Bradenton, FL Map & Demographics
Bradenton Map
Bradenton Overview
$32,378
PER CAPITA INCOME
$68,078
AVG FAMILY INCOME
$55,795
AVG HOUSEHOLD INCOME
21.5%
WAGE / INCOME GAP [ % ]
78.5¢/ $1
WAGE / INCOME GAP [ $ ]
$12,256
FAMILY INCOME DEFICIT
0.45
INEQUALITY / GINI INDEX
55,795
TOTAL POPULATION
26,537
MALE POPULATION
29,258
FEMALE POPULATION
90.70
MALES / 100 FEMALES
110.25
FEMALES / 100 MALES
45.4
MEDIAN AGE
3.1
AVG FAMILY SIZE
2.4
AVG HOUSEHOLD SIZE
24,733
LABOR FORCE [ PEOPLE ]
54.5%
PERCENT IN LABOR FORCE
6.7%
UNEMPLOYMENT RATE
Bradenton Area Codes
Income in Bradenton
Income Overview in Bradenton
Per Capita Income in Bradenton is $32,378, while median incomes of families and households are $68,078 and $55,795 respectively.
| Characteristic | Number | Measure |
| Per Capita Income | 55,795 | $32,378 |
| Median Family Income | 12,776 | $68,078 |
| Mean Family Income | 12,776 | $90,451 |
| Median Household Income | 22,161 | $55,795 |
| Mean Household Income | 22,161 | $75,554 |
| Income Deficit | 12,776 | $12,256 |
| Wage / Income Gap (%) | 55,795 | 21.45% |
| Wage / Income Gap ($) | 55,795 | 78.55¢ per $1 |
| Gini / Inequality Index | 55,795 | 0.45 |
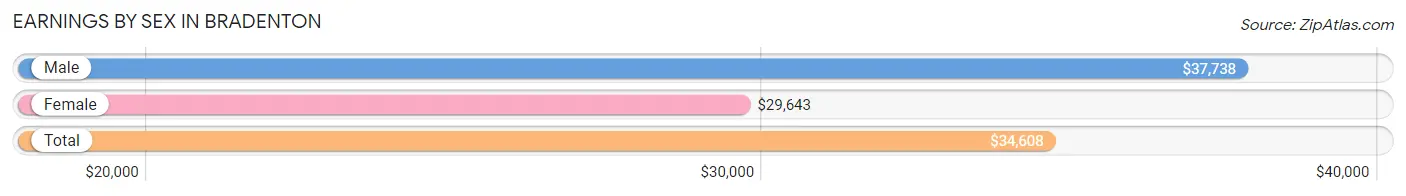
Earnings by Sex in Bradenton
Average Earnings in Bradenton are $34,608, $37,738 for men and $29,643 for women, a difference of 21.4%.
| Sex | Number | Average Earnings |
| Male | 13,156 (52.2%) | $37,738 |
| Female | 12,033 (47.8%) | $29,643 |
| Total | 25,189 (100.0%) | $34,608 |
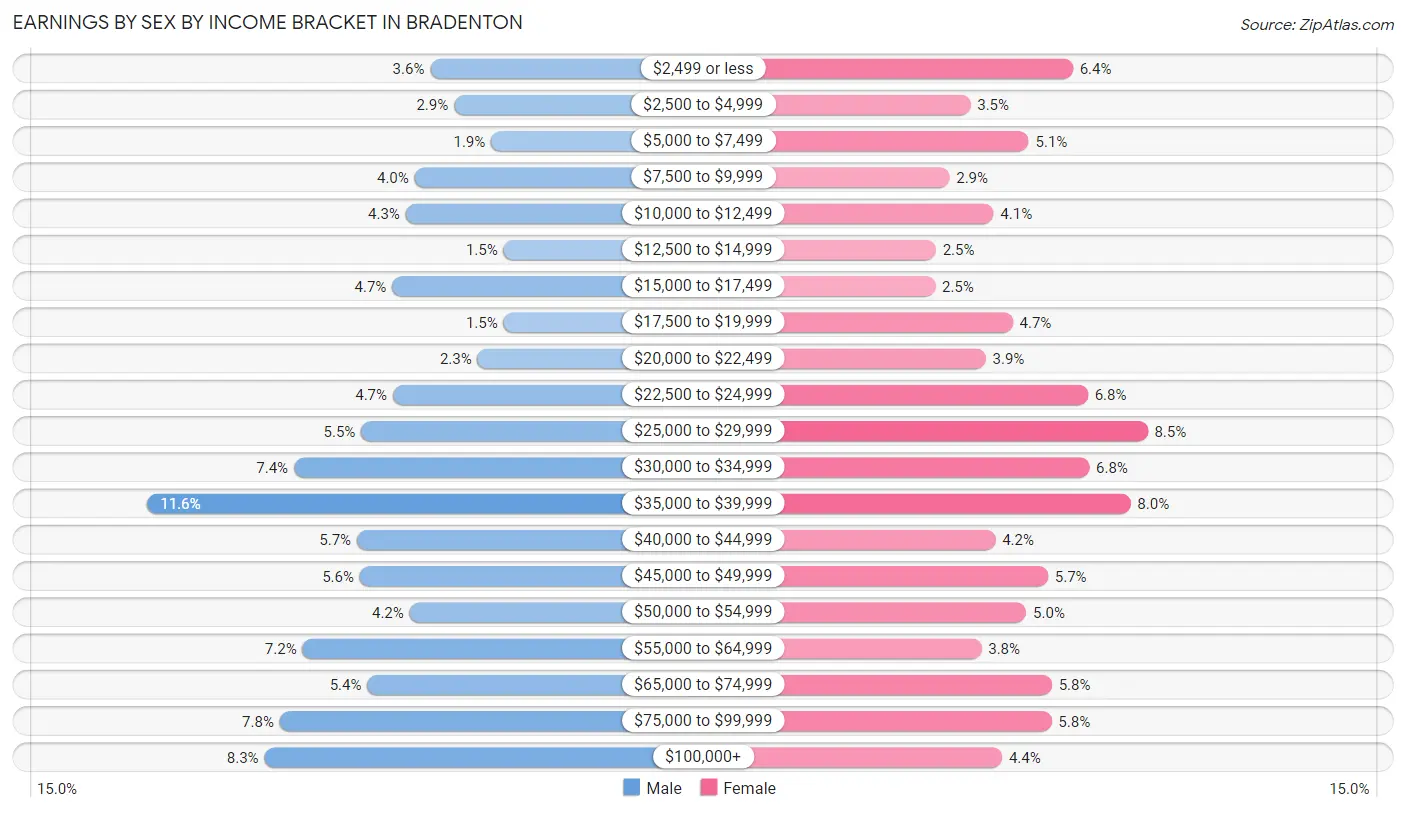
Earnings by Sex by Income Bracket in Bradenton
The most common earnings brackets in Bradenton are $35,000 to $39,999 for men (1,519 | 11.6%) and $25,000 to $29,999 for women (1,017 | 8.5%).
| Income | Male | Female |
| $2,499 or less | 473 (3.6%) | 764 (6.4%) |
| $2,500 to $4,999 | 386 (2.9%) | 418 (3.5%) |
| $5,000 to $7,499 | 248 (1.9%) | 615 (5.1%) |
| $7,500 to $9,999 | 532 (4.0%) | 347 (2.9%) |
| $10,000 to $12,499 | 564 (4.3%) | 496 (4.1%) |
| $12,500 to $14,999 | 202 (1.5%) | 301 (2.5%) |
| $15,000 to $17,499 | 615 (4.7%) | 299 (2.5%) |
| $17,500 to $19,999 | 202 (1.5%) | 561 (4.7%) |
| $20,000 to $22,499 | 298 (2.3%) | 469 (3.9%) |
| $22,500 to $24,999 | 612 (4.6%) | 815 (6.8%) |
| $25,000 to $29,999 | 729 (5.5%) | 1,017 (8.5%) |
| $30,000 to $34,999 | 978 (7.4%) | 819 (6.8%) |
| $35,000 to $39,999 | 1,519 (11.6%) | 959 (8.0%) |
| $40,000 to $44,999 | 744 (5.7%) | 502 (4.2%) |
| $45,000 to $49,999 | 734 (5.6%) | 680 (5.7%) |
| $50,000 to $54,999 | 550 (4.2%) | 606 (5.0%) |
| $55,000 to $64,999 | 946 (7.2%) | 455 (3.8%) |
| $65,000 to $74,999 | 707 (5.4%) | 693 (5.8%) |
| $75,000 to $99,999 | 1,030 (7.8%) | 692 (5.8%) |
| $100,000+ | 1,087 (8.3%) | 525 (4.4%) |
| Total | 13,156 (100.0%) | 12,033 (100.0%) |
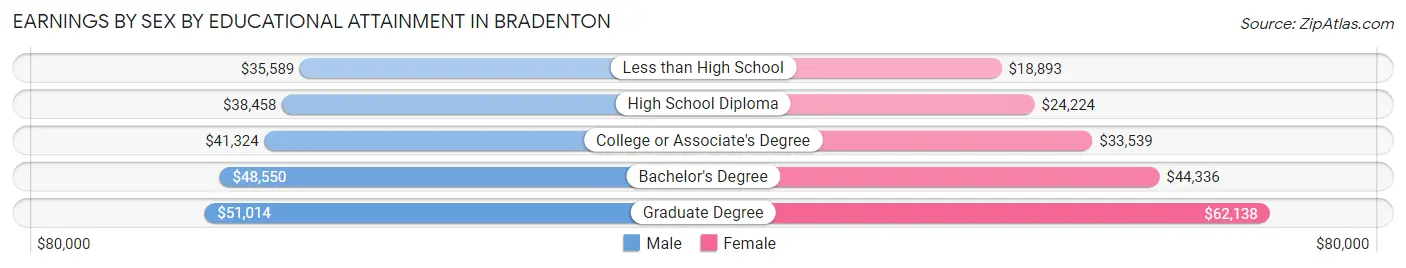
Earnings by Sex by Educational Attainment in Bradenton
Average earnings in Bradenton are $39,722 for men and $33,473 for women, a difference of 15.7%. Men with an educational attainment of graduate degree enjoy the highest average annual earnings of $51,014, while those with less than high school education earn the least with $35,589. Women with an educational attainment of graduate degree earn the most with the average annual earnings of $62,138, while those with less than high school education have the smallest earnings of $18,893.
| Educational Attainment | Male Income | Female Income |
| Less than High School | $35,589 | $18,893 |
| High School Diploma | $38,458 | $24,224 |
| College or Associate's Degree | $41,324 | $33,539 |
| Bachelor's Degree | $48,550 | $44,336 |
| Graduate Degree | $51,014 | $62,138 |
| Total | $39,722 | $33,473 |
Family Income in Bradenton
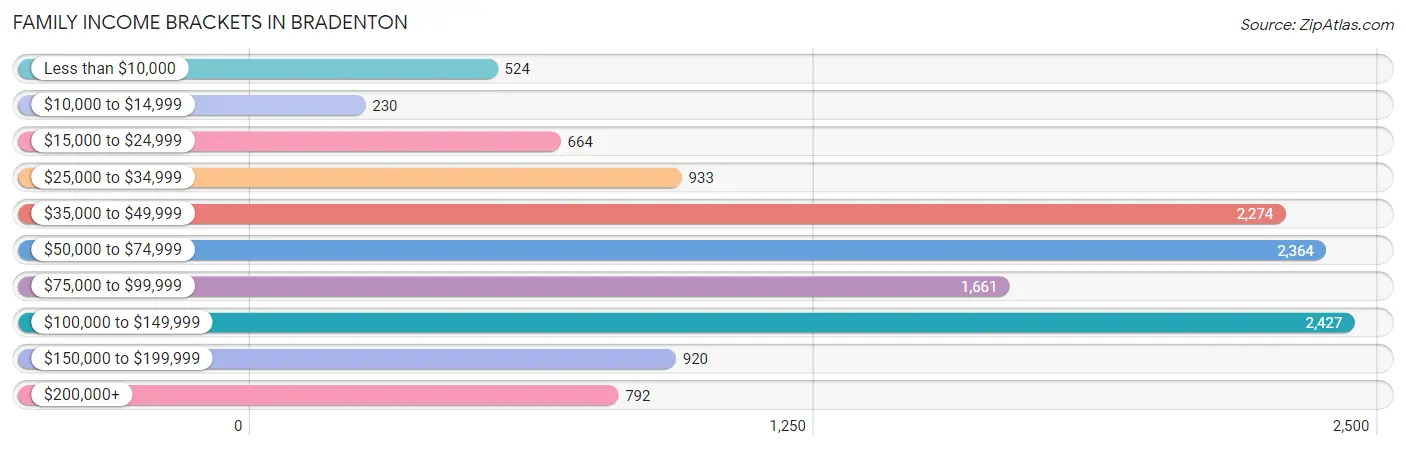
Family Income Brackets in Bradenton
According to the Bradenton family income data, there are 2,427 families falling into the $100,000 to $149,999 income range, which is the most common income bracket and makes up 19.0% of all families. Conversely, the $10,000 to $14,999 income bracket is the least frequent group with only 230 families (1.8%) belonging to this category.
| Income Bracket | # Families | % Families |
| Less than $10,000 | 524 | 4.1% |
| $10,000 to $14,999 | 230 | 1.8% |
| $15,000 to $24,999 | 664 | 5.2% |
| $25,000 to $34,999 | 933 | 7.3% |
| $35,000 to $49,999 | 2,274 | 17.8% |
| $50,000 to $74,999 | 2,364 | 18.5% |
| $75,000 to $99,999 | 1,661 | 13.0% |
| $100,000 to $149,999 | 2,427 | 19.0% |
| $150,000 to $199,999 | 920 | 7.2% |
| $200,000+ | 792 | 6.2% |
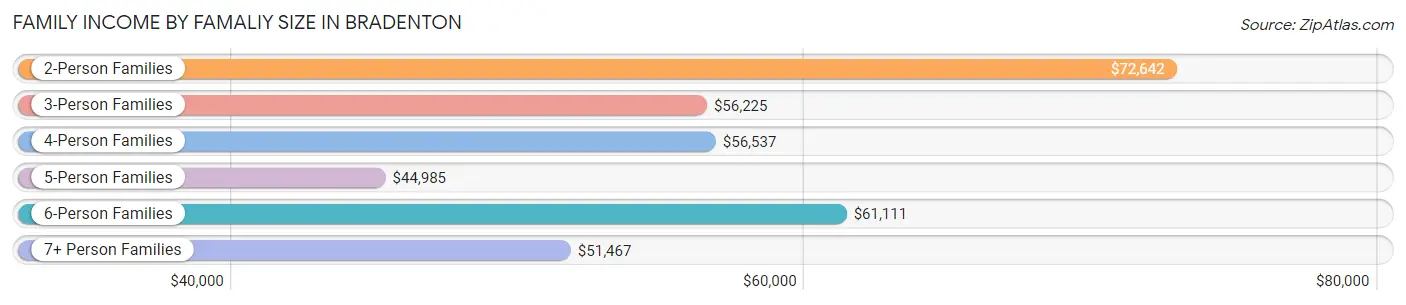
Family Income by Famaliy Size in Bradenton
2-person families (7,555 | 59.1%) account for the highest median family income in Bradenton with $72,642 per family, while 2-person families (7,555 | 59.1%) have the highest median income of $36,321 per family member.
| Income Bracket | # Families | Median Income |
| 2-Person Families | 7,555 (59.1%) | $72,642 |
| 3-Person Families | 2,243 (17.6%) | $56,225 |
| 4-Person Families | 1,637 (12.8%) | $56,537 |
| 5-Person Families | 856 (6.7%) | $44,985 |
| 6-Person Families | 236 (1.8%) | $61,111 |
| 7+ Person Families | 249 (1.9%) | $51,467 |
| Total | 12,776 (100.0%) | $68,078 |
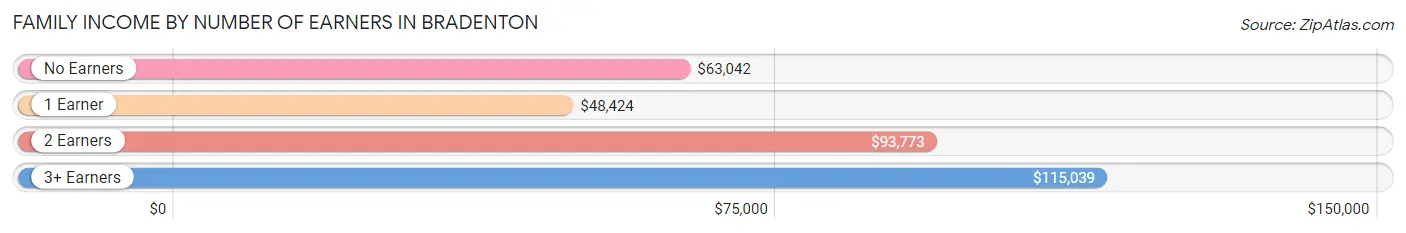
Family Income by Number of Earners in Bradenton
The median family income in Bradenton is $68,078, with families comprising 3+ earners (796) having the highest median family income of $115,039, while families with 1 earner (4,507) have the lowest median family income of $48,424, accounting for 6.2% and 35.3% of families, respectively.
| Number of Earners | # Families | Median Income |
| No Earners | 3,109 (24.3%) | $63,042 |
| 1 Earner | 4,507 (35.3%) | $48,424 |
| 2 Earners | 4,364 (34.2%) | $93,773 |
| 3+ Earners | 796 (6.2%) | $115,039 |
| Total | 12,776 (100.0%) | $68,078 |
Household Income in Bradenton
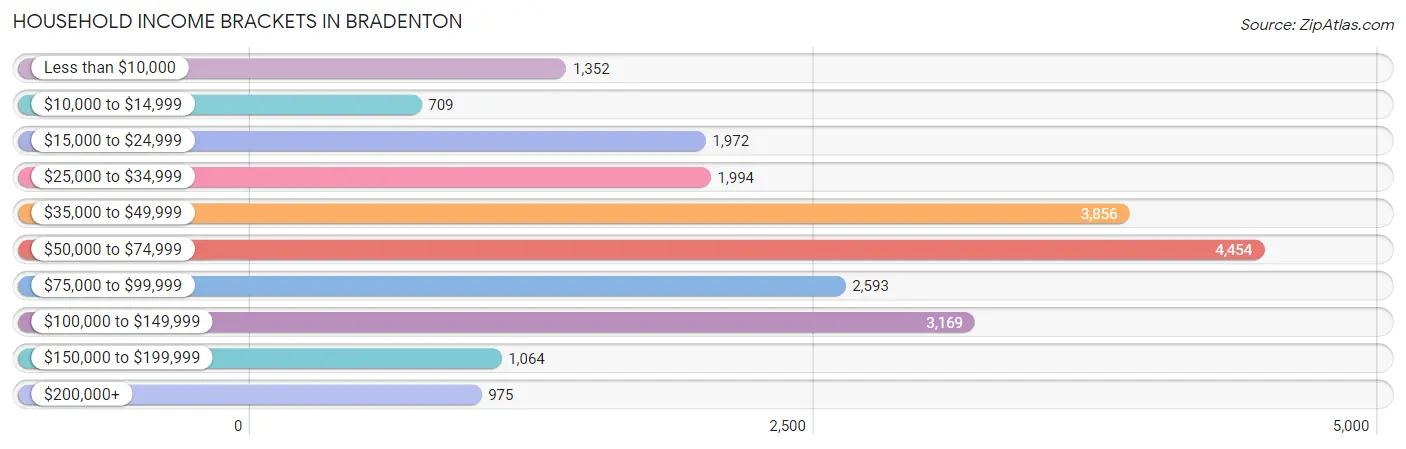
Household Income Brackets in Bradenton
With 4,454 households falling in the category, the $50,000 to $74,999 income range is the most frequent in Bradenton, accounting for 20.1% of all households. In contrast, only 709 households (3.2%) fall into the $10,000 to $14,999 income bracket, making it the least populous group.
| Income Bracket | # Households | % Households |
| Less than $10,000 | 1,352 | 6.1% |
| $10,000 to $14,999 | 709 | 3.2% |
| $15,000 to $24,999 | 1,972 | 8.9% |
| $25,000 to $34,999 | 1,994 | 9.0% |
| $35,000 to $49,999 | 3,856 | 17.4% |
| $50,000 to $74,999 | 4,454 | 20.1% |
| $75,000 to $99,999 | 2,593 | 11.7% |
| $100,000 to $149,999 | 3,169 | 14.3% |
| $150,000 to $199,999 | 1,064 | 4.8% |
| $200,000+ | 975 | 4.4% |
Household Income by Householder Age in Bradenton
The median household income in Bradenton is $55,795, with the highest median household income of $73,142 found in the 45 to 64 years age bracket for the primary householder. A total of 7,046 households (31.8%) fall into this category. Meanwhile, the 65+ years age bracket for the primary householder has the lowest median household income of $48,125, with 8,891 households (40.1%) in this group.
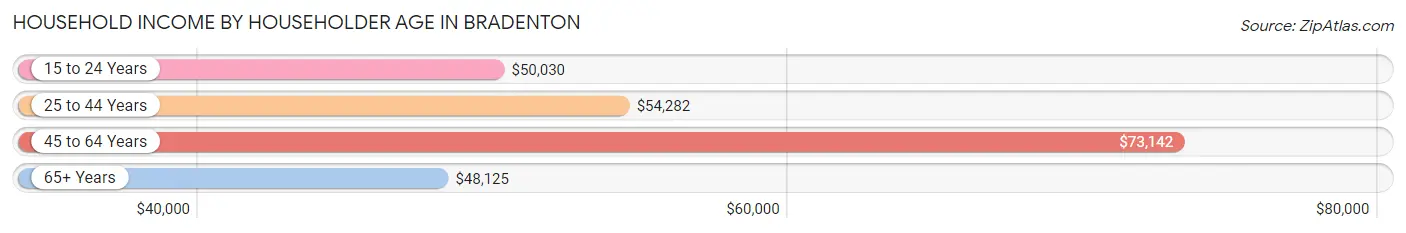
| Income Bracket | # Households | Median Income |
| 15 to 24 Years | 679 (3.1%) | $50,030 |
| 25 to 44 Years | 5,545 (25.0%) | $54,282 |
| 45 to 64 Years | 7,046 (31.8%) | $73,142 |
| 65+ Years | 8,891 (40.1%) | $48,125 |
| Total | 22,161 (100.0%) | $55,795 |
Poverty in Bradenton
Income Below Poverty by Sex and Age in Bradenton
With 13.0% poverty level for males and 16.1% for females among the residents of Bradenton, 6 to 11 year old males and 16 and 17 year old females are the most vulnerable to poverty, with 668 males (33.9%) and 298 females (47.9%) in their respective age groups living below the poverty level.
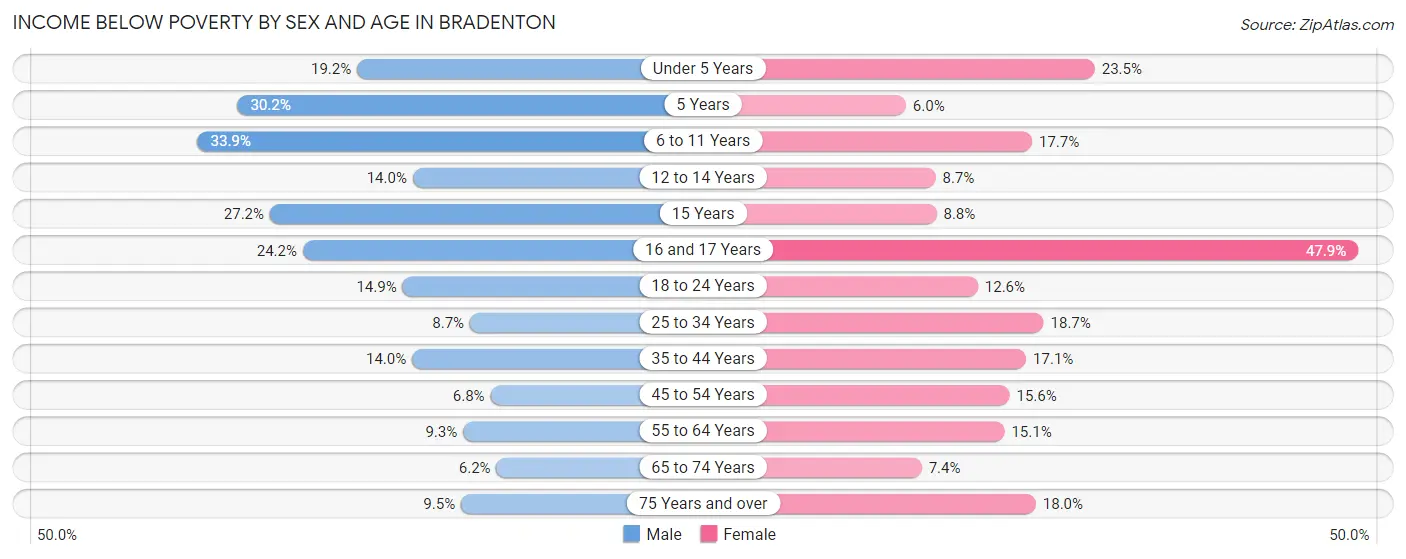
| Age Bracket | Male | Female |
| Under 5 Years | 278 (19.2%) | 397 (23.5%) |
| 5 Years | 166 (30.2%) | 25 (5.9%) |
| 6 to 11 Years | 668 (33.9%) | 307 (17.7%) |
| 12 to 14 Years | 139 (14.0%) | 53 (8.7%) |
| 15 Years | 67 (27.2%) | 29 (8.8%) |
| 16 and 17 Years | 154 (24.2%) | 298 (47.9%) |
| 18 to 24 Years | 250 (14.9%) | 220 (12.6%) |
| 25 to 34 Years | 310 (8.7%) | 717 (18.7%) |
| 35 to 44 Years | 346 (14.0%) | 455 (17.1%) |
| 45 to 54 Years | 199 (6.8%) | 478 (15.6%) |
| 55 to 64 Years | 311 (9.3%) | 556 (15.1%) |
| 65 to 74 Years | 203 (6.2%) | 292 (7.4%) |
| 75 Years and over | 240 (9.5%) | 705 (18.0%) |
| Total | 3,331 (13.0%) | 4,532 (16.1%) |
Income Above Poverty by Sex and Age in Bradenton
According to the poverty statistics in Bradenton, males aged 65 to 74 years and females aged 5 years are the age groups that are most secure financially, with 93.8% of males and 94.1% of females in these age groups living above the poverty line.
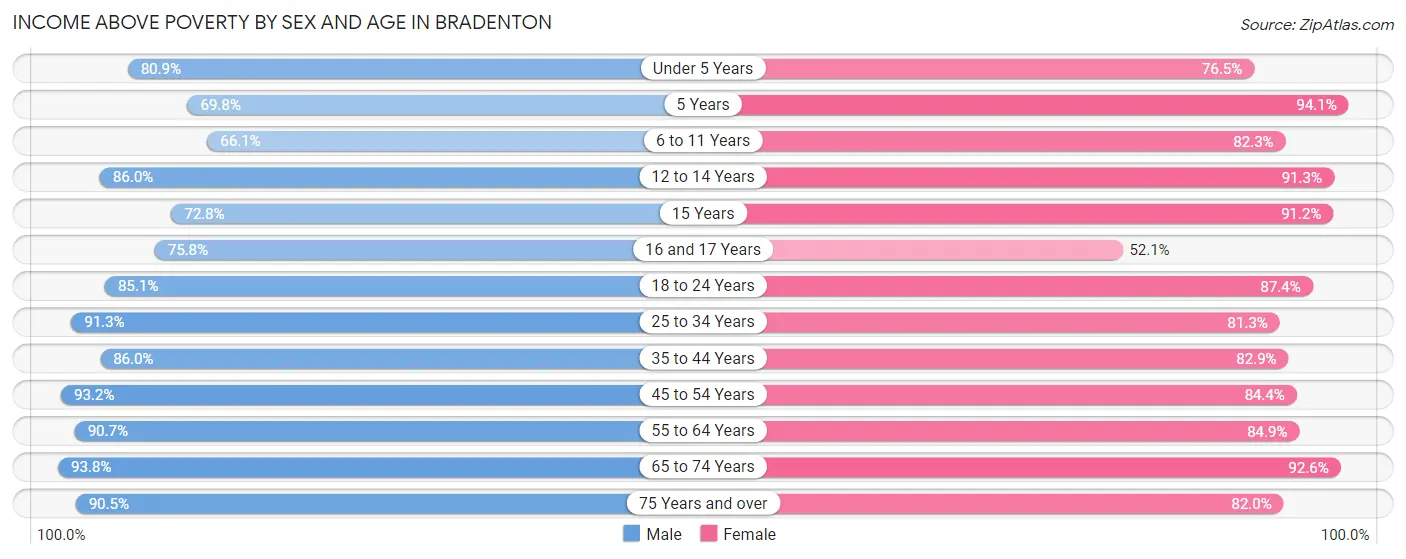
| Age Bracket | Male | Female |
| Under 5 Years | 1,174 (80.8%) | 1,294 (76.5%) |
| 5 Years | 383 (69.8%) | 395 (94.1%) |
| 6 to 11 Years | 1,300 (66.1%) | 1,431 (82.3%) |
| 12 to 14 Years | 855 (86.0%) | 556 (91.3%) |
| 15 Years | 179 (72.8%) | 301 (91.2%) |
| 16 and 17 Years | 483 (75.8%) | 324 (52.1%) |
| 18 to 24 Years | 1,424 (85.1%) | 1,522 (87.4%) |
| 25 to 34 Years | 3,264 (91.3%) | 3,111 (81.3%) |
| 35 to 44 Years | 2,118 (86.0%) | 2,204 (82.9%) |
| 45 to 54 Years | 2,741 (93.2%) | 2,592 (84.4%) |
| 55 to 64 Years | 3,029 (90.7%) | 3,126 (84.9%) |
| 65 to 74 Years | 3,068 (93.8%) | 3,644 (92.6%) |
| 75 Years and over | 2,286 (90.5%) | 3,210 (82.0%) |
| Total | 22,304 (87.0%) | 23,710 (84.0%) |
Income Below Poverty Among Married-Couple Families in Bradenton
The poverty statistics for married-couple families in Bradenton show that 4.4% or 393 of the total 8,970 families live below the poverty line. Families with 3 or 4 children have the highest poverty rate of 8.6%, comprising of 47 families. On the other hand, families with 5 or more children have the lowest poverty rate of 0.0%, which includes 0 families.
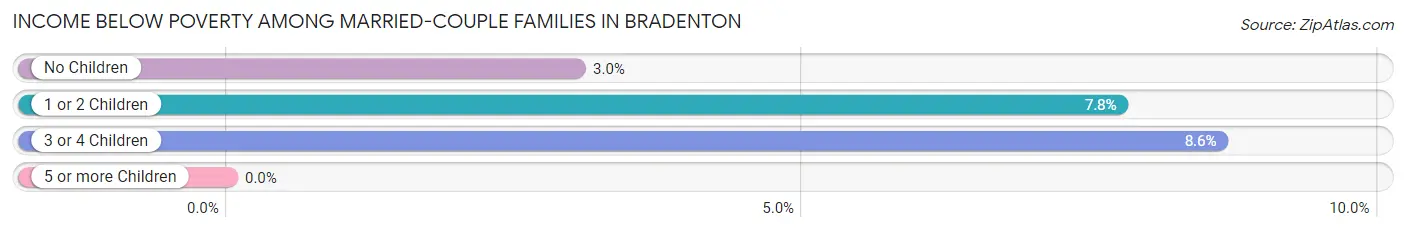
| Children | Above Poverty | Below Poverty |
| No Children | 6,153 (97.0%) | 192 (3.0%) |
| 1 or 2 Children | 1,834 (92.2%) | 154 (7.7%) |
| 3 or 4 Children | 498 (91.4%) | 47 (8.6%) |
| 5 or more Children | 92 (100.0%) | 0 (0.0%) |
| Total | 8,577 (95.6%) | 393 (4.4%) |
Income Below Poverty Among Single-Parent Households in Bradenton
According to the poverty data in Bradenton, 9.6% or 102 single-father households and 30.2% or 827 single-mother households are living below the poverty line. Among single-father households, those with 3 or 4 children have the highest poverty rate, with 50 households (49.5%) experiencing poverty. Likewise, among single-mother households, those with 5 or more children have the highest poverty rate, with 44 households (100.0%) falling below the poverty line.
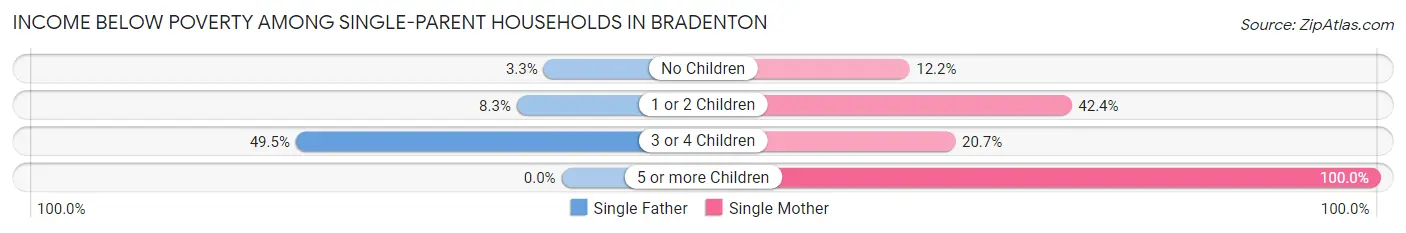
| Children | Single Father | Single Mother |
| No Children | 19 (3.3%) | 113 (12.2%) |
| 1 or 2 Children | 33 (8.3%) | 592 (42.4%) |
| 3 or 4 Children | 50 (49.5%) | 78 (20.7%) |
| 5 or more Children | 0 (0.0%) | 44 (100.0%) |
| Total | 102 (9.6%) | 827 (30.2%) |
Income Below Poverty Among Married-Couple vs Single-Parent Households in Bradenton
The poverty data for Bradenton shows that 393 of the married-couple family households (4.4%) and 929 of the single-parent households (24.4%) are living below the poverty level. Within the married-couple family households, those with 3 or 4 children have the highest poverty rate, with 47 households (8.6%) falling below the poverty line. Among the single-parent households, those with 5 or more children have the highest poverty rate, with 44 household (100.0%) living below poverty.
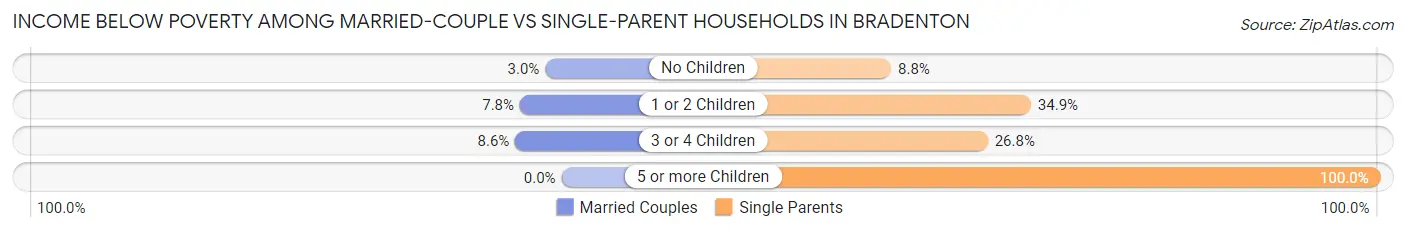
| Children | Married-Couple Families | Single-Parent Households |
| No Children | 192 (3.0%) | 132 (8.8%) |
| 1 or 2 Children | 154 (7.7%) | 625 (34.9%) |
| 3 or 4 Children | 47 (8.6%) | 128 (26.8%) |
| 5 or more Children | 0 (0.0%) | 44 (100.0%) |
| Total | 393 (4.4%) | 929 (24.4%) |
Race in Bradenton
The most populous races in Bradenton are White / Caucasian (39,851 | 71.4%), Hispanic or Latino (12,547 | 22.5%), and Black / African American (8,235 | 14.8%).
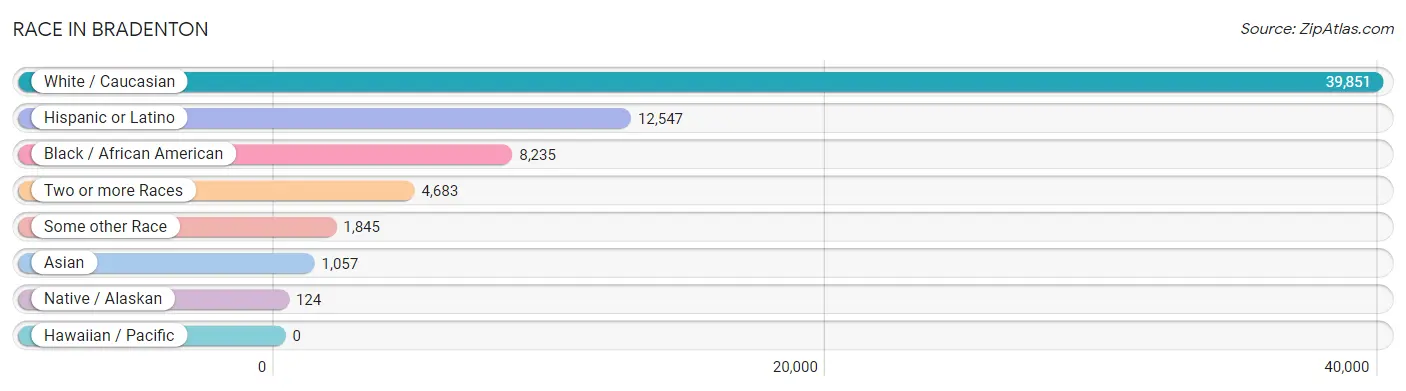
| Race | # Population | % Population |
| Asian | 1,057 | 1.9% |
| Black / African American | 8,235 | 14.8% |
| Hawaiian / Pacific | 0 | 0.0% |
| Hispanic or Latino | 12,547 | 22.5% |
| Native / Alaskan | 124 | 0.2% |
| White / Caucasian | 39,851 | 71.4% |
| Two or more Races | 4,683 | 8.4% |
| Some other Race | 1,845 | 3.3% |
| Total | 55,795 | 100.0% |
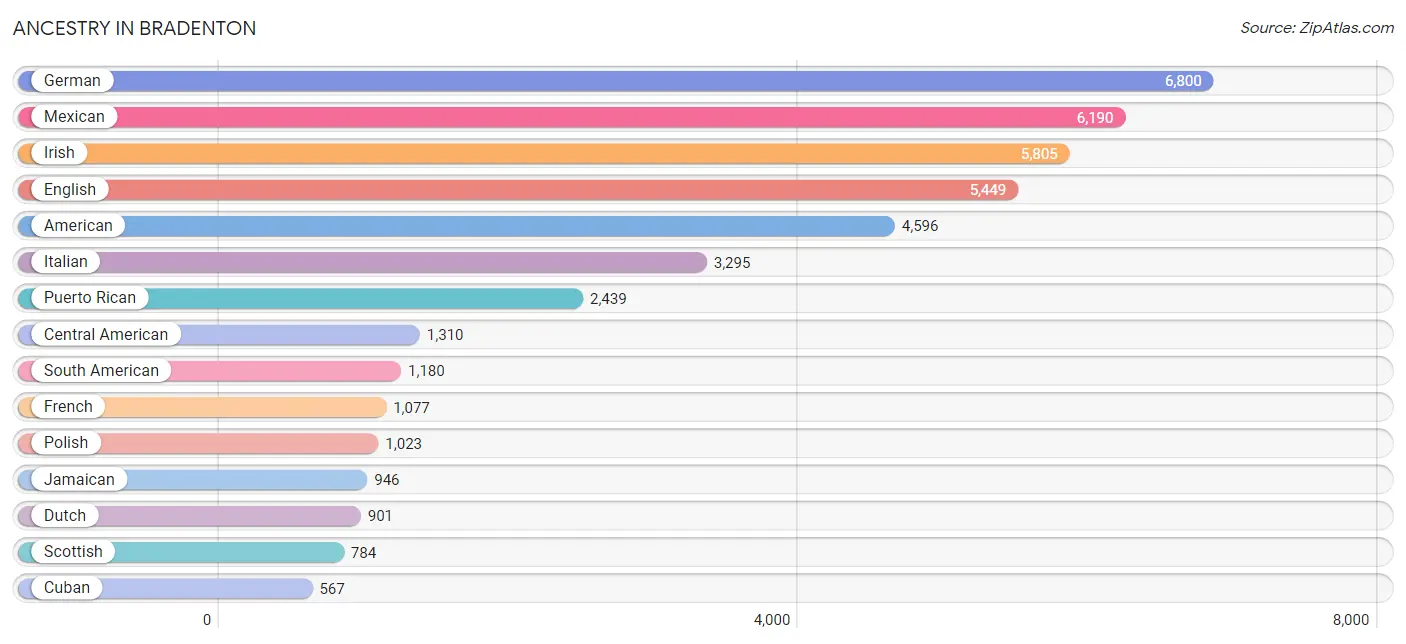
Ancestry in Bradenton
The most populous ancestries reported in Bradenton are German (6,800 | 12.2%), Mexican (6,190 | 11.1%), Irish (5,805 | 10.4%), English (5,449 | 9.8%), and American (4,596 | 8.2%), together accounting for 51.7% of all Bradenton residents.
| Ancestry | # Population | % Population |
| African | 399 | 0.7% |
| Albanian | 63 | 0.1% |
| American | 4,596 | 8.2% |
| Arab | 218 | 0.4% |
| Argentinean | 33 | 0.1% |
| Australian | 7 | 0.0% |
| Austrian | 111 | 0.2% |
| Bahamian | 11 | 0.0% |
| Barbadian | 7 | 0.0% |
| Belgian | 67 | 0.1% |
| Bhutanese | 87 | 0.2% |
| Blackfeet | 38 | 0.1% |
| Brazilian | 188 | 0.3% |
| British | 303 | 0.5% |
| British West Indian | 132 | 0.2% |
| Burmese | 21 | 0.0% |
| Canadian | 369 | 0.7% |
| Central American | 1,310 | 2.4% |
| Central American Indian | 126 | 0.2% |
| Cherokee | 55 | 0.1% |
| Chippewa | 13 | 0.0% |
| Colombian | 354 | 0.6% |
| Costa Rican | 88 | 0.2% |
| Creek | 7 | 0.0% |
| Croatian | 22 | 0.0% |
| Cuban | 567 | 1.0% |
| Cypriot | 7 | 0.0% |
| Czech | 146 | 0.3% |
| Czechoslovakian | 29 | 0.1% |
| Danish | 194 | 0.4% |
| Dominican | 308 | 0.5% |
| Dutch | 901 | 1.6% |
| Eastern European | 53 | 0.1% |
| Ecuadorian | 113 | 0.2% |
| Egyptian | 10 | 0.0% |
| English | 5,449 | 9.8% |
| European | 366 | 0.7% |
| Finnish | 166 | 0.3% |
| French | 1,077 | 1.9% |
| French American Indian | 6 | 0.0% |
| French Canadian | 424 | 0.8% |
| German | 6,800 | 12.2% |
| Greek | 279 | 0.5% |
| Guatemalan | 541 | 1.0% |
| Haitian | 473 | 0.9% |
| Honduran | 396 | 0.7% |
| Hungarian | 444 | 0.8% |
| Indian (Asian) | 311 | 0.6% |
| Inupiat | 28 | 0.1% |
| Irish | 5,805 | 10.4% |
| Iroquois | 7 | 0.0% |
| Italian | 3,295 | 5.9% |
| Jamaican | 946 | 1.7% |
| Kenyan | 11 | 0.0% |
| Korean | 418 | 0.7% |
| Lebanese | 167 | 0.3% |
| Lithuanian | 152 | 0.3% |
| Macedonian | 25 | 0.0% |
| Mexican | 6,190 | 11.1% |
| Nicaraguan | 13 | 0.0% |
| Nigerian | 30 | 0.1% |
| Northern European | 108 | 0.2% |
| Norwegian | 451 | 0.8% |
| Pennsylvania German | 62 | 0.1% |
| Peruvian | 124 | 0.2% |
| Polish | 1,023 | 1.8% |
| Portuguese | 162 | 0.3% |
| Puerto Rican | 2,439 | 4.4% |
| Romanian | 109 | 0.2% |
| Russian | 392 | 0.7% |
| Salvadoran | 272 | 0.5% |
| Scandinavian | 85 | 0.2% |
| Scotch-Irish | 455 | 0.8% |
| Scottish | 784 | 1.4% |
| Seminole | 10 | 0.0% |
| Serbian | 7 | 0.0% |
| Sioux | 9 | 0.0% |
| Slavic | 66 | 0.1% |
| Slovak | 191 | 0.3% |
| Slovene | 61 | 0.1% |
| South American | 1,180 | 2.1% |
| Spaniard | 83 | 0.2% |
| Spanish | 233 | 0.4% |
| Spanish American Indian | 11 | 0.0% |
| Sri Lankan | 12 | 0.0% |
| Subsaharan African | 453 | 0.8% |
| Swedish | 511 | 0.9% |
| Swiss | 56 | 0.1% |
| Thai | 320 | 0.6% |
| Trinidadian and Tobagonian | 36 | 0.1% |
| Turkish | 8 | 0.0% |
| Ukrainian | 161 | 0.3% |
| Uruguayan | 10 | 0.0% |
| Venezuelan | 546 | 1.0% |
| Vietnamese | 101 | 0.2% |
| Welsh | 561 | 1.0% |
| West Indian | 144 | 0.3% | View All 97 Rows |
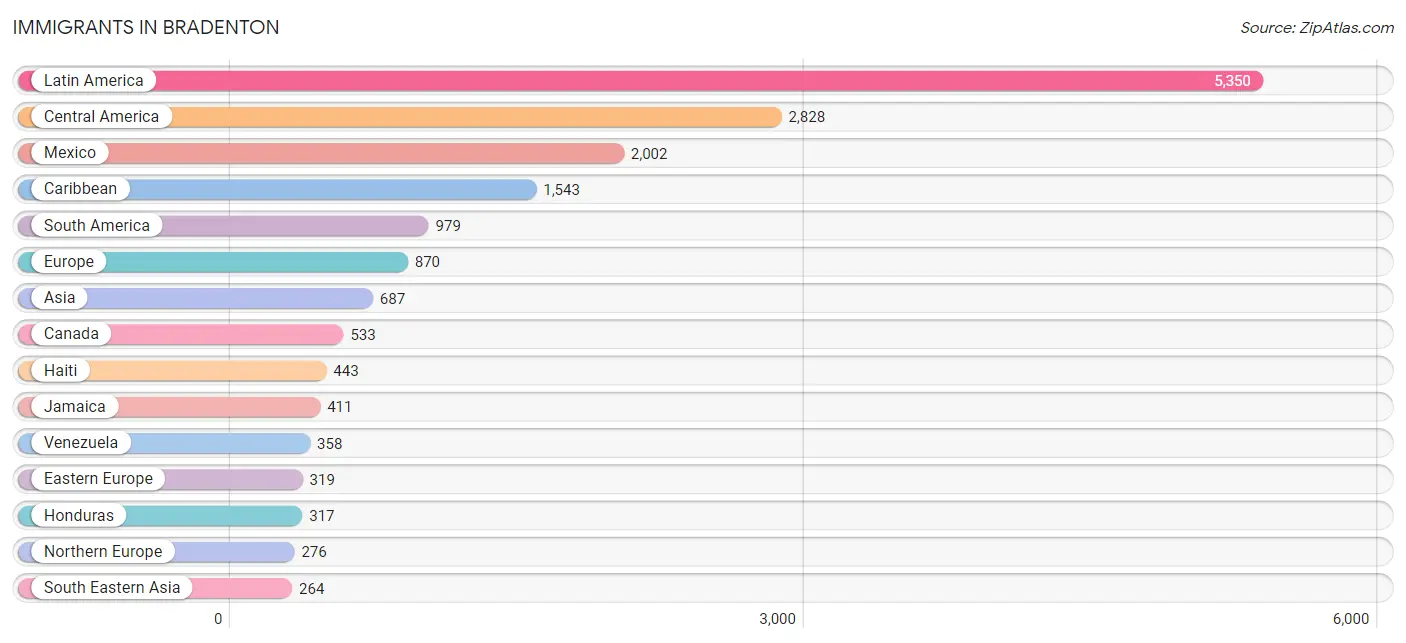
Immigrants in Bradenton
The most numerous immigrant groups reported in Bradenton came from Latin America (5,350 | 9.6%), Central America (2,828 | 5.1%), Mexico (2,002 | 3.6%), Caribbean (1,543 | 2.8%), and South America (979 | 1.8%), together accounting for 22.8% of all Bradenton residents.
| Immigration Origin | # Population | % Population |
| Africa | 177 | 0.3% |
| Argentina | 17 | 0.0% |
| Asia | 687 | 1.2% |
| Australia | 36 | 0.1% |
| Austria | 10 | 0.0% |
| Bahamas | 11 | 0.0% |
| Bangladesh | 58 | 0.1% |
| Barbados | 16 | 0.0% |
| Belgium | 12 | 0.0% |
| Brazil | 200 | 0.4% |
| Cambodia | 34 | 0.1% |
| Cameroon | 69 | 0.1% |
| Canada | 533 | 1.0% |
| Caribbean | 1,543 | 2.8% |
| Central America | 2,828 | 5.1% |
| China | 185 | 0.3% |
| Colombia | 174 | 0.3% |
| Costa Rica | 68 | 0.1% |
| Cuba | 257 | 0.5% |
| Czechoslovakia | 10 | 0.0% |
| Denmark | 9 | 0.0% |
| Dominica | 58 | 0.1% |
| Dominican Republic | 185 | 0.3% |
| Eastern Africa | 18 | 0.0% |
| Eastern Asia | 191 | 0.3% |
| Eastern Europe | 319 | 0.6% |
| Ecuador | 150 | 0.3% |
| Egypt | 10 | 0.0% |
| El Salvador | 178 | 0.3% |
| England | 51 | 0.1% |
| Europe | 870 | 1.6% |
| France | 73 | 0.1% |
| Germany | 126 | 0.2% |
| Grenada | 13 | 0.0% |
| Guatemala | 240 | 0.4% |
| Haiti | 443 | 0.8% |
| Honduras | 317 | 0.6% |
| Hong Kong | 72 | 0.1% |
| Hungary | 8 | 0.0% |
| India | 62 | 0.1% |
| Ireland | 8 | 0.0% |
| Italy | 40 | 0.1% |
| Jamaica | 411 | 0.7% |
| Jordan | 14 | 0.0% |
| Korea | 6 | 0.0% |
| Kuwait | 18 | 0.0% |
| Latin America | 5,350 | 9.6% |
| Lebanon | 41 | 0.1% |
| Mexico | 2,002 | 3.6% |
| Middle Africa | 69 | 0.1% |
| Moldova | 54 | 0.1% |
| Netherlands | 14 | 0.0% |
| Nicaragua | 13 | 0.0% |
| Nigeria | 11 | 0.0% |
| Northern Africa | 62 | 0.1% |
| Northern Europe | 276 | 0.5% |
| Oceania | 36 | 0.1% |
| Peru | 70 | 0.1% |
| Philippines | 218 | 0.4% |
| Poland | 17 | 0.0% |
| Romania | 45 | 0.1% |
| Russia | 75 | 0.1% |
| Scotland | 24 | 0.0% |
| Somalia | 18 | 0.0% |
| South Africa | 17 | 0.0% |
| South America | 979 | 1.8% |
| South Central Asia | 151 | 0.3% |
| South Eastern Asia | 264 | 0.5% |
| Southern Europe | 40 | 0.1% |
| Sweden | 19 | 0.0% |
| Taiwan | 52 | 0.1% |
| Trinidad and Tobago | 36 | 0.1% |
| Turkey | 8 | 0.0% |
| Ukraine | 99 | 0.2% |
| Uruguay | 10 | 0.0% |
| Uzbekistan | 31 | 0.1% |
| Venezuela | 358 | 0.6% |
| Vietnam | 12 | 0.0% |
| West Indies | 38 | 0.1% |
| Western Africa | 11 | 0.0% |
| Western Asia | 81 | 0.2% |
| Western Europe | 235 | 0.4% | View All 82 Rows |
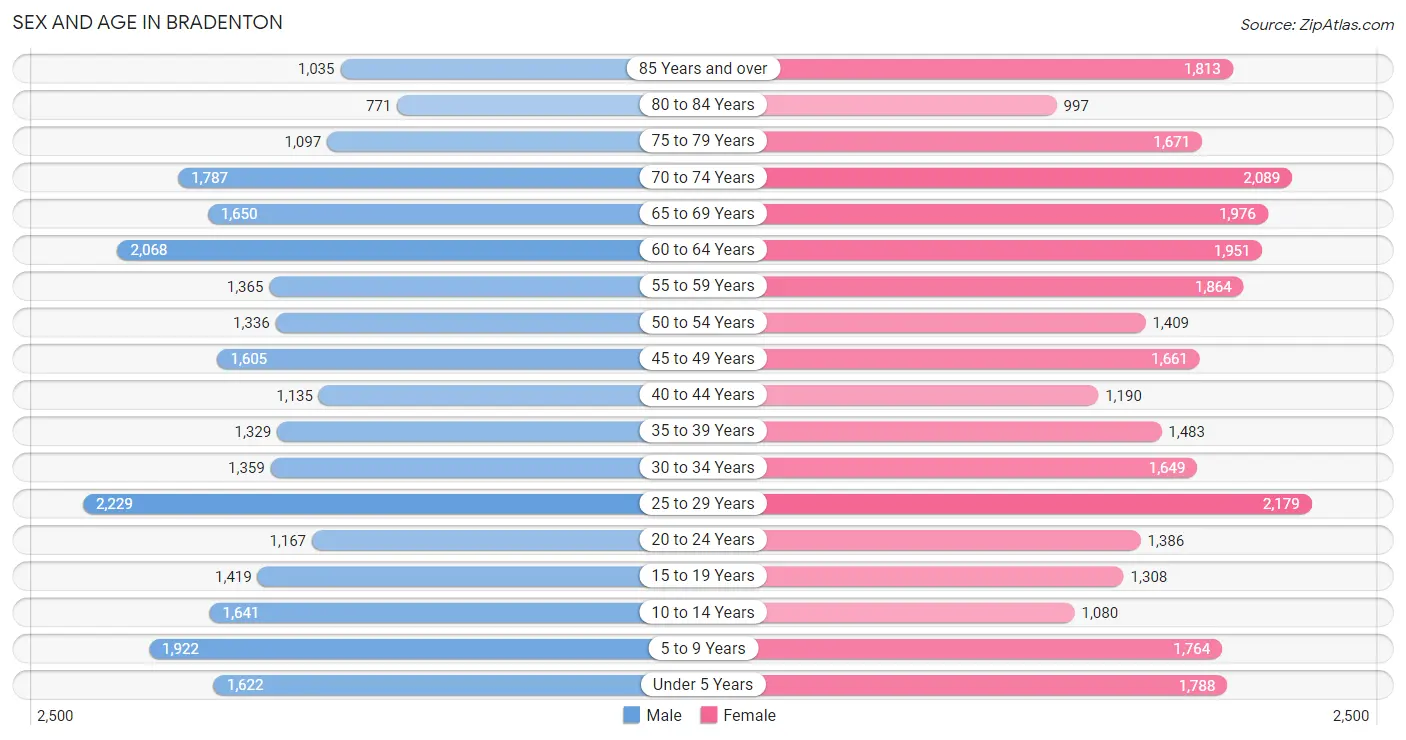
Sex and Age in Bradenton
Sex and Age in Bradenton
The most populous age groups in Bradenton are 25 to 29 Years (2,229 | 8.4%) for men and 25 to 29 Years (2,179 | 7.4%) for women.
| Age Bracket | Male | Female |
| Under 5 Years | 1,622 (6.1%) | 1,788 (6.1%) |
| 5 to 9 Years | 1,922 (7.2%) | 1,764 (6.0%) |
| 10 to 14 Years | 1,641 (6.2%) | 1,080 (3.7%) |
| 15 to 19 Years | 1,419 (5.3%) | 1,308 (4.5%) |
| 20 to 24 Years | 1,167 (4.4%) | 1,386 (4.7%) |
| 25 to 29 Years | 2,229 (8.4%) | 2,179 (7.4%) |
| 30 to 34 Years | 1,359 (5.1%) | 1,649 (5.6%) |
| 35 to 39 Years | 1,329 (5.0%) | 1,483 (5.1%) |
| 40 to 44 Years | 1,135 (4.3%) | 1,190 (4.1%) |
| 45 to 49 Years | 1,605 (6.0%) | 1,661 (5.7%) |
| 50 to 54 Years | 1,336 (5.0%) | 1,409 (4.8%) |
| 55 to 59 Years | 1,365 (5.1%) | 1,864 (6.4%) |
| 60 to 64 Years | 2,068 (7.8%) | 1,951 (6.7%) |
| 65 to 69 Years | 1,650 (6.2%) | 1,976 (6.8%) |
| 70 to 74 Years | 1,787 (6.7%) | 2,089 (7.1%) |
| 75 to 79 Years | 1,097 (4.1%) | 1,671 (5.7%) |
| 80 to 84 Years | 771 (2.9%) | 997 (3.4%) |
| 85 Years and over | 1,035 (3.9%) | 1,813 (6.2%) |
| Total | 26,537 (100.0%) | 29,258 (100.0%) |
Families and Households in Bradenton
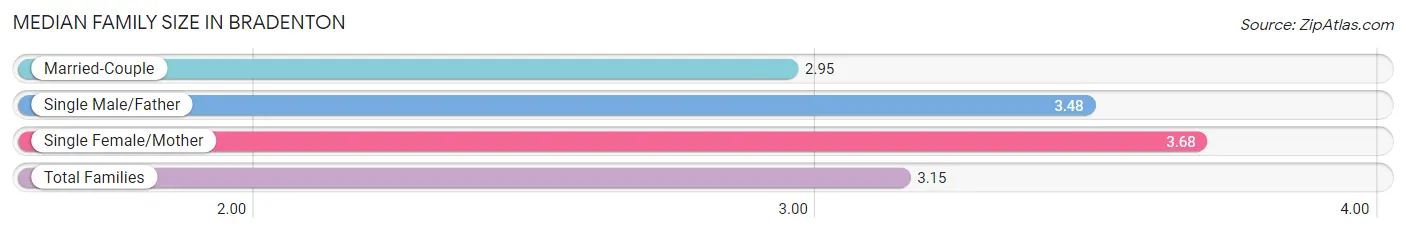
Median Family Size in Bradenton
The median family size in Bradenton is 3.15 persons per family, with single female/mother families (2,740 | 21.4%) accounting for the largest median family size of 3.68 persons per family. On the other hand, married-couple families (8,970 | 70.2%) represent the smallest median family size with 2.95 persons per family.
| Family Type | # Families | Family Size |
| Married-Couple | 8,970 (70.2%) | 2.95 |
| Single Male/Father | 1,066 (8.3%) | 3.48 |
| Single Female/Mother | 2,740 (21.4%) | 3.68 |
| Total Families | 12,776 (100.0%) | 3.15 |
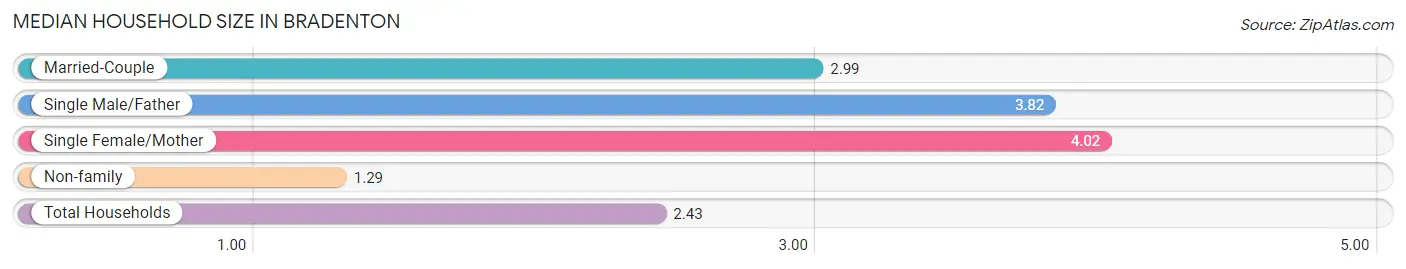
Median Household Size in Bradenton
The median household size in Bradenton is 2.43 persons per household, with single female/mother households (2,740 | 12.4%) accounting for the largest median household size of 4.02 persons per household. non-family households (9,385 | 42.3%) represent the smallest median household size with 1.29 persons per household.
| Household Type | # Households | Household Size |
| Married-Couple | 8,970 (40.5%) | 2.99 |
| Single Male/Father | 1,066 (4.8%) | 3.82 |
| Single Female/Mother | 2,740 (12.4%) | 4.02 |
| Non-family | 9,385 (42.3%) | 1.29 |
| Total Households | 22,161 (100.0%) | 2.43 |
Household Size by Marriage Status in Bradenton
Out of a total of 22,161 households in Bradenton, 12,776 (57.7%) are family households, while 9,385 (42.3%) are nonfamily households. The most numerous type of family households are 2-person households, comprising 7,096, and the most common type of nonfamily households are 1-person households, comprising 7,813.
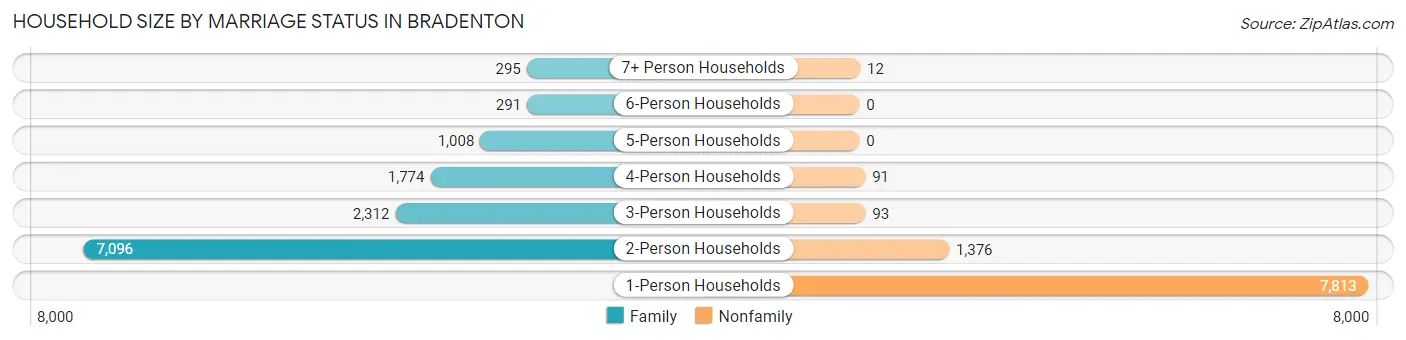
| Household Size | Family Households | Nonfamily Households |
| 1-Person Households | - | 7,813 (35.3%) |
| 2-Person Households | 7,096 (32.0%) | 1,376 (6.2%) |
| 3-Person Households | 2,312 (10.4%) | 93 (0.4%) |
| 4-Person Households | 1,774 (8.0%) | 91 (0.4%) |
| 5-Person Households | 1,008 (4.5%) | 0 (0.0%) |
| 6-Person Households | 291 (1.3%) | 0 (0.0%) |
| 7+ Person Households | 295 (1.3%) | 12 (0.1%) |
| Total | 12,776 (57.7%) | 9,385 (42.3%) |
Female Fertility in Bradenton
Fertility by Age in Bradenton
Average fertility rate in Bradenton is 52.0 births per 1,000 women. Women in the age bracket of 20 to 34 years have the highest fertility rate with 84.0 births per 1,000 women. Women in the age bracket of 20 to 34 years acount for 75.4% of all women with births.
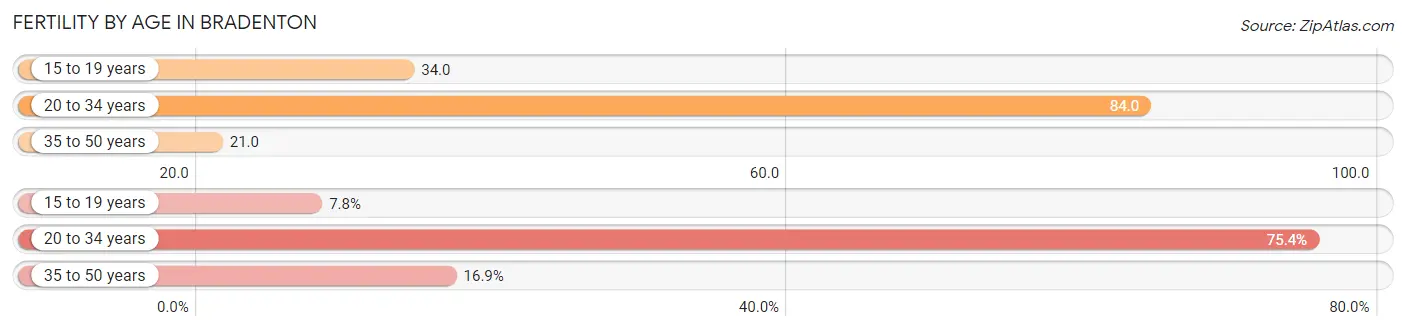
| Age Bracket | Women with Births | Births / 1,000 Women |
| 15 to 19 years | 45 (7.7%) | 34.0 |
| 20 to 34 years | 438 (75.4%) | 84.0 |
| 35 to 50 years | 98 (16.9%) | 21.0 |
| Total | 581 (100.0%) | 52.0 |
Fertility by Age by Marriage Status in Bradenton
47.3% of women with births (581) in Bradenton are married. The highest percentage of unmarried women with births falls into 15 to 19 years age bracket with 77.8% of them unmarried at the time of birth, while the lowest percentage of unmarried women with births belong to 35 to 50 years age bracket with 30.6% of them unmarried.
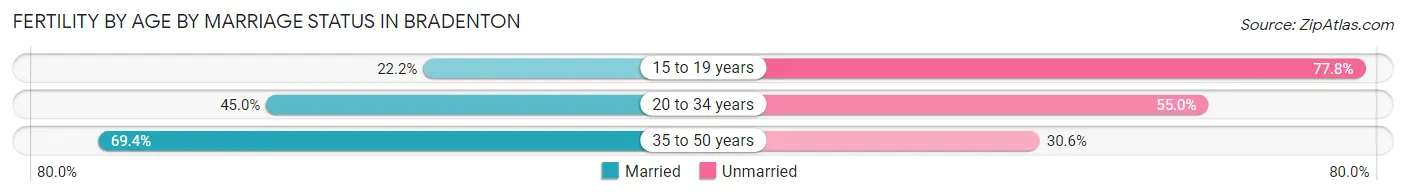
| Age Bracket | Married | Unmarried |
| 15 to 19 years | 10 (22.2%) | 35 (77.8%) |
| 20 to 34 years | 197 (45.0%) | 241 (55.0%) |
| 35 to 50 years | 68 (69.4%) | 30 (30.6%) |
| Total | 275 (47.3%) | 306 (52.7%) |
Fertility by Education in Bradenton
Average fertility rate in Bradenton is 52.0 births per 1,000 women. Women with the education attainment of graduate degree have the highest fertility rate of 91.0 births per 1,000 women, while women with the education attainment of bachelor's degree have the lowest fertility at 13.0 births per 1,000 women. Women with the education attainment of college or associate's degree represent 29.6% of all women with births.
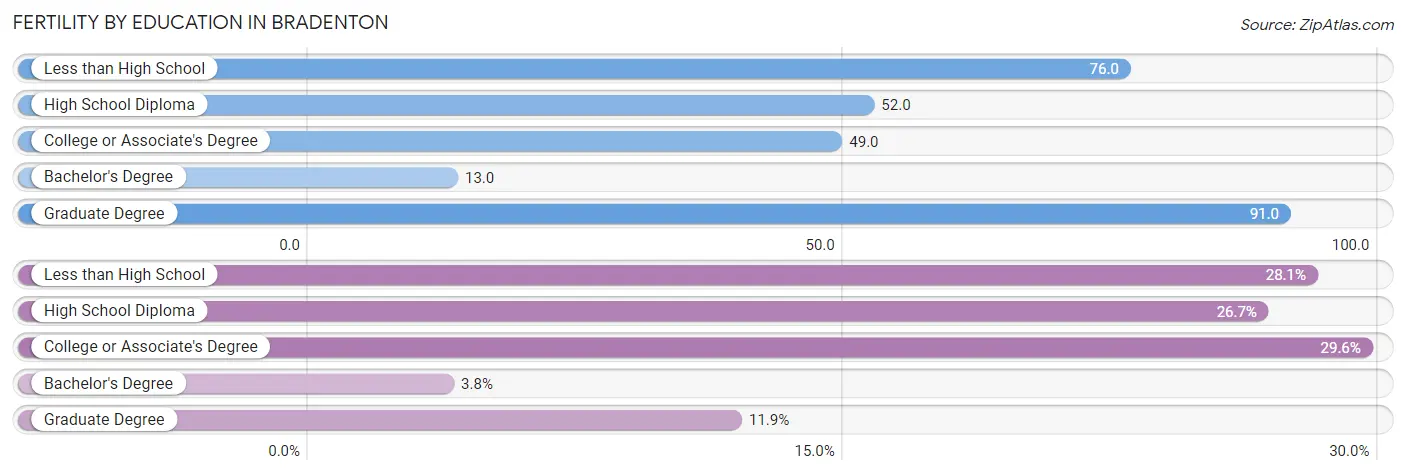
| Educational Attainment | Women with Births | Births / 1,000 Women |
| Less than High School | 163 (28.1%) | 76.0 |
| High School Diploma | 155 (26.7%) | 52.0 |
| College or Associate's Degree | 172 (29.6%) | 49.0 |
| Bachelor's Degree | 22 (3.8%) | 13.0 |
| Graduate Degree | 69 (11.9%) | 91.0 |
| Total | 581 (100.0%) | 52.0 |
Fertility by Education by Marriage Status in Bradenton
52.7% of women with births in Bradenton are unmarried. Women with the educational attainment of less than high school are most likely to be married with 81.0% of them married at childbirth, while women with the educational attainment of college or associate's degree are least likely to be married with 76.2% of them unmarried at childbirth.
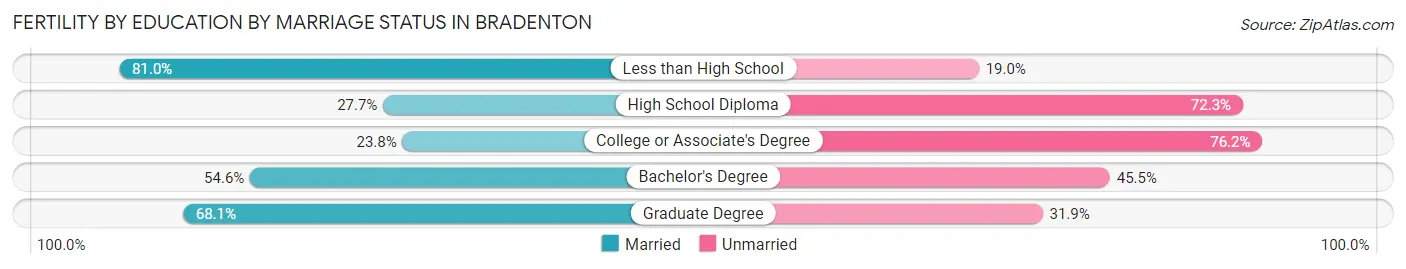
| Educational Attainment | Married | Unmarried |
| Less than High School | 132 (81.0%) | 31 (19.0%) |
| High School Diploma | 43 (27.7%) | 112 (72.3%) |
| College or Associate's Degree | 41 (23.8%) | 131 (76.2%) |
| Bachelor's Degree | 12 (54.5%) | 10 (45.5%) |
| Graduate Degree | 47 (68.1%) | 22 (31.9%) |
| Total | 275 (47.3%) | 306 (52.7%) |
Employment Characteristics in Bradenton
Employment by Class of Employer in Bradenton
Among the 22,751 employed individuals in Bradenton, private company employees (15,484 | 68.1%), local government employees (1,969 | 8.6%), and not-for-profit organizations (1,966 | 8.6%) make up the most common classes of employment.
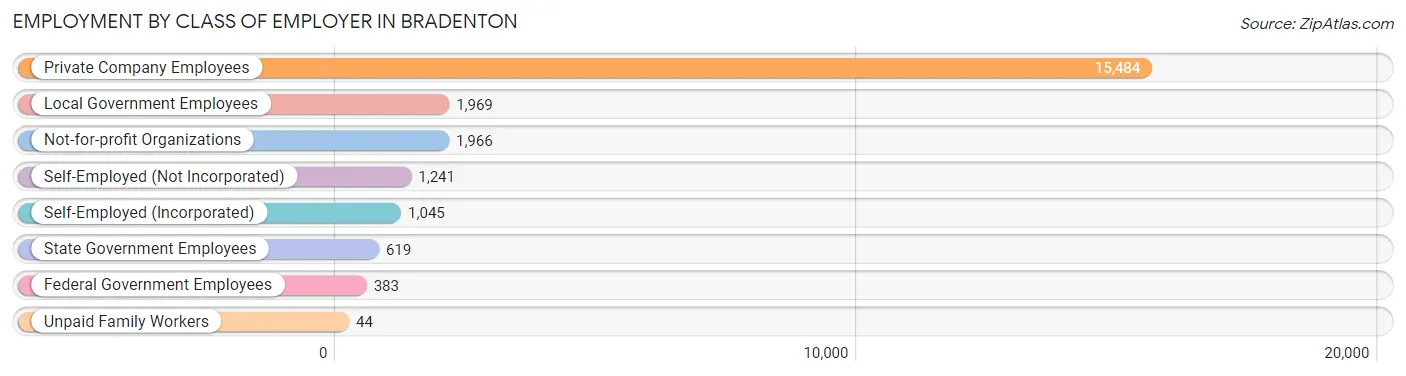
| Employer Class | # Employees | % Employees |
| Private Company Employees | 15,484 | 68.1% |
| Self-Employed (Incorporated) | 1,045 | 4.6% |
| Self-Employed (Not Incorporated) | 1,241 | 5.4% |
| Not-for-profit Organizations | 1,966 | 8.6% |
| Local Government Employees | 1,969 | 8.6% |
| State Government Employees | 619 | 2.7% |
| Federal Government Employees | 383 | 1.7% |
| Unpaid Family Workers | 44 | 0.2% |
| Total | 22,751 | 100.0% |
Employment Status by Age in Bradenton
According to the labor force statistics for Bradenton, out of the total population over 16 years of age (45,381), 54.5% or 24,733 individuals are in the labor force, with 6.7% or 1,657 of them unemployed. The age group with the highest labor force participation rate is 20 to 24 years, with 88.6% or 2,262 individuals in the labor force. Within the labor force, the 20 to 24 years age range has the highest percentage of unemployed individuals, with 16.0% or 362 of them being unemployed.
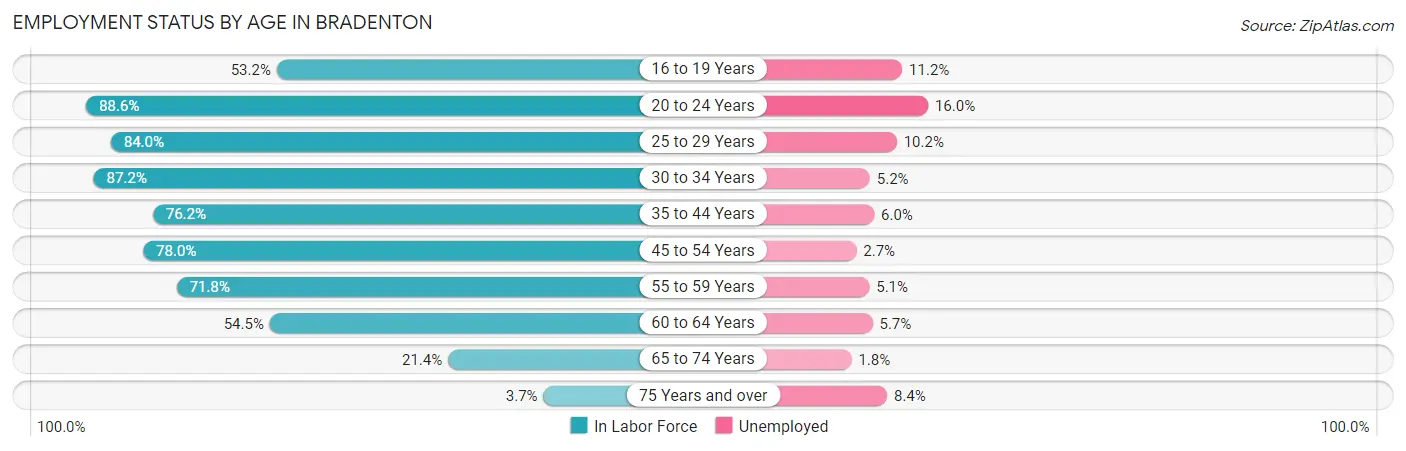
| Age Bracket | In Labor Force | Unemployed |
| 16 to 19 Years | 1,133 (53.2%) | 127 (11.2%) |
| 20 to 24 Years | 2,262 (88.6%) | 362 (16.0%) |
| 25 to 29 Years | 3,703 (84.0%) | 378 (10.2%) |
| 30 to 34 Years | 2,623 (87.2%) | 136 (5.2%) |
| 35 to 44 Years | 3,914 (76.2%) | 235 (6.0%) |
| 45 to 54 Years | 4,689 (78.0%) | 127 (2.7%) |
| 55 to 59 Years | 2,318 (71.8%) | 118 (5.1%) |
| 60 to 64 Years | 2,190 (54.5%) | 125 (5.7%) |
| 65 to 74 Years | 1,605 (21.4%) | 29 (1.8%) |
| 75 Years and over | 273 (3.7%) | 23 (8.4%) |
| Total | 24,733 (54.5%) | 1,657 (6.7%) |
Employment Status by Educational Attainment in Bradenton
According to labor force statistics for Bradenton, 75.3% of individuals (19,436) out of the total population between 25 and 64 years of age (25,812) are in the labor force, with 5.7% or 1,108 of them being unemployed. The group with the highest labor force participation rate are those with the educational attainment of bachelor's degree or higher, with 84.3% or 5,542 individuals in the labor force. Within the labor force, individuals with less than high school education have the highest percentage of unemployment, with 7.3% or 163 of them being unemployed.
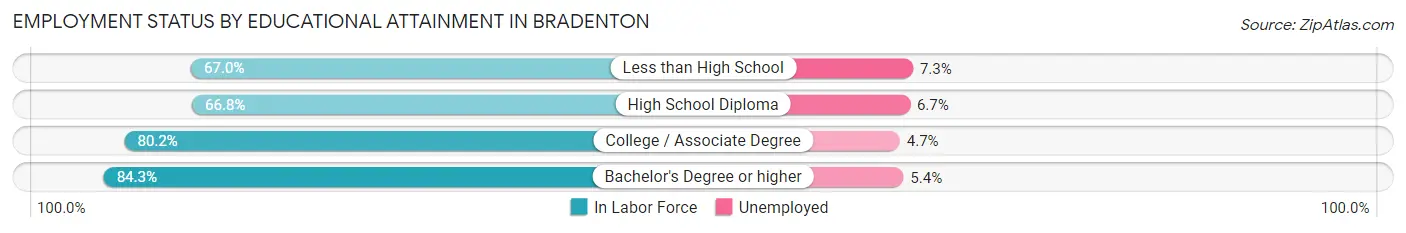
| Educational Attainment | In Labor Force | Unemployed |
| Less than High School | 2,230 (67.0%) | 243 (7.3%) |
| High School Diploma | 5,432 (66.8%) | 545 (6.7%) |
| College / Associate Degree | 6,238 (80.2%) | 366 (4.7%) |
| Bachelor's Degree or higher | 5,542 (84.3%) | 355 (5.4%) |
| Total | 19,436 (75.3%) | 1,471 (5.7%) |
Employment Occupations by Sex in Bradenton
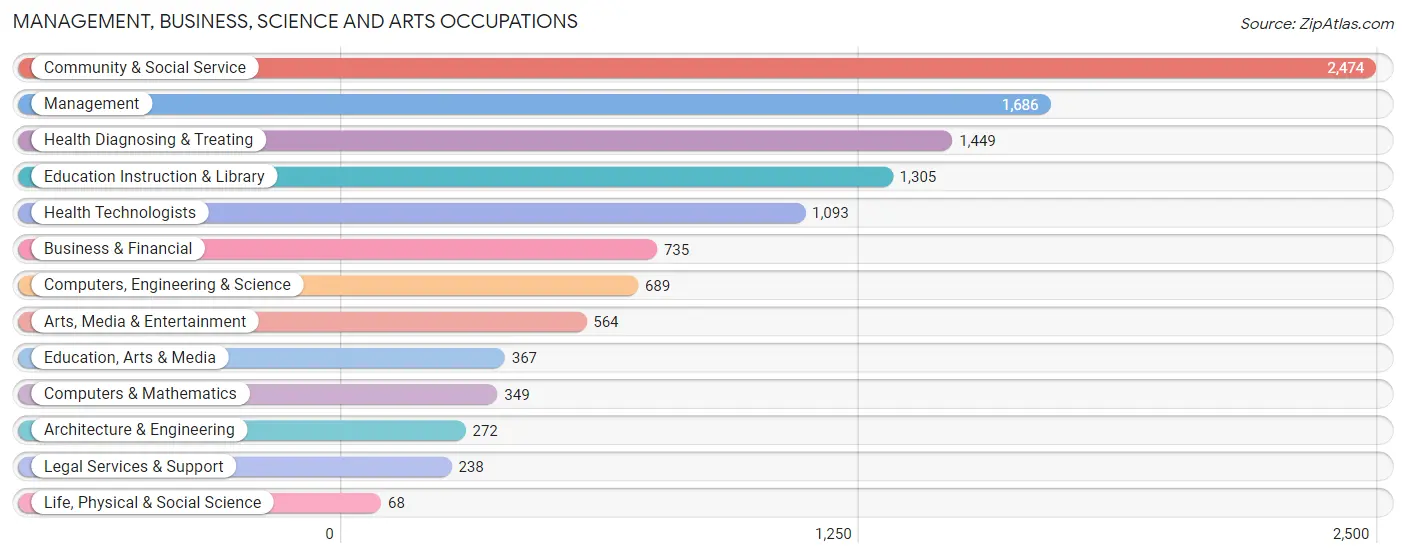
Management, Business, Science and Arts Occupations
The most common Management, Business, Science and Arts occupations in Bradenton are Community & Social Service (2,474 | 10.7%), Management (1,686 | 7.3%), Health Diagnosing & Treating (1,449 | 6.3%), Education Instruction & Library (1,305 | 5.7%), and Health Technologists (1,093 | 4.7%).
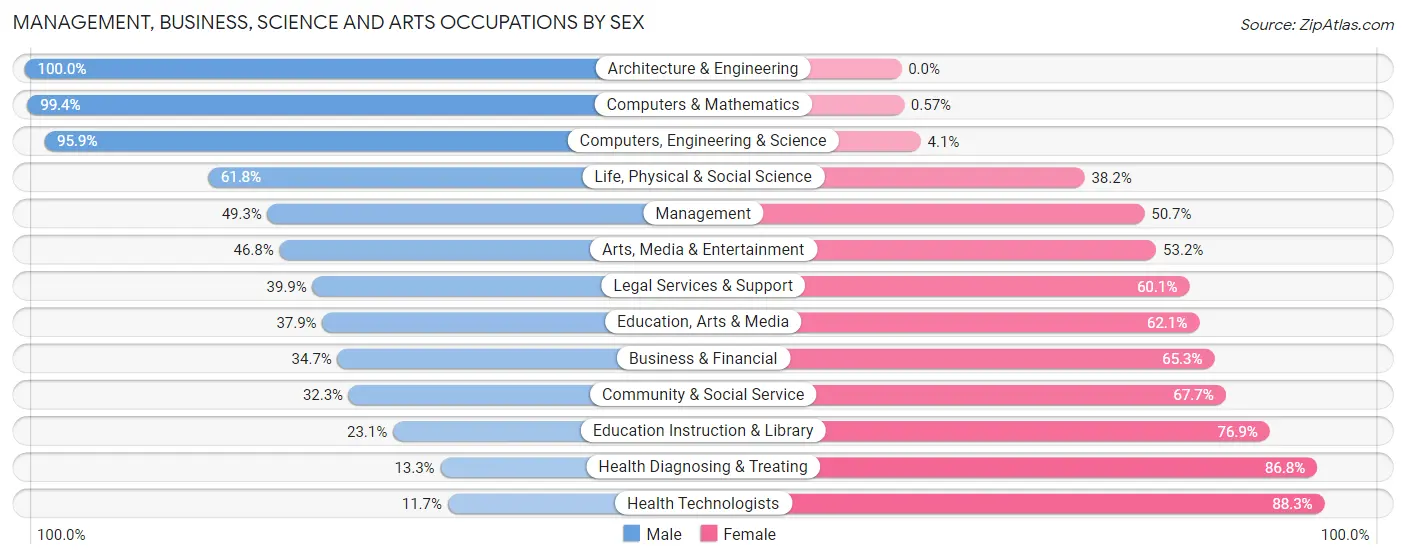
Management, Business, Science and Arts Occupations by Sex
Within the Management, Business, Science and Arts occupations in Bradenton, the most male-oriented occupations are Architecture & Engineering (100.0%), Computers & Mathematics (99.4%), and Computers, Engineering & Science (95.9%), while the most female-oriented occupations are Health Technologists (88.3%), Health Diagnosing & Treating (86.8%), and Education Instruction & Library (76.9%).
| Occupation | Male | Female |
| Management | 831 (49.3%) | 855 (50.7%) |
| Business & Financial | 255 (34.7%) | 480 (65.3%) |
| Computers, Engineering & Science | 661 (95.9%) | 28 (4.1%) |
| Computers & Mathematics | 347 (99.4%) | 2 (0.6%) |
| Architecture & Engineering | 272 (100.0%) | 0 (0.0%) |
| Life, Physical & Social Science | 42 (61.8%) | 26 (38.2%) |
| Community & Social Service | 800 (32.3%) | 1,674 (67.7%) |
| Education, Arts & Media | 139 (37.9%) | 228 (62.1%) |
| Legal Services & Support | 95 (39.9%) | 143 (60.1%) |
| Education Instruction & Library | 302 (23.1%) | 1,003 (76.9%) |
| Arts, Media & Entertainment | 264 (46.8%) | 300 (53.2%) |
| Health Diagnosing & Treating | 192 (13.3%) | 1,257 (86.8%) |
| Health Technologists | 128 (11.7%) | 965 (88.3%) |
| Total (Category) | 2,739 (38.9%) | 4,294 (61.1%) |
| Total (Overall) | 11,887 (51.6%) | 11,167 (48.4%) |
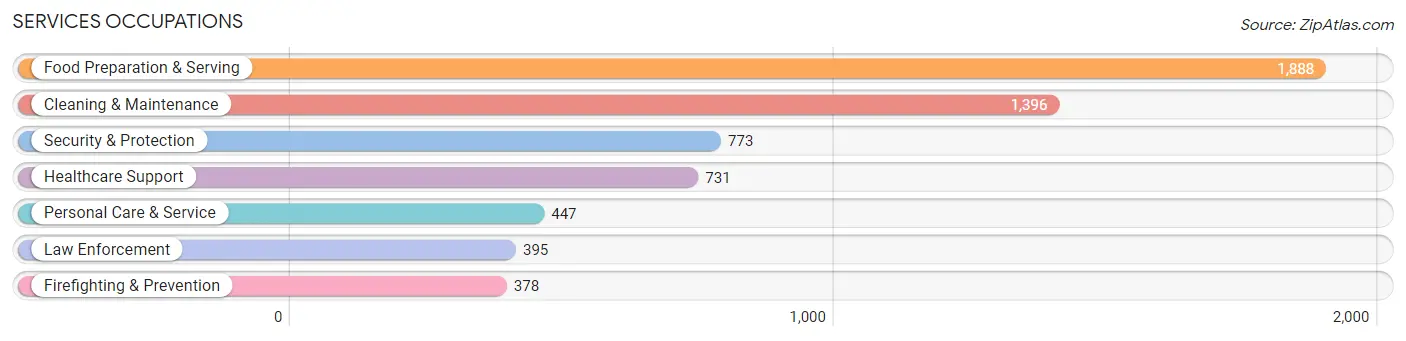
Services Occupations
The most common Services occupations in Bradenton are Food Preparation & Serving (1,888 | 8.2%), Cleaning & Maintenance (1,396 | 6.1%), Security & Protection (773 | 3.4%), Healthcare Support (731 | 3.2%), and Personal Care & Service (447 | 1.9%).
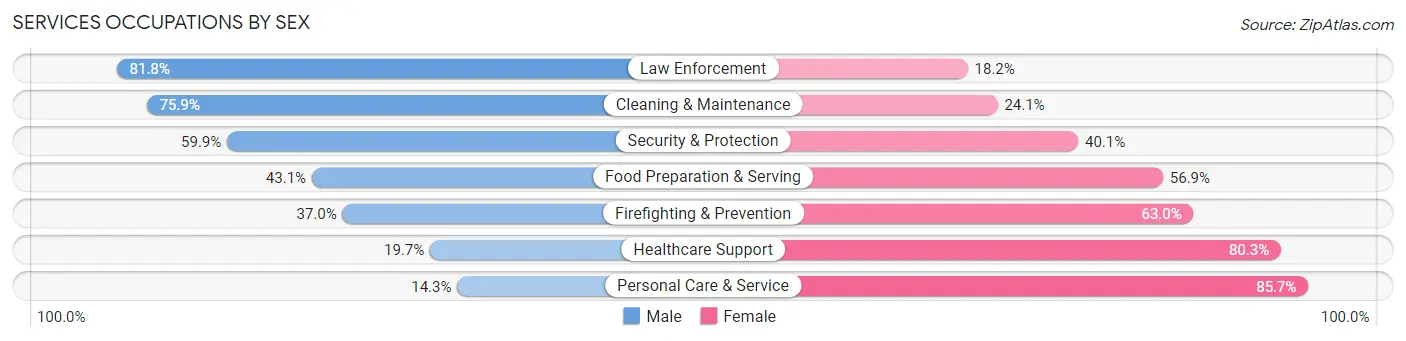
Services Occupations by Sex
Within the Services occupations in Bradenton, the most male-oriented occupations are Law Enforcement (81.8%), Cleaning & Maintenance (75.9%), and Security & Protection (59.9%), while the most female-oriented occupations are Personal Care & Service (85.7%), Healthcare Support (80.3%), and Firefighting & Prevention (63.0%).
| Occupation | Male | Female |
| Healthcare Support | 144 (19.7%) | 587 (80.3%) |
| Security & Protection | 463 (59.9%) | 310 (40.1%) |
| Firefighting & Prevention | 140 (37.0%) | 238 (63.0%) |
| Law Enforcement | 323 (81.8%) | 72 (18.2%) |
| Food Preparation & Serving | 814 (43.1%) | 1,074 (56.9%) |
| Cleaning & Maintenance | 1,059 (75.9%) | 337 (24.1%) |
| Personal Care & Service | 64 (14.3%) | 383 (85.7%) |
| Total (Category) | 2,544 (48.6%) | 2,691 (51.4%) |
| Total (Overall) | 11,887 (51.6%) | 11,167 (48.4%) |
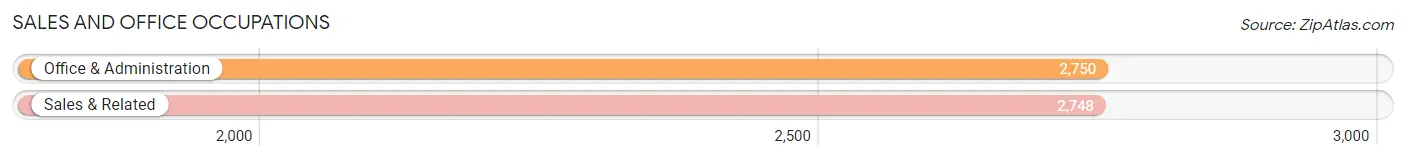
Sales and Office Occupations
The most common Sales and Office occupations in Bradenton are Office & Administration (2,750 | 11.9%), and Sales & Related (2,748 | 11.9%).
Sales and Office Occupations by Sex
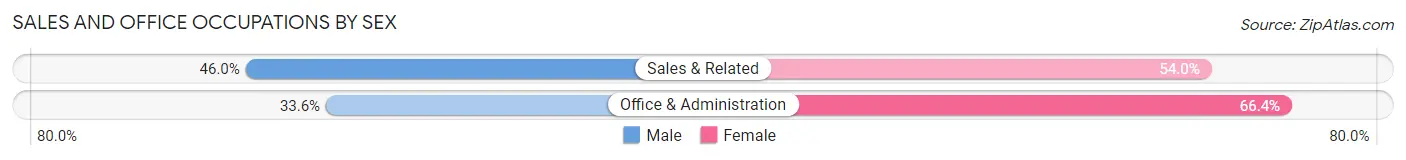
| Occupation | Male | Female |
| Sales & Related | 1,264 (46.0%) | 1,484 (54.0%) |
| Office & Administration | 925 (33.6%) | 1,825 (66.4%) |
| Total (Category) | 2,189 (39.8%) | 3,309 (60.2%) |
| Total (Overall) | 11,887 (51.6%) | 11,167 (48.4%) |
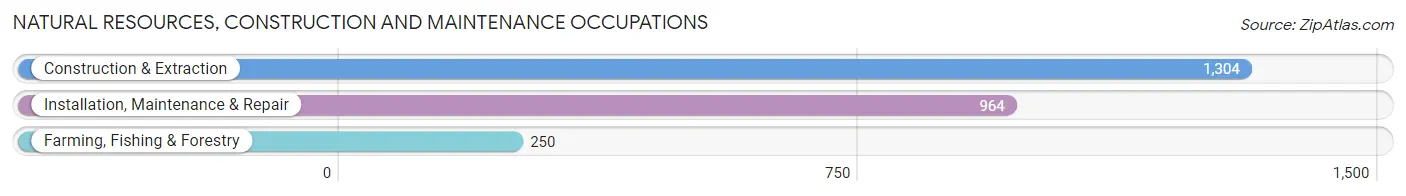
Natural Resources, Construction and Maintenance Occupations
The most common Natural Resources, Construction and Maintenance occupations in Bradenton are Construction & Extraction (1,304 | 5.7%), Installation, Maintenance & Repair (964 | 4.2%), and Farming, Fishing & Forestry (250 | 1.1%).
Natural Resources, Construction and Maintenance Occupations by Sex
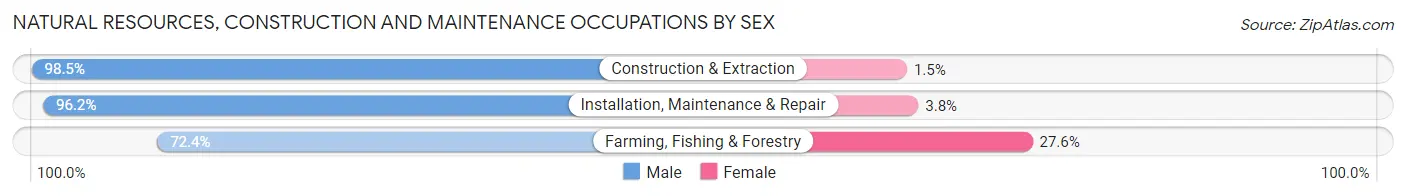
| Occupation | Male | Female |
| Farming, Fishing & Forestry | 181 (72.4%) | 69 (27.6%) |
| Construction & Extraction | 1,285 (98.5%) | 19 (1.5%) |
| Installation, Maintenance & Repair | 927 (96.2%) | 37 (3.8%) |
| Total (Category) | 2,393 (95.0%) | 125 (5.0%) |
| Total (Overall) | 11,887 (51.6%) | 11,167 (48.4%) |
Production, Transportation and Moving Occupations
The most common Production, Transportation and Moving occupations in Bradenton are Material Moving (948 | 4.1%), Transportation (940 | 4.1%), and Production (882 | 3.8%).
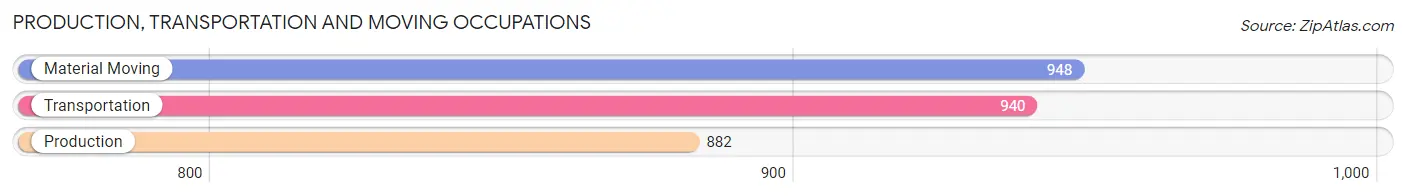
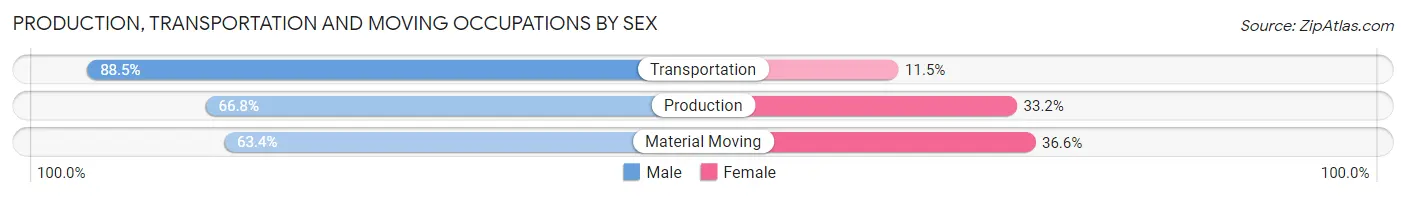
Production, Transportation and Moving Occupations by Sex
| Occupation | Male | Female |
| Production | 589 (66.8%) | 293 (33.2%) |
| Transportation | 832 (88.5%) | 108 (11.5%) |
| Material Moving | 601 (63.4%) | 347 (36.6%) |
| Total (Category) | 2,022 (73.0%) | 748 (27.0%) |
| Total (Overall) | 11,887 (51.6%) | 11,167 (48.4%) |
Employment Industries by Sex in Bradenton
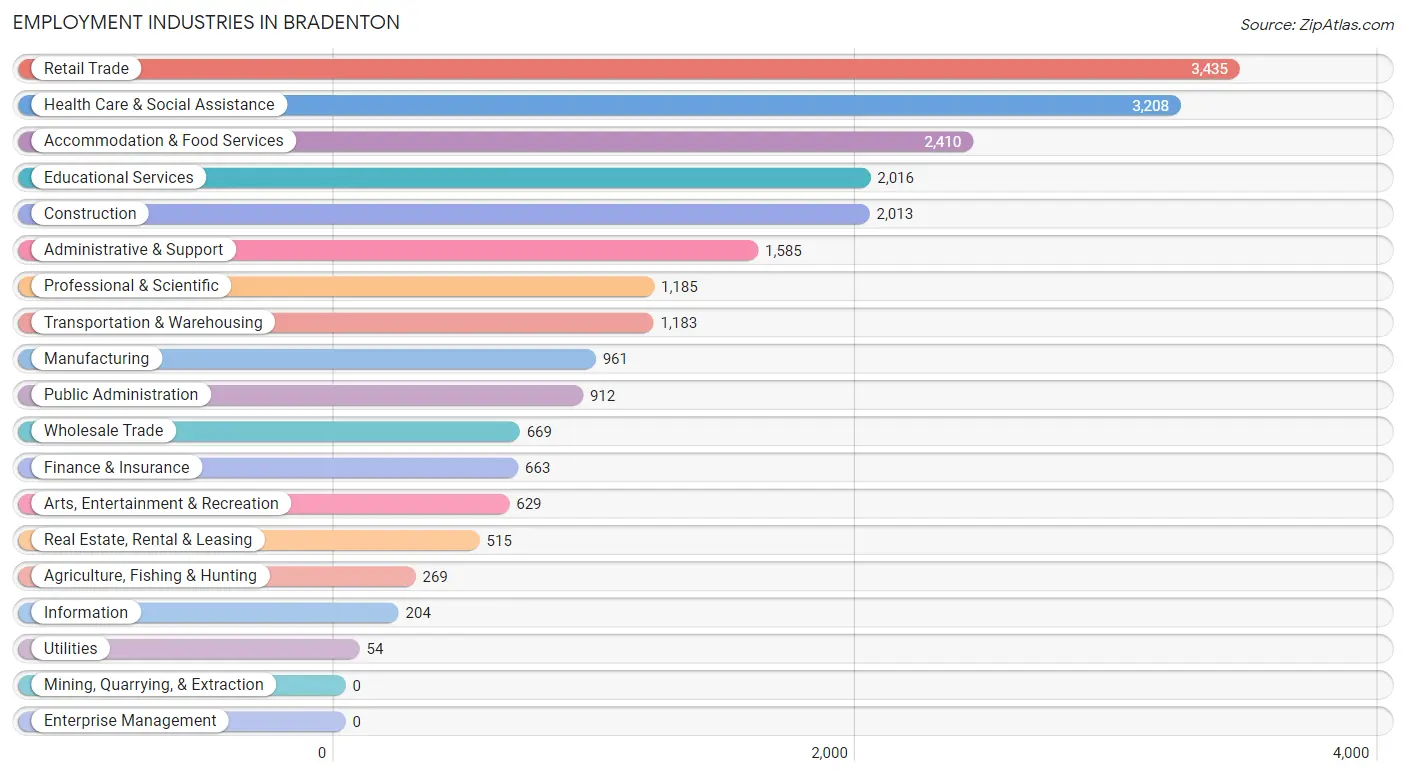
Employment Industries in Bradenton
The major employment industries in Bradenton include Retail Trade (3,435 | 14.9%), Health Care & Social Assistance (3,208 | 13.9%), Accommodation & Food Services (2,410 | 10.4%), Educational Services (2,016 | 8.7%), and Construction (2,013 | 8.7%).
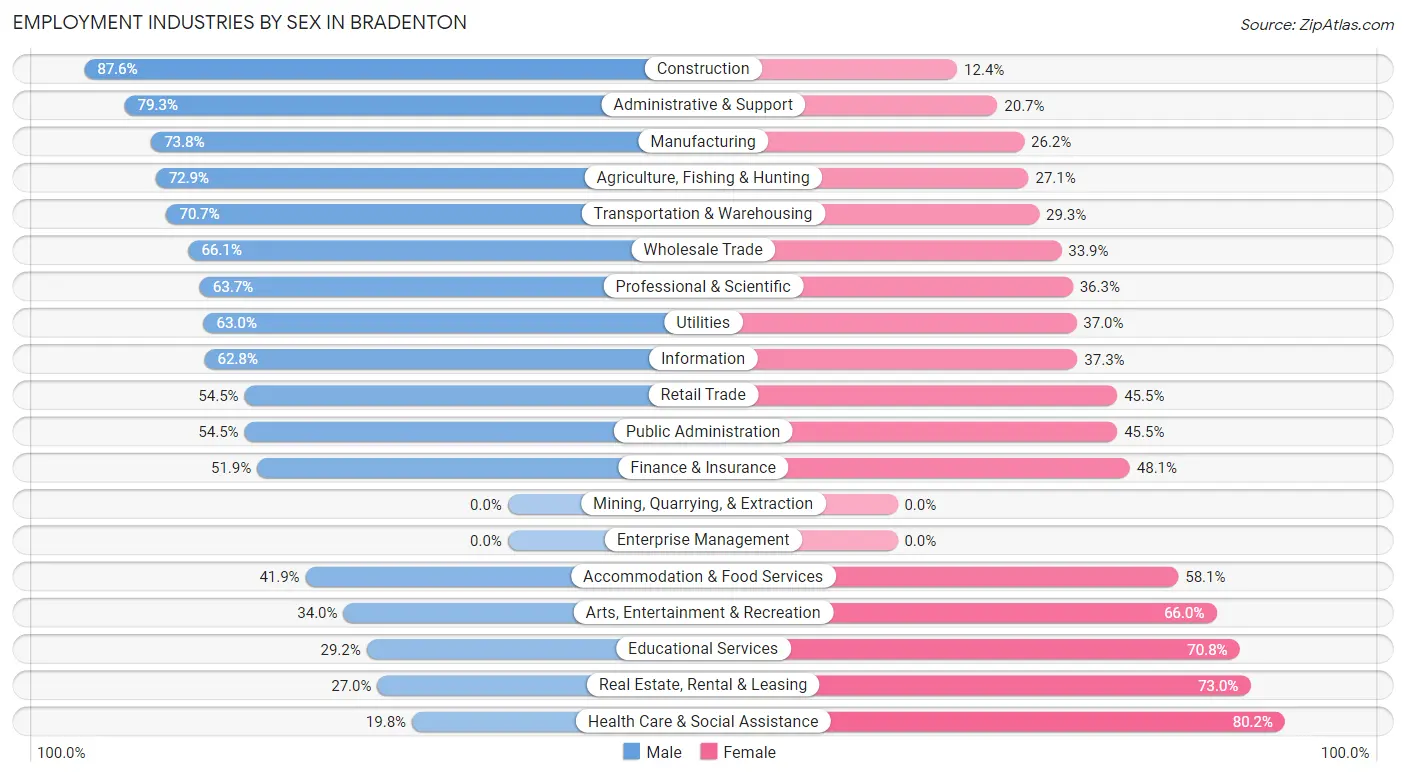
Employment Industries by Sex in Bradenton
The Bradenton industries that see more men than women are Construction (87.6%), Administrative & Support (79.3%), and Manufacturing (73.8%), whereas the industries that tend to have a higher number of women are Health Care & Social Assistance (80.2%), Real Estate, Rental & Leasing (73.0%), and Educational Services (70.8%).
| Industry | Male | Female |
| Agriculture, Fishing & Hunting | 196 (72.9%) | 73 (27.1%) |
| Mining, Quarrying, & Extraction | 0 (0.0%) | 0 (0.0%) |
| Construction | 1,764 (87.6%) | 249 (12.4%) |
| Manufacturing | 709 (73.8%) | 252 (26.2%) |
| Wholesale Trade | 442 (66.1%) | 227 (33.9%) |
| Retail Trade | 1,872 (54.5%) | 1,563 (45.5%) |
| Transportation & Warehousing | 836 (70.7%) | 347 (29.3%) |
| Utilities | 34 (63.0%) | 20 (37.0%) |
| Information | 128 (62.7%) | 76 (37.2%) |
| Finance & Insurance | 344 (51.9%) | 319 (48.1%) |
| Real Estate, Rental & Leasing | 139 (27.0%) | 376 (73.0%) |
| Professional & Scientific | 755 (63.7%) | 430 (36.3%) |
| Enterprise Management | 0 (0.0%) | 0 (0.0%) |
| Administrative & Support | 1,257 (79.3%) | 328 (20.7%) |
| Educational Services | 589 (29.2%) | 1,427 (70.8%) |
| Health Care & Social Assistance | 636 (19.8%) | 2,572 (80.2%) |
| Arts, Entertainment & Recreation | 214 (34.0%) | 415 (66.0%) |
| Accommodation & Food Services | 1,009 (41.9%) | 1,401 (58.1%) |
| Public Administration | 497 (54.5%) | 415 (45.5%) |
| Total | 11,887 (51.6%) | 11,167 (48.4%) |
Education in Bradenton
School Enrollment in Bradenton
The most common levels of schooling among the 11,043 students in Bradenton are elementary school (2,656 | 24.0%), high school (2,399 | 21.7%), and middle school (2,143 | 19.4%).
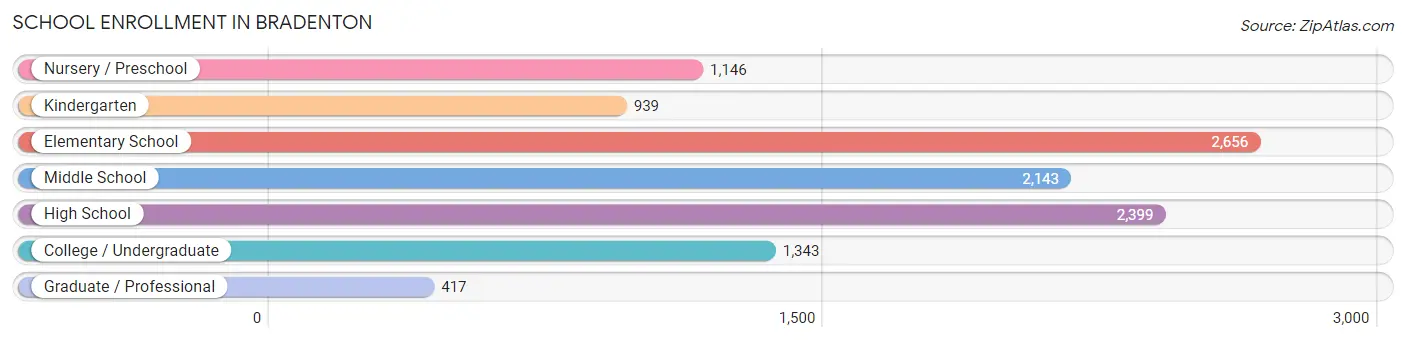
| School Level | # Students | % Students |
| Nursery / Preschool | 1,146 | 10.4% |
| Kindergarten | 939 | 8.5% |
| Elementary School | 2,656 | 24.0% |
| Middle School | 2,143 | 19.4% |
| High School | 2,399 | 21.7% |
| College / Undergraduate | 1,343 | 12.2% |
| Graduate / Professional | 417 | 3.8% |
| Total | 11,043 | 100.0% |
School Enrollment by Age by Funding Source in Bradenton
Out of a total of 11,043 students who are enrolled in schools in Bradenton, 1,933 (17.5%) attend a private institution, while the remaining 9,110 (82.5%) are enrolled in public schools. The age group of 3 to 4 year olds has the highest likelihood of being enrolled in private schools, with 467 (50.6% in the age bracket) enrolled. Conversely, the age group of 18 to 19 year olds has the lowest likelihood of being enrolled in a private school, with 465 (96.7% in the age bracket) attending a public institution.
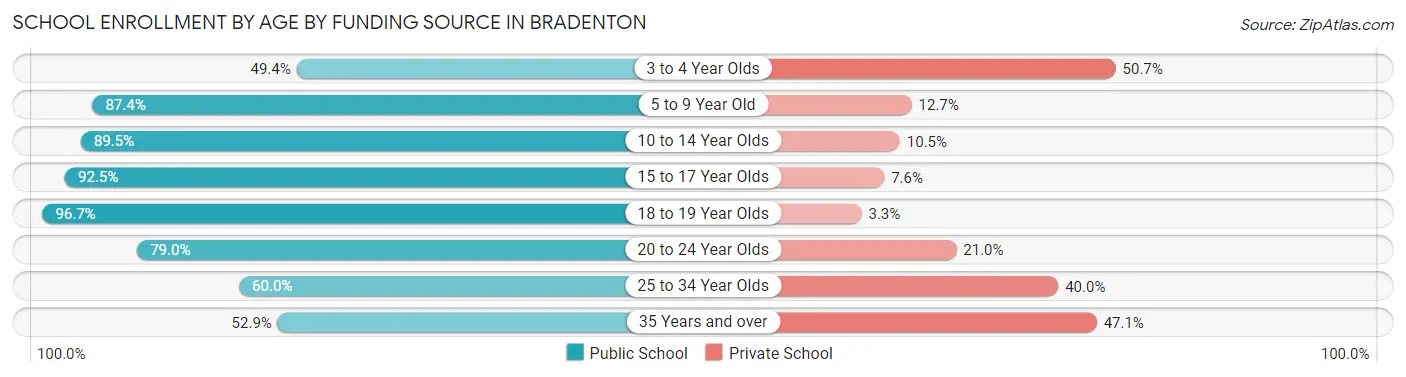
| Age Bracket | Public School | Private School |
| 3 to 4 Year Olds | 455 (49.3%) | 467 (50.6%) |
| 5 to 9 Year Old | 3,086 (87.4%) | 447 (12.7%) |
| 10 to 14 Year Olds | 2,421 (89.5%) | 283 (10.5%) |
| 15 to 17 Year Olds | 1,579 (92.4%) | 129 (7.5%) |
| 18 to 19 Year Olds | 465 (96.7%) | 16 (3.3%) |
| 20 to 24 Year Olds | 497 (79.0%) | 132 (21.0%) |
| 25 to 34 Year Olds | 347 (60.0%) | 231 (40.0%) |
| 35 Years and over | 258 (52.9%) | 230 (47.1%) |
| Total | 9,110 (82.5%) | 1,933 (17.5%) |
Educational Attainment by Field of Study in Bradenton
Business (2,312 | 19.4%), education (1,813 | 15.2%), science & technology (1,380 | 11.6%), arts & humanities (953 | 8.0%), and social sciences (812 | 6.8%) are the most common fields of study among 11,898 individuals in Bradenton who have obtained a bachelor's degree or higher.
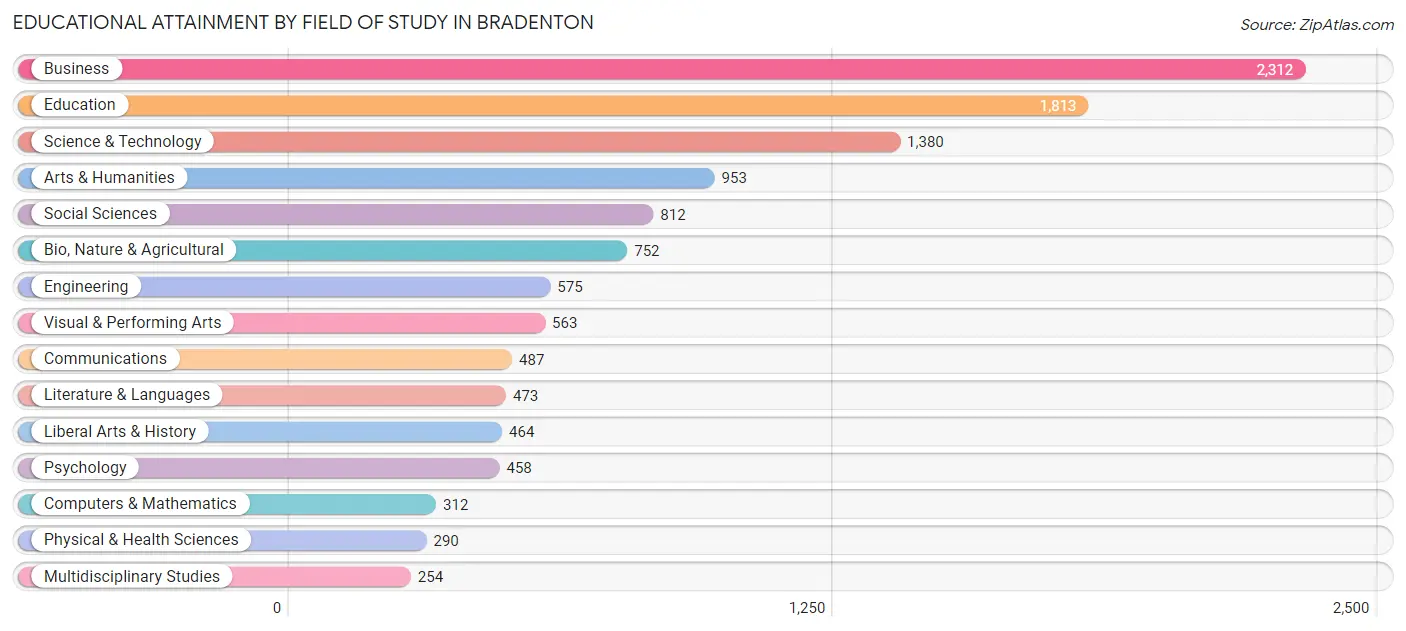
| Field of Study | # Graduates | % Graduates |
| Computers & Mathematics | 312 | 2.6% |
| Bio, Nature & Agricultural | 752 | 6.3% |
| Physical & Health Sciences | 290 | 2.4% |
| Psychology | 458 | 3.8% |
| Social Sciences | 812 | 6.8% |
| Engineering | 575 | 4.8% |
| Multidisciplinary Studies | 254 | 2.1% |
| Science & Technology | 1,380 | 11.6% |
| Business | 2,312 | 19.4% |
| Education | 1,813 | 15.2% |
| Literature & Languages | 473 | 4.0% |
| Liberal Arts & History | 464 | 3.9% |
| Visual & Performing Arts | 563 | 4.7% |
| Communications | 487 | 4.1% |
| Arts & Humanities | 953 | 8.0% |
| Total | 11,898 | 100.0% |
Transportation & Commute in Bradenton
Vehicle Availability by Sex in Bradenton
The most prevalent vehicle ownership categories in Bradenton are males with 2 vehicles (5,246, accounting for 45.0%) and females with 2 vehicles (4,710, making up 47.8%).
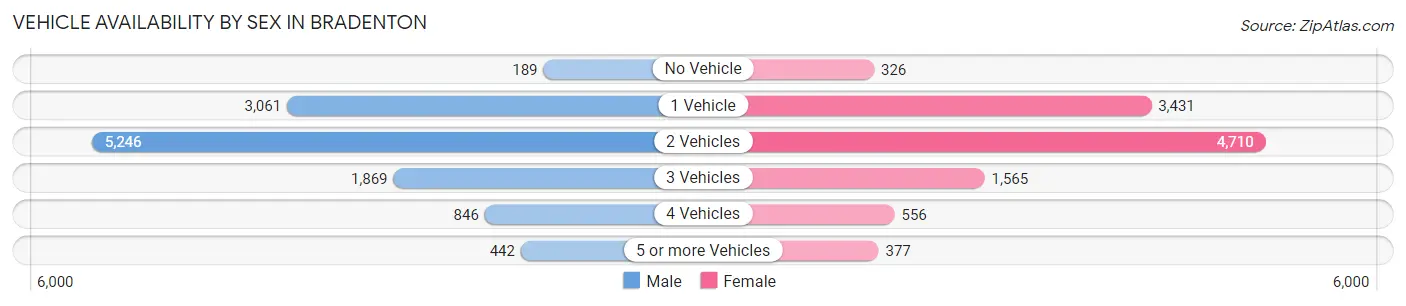
| Vehicles Available | Male | Female |
| No Vehicle | 189 (1.6%) | 326 (3.0%) |
| 1 Vehicle | 3,061 (26.3%) | 3,431 (31.3%) |
| 2 Vehicles | 5,246 (45.0%) | 4,710 (42.9%) |
| 3 Vehicles | 1,869 (16.0%) | 1,565 (14.3%) |
| 4 Vehicles | 846 (7.3%) | 556 (5.1%) |
| 5 or more Vehicles | 442 (3.8%) | 377 (3.4%) |
| Total | 11,653 (100.0%) | 10,965 (100.0%) |
Commute Time in Bradenton
The most frequently occuring commute durations in Bradenton are 15 to 19 minutes (3,401 commuters, 16.2%), 20 to 24 minutes (3,152 commuters, 15.0%), and 10 to 14 minutes (3,045 commuters, 14.5%).
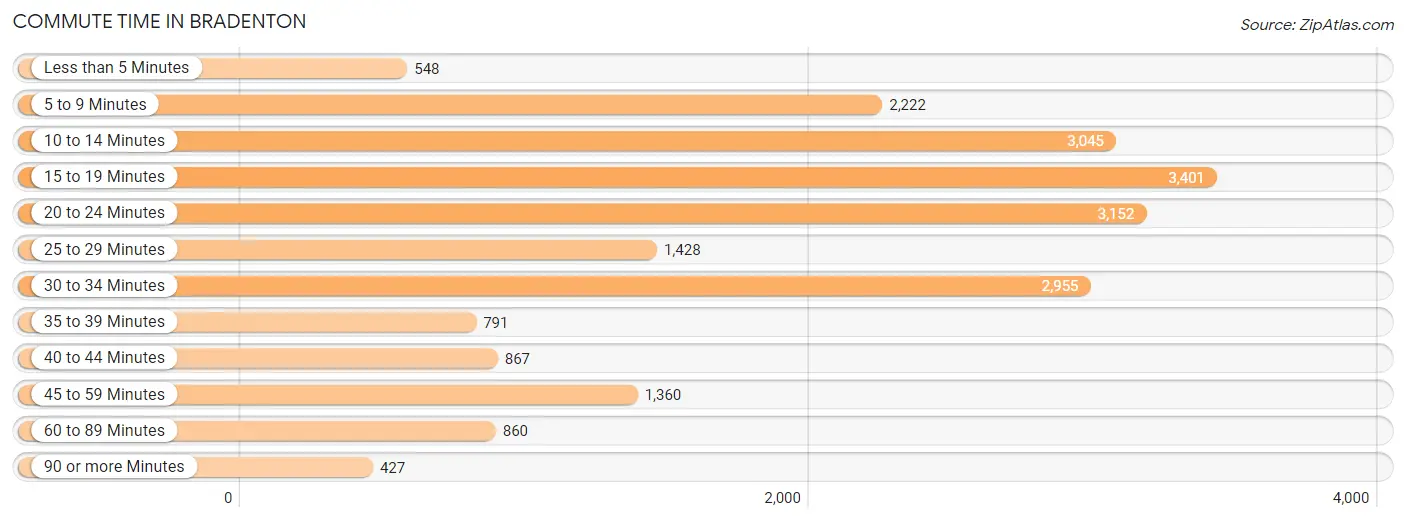
| Commute Time | # Commuters | % Commuters |
| Less than 5 Minutes | 548 | 2.6% |
| 5 to 9 Minutes | 2,222 | 10.5% |
| 10 to 14 Minutes | 3,045 | 14.5% |
| 15 to 19 Minutes | 3,401 | 16.2% |
| 20 to 24 Minutes | 3,152 | 15.0% |
| 25 to 29 Minutes | 1,428 | 6.8% |
| 30 to 34 Minutes | 2,955 | 14.0% |
| 35 to 39 Minutes | 791 | 3.8% |
| 40 to 44 Minutes | 867 | 4.1% |
| 45 to 59 Minutes | 1,360 | 6.5% |
| 60 to 89 Minutes | 860 | 4.1% |
| 90 or more Minutes | 427 | 2.0% |
Commute Time by Sex in Bradenton
The most common commute times in Bradenton are 15 to 19 minutes (1,853 commuters, 16.7%) for males and 10 to 14 minutes (1,695 commuters, 17.1%) for females.
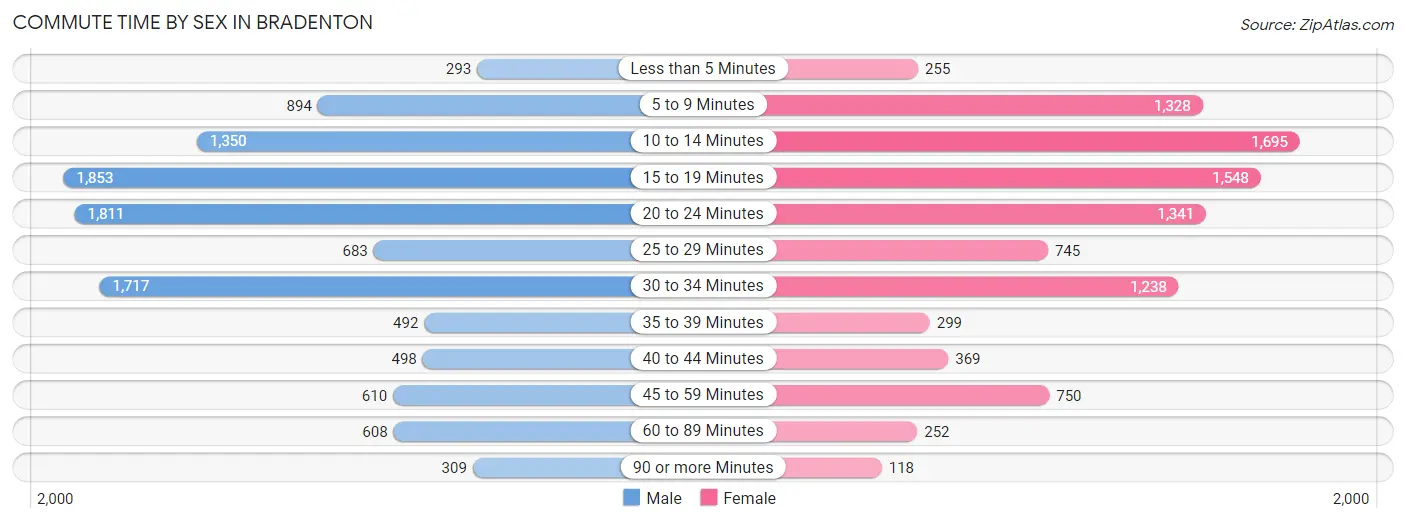
| Commute Time | Male | Female |
| Less than 5 Minutes | 293 (2.6%) | 255 (2.6%) |
| 5 to 9 Minutes | 894 (8.0%) | 1,328 (13.4%) |
| 10 to 14 Minutes | 1,350 (12.1%) | 1,695 (17.1%) |
| 15 to 19 Minutes | 1,853 (16.7%) | 1,548 (15.6%) |
| 20 to 24 Minutes | 1,811 (16.3%) | 1,341 (13.5%) |
| 25 to 29 Minutes | 683 (6.1%) | 745 (7.5%) |
| 30 to 34 Minutes | 1,717 (15.4%) | 1,238 (12.5%) |
| 35 to 39 Minutes | 492 (4.4%) | 299 (3.0%) |
| 40 to 44 Minutes | 498 (4.5%) | 369 (3.7%) |
| 45 to 59 Minutes | 610 (5.5%) | 750 (7.5%) |
| 60 to 89 Minutes | 608 (5.5%) | 252 (2.5%) |
| 90 or more Minutes | 309 (2.8%) | 118 (1.2%) |
Time of Departure to Work by Sex in Bradenton
The most frequent times of departure to work in Bradenton are 7:00 AM to 7:29 AM (1,788, 16.1%) for males and 7:30 AM to 7:59 AM (1,767, 17.8%) for females.
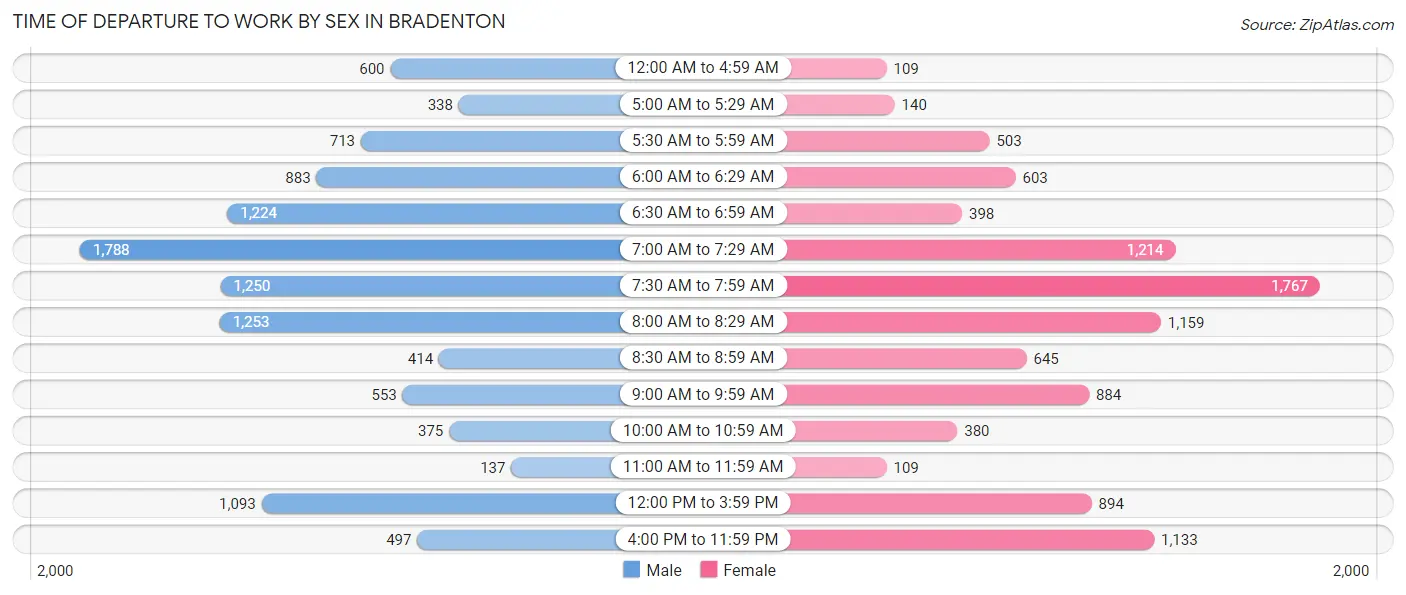
| Time of Departure | Male | Female |
| 12:00 AM to 4:59 AM | 600 (5.4%) | 109 (1.1%) |
| 5:00 AM to 5:29 AM | 338 (3.0%) | 140 (1.4%) |
| 5:30 AM to 5:59 AM | 713 (6.4%) | 503 (5.1%) |
| 6:00 AM to 6:29 AM | 883 (7.9%) | 603 (6.1%) |
| 6:30 AM to 6:59 AM | 1,224 (11.0%) | 398 (4.0%) |
| 7:00 AM to 7:29 AM | 1,788 (16.1%) | 1,214 (12.2%) |
| 7:30 AM to 7:59 AM | 1,250 (11.2%) | 1,767 (17.8%) |
| 8:00 AM to 8:29 AM | 1,253 (11.3%) | 1,159 (11.7%) |
| 8:30 AM to 8:59 AM | 414 (3.7%) | 645 (6.5%) |
| 9:00 AM to 9:59 AM | 553 (5.0%) | 884 (8.9%) |
| 10:00 AM to 10:59 AM | 375 (3.4%) | 380 (3.8%) |
| 11:00 AM to 11:59 AM | 137 (1.2%) | 109 (1.1%) |
| 12:00 PM to 3:59 PM | 1,093 (9.8%) | 894 (9.0%) |
| 4:00 PM to 11:59 PM | 497 (4.5%) | 1,133 (11.4%) |
| Total | 11,118 (100.0%) | 9,938 (100.0%) |
Housing Occupancy in Bradenton
Occupancy by Ownership in Bradenton
Of the total 22,161 dwellings in Bradenton, owner-occupied units account for 12,986 (58.6%), while renter-occupied units make up 9,175 (41.4%).
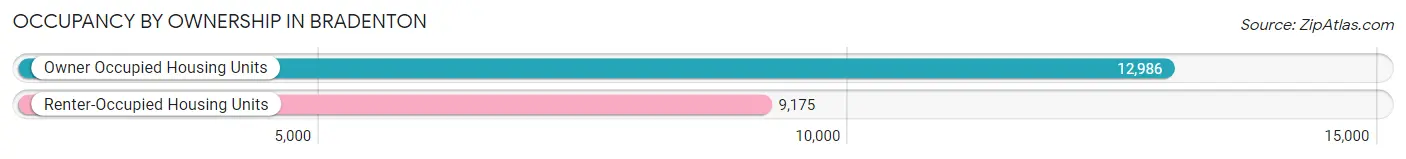
| Occupancy | # Housing Units | % Housing Units |
| Owner Occupied Housing Units | 12,986 | 58.6% |
| Renter-Occupied Housing Units | 9,175 | 41.4% |
| Total Occupied Housing Units | 22,161 | 100.0% |
Occupancy by Household Size in Bradenton
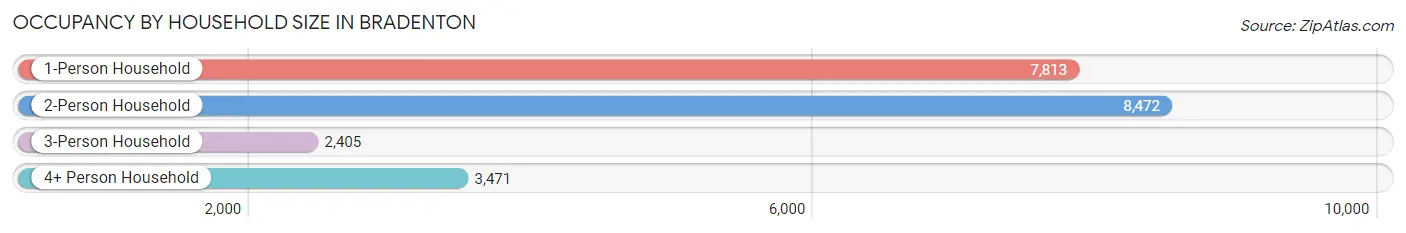
| Household Size | # Housing Units | % Housing Units |
| 1-Person Household | 7,813 | 35.3% |
| 2-Person Household | 8,472 | 38.2% |
| 3-Person Household | 2,405 | 10.8% |
| 4+ Person Household | 3,471 | 15.7% |
| Total Housing Units | 22,161 | 100.0% |
Occupancy by Ownership by Household Size in Bradenton
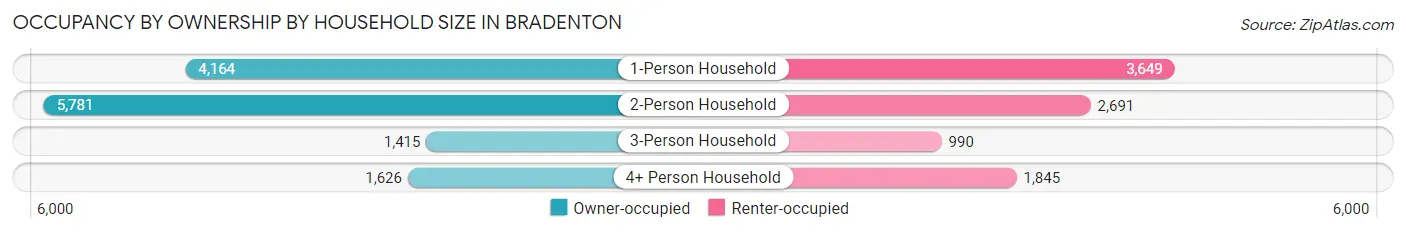
| Household Size | Owner-occupied | Renter-occupied |
| 1-Person Household | 4,164 (53.3%) | 3,649 (46.7%) |
| 2-Person Household | 5,781 (68.2%) | 2,691 (31.8%) |
| 3-Person Household | 1,415 (58.8%) | 990 (41.2%) |
| 4+ Person Household | 1,626 (46.9%) | 1,845 (53.1%) |
| Total Housing Units | 12,986 (58.6%) | 9,175 (41.4%) |
Occupancy by Educational Attainment in Bradenton
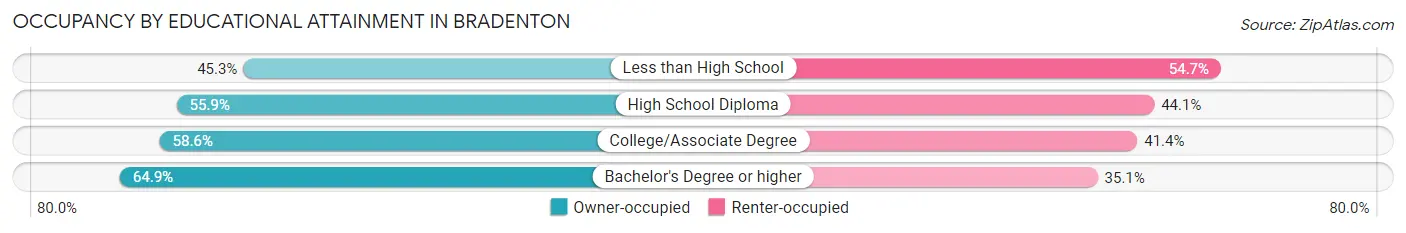
| Household Size | Owner-occupied | Renter-occupied |
| Less than High School | 991 (45.3%) | 1,195 (54.7%) |
| High School Diploma | 3,316 (55.9%) | 2,616 (44.1%) |
| College/Associate Degree | 4,020 (58.6%) | 2,842 (41.4%) |
| Bachelor's Degree or higher | 4,659 (64.9%) | 2,522 (35.1%) |
Occupancy by Age of Householder in Bradenton
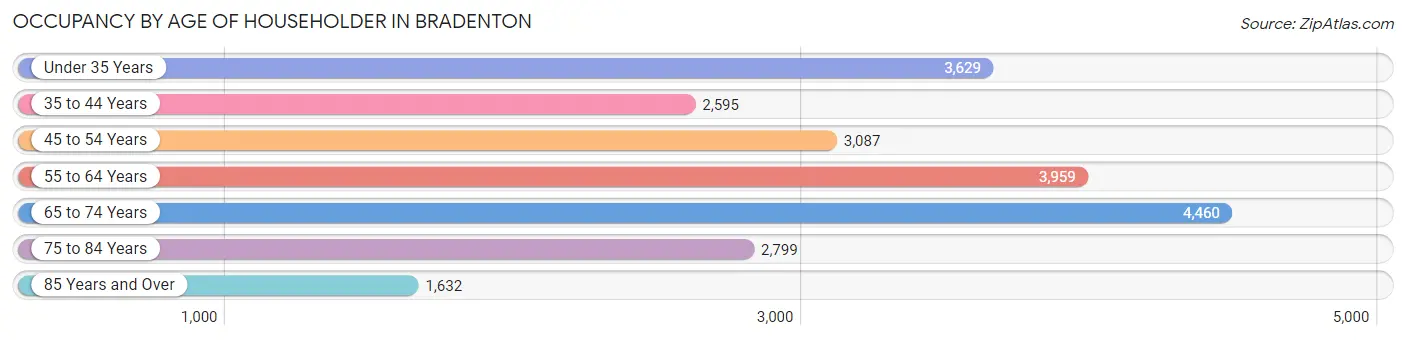
| Age Bracket | # Households | % Households |
| Under 35 Years | 3,629 | 16.4% |
| 35 to 44 Years | 2,595 | 11.7% |
| 45 to 54 Years | 3,087 | 13.9% |
| 55 to 64 Years | 3,959 | 17.9% |
| 65 to 74 Years | 4,460 | 20.1% |
| 75 to 84 Years | 2,799 | 12.6% |
| 85 Years and Over | 1,632 | 7.4% |
| Total | 22,161 | 100.0% |
Housing Finances in Bradenton
Median Income by Occupancy in Bradenton
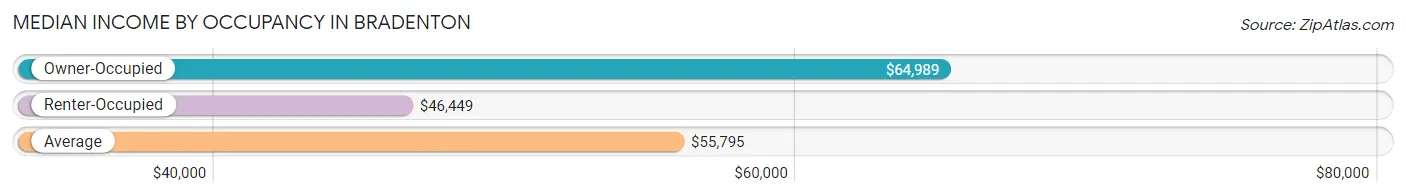
| Occupancy Type | # Households | Median Income |
| Owner-Occupied | 12,986 (58.6%) | $64,989 |
| Renter-Occupied | 9,175 (41.4%) | $46,449 |
| Average | 22,161 (100.0%) | $55,795 |
Occupancy by Householder Income Bracket in Bradenton
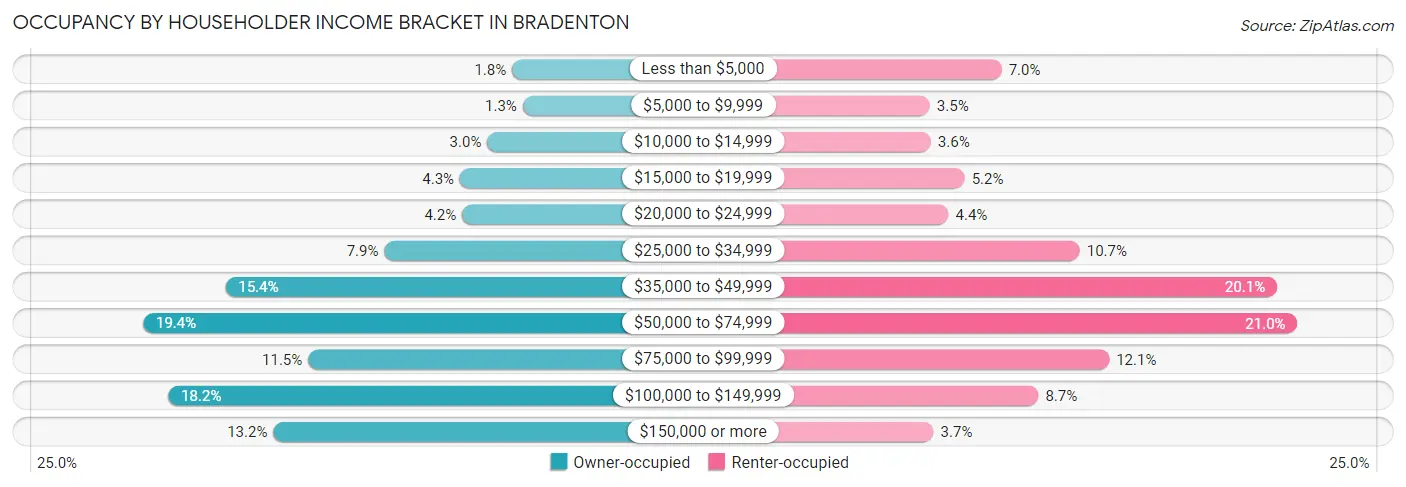
| Income Bracket | Owner-occupied | Renter-occupied |
| Less than $5,000 | 232 (1.8%) | 639 (7.0%) |
| $5,000 to $9,999 | 166 (1.3%) | 325 (3.5%) |
| $10,000 to $14,999 | 386 (3.0%) | 329 (3.6%) |
| $15,000 to $19,999 | 555 (4.3%) | 477 (5.2%) |
| $20,000 to $24,999 | 542 (4.2%) | 406 (4.4%) |
| $25,000 to $34,999 | 1,022 (7.9%) | 980 (10.7%) |
| $35,000 to $49,999 | 2,005 (15.4%) | 1,841 (20.1%) |
| $50,000 to $74,999 | 2,516 (19.4%) | 1,930 (21.0%) |
| $75,000 to $99,999 | 1,494 (11.5%) | 1,108 (12.1%) |
| $100,000 to $149,999 | 2,359 (18.2%) | 799 (8.7%) |
| $150,000 or more | 1,709 (13.2%) | 341 (3.7%) |
| Total | 12,986 (100.0%) | 9,175 (100.0%) |
Monthly Housing Cost Tiers in Bradenton
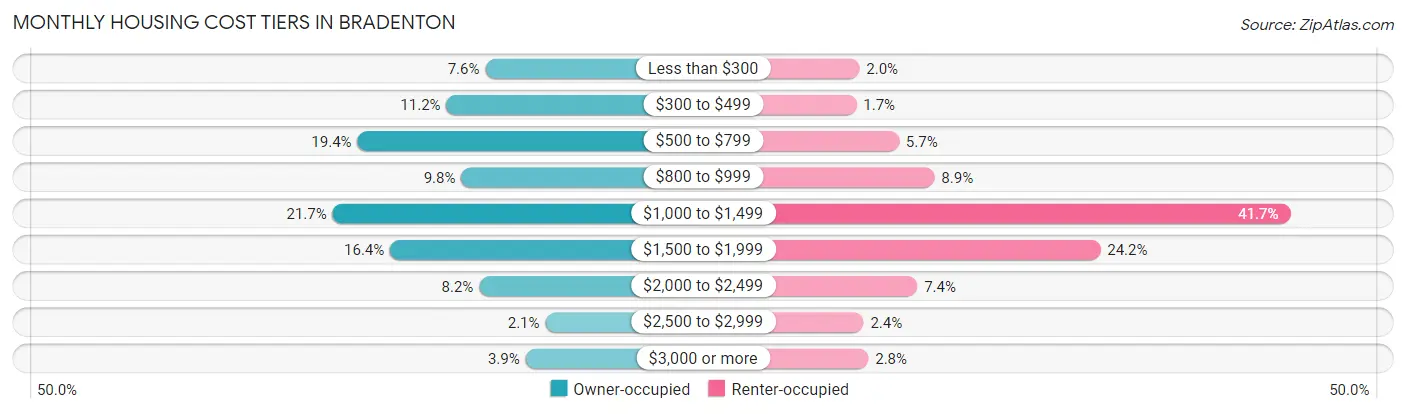
| Monthly Cost | Owner-occupied | Renter-occupied |
| Less than $300 | 985 (7.6%) | 185 (2.0%) |
| $300 to $499 | 1,451 (11.2%) | 160 (1.7%) |
| $500 to $799 | 2,514 (19.4%) | 519 (5.7%) |
| $800 to $999 | 1,272 (9.8%) | 819 (8.9%) |
| $1,000 to $1,499 | 2,812 (21.6%) | 3,825 (41.7%) |
| $1,500 to $1,999 | 2,123 (16.4%) | 2,220 (24.2%) |
| $2,000 to $2,499 | 1,058 (8.2%) | 674 (7.3%) |
| $2,500 to $2,999 | 267 (2.1%) | 220 (2.4%) |
| $3,000 or more | 504 (3.9%) | 261 (2.8%) |
| Total | 12,986 (100.0%) | 9,175 (100.0%) |
Physical Housing Characteristics in Bradenton
Housing Structures in Bradenton
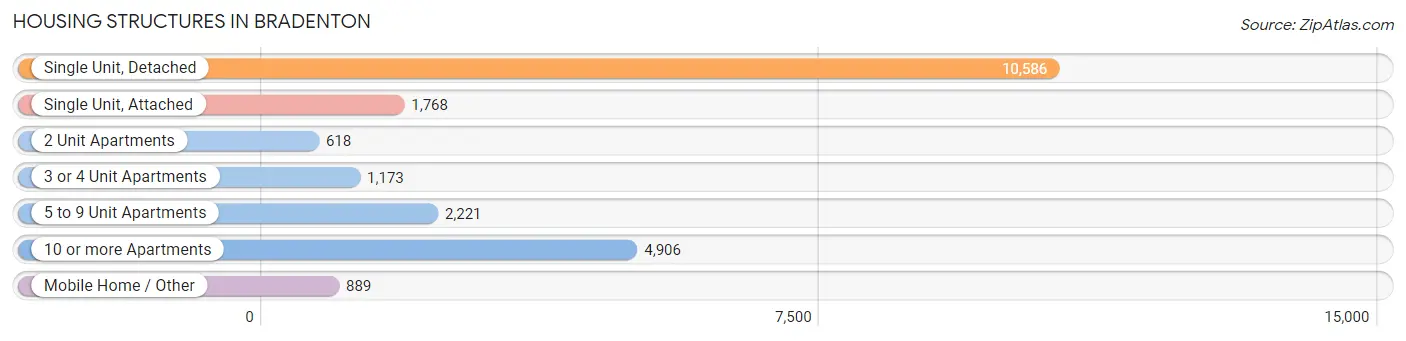
| Structure Type | # Housing Units | % Housing Units |
| Single Unit, Detached | 10,586 | 47.8% |
| Single Unit, Attached | 1,768 | 8.0% |
| 2 Unit Apartments | 618 | 2.8% |
| 3 or 4 Unit Apartments | 1,173 | 5.3% |
| 5 to 9 Unit Apartments | 2,221 | 10.0% |
| 10 or more Apartments | 4,906 | 22.1% |
| Mobile Home / Other | 889 | 4.0% |
| Total | 22,161 | 100.0% |
Housing Structures by Occupancy in Bradenton
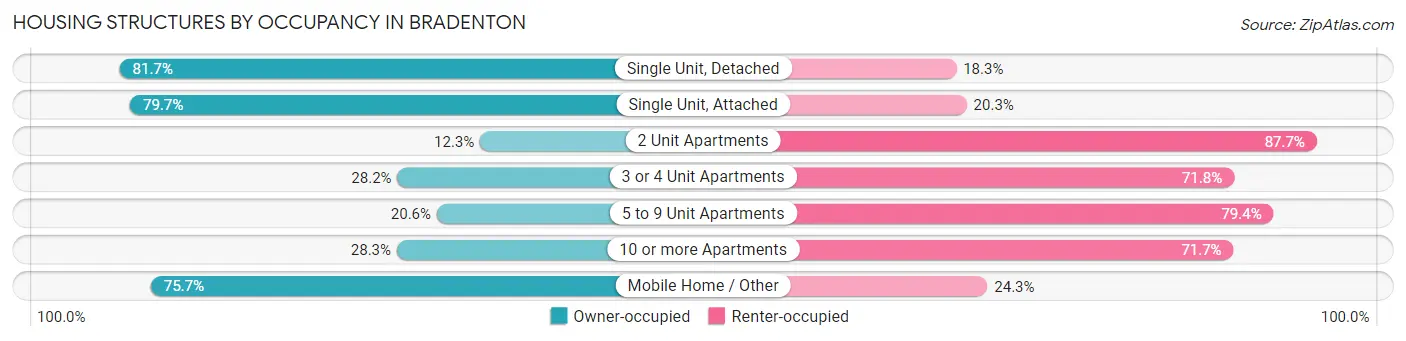
| Structure Type | Owner-occupied | Renter-occupied |
| Single Unit, Detached | 8,649 (81.7%) | 1,937 (18.3%) |
| Single Unit, Attached | 1,409 (79.7%) | 359 (20.3%) |
| 2 Unit Apartments | 76 (12.3%) | 542 (87.7%) |
| 3 or 4 Unit Apartments | 331 (28.2%) | 842 (71.8%) |
| 5 to 9 Unit Apartments | 458 (20.6%) | 1,763 (79.4%) |
| 10 or more Apartments | 1,390 (28.3%) | 3,516 (71.7%) |
| Mobile Home / Other | 673 (75.7%) | 216 (24.3%) |
| Total | 12,986 (58.6%) | 9,175 (41.4%) |
Housing Structures by Number of Rooms in Bradenton
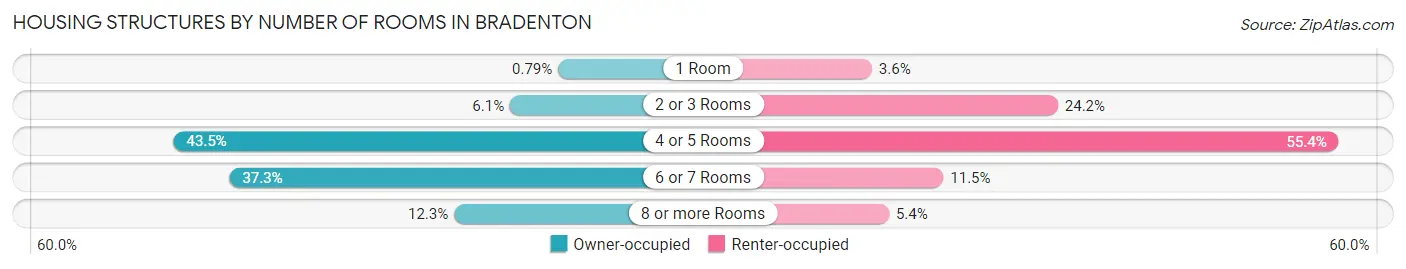
| Number of Rooms | Owner-occupied | Renter-occupied |
| 1 Room | 102 (0.8%) | 326 (3.5%) |
| 2 or 3 Rooms | 796 (6.1%) | 2,219 (24.2%) |
| 4 or 5 Rooms | 5,646 (43.5%) | 5,078 (55.3%) |
| 6 or 7 Rooms | 4,840 (37.3%) | 1,053 (11.5%) |
| 8 or more Rooms | 1,602 (12.3%) | 499 (5.4%) |
| Total | 12,986 (100.0%) | 9,175 (100.0%) |
Housing Structure by Heating Type in Bradenton
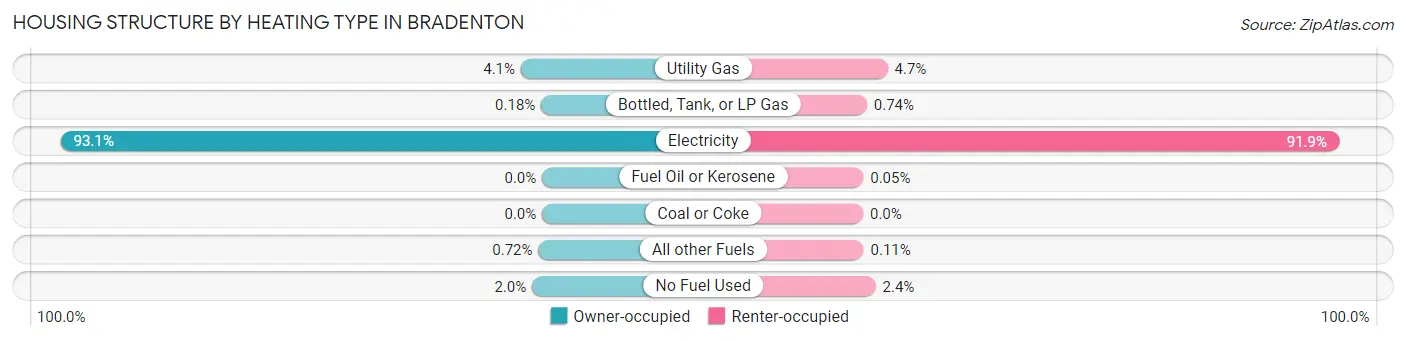
| Heating Type | Owner-occupied | Renter-occupied |
| Utility Gas | 532 (4.1%) | 435 (4.7%) |
| Bottled, Tank, or LP Gas | 23 (0.2%) | 68 (0.7%) |
| Electricity | 12,085 (93.1%) | 8,434 (91.9%) |
| Fuel Oil or Kerosene | 0 (0.0%) | 5 (0.1%) |
| Coal or Coke | 0 (0.0%) | 0 (0.0%) |
| All other Fuels | 93 (0.7%) | 10 (0.1%) |
| No Fuel Used | 253 (1.9%) | 223 (2.4%) |
| Total | 12,986 (100.0%) | 9,175 (100.0%) |
Household Vehicle Usage in Bradenton
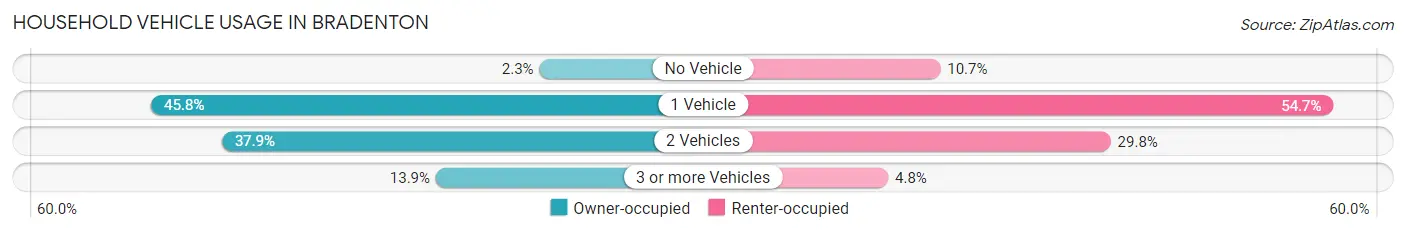
| Vehicles per Household | Owner-occupied | Renter-occupied |
| No Vehicle | 302 (2.3%) | 980 (10.7%) |
| 1 Vehicle | 5,951 (45.8%) | 5,020 (54.7%) |
| 2 Vehicles | 4,924 (37.9%) | 2,731 (29.8%) |
| 3 or more Vehicles | 1,809 (13.9%) | 444 (4.8%) |
| Total | 12,986 (100.0%) | 9,175 (100.0%) |
Real Estate & Mortgages in Bradenton
Real Estate and Mortgage Overview in Bradenton
| Characteristic | Without Mortgage | With Mortgage |
| Housing Units | 6,024 | 6,962 |
| Median Property Value | $222,200 | $266,900 |
| Median Household Income | $54,081 | $1,195 |
| Monthly Housing Costs | $575 | $504 |
| Real Estate Taxes | $1,806 | $116 |
Property Value by Mortgage Status in Bradenton
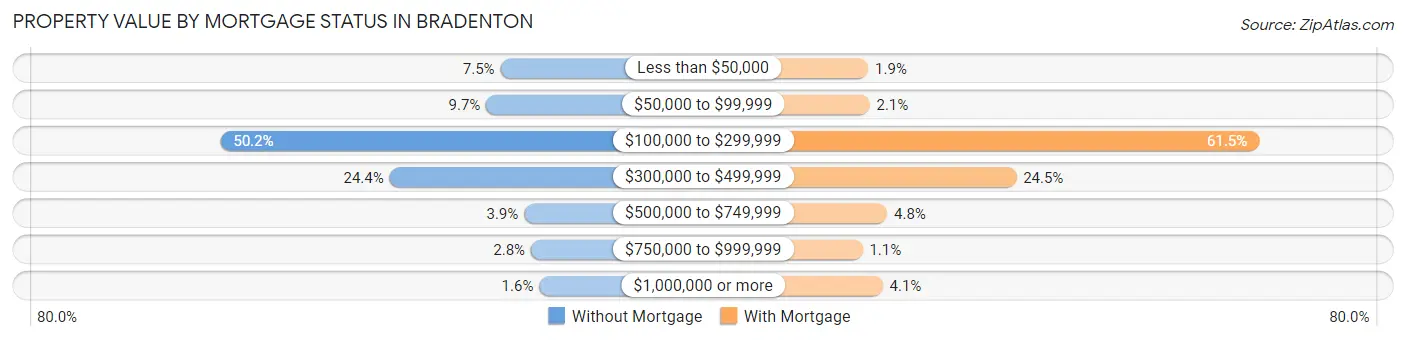
| Property Value | Without Mortgage | With Mortgage |
| Less than $50,000 | 451 (7.5%) | 134 (1.9%) |
| $50,000 to $99,999 | 582 (9.7%) | 148 (2.1%) |
| $100,000 to $299,999 | 3,022 (50.2%) | 4,281 (61.5%) |
| $300,000 to $499,999 | 1,469 (24.4%) | 1,704 (24.5%) |
| $500,000 to $749,999 | 234 (3.9%) | 335 (4.8%) |
| $750,000 to $999,999 | 171 (2.8%) | 73 (1.1%) |
| $1,000,000 or more | 95 (1.6%) | 287 (4.1%) |
| Total | 6,024 (100.0%) | 6,962 (100.0%) |
Household Income by Mortgage Status in Bradenton
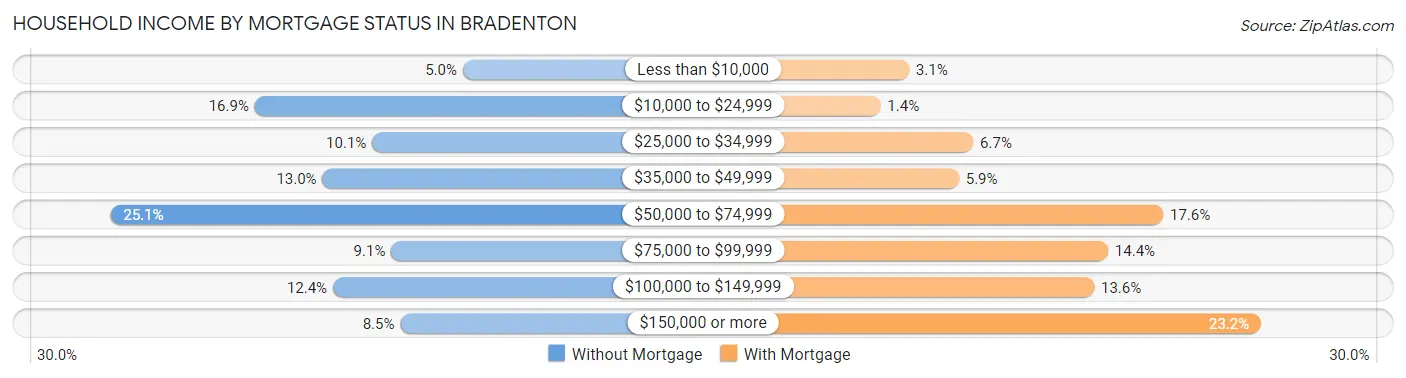
| Household Income | Without Mortgage | With Mortgage |
| Less than $10,000 | 299 (5.0%) | 212 (3.0%) |
| $10,000 to $24,999 | 1,015 (16.9%) | 99 (1.4%) |
| $25,000 to $34,999 | 611 (10.1%) | 468 (6.7%) |
| $35,000 to $49,999 | 782 (13.0%) | 411 (5.9%) |
| $50,000 to $74,999 | 1,512 (25.1%) | 1,223 (17.6%) |
| $75,000 to $99,999 | 545 (9.0%) | 1,004 (14.4%) |
| $100,000 to $149,999 | 746 (12.4%) | 949 (13.6%) |
| $150,000 or more | 514 (8.5%) | 1,613 (23.2%) |
| Total | 6,024 (100.0%) | 6,962 (100.0%) |
Property Value to Household Income Ratio in Bradenton
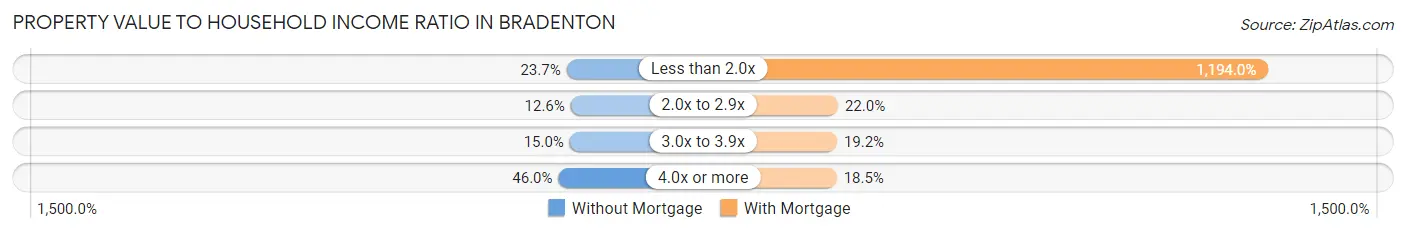
| Value-to-Income Ratio | Without Mortgage | With Mortgage |
| Less than 2.0x | 1,430 (23.7%) | 83,125 (1,194.0%) |
| 2.0x to 2.9x | 756 (12.6%) | 1,533 (22.0%) |
| 3.0x to 3.9x | 904 (15.0%) | 1,334 (19.2%) |
| 4.0x or more | 2,769 (46.0%) | 1,289 (18.5%) |
| Total | 6,024 (100.0%) | 6,962 (100.0%) |
Real Estate Taxes by Mortgage Status in Bradenton
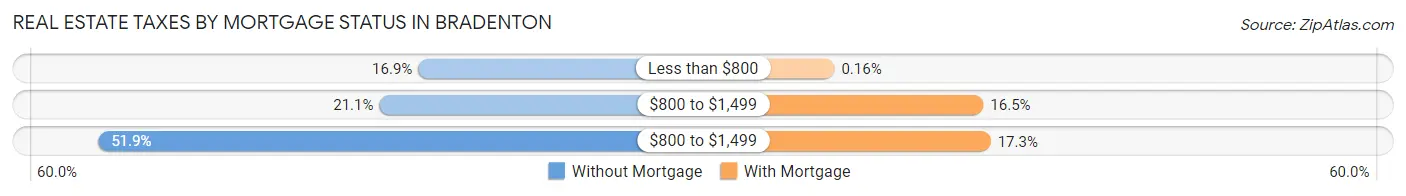
| Property Taxes | Without Mortgage | With Mortgage |
| Less than $800 | 1,016 (16.9%) | 11 (0.2%) |
| $800 to $1,499 | 1,273 (21.1%) | 1,147 (16.5%) |
| $800 to $1,499 | 3,128 (51.9%) | 1,203 (17.3%) |
| Total | 6,024 (100.0%) | 6,962 (100.0%) |
Health & Disability in Bradenton
Health Insurance Coverage by Age in Bradenton
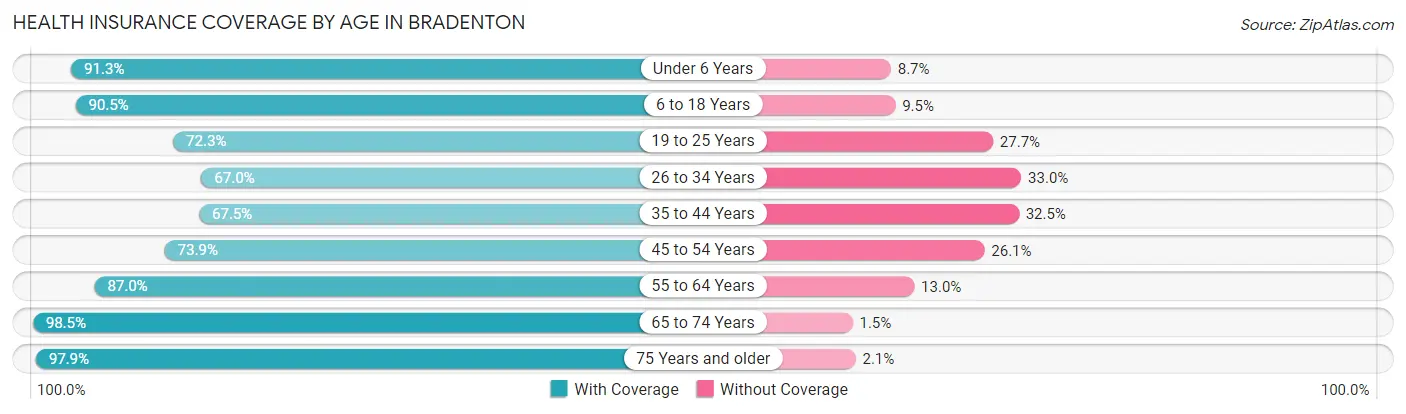
| Age Bracket | With Coverage | Without Coverage |
| Under 6 Years | 4,023 (91.3%) | 382 (8.7%) |
| 6 to 18 Years | 6,880 (90.5%) | 721 (9.5%) |
| 19 to 25 Years | 2,731 (72.3%) | 1,047 (27.7%) |
| 26 to 34 Years | 4,476 (67.0%) | 2,203 (33.0%) |
| 35 to 44 Years | 3,457 (67.5%) | 1,666 (32.5%) |
| 45 to 54 Years | 4,440 (73.9%) | 1,570 (26.1%) |
| 55 to 64 Years | 6,107 (87.0%) | 915 (13.0%) |
| 65 to 74 Years | 7,096 (98.5%) | 111 (1.5%) |
| 75 Years and older | 6,306 (97.9%) | 135 (2.1%) |
| Total | 45,516 (83.9%) | 8,750 (16.1%) |
Health Insurance Coverage by Citizenship Status in Bradenton
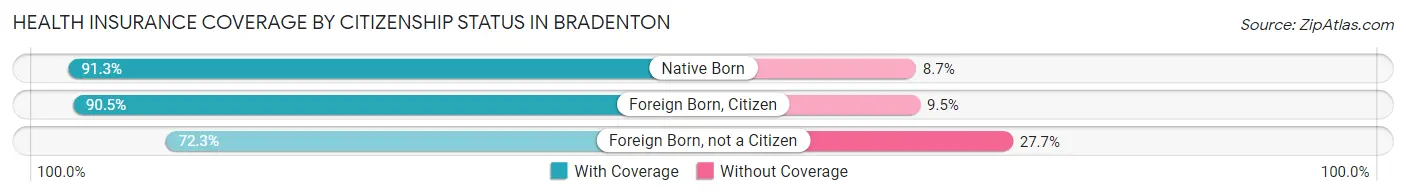
| Citizenship Status | With Coverage | Without Coverage |
| Native Born | 4,023 (91.3%) | 382 (8.7%) |
| Foreign Born, Citizen | 6,880 (90.5%) | 721 (9.5%) |
| Foreign Born, not a Citizen | 2,731 (72.3%) | 1,047 (27.7%) |
Health Insurance Coverage by Household Income in Bradenton
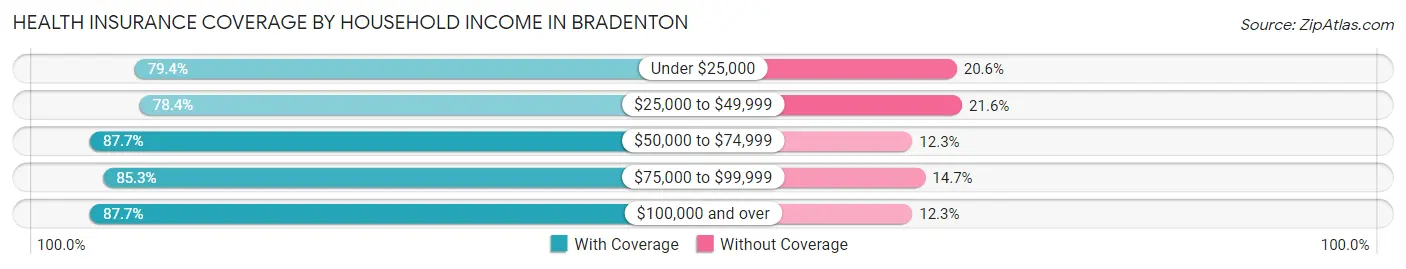
| Household Income | With Coverage | Without Coverage |
| Under $25,000 | 5,843 (79.4%) | 1,517 (20.6%) |
| $25,000 to $49,999 | 10,202 (78.4%) | 2,812 (21.6%) |
| $50,000 to $74,999 | 9,203 (87.7%) | 1,289 (12.3%) |
| $75,000 to $99,999 | 6,021 (85.3%) | 1,040 (14.7%) |
| $100,000 and over | 14,046 (87.7%) | 1,967 (12.3%) |
Public vs Private Health Insurance Coverage by Age in Bradenton
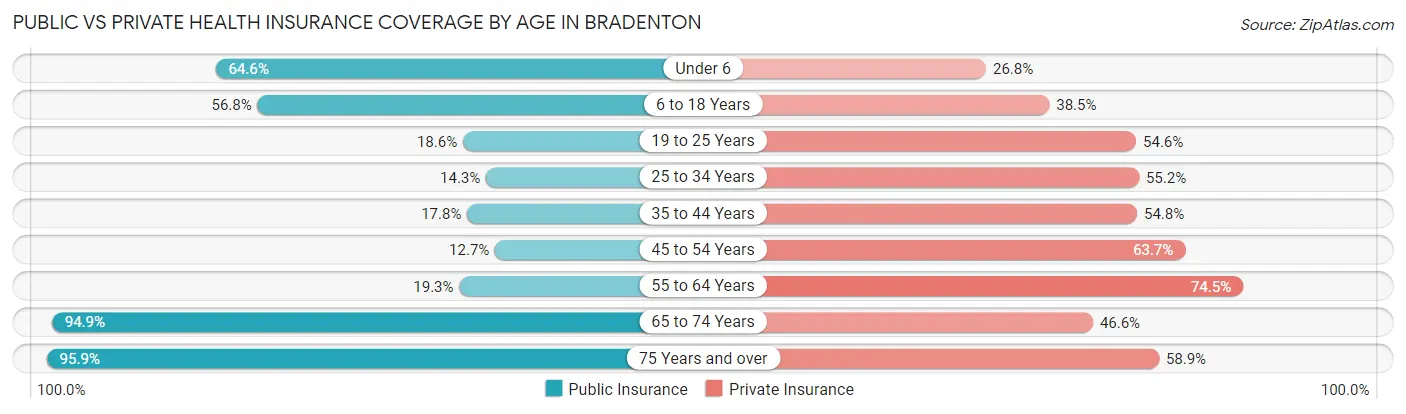
| Age Bracket | Public Insurance | Private Insurance |
| Under 6 | 2,844 (64.6%) | 1,179 (26.8%) |
| 6 to 18 Years | 4,314 (56.8%) | 2,927 (38.5%) |
| 19 to 25 Years | 704 (18.6%) | 2,064 (54.6%) |
| 25 to 34 Years | 958 (14.3%) | 3,684 (55.2%) |
| 35 to 44 Years | 914 (17.8%) | 2,808 (54.8%) |
| 45 to 54 Years | 761 (12.7%) | 3,830 (63.7%) |
| 55 to 64 Years | 1,355 (19.3%) | 5,229 (74.5%) |
| 65 to 74 Years | 6,842 (94.9%) | 3,360 (46.6%) |
| 75 Years and over | 6,177 (95.9%) | 3,792 (58.9%) |
| Total | 24,869 (45.8%) | 28,873 (53.2%) |
Disability Status by Sex by Age in Bradenton
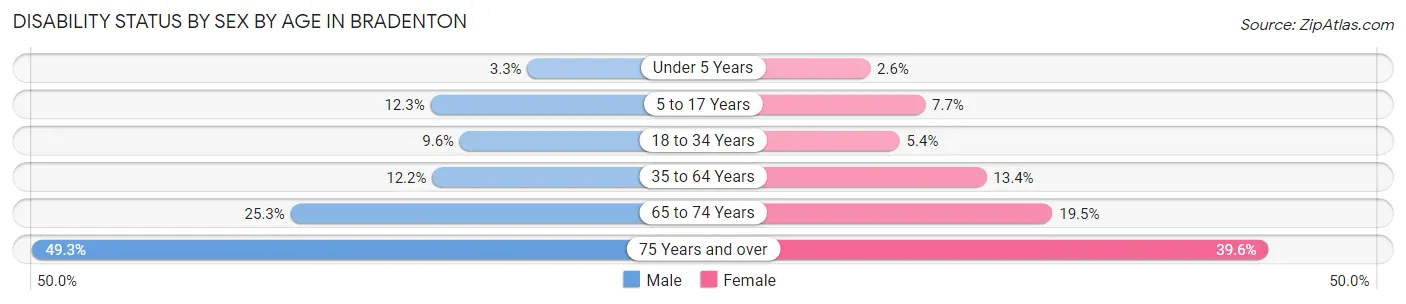
| Age Bracket | Male | Female |
| Under 5 Years | 54 (3.3%) | 47 (2.6%) |
| 5 to 17 Years | 548 (12.3%) | 293 (7.7%) |
| 18 to 34 Years | 504 (9.6%) | 299 (5.4%) |
| 35 to 64 Years | 1,063 (12.2%) | 1,263 (13.4%) |
| 65 to 74 Years | 828 (25.3%) | 769 (19.5%) |
| 75 Years and over | 1,244 (49.2%) | 1,550 (39.6%) |
Disability Class by Sex by Age in Bradenton
Disability Class: Hearing Difficulty
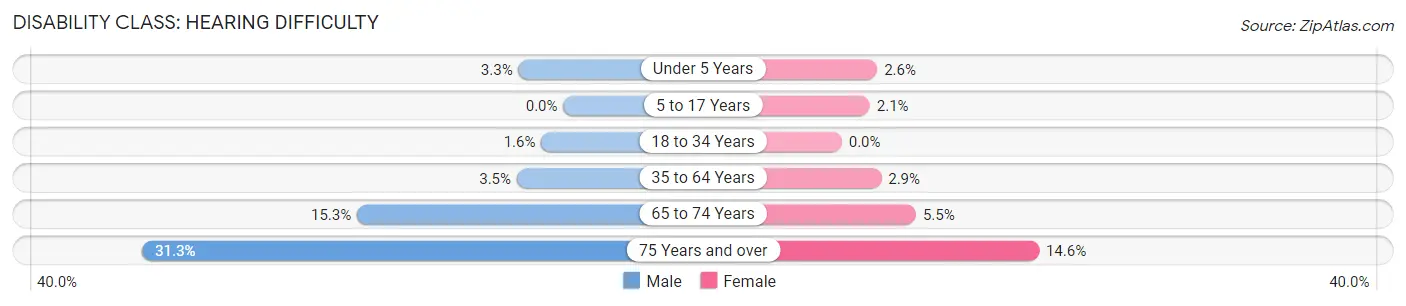
| Age Bracket | Male | Female |
| Under 5 Years | 54 (3.3%) | 47 (2.6%) |
| 5 to 17 Years | 0 (0.0%) | 79 (2.1%) |
| 18 to 34 Years | 86 (1.6%) | 0 (0.0%) |
| 35 to 64 Years | 302 (3.5%) | 276 (2.9%) |
| 65 to 74 Years | 501 (15.3%) | 217 (5.5%) |
| 75 Years and over | 790 (31.3%) | 573 (14.6%) |
Disability Class: Vision Difficulty
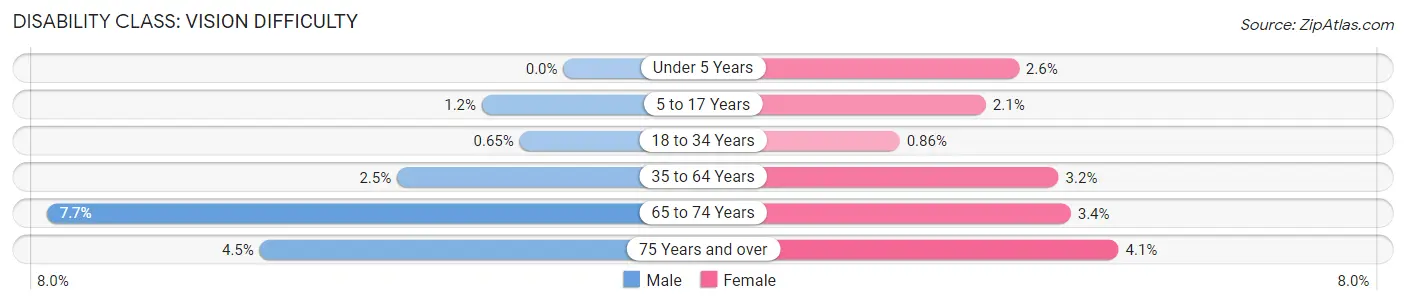
| Age Bracket | Male | Female |
| Under 5 Years | 0 (0.0%) | 47 (2.6%) |
| 5 to 17 Years | 54 (1.2%) | 81 (2.1%) |
| 18 to 34 Years | 34 (0.6%) | 48 (0.9%) |
| 35 to 64 Years | 216 (2.5%) | 303 (3.2%) |
| 65 to 74 Years | 251 (7.7%) | 134 (3.4%) |
| 75 Years and over | 114 (4.5%) | 161 (4.1%) |
Disability Class: Cognitive Difficulty
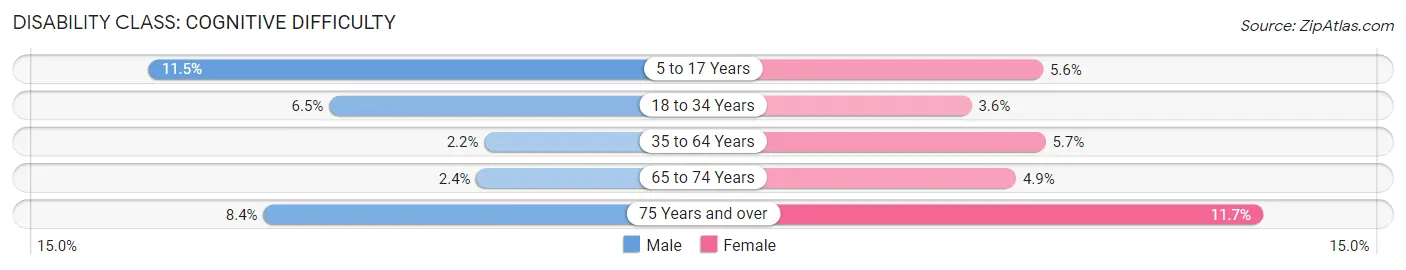
| Age Bracket | Male | Female |
| 5 to 17 Years | 513 (11.5%) | 212 (5.6%) |
| 18 to 34 Years | 342 (6.5%) | 201 (3.6%) |
| 35 to 64 Years | 192 (2.2%) | 534 (5.7%) |
| 65 to 74 Years | 79 (2.4%) | 191 (4.9%) |
| 75 Years and over | 211 (8.4%) | 459 (11.7%) |
Disability Class: Ambulatory Difficulty
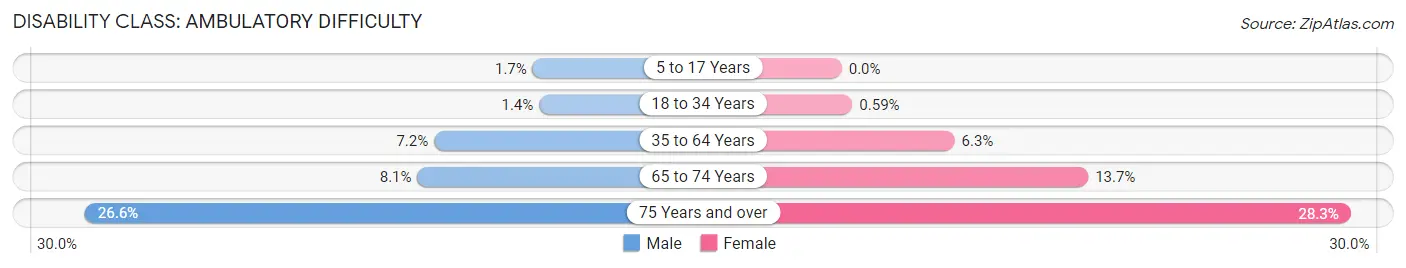
| Age Bracket | Male | Female |
| 5 to 17 Years | 76 (1.7%) | 0 (0.0%) |
| 18 to 34 Years | 71 (1.3%) | 33 (0.6%) |
| 35 to 64 Years | 630 (7.2%) | 591 (6.3%) |
| 65 to 74 Years | 266 (8.1%) | 540 (13.7%) |
| 75 Years and over | 673 (26.6%) | 1,109 (28.3%) |
Disability Class: Self-Care Difficulty
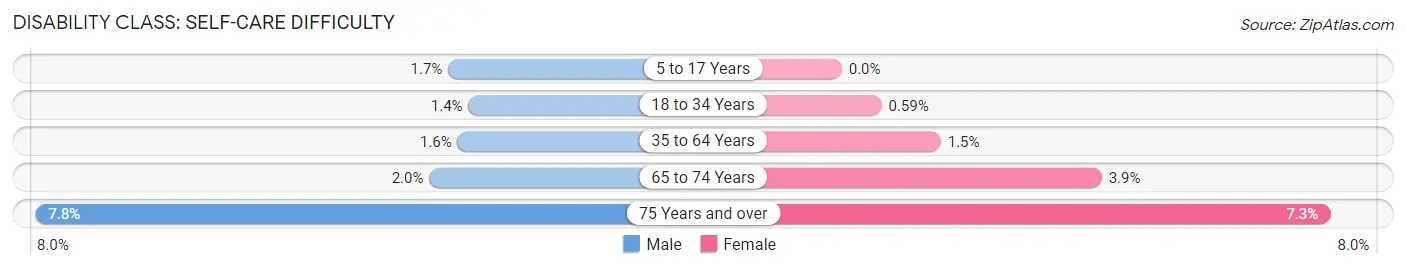
| Age Bracket | Male | Female |
| 5 to 17 Years | 76 (1.7%) | 0 (0.0%) |
| 18 to 34 Years | 74 (1.4%) | 33 (0.6%) |
| 35 to 64 Years | 137 (1.6%) | 138 (1.5%) |
| 65 to 74 Years | 65 (2.0%) | 152 (3.9%) |
| 75 Years and over | 198 (7.8%) | 284 (7.2%) |
Technology Access in Bradenton
Computing Device Access in Bradenton
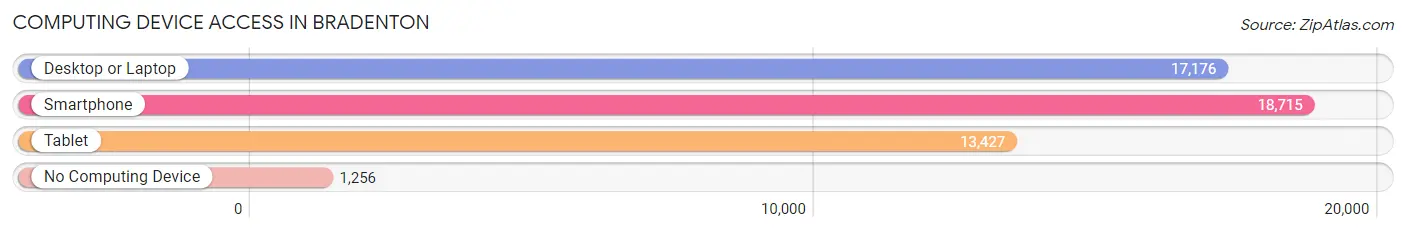
| Device Type | # Households | % Households |
| Desktop or Laptop | 17,176 | 77.5% |
| Smartphone | 18,715 | 84.5% |
| Tablet | 13,427 | 60.6% |
| No Computing Device | 1,256 | 5.7% |
| Total | 22,161 | 100.0% |
Internet Access in Bradenton
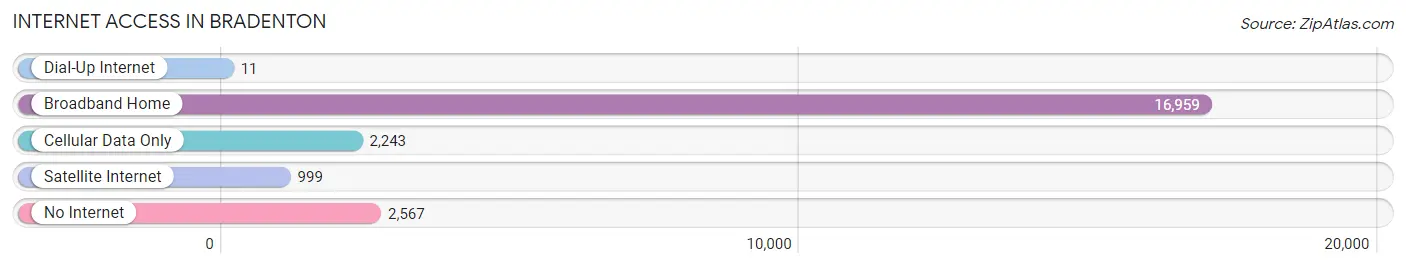
| Internet Type | # Households | % Households |
| Dial-Up Internet | 11 | 0.1% |
| Broadband Home | 16,959 | 76.5% |
| Cellular Data Only | 2,243 | 10.1% |
| Satellite Internet | 999 | 4.5% |
| No Internet | 2,567 | 11.6% |
| Total | 22,161 | 100.0% |
Bradenton Summary
Bradenton, Florida is a city located in Manatee County, Florida, United States. It is the county seat of Manatee County and is located along the Manatee River, which flows into the Gulf of Mexico. The city is part of the Tampa-St. Petersburg-Clearwater metropolitan area. As of the 2010 census, the city had a population of 49,546.
Geography
Bradenton is located in the central part of Manatee County, on the Manatee River, which flows into the Gulf of Mexico. The city is located about 30 miles south of Tampa and about 50 miles north of Sarasota. The city is bordered by Palmetto to the north, Ellenton to the east, and the Manatee River to the south. The city is located on the Gulf Coast of Florida, and is part of the Tampa-St. Petersburg-Clearwater metropolitan area.
Climate
Bradenton has a humid subtropical climate, with hot, humid summers and mild, wet winters. The average high temperature in the summer is around 90°F, and the average low temperature in the winter is around 60°F. The average annual precipitation is around 50 inches.
Demographics
As of the 2010 census, there were 49,546 people, 20,845 households, and 12,845 families residing in the city. The population density was 1,845.3 people per square mile. The racial makeup of the city was 75.2% White, 15.3% African American, 0.5% Native American, 2.2% Asian, 0.1% Pacific Islander, 4.7% from other races, and 2.1% from two or more races. Hispanic or Latino of any race were 16.2% of the population.
Economy
Bradenton is home to a variety of businesses and industries. The city is home to several large employers, including Tropicana Products, Champs Sports, and Bealls Department Stores. The city is also home to several smaller businesses, including restaurants, retail stores, and service providers. The city is also home to several medical facilities, including Manatee Memorial Hospital and Blake Medical Center.
The city is also home to several educational institutions, including Manatee Technical College, State College of Florida, and the University of South Florida. The city is also home to several cultural attractions, including the South Florida Museum, the Manatee Players Theater, and the Manatee County Historical Society.
Conclusion
Bradenton, Florida is a city located in Manatee County, Florida, United States. It is the county seat of Manatee County and is located along the Manatee River, which flows into the Gulf of Mexico. The city is part of the Tampa-St. Petersburg-Clearwater metropolitan area. As of the 2010 census, the city had a population of 49,546. The city has a humid subtropical climate, with hot, humid summers and mild, wet winters. The racial makeup of the city was 75.2% White, 15.3% African American, 0.5% Native American, 2.2% Asian, 0.1% Pacific Islander, 4.7% from other races, and 2.1% from two or more races. Hispanic or Latino of any race were 16.2% of the population. The city is home to several large employers, including Tropicana Products, Champs Sports, and Bealls Department Stores. The city is also home to several educational institutions, including Manatee Technical College, State College of Florida, and the University of South Florida. The city is also home to several cultural attractions, including the South Florida Museum, the Manatee Players Theater, and the Manatee County Historical Society.
Common Questions
What is Per Capita Income in Bradenton?
Per Capita income in Bradenton is $32,378.
What is the Median Family Income in Bradenton?
Median Family Income in Bradenton is $68,078.
What is the Median Household income in Bradenton?
Median Household Income in Bradenton is $55,795.
What is Income or Wage Gap in Bradenton?
Income or Wage Gap in Bradenton is 21.5%.
Women in Bradenton earn 78.5 cents for every dollar earned by a man.
What is Family Income Deficit in Bradenton?
Family Income Deficit in Bradenton is $12,256.
Families that are below poverty line in Bradenton earn $12,256 less on average than the poverty threshold level.
What is Inequality or Gini Index in Bradenton?
Inequality or Gini Index in Bradenton is 0.45.
What is the Total Population of Bradenton?
Total Population of Bradenton is 55,795.
What is the Total Male Population of Bradenton?
Total Male Population of Bradenton is 26,537.
What is the Total Female Population of Bradenton?
Total Female Population of Bradenton is 29,258.
What is the Ratio of Males per 100 Females in Bradenton?
There are 90.70 Males per 100 Females in Bradenton.
What is the Ratio of Females per 100 Males in Bradenton?
There are 110.25 Females per 100 Males in Bradenton.
What is the Median Population Age in Bradenton?
Median Population Age in Bradenton is 45.4 Years.
What is the Average Family Size in Bradenton
Average Family Size in Bradenton is 3.1 People.
What is the Average Household Size in Bradenton
Average Household Size in Bradenton is 2.4 People.
How Large is the Labor Force in Bradenton?
There are 24,733 People in the Labor Forcein in Bradenton.
What is the Percentage of People in the Labor Force in Bradenton?
54.5% of People are in the Labor Force in Bradenton.
What is the Unemployment Rate in Bradenton?
Unemployment Rate in Bradenton is 6.7%.