Springfield, MA Map & Demographics
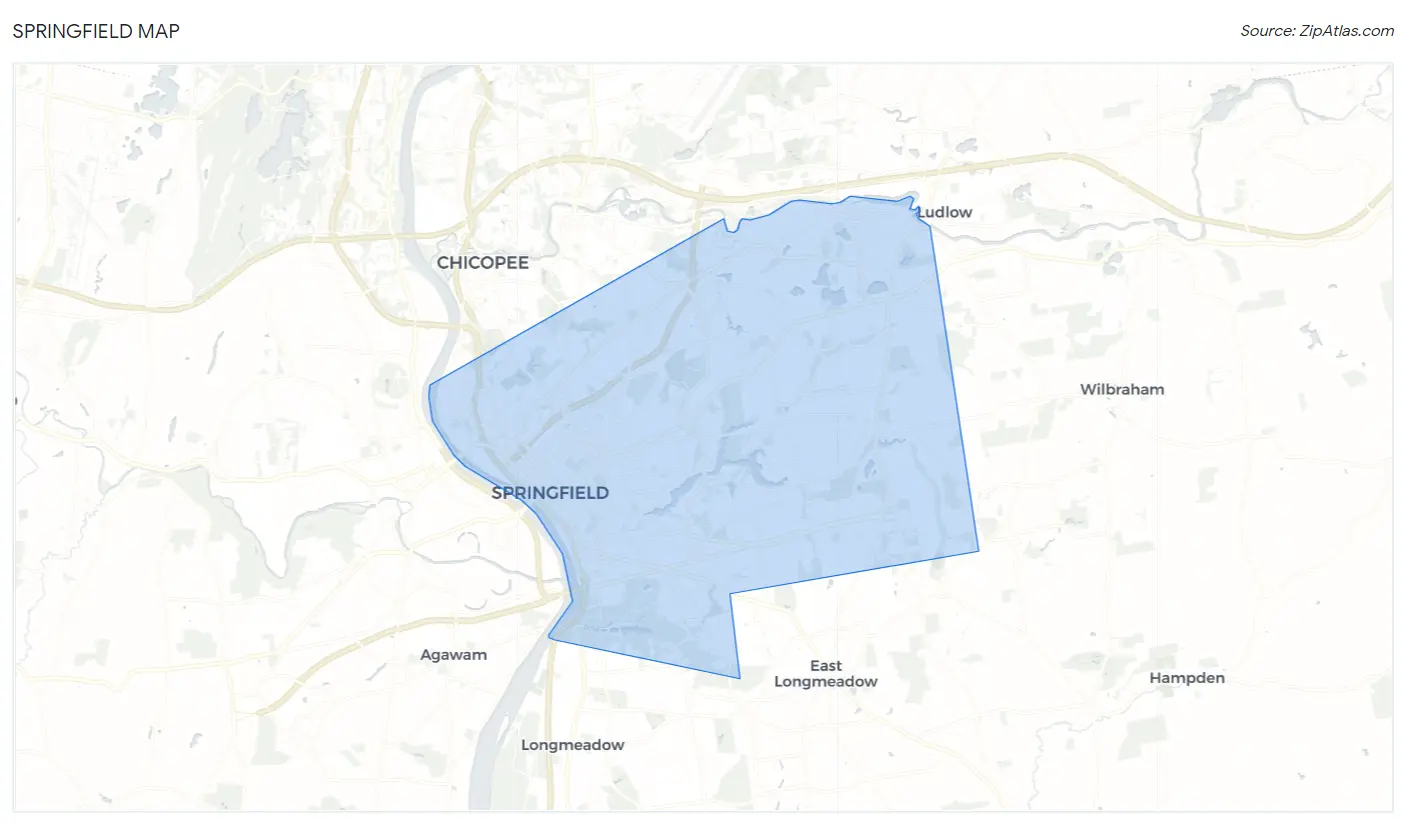
Springfield Map
Springfield Overview
$25,669
PER CAPITA INCOME
$61,936
AVG FAMILY INCOME
$47,677
AVG HOUSEHOLD INCOME
20.7%
WAGE / INCOME GAP [ % ]
79.3¢/ $1
WAGE / INCOME GAP [ $ ]
$10,313
FAMILY INCOME DEFICIT
0.48
INEQUALITY / GINI INDEX
155,305
TOTAL POPULATION
74,785
MALE POPULATION
80,520
FEMALE POPULATION
92.88
MALES / 100 FEMALES
107.67
FEMALES / 100 MALES
33.4
MEDIAN AGE
3.3
AVG FAMILY SIZE
2.6
AVG HOUSEHOLD SIZE
69,535
LABOR FORCE [ PEOPLE ]
57.3%
PERCENT IN LABOR FORCE
8.7%
UNEMPLOYMENT RATE
Springfield Area Codes
Income in Springfield
Income Overview in Springfield
Per Capita Income in Springfield is $25,669, while median incomes of families and households are $61,936 and $47,677 respectively.
| Characteristic | Number | Measure |
| Per Capita Income | 155,305 | $25,669 |
| Median Family Income | 35,266 | $61,936 |
| Mean Family Income | 35,266 | $78,961 |
| Median Household Income | 58,448 | $47,677 |
| Mean Household Income | 58,448 | $66,206 |
| Income Deficit | 35,266 | $10,313 |
| Wage / Income Gap (%) | 155,305 | 20.72% |
| Wage / Income Gap ($) | 155,305 | 79.28¢ per $1 |
| Gini / Inequality Index | 155,305 | 0.48 |
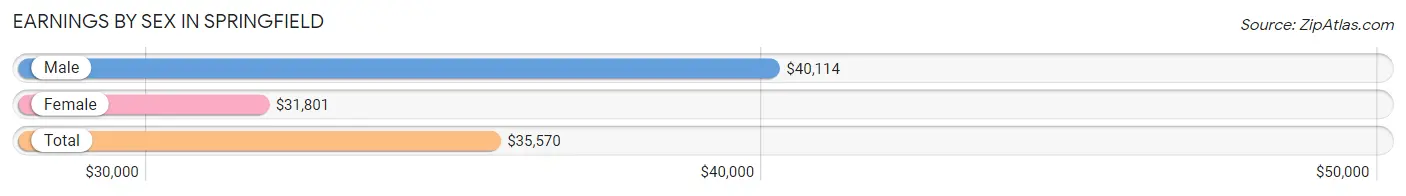
Earnings by Sex in Springfield
Average Earnings in Springfield are $35,570, $40,114 for men and $31,801 for women, a difference of 20.7%.
| Sex | Number | Average Earnings |
| Male | 35,046 (49.3%) | $40,114 |
| Female | 36,086 (50.7%) | $31,801 |
| Total | 71,132 (100.0%) | $35,570 |
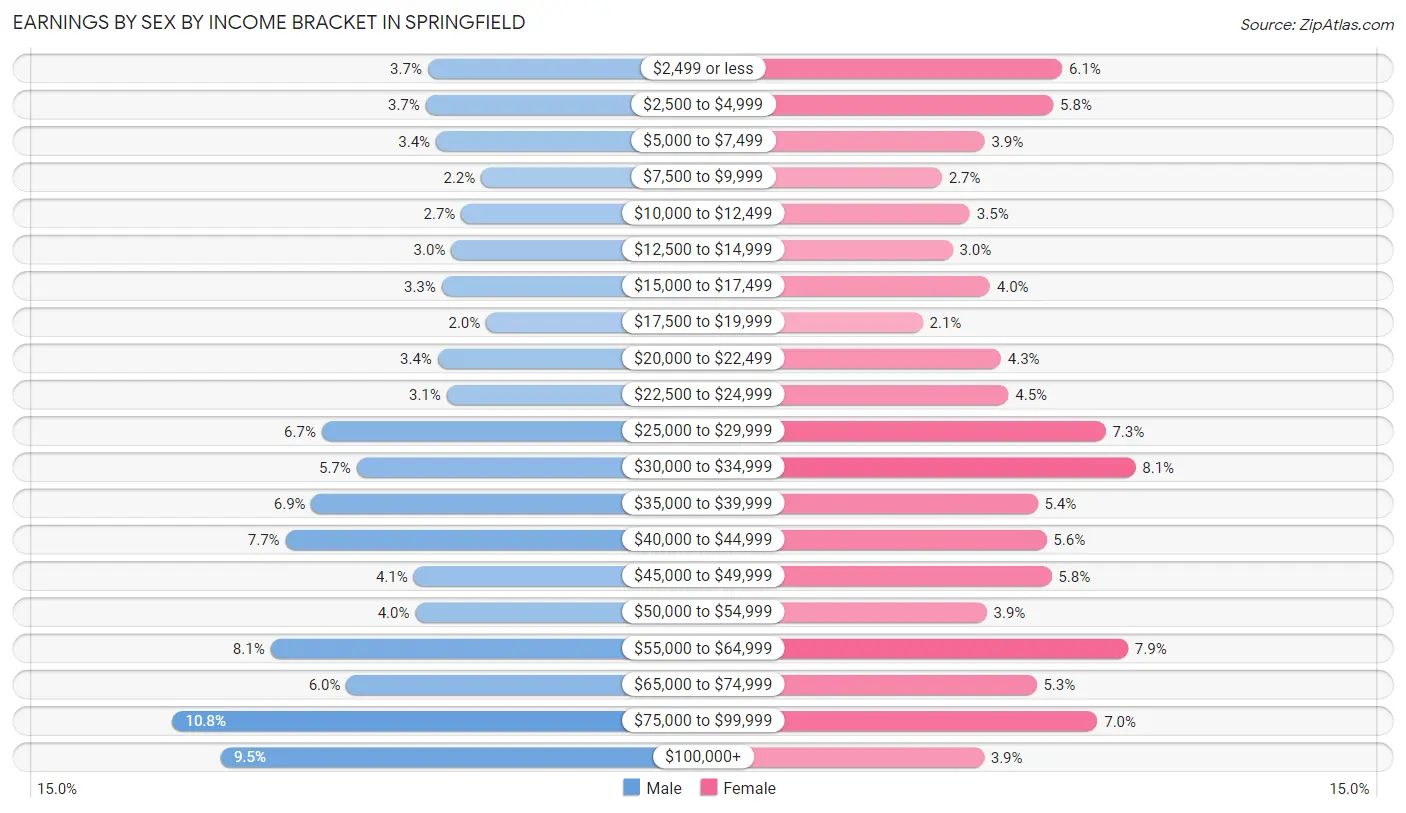
Earnings by Sex by Income Bracket in Springfield
The most common earnings brackets in Springfield are $75,000 to $99,999 for men (3,799 | 10.8%) and $30,000 to $34,999 for women (2,928 | 8.1%).
| Income | Male | Female |
| $2,499 or less | 1,286 (3.7%) | 2,185 (6.0%) |
| $2,500 to $4,999 | 1,308 (3.7%) | 2,094 (5.8%) |
| $5,000 to $7,499 | 1,206 (3.4%) | 1,396 (3.9%) |
| $7,500 to $9,999 | 762 (2.2%) | 963 (2.7%) |
| $10,000 to $12,499 | 957 (2.7%) | 1,248 (3.5%) |
| $12,500 to $14,999 | 1,055 (3.0%) | 1,070 (3.0%) |
| $15,000 to $17,499 | 1,151 (3.3%) | 1,452 (4.0%) |
| $17,500 to $19,999 | 710 (2.0%) | 767 (2.1%) |
| $20,000 to $22,499 | 1,187 (3.4%) | 1,564 (4.3%) |
| $22,500 to $24,999 | 1,102 (3.1%) | 1,640 (4.5%) |
| $25,000 to $29,999 | 2,330 (6.7%) | 2,624 (7.3%) |
| $30,000 to $34,999 | 1,987 (5.7%) | 2,928 (8.1%) |
| $35,000 to $39,999 | 2,432 (6.9%) | 1,933 (5.4%) |
| $40,000 to $44,999 | 2,688 (7.7%) | 2,024 (5.6%) |
| $45,000 to $49,999 | 1,427 (4.1%) | 2,075 (5.8%) |
| $50,000 to $54,999 | 1,410 (4.0%) | 1,419 (3.9%) |
| $55,000 to $64,999 | 2,836 (8.1%) | 2,851 (7.9%) |
| $65,000 to $74,999 | 2,090 (6.0%) | 1,924 (5.3%) |
| $75,000 to $99,999 | 3,799 (10.8%) | 2,541 (7.0%) |
| $100,000+ | 3,323 (9.5%) | 1,388 (3.8%) |
| Total | 35,046 (100.0%) | 36,086 (100.0%) |
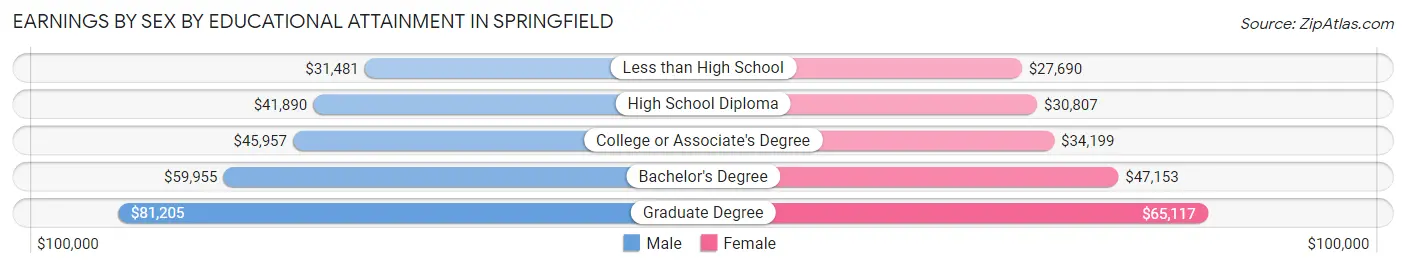
Earnings by Sex by Educational Attainment in Springfield
Average earnings in Springfield are $44,793 for men and $35,819 for women, a difference of 20.0%. Men with an educational attainment of graduate degree enjoy the highest average annual earnings of $81,205, while those with less than high school education earn the least with $31,481. Women with an educational attainment of graduate degree earn the most with the average annual earnings of $65,117, while those with less than high school education have the smallest earnings of $27,690.
| Educational Attainment | Male Income | Female Income |
| Less than High School | $31,481 | $27,690 |
| High School Diploma | $41,890 | $30,807 |
| College or Associate's Degree | $45,957 | $34,199 |
| Bachelor's Degree | $59,955 | $47,153 |
| Graduate Degree | $81,205 | $65,117 |
| Total | $44,793 | $35,819 |
Family Income in Springfield
Family Income Brackets in Springfield
According to the Springfield family income data, there are 6,630 families falling into the $50,000 to $74,999 income range, which is the most common income bracket and makes up 18.8% of all families. Conversely, the $10,000 to $14,999 income bracket is the least frequent group with only 1,834 families (5.2%) belonging to this category.
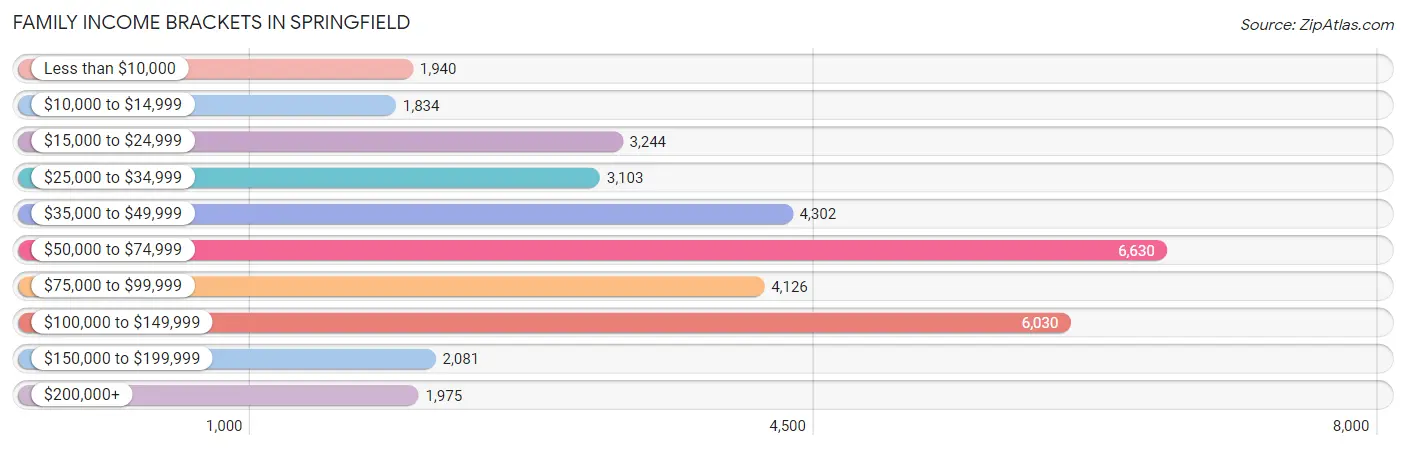
| Income Bracket | # Families | % Families |
| Less than $10,000 | 1,940 | 5.5% |
| $10,000 to $14,999 | 1,834 | 5.2% |
| $15,000 to $24,999 | 3,244 | 9.2% |
| $25,000 to $34,999 | 3,103 | 8.8% |
| $35,000 to $49,999 | 4,302 | 12.2% |
| $50,000 to $74,999 | 6,630 | 18.8% |
| $75,000 to $99,999 | 4,126 | 11.7% |
| $100,000 to $149,999 | 6,030 | 17.1% |
| $150,000 to $199,999 | 2,081 | 5.9% |
| $200,000+ | 1,975 | 5.6% |
Family Income by Famaliy Size in Springfield
6-person families (1,167 | 3.3%) account for the highest median family income in Springfield with $91,984 per family, while 2-person families (14,237 | 40.4%) have the highest median income of $26,271 per family member.
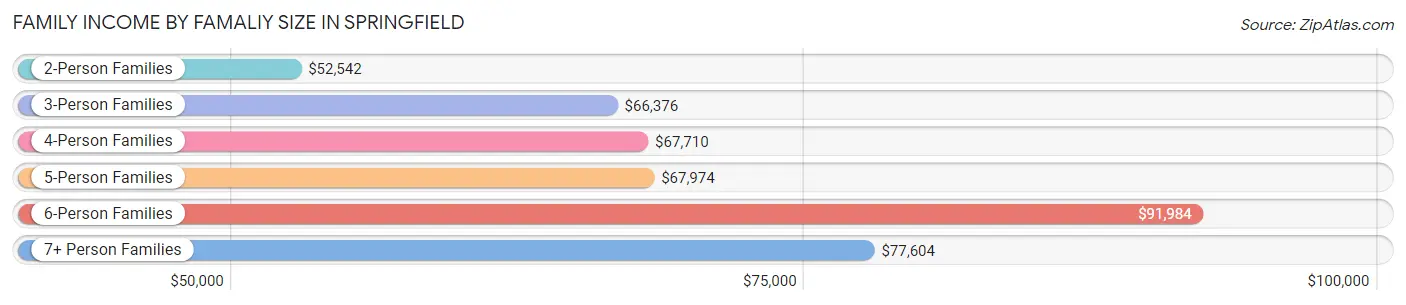
| Income Bracket | # Families | Median Income |
| 2-Person Families | 14,237 (40.4%) | $52,542 |
| 3-Person Families | 10,080 (28.6%) | $66,376 |
| 4-Person Families | 6,382 (18.1%) | $67,710 |
| 5-Person Families | 2,755 (7.8%) | $67,974 |
| 6-Person Families | 1,167 (3.3%) | $91,984 |
| 7+ Person Families | 645 (1.8%) | $77,604 |
| Total | 35,266 (100.0%) | $61,936 |
Family Income by Number of Earners in Springfield
The median family income in Springfield is $61,936, with families comprising 3+ earners (3,782) having the highest median family income of $128,189, while families with no earners (6,145) have the lowest median family income of $19,004, accounting for 10.7% and 17.4% of families, respectively.
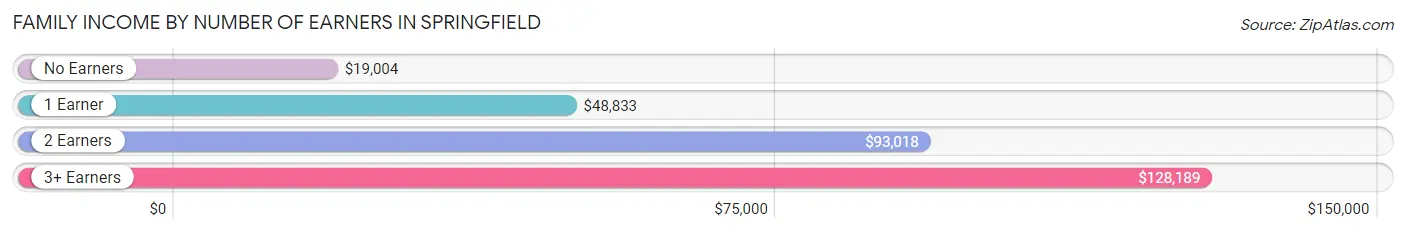
| Number of Earners | # Families | Median Income |
| No Earners | 6,145 (17.4%) | $19,004 |
| 1 Earner | 13,910 (39.4%) | $48,833 |
| 2 Earners | 11,429 (32.4%) | $93,018 |
| 3+ Earners | 3,782 (10.7%) | $128,189 |
| Total | 35,266 (100.0%) | $61,936 |
Household Income in Springfield
Household Income Brackets in Springfield
With 9,410 households falling in the category, the $50,000 to $74,999 income range is the most frequent in Springfield, accounting for 16.1% of all households. In contrast, only 2,396 households (4.1%) fall into the $200,000+ income bracket, making it the least populous group.
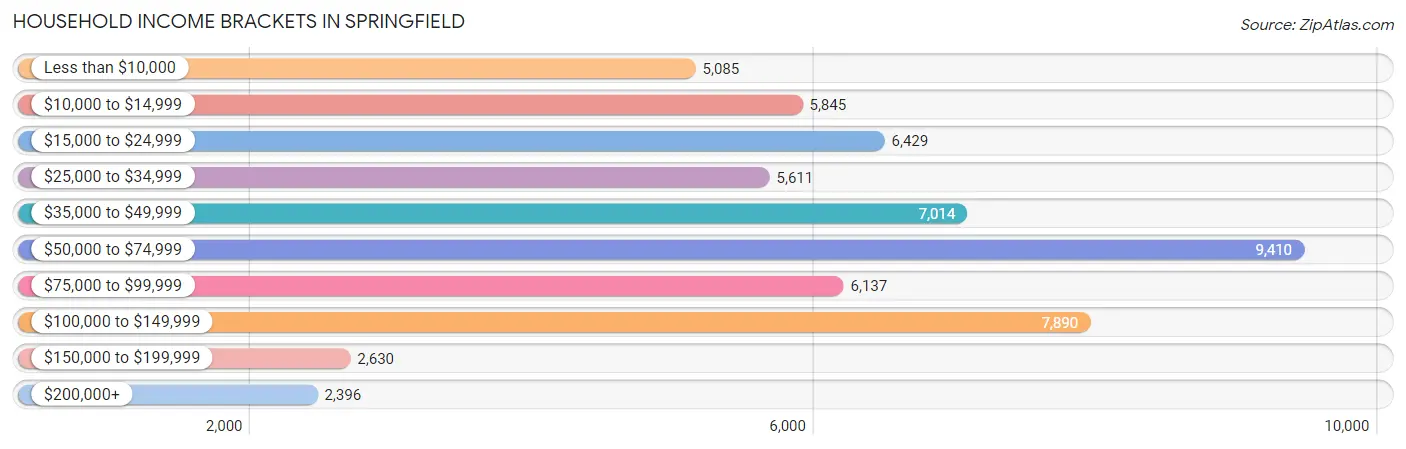
| Income Bracket | # Households | % Households |
| Less than $10,000 | 5,085 | 8.7% |
| $10,000 to $14,999 | 5,845 | 10.0% |
| $15,000 to $24,999 | 6,429 | 11.0% |
| $25,000 to $34,999 | 5,611 | 9.6% |
| $35,000 to $49,999 | 7,014 | 12.0% |
| $50,000 to $74,999 | 9,410 | 16.1% |
| $75,000 to $99,999 | 6,137 | 10.5% |
| $100,000 to $149,999 | 7,890 | 13.5% |
| $150,000 to $199,999 | 2,630 | 4.5% |
| $200,000+ | 2,396 | 4.1% |
Household Income by Householder Age in Springfield
The median household income in Springfield is $47,677, with the highest median household income of $56,842 found in the 45 to 64 years age bracket for the primary householder. A total of 22,171 households (37.9%) fall into this category. Meanwhile, the 65+ years age bracket for the primary householder has the lowest median household income of $32,397, with 13,185 households (22.6%) in this group.
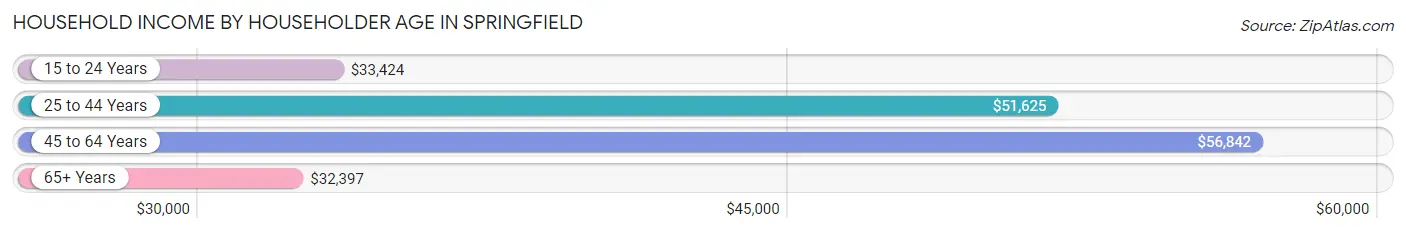
| Income Bracket | # Households | Median Income |
| 15 to 24 Years | 2,419 (4.1%) | $33,424 |
| 25 to 44 Years | 20,673 (35.4%) | $51,625 |
| 45 to 64 Years | 22,171 (37.9%) | $56,842 |
| 65+ Years | 13,185 (22.6%) | $32,397 |
| Total | 58,448 (100.0%) | $47,677 |
Poverty in Springfield
Income Below Poverty by Sex and Age in Springfield
With 22.7% poverty level for males and 27.7% for females among the residents of Springfield, 12 to 14 year old males and 12 to 14 year old females are the most vulnerable to poverty, with 1,344 males (38.8%) and 1,019 females (40.8%) in their respective age groups living below the poverty level.
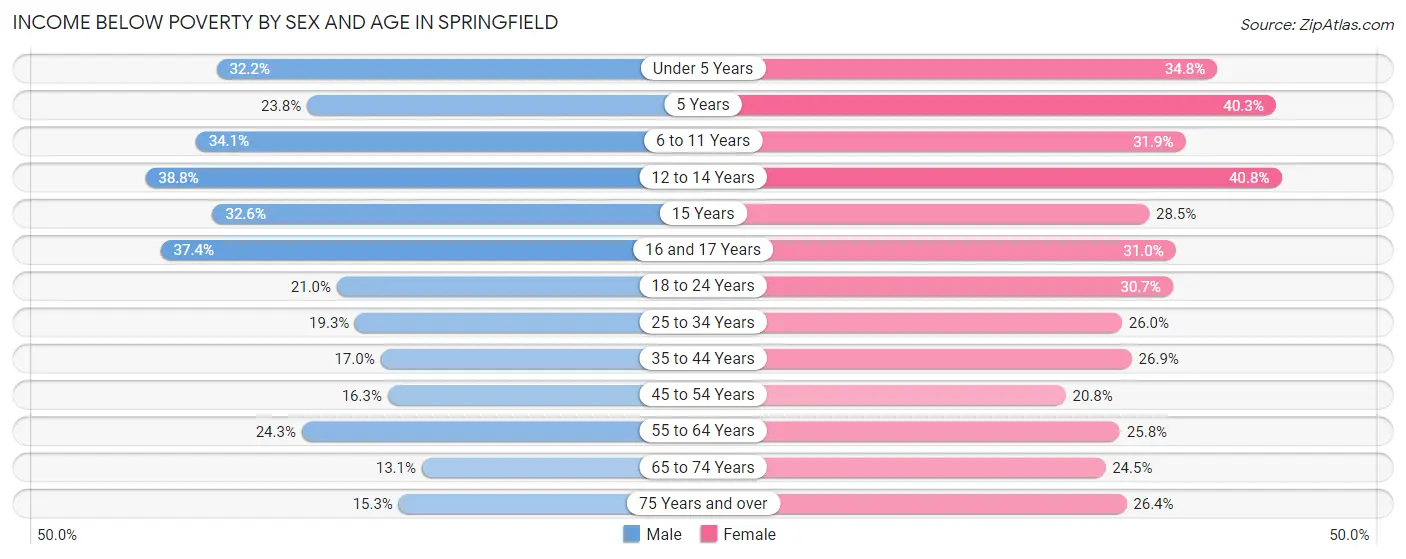
| Age Bracket | Male | Female |
| Under 5 Years | 1,705 (32.2%) | 1,766 (34.8%) |
| 5 Years | 186 (23.8%) | 489 (40.3%) |
| 6 to 11 Years | 2,219 (34.1%) | 2,029 (31.9%) |
| 12 to 14 Years | 1,344 (38.8%) | 1,019 (40.8%) |
| 15 Years | 388 (32.6%) | 225 (28.5%) |
| 16 and 17 Years | 635 (37.4%) | 691 (31.0%) |
| 18 to 24 Years | 1,799 (21.0%) | 2,251 (30.7%) |
| 25 to 34 Years | 2,238 (19.3%) | 3,104 (26.0%) |
| 35 to 44 Years | 1,433 (17.0%) | 2,673 (26.9%) |
| 45 to 54 Years | 1,279 (16.3%) | 1,959 (20.8%) |
| 55 to 64 Years | 1,973 (24.3%) | 2,557 (25.8%) |
| 65 to 74 Years | 742 (13.1%) | 1,587 (24.4%) |
| 75 Years and over | 444 (15.3%) | 1,262 (26.4%) |
| Total | 16,385 (22.7%) | 21,612 (27.7%) |
Income Above Poverty by Sex and Age in Springfield
According to the poverty statistics in Springfield, males aged 65 to 74 years and females aged 45 to 54 years are the age groups that are most secure financially, with 86.9% of males and 79.2% of females in these age groups living above the poverty line.
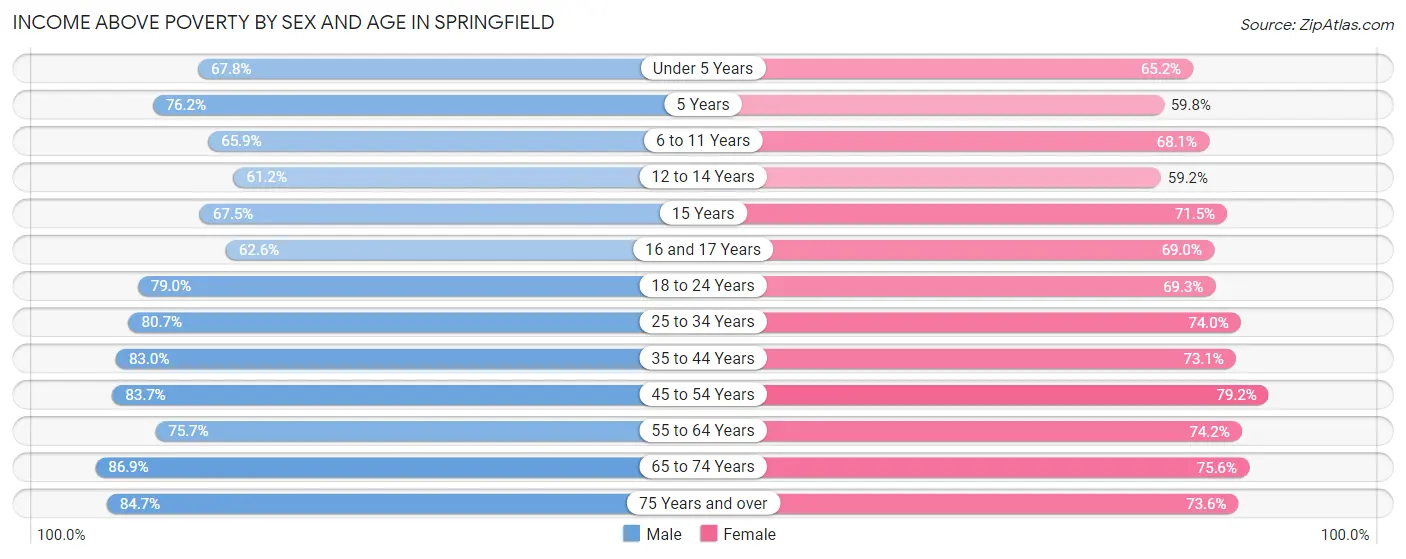
| Age Bracket | Male | Female |
| Under 5 Years | 3,592 (67.8%) | 3,305 (65.2%) |
| 5 Years | 596 (76.2%) | 726 (59.8%) |
| 6 to 11 Years | 4,287 (65.9%) | 4,337 (68.1%) |
| 12 to 14 Years | 2,121 (61.2%) | 1,480 (59.2%) |
| 15 Years | 804 (67.4%) | 564 (71.5%) |
| 16 and 17 Years | 1,064 (62.6%) | 1,540 (69.0%) |
| 18 to 24 Years | 6,759 (79.0%) | 5,082 (69.3%) |
| 25 to 34 Years | 9,348 (80.7%) | 8,839 (74.0%) |
| 35 to 44 Years | 7,013 (83.0%) | 7,263 (73.1%) |
| 45 to 54 Years | 6,570 (83.7%) | 7,474 (79.2%) |
| 55 to 64 Years | 6,153 (75.7%) | 7,351 (74.2%) |
| 65 to 74 Years | 4,904 (86.9%) | 4,903 (75.5%) |
| 75 Years and over | 2,462 (84.7%) | 3,517 (73.6%) |
| Total | 55,673 (77.3%) | 56,381 (72.3%) |
Income Below Poverty Among Married-Couple Families in Springfield
The poverty statistics for married-couple families in Springfield show that 8.7% or 1,541 of the total 17,689 families live below the poverty line. Families with 5 or more children have the highest poverty rate of 84.3%, comprising of 75 families. On the other hand, families with no children have the lowest poverty rate of 6.6%, which includes 687 families.
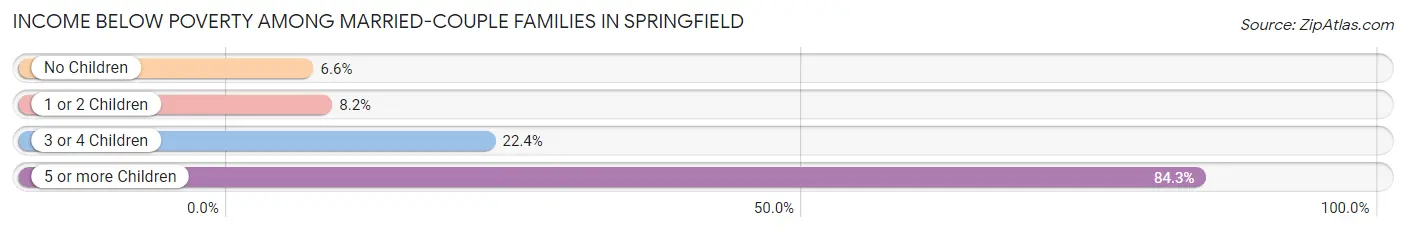
| Children | Above Poverty | Below Poverty |
| No Children | 9,756 (93.4%) | 687 (6.6%) |
| 1 or 2 Children | 5,333 (91.8%) | 477 (8.2%) |
| 3 or 4 Children | 1,045 (77.6%) | 302 (22.4%) |
| 5 or more Children | 14 (15.7%) | 75 (84.3%) |
| Total | 16,148 (91.3%) | 1,541 (8.7%) |
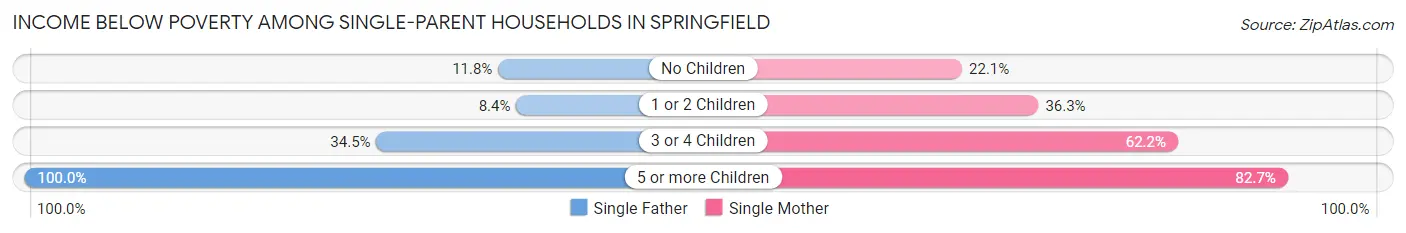
Income Below Poverty Among Single-Parent Households in Springfield
According to the poverty data in Springfield, 12.5% or 503 single-father households and 35.5% or 4,816 single-mother households are living below the poverty line. Among single-father households, those with 5 or more children have the highest poverty rate, with 23 households (100.0%) experiencing poverty. Likewise, among single-mother households, those with 5 or more children have the highest poverty rate, with 215 households (82.7%) falling below the poverty line.
| Children | Single Father | Single Mother |
| No Children | 207 (11.8%) | 890 (22.1%) |
| 1 or 2 Children | 162 (8.4%) | 2,863 (36.3%) |
| 3 or 4 Children | 111 (34.5%) | 848 (62.2%) |
| 5 or more Children | 23 (100.0%) | 215 (82.7%) |
| Total | 503 (12.5%) | 4,816 (35.5%) |
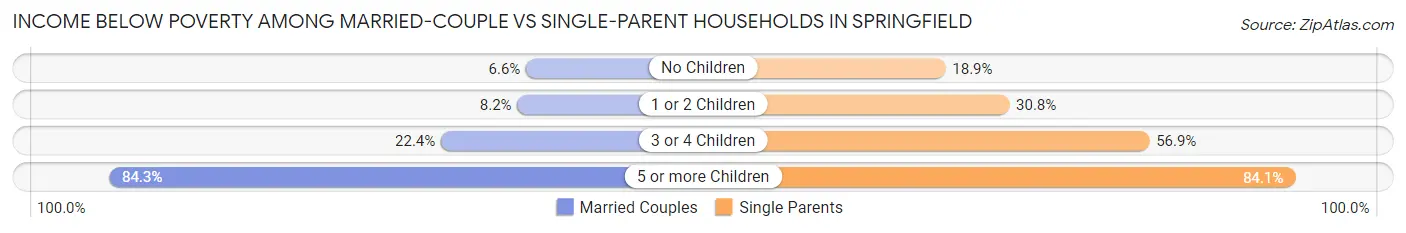
Income Below Poverty Among Married-Couple vs Single-Parent Households in Springfield
The poverty data for Springfield shows that 1,541 of the married-couple family households (8.7%) and 5,319 of the single-parent households (30.3%) are living below the poverty level. Within the married-couple family households, those with 5 or more children have the highest poverty rate, with 75 households (84.3%) falling below the poverty line. Among the single-parent households, those with 5 or more children have the highest poverty rate, with 238 household (84.1%) living below poverty.
| Children | Married-Couple Families | Single-Parent Households |
| No Children | 687 (6.6%) | 1,097 (18.9%) |
| 1 or 2 Children | 477 (8.2%) | 3,025 (30.8%) |
| 3 or 4 Children | 302 (22.4%) | 959 (56.9%) |
| 5 or more Children | 75 (84.3%) | 238 (84.1%) |
| Total | 1,541 (8.7%) | 5,319 (30.3%) |
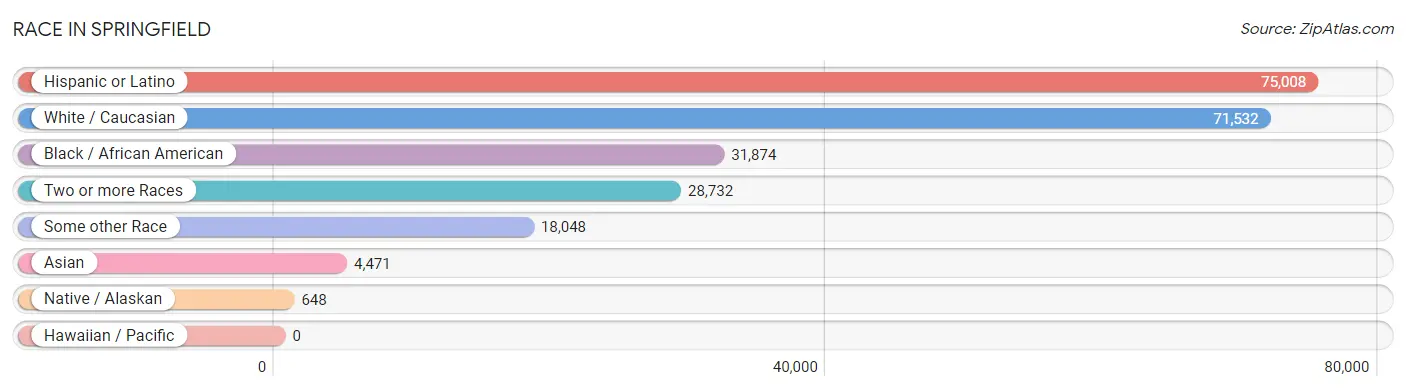
Race in Springfield
The most populous races in Springfield are Hispanic or Latino (75,008 | 48.3%), White / Caucasian (71,532 | 46.1%), and Black / African American (31,874 | 20.5%).
| Race | # Population | % Population |
| Asian | 4,471 | 2.9% |
| Black / African American | 31,874 | 20.5% |
| Hawaiian / Pacific | 0 | 0.0% |
| Hispanic or Latino | 75,008 | 48.3% |
| Native / Alaskan | 648 | 0.4% |
| White / Caucasian | 71,532 | 46.1% |
| Two or more Races | 28,732 | 18.5% |
| Some other Race | 18,048 | 11.6% |
| Total | 155,305 | 100.0% |
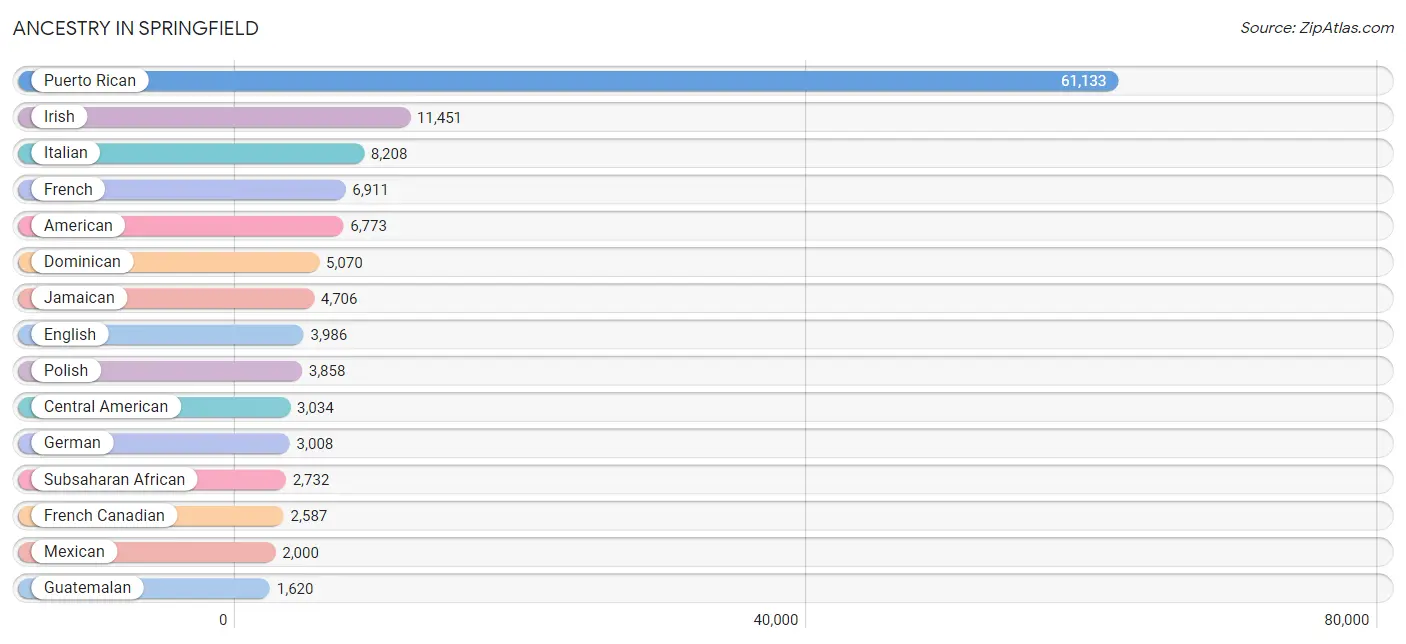
Ancestry in Springfield
The most populous ancestries reported in Springfield are Puerto Rican (61,133 | 39.4%), Irish (11,451 | 7.4%), Italian (8,208 | 5.3%), French (6,911 | 4.4%), and American (6,773 | 4.4%), together accounting for 60.8% of all Springfield residents.
| Ancestry | # Population | % Population |
| African | 949 | 0.6% |
| American | 6,773 | 4.4% |
| Arab | 874 | 0.6% |
| Argentinean | 27 | 0.0% |
| Armenian | 130 | 0.1% |
| Australian | 6 | 0.0% |
| Austrian | 22 | 0.0% |
| Barbadian | 118 | 0.1% |
| Basque | 36 | 0.0% |
| Belgian | 18 | 0.0% |
| Belizean | 14 | 0.0% |
| Bhutanese | 55 | 0.0% |
| Blackfeet | 289 | 0.2% |
| Bolivian | 43 | 0.0% |
| Brazilian | 43 | 0.0% |
| British | 257 | 0.2% |
| British West Indian | 131 | 0.1% |
| Bulgarian | 24 | 0.0% |
| Burmese | 155 | 0.1% |
| Canadian | 166 | 0.1% |
| Cape Verdean | 346 | 0.2% |
| Celtic | 14 | 0.0% |
| Central American | 3,034 | 1.9% |
| Central American Indian | 482 | 0.3% |
| Cherokee | 226 | 0.2% |
| Chippewa | 15 | 0.0% |
| Colombian | 449 | 0.3% |
| Costa Rican | 53 | 0.0% |
| Croatian | 5 | 0.0% |
| Cuban | 485 | 0.3% |
| Czech | 63 | 0.0% |
| Czechoslovakian | 37 | 0.0% |
| Danish | 38 | 0.0% |
| Dominican | 5,070 | 3.3% |
| Dutch | 215 | 0.1% |
| Eastern European | 141 | 0.1% |
| Ecuadorian | 505 | 0.3% |
| Egyptian | 39 | 0.0% |
| English | 3,986 | 2.6% |
| Estonian | 11 | 0.0% |
| Ethiopian | 20 | 0.0% |
| European | 502 | 0.3% |
| Finnish | 35 | 0.0% |
| French | 6,911 | 4.4% |
| French Canadian | 2,587 | 1.7% |
| German | 3,008 | 1.9% |
| Ghanaian | 157 | 0.1% |
| Greek | 902 | 0.6% |
| Guatemalan | 1,620 | 1.0% |
| Guyanese | 62 | 0.0% |
| Haitian | 355 | 0.2% |
| Honduran | 257 | 0.2% |
| Hungarian | 95 | 0.1% |
| Icelander | 9 | 0.0% |
| Indian (Asian) | 676 | 0.4% |
| Indonesian | 61 | 0.0% |
| Iranian | 31 | 0.0% |
| Iraqi | 193 | 0.1% |
| Irish | 11,451 | 7.4% |
| Iroquois | 10 | 0.0% |
| Italian | 8,208 | 5.3% |
| Jamaican | 4,706 | 3.0% |
| Japanese | 460 | 0.3% |
| Jordanian | 34 | 0.0% |
| Kenyan | 131 | 0.1% |
| Korean | 166 | 0.1% |
| Laotian | 10 | 0.0% |
| Latvian | 6 | 0.0% |
| Lebanese | 303 | 0.2% |
| Liberian | 14 | 0.0% |
| Lithuanian | 242 | 0.2% |
| Macedonian | 6 | 0.0% |
| Malaysian | 241 | 0.2% |
| Mexican | 2,000 | 1.3% |
| Mexican American Indian | 49 | 0.0% |
| Moroccan | 177 | 0.1% |
| Native Hawaiian | 137 | 0.1% |
| Navajo | 16 | 0.0% |
| Nicaraguan | 282 | 0.2% |
| Nigerian | 290 | 0.2% |
| Northern European | 49 | 0.0% |
| Norwegian | 48 | 0.0% |
| Pakistani | 46 | 0.0% |
| Panamanian | 174 | 0.1% |
| Paraguayan | 22 | 0.0% |
| Pennsylvania German | 7 | 0.0% |
| Peruvian | 354 | 0.2% |
| Polish | 3,858 | 2.5% |
| Portuguese | 991 | 0.6% |
| Puerto Rican | 61,133 | 39.4% |
| Romanian | 13 | 0.0% |
| Russian | 492 | 0.3% |
| Salvadoran | 648 | 0.4% |
| Samoan | 43 | 0.0% |
| Scandinavian | 26 | 0.0% |
| Scotch-Irish | 395 | 0.3% |
| Scottish | 788 | 0.5% |
| Serbian | 5 | 0.0% |
| Sierra Leonean | 14 | 0.0% |
| Slavic | 28 | 0.0% |
| Slovak | 86 | 0.1% |
| Slovene | 11 | 0.0% |
| Somali | 665 | 0.4% |
| South American | 1,475 | 0.9% |
| South American Indian | 14 | 0.0% |
| Spaniard | 392 | 0.3% |
| Spanish | 176 | 0.1% |
| Spanish American Indian | 192 | 0.1% |
| Sri Lankan | 1,543 | 1.0% |
| Subsaharan African | 2,732 | 1.8% |
| Sudanese | 48 | 0.0% |
| Swedish | 756 | 0.5% |
| Swiss | 14 | 0.0% |
| Thai | 530 | 0.3% |
| Trinidadian and Tobagonian | 172 | 0.1% |
| Turkish | 56 | 0.0% |
| U.S. Virgin Islander | 35 | 0.0% |
| Ukrainian | 197 | 0.1% |
| Uruguayan | 6 | 0.0% |
| Venezuelan | 36 | 0.0% |
| Welsh | 147 | 0.1% |
| West Indian | 169 | 0.1% |
| Yugoslavian | 6 | 0.0% | View All 123 Rows |
Immigrants in Springfield
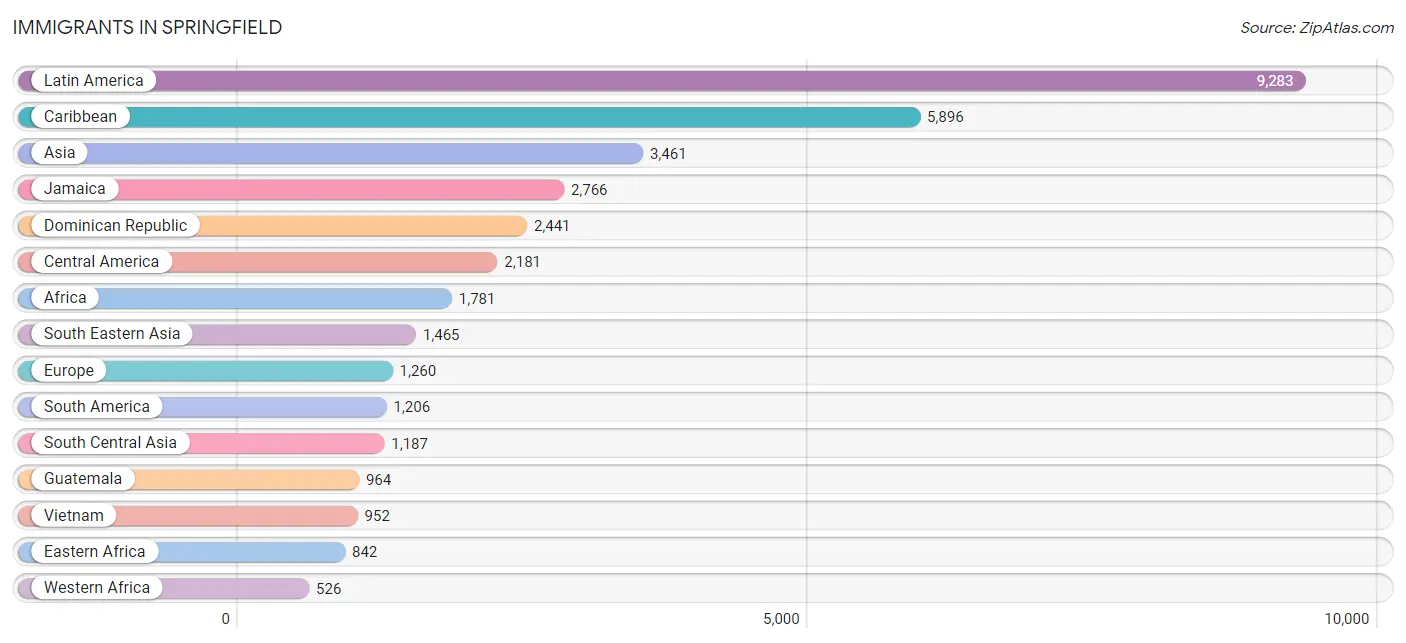
The most numerous immigrant groups reported in Springfield came from Latin America (9,283 | 6.0%), Caribbean (5,896 | 3.8%), Asia (3,461 | 2.2%), Jamaica (2,766 | 1.8%), and Dominican Republic (2,441 | 1.6%), together accounting for 15.4% of all Springfield residents.
| Immigration Origin | # Population | % Population |
| Afghanistan | 11 | 0.0% |
| Africa | 1,781 | 1.1% |
| Argentina | 14 | 0.0% |
| Asia | 3,461 | 2.2% |
| Australia | 6 | 0.0% |
| Austria | 18 | 0.0% |
| Azores | 7 | 0.0% |
| Bangladesh | 19 | 0.0% |
| Barbados | 149 | 0.1% |
| Belarus | 79 | 0.1% |
| Belgium | 12 | 0.0% |
| Bolivia | 14 | 0.0% |
| Brazil | 89 | 0.1% |
| Cabo Verde | 7 | 0.0% |
| Cambodia | 147 | 0.1% |
| Cameroon | 13 | 0.0% |
| Canada | 139 | 0.1% |
| Caribbean | 5,896 | 3.8% |
| Central America | 2,181 | 1.4% |
| Chile | 5 | 0.0% |
| China | 336 | 0.2% |
| Colombia | 360 | 0.2% |
| Congo | 5 | 0.0% |
| Costa Rica | 30 | 0.0% |
| Cuba | 10 | 0.0% |
| Dominica | 167 | 0.1% |
| Dominican Republic | 2,441 | 1.6% |
| Eastern Africa | 842 | 0.5% |
| Eastern Asia | 378 | 0.2% |
| Eastern Europe | 465 | 0.3% |
| Ecuador | 214 | 0.1% |
| Egypt | 8 | 0.0% |
| El Salvador | 414 | 0.3% |
| England | 31 | 0.0% |
| Ethiopia | 29 | 0.0% |
| Europe | 1,260 | 0.8% |
| France | 6 | 0.0% |
| Germany | 74 | 0.1% |
| Ghana | 236 | 0.2% |
| Greece | 89 | 0.1% |
| Grenada | 24 | 0.0% |
| Guatemala | 964 | 0.6% |
| Guyana | 129 | 0.1% |
| Haiti | 113 | 0.1% |
| Honduras | 91 | 0.1% |
| Hong Kong | 20 | 0.0% |
| India | 233 | 0.2% |
| Indonesia | 6 | 0.0% |
| Iran | 31 | 0.0% |
| Iraq | 188 | 0.1% |
| Ireland | 104 | 0.1% |
| Italy | 193 | 0.1% |
| Jamaica | 2,766 | 1.8% |
| Japan | 16 | 0.0% |
| Jordan | 38 | 0.0% |
| Kazakhstan | 22 | 0.0% |
| Kenya | 167 | 0.1% |
| Korea | 26 | 0.0% |
| Kuwait | 19 | 0.0% |
| Laos | 150 | 0.1% |
| Latin America | 9,283 | 6.0% |
| Lebanon | 65 | 0.0% |
| Liberia | 14 | 0.0% |
| Lithuania | 13 | 0.0% |
| Mexico | 522 | 0.3% |
| Middle Africa | 37 | 0.0% |
| Moldova | 15 | 0.0% |
| Morocco | 108 | 0.1% |
| Nepal | 401 | 0.3% |
| Netherlands | 25 | 0.0% |
| Nicaragua | 123 | 0.1% |
| Nigeria | 191 | 0.1% |
| Northern Africa | 190 | 0.1% |
| Northern Europe | 200 | 0.1% |
| Oceania | 6 | 0.0% |
| Pakistan | 225 | 0.1% |
| Panama | 37 | 0.0% |
| Peru | 304 | 0.2% |
| Philippines | 91 | 0.1% |
| Poland | 164 | 0.1% |
| Portugal | 178 | 0.1% |
| Romania | 1 | 0.0% |
| Russia | 107 | 0.1% |
| Scotland | 14 | 0.0% |
| Senegal | 41 | 0.0% |
| Sierra Leone | 14 | 0.0% |
| Somalia | 213 | 0.1% |
| South America | 1,206 | 0.8% |
| South Central Asia | 1,187 | 0.8% |
| South Eastern Asia | 1,465 | 0.9% |
| Southern Europe | 460 | 0.3% |
| Sudan | 33 | 0.0% |
| Sweden | 22 | 0.0% |
| Syria | 27 | 0.0% |
| Thailand | 104 | 0.1% |
| Trinidad and Tobago | 145 | 0.1% |
| Turkey | 19 | 0.0% |
| Ukraine | 58 | 0.0% |
| Uruguay | 6 | 0.0% |
| Venezuela | 12 | 0.0% |
| Vietnam | 952 | 0.6% |
| West Indies | 64 | 0.0% |
| Western Africa | 526 | 0.3% |
| Western Asia | 431 | 0.3% |
| Western Europe | 135 | 0.1% | View All 105 Rows |
Sex and Age in Springfield
Sex and Age in Springfield
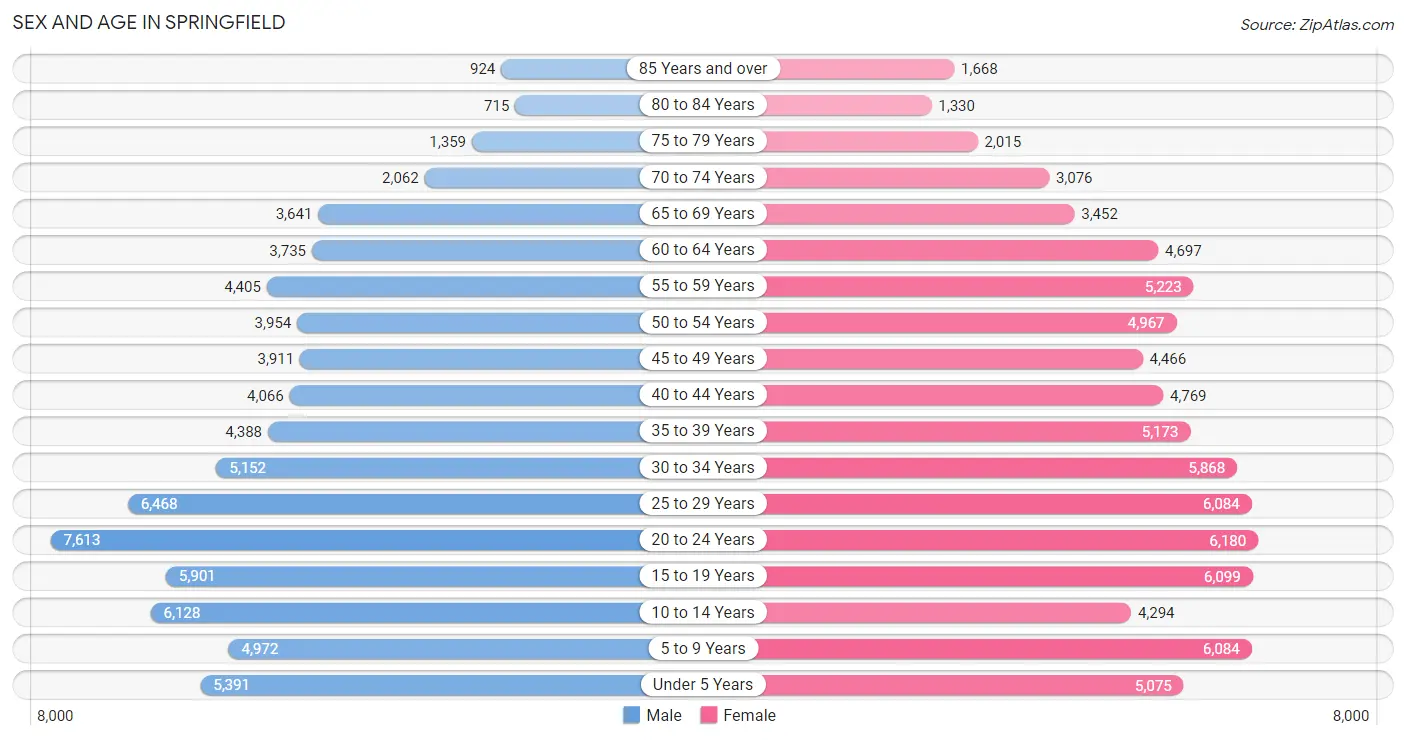
The most populous age groups in Springfield are 20 to 24 Years (7,613 | 10.2%) for men and 20 to 24 Years (6,180 | 7.7%) for women.
| Age Bracket | Male | Female |
| Under 5 Years | 5,391 (7.2%) | 5,075 (6.3%) |
| 5 to 9 Years | 4,972 (6.7%) | 6,084 (7.6%) |
| 10 to 14 Years | 6,128 (8.2%) | 4,294 (5.3%) |
| 15 to 19 Years | 5,901 (7.9%) | 6,099 (7.6%) |
| 20 to 24 Years | 7,613 (10.2%) | 6,180 (7.7%) |
| 25 to 29 Years | 6,468 (8.6%) | 6,084 (7.6%) |
| 30 to 34 Years | 5,152 (6.9%) | 5,868 (7.3%) |
| 35 to 39 Years | 4,388 (5.9%) | 5,173 (6.4%) |
| 40 to 44 Years | 4,066 (5.4%) | 4,769 (5.9%) |
| 45 to 49 Years | 3,911 (5.2%) | 4,466 (5.6%) |
| 50 to 54 Years | 3,954 (5.3%) | 4,967 (6.2%) |
| 55 to 59 Years | 4,405 (5.9%) | 5,223 (6.5%) |
| 60 to 64 Years | 3,735 (5.0%) | 4,697 (5.8%) |
| 65 to 69 Years | 3,641 (4.9%) | 3,452 (4.3%) |
| 70 to 74 Years | 2,062 (2.8%) | 3,076 (3.8%) |
| 75 to 79 Years | 1,359 (1.8%) | 2,015 (2.5%) |
| 80 to 84 Years | 715 (1.0%) | 1,330 (1.7%) |
| 85 Years and over | 924 (1.2%) | 1,668 (2.1%) |
| Total | 74,785 (100.0%) | 80,520 (100.0%) |
Families and Households in Springfield
Median Family Size in Springfield
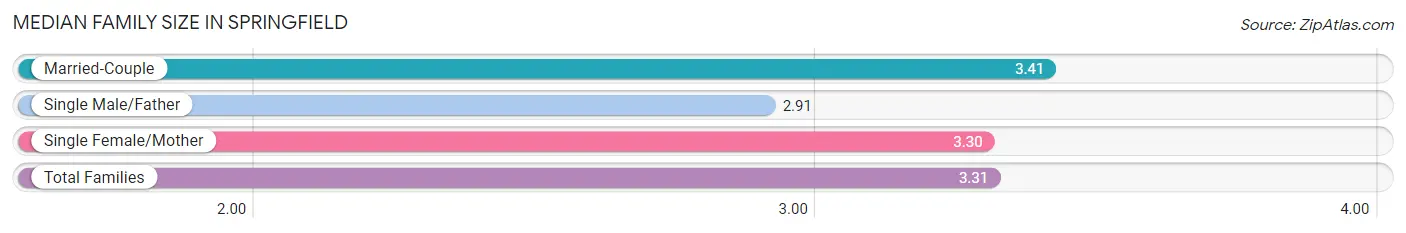
The median family size in Springfield is 3.31 persons per family, with married-couple families (17,689 | 50.2%) accounting for the largest median family size of 3.41 persons per family. On the other hand, single male/father families (4,028 | 11.4%) represent the smallest median family size with 2.91 persons per family.
| Family Type | # Families | Family Size |
| Married-Couple | 17,689 (50.2%) | 3.41 |
| Single Male/Father | 4,028 (11.4%) | 2.91 |
| Single Female/Mother | 13,549 (38.4%) | 3.30 |
| Total Families | 35,266 (100.0%) | 3.31 |
Median Household Size in Springfield
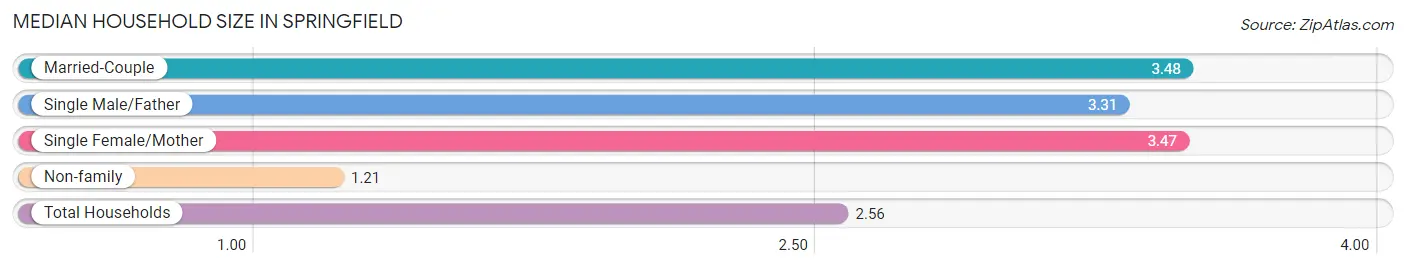
The median household size in Springfield is 2.56 persons per household, with married-couple households (17,689 | 30.3%) accounting for the largest median household size of 3.48 persons per household. non-family households (23,182 | 39.7%) represent the smallest median household size with 1.21 persons per household.
| Household Type | # Households | Household Size |
| Married-Couple | 17,689 (30.3%) | 3.48 |
| Single Male/Father | 4,028 (6.9%) | 3.31 |
| Single Female/Mother | 13,549 (23.2%) | 3.47 |
| Non-family | 23,182 (39.7%) | 1.21 |
| Total Households | 58,448 (100.0%) | 2.56 |
Household Size by Marriage Status in Springfield
Out of a total of 58,448 households in Springfield, 35,266 (60.3%) are family households, while 23,182 (39.7%) are nonfamily households. The most numerous type of family households are 2-person households, comprising 12,977, and the most common type of nonfamily households are 1-person households, comprising 19,055.
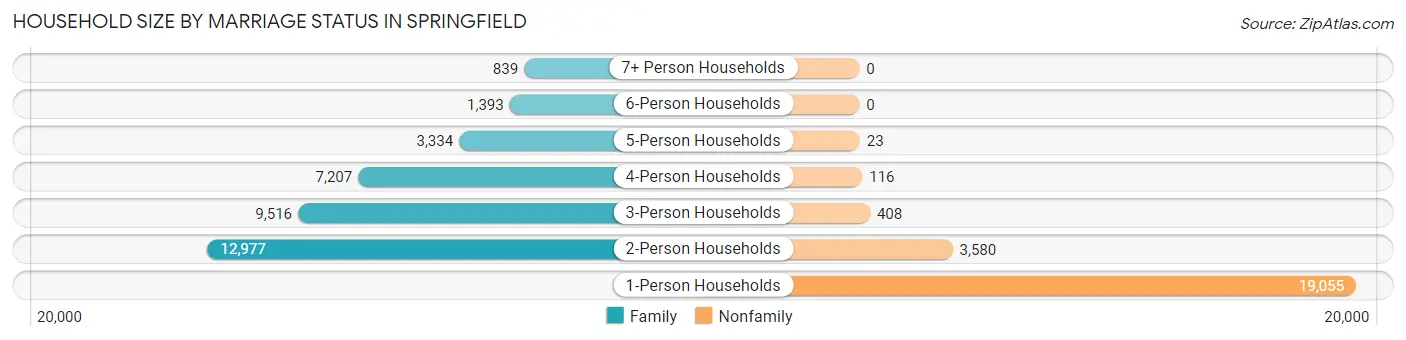
| Household Size | Family Households | Nonfamily Households |
| 1-Person Households | - | 19,055 (32.6%) |
| 2-Person Households | 12,977 (22.2%) | 3,580 (6.1%) |
| 3-Person Households | 9,516 (16.3%) | 408 (0.7%) |
| 4-Person Households | 7,207 (12.3%) | 116 (0.2%) |
| 5-Person Households | 3,334 (5.7%) | 23 (0.0%) |
| 6-Person Households | 1,393 (2.4%) | 0 (0.0%) |
| 7+ Person Households | 839 (1.4%) | 0 (0.0%) |
| Total | 35,266 (60.3%) | 23,182 (39.7%) |
Female Fertility in Springfield
Fertility by Age in Springfield
Average fertility rate in Springfield is 57.0 births per 1,000 women. Women in the age bracket of 20 to 34 years have the highest fertility rate with 104.0 births per 1,000 women. Women in the age bracket of 20 to 34 years acount for 83.6% of all women with births.
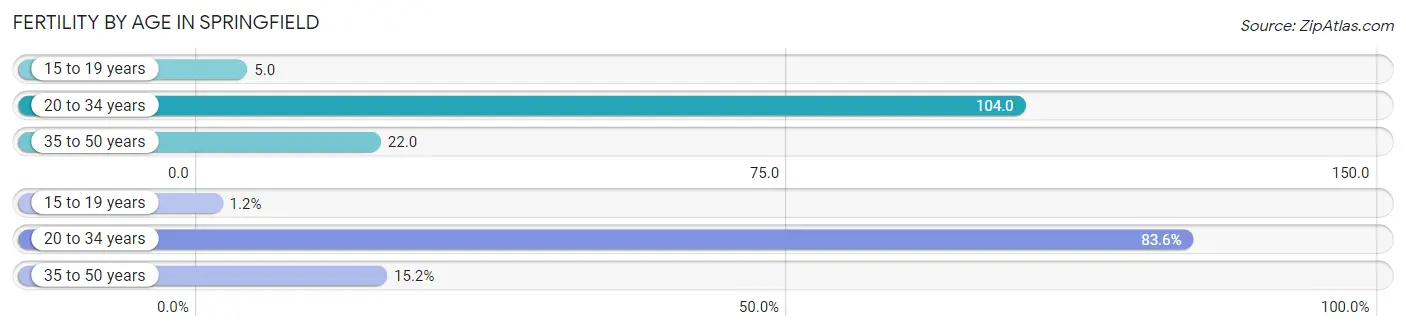
| Age Bracket | Women with Births | Births / 1,000 Women |
| 15 to 19 years | 28 (1.2%) | 5.0 |
| 20 to 34 years | 1,893 (83.6%) | 104.0 |
| 35 to 50 years | 344 (15.2%) | 22.0 |
| Total | 2,265 (100.0%) | 57.0 |
Fertility by Age by Marriage Status in Springfield
40.7% of women with births (2,265) in Springfield are married. The highest percentage of unmarried women with births falls into 15 to 19 years age bracket with 100.0% of them unmarried at the time of birth, while the lowest percentage of unmarried women with births belong to 35 to 50 years age bracket with 29.6% of them unmarried.
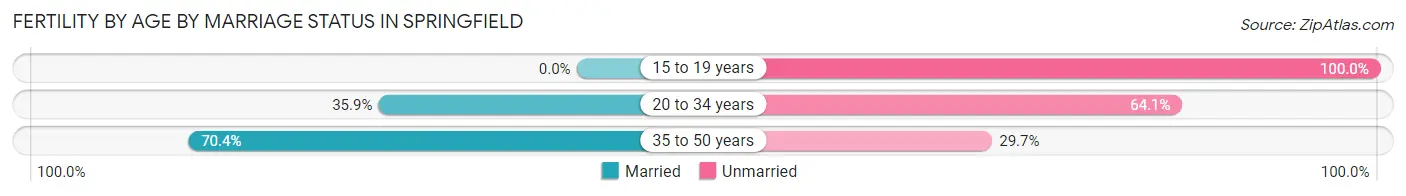
| Age Bracket | Married | Unmarried |
| 15 to 19 years | 0 (0.0%) | 28 (100.0%) |
| 20 to 34 years | 680 (35.9%) | 1,213 (64.1%) |
| 35 to 50 years | 242 (70.4%) | 102 (29.6%) |
| Total | 922 (40.7%) | 1,343 (59.3%) |
Fertility by Education in Springfield
Average fertility rate in Springfield is 57.0 births per 1,000 women. Women with the education attainment of college or associate's degree have the highest fertility rate of 69.0 births per 1,000 women, while women with the education attainment of high school diploma have the lowest fertility at 37.0 births per 1,000 women. Women with the education attainment of college or associate's degree represent 38.4% of all women with births.
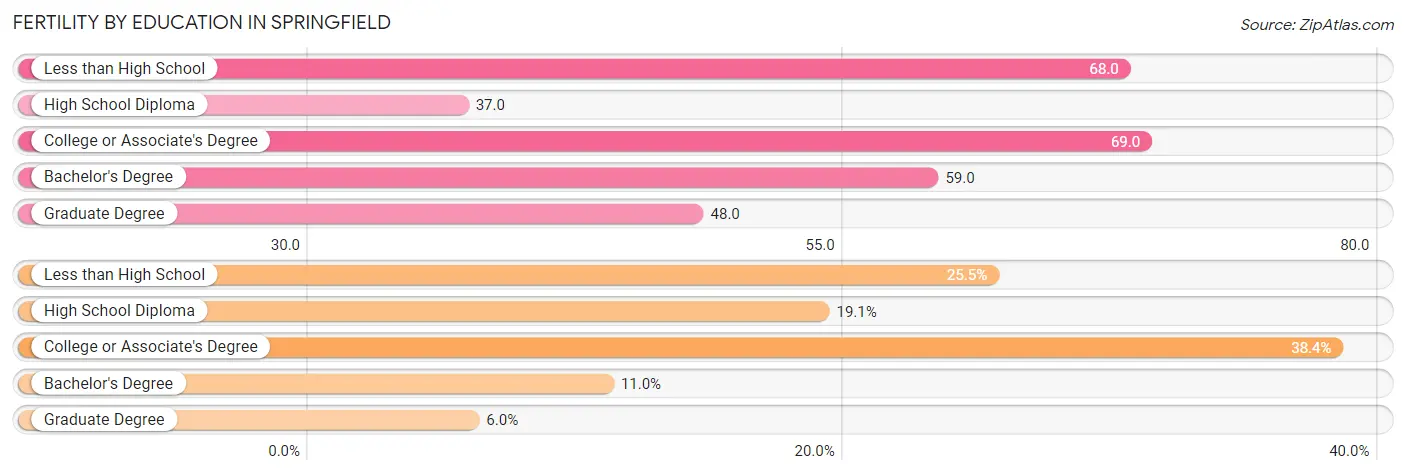
| Educational Attainment | Women with Births | Births / 1,000 Women |
| Less than High School | 577 (25.5%) | 68.0 |
| High School Diploma | 433 (19.1%) | 37.0 |
| College or Associate's Degree | 869 (38.4%) | 69.0 |
| Bachelor's Degree | 250 (11.0%) | 59.0 |
| Graduate Degree | 136 (6.0%) | 48.0 |
| Total | 2,265 (100.0%) | 57.0 |
Fertility by Education by Marriage Status in Springfield
59.3% of women with births in Springfield are unmarried. Women with the educational attainment of graduate degree are most likely to be married with 87.5% of them married at childbirth, while women with the educational attainment of less than high school are least likely to be married with 80.4% of them unmarried at childbirth.
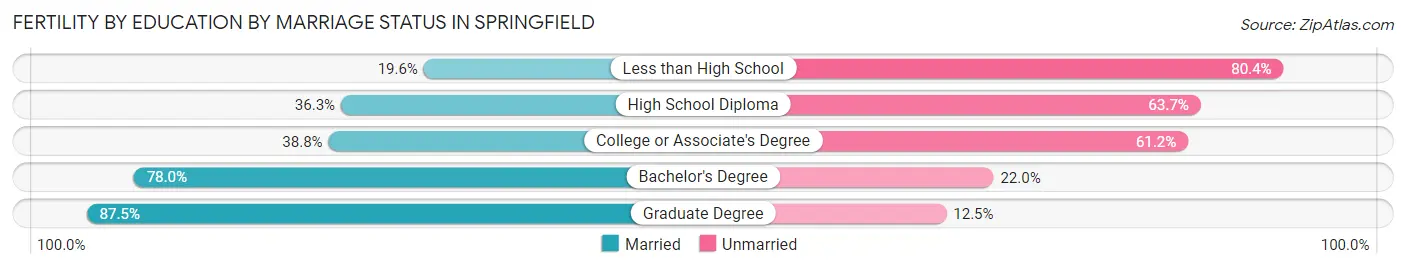
| Educational Attainment | Married | Unmarried |
| Less than High School | 113 (19.6%) | 464 (80.4%) |
| High School Diploma | 157 (36.3%) | 276 (63.7%) |
| College or Associate's Degree | 337 (38.8%) | 532 (61.2%) |
| Bachelor's Degree | 195 (78.0%) | 55 (22.0%) |
| Graduate Degree | 119 (87.5%) | 17 (12.5%) |
| Total | 922 (40.7%) | 1,343 (59.3%) |
Employment Characteristics in Springfield
Employment by Class of Employer in Springfield
Among the 62,454 employed individuals in Springfield, private company employees (40,842 | 65.4%), not-for-profit organizations (7,613 | 12.2%), and local government employees (5,156 | 8.3%) make up the most common classes of employment.
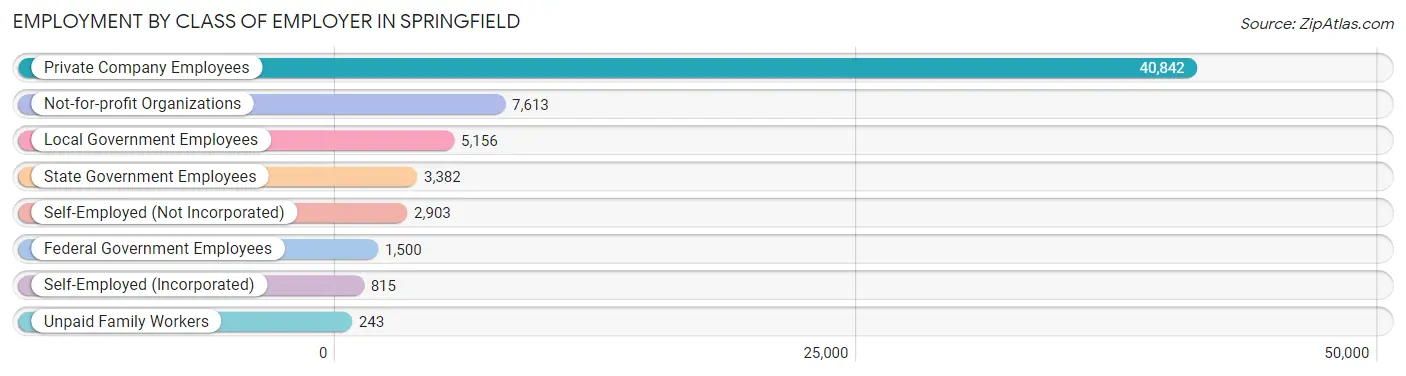
| Employer Class | # Employees | % Employees |
| Private Company Employees | 40,842 | 65.4% |
| Self-Employed (Incorporated) | 815 | 1.3% |
| Self-Employed (Not Incorporated) | 2,903 | 4.6% |
| Not-for-profit Organizations | 7,613 | 12.2% |
| Local Government Employees | 5,156 | 8.3% |
| State Government Employees | 3,382 | 5.4% |
| Federal Government Employees | 1,500 | 2.4% |
| Unpaid Family Workers | 243 | 0.4% |
| Total | 62,454 | 100.0% |
Employment Status by Age in Springfield
According to the labor force statistics for Springfield, out of the total population over 16 years of age (121,353), 57.3% or 69,535 individuals are in the labor force, with 8.7% or 6,050 of them unemployed. The age group with the highest labor force participation rate is 25 to 29 years, with 78.2% or 9,816 individuals in the labor force. Within the labor force, the 16 to 19 years age range has the highest percentage of unemployed individuals, with 29.3% or 820 of them being unemployed.
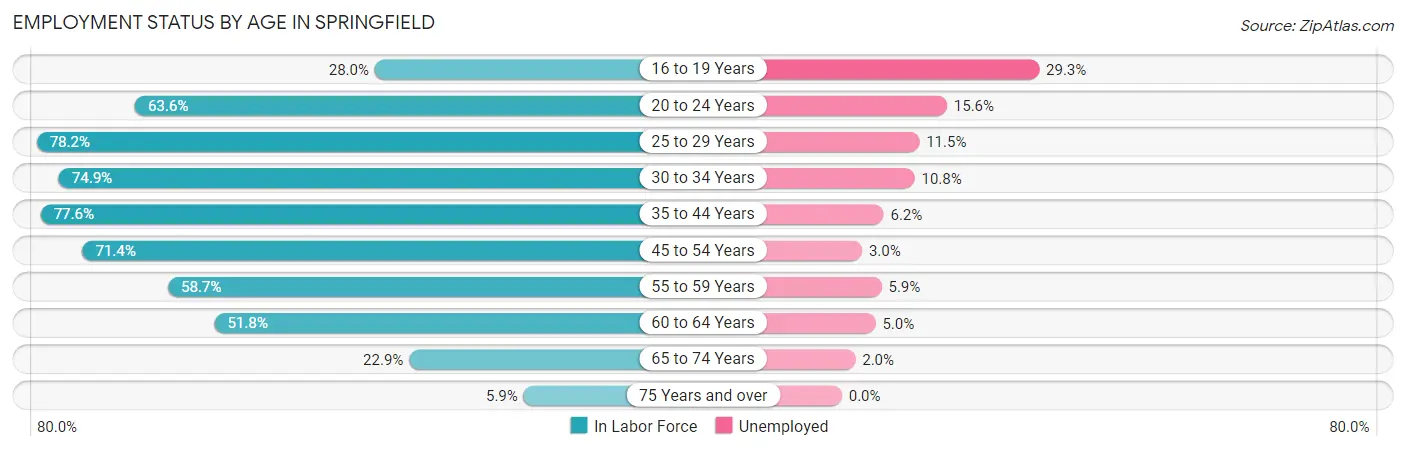
| Age Bracket | In Labor Force | Unemployed |
| 16 to 19 Years | 2,798 (28.0%) | 820 (29.3%) |
| 20 to 24 Years | 8,772 (63.6%) | 1,368 (15.6%) |
| 25 to 29 Years | 9,816 (78.2%) | 1,129 (11.5%) |
| 30 to 34 Years | 8,254 (74.9%) | 891 (10.8%) |
| 35 to 44 Years | 14,275 (77.6%) | 885 (6.2%) |
| 45 to 54 Years | 12,351 (71.4%) | 371 (3.0%) |
| 55 to 59 Years | 5,652 (58.7%) | 333 (5.9%) |
| 60 to 64 Years | 4,368 (51.8%) | 218 (5.0%) |
| 65 to 74 Years | 2,801 (22.9%) | 56 (2.0%) |
| 75 Years and over | 473 (5.9%) | 0 (0.0%) |
| Total | 69,535 (57.3%) | 6,050 (8.7%) |
Employment Status by Educational Attainment in Springfield
According to labor force statistics for Springfield, 70.7% of individuals (54,669) out of the total population between 25 and 64 years of age (77,326) are in the labor force, with 7.0% or 3,827 of them being unemployed. The group with the highest labor force participation rate are those with the educational attainment of bachelor's degree or higher, with 86.7% or 13,523 individuals in the labor force. Within the labor force, individuals with less than high school education have the highest percentage of unemployment, with 11.0% or 734 of them being unemployed.
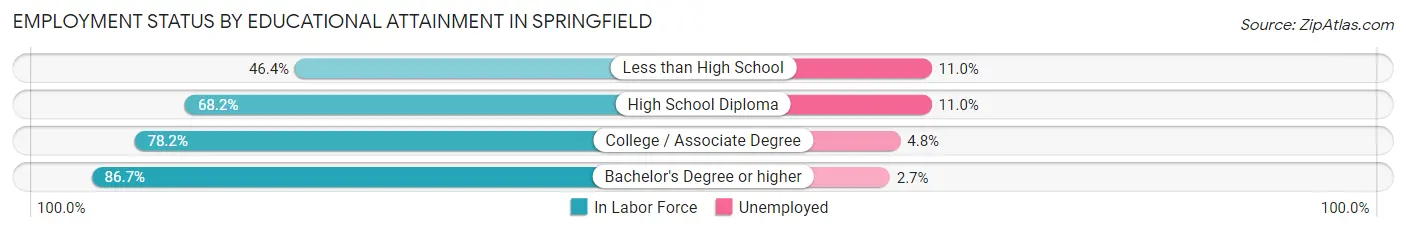
| Educational Attainment | In Labor Force | Unemployed |
| Less than High School | 6,676 (46.4%) | 1,583 (11.0%) |
| High School Diploma | 17,165 (68.2%) | 2,769 (11.0%) |
| College / Associate Degree | 17,338 (78.2%) | 1,064 (4.8%) |
| Bachelor's Degree or higher | 13,523 (86.7%) | 421 (2.7%) |
| Total | 54,669 (70.7%) | 5,413 (7.0%) |
Employment Occupations by Sex in Springfield
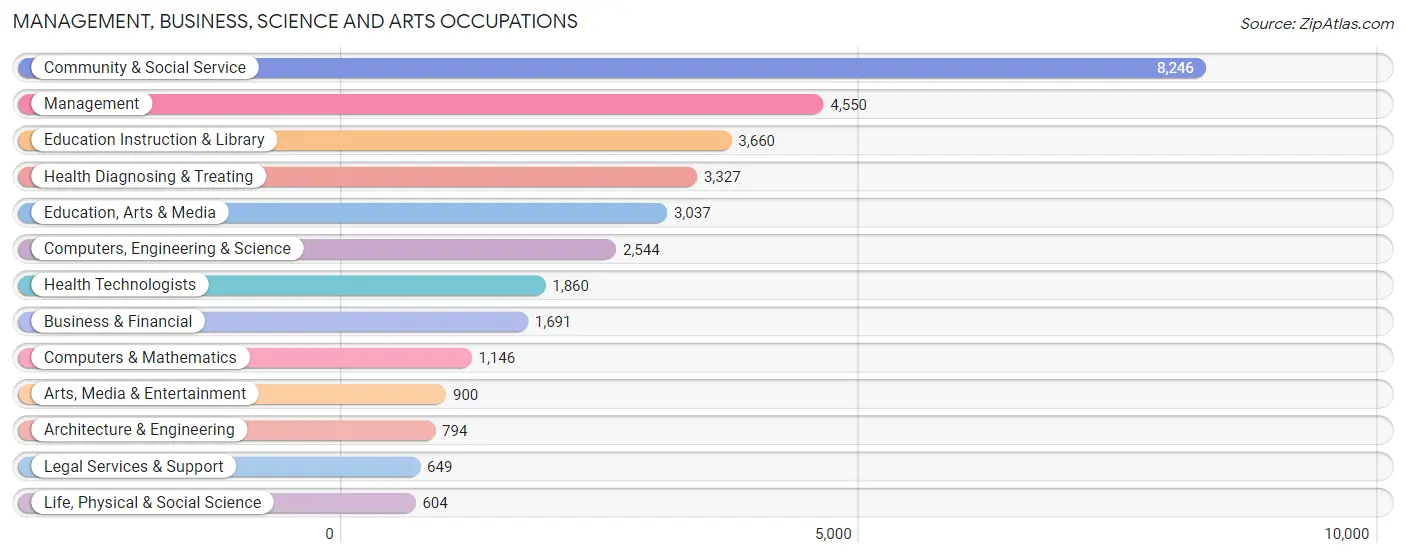
Management, Business, Science and Arts Occupations
The most common Management, Business, Science and Arts occupations in Springfield are Community & Social Service (8,246 | 13.0%), Management (4,550 | 7.2%), Education Instruction & Library (3,660 | 5.8%), Health Diagnosing & Treating (3,327 | 5.2%), and Education, Arts & Media (3,037 | 4.8%).
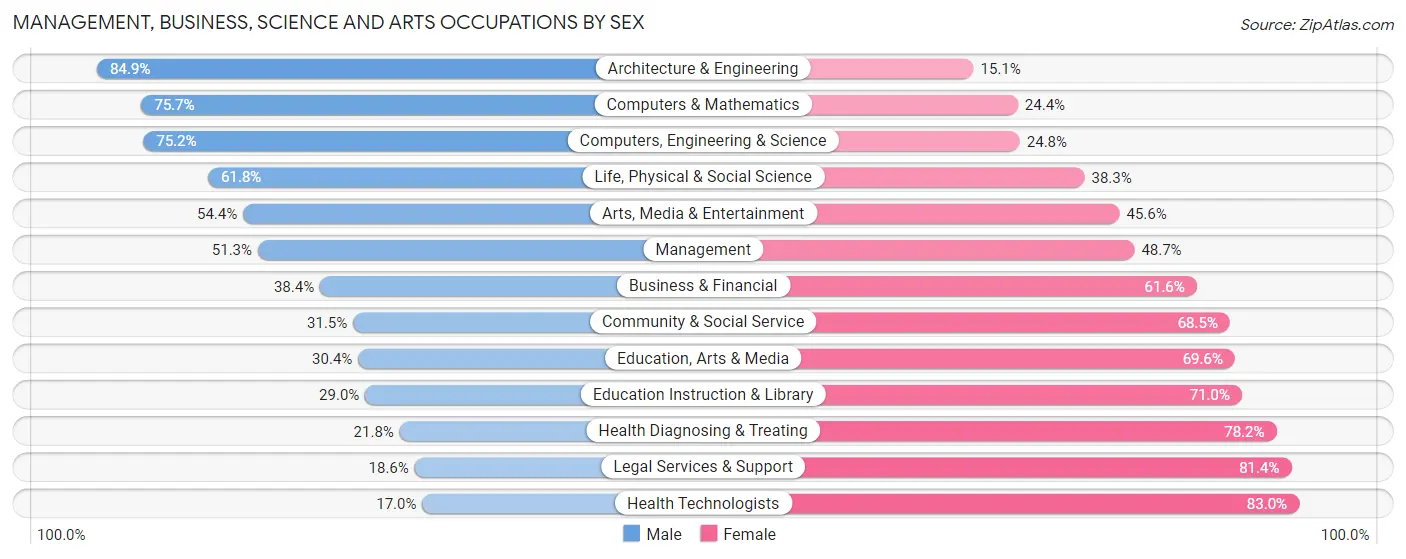
Management, Business, Science and Arts Occupations by Sex
Within the Management, Business, Science and Arts occupations in Springfield, the most male-oriented occupations are Architecture & Engineering (84.9%), Computers & Mathematics (75.6%), and Computers, Engineering & Science (75.2%), while the most female-oriented occupations are Health Technologists (83.0%), Legal Services & Support (81.4%), and Health Diagnosing & Treating (78.2%).
| Occupation | Male | Female |
| Management | 2,336 (51.3%) | 2,214 (48.7%) |
| Business & Financial | 649 (38.4%) | 1,042 (61.6%) |
| Computers, Engineering & Science | 1,914 (75.2%) | 630 (24.8%) |
| Computers & Mathematics | 867 (75.6%) | 279 (24.3%) |
| Architecture & Engineering | 674 (84.9%) | 120 (15.1%) |
| Life, Physical & Social Science | 373 (61.8%) | 231 (38.3%) |
| Community & Social Service | 2,595 (31.5%) | 5,651 (68.5%) |
| Education, Arts & Media | 924 (30.4%) | 2,113 (69.6%) |
| Legal Services & Support | 121 (18.6%) | 528 (81.4%) |
| Education Instruction & Library | 1,060 (29.0%) | 2,600 (71.0%) |
| Arts, Media & Entertainment | 490 (54.4%) | 410 (45.6%) |
| Health Diagnosing & Treating | 724 (21.8%) | 2,603 (78.2%) |
| Health Technologists | 317 (17.0%) | 1,543 (83.0%) |
| Total (Category) | 8,218 (40.4%) | 12,140 (59.6%) |
| Total (Overall) | 31,320 (49.4%) | 32,108 (50.6%) |
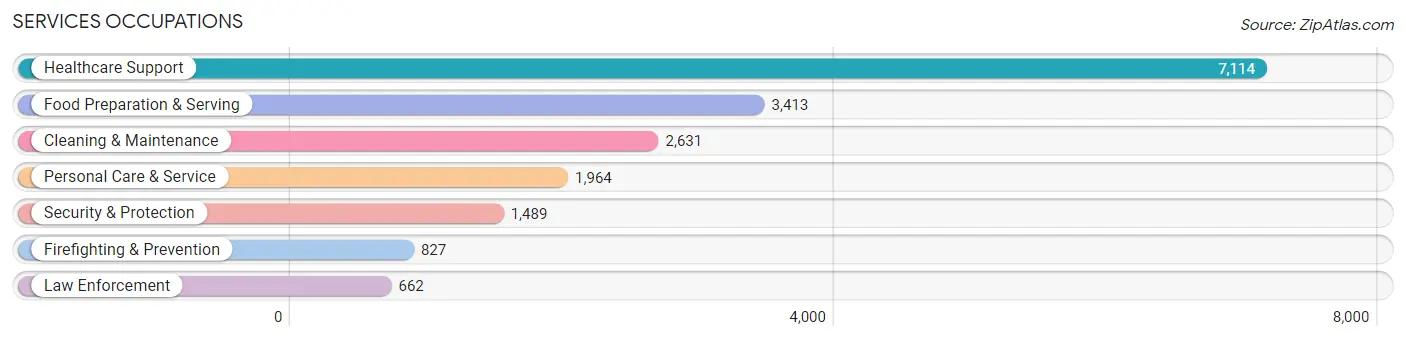
Services Occupations
The most common Services occupations in Springfield are Healthcare Support (7,114 | 11.2%), Food Preparation & Serving (3,413 | 5.4%), Cleaning & Maintenance (2,631 | 4.2%), Personal Care & Service (1,964 | 3.1%), and Security & Protection (1,489 | 2.4%).
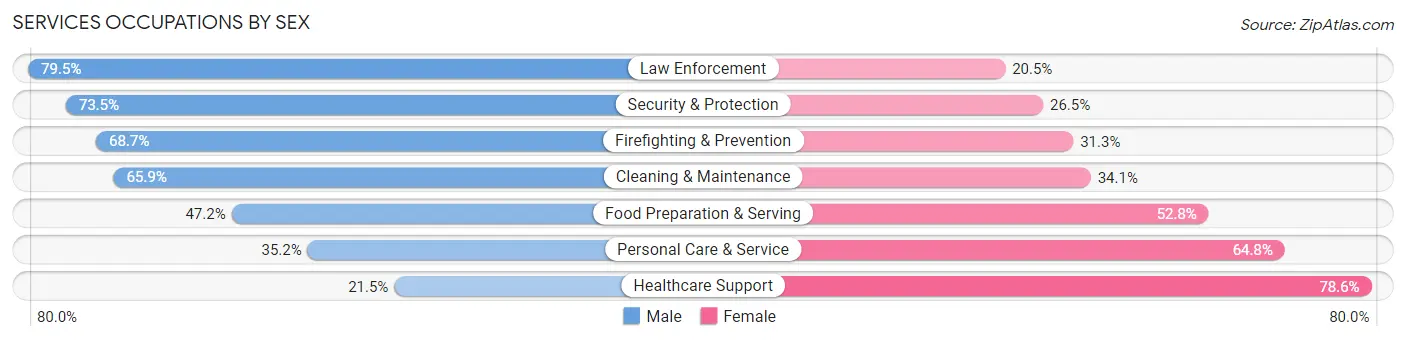
Services Occupations by Sex
Within the Services occupations in Springfield, the most male-oriented occupations are Law Enforcement (79.5%), Security & Protection (73.5%), and Firefighting & Prevention (68.7%), while the most female-oriented occupations are Healthcare Support (78.5%), Personal Care & Service (64.8%), and Food Preparation & Serving (52.8%).
| Occupation | Male | Female |
| Healthcare Support | 1,526 (21.4%) | 5,588 (78.5%) |
| Security & Protection | 1,094 (73.5%) | 395 (26.5%) |
| Firefighting & Prevention | 568 (68.7%) | 259 (31.3%) |
| Law Enforcement | 526 (79.5%) | 136 (20.5%) |
| Food Preparation & Serving | 1,612 (47.2%) | 1,801 (52.8%) |
| Cleaning & Maintenance | 1,734 (65.9%) | 897 (34.1%) |
| Personal Care & Service | 691 (35.2%) | 1,273 (64.8%) |
| Total (Category) | 6,657 (40.1%) | 9,954 (59.9%) |
| Total (Overall) | 31,320 (49.4%) | 32,108 (50.6%) |
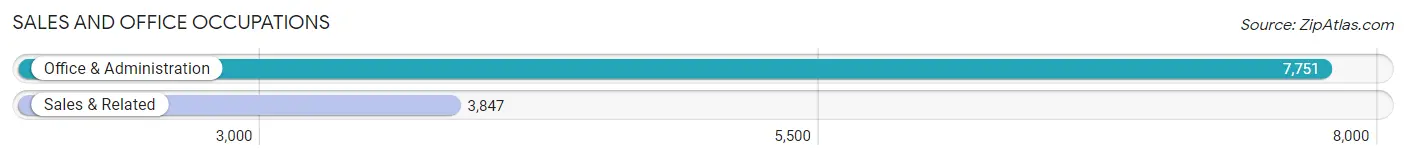
Sales and Office Occupations
The most common Sales and Office occupations in Springfield are Office & Administration (7,751 | 12.2%), and Sales & Related (3,847 | 6.1%).
Sales and Office Occupations by Sex
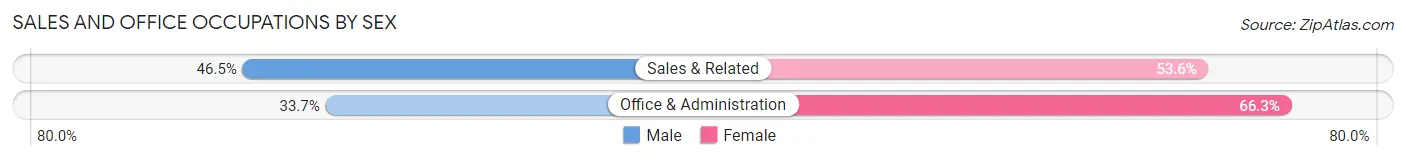
| Occupation | Male | Female |
| Sales & Related | 1,787 (46.5%) | 2,060 (53.5%) |
| Office & Administration | 2,612 (33.7%) | 5,139 (66.3%) |
| Total (Category) | 4,399 (37.9%) | 7,199 (62.1%) |
| Total (Overall) | 31,320 (49.4%) | 32,108 (50.6%) |
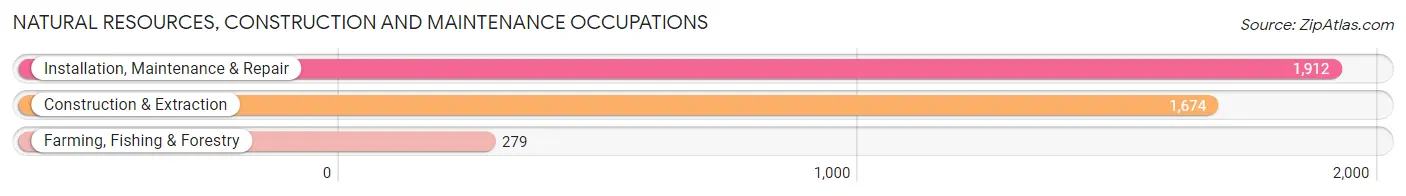
Natural Resources, Construction and Maintenance Occupations
The most common Natural Resources, Construction and Maintenance occupations in Springfield are Installation, Maintenance & Repair (1,912 | 3.0%), Construction & Extraction (1,674 | 2.6%), and Farming, Fishing & Forestry (279 | 0.4%).
Natural Resources, Construction and Maintenance Occupations by Sex
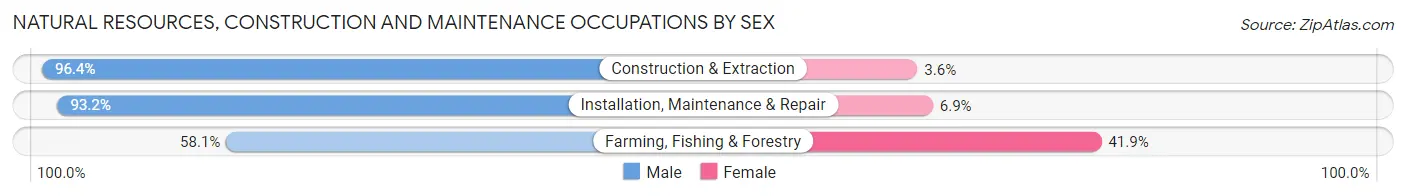
| Occupation | Male | Female |
| Farming, Fishing & Forestry | 162 (58.1%) | 117 (41.9%) |
| Construction & Extraction | 1,613 (96.4%) | 61 (3.6%) |
| Installation, Maintenance & Repair | 1,781 (93.1%) | 131 (6.9%) |
| Total (Category) | 3,556 (92.0%) | 309 (8.0%) |
| Total (Overall) | 31,320 (49.4%) | 32,108 (50.6%) |
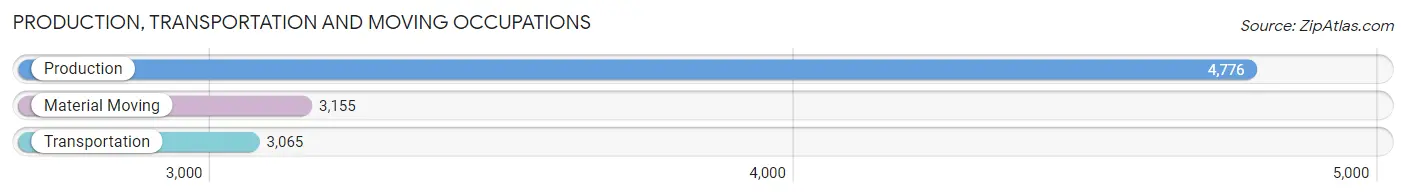
Production, Transportation and Moving Occupations
The most common Production, Transportation and Moving occupations in Springfield are Production (4,776 | 7.5%), Material Moving (3,155 | 5.0%), and Transportation (3,065 | 4.8%).
Production, Transportation and Moving Occupations by Sex
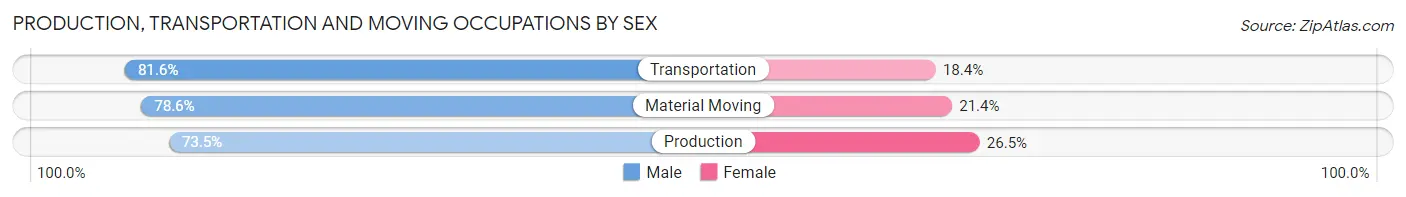
| Occupation | Male | Female |
| Production | 3,511 (73.5%) | 1,265 (26.5%) |
| Transportation | 2,500 (81.6%) | 565 (18.4%) |
| Material Moving | 2,479 (78.6%) | 676 (21.4%) |
| Total (Category) | 8,490 (77.2%) | 2,506 (22.8%) |
| Total (Overall) | 31,320 (49.4%) | 32,108 (50.6%) |
Employment Industries by Sex in Springfield
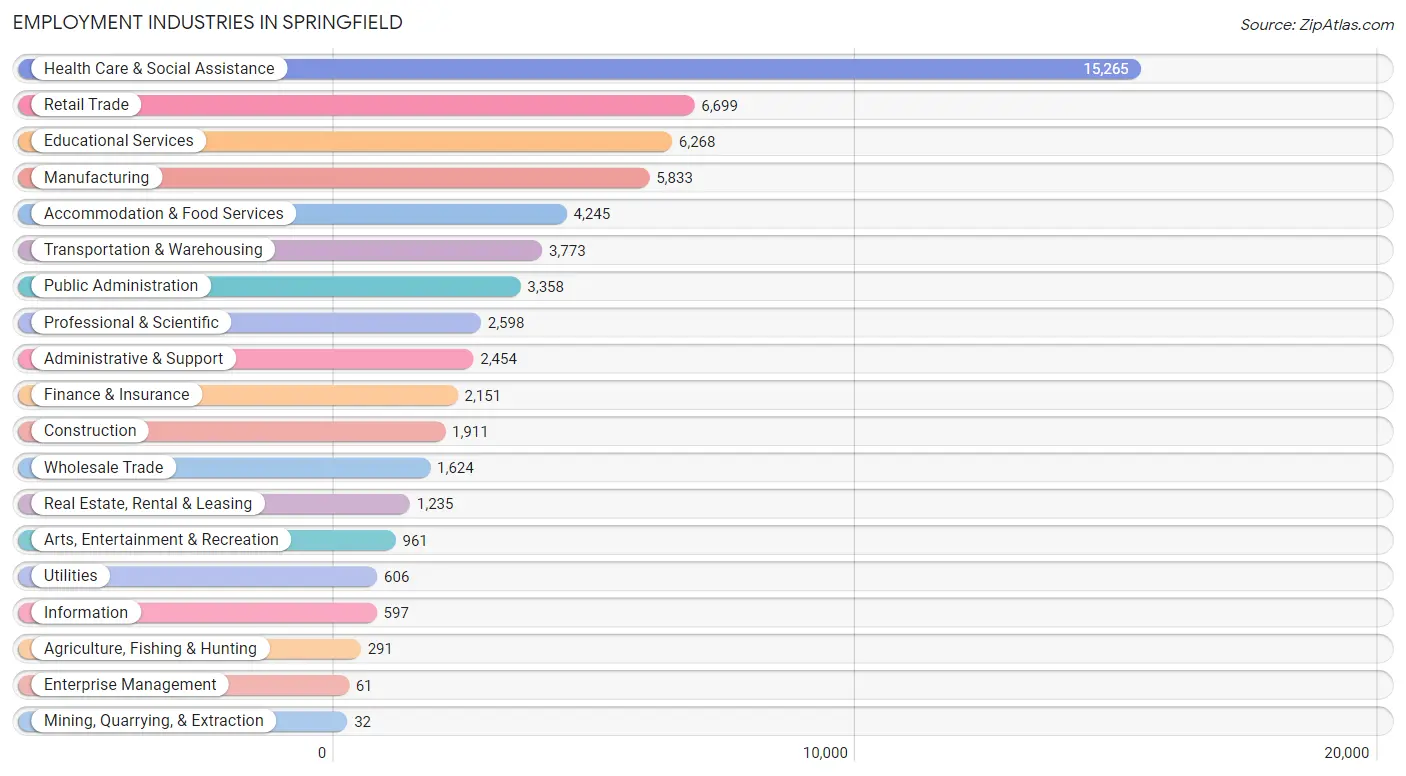
Employment Industries in Springfield
The major employment industries in Springfield include Health Care & Social Assistance (15,265 | 24.1%), Retail Trade (6,699 | 10.6%), Educational Services (6,268 | 9.9%), Manufacturing (5,833 | 9.2%), and Accommodation & Food Services (4,245 | 6.7%).
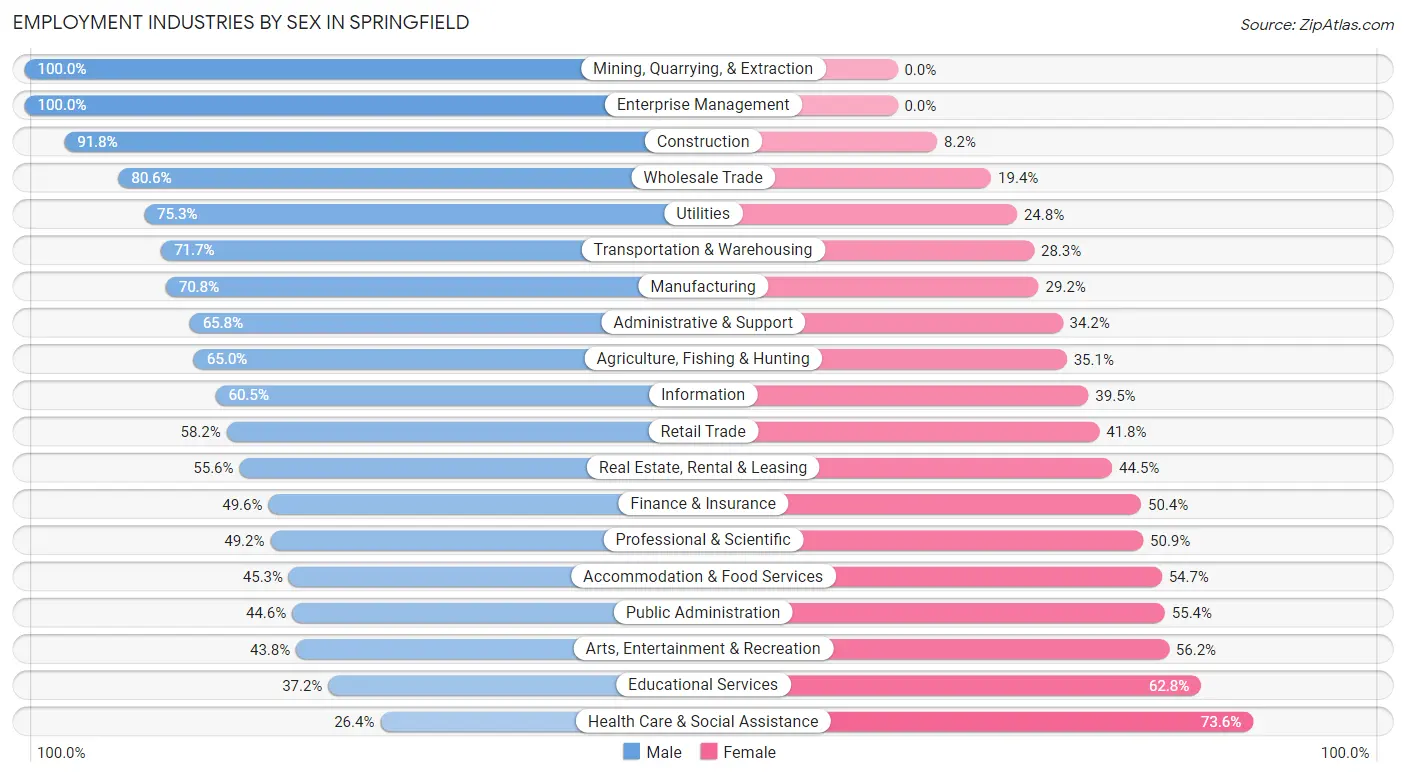
Employment Industries by Sex in Springfield
The Springfield industries that see more men than women are Mining, Quarrying, & Extraction (100.0%), Enterprise Management (100.0%), and Construction (91.8%), whereas the industries that tend to have a higher number of women are Health Care & Social Assistance (73.6%), Educational Services (62.8%), and Arts, Entertainment & Recreation (56.2%).
| Industry | Male | Female |
| Agriculture, Fishing & Hunting | 189 (64.9%) | 102 (35.0%) |
| Mining, Quarrying, & Extraction | 32 (100.0%) | 0 (0.0%) |
| Construction | 1,754 (91.8%) | 157 (8.2%) |
| Manufacturing | 4,128 (70.8%) | 1,705 (29.2%) |
| Wholesale Trade | 1,309 (80.6%) | 315 (19.4%) |
| Retail Trade | 3,899 (58.2%) | 2,800 (41.8%) |
| Transportation & Warehousing | 2,706 (71.7%) | 1,067 (28.3%) |
| Utilities | 456 (75.2%) | 150 (24.7%) |
| Information | 361 (60.5%) | 236 (39.5%) |
| Finance & Insurance | 1,066 (49.6%) | 1,085 (50.4%) |
| Real Estate, Rental & Leasing | 686 (55.5%) | 549 (44.5%) |
| Professional & Scientific | 1,277 (49.1%) | 1,321 (50.8%) |
| Enterprise Management | 61 (100.0%) | 0 (0.0%) |
| Administrative & Support | 1,615 (65.8%) | 839 (34.2%) |
| Educational Services | 2,329 (37.2%) | 3,939 (62.8%) |
| Health Care & Social Assistance | 4,029 (26.4%) | 11,236 (73.6%) |
| Arts, Entertainment & Recreation | 421 (43.8%) | 540 (56.2%) |
| Accommodation & Food Services | 1,923 (45.3%) | 2,322 (54.7%) |
| Public Administration | 1,499 (44.6%) | 1,859 (55.4%) |
| Total | 31,320 (49.4%) | 32,108 (50.6%) |
Education in Springfield
School Enrollment in Springfield
The most common levels of schooling among the 41,629 students in Springfield are college / undergraduate (9,349 | 22.5%), elementary school (9,090 | 21.8%), and middle school (8,727 | 21.0%).
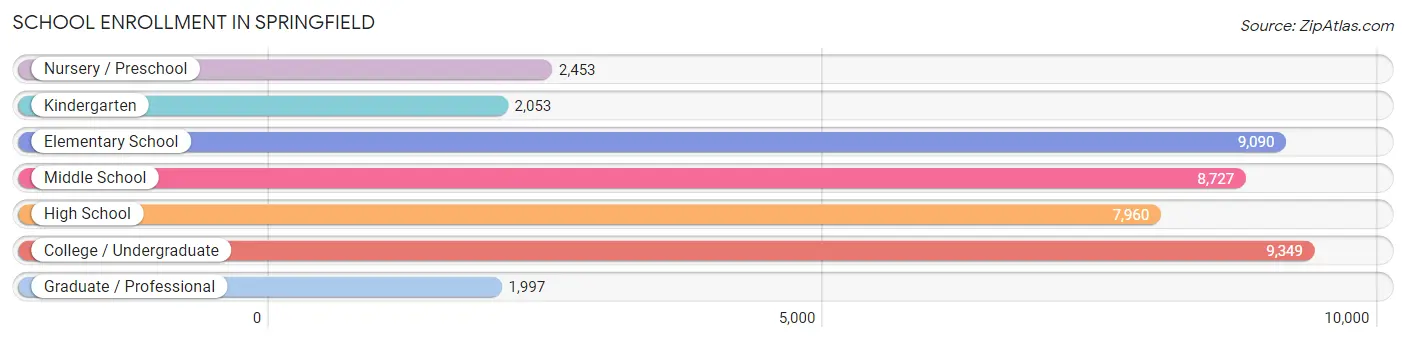
| School Level | # Students | % Students |
| Nursery / Preschool | 2,453 | 5.9% |
| Kindergarten | 2,053 | 4.9% |
| Elementary School | 9,090 | 21.8% |
| Middle School | 8,727 | 21.0% |
| High School | 7,960 | 19.1% |
| College / Undergraduate | 9,349 | 22.5% |
| Graduate / Professional | 1,997 | 4.8% |
| Total | 41,629 | 100.0% |
School Enrollment by Age by Funding Source in Springfield
Out of a total of 41,629 students who are enrolled in schools in Springfield, 7,785 (18.7%) attend a private institution, while the remaining 33,844 (81.3%) are enrolled in public schools. The age group of 20 to 24 year olds has the highest likelihood of being enrolled in private schools, with 2,497 (52.4% in the age bracket) enrolled. Conversely, the age group of 15 to 17 year olds has the lowest likelihood of being enrolled in a private school, with 5,327 (93.2% in the age bracket) attending a public institution.
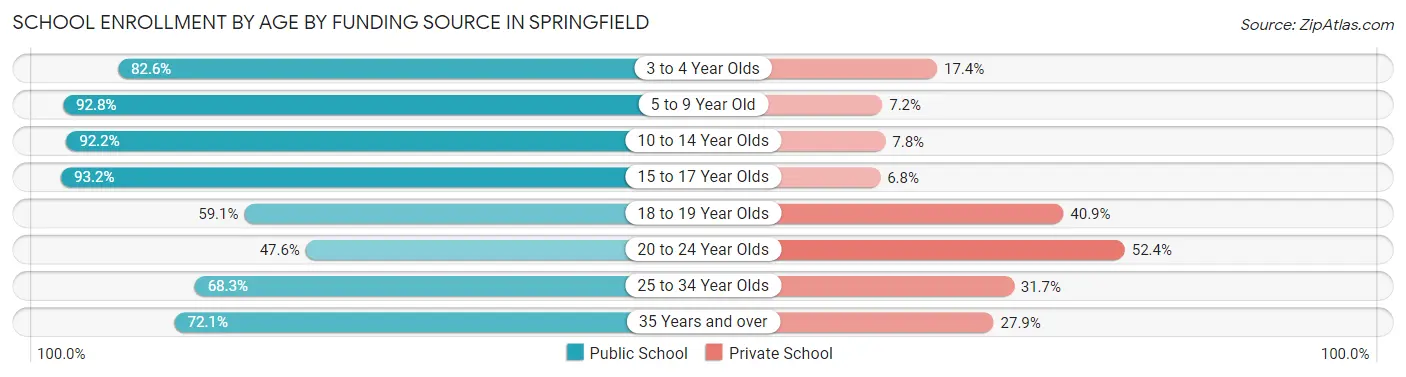
| Age Bracket | Public School | Private School |
| 3 to 4 Year Olds | 1,743 (82.6%) | 367 (17.4%) |
| 5 to 9 Year Old | 9,526 (92.8%) | 738 (7.2%) |
| 10 to 14 Year Olds | 9,528 (92.2%) | 803 (7.8%) |
| 15 to 17 Year Olds | 5,327 (93.2%) | 389 (6.8%) |
| 18 to 19 Year Olds | 2,569 (59.1%) | 1,779 (40.9%) |
| 20 to 24 Year Olds | 2,272 (47.6%) | 2,497 (52.4%) |
| 25 to 34 Year Olds | 1,425 (68.3%) | 661 (31.7%) |
| 35 Years and over | 1,445 (72.1%) | 560 (27.9%) |
| Total | 33,844 (81.3%) | 7,785 (18.7%) |
Educational Attainment by Field of Study in Springfield
Business (3,702 | 17.7%), education (2,591 | 12.4%), arts & humanities (2,432 | 11.7%), science & technology (2,061 | 9.9%), and social sciences (1,759 | 8.4%) are the most common fields of study among 20,855 individuals in Springfield who have obtained a bachelor's degree or higher.
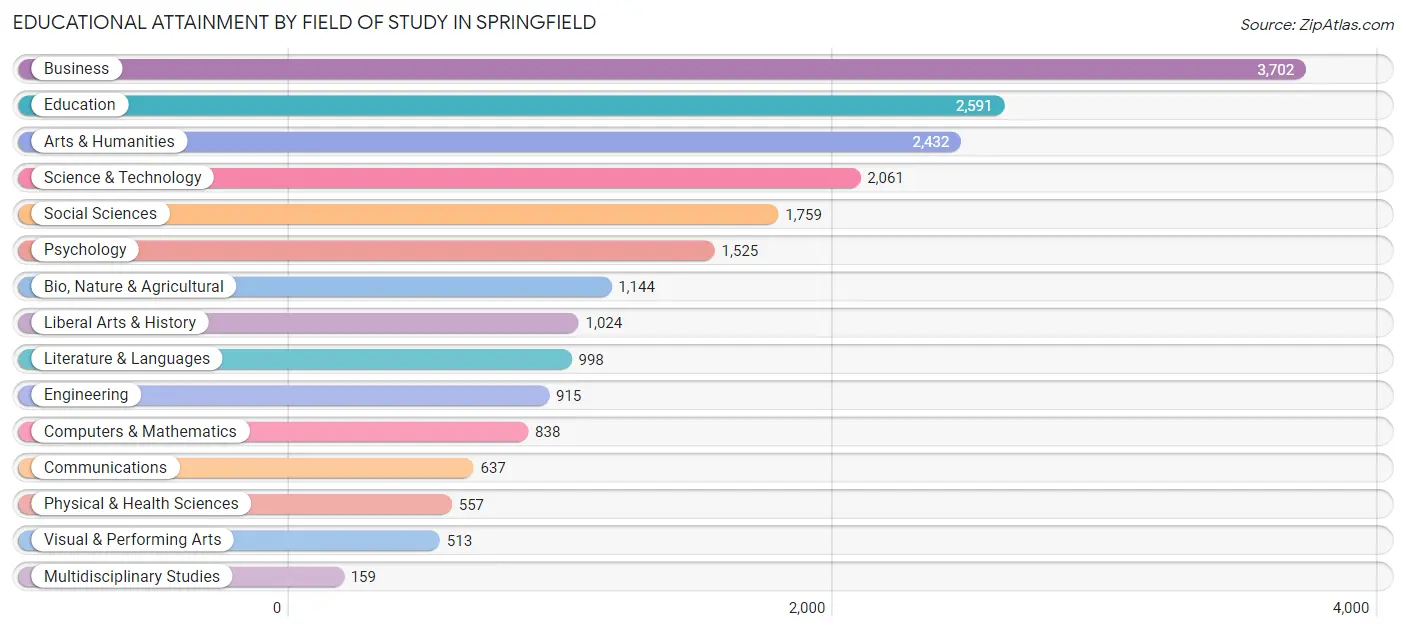
| Field of Study | # Graduates | % Graduates |
| Computers & Mathematics | 838 | 4.0% |
| Bio, Nature & Agricultural | 1,144 | 5.5% |
| Physical & Health Sciences | 557 | 2.7% |
| Psychology | 1,525 | 7.3% |
| Social Sciences | 1,759 | 8.4% |
| Engineering | 915 | 4.4% |
| Multidisciplinary Studies | 159 | 0.8% |
| Science & Technology | 2,061 | 9.9% |
| Business | 3,702 | 17.7% |
| Education | 2,591 | 12.4% |
| Literature & Languages | 998 | 4.8% |
| Liberal Arts & History | 1,024 | 4.9% |
| Visual & Performing Arts | 513 | 2.5% |
| Communications | 637 | 3.0% |
| Arts & Humanities | 2,432 | 11.7% |
| Total | 20,855 | 100.0% |
Transportation & Commute in Springfield
Vehicle Availability by Sex in Springfield
The most prevalent vehicle ownership categories in Springfield are males with 2 vehicles (11,768, accounting for 38.7%) and females with 2 vehicles (10,224, making up 37.7%).
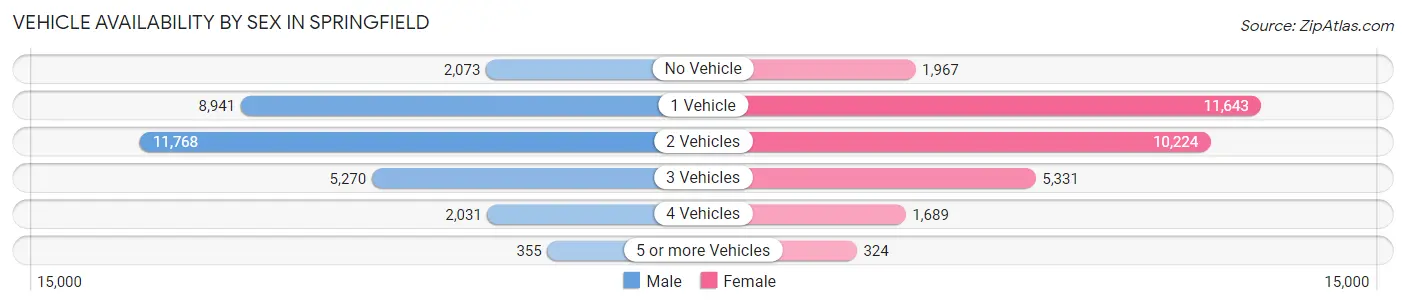
| Vehicles Available | Male | Female |
| No Vehicle | 2,073 (6.8%) | 1,967 (6.3%) |
| 1 Vehicle | 8,941 (29.4%) | 11,643 (37.3%) |
| 2 Vehicles | 11,768 (38.7%) | 10,224 (32.8%) |
| 3 Vehicles | 5,270 (17.3%) | 5,331 (17.1%) |
| 4 Vehicles | 2,031 (6.7%) | 1,689 (5.4%) |
| 5 or more Vehicles | 355 (1.2%) | 324 (1.0%) |
| Total | 30,438 (100.0%) | 31,178 (100.0%) |
Commute Time in Springfield
The most frequently occuring commute durations in Springfield are 15 to 19 minutes (11,241 commuters, 19.4%), 20 to 24 minutes (11,118 commuters, 19.2%), and 10 to 14 minutes (10,851 commuters, 18.8%).
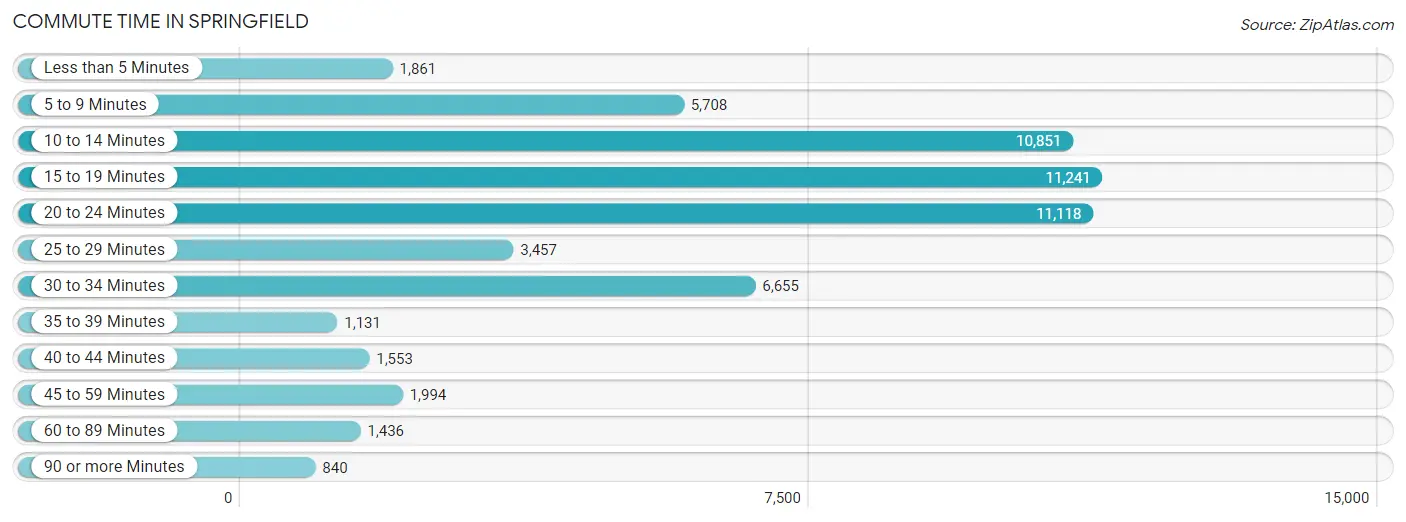
| Commute Time | # Commuters | % Commuters |
| Less than 5 Minutes | 1,861 | 3.2% |
| 5 to 9 Minutes | 5,708 | 9.9% |
| 10 to 14 Minutes | 10,851 | 18.8% |
| 15 to 19 Minutes | 11,241 | 19.4% |
| 20 to 24 Minutes | 11,118 | 19.2% |
| 25 to 29 Minutes | 3,457 | 6.0% |
| 30 to 34 Minutes | 6,655 | 11.5% |
| 35 to 39 Minutes | 1,131 | 2.0% |
| 40 to 44 Minutes | 1,553 | 2.7% |
| 45 to 59 Minutes | 1,994 | 3.5% |
| 60 to 89 Minutes | 1,436 | 2.5% |
| 90 or more Minutes | 840 | 1.5% |
Commute Time by Sex in Springfield
The most common commute times in Springfield are 20 to 24 minutes (5,293 commuters, 18.4%) for males and 15 to 19 minutes (6,168 commuters, 21.2%) for females.
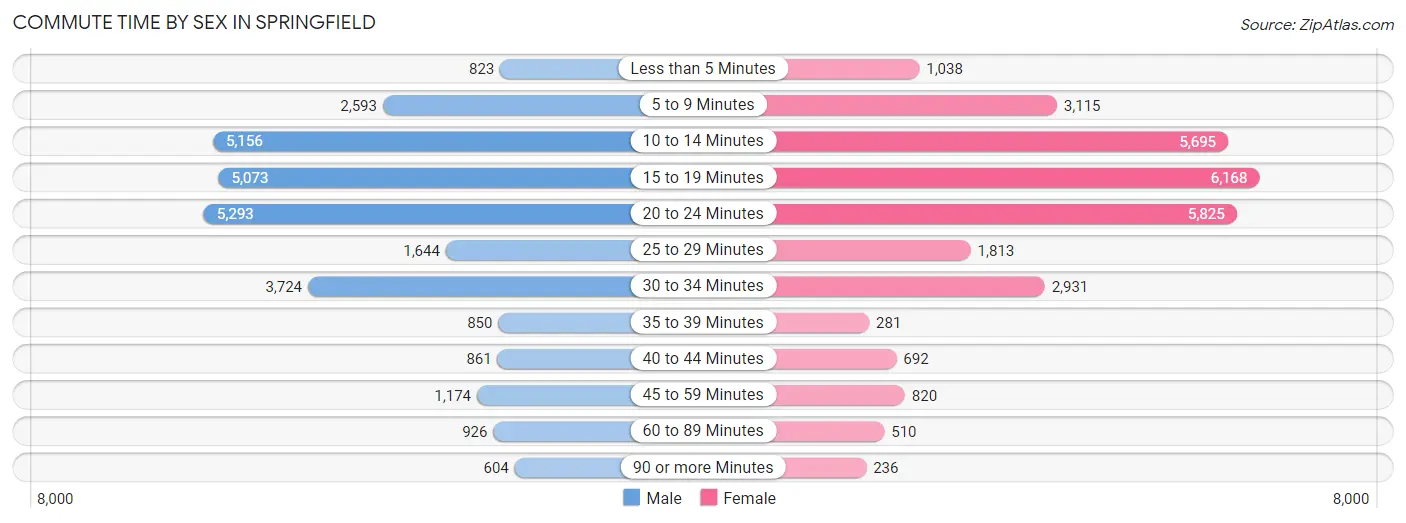
| Commute Time | Male | Female |
| Less than 5 Minutes | 823 (2.9%) | 1,038 (3.6%) |
| 5 to 9 Minutes | 2,593 (9.0%) | 3,115 (10.7%) |
| 10 to 14 Minutes | 5,156 (17.9%) | 5,695 (19.6%) |
| 15 to 19 Minutes | 5,073 (17.7%) | 6,168 (21.2%) |
| 20 to 24 Minutes | 5,293 (18.4%) | 5,825 (20.0%) |
| 25 to 29 Minutes | 1,644 (5.7%) | 1,813 (6.2%) |
| 30 to 34 Minutes | 3,724 (13.0%) | 2,931 (10.1%) |
| 35 to 39 Minutes | 850 (3.0%) | 281 (1.0%) |
| 40 to 44 Minutes | 861 (3.0%) | 692 (2.4%) |
| 45 to 59 Minutes | 1,174 (4.1%) | 820 (2.8%) |
| 60 to 89 Minutes | 926 (3.2%) | 510 (1.8%) |
| 90 or more Minutes | 604 (2.1%) | 236 (0.8%) |
Time of Departure to Work by Sex in Springfield
The most frequent times of departure to work in Springfield are 12:00 PM to 3:59 PM (3,647, 12.7%) for males and 8:00 AM to 8:29 AM (4,107, 14.1%) for females.
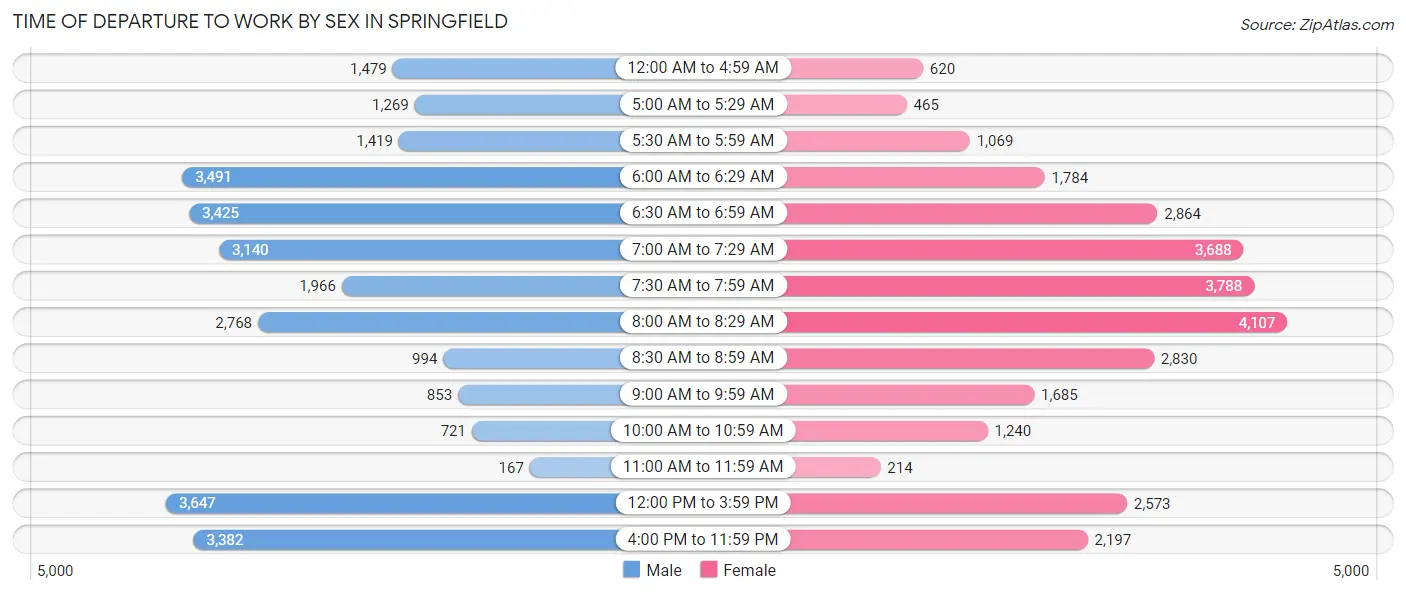
| Time of Departure | Male | Female |
| 12:00 AM to 4:59 AM | 1,479 (5.1%) | 620 (2.1%) |
| 5:00 AM to 5:29 AM | 1,269 (4.4%) | 465 (1.6%) |
| 5:30 AM to 5:59 AM | 1,419 (4.9%) | 1,069 (3.7%) |
| 6:00 AM to 6:29 AM | 3,491 (12.1%) | 1,784 (6.1%) |
| 6:30 AM to 6:59 AM | 3,425 (11.9%) | 2,864 (9.8%) |
| 7:00 AM to 7:29 AM | 3,140 (10.9%) | 3,688 (12.7%) |
| 7:30 AM to 7:59 AM | 1,966 (6.9%) | 3,788 (13.0%) |
| 8:00 AM to 8:29 AM | 2,768 (9.6%) | 4,107 (14.1%) |
| 8:30 AM to 8:59 AM | 994 (3.5%) | 2,830 (9.7%) |
| 9:00 AM to 9:59 AM | 853 (3.0%) | 1,685 (5.8%) |
| 10:00 AM to 10:59 AM | 721 (2.5%) | 1,240 (4.3%) |
| 11:00 AM to 11:59 AM | 167 (0.6%) | 214 (0.7%) |
| 12:00 PM to 3:59 PM | 3,647 (12.7%) | 2,573 (8.8%) |
| 4:00 PM to 11:59 PM | 3,382 (11.8%) | 2,197 (7.5%) |
| Total | 28,721 (100.0%) | 29,124 (100.0%) |
Housing Occupancy in Springfield
Occupancy by Ownership in Springfield
Of the total 58,448 dwellings in Springfield, owner-occupied units account for 27,937 (47.8%), while renter-occupied units make up 30,511 (52.2%).
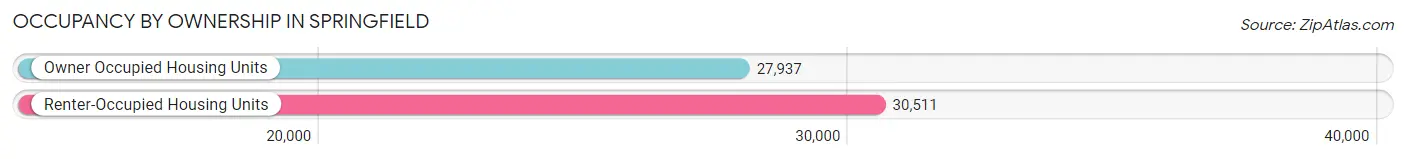
| Occupancy | # Housing Units | % Housing Units |
| Owner Occupied Housing Units | 27,937 | 47.8% |
| Renter-Occupied Housing Units | 30,511 | 52.2% |
| Total Occupied Housing Units | 58,448 | 100.0% |
Occupancy by Household Size in Springfield
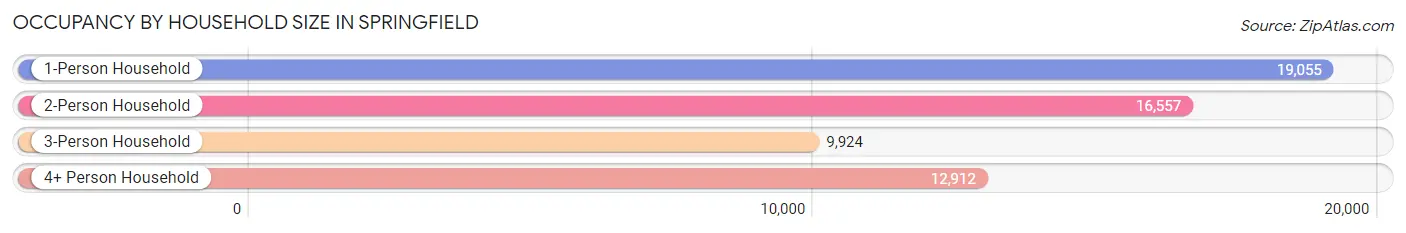
| Household Size | # Housing Units | % Housing Units |
| 1-Person Household | 19,055 | 32.6% |
| 2-Person Household | 16,557 | 28.3% |
| 3-Person Household | 9,924 | 17.0% |
| 4+ Person Household | 12,912 | 22.1% |
| Total Housing Units | 58,448 | 100.0% |
Occupancy by Ownership by Household Size in Springfield
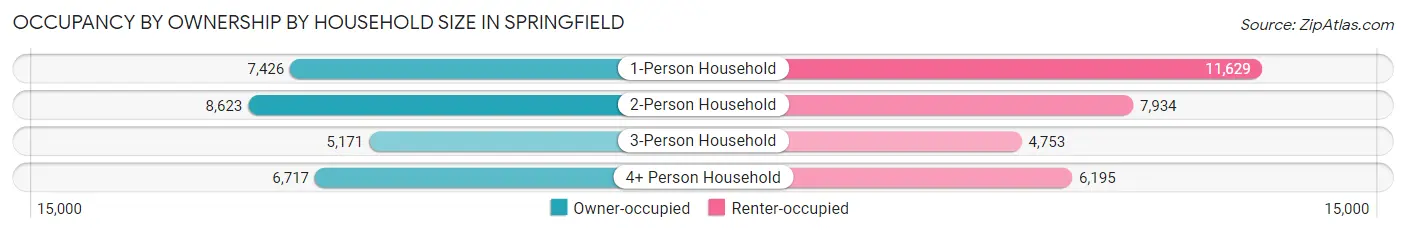
| Household Size | Owner-occupied | Renter-occupied |
| 1-Person Household | 7,426 (39.0%) | 11,629 (61.0%) |
| 2-Person Household | 8,623 (52.1%) | 7,934 (47.9%) |
| 3-Person Household | 5,171 (52.1%) | 4,753 (47.9%) |
| 4+ Person Household | 6,717 (52.0%) | 6,195 (48.0%) |
| Total Housing Units | 27,937 (47.8%) | 30,511 (52.2%) |
Occupancy by Educational Attainment in Springfield
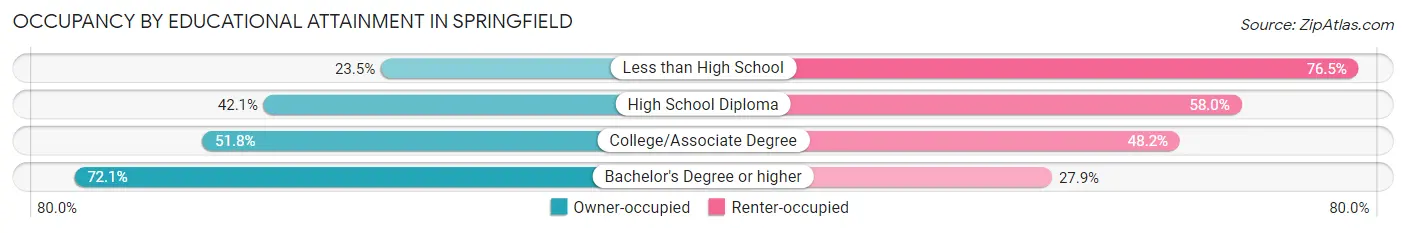
| Household Size | Owner-occupied | Renter-occupied |
| Less than High School | 2,536 (23.5%) | 8,271 (76.5%) |
| High School Diploma | 7,659 (42.0%) | 10,555 (58.0%) |
| College/Associate Degree | 8,890 (51.8%) | 8,263 (48.2%) |
| Bachelor's Degree or higher | 8,852 (72.1%) | 3,422 (27.9%) |
Occupancy by Age of Householder in Springfield
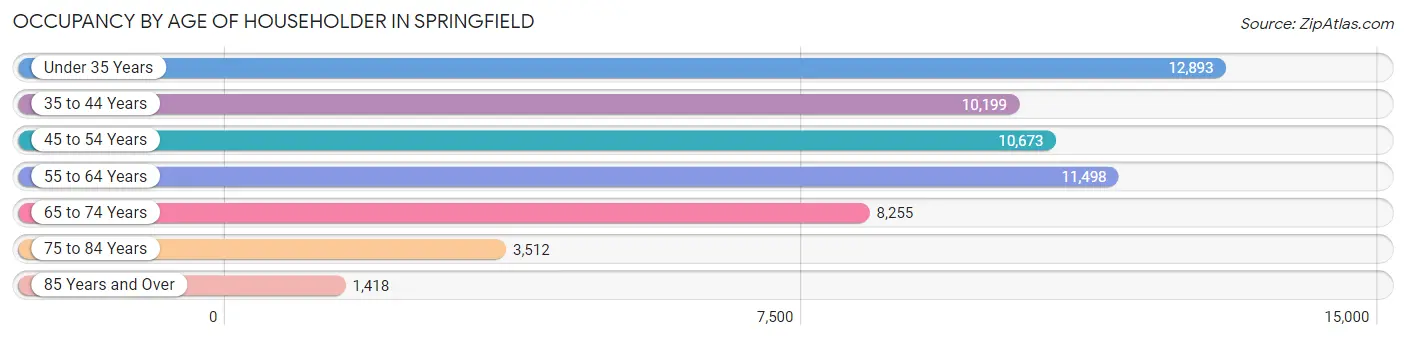
| Age Bracket | # Households | % Households |
| Under 35 Years | 12,893 | 22.1% |
| 35 to 44 Years | 10,199 | 17.4% |
| 45 to 54 Years | 10,673 | 18.3% |
| 55 to 64 Years | 11,498 | 19.7% |
| 65 to 74 Years | 8,255 | 14.1% |
| 75 to 84 Years | 3,512 | 6.0% |
| 85 Years and Over | 1,418 | 2.4% |
| Total | 58,448 | 100.0% |
Housing Finances in Springfield
Median Income by Occupancy in Springfield
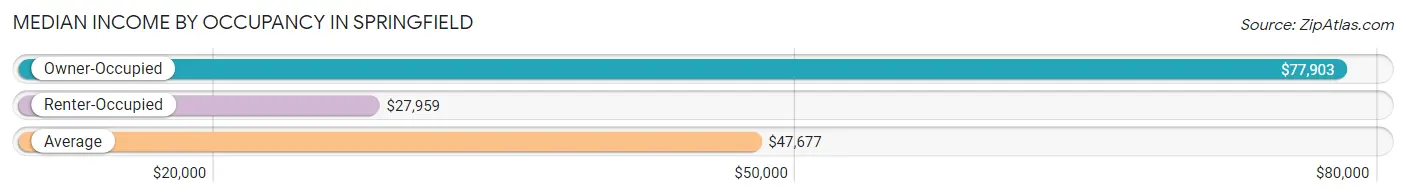
| Occupancy Type | # Households | Median Income |
| Owner-Occupied | 27,937 (47.8%) | $77,903 |
| Renter-Occupied | 30,511 (52.2%) | $27,959 |
| Average | 58,448 (100.0%) | $47,677 |
Occupancy by Householder Income Bracket in Springfield
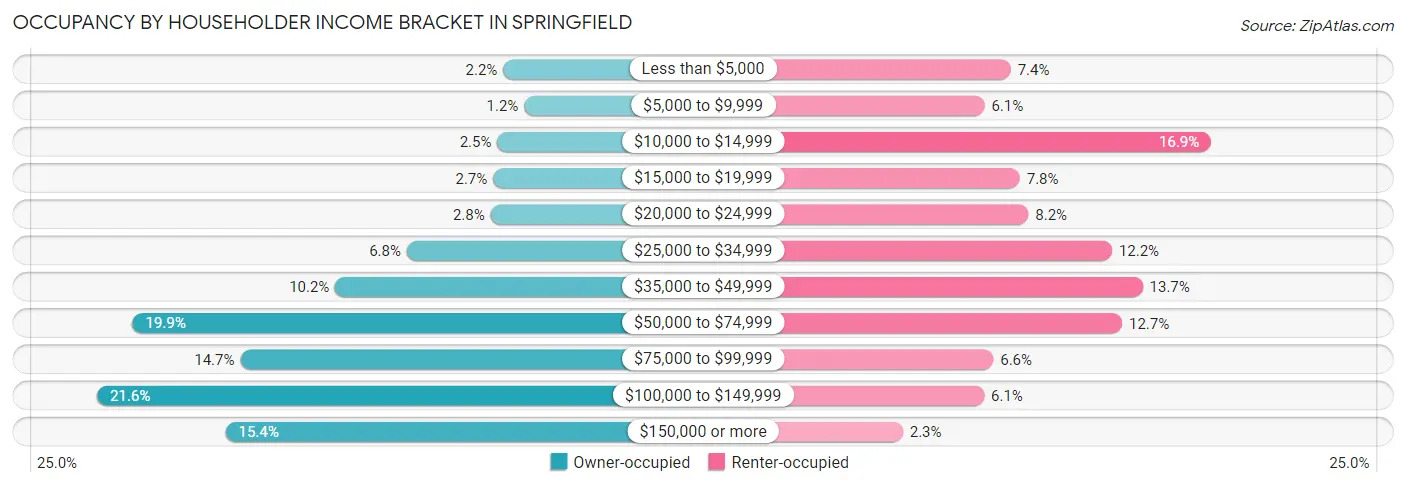
| Income Bracket | Owner-occupied | Renter-occupied |
| Less than $5,000 | 617 (2.2%) | 2,254 (7.4%) |
| $5,000 to $9,999 | 339 (1.2%) | 1,874 (6.1%) |
| $10,000 to $14,999 | 697 (2.5%) | 5,164 (16.9%) |
| $15,000 to $19,999 | 751 (2.7%) | 2,387 (7.8%) |
| $20,000 to $24,999 | 786 (2.8%) | 2,511 (8.2%) |
| $25,000 to $34,999 | 1,900 (6.8%) | 3,724 (12.2%) |
| $35,000 to $49,999 | 2,851 (10.2%) | 4,170 (13.7%) |
| $50,000 to $74,999 | 5,548 (19.9%) | 3,872 (12.7%) |
| $75,000 to $99,999 | 4,116 (14.7%) | 2,001 (6.6%) |
| $100,000 to $149,999 | 6,020 (21.5%) | 1,868 (6.1%) |
| $150,000 or more | 4,312 (15.4%) | 686 (2.2%) |
| Total | 27,937 (100.0%) | 30,511 (100.0%) |
Monthly Housing Cost Tiers in Springfield
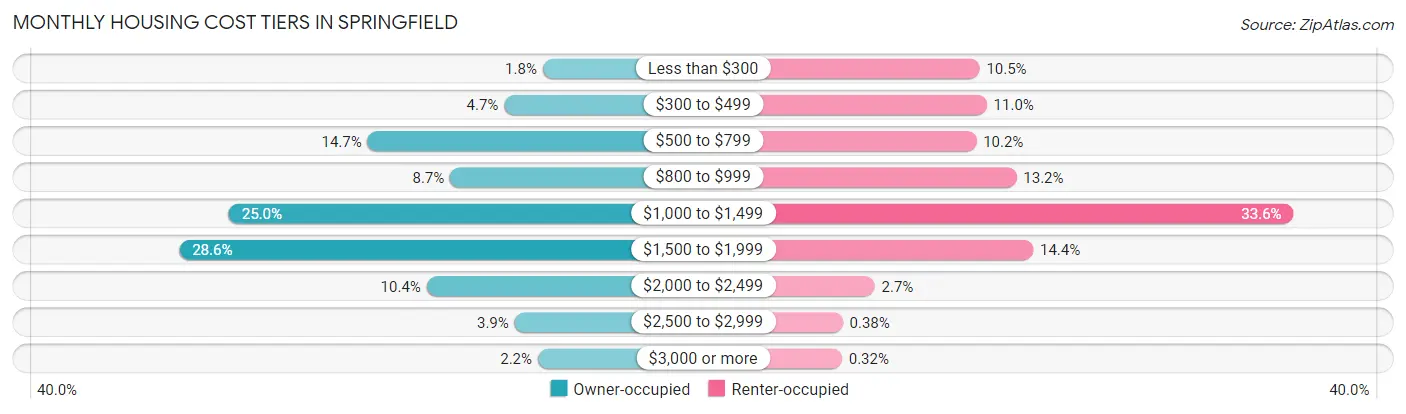
| Monthly Cost | Owner-occupied | Renter-occupied |
| Less than $300 | 514 (1.8%) | 3,190 (10.5%) |
| $300 to $499 | 1,307 (4.7%) | 3,353 (11.0%) |
| $500 to $799 | 4,118 (14.7%) | 3,118 (10.2%) |
| $800 to $999 | 2,420 (8.7%) | 4,021 (13.2%) |
| $1,000 to $1,499 | 6,972 (25.0%) | 10,245 (33.6%) |
| $1,500 to $1,999 | 7,994 (28.6%) | 4,398 (14.4%) |
| $2,000 to $2,499 | 2,904 (10.4%) | 836 (2.7%) |
| $2,500 to $2,999 | 1,093 (3.9%) | 116 (0.4%) |
| $3,000 or more | 615 (2.2%) | 97 (0.3%) |
| Total | 27,937 (100.0%) | 30,511 (100.0%) |
Physical Housing Characteristics in Springfield
Housing Structures in Springfield
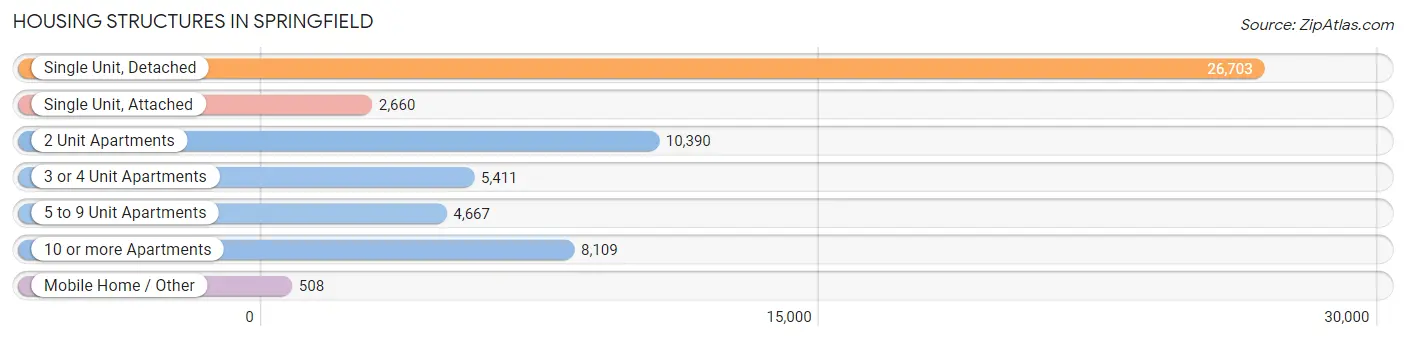
| Structure Type | # Housing Units | % Housing Units |
| Single Unit, Detached | 26,703 | 45.7% |
| Single Unit, Attached | 2,660 | 4.5% |
| 2 Unit Apartments | 10,390 | 17.8% |
| 3 or 4 Unit Apartments | 5,411 | 9.3% |
| 5 to 9 Unit Apartments | 4,667 | 8.0% |
| 10 or more Apartments | 8,109 | 13.9% |
| Mobile Home / Other | 508 | 0.9% |
| Total | 58,448 | 100.0% |
Housing Structures by Occupancy in Springfield
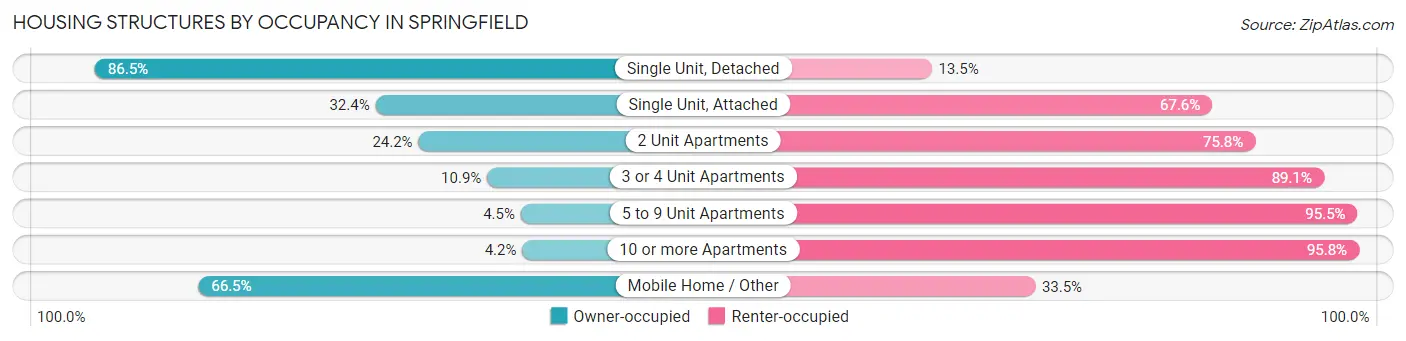
| Structure Type | Owner-occupied | Renter-occupied |
| Single Unit, Detached | 23,087 (86.5%) | 3,616 (13.5%) |
| Single Unit, Attached | 863 (32.4%) | 1,797 (67.6%) |
| 2 Unit Apartments | 2,511 (24.2%) | 7,879 (75.8%) |
| 3 or 4 Unit Apartments | 592 (10.9%) | 4,819 (89.1%) |
| 5 to 9 Unit Apartments | 208 (4.5%) | 4,459 (95.5%) |
| 10 or more Apartments | 338 (4.2%) | 7,771 (95.8%) |
| Mobile Home / Other | 338 (66.5%) | 170 (33.5%) |
| Total | 27,937 (47.8%) | 30,511 (52.2%) |
Housing Structures by Number of Rooms in Springfield
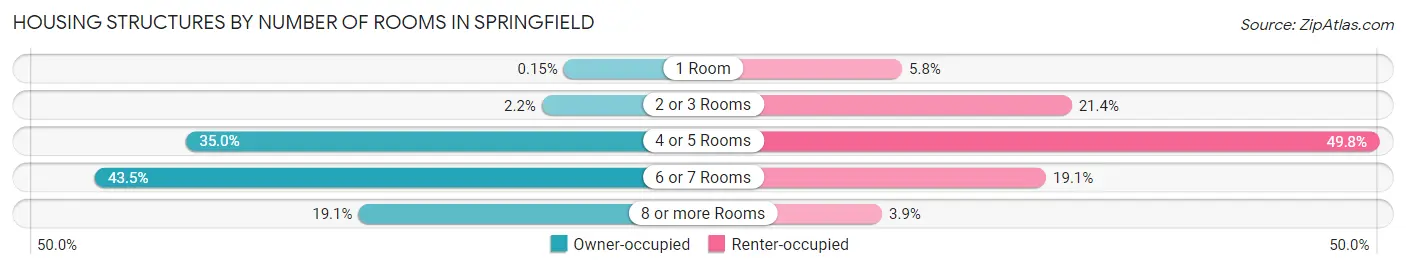
| Number of Rooms | Owner-occupied | Renter-occupied |
| 1 Room | 43 (0.2%) | 1,755 (5.8%) |
| 2 or 3 Rooms | 609 (2.2%) | 6,541 (21.4%) |
| 4 or 5 Rooms | 9,789 (35.0%) | 15,206 (49.8%) |
| 6 or 7 Rooms | 12,148 (43.5%) | 5,818 (19.1%) |
| 8 or more Rooms | 5,348 (19.1%) | 1,191 (3.9%) |
| Total | 27,937 (100.0%) | 30,511 (100.0%) |
Housing Structure by Heating Type in Springfield
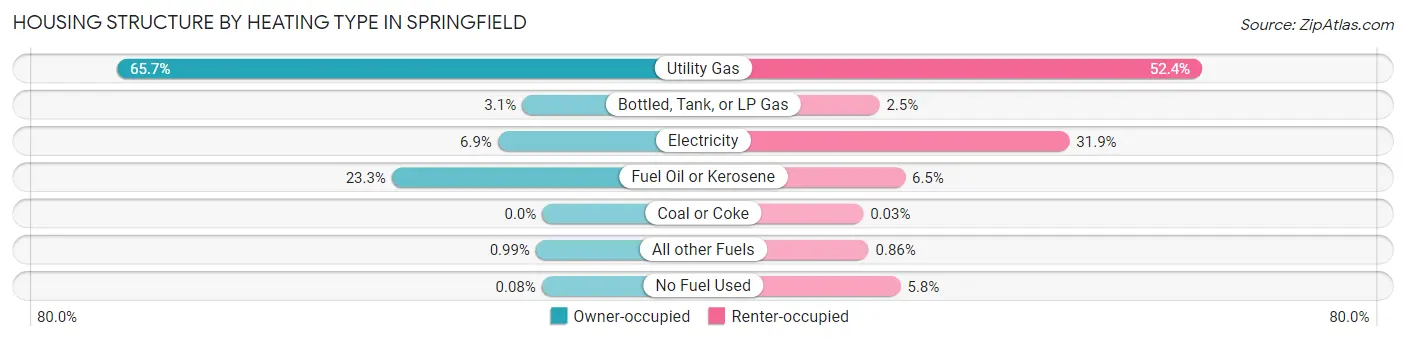
| Heating Type | Owner-occupied | Renter-occupied |
| Utility Gas | 18,358 (65.7%) | 15,983 (52.4%) |
| Bottled, Tank, or LP Gas | 869 (3.1%) | 776 (2.5%) |
| Electricity | 1,916 (6.9%) | 9,733 (31.9%) |
| Fuel Oil or Kerosene | 6,495 (23.3%) | 1,979 (6.5%) |
| Coal or Coke | 0 (0.0%) | 8 (0.0%) |
| All other Fuels | 277 (1.0%) | 262 (0.9%) |
| No Fuel Used | 22 (0.1%) | 1,770 (5.8%) |
| Total | 27,937 (100.0%) | 30,511 (100.0%) |
Household Vehicle Usage in Springfield
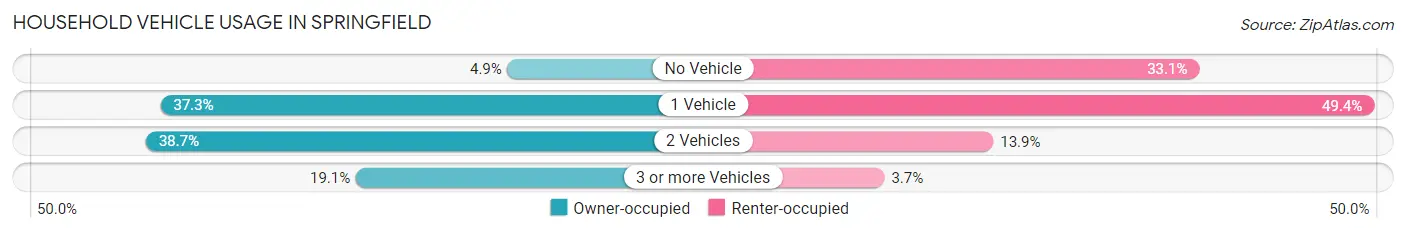
| Vehicles per Household | Owner-occupied | Renter-occupied |
| No Vehicle | 1,373 (4.9%) | 10,090 (33.1%) |
| 1 Vehicle | 10,429 (37.3%) | 15,071 (49.4%) |
| 2 Vehicles | 10,809 (38.7%) | 4,225 (13.9%) |
| 3 or more Vehicles | 5,326 (19.1%) | 1,125 (3.7%) |
| Total | 27,937 (100.0%) | 30,511 (100.0%) |
Real Estate & Mortgages in Springfield
Real Estate and Mortgage Overview in Springfield
| Characteristic | Without Mortgage | With Mortgage |
| Housing Units | 8,241 | 19,696 |
| Median Property Value | $190,100 | $200,900 |
| Median Household Income | $61,861 | $3,429 |
| Monthly Housing Costs | $703 | $607 |
| Real Estate Taxes | $3,325 | $350 |
Property Value by Mortgage Status in Springfield
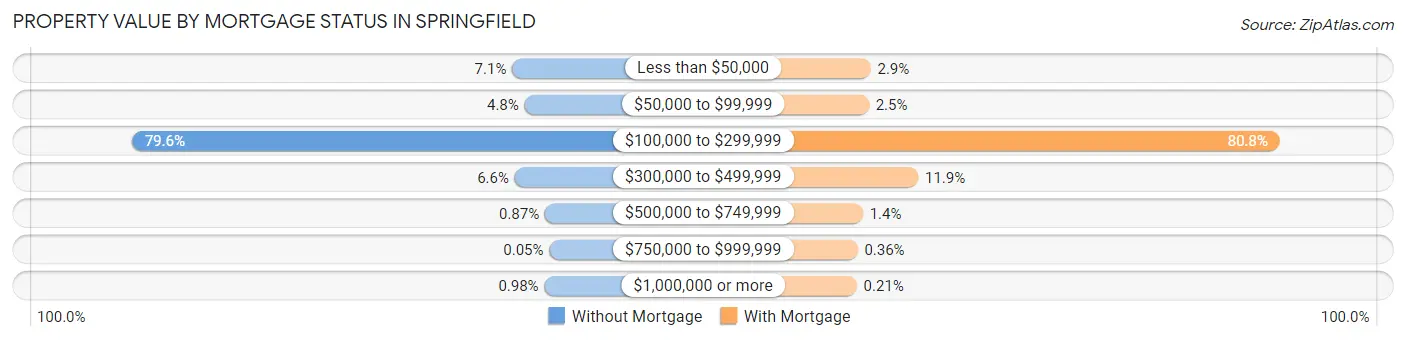
| Property Value | Without Mortgage | With Mortgage |
| Less than $50,000 | 587 (7.1%) | 562 (2.9%) |
| $50,000 to $99,999 | 392 (4.8%) | 492 (2.5%) |
| $100,000 to $299,999 | 6,559 (79.6%) | 15,917 (80.8%) |
| $300,000 to $499,999 | 546 (6.6%) | 2,343 (11.9%) |
| $500,000 to $749,999 | 72 (0.9%) | 270 (1.4%) |
| $750,000 to $999,999 | 4 (0.1%) | 70 (0.4%) |
| $1,000,000 or more | 81 (1.0%) | 42 (0.2%) |
| Total | 8,241 (100.0%) | 19,696 (100.0%) |
Household Income by Mortgage Status in Springfield
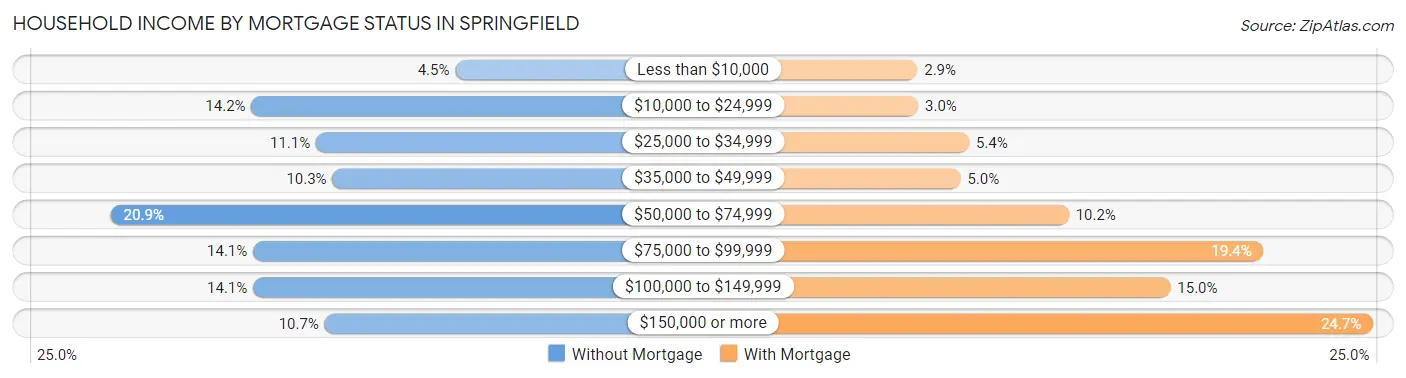
| Household Income | Without Mortgage | With Mortgage |
| Less than $10,000 | 370 (4.5%) | 580 (2.9%) |
| $10,000 to $24,999 | 1,170 (14.2%) | 586 (3.0%) |
| $25,000 to $34,999 | 916 (11.1%) | 1,064 (5.4%) |
| $35,000 to $49,999 | 852 (10.3%) | 984 (5.0%) |
| $50,000 to $74,999 | 1,722 (20.9%) | 1,999 (10.2%) |
| $75,000 to $99,999 | 1,164 (14.1%) | 3,826 (19.4%) |
| $100,000 to $149,999 | 1,164 (14.1%) | 2,952 (15.0%) |
| $150,000 or more | 883 (10.7%) | 4,856 (24.6%) |
| Total | 8,241 (100.0%) | 19,696 (100.0%) |
Property Value to Household Income Ratio in Springfield
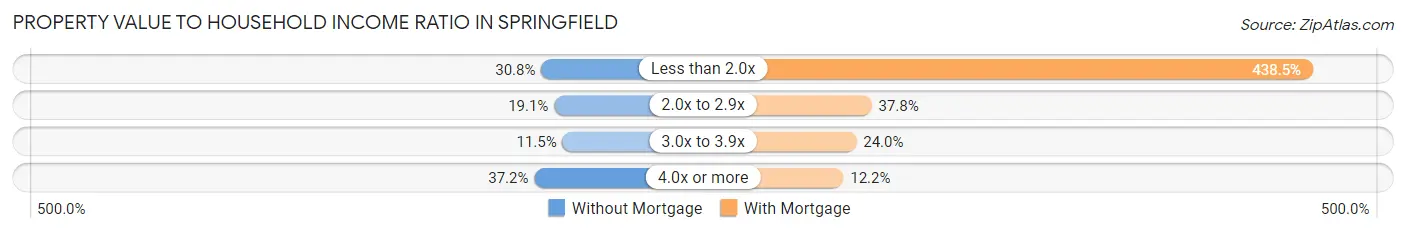
| Value-to-Income Ratio | Without Mortgage | With Mortgage |
| Less than 2.0x | 2,539 (30.8%) | 86,375 (438.5%) |
| 2.0x to 2.9x | 1,574 (19.1%) | 7,442 (37.8%) |
| 3.0x to 3.9x | 946 (11.5%) | 4,718 (23.9%) |
| 4.0x or more | 3,065 (37.2%) | 2,393 (12.1%) |
| Total | 8,241 (100.0%) | 19,696 (100.0%) |
Real Estate Taxes by Mortgage Status in Springfield
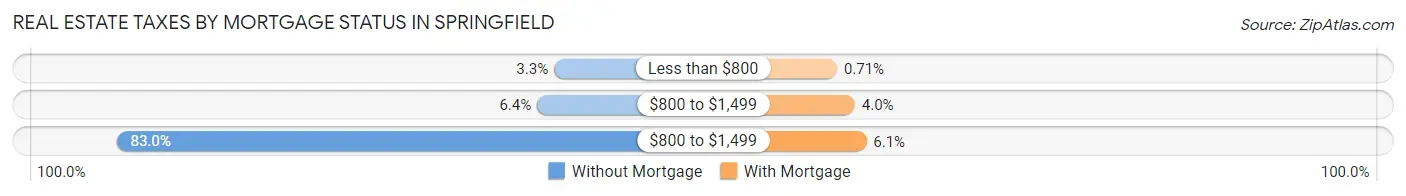
| Property Taxes | Without Mortgage | With Mortgage |
| Less than $800 | 273 (3.3%) | 140 (0.7%) |
| $800 to $1,499 | 528 (6.4%) | 783 (4.0%) |
| $800 to $1,499 | 6,841 (83.0%) | 1,198 (6.1%) |
| Total | 8,241 (100.0%) | 19,696 (100.0%) |
Health & Disability in Springfield
Health Insurance Coverage by Age in Springfield
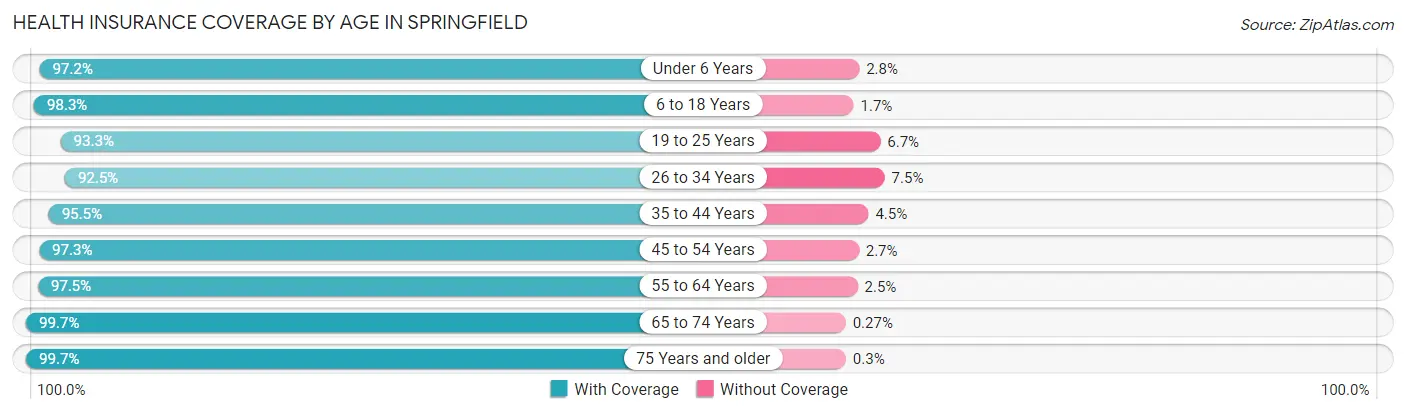
| Age Bracket | With Coverage | Without Coverage |
| Under 6 Years | 12,187 (97.2%) | 348 (2.8%) |
| 6 to 18 Years | 27,561 (98.3%) | 488 (1.7%) |
| 19 to 25 Years | 18,415 (93.3%) | 1,328 (6.7%) |
| 26 to 34 Years | 19,163 (92.5%) | 1,561 (7.5%) |
| 35 to 44 Years | 17,554 (95.5%) | 830 (4.5%) |
| 45 to 54 Years | 16,818 (97.3%) | 466 (2.7%) |
| 55 to 64 Years | 17,587 (97.5%) | 447 (2.5%) |
| 65 to 74 Years | 12,103 (99.7%) | 33 (0.3%) |
| 75 Years and older | 7,662 (99.7%) | 23 (0.3%) |
| Total | 149,050 (96.4%) | 5,524 (3.6%) |
Health Insurance Coverage by Citizenship Status in Springfield
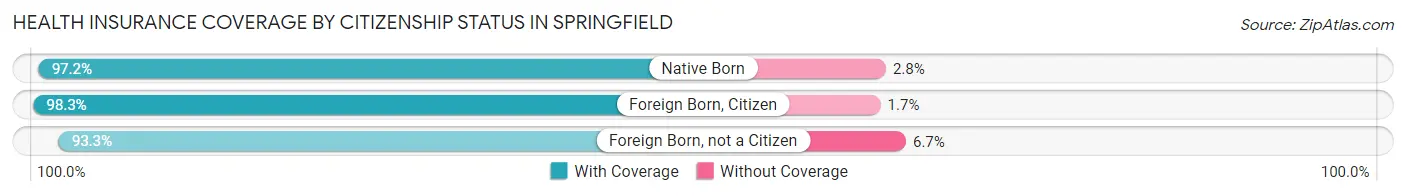
| Citizenship Status | With Coverage | Without Coverage |
| Native Born | 12,187 (97.2%) | 348 (2.8%) |
| Foreign Born, Citizen | 27,561 (98.3%) | 488 (1.7%) |
| Foreign Born, not a Citizen | 18,415 (93.3%) | 1,328 (6.7%) |
Health Insurance Coverage by Household Income in Springfield
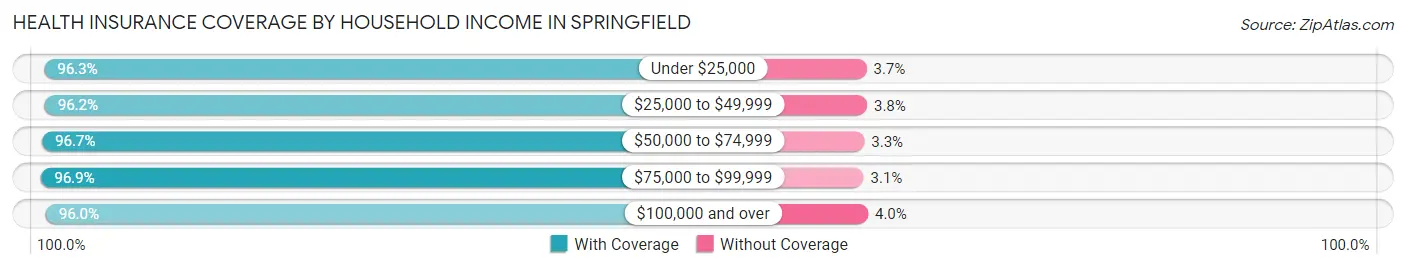
| Household Income | With Coverage | Without Coverage |
| Under $25,000 | 31,578 (96.3%) | 1,214 (3.7%) |
| $25,000 to $49,999 | 29,874 (96.2%) | 1,178 (3.8%) |
| $50,000 to $74,999 | 23,940 (96.7%) | 814 (3.3%) |
| $75,000 to $99,999 | 17,005 (96.9%) | 552 (3.1%) |
| $100,000 and over | 41,837 (96.0%) | 1,735 (4.0%) |
Public vs Private Health Insurance Coverage by Age in Springfield
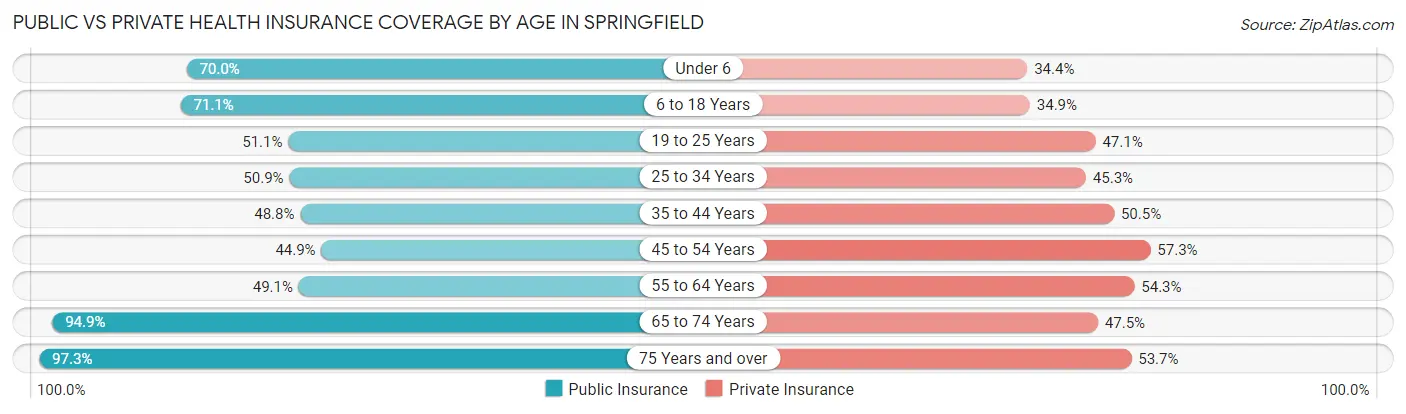
| Age Bracket | Public Insurance | Private Insurance |
| Under 6 | 8,768 (70.0%) | 4,315 (34.4%) |
| 6 to 18 Years | 19,935 (71.1%) | 9,791 (34.9%) |
| 19 to 25 Years | 10,080 (51.1%) | 9,297 (47.1%) |
| 25 to 34 Years | 10,539 (50.8%) | 9,391 (45.3%) |
| 35 to 44 Years | 8,975 (48.8%) | 9,288 (50.5%) |
| 45 to 54 Years | 7,760 (44.9%) | 9,900 (57.3%) |
| 55 to 64 Years | 8,855 (49.1%) | 9,792 (54.3%) |
| 65 to 74 Years | 11,514 (94.9%) | 5,769 (47.5%) |
| 75 Years and over | 7,477 (97.3%) | 4,129 (53.7%) |
| Total | 93,903 (60.8%) | 71,672 (46.4%) |
Disability Status by Sex by Age in Springfield
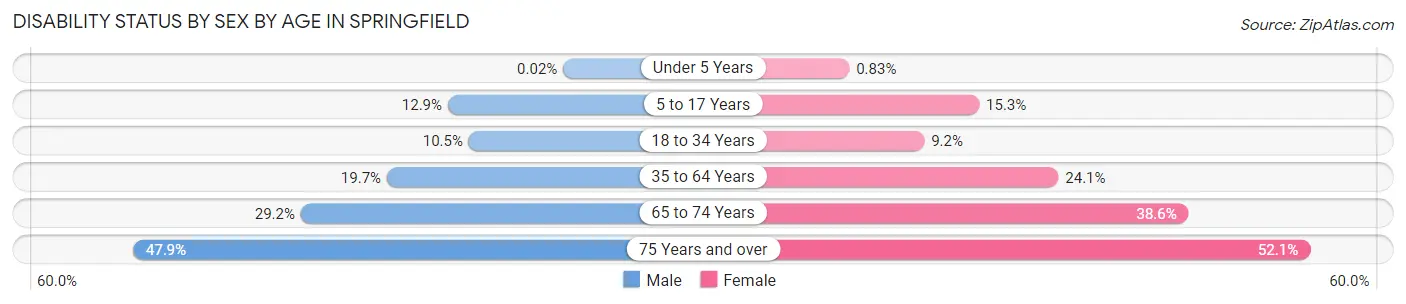
| Age Bracket | Male | Female |
| Under 5 Years | 1 (0.0%) | 42 (0.8%) |
| 5 to 17 Years | 1,795 (12.9%) | 2,048 (15.3%) |
| 18 to 34 Years | 2,327 (10.5%) | 1,940 (9.2%) |
| 35 to 64 Years | 4,800 (19.7%) | 7,061 (24.1%) |
| 65 to 74 Years | 1,651 (29.2%) | 2,506 (38.6%) |
| 75 Years and over | 1,393 (47.9%) | 2,492 (52.1%) |
Disability Class by Sex by Age in Springfield
Disability Class: Hearing Difficulty
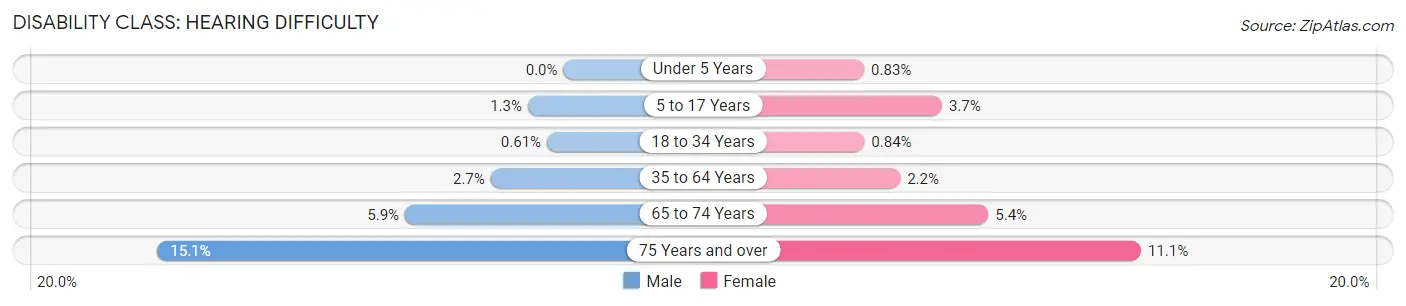
| Age Bracket | Male | Female |
| Under 5 Years | 0 (0.0%) | 42 (0.8%) |
| 5 to 17 Years | 184 (1.3%) | 498 (3.7%) |
| 18 to 34 Years | 134 (0.6%) | 178 (0.8%) |
| 35 to 64 Years | 660 (2.7%) | 636 (2.2%) |
| 65 to 74 Years | 332 (5.9%) | 353 (5.4%) |
| 75 Years and over | 438 (15.1%) | 531 (11.1%) |
Disability Class: Vision Difficulty
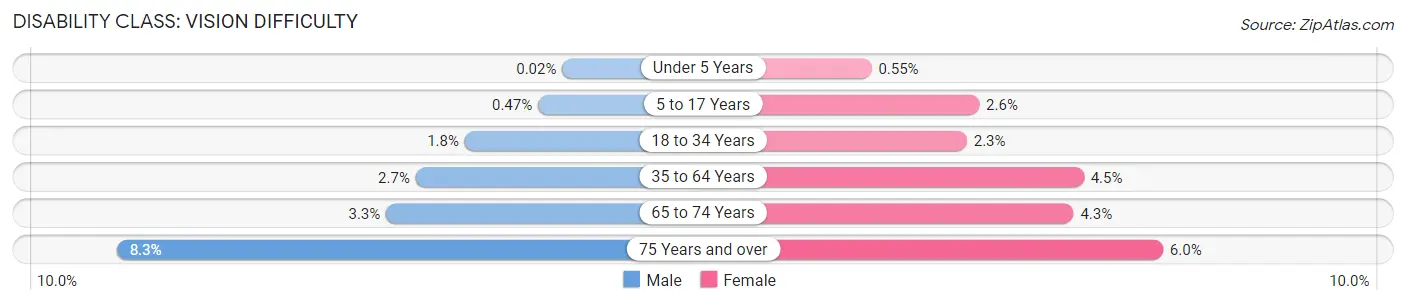
| Age Bracket | Male | Female |
| Under 5 Years | 1 (0.0%) | 28 (0.5%) |
| 5 to 17 Years | 65 (0.5%) | 341 (2.5%) |
| 18 to 34 Years | 404 (1.8%) | 490 (2.3%) |
| 35 to 64 Years | 669 (2.7%) | 1,314 (4.5%) |
| 65 to 74 Years | 186 (3.3%) | 279 (4.3%) |
| 75 Years and over | 241 (8.3%) | 285 (6.0%) |
Disability Class: Cognitive Difficulty
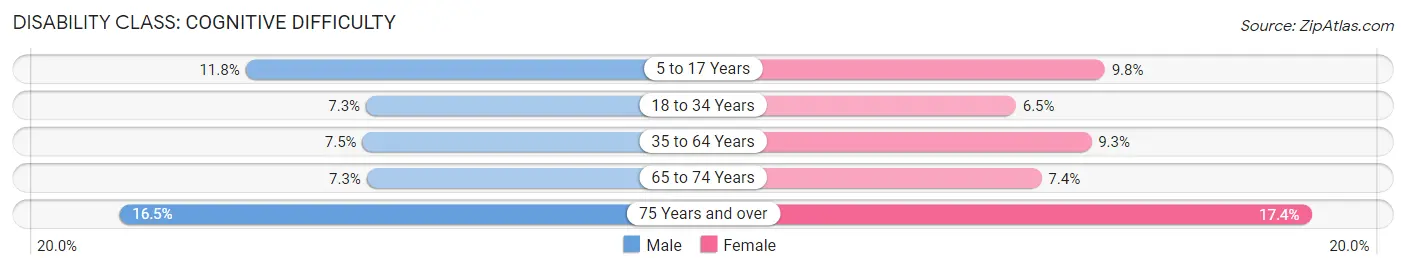
| Age Bracket | Male | Female |
| 5 to 17 Years | 1,647 (11.8%) | 1,307 (9.8%) |
| 18 to 34 Years | 1,620 (7.3%) | 1,364 (6.5%) |
| 35 to 64 Years | 1,822 (7.5%) | 2,711 (9.3%) |
| 65 to 74 Years | 412 (7.3%) | 481 (7.4%) |
| 75 Years and over | 479 (16.5%) | 833 (17.4%) |
Disability Class: Ambulatory Difficulty
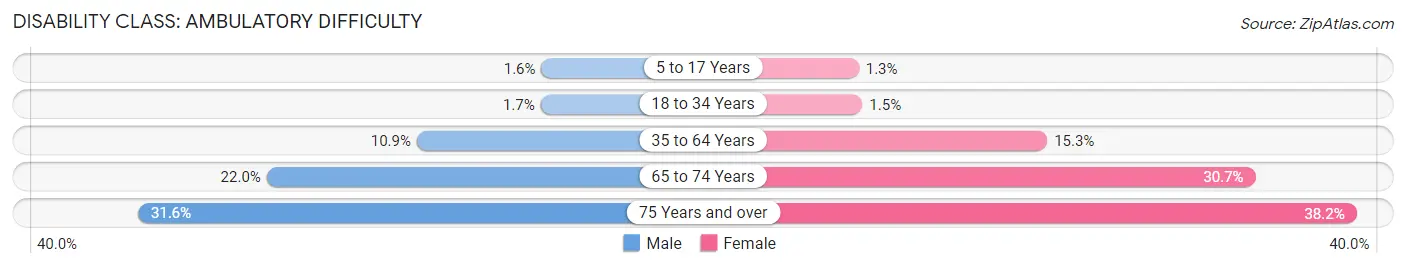
| Age Bracket | Male | Female |
| 5 to 17 Years | 227 (1.6%) | 169 (1.3%) |
| 18 to 34 Years | 374 (1.7%) | 324 (1.5%) |
| 35 to 64 Years | 2,657 (10.9%) | 4,466 (15.2%) |
| 65 to 74 Years | 1,244 (22.0%) | 1,993 (30.7%) |
| 75 Years and over | 918 (31.6%) | 1,826 (38.2%) |
Disability Class: Self-Care Difficulty
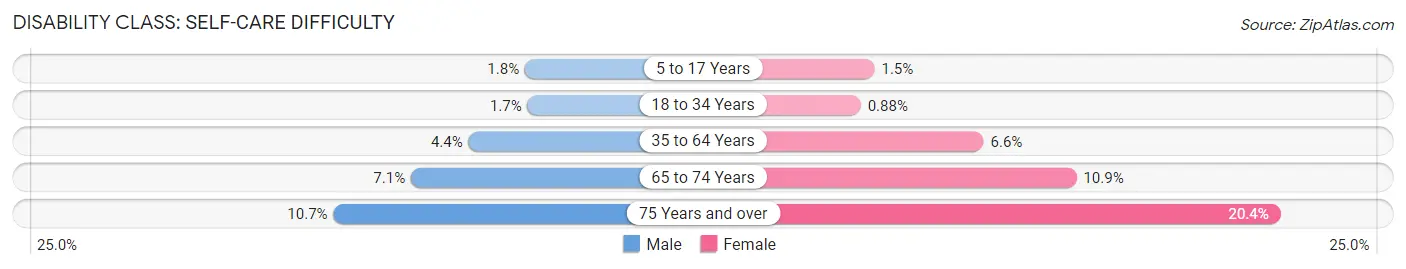
| Age Bracket | Male | Female |
| 5 to 17 Years | 249 (1.8%) | 204 (1.5%) |
| 18 to 34 Years | 366 (1.7%) | 185 (0.9%) |
| 35 to 64 Years | 1,074 (4.4%) | 1,928 (6.6%) |
| 65 to 74 Years | 399 (7.1%) | 707 (10.9%) |
| 75 Years and over | 310 (10.7%) | 973 (20.4%) |
Technology Access in Springfield
Computing Device Access in Springfield
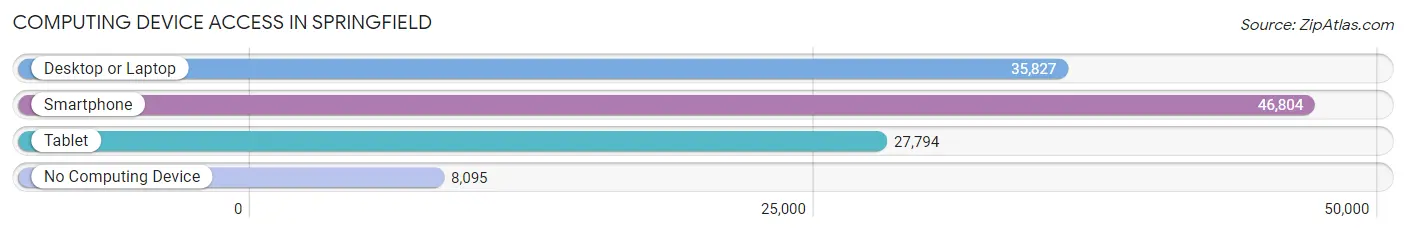
| Device Type | # Households | % Households |
| Desktop or Laptop | 35,827 | 61.3% |
| Smartphone | 46,804 | 80.1% |
| Tablet | 27,794 | 47.5% |
| No Computing Device | 8,095 | 13.9% |
| Total | 58,448 | 100.0% |
Internet Access in Springfield
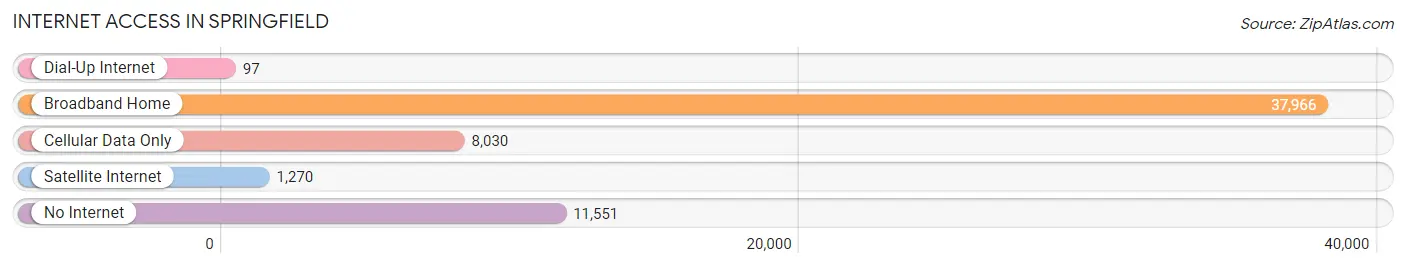
| Internet Type | # Households | % Households |
| Dial-Up Internet | 97 | 0.2% |
| Broadband Home | 37,966 | 65.0% |
| Cellular Data Only | 8,030 | 13.7% |
| Satellite Internet | 1,270 | 2.2% |
| No Internet | 11,551 | 19.8% |
| Total | 58,448 | 100.0% |
Springfield Summary
Springfield, Massachusetts is the third largest city in the state and the largest city in Western Massachusetts. It is located in Hampden County and is the county seat. Springfield is situated on the Connecticut River and is bordered by Chicopee, Longmeadow, East Longmeadow, Wilbraham, and Agawam. The city is known for its rich history, diverse economy, and vibrant culture.
Geography
Springfield is located in the Connecticut River Valley, which is part of the Pioneer Valley region of Massachusetts. The city is situated on the eastern bank of the Connecticut River, and is bordered by the towns of Chicopee, Longmeadow, East Longmeadow, Wilbraham, and Agawam. The city is located approximately 90 miles west of Boston and is part of the Springfield Metropolitan Statistical Area. The city has a total area of 33.4 square miles, of which 32.9 square miles is land and 0.5 square miles is water.
History
Springfield was first settled in 1636 by William Pynchon, who established the settlement of Agawam Plantation. The settlement was later renamed Springfield in 1641, and was incorporated as a town in 1752. During the Revolutionary War, Springfield was the site of the first battle of the American Revolution, the Battle of Springfield. The city was also the site of the first armory in the United States, which was established in 1777.
In the 19th century, Springfield became an important industrial center, and was home to several major companies, including Smith & Wesson, Indian Motorcycle, and Rolls-Royce. The city was also the birthplace of basketball, which was invented by James Naismith in 1891.
Economy
Springfield has a diverse economy, with a mix of manufacturing, healthcare, education, and government services. The city is home to several major employers, including Baystate Health, Smith & Wesson, MassMutual, and the U.S. Army Corps of Engineers. The city is also home to several colleges and universities, including Springfield College, Western New England University, and American International College.
Demographics
As of the 2010 census, Springfield had a population of 153,060, making it the third largest city in Massachusetts. The city has a population density of 4,541 people per square mile. The racial makeup of the city is 63.2% White, 22.3% African American, 0.4% Native American, 4.2% Asian, 0.1% Pacific Islander, 5.2% from other races, and 4.6% from two or more races. The median household income in Springfield is $37,837, and the median family income is $45,837. The city has a poverty rate of 28.2%.
Conclusion
Springfield, Massachusetts is a vibrant city with a rich history, diverse economy, and vibrant culture. The city is home to several major employers, including Baystate Health, Smith & Wesson, MassMutual, and the U.S. Army Corps of Engineers. The city also has a diverse population, with a median household income of $37,837 and a poverty rate of 28.2%. Springfield is an important part of the Pioneer Valley region of Massachusetts, and is an important economic and cultural center in the state.
Common Questions
What is Per Capita Income in Springfield?
Per Capita income in Springfield is $25,669.
What is the Median Family Income in Springfield?
Median Family Income in Springfield is $61,936.
What is the Median Household income in Springfield?
Median Household Income in Springfield is $47,677.
What is Income or Wage Gap in Springfield?
Income or Wage Gap in Springfield is 20.7%.
Women in Springfield earn 79.3 cents for every dollar earned by a man.
What is Family Income Deficit in Springfield?
Family Income Deficit in Springfield is $10,313.
Families that are below poverty line in Springfield earn $10,313 less on average than the poverty threshold level.
What is Inequality or Gini Index in Springfield?
Inequality or Gini Index in Springfield is 0.48.
What is the Total Population of Springfield?
Total Population of Springfield is 155,305.
What is the Total Male Population of Springfield?
Total Male Population of Springfield is 74,785.
What is the Total Female Population of Springfield?
Total Female Population of Springfield is 80,520.
What is the Ratio of Males per 100 Females in Springfield?
There are 92.88 Males per 100 Females in Springfield.
What is the Ratio of Females per 100 Males in Springfield?
There are 107.67 Females per 100 Males in Springfield.
What is the Median Population Age in Springfield?
Median Population Age in Springfield is 33.4 Years.
What is the Average Family Size in Springfield
Average Family Size in Springfield is 3.3 People.
What is the Average Household Size in Springfield
Average Household Size in Springfield is 2.6 People.
How Large is the Labor Force in Springfield?
There are 69,535 People in the Labor Forcein in Springfield.
What is the Percentage of People in the Labor Force in Springfield?
57.3% of People are in the Labor Force in Springfield.
What is the Unemployment Rate in Springfield?
Unemployment Rate in Springfield is 8.7%.