Brockton, MA Map & Demographics
Brockton Map
Brockton Overview
$34,180
PER CAPITA INCOME
$85,100
AVG FAMILY INCOME
$74,016
AVG HOUSEHOLD INCOME
27.2%
WAGE / INCOME GAP [ % ]
72.8¢/ $1
WAGE / INCOME GAP [ $ ]
$10,762
FAMILY INCOME DEFICIT
0.46
INEQUALITY / GINI INDEX
104,713
TOTAL POPULATION
51,194
MALE POPULATION
53,519
FEMALE POPULATION
95.66
MALES / 100 FEMALES
104.54
FEMALES / 100 MALES
36.4
MEDIAN AGE
3.4
AVG FAMILY SIZE
2.9
AVG HOUSEHOLD SIZE
56,192
LABOR FORCE [ PEOPLE ]
68.7%
PERCENT IN LABOR FORCE
8.2%
UNEMPLOYMENT RATE
Income in Brockton
Income Overview in Brockton
Per Capita Income in Brockton is $34,180, while median incomes of families and households are $85,100 and $74,016 respectively.
| Characteristic | Number | Measure |
| Per Capita Income | 104,713 | $34,180 |
| Median Family Income | 25,313 | $85,100 |
| Mean Family Income | 25,313 | $112,177 |
| Median Household Income | 35,489 | $74,016 |
| Mean Household Income | 35,489 | $99,418 |
| Income Deficit | 25,313 | $10,762 |
| Wage / Income Gap (%) | 104,713 | 27.20% |
| Wage / Income Gap ($) | 104,713 | 72.80¢ per $1 |
| Gini / Inequality Index | 104,713 | 0.46 |
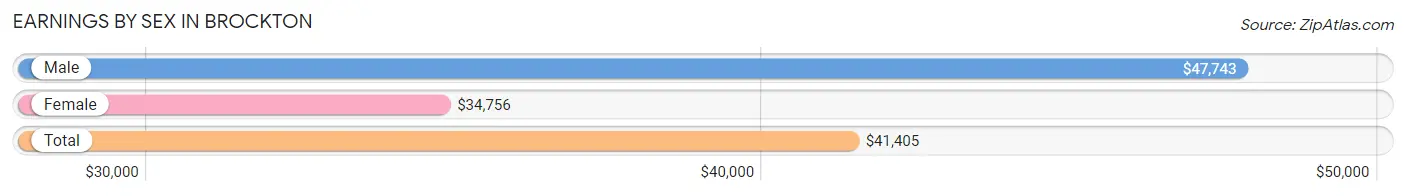
Earnings by Sex in Brockton
Average Earnings in Brockton are $41,405, $47,743 for men and $34,756 for women, a difference of 27.2%.
| Sex | Number | Average Earnings |
| Male | 28,057 (49.8%) | $47,743 |
| Female | 28,283 (50.2%) | $34,756 |
| Total | 56,340 (100.0%) | $41,405 |
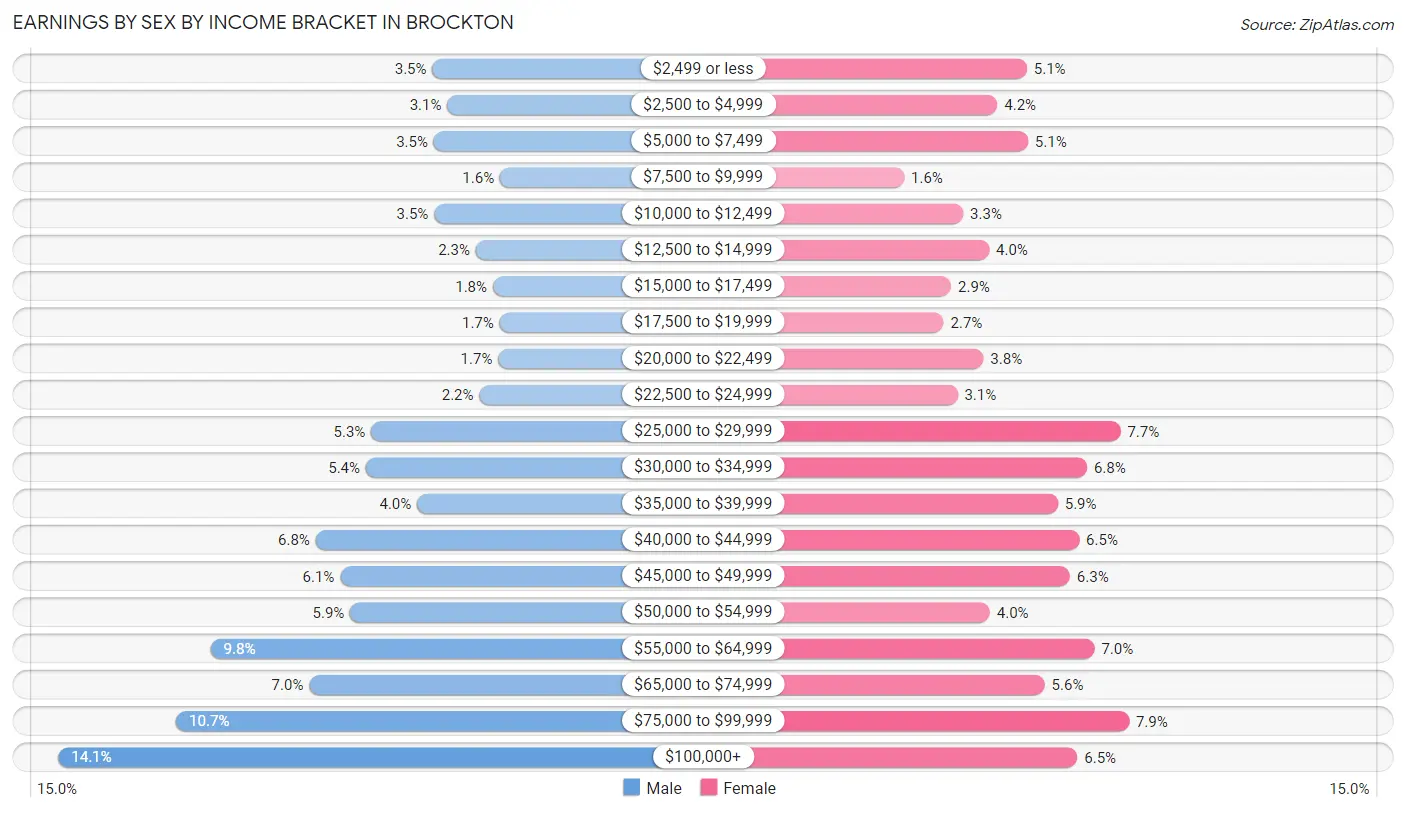
Earnings by Sex by Income Bracket in Brockton
The most common earnings brackets in Brockton are $100,000+ for men (3,943 | 14.1%) and $75,000 to $99,999 for women (2,243 | 7.9%).
| Income | Male | Female |
| $2,499 or less | 992 (3.5%) | 1,432 (5.1%) |
| $2,500 to $4,999 | 874 (3.1%) | 1,197 (4.2%) |
| $5,000 to $7,499 | 983 (3.5%) | 1,440 (5.1%) |
| $7,500 to $9,999 | 460 (1.6%) | 456 (1.6%) |
| $10,000 to $12,499 | 980 (3.5%) | 926 (3.3%) |
| $12,500 to $14,999 | 650 (2.3%) | 1,131 (4.0%) |
| $15,000 to $17,499 | 517 (1.8%) | 829 (2.9%) |
| $17,500 to $19,999 | 463 (1.7%) | 770 (2.7%) |
| $20,000 to $22,499 | 474 (1.7%) | 1,087 (3.8%) |
| $22,500 to $24,999 | 624 (2.2%) | 881 (3.1%) |
| $25,000 to $29,999 | 1,475 (5.3%) | 2,175 (7.7%) |
| $30,000 to $34,999 | 1,518 (5.4%) | 1,909 (6.8%) |
| $35,000 to $39,999 | 1,113 (4.0%) | 1,677 (5.9%) |
| $40,000 to $44,999 | 1,914 (6.8%) | 1,846 (6.5%) |
| $45,000 to $49,999 | 1,720 (6.1%) | 1,772 (6.3%) |
| $50,000 to $54,999 | 1,640 (5.9%) | 1,137 (4.0%) |
| $55,000 to $64,999 | 2,740 (9.8%) | 1,969 (7.0%) |
| $65,000 to $74,999 | 1,964 (7.0%) | 1,572 (5.6%) |
| $75,000 to $99,999 | 3,013 (10.7%) | 2,243 (7.9%) |
| $100,000+ | 3,943 (14.1%) | 1,834 (6.5%) |
| Total | 28,057 (100.0%) | 28,283 (100.0%) |
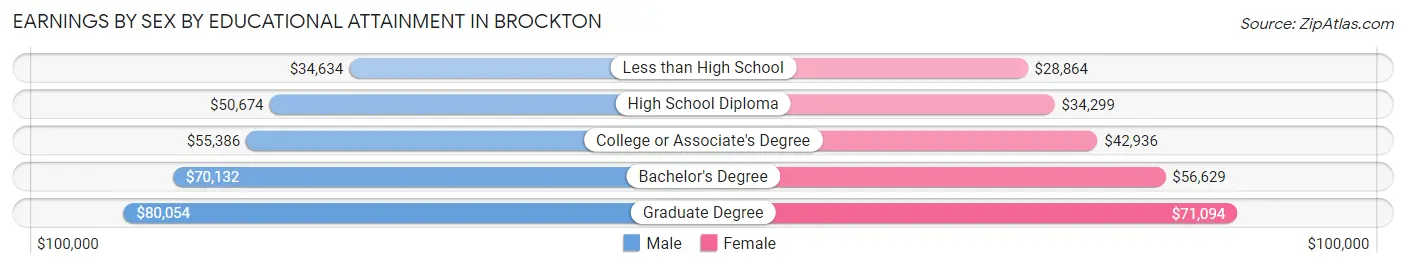
Earnings by Sex by Educational Attainment in Brockton
Average earnings in Brockton are $53,067 for men and $40,951 for women, a difference of 22.8%. Men with an educational attainment of graduate degree enjoy the highest average annual earnings of $80,054, while those with less than high school education earn the least with $34,634. Women with an educational attainment of graduate degree earn the most with the average annual earnings of $71,094, while those with less than high school education have the smallest earnings of $28,864.
| Educational Attainment | Male Income | Female Income |
| Less than High School | $34,634 | $28,864 |
| High School Diploma | $50,674 | $34,299 |
| College or Associate's Degree | $55,386 | $42,936 |
| Bachelor's Degree | $70,132 | $56,629 |
| Graduate Degree | $80,054 | $71,094 |
| Total | $53,067 | $40,951 |
Family Income in Brockton
Family Income Brackets in Brockton
According to the Brockton family income data, there are 5,139 families falling into the $100,000 to $149,999 income range, which is the most common income bracket and makes up 20.3% of all families. Conversely, the $10,000 to $14,999 income bracket is the least frequent group with only 506 families (2.0%) belonging to this category.
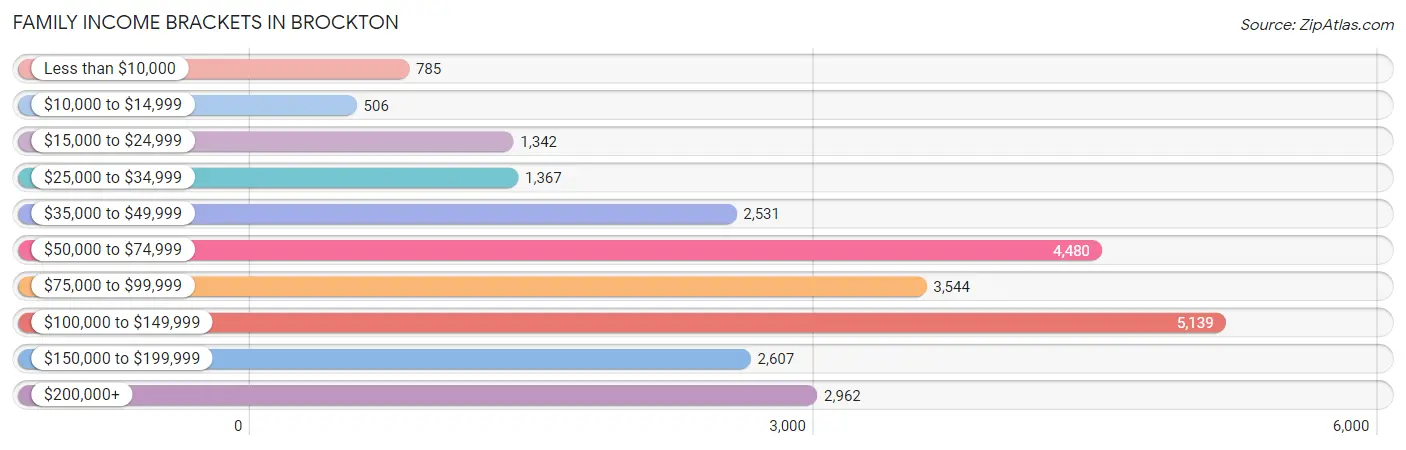
| Income Bracket | # Families | % Families |
| Less than $10,000 | 785 | 3.1% |
| $10,000 to $14,999 | 506 | 2.0% |
| $15,000 to $24,999 | 1,342 | 5.3% |
| $25,000 to $34,999 | 1,367 | 5.4% |
| $35,000 to $49,999 | 2,531 | 10.0% |
| $50,000 to $74,999 | 4,480 | 17.7% |
| $75,000 to $99,999 | 3,544 | 14.0% |
| $100,000 to $149,999 | 5,139 | 20.3% |
| $150,000 to $199,999 | 2,607 | 10.3% |
| $200,000+ | 2,962 | 11.7% |
Family Income by Famaliy Size in Brockton
7+ person families (1,094 | 4.3%) account for the highest median family income in Brockton with $121,512 per family, while 2-person families (8,207 | 32.4%) have the highest median income of $31,036 per family member.
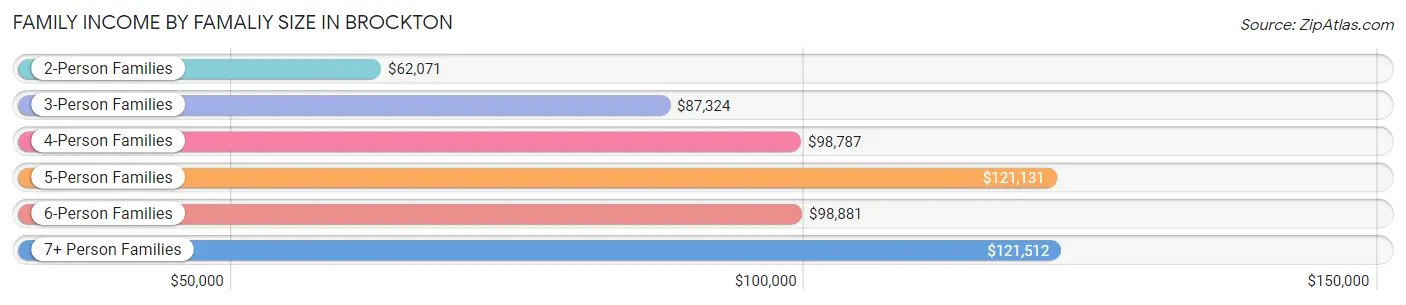
| Income Bracket | # Families | Median Income |
| 2-Person Families | 8,207 (32.4%) | $62,071 |
| 3-Person Families | 7,199 (28.4%) | $87,324 |
| 4-Person Families | 4,972 (19.6%) | $98,787 |
| 5-Person Families | 2,983 (11.8%) | $121,131 |
| 6-Person Families | 858 (3.4%) | $98,881 |
| 7+ Person Families | 1,094 (4.3%) | $121,512 |
| Total | 25,313 (100.0%) | $85,100 |
Family Income by Number of Earners in Brockton
The median family income in Brockton is $85,100, with families comprising 3+ earners (5,581) having the highest median family income of $146,955, while families with no earners (2,427) have the lowest median family income of $25,655, accounting for 22.1% and 9.6% of families, respectively.
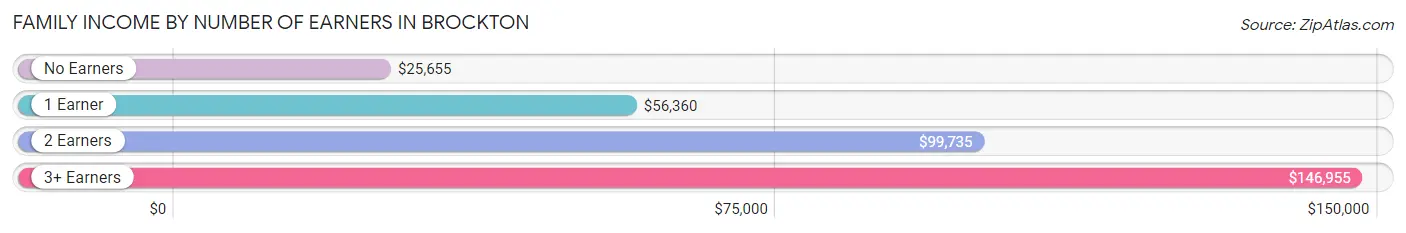
| Number of Earners | # Families | Median Income |
| No Earners | 2,427 (9.6%) | $25,655 |
| 1 Earner | 7,096 (28.0%) | $56,360 |
| 2 Earners | 10,209 (40.3%) | $99,735 |
| 3+ Earners | 5,581 (22.1%) | $146,955 |
| Total | 25,313 (100.0%) | $85,100 |
Household Income in Brockton
Household Income Brackets in Brockton
With 6,317 households falling in the category, the $100,000 to $149,999 income range is the most frequent in Brockton, accounting for 17.8% of all households. In contrast, only 1,597 households (4.5%) fall into the less than $10,000 income bracket, making it the least populous group.
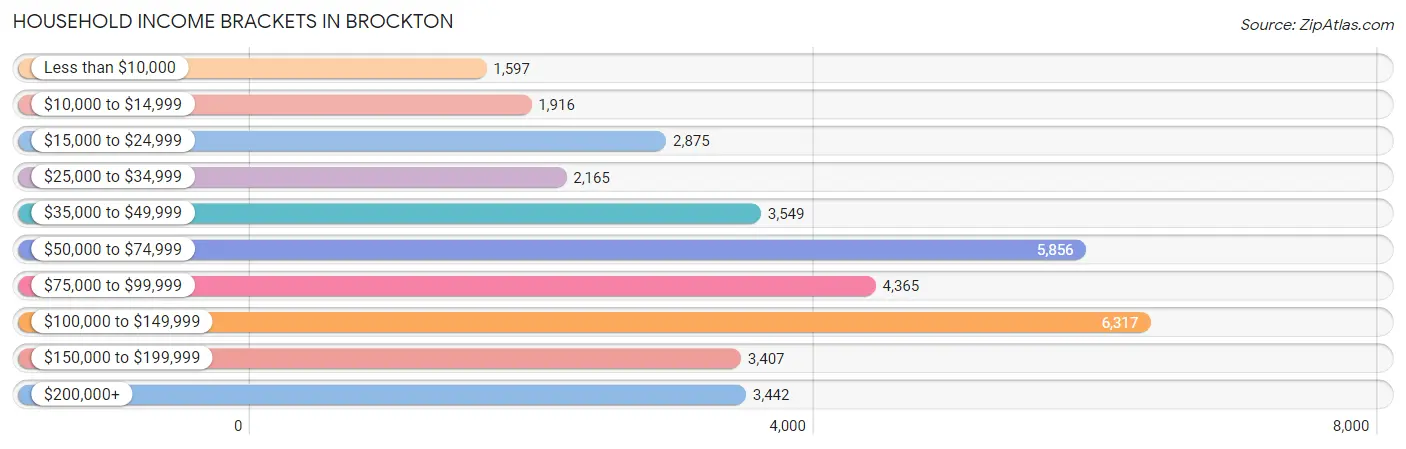
| Income Bracket | # Households | % Households |
| Less than $10,000 | 1,597 | 4.5% |
| $10,000 to $14,999 | 1,916 | 5.4% |
| $15,000 to $24,999 | 2,875 | 8.1% |
| $25,000 to $34,999 | 2,165 | 6.1% |
| $35,000 to $49,999 | 3,549 | 10.0% |
| $50,000 to $74,999 | 5,856 | 16.5% |
| $75,000 to $99,999 | 4,365 | 12.3% |
| $100,000 to $149,999 | 6,317 | 17.8% |
| $150,000 to $199,999 | 3,407 | 9.6% |
| $200,000+ | 3,442 | 9.7% |
Household Income by Householder Age in Brockton
The median household income in Brockton is $74,016, with the highest median household income of $82,939 found in the 45 to 64 years age bracket for the primary householder. A total of 15,217 households (42.9%) fall into this category. Meanwhile, the 65+ years age bracket for the primary householder has the lowest median household income of $51,625, with 8,051 households (22.7%) in this group.
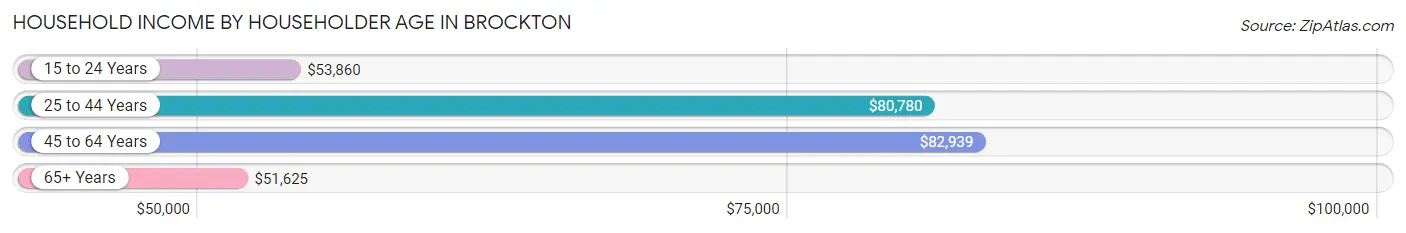
| Income Bracket | # Households | Median Income |
| 15 to 24 Years | 781 (2.2%) | $53,860 |
| 25 to 44 Years | 11,440 (32.2%) | $80,780 |
| 45 to 64 Years | 15,217 (42.9%) | $82,939 |
| 65+ Years | 8,051 (22.7%) | $51,625 |
| Total | 35,489 (100.0%) | $74,016 |
Poverty in Brockton
Income Below Poverty by Sex and Age in Brockton
With 11.3% poverty level for males and 14.4% for females among the residents of Brockton, 5 year old males and 15 year old females are the most vulnerable to poverty, with 115 males (22.4%) and 271 females (23.9%) in their respective age groups living below the poverty level.
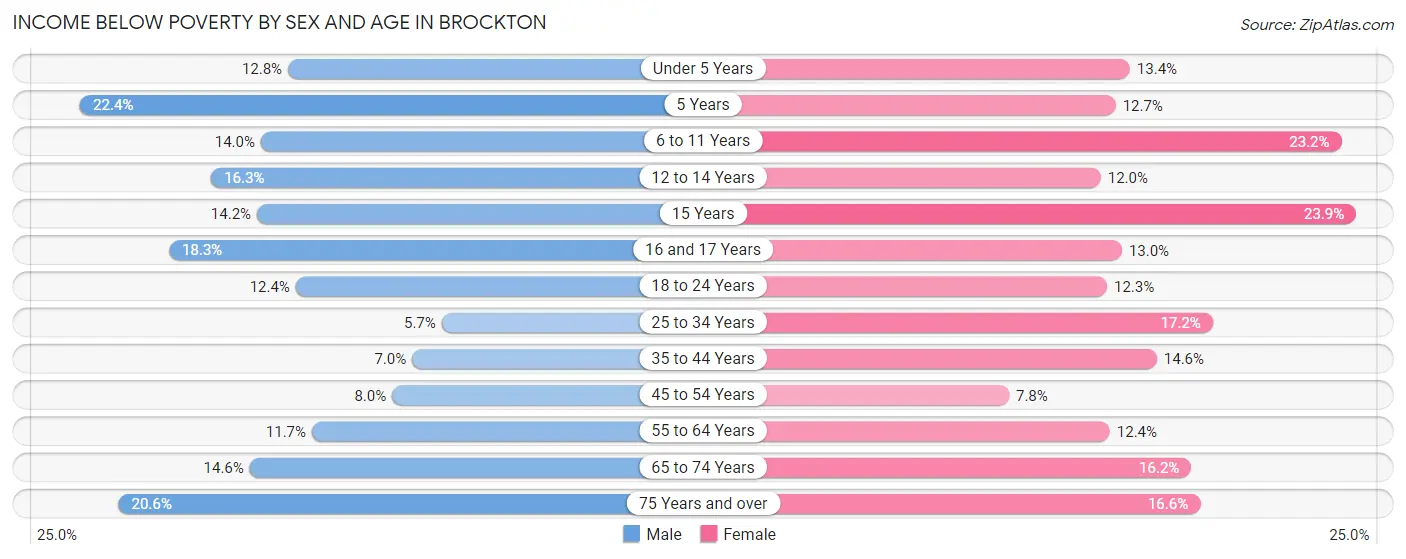
| Age Bracket | Male | Female |
| Under 5 Years | 415 (12.8%) | 446 (13.4%) |
| 5 Years | 115 (22.4%) | 84 (12.7%) |
| 6 to 11 Years | 587 (14.0%) | 874 (23.2%) |
| 12 to 14 Years | 428 (16.3%) | 274 (12.0%) |
| 15 Years | 90 (14.2%) | 271 (23.9%) |
| 16 and 17 Years | 297 (18.3%) | 213 (13.0%) |
| 18 to 24 Years | 661 (12.4%) | 634 (12.3%) |
| 25 to 34 Years | 388 (5.7%) | 1,200 (17.2%) |
| 35 to 44 Years | 465 (7.0%) | 1,006 (14.6%) |
| 45 to 54 Years | 523 (8.0%) | 501 (7.8%) |
| 55 to 64 Years | 731 (11.7%) | 871 (12.4%) |
| 65 to 74 Years | 583 (14.6%) | 740 (16.2%) |
| 75 Years and over | 402 (20.6%) | 487 (16.6%) |
| Total | 5,685 (11.3%) | 7,601 (14.4%) |
Income Above Poverty by Sex and Age in Brockton
According to the poverty statistics in Brockton, males aged 25 to 34 years and females aged 45 to 54 years are the age groups that are most secure financially, with 94.4% of males and 92.2% of females in these age groups living above the poverty line.
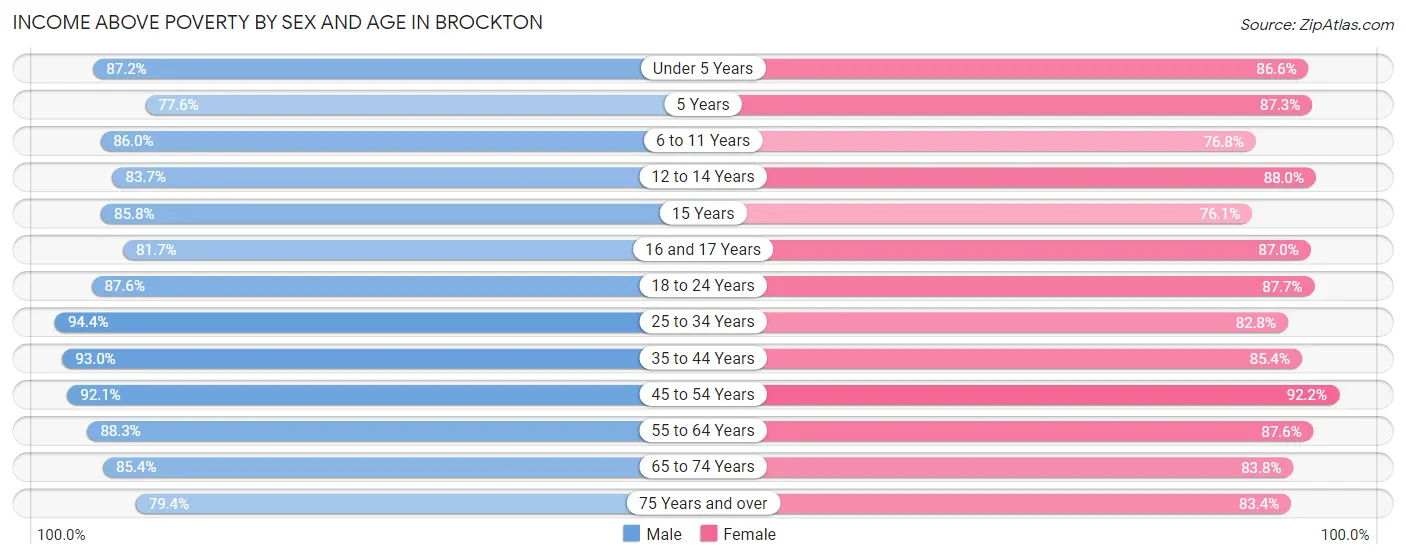
| Age Bracket | Male | Female |
| Under 5 Years | 2,832 (87.2%) | 2,890 (86.6%) |
| 5 Years | 398 (77.6%) | 577 (87.3%) |
| 6 to 11 Years | 3,594 (86.0%) | 2,897 (76.8%) |
| 12 to 14 Years | 2,191 (83.7%) | 2,006 (88.0%) |
| 15 Years | 543 (85.8%) | 865 (76.1%) |
| 16 and 17 Years | 1,326 (81.7%) | 1,426 (87.0%) |
| 18 to 24 Years | 4,659 (87.6%) | 4,518 (87.7%) |
| 25 to 34 Years | 6,482 (94.4%) | 5,774 (82.8%) |
| 35 to 44 Years | 6,158 (93.0%) | 5,873 (85.4%) |
| 45 to 54 Years | 6,052 (92.0%) | 5,955 (92.2%) |
| 55 to 64 Years | 5,535 (88.3%) | 6,131 (87.6%) |
| 65 to 74 Years | 3,422 (85.4%) | 3,824 (83.8%) |
| 75 Years and over | 1,546 (79.4%) | 2,443 (83.4%) |
| Total | 44,738 (88.7%) | 45,179 (85.6%) |
Income Below Poverty Among Married-Couple Families in Brockton
The poverty statistics for married-couple families in Brockton show that 3.8% or 523 of the total 13,632 families live below the poverty line. Families with 5 or more children have the highest poverty rate of 31.0%, comprising of 49 families. On the other hand, families with 1 or 2 children have the lowest poverty rate of 1.0%, which includes 50 families.
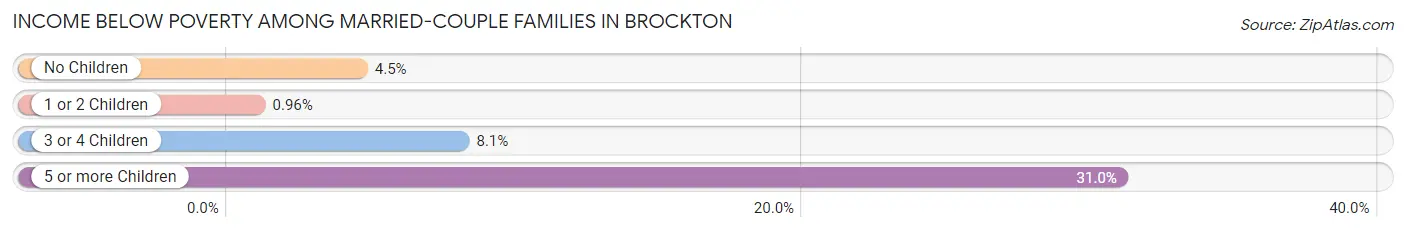
| Children | Above Poverty | Below Poverty |
| No Children | 6,550 (95.5%) | 310 (4.5%) |
| 1 or 2 Children | 5,149 (99.0%) | 50 (1.0%) |
| 3 or 4 Children | 1,301 (91.9%) | 114 (8.1%) |
| 5 or more Children | 109 (69.0%) | 49 (31.0%) |
| Total | 13,109 (96.2%) | 523 (3.8%) |
Income Below Poverty Among Single-Parent Households in Brockton
According to the poverty data in Brockton, 13.5% or 463 single-father households and 17.7% or 1,466 single-mother households are living below the poverty line. Among single-father households, those with 1 or 2 children have the highest poverty rate, with 342 households (19.8%) experiencing poverty. Likewise, among single-mother households, those with 5 or more children have the highest poverty rate, with 128 households (85.3%) falling below the poverty line.
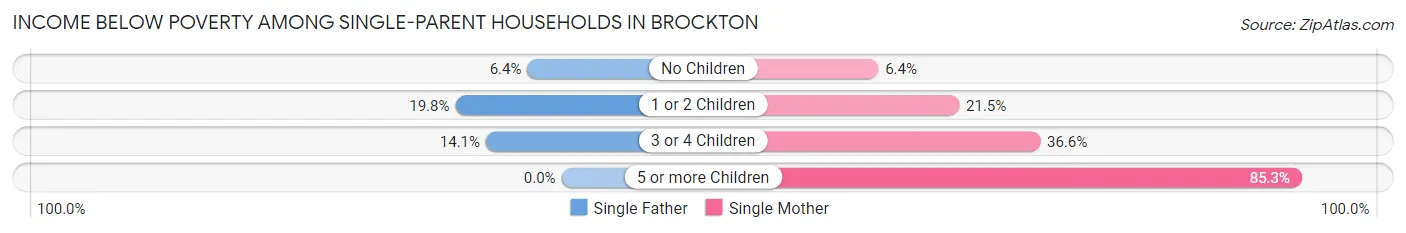
| Children | Single Father | Single Mother |
| No Children | 91 (6.4%) | 212 (6.4%) |
| 1 or 2 Children | 342 (19.8%) | 908 (21.5%) |
| 3 or 4 Children | 30 (14.1%) | 218 (36.6%) |
| 5 or more Children | 0 (0.0%) | 128 (85.3%) |
| Total | 463 (13.5%) | 1,466 (17.7%) |
Income Below Poverty Among Married-Couple vs Single-Parent Households in Brockton
The poverty data for Brockton shows that 523 of the married-couple family households (3.8%) and 1,929 of the single-parent households (16.5%) are living below the poverty level. Within the married-couple family households, those with 5 or more children have the highest poverty rate, with 49 households (31.0%) falling below the poverty line. Among the single-parent households, those with 5 or more children have the highest poverty rate, with 128 household (64.3%) living below poverty.
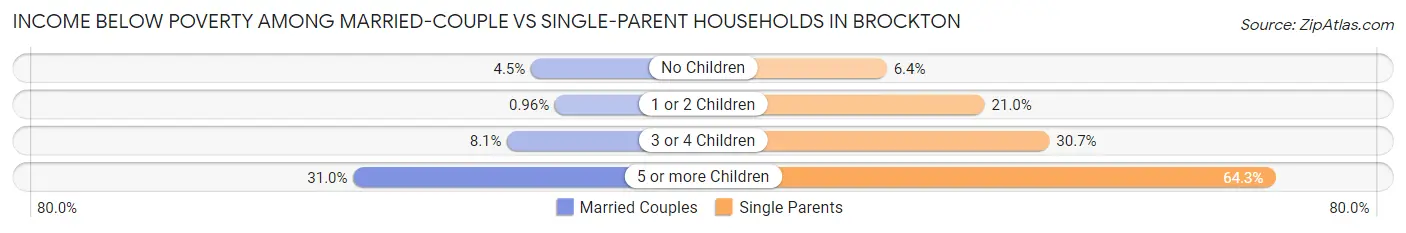
| Children | Married-Couple Families | Single-Parent Households |
| No Children | 310 (4.5%) | 303 (6.4%) |
| 1 or 2 Children | 50 (1.0%) | 1,250 (21.0%) |
| 3 or 4 Children | 114 (8.1%) | 248 (30.7%) |
| 5 or more Children | 49 (31.0%) | 128 (64.3%) |
| Total | 523 (3.8%) | 1,929 (16.5%) |
Race in Brockton
The most populous races in Brockton are Black / African American (42,203 | 40.3%), White / Caucasian (33,912 | 32.4%), and Two or more Races (16,341 | 15.6%).
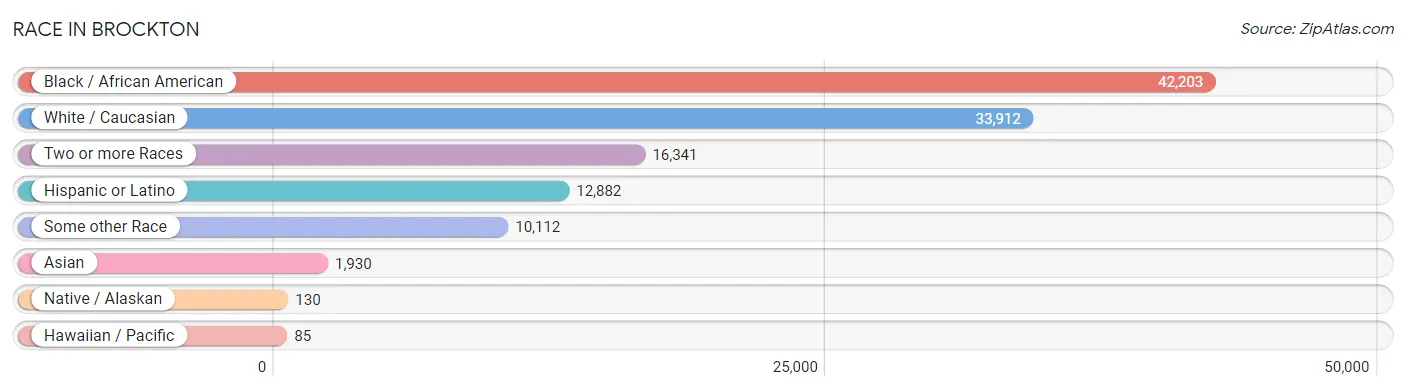
| Race | # Population | % Population |
| Asian | 1,930 | 1.8% |
| Black / African American | 42,203 | 40.3% |
| Hawaiian / Pacific | 85 | 0.1% |
| Hispanic or Latino | 12,882 | 12.3% |
| Native / Alaskan | 130 | 0.1% |
| White / Caucasian | 33,912 | 32.4% |
| Two or more Races | 16,341 | 15.6% |
| Some other Race | 10,112 | 9.7% |
| Total | 104,713 | 100.0% |
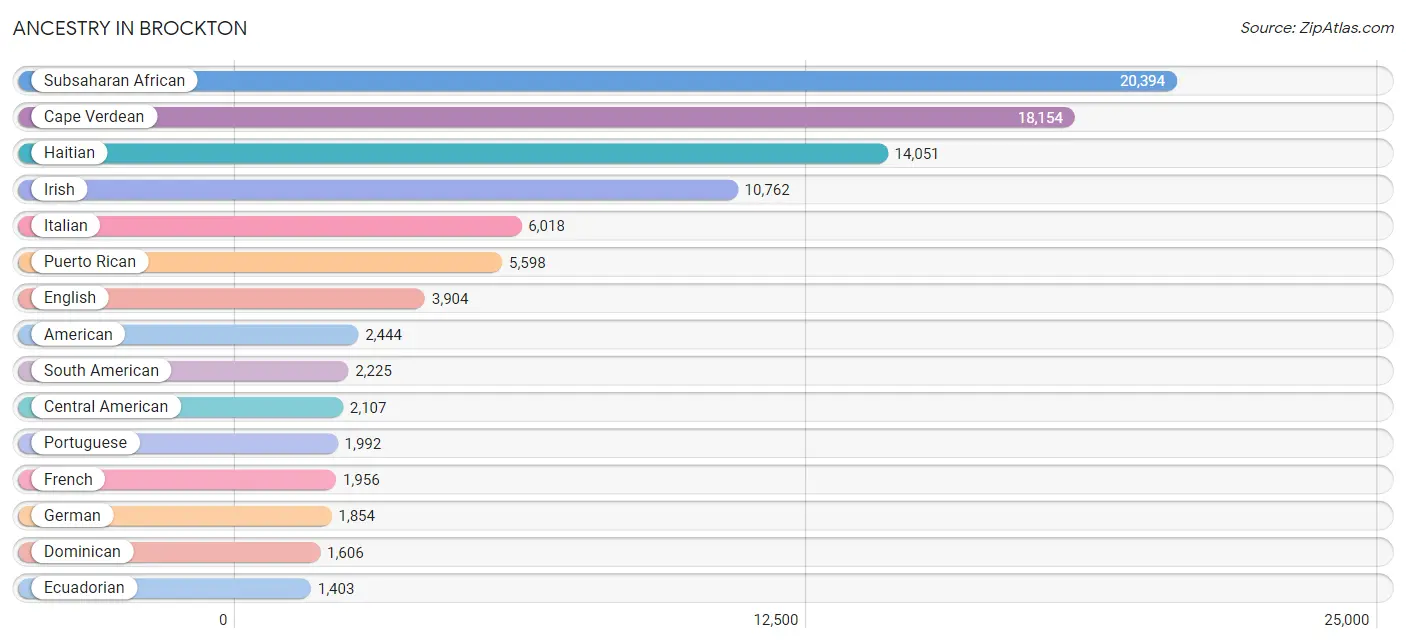
Ancestry in Brockton
The most populous ancestries reported in Brockton are Subsaharan African (20,394 | 19.5%), Cape Verdean (18,154 | 17.3%), Haitian (14,051 | 13.4%), Irish (10,762 | 10.3%), and Italian (6,018 | 5.8%), together accounting for 66.3% of all Brockton residents.
| Ancestry | # Population | % Population |
| African | 1,051 | 1.0% |
| Albanian | 50 | 0.1% |
| American | 2,444 | 2.3% |
| Apache | 12 | 0.0% |
| Arab | 357 | 0.3% |
| Armenian | 159 | 0.2% |
| Austrian | 65 | 0.1% |
| Bangladeshi | 87 | 0.1% |
| Barbadian | 346 | 0.3% |
| Belgian | 65 | 0.1% |
| Bhutanese | 28 | 0.0% |
| Blackfeet | 22 | 0.0% |
| Brazilian | 619 | 0.6% |
| British | 54 | 0.1% |
| British West Indian | 238 | 0.2% |
| Burmese | 117 | 0.1% |
| Canadian | 274 | 0.3% |
| Cape Verdean | 18,154 | 17.3% |
| Celtic | 40 | 0.0% |
| Central American | 2,107 | 2.0% |
| Central American Indian | 6 | 0.0% |
| Cherokee | 200 | 0.2% |
| Chilean | 70 | 0.1% |
| Colombian | 396 | 0.4% |
| Costa Rican | 76 | 0.1% |
| Cree | 22 | 0.0% |
| Creek | 21 | 0.0% |
| Cuban | 164 | 0.2% |
| Czech | 5 | 0.0% |
| Danish | 14 | 0.0% |
| Dominican | 1,606 | 1.5% |
| Dutch | 41 | 0.0% |
| Eastern European | 59 | 0.1% |
| Ecuadorian | 1,403 | 1.3% |
| English | 3,904 | 3.7% |
| Estonian | 22 | 0.0% |
| Ethiopian | 27 | 0.0% |
| European | 237 | 0.2% |
| Finnish | 80 | 0.1% |
| French | 1,956 | 1.9% |
| French American Indian | 6 | 0.0% |
| French Canadian | 1,378 | 1.3% |
| German | 1,854 | 1.8% |
| Ghanaian | 37 | 0.0% |
| Greek | 723 | 0.7% |
| Guamanian / Chamorro | 3 | 0.0% |
| Guatemalan | 580 | 0.5% |
| Guyanese | 124 | 0.1% |
| Haitian | 14,051 | 13.4% |
| Honduran | 859 | 0.8% |
| Hungarian | 107 | 0.1% |
| Indian (Asian) | 648 | 0.6% |
| Irish | 10,762 | 10.3% |
| Iroquois | 20 | 0.0% |
| Israeli | 21 | 0.0% |
| Italian | 6,018 | 5.8% |
| Jamaican | 1,003 | 1.0% |
| Japanese | 203 | 0.2% |
| Kenyan | 538 | 0.5% |
| Korean | 193 | 0.2% |
| Latvian | 8 | 0.0% |
| Lebanese | 220 | 0.2% |
| Liberian | 70 | 0.1% |
| Lithuanian | 370 | 0.4% |
| Mexican | 276 | 0.3% |
| Moroccan | 89 | 0.1% |
| Navajo | 12 | 0.0% |
| Nigerian | 487 | 0.5% |
| Northern European | 11 | 0.0% |
| Norwegian | 75 | 0.1% |
| Pakistani | 27 | 0.0% |
| Panamanian | 118 | 0.1% |
| Paraguayan | 29 | 0.0% |
| Peruvian | 237 | 0.2% |
| Polish | 1,146 | 1.1% |
| Portuguese | 1,992 | 1.9% |
| Puerto Rican | 5,598 | 5.3% |
| Russian | 201 | 0.2% |
| Salvadoran | 474 | 0.4% |
| Samoan | 60 | 0.1% |
| Scandinavian | 23 | 0.0% |
| Scotch-Irish | 423 | 0.4% |
| Scottish | 1,181 | 1.1% |
| Senegalese | 16 | 0.0% |
| Serbian | 40 | 0.0% |
| Sierra Leonean | 49 | 0.1% |
| Slavic | 13 | 0.0% |
| Slovak | 11 | 0.0% |
| Slovene | 15 | 0.0% |
| Somali | 10 | 0.0% |
| South American | 2,225 | 2.1% |
| Spaniard | 179 | 0.2% |
| Spanish | 110 | 0.1% |
| Sri Lankan | 702 | 0.7% |
| Subsaharan African | 20,394 | 19.5% |
| Swedish | 1,102 | 1.1% |
| Syrian | 27 | 0.0% |
| Thai | 188 | 0.2% |
| Trinidadian and Tobagonian | 409 | 0.4% |
| U.S. Virgin Islander | 19 | 0.0% |
| Ugandan | 51 | 0.1% |
| Ukrainian | 80 | 0.1% |
| Venezuelan | 90 | 0.1% |
| Vietnamese | 94 | 0.1% |
| Welsh | 19 | 0.0% |
| West Indian | 92 | 0.1% |
| Yugoslavian | 8 | 0.0% | View All 107 Rows |
Immigrants in Brockton
The most numerous immigrant groups reported in Brockton came from Latin America (17,345 | 16.6%), Caribbean (13,611 | 13.0%), Africa (13,566 | 13.0%), Western Africa (12,597 | 12.0%), and Cabo Verde (11,950 | 11.4%), together accounting for 66.0% of all Brockton residents.
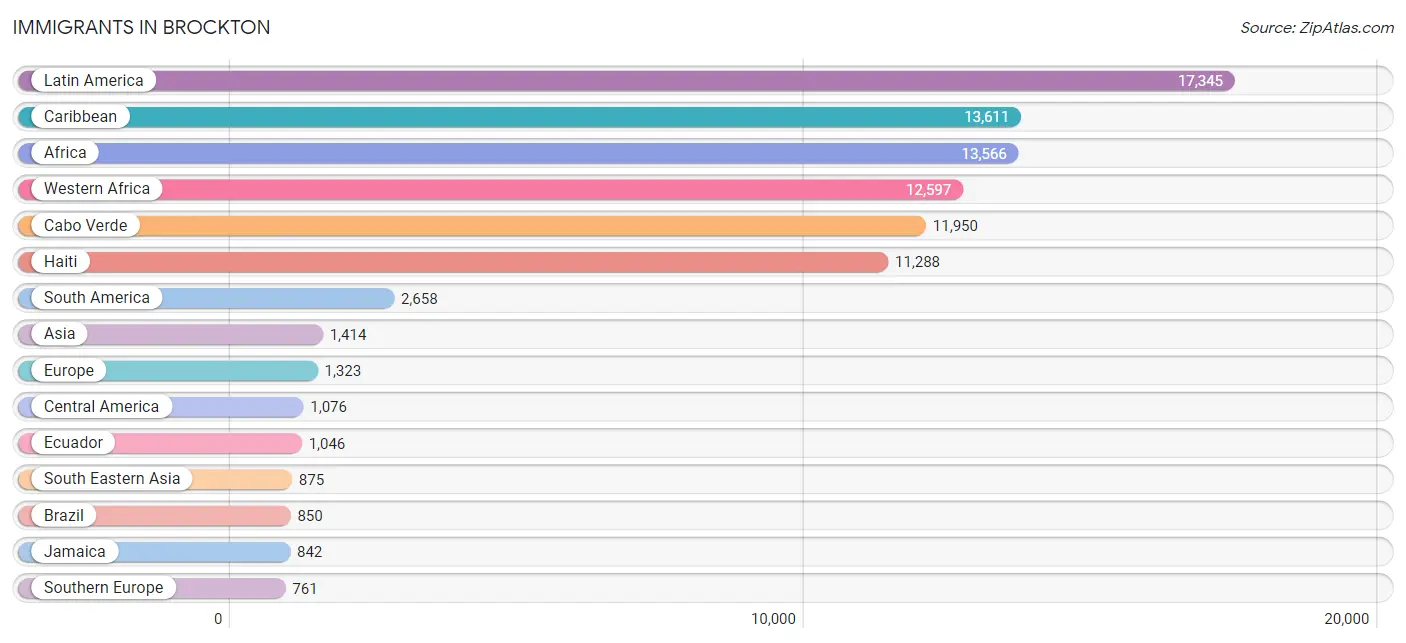
| Immigration Origin | # Population | % Population |
| Africa | 13,566 | 13.0% |
| Albania | 33 | 0.0% |
| Asia | 1,414 | 1.3% |
| Austria | 22 | 0.0% |
| Azores | 33 | 0.0% |
| Barbados | 185 | 0.2% |
| Brazil | 850 | 0.8% |
| Cabo Verde | 11,950 | 11.4% |
| Cambodia | 120 | 0.1% |
| Cameroon | 198 | 0.2% |
| Canada | 138 | 0.1% |
| Caribbean | 13,611 | 13.0% |
| Central America | 1,076 | 1.0% |
| Chile | 70 | 0.1% |
| China | 331 | 0.3% |
| Colombia | 390 | 0.4% |
| Costa Rica | 65 | 0.1% |
| Cuba | 51 | 0.1% |
| Dominica | 63 | 0.1% |
| Dominican Republic | 670 | 0.6% |
| Eastern Africa | 481 | 0.5% |
| Eastern Asia | 393 | 0.4% |
| Eastern Europe | 101 | 0.1% |
| Ecuador | 1,046 | 1.0% |
| El Salvador | 171 | 0.2% |
| England | 48 | 0.1% |
| Ethiopia | 14 | 0.0% |
| Europe | 1,323 | 1.3% |
| France | 20 | 0.0% |
| Germany | 68 | 0.1% |
| Ghana | 5 | 0.0% |
| Greece | 147 | 0.1% |
| Guatemala | 249 | 0.2% |
| Guyana | 25 | 0.0% |
| Haiti | 11,288 | 10.8% |
| Honduras | 468 | 0.4% |
| Hong Kong | 263 | 0.3% |
| India | 69 | 0.1% |
| Ireland | 210 | 0.2% |
| Italy | 69 | 0.1% |
| Jamaica | 842 | 0.8% |
| Japan | 28 | 0.0% |
| Kenya | 387 | 0.4% |
| Korea | 34 | 0.0% |
| Laos | 24 | 0.0% |
| Latin America | 17,345 | 16.6% |
| Liberia | 32 | 0.0% |
| Lithuania | 32 | 0.0% |
| Mexico | 72 | 0.1% |
| Middle Africa | 407 | 0.4% |
| Morocco | 32 | 0.0% |
| Nepal | 27 | 0.0% |
| Nicaragua | 41 | 0.0% |
| Nigeria | 485 | 0.5% |
| Northern Africa | 32 | 0.0% |
| Northern Europe | 351 | 0.3% |
| Pakistan | 26 | 0.0% |
| Panama | 10 | 0.0% |
| Peru | 169 | 0.2% |
| Philippines | 82 | 0.1% |
| Poland | 1 | 0.0% |
| Portugal | 428 | 0.4% |
| Russia | 35 | 0.0% |
| Scotland | 18 | 0.0% |
| Senegal | 57 | 0.1% |
| Sierra Leone | 30 | 0.0% |
| South Africa | 27 | 0.0% |
| South America | 2,658 | 2.5% |
| South Central Asia | 122 | 0.1% |
| South Eastern Asia | 875 | 0.8% |
| Southern Europe | 761 | 0.7% |
| Spain | 117 | 0.1% |
| Taiwan | 28 | 0.0% |
| Thailand | 70 | 0.1% |
| Trinidad and Tobago | 270 | 0.3% |
| Uganda | 53 | 0.1% |
| Venezuela | 90 | 0.1% |
| Vietnam | 579 | 0.5% |
| West Indies | 16 | 0.0% |
| Western Africa | 12,597 | 12.0% |
| Western Asia | 24 | 0.0% |
| Western Europe | 110 | 0.1% |
| Zimbabwe | 9 | 0.0% | View All 83 Rows |
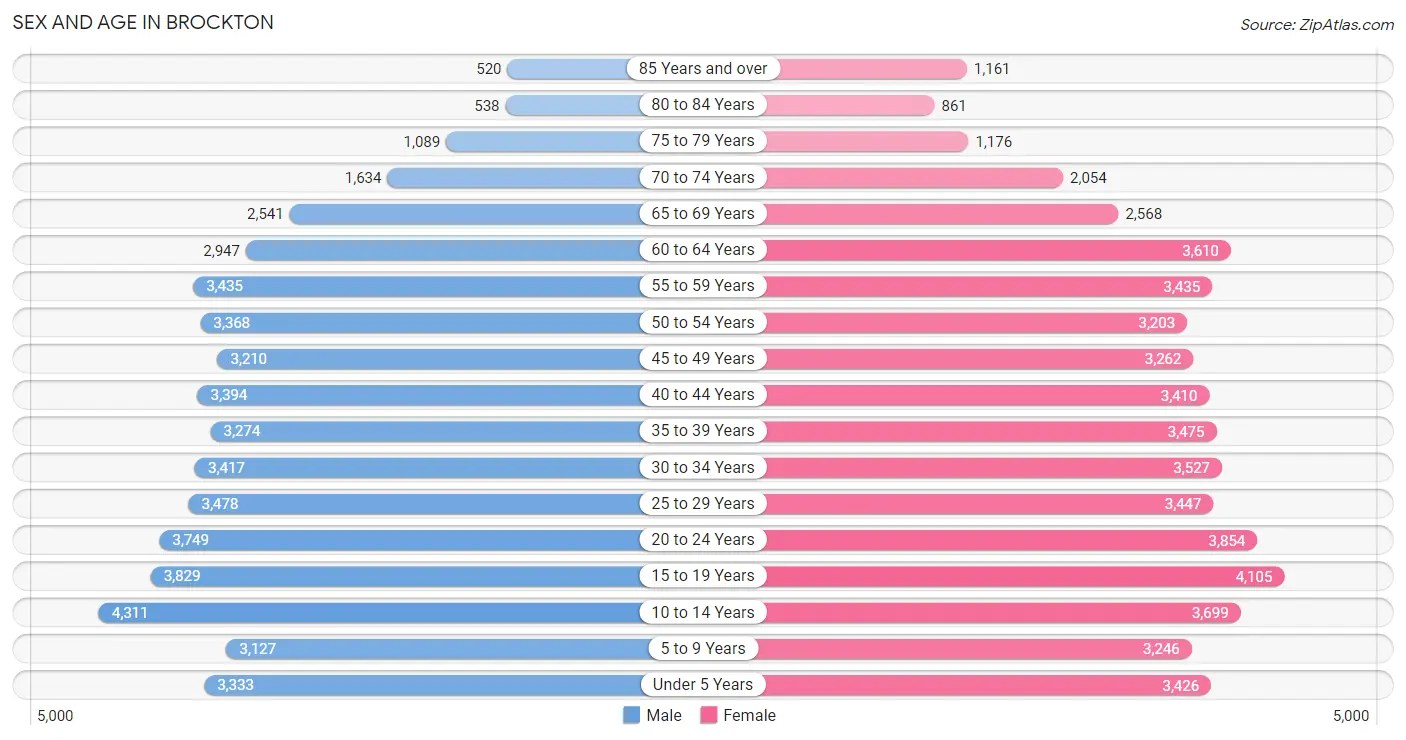
Sex and Age in Brockton
Sex and Age in Brockton
The most populous age groups in Brockton are 10 to 14 Years (4,311 | 8.4%) for men and 15 to 19 Years (4,105 | 7.7%) for women.
| Age Bracket | Male | Female |
| Under 5 Years | 3,333 (6.5%) | 3,426 (6.4%) |
| 5 to 9 Years | 3,127 (6.1%) | 3,246 (6.1%) |
| 10 to 14 Years | 4,311 (8.4%) | 3,699 (6.9%) |
| 15 to 19 Years | 3,829 (7.5%) | 4,105 (7.7%) |
| 20 to 24 Years | 3,749 (7.3%) | 3,854 (7.2%) |
| 25 to 29 Years | 3,478 (6.8%) | 3,447 (6.4%) |
| 30 to 34 Years | 3,417 (6.7%) | 3,527 (6.6%) |
| 35 to 39 Years | 3,274 (6.4%) | 3,475 (6.5%) |
| 40 to 44 Years | 3,394 (6.6%) | 3,410 (6.4%) |
| 45 to 49 Years | 3,210 (6.3%) | 3,262 (6.1%) |
| 50 to 54 Years | 3,368 (6.6%) | 3,203 (6.0%) |
| 55 to 59 Years | 3,435 (6.7%) | 3,435 (6.4%) |
| 60 to 64 Years | 2,947 (5.8%) | 3,610 (6.8%) |
| 65 to 69 Years | 2,541 (5.0%) | 2,568 (4.8%) |
| 70 to 74 Years | 1,634 (3.2%) | 2,054 (3.8%) |
| 75 to 79 Years | 1,089 (2.1%) | 1,176 (2.2%) |
| 80 to 84 Years | 538 (1.1%) | 861 (1.6%) |
| 85 Years and over | 520 (1.0%) | 1,161 (2.2%) |
| Total | 51,194 (100.0%) | 53,519 (100.0%) |
Families and Households in Brockton
Median Family Size in Brockton
The median family size in Brockton is 3.40 persons per family, with married-couple families (13,632 | 53.8%) accounting for the largest median family size of 3.64 persons per family. On the other hand, single male/father families (3,421 | 13.5%) represent the smallest median family size with 2.85 persons per family.
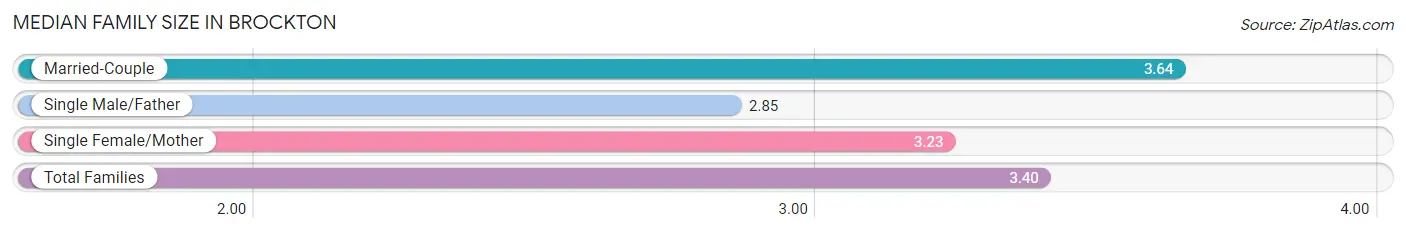
| Family Type | # Families | Family Size |
| Married-Couple | 13,632 (53.8%) | 3.64 |
| Single Male/Father | 3,421 (13.5%) | 2.85 |
| Single Female/Mother | 8,260 (32.6%) | 3.23 |
| Total Families | 25,313 (100.0%) | 3.40 |
Median Household Size in Brockton
The median household size in Brockton is 2.90 persons per household, with married-couple households (13,632 | 38.4%) accounting for the largest median household size of 3.7 persons per household. non-family households (10,176 | 28.7%) represent the smallest median household size with 1.19 persons per household.
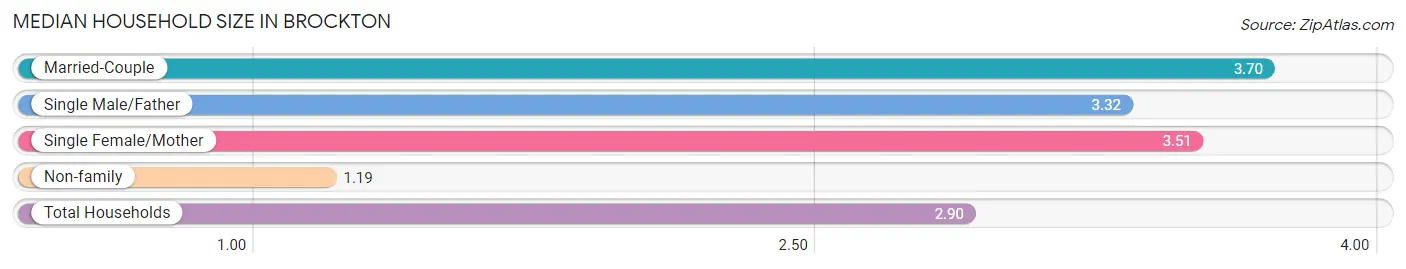
| Household Type | # Households | Household Size |
| Married-Couple | 13,632 (38.4%) | 3.70 |
| Single Male/Father | 3,421 (9.6%) | 3.32 |
| Single Female/Mother | 8,260 (23.3%) | 3.51 |
| Non-family | 10,176 (28.7%) | 1.19 |
| Total Households | 35,489 (100.0%) | 2.90 |
Household Size by Marriage Status in Brockton
Out of a total of 35,489 households in Brockton, 25,313 (71.3%) are family households, while 10,176 (28.7%) are nonfamily households. The most numerous type of family households are 3-person households, comprising 7,207, and the most common type of nonfamily households are 1-person households, comprising 8,617.
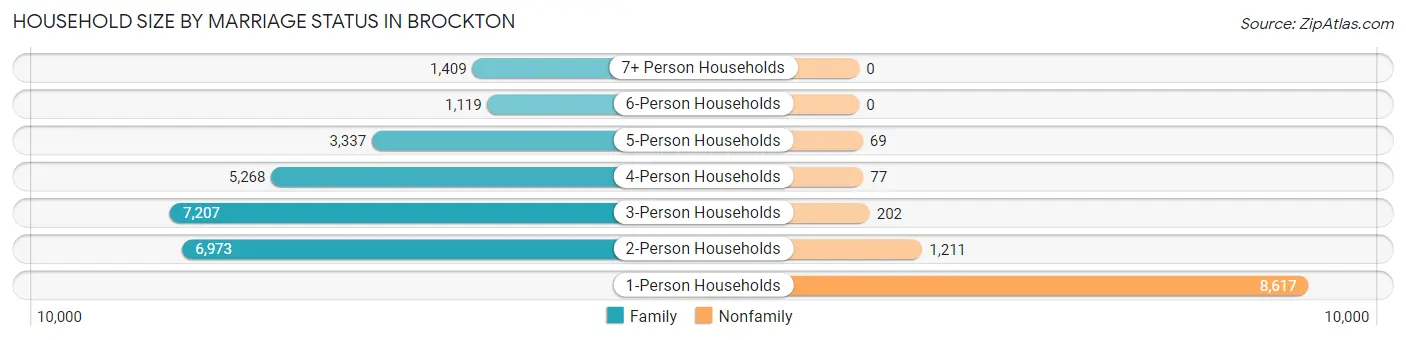
| Household Size | Family Households | Nonfamily Households |
| 1-Person Households | - | 8,617 (24.3%) |
| 2-Person Households | 6,973 (19.7%) | 1,211 (3.4%) |
| 3-Person Households | 7,207 (20.3%) | 202 (0.6%) |
| 4-Person Households | 5,268 (14.8%) | 77 (0.2%) |
| 5-Person Households | 3,337 (9.4%) | 69 (0.2%) |
| 6-Person Households | 1,119 (3.2%) | 0 (0.0%) |
| 7+ Person Households | 1,409 (4.0%) | 0 (0.0%) |
| Total | 25,313 (71.3%) | 10,176 (28.7%) |
Female Fertility in Brockton
Fertility by Age in Brockton
Average fertility rate in Brockton is 51.0 births per 1,000 women. Women in the age bracket of 20 to 34 years have the highest fertility rate with 82.0 births per 1,000 women. Women in the age bracket of 20 to 34 years acount for 66.9% of all women with births.
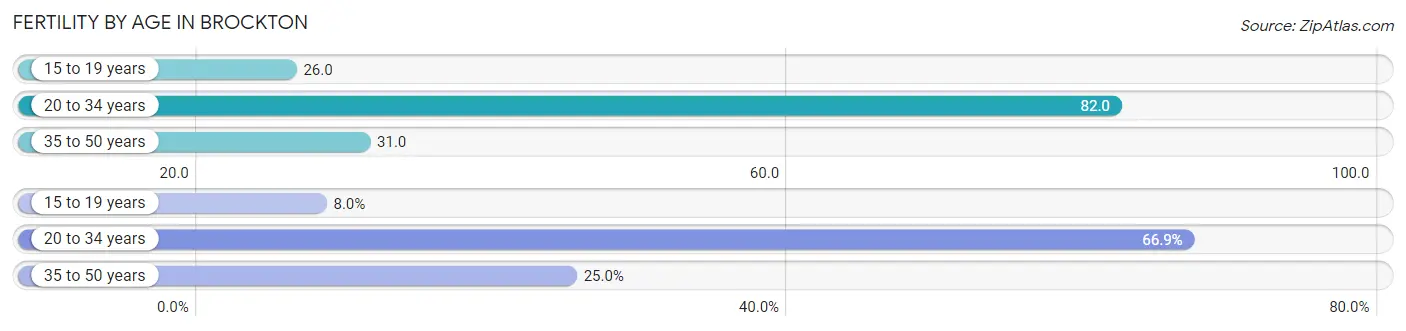
| Age Bracket | Women with Births | Births / 1,000 Women |
| 15 to 19 years | 106 (8.0%) | 26.0 |
| 20 to 34 years | 883 (66.9%) | 82.0 |
| 35 to 50 years | 330 (25.0%) | 31.0 |
| Total | 1,319 (100.0%) | 51.0 |
Fertility by Age by Marriage Status in Brockton
50.1% of women with births (1,319) in Brockton are married. The highest percentage of unmarried women with births falls into 15 to 19 years age bracket with 67.0% of them unmarried at the time of birth, while the lowest percentage of unmarried women with births belong to 20 to 34 years age bracket with 47.7% of them unmarried.
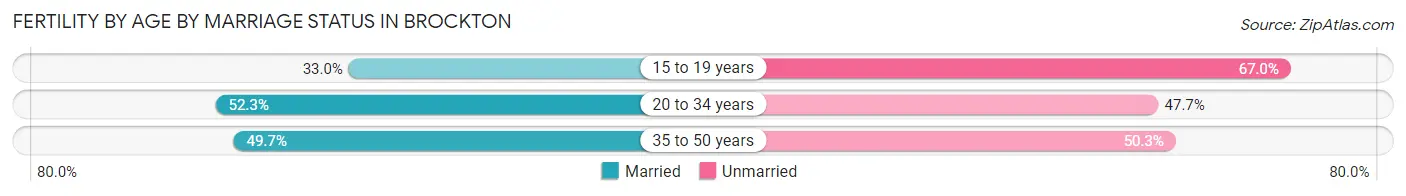
| Age Bracket | Married | Unmarried |
| 15 to 19 years | 35 (33.0%) | 71 (67.0%) |
| 20 to 34 years | 462 (52.3%) | 421 (47.7%) |
| 35 to 50 years | 164 (49.7%) | 166 (50.3%) |
| Total | 661 (50.1%) | 658 (49.9%) |
Fertility by Education in Brockton
Average fertility rate in Brockton is 51.0 births per 1,000 women. Women with the education attainment of high school diploma have the highest fertility rate of 64.0 births per 1,000 women, while women with the education attainment of less than high school have the lowest fertility at 28.0 births per 1,000 women. Women with the education attainment of high school diploma represent 34.9% of all women with births.
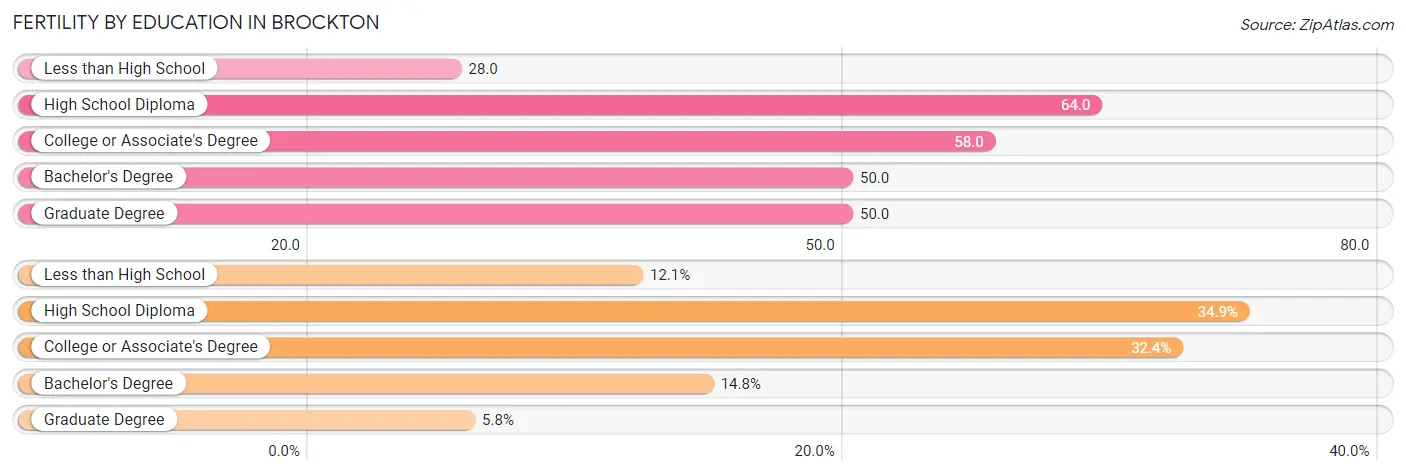
| Educational Attainment | Women with Births | Births / 1,000 Women |
| Less than High School | 160 (12.1%) | 28.0 |
| High School Diploma | 460 (34.9%) | 64.0 |
| College or Associate's Degree | 427 (32.4%) | 58.0 |
| Bachelor's Degree | 195 (14.8%) | 50.0 |
| Graduate Degree | 77 (5.8%) | 50.0 |
| Total | 1,319 (100.0%) | 51.0 |
Fertility by Education by Marriage Status in Brockton
49.9% of women with births in Brockton are unmarried. Women with the educational attainment of graduate degree are most likely to be married with 100.0% of them married at childbirth, while women with the educational attainment of high school diploma are least likely to be married with 63.5% of them unmarried at childbirth.
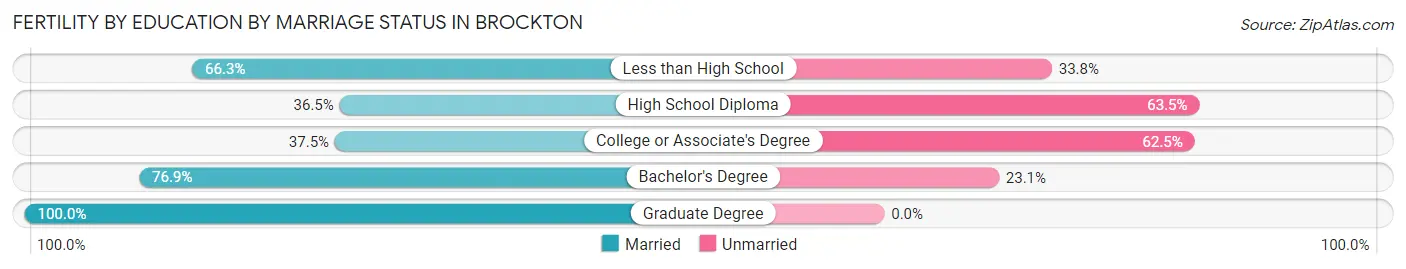
| Educational Attainment | Married | Unmarried |
| Less than High School | 106 (66.2%) | 54 (33.8%) |
| High School Diploma | 168 (36.5%) | 292 (63.5%) |
| College or Associate's Degree | 160 (37.5%) | 267 (62.5%) |
| Bachelor's Degree | 150 (76.9%) | 45 (23.1%) |
| Graduate Degree | 77 (100.0%) | 0 (0.0%) |
| Total | 661 (50.1%) | 658 (49.9%) |
Employment Characteristics in Brockton
Employment by Class of Employer in Brockton
Among the 49,446 employed individuals in Brockton, private company employees (32,750 | 66.2%), not-for-profit organizations (7,574 | 15.3%), and local government employees (3,015 | 6.1%) make up the most common classes of employment.
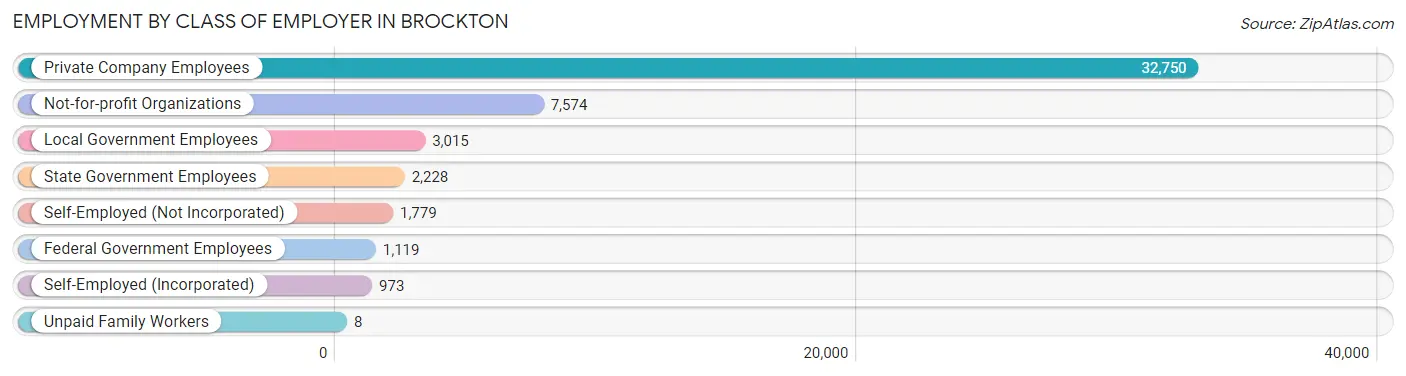
| Employer Class | # Employees | % Employees |
| Private Company Employees | 32,750 | 66.2% |
| Self-Employed (Incorporated) | 973 | 2.0% |
| Self-Employed (Not Incorporated) | 1,779 | 3.6% |
| Not-for-profit Organizations | 7,574 | 15.3% |
| Local Government Employees | 3,015 | 6.1% |
| State Government Employees | 2,228 | 4.5% |
| Federal Government Employees | 1,119 | 2.3% |
| Unpaid Family Workers | 8 | 0.0% |
| Total | 49,446 | 100.0% |
Employment Status by Age in Brockton
According to the labor force statistics for Brockton, out of the total population over 16 years of age (81,794), 68.7% or 56,192 individuals are in the labor force, with 8.2% or 4,608 of them unemployed. The age group with the highest labor force participation rate is 35 to 44 years, with 88.7% or 12,022 individuals in the labor force. Within the labor force, the 16 to 19 years age range has the highest percentage of unemployed individuals, with 16.0% or 468 of them being unemployed.
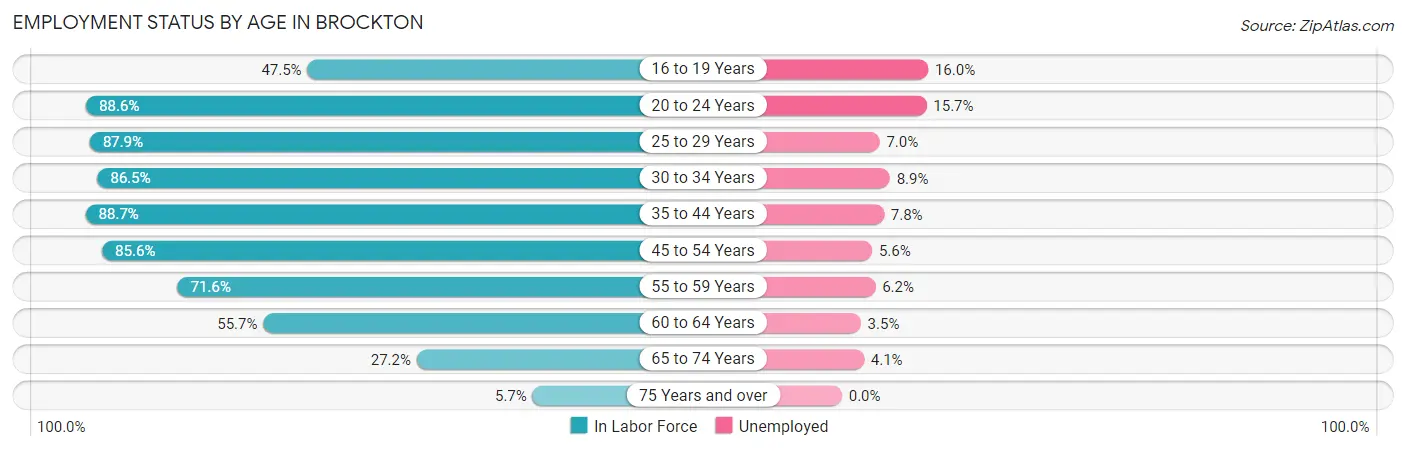
| Age Bracket | In Labor Force | Unemployed |
| 16 to 19 Years | 2,925 (47.5%) | 468 (16.0%) |
| 20 to 24 Years | 6,736 (88.6%) | 1,058 (15.7%) |
| 25 to 29 Years | 6,087 (87.9%) | 426 (7.0%) |
| 30 to 34 Years | 6,007 (86.5%) | 535 (8.9%) |
| 35 to 44 Years | 12,022 (88.7%) | 938 (7.8%) |
| 45 to 54 Years | 11,165 (85.6%) | 625 (5.6%) |
| 55 to 59 Years | 4,919 (71.6%) | 305 (6.2%) |
| 60 to 64 Years | 3,652 (55.7%) | 128 (3.5%) |
| 65 to 74 Years | 2,393 (27.2%) | 98 (4.1%) |
| 75 Years and over | 305 (5.7%) | 0 (0.0%) |
| Total | 56,192 (68.7%) | 4,608 (8.2%) |
Employment Status by Educational Attainment in Brockton
According to labor force statistics for Brockton, 81.4% of individuals (43,868) out of the total population between 25 and 64 years of age (53,892) are in the labor force, with 6.8% or 2,983 of them being unemployed. The group with the highest labor force participation rate are those with the educational attainment of bachelor's degree or higher, with 89.7% or 10,739 individuals in the labor force. Within the labor force, individuals with high school diploma education have the highest percentage of unemployment, with 10.1% or 1,461 of them being unemployed.
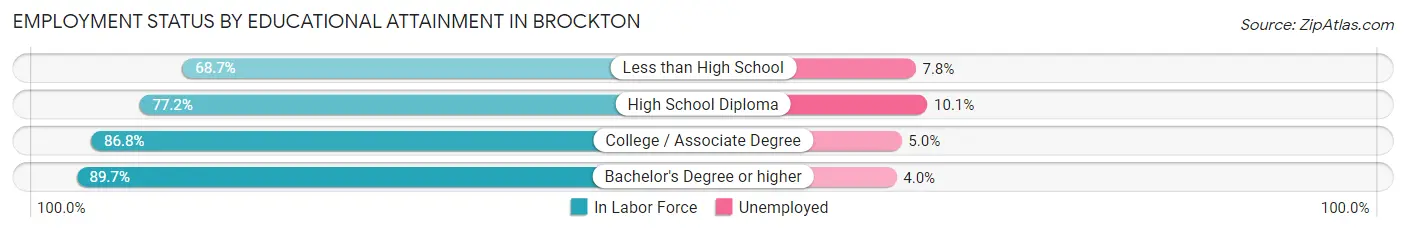
| Educational Attainment | In Labor Force | Unemployed |
| Less than High School | 5,585 (68.7%) | 634 (7.8%) |
| High School Diploma | 14,467 (77.2%) | 1,893 (10.1%) |
| College / Associate Degree | 13,064 (86.8%) | 753 (5.0%) |
| Bachelor's Degree or higher | 10,739 (89.7%) | 479 (4.0%) |
| Total | 43,868 (81.4%) | 3,665 (6.8%) |
Employment Occupations by Sex in Brockton
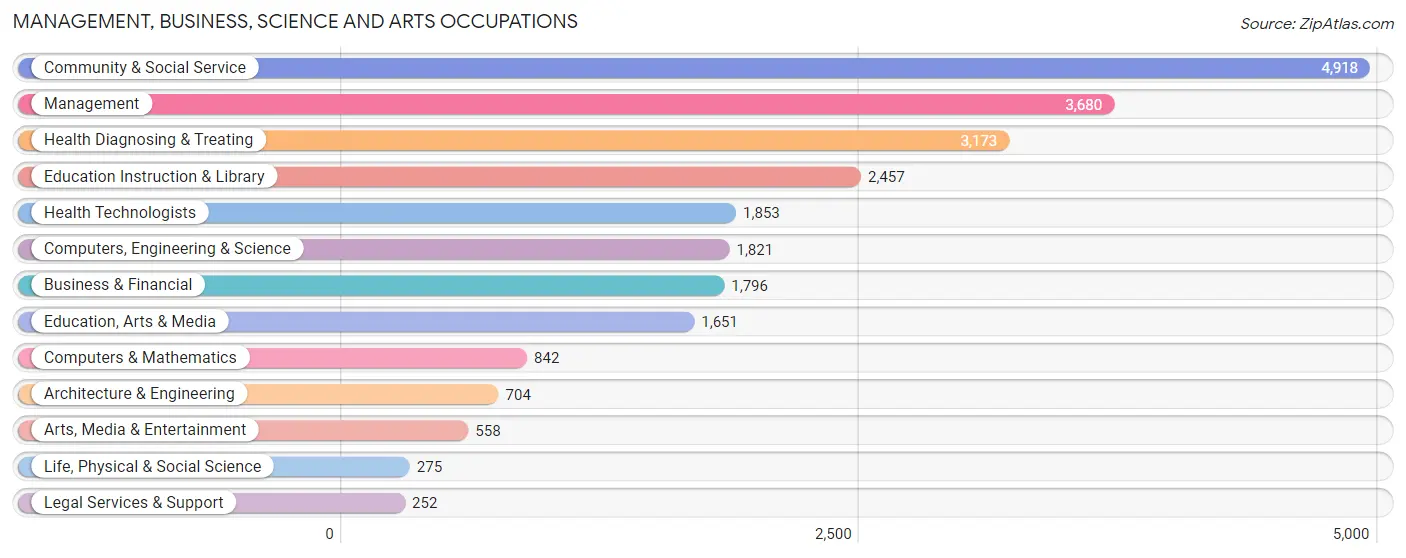
Management, Business, Science and Arts Occupations
The most common Management, Business, Science and Arts occupations in Brockton are Community & Social Service (4,918 | 9.5%), Management (3,680 | 7.1%), Health Diagnosing & Treating (3,173 | 6.1%), Education Instruction & Library (2,457 | 4.8%), and Health Technologists (1,853 | 3.6%).
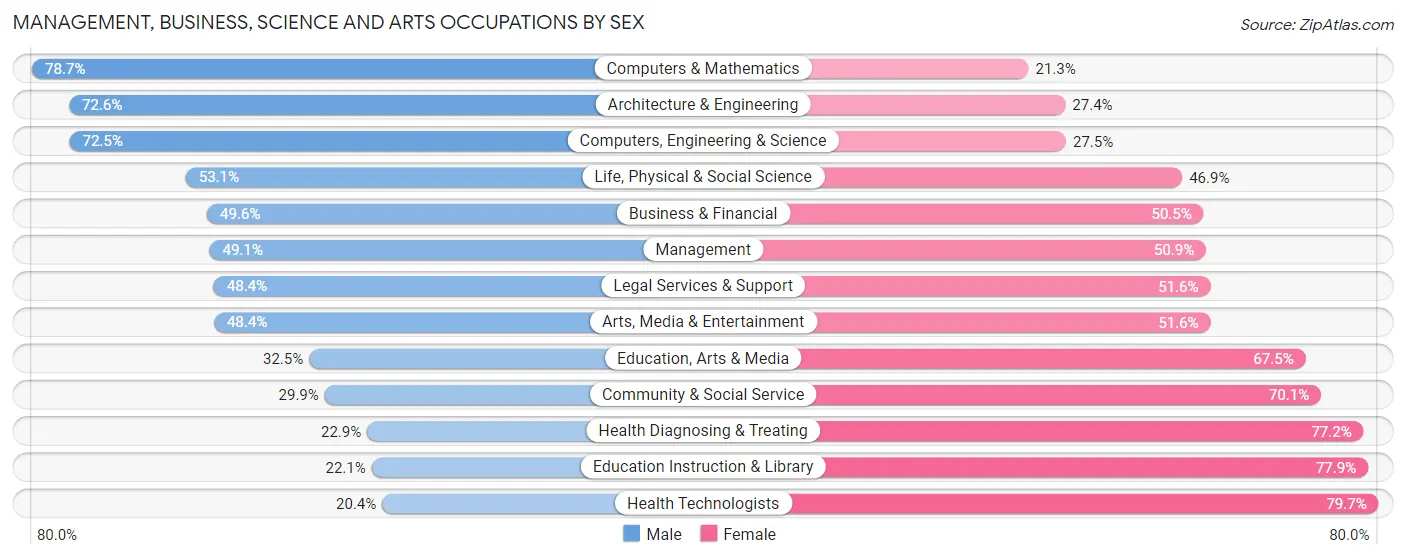
Management, Business, Science and Arts Occupations by Sex
Within the Management, Business, Science and Arts occupations in Brockton, the most male-oriented occupations are Computers & Mathematics (78.7%), Architecture & Engineering (72.6%), and Computers, Engineering & Science (72.5%), while the most female-oriented occupations are Health Technologists (79.6%), Education Instruction & Library (77.9%), and Health Diagnosing & Treating (77.1%).
| Occupation | Male | Female |
| Management | 1,808 (49.1%) | 1,872 (50.9%) |
| Business & Financial | 890 (49.5%) | 906 (50.4%) |
| Computers, Engineering & Science | 1,320 (72.5%) | 501 (27.5%) |
| Computers & Mathematics | 663 (78.7%) | 179 (21.3%) |
| Architecture & Engineering | 511 (72.6%) | 193 (27.4%) |
| Life, Physical & Social Science | 146 (53.1%) | 129 (46.9%) |
| Community & Social Service | 1,472 (29.9%) | 3,446 (70.1%) |
| Education, Arts & Media | 537 (32.5%) | 1,114 (67.5%) |
| Legal Services & Support | 122 (48.4%) | 130 (51.6%) |
| Education Instruction & Library | 543 (22.1%) | 1,914 (77.9%) |
| Arts, Media & Entertainment | 270 (48.4%) | 288 (51.6%) |
| Health Diagnosing & Treating | 725 (22.9%) | 2,448 (77.1%) |
| Health Technologists | 377 (20.3%) | 1,476 (79.6%) |
| Total (Category) | 6,215 (40.4%) | 9,173 (59.6%) |
| Total (Overall) | 25,520 (49.5%) | 26,040 (50.5%) |
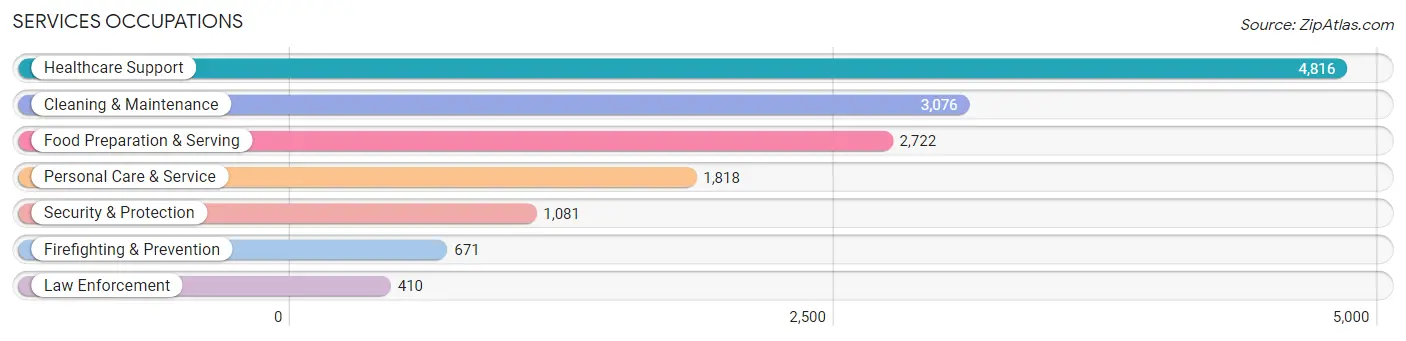
Services Occupations
The most common Services occupations in Brockton are Healthcare Support (4,816 | 9.3%), Cleaning & Maintenance (3,076 | 6.0%), Food Preparation & Serving (2,722 | 5.3%), Personal Care & Service (1,818 | 3.5%), and Security & Protection (1,081 | 2.1%).
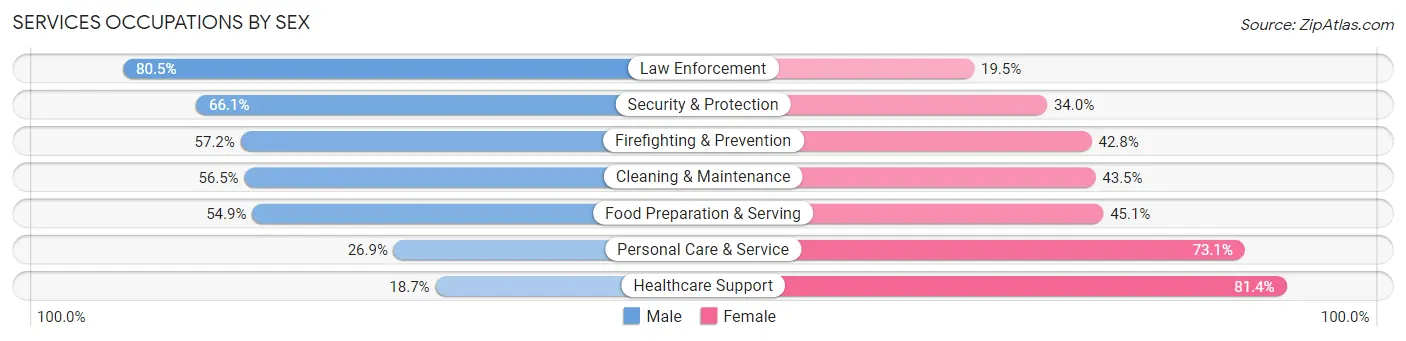
Services Occupations by Sex
Within the Services occupations in Brockton, the most male-oriented occupations are Law Enforcement (80.5%), Security & Protection (66.0%), and Firefighting & Prevention (57.2%), while the most female-oriented occupations are Healthcare Support (81.4%), Personal Care & Service (73.1%), and Food Preparation & Serving (45.1%).
| Occupation | Male | Female |
| Healthcare Support | 898 (18.6%) | 3,918 (81.4%) |
| Security & Protection | 714 (66.0%) | 367 (34.0%) |
| Firefighting & Prevention | 384 (57.2%) | 287 (42.8%) |
| Law Enforcement | 330 (80.5%) | 80 (19.5%) |
| Food Preparation & Serving | 1,495 (54.9%) | 1,227 (45.1%) |
| Cleaning & Maintenance | 1,737 (56.5%) | 1,339 (43.5%) |
| Personal Care & Service | 489 (26.9%) | 1,329 (73.1%) |
| Total (Category) | 5,333 (39.5%) | 8,180 (60.5%) |
| Total (Overall) | 25,520 (49.5%) | 26,040 (50.5%) |
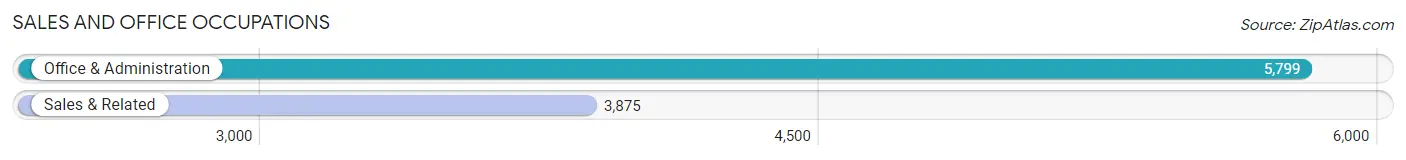
Sales and Office Occupations
The most common Sales and Office occupations in Brockton are Office & Administration (5,799 | 11.3%), and Sales & Related (3,875 | 7.5%).
Sales and Office Occupations by Sex
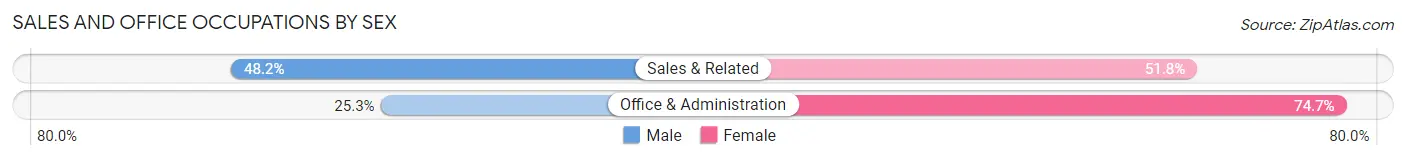
| Occupation | Male | Female |
| Sales & Related | 1,869 (48.2%) | 2,006 (51.8%) |
| Office & Administration | 1,465 (25.3%) | 4,334 (74.7%) |
| Total (Category) | 3,334 (34.5%) | 6,340 (65.5%) |
| Total (Overall) | 25,520 (49.5%) | 26,040 (50.5%) |
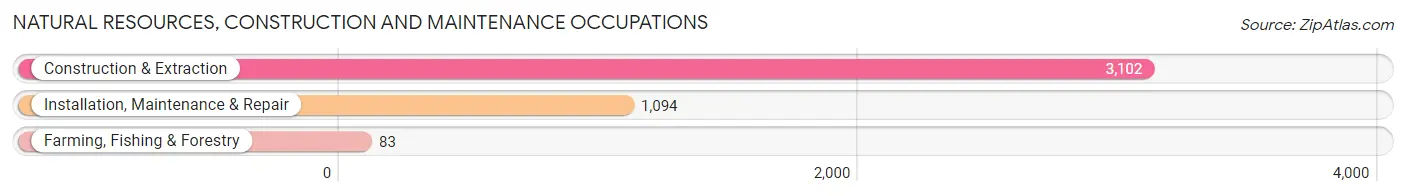
Natural Resources, Construction and Maintenance Occupations
The most common Natural Resources, Construction and Maintenance occupations in Brockton are Construction & Extraction (3,102 | 6.0%), Installation, Maintenance & Repair (1,094 | 2.1%), and Farming, Fishing & Forestry (83 | 0.2%).
Natural Resources, Construction and Maintenance Occupations by Sex
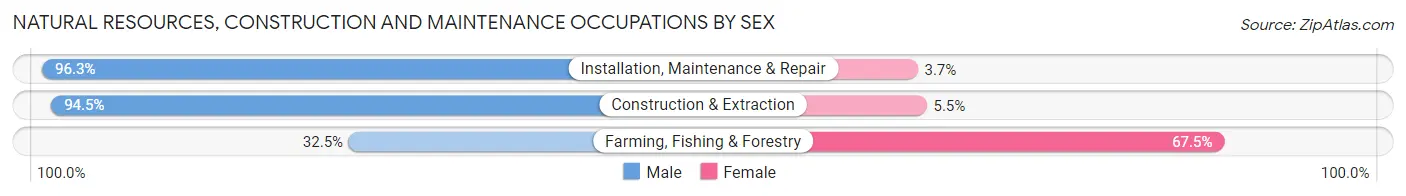
| Occupation | Male | Female |
| Farming, Fishing & Forestry | 27 (32.5%) | 56 (67.5%) |
| Construction & Extraction | 2,930 (94.5%) | 172 (5.5%) |
| Installation, Maintenance & Repair | 1,054 (96.3%) | 40 (3.7%) |
| Total (Category) | 4,011 (93.7%) | 268 (6.3%) |
| Total (Overall) | 25,520 (49.5%) | 26,040 (50.5%) |
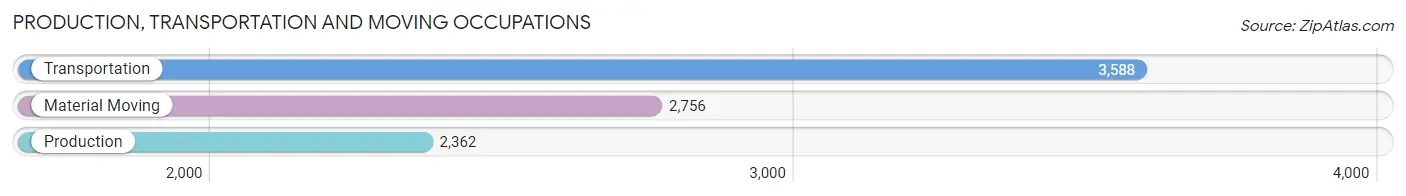
Production, Transportation and Moving Occupations
The most common Production, Transportation and Moving occupations in Brockton are Transportation (3,588 | 7.0%), Material Moving (2,756 | 5.3%), and Production (2,362 | 4.6%).
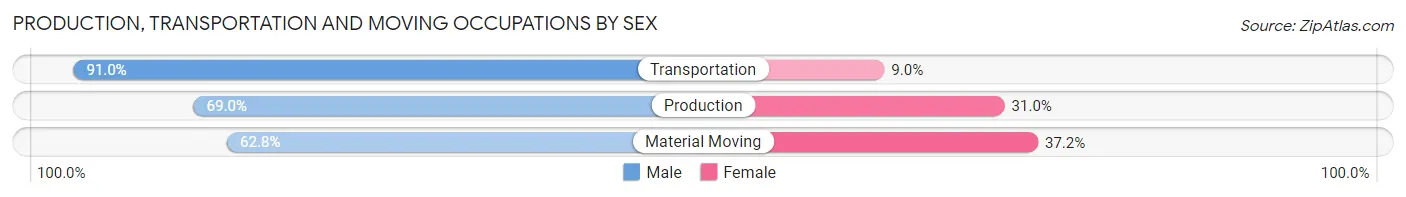
Production, Transportation and Moving Occupations by Sex
| Occupation | Male | Female |
| Production | 1,629 (69.0%) | 733 (31.0%) |
| Transportation | 3,266 (91.0%) | 322 (9.0%) |
| Material Moving | 1,732 (62.8%) | 1,024 (37.2%) |
| Total (Category) | 6,627 (76.1%) | 2,079 (23.9%) |
| Total (Overall) | 25,520 (49.5%) | 26,040 (50.5%) |
Employment Industries by Sex in Brockton
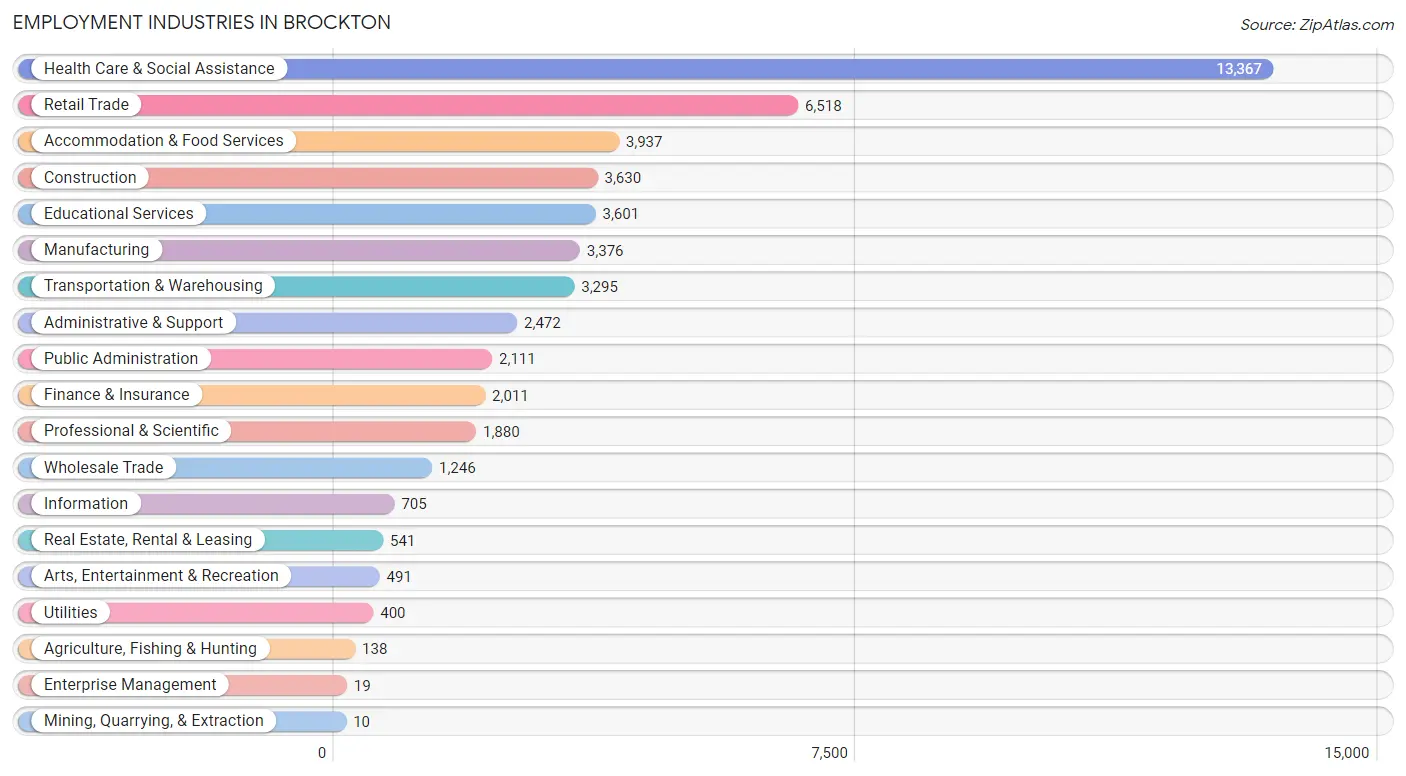
Employment Industries in Brockton
The major employment industries in Brockton include Health Care & Social Assistance (13,367 | 25.9%), Retail Trade (6,518 | 12.6%), Accommodation & Food Services (3,937 | 7.6%), Construction (3,630 | 7.0%), and Educational Services (3,601 | 7.0%).
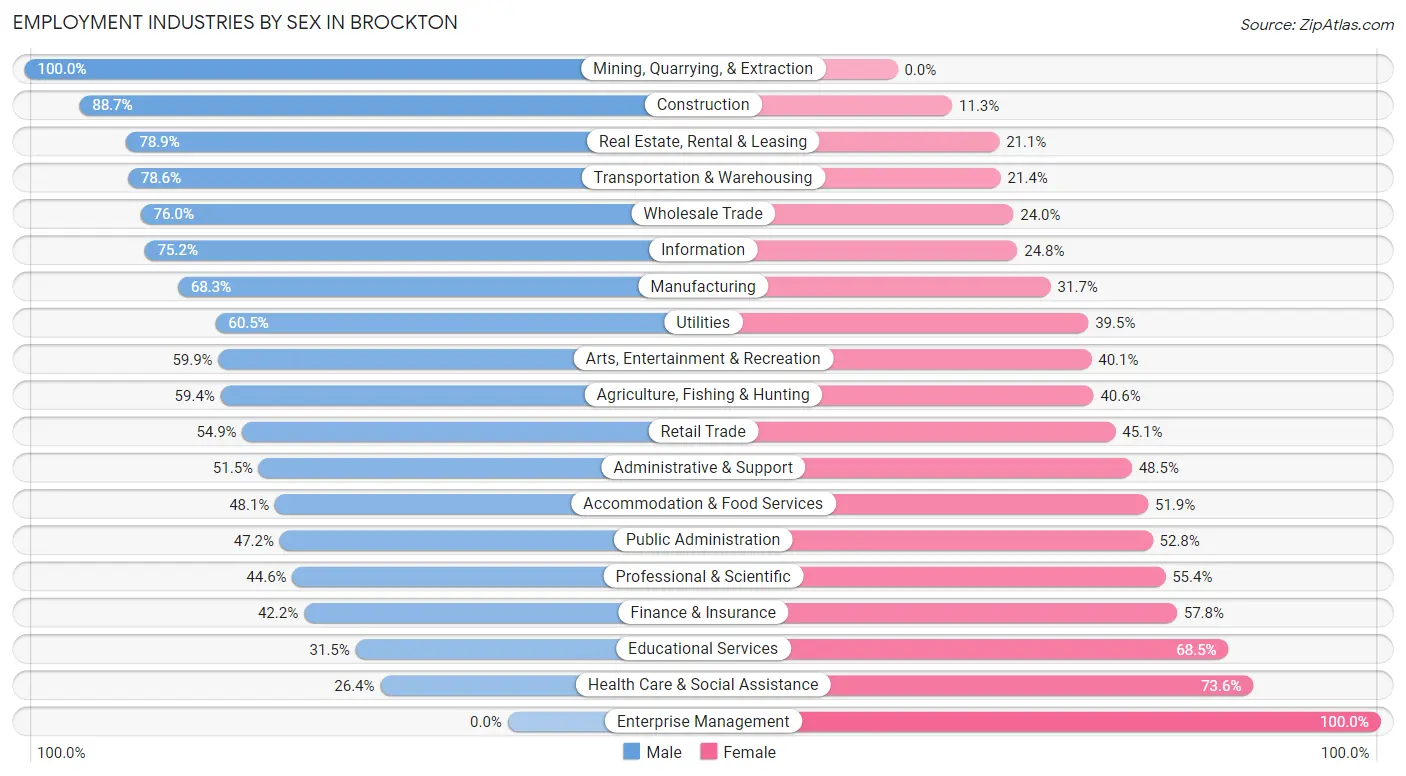
Employment Industries by Sex in Brockton
The Brockton industries that see more men than women are Mining, Quarrying, & Extraction (100.0%), Construction (88.7%), and Real Estate, Rental & Leasing (78.9%), whereas the industries that tend to have a higher number of women are Enterprise Management (100.0%), Health Care & Social Assistance (73.6%), and Educational Services (68.5%).
| Industry | Male | Female |
| Agriculture, Fishing & Hunting | 82 (59.4%) | 56 (40.6%) |
| Mining, Quarrying, & Extraction | 10 (100.0%) | 0 (0.0%) |
| Construction | 3,219 (88.7%) | 411 (11.3%) |
| Manufacturing | 2,305 (68.3%) | 1,071 (31.7%) |
| Wholesale Trade | 947 (76.0%) | 299 (24.0%) |
| Retail Trade | 3,579 (54.9%) | 2,939 (45.1%) |
| Transportation & Warehousing | 2,591 (78.6%) | 704 (21.4%) |
| Utilities | 242 (60.5%) | 158 (39.5%) |
| Information | 530 (75.2%) | 175 (24.8%) |
| Finance & Insurance | 848 (42.2%) | 1,163 (57.8%) |
| Real Estate, Rental & Leasing | 427 (78.9%) | 114 (21.1%) |
| Professional & Scientific | 838 (44.6%) | 1,042 (55.4%) |
| Enterprise Management | 0 (0.0%) | 19 (100.0%) |
| Administrative & Support | 1,273 (51.5%) | 1,199 (48.5%) |
| Educational Services | 1,134 (31.5%) | 2,467 (68.5%) |
| Health Care & Social Assistance | 3,523 (26.4%) | 9,844 (73.6%) |
| Arts, Entertainment & Recreation | 294 (59.9%) | 197 (40.1%) |
| Accommodation & Food Services | 1,895 (48.1%) | 2,042 (51.9%) |
| Public Administration | 996 (47.2%) | 1,115 (52.8%) |
| Total | 25,520 (49.5%) | 26,040 (50.5%) |
Education in Brockton
School Enrollment in Brockton
The most common levels of schooling among the 27,974 students in Brockton are high school (6,955 | 24.9%), middle school (6,495 | 23.2%), and college / undergraduate (5,863 | 21.0%).
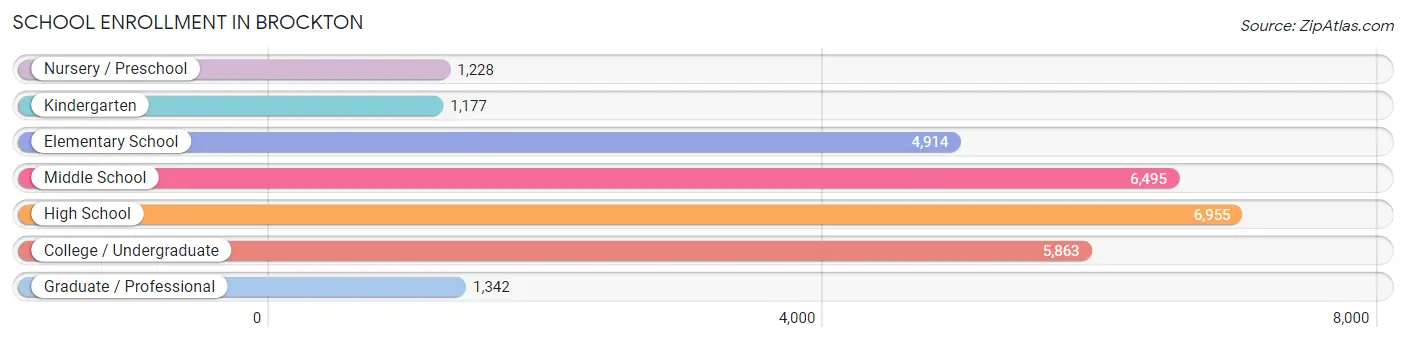
| School Level | # Students | % Students |
| Nursery / Preschool | 1,228 | 4.4% |
| Kindergarten | 1,177 | 4.2% |
| Elementary School | 4,914 | 17.6% |
| Middle School | 6,495 | 23.2% |
| High School | 6,955 | 24.9% |
| College / Undergraduate | 5,863 | 21.0% |
| Graduate / Professional | 1,342 | 4.8% |
| Total | 27,974 | 100.0% |
School Enrollment by Age by Funding Source in Brockton
Out of a total of 27,974 students who are enrolled in schools in Brockton, 4,448 (15.9%) attend a private institution, while the remaining 23,526 (84.1%) are enrolled in public schools. The age group of 35 years and over has the highest likelihood of being enrolled in private schools, with 826 (40.0% in the age bracket) enrolled. Conversely, the age group of 10 to 14 year olds has the lowest likelihood of being enrolled in a private school, with 7,163 (91.7% in the age bracket) attending a public institution.
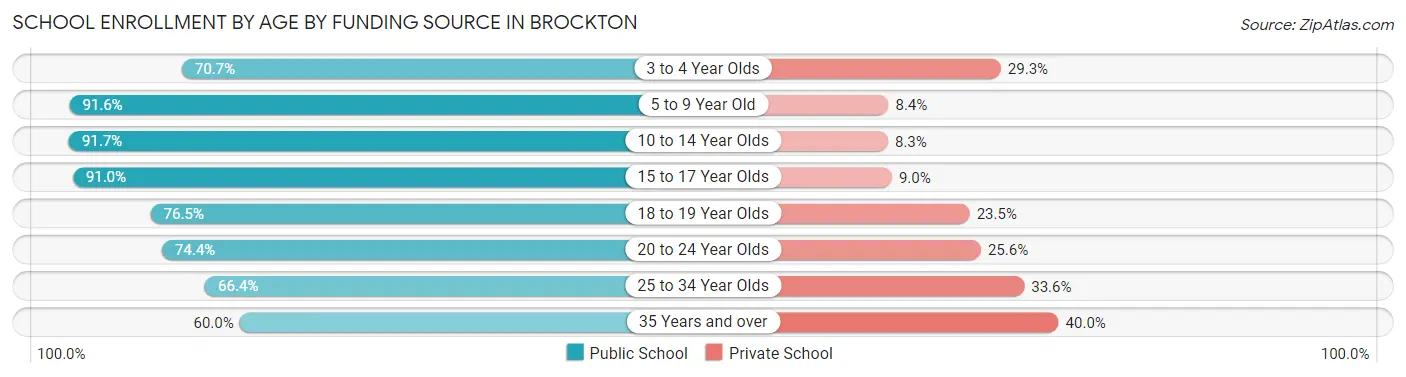
| Age Bracket | Public School | Private School |
| 3 to 4 Year Olds | 840 (70.7%) | 348 (29.3%) |
| 5 to 9 Year Old | 5,259 (91.6%) | 480 (8.4%) |
| 10 to 14 Year Olds | 7,163 (91.7%) | 645 (8.3%) |
| 15 to 17 Year Olds | 4,474 (91.0%) | 442 (9.0%) |
| 18 to 19 Year Olds | 1,600 (76.5%) | 491 (23.5%) |
| 20 to 24 Year Olds | 1,804 (74.4%) | 620 (25.6%) |
| 25 to 34 Year Olds | 1,158 (66.4%) | 587 (33.6%) |
| 35 Years and over | 1,237 (60.0%) | 826 (40.0%) |
| Total | 23,526 (84.1%) | 4,448 (15.9%) |
Educational Attainment by Field of Study in Brockton
Business (2,759 | 18.4%), education (1,658 | 11.0%), science & technology (1,636 | 10.9%), social sciences (1,400 | 9.3%), and arts & humanities (1,374 | 9.1%) are the most common fields of study among 15,020 individuals in Brockton who have obtained a bachelor's degree or higher.
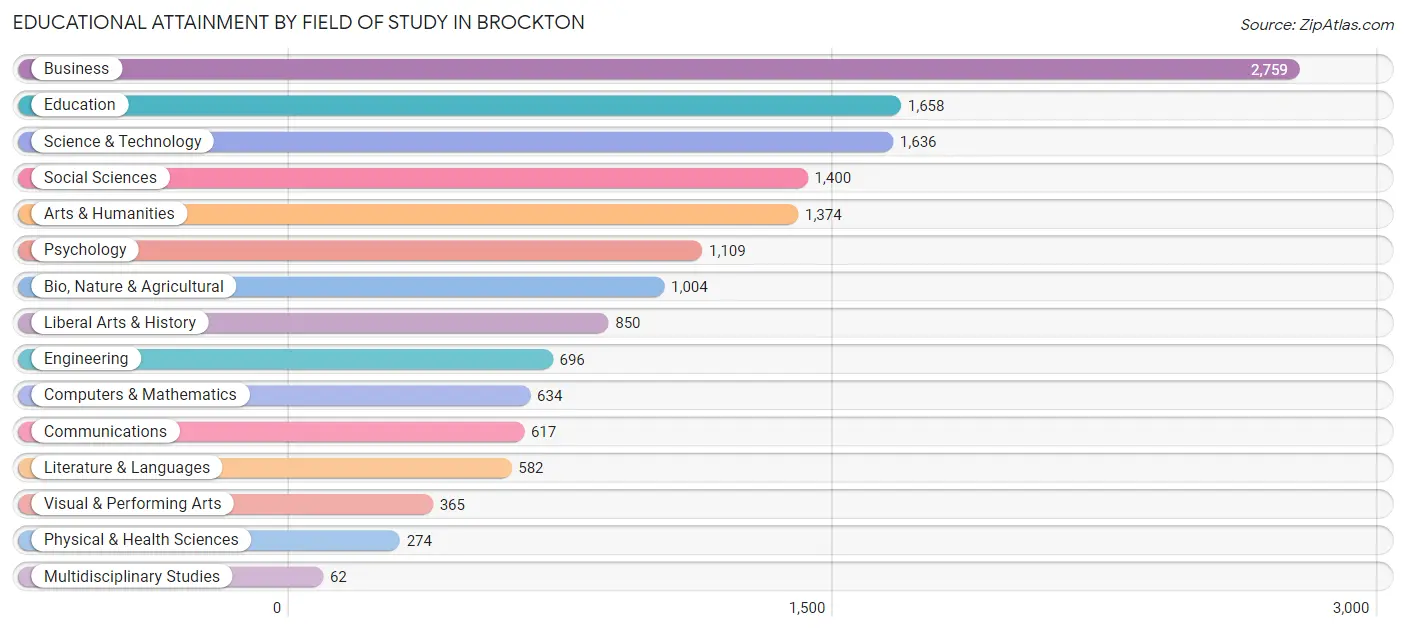
| Field of Study | # Graduates | % Graduates |
| Computers & Mathematics | 634 | 4.2% |
| Bio, Nature & Agricultural | 1,004 | 6.7% |
| Physical & Health Sciences | 274 | 1.8% |
| Psychology | 1,109 | 7.4% |
| Social Sciences | 1,400 | 9.3% |
| Engineering | 696 | 4.6% |
| Multidisciplinary Studies | 62 | 0.4% |
| Science & Technology | 1,636 | 10.9% |
| Business | 2,759 | 18.4% |
| Education | 1,658 | 11.0% |
| Literature & Languages | 582 | 3.9% |
| Liberal Arts & History | 850 | 5.7% |
| Visual & Performing Arts | 365 | 2.4% |
| Communications | 617 | 4.1% |
| Arts & Humanities | 1,374 | 9.1% |
| Total | 15,020 | 100.0% |
Transportation & Commute in Brockton
Vehicle Availability by Sex in Brockton
The most prevalent vehicle ownership categories in Brockton are males with 2 vehicles (10,414, accounting for 42.5%) and females with 2 vehicles (9,832, making up 41.9%).
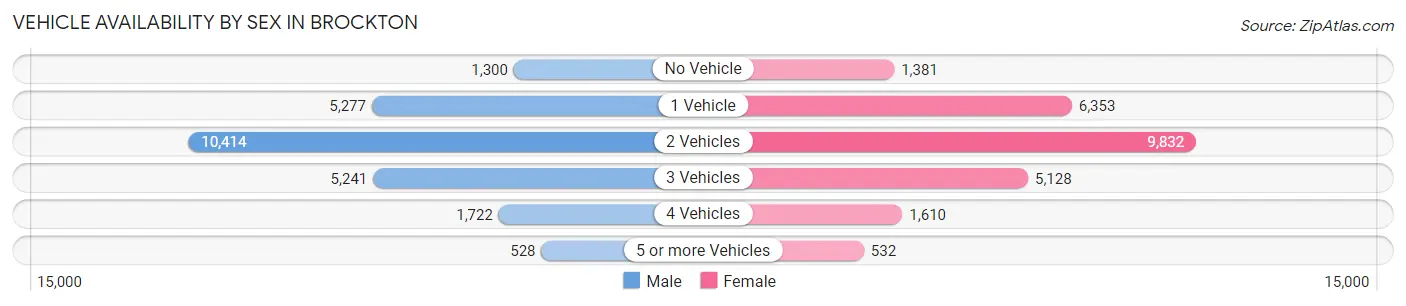
| Vehicles Available | Male | Female |
| No Vehicle | 1,300 (5.3%) | 1,381 (5.6%) |
| 1 Vehicle | 5,277 (21.5%) | 6,353 (25.6%) |
| 2 Vehicles | 10,414 (42.5%) | 9,832 (39.6%) |
| 3 Vehicles | 5,241 (21.4%) | 5,128 (20.6%) |
| 4 Vehicles | 1,722 (7.0%) | 1,610 (6.5%) |
| 5 or more Vehicles | 528 (2.2%) | 532 (2.1%) |
| Total | 24,482 (100.0%) | 24,836 (100.0%) |
Commute Time in Brockton
The most frequently occuring commute durations in Brockton are 10 to 14 minutes (6,898 commuters, 14.8%), 30 to 34 minutes (6,140 commuters, 13.1%), and 20 to 24 minutes (5,704 commuters, 12.2%).
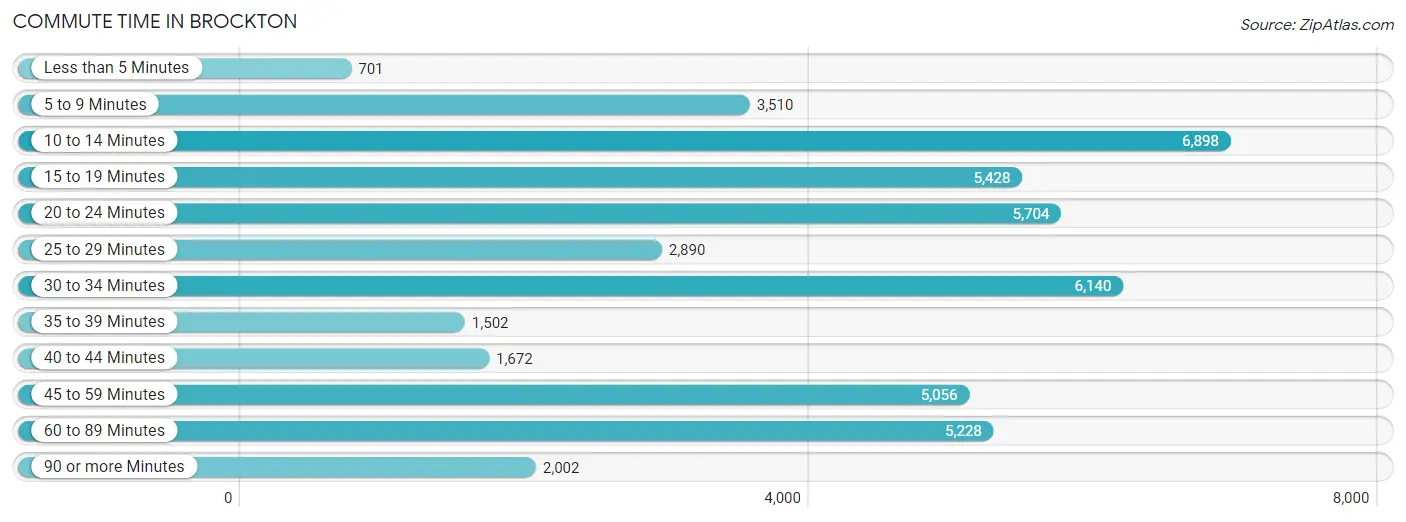
| Commute Time | # Commuters | % Commuters |
| Less than 5 Minutes | 701 | 1.5% |
| 5 to 9 Minutes | 3,510 | 7.5% |
| 10 to 14 Minutes | 6,898 | 14.8% |
| 15 to 19 Minutes | 5,428 | 11.6% |
| 20 to 24 Minutes | 5,704 | 12.2% |
| 25 to 29 Minutes | 2,890 | 6.2% |
| 30 to 34 Minutes | 6,140 | 13.1% |
| 35 to 39 Minutes | 1,502 | 3.2% |
| 40 to 44 Minutes | 1,672 | 3.6% |
| 45 to 59 Minutes | 5,056 | 10.8% |
| 60 to 89 Minutes | 5,228 | 11.2% |
| 90 or more Minutes | 2,002 | 4.3% |
Commute Time by Sex in Brockton
The most common commute times in Brockton are 10 to 14 minutes (3,594 commuters, 15.3%) for males and 10 to 14 minutes (3,304 commuters, 14.2%) for females.
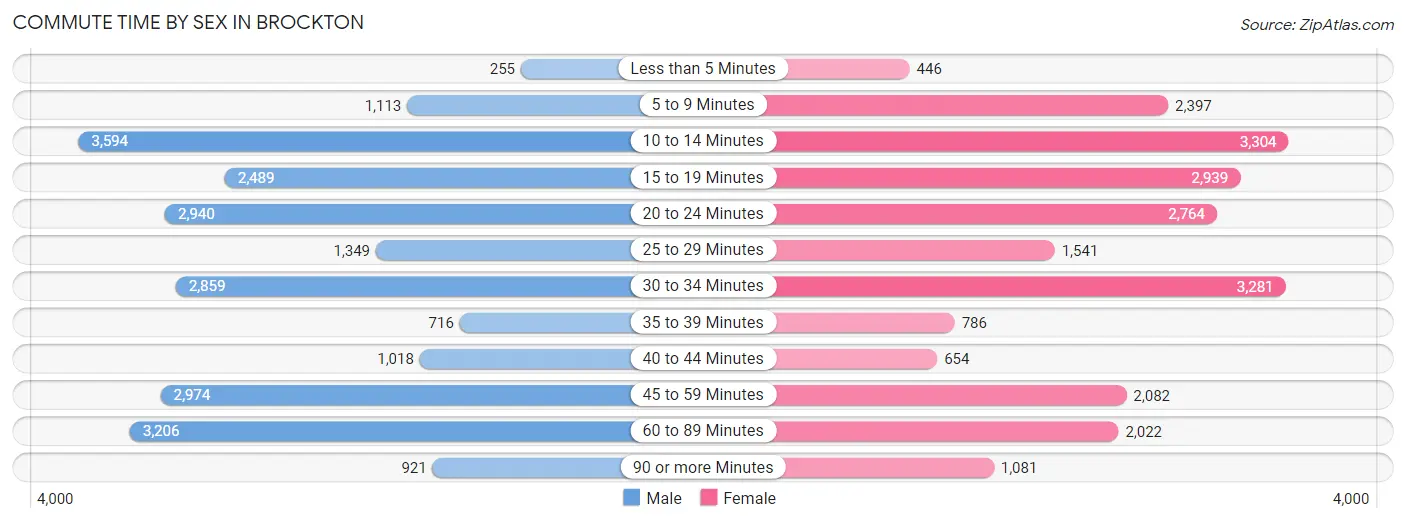
| Commute Time | Male | Female |
| Less than 5 Minutes | 255 (1.1%) | 446 (1.9%) |
| 5 to 9 Minutes | 1,113 (4.8%) | 2,397 (10.3%) |
| 10 to 14 Minutes | 3,594 (15.3%) | 3,304 (14.2%) |
| 15 to 19 Minutes | 2,489 (10.6%) | 2,939 (12.6%) |
| 20 to 24 Minutes | 2,940 (12.6%) | 2,764 (11.9%) |
| 25 to 29 Minutes | 1,349 (5.8%) | 1,541 (6.6%) |
| 30 to 34 Minutes | 2,859 (12.2%) | 3,281 (14.1%) |
| 35 to 39 Minutes | 716 (3.1%) | 786 (3.4%) |
| 40 to 44 Minutes | 1,018 (4.3%) | 654 (2.8%) |
| 45 to 59 Minutes | 2,974 (12.7%) | 2,082 (8.9%) |
| 60 to 89 Minutes | 3,206 (13.7%) | 2,022 (8.7%) |
| 90 or more Minutes | 921 (3.9%) | 1,081 (4.6%) |
Time of Departure to Work by Sex in Brockton
The most frequent times of departure to work in Brockton are 12:00 PM to 3:59 PM (3,140, 13.4%) for males and 12:00 PM to 3:59 PM (3,015, 12.9%) for females.
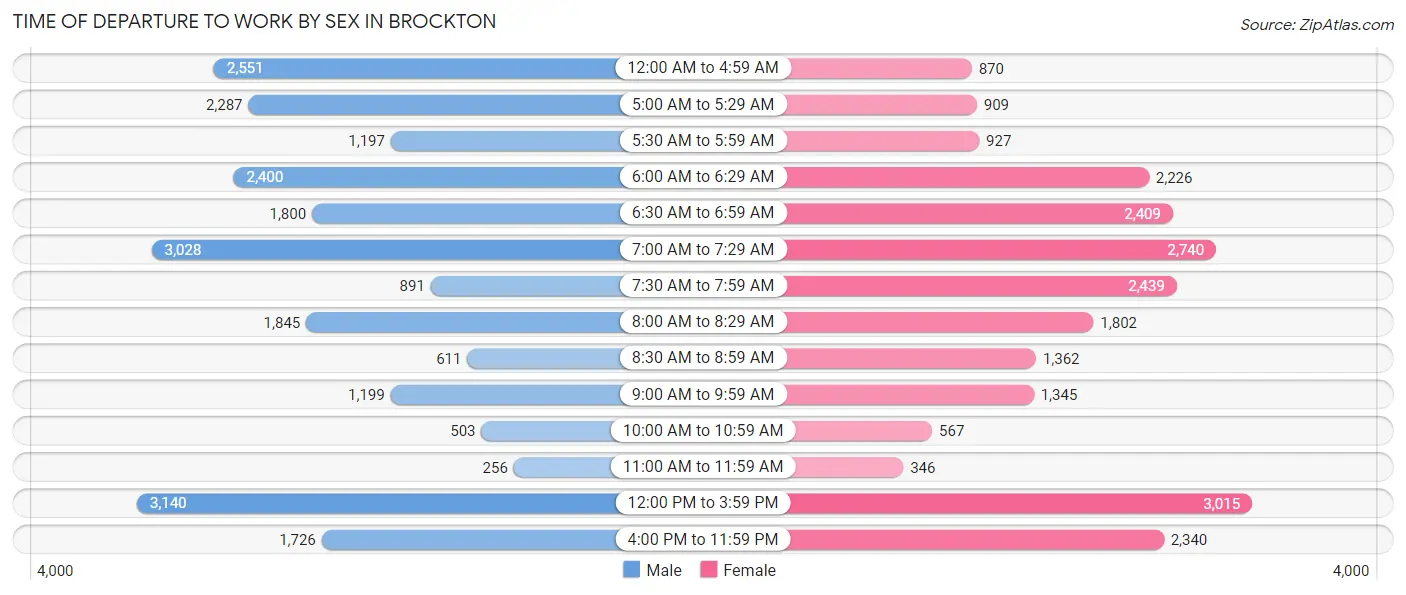
| Time of Departure | Male | Female |
| 12:00 AM to 4:59 AM | 2,551 (10.9%) | 870 (3.7%) |
| 5:00 AM to 5:29 AM | 2,287 (9.8%) | 909 (3.9%) |
| 5:30 AM to 5:59 AM | 1,197 (5.1%) | 927 (4.0%) |
| 6:00 AM to 6:29 AM | 2,400 (10.2%) | 2,226 (9.6%) |
| 6:30 AM to 6:59 AM | 1,800 (7.7%) | 2,409 (10.3%) |
| 7:00 AM to 7:29 AM | 3,028 (12.9%) | 2,740 (11.8%) |
| 7:30 AM to 7:59 AM | 891 (3.8%) | 2,439 (10.5%) |
| 8:00 AM to 8:29 AM | 1,845 (7.9%) | 1,802 (7.7%) |
| 8:30 AM to 8:59 AM | 611 (2.6%) | 1,362 (5.9%) |
| 9:00 AM to 9:59 AM | 1,199 (5.1%) | 1,345 (5.8%) |
| 10:00 AM to 10:59 AM | 503 (2.1%) | 567 (2.4%) |
| 11:00 AM to 11:59 AM | 256 (1.1%) | 346 (1.5%) |
| 12:00 PM to 3:59 PM | 3,140 (13.4%) | 3,015 (12.9%) |
| 4:00 PM to 11:59 PM | 1,726 (7.4%) | 2,340 (10.0%) |
| Total | 23,434 (100.0%) | 23,297 (100.0%) |
Housing Occupancy in Brockton
Occupancy by Ownership in Brockton
Of the total 35,489 dwellings in Brockton, owner-occupied units account for 20,018 (56.4%), while renter-occupied units make up 15,471 (43.6%).
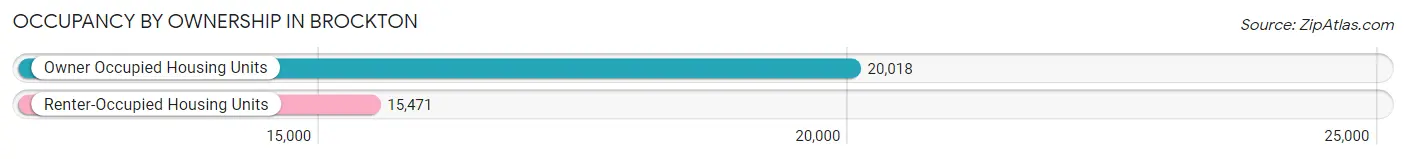
| Occupancy | # Housing Units | % Housing Units |
| Owner Occupied Housing Units | 20,018 | 56.4% |
| Renter-Occupied Housing Units | 15,471 | 43.6% |
| Total Occupied Housing Units | 35,489 | 100.0% |
Occupancy by Household Size in Brockton
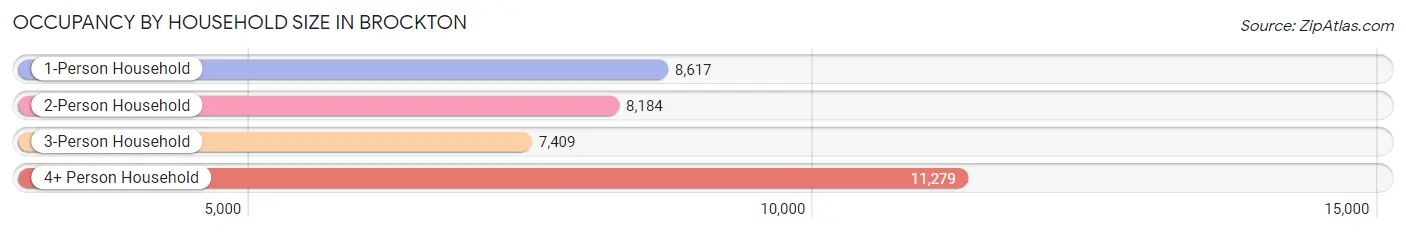
| Household Size | # Housing Units | % Housing Units |
| 1-Person Household | 8,617 | 24.3% |
| 2-Person Household | 8,184 | 23.1% |
| 3-Person Household | 7,409 | 20.9% |
| 4+ Person Household | 11,279 | 31.8% |
| Total Housing Units | 35,489 | 100.0% |
Occupancy by Ownership by Household Size in Brockton
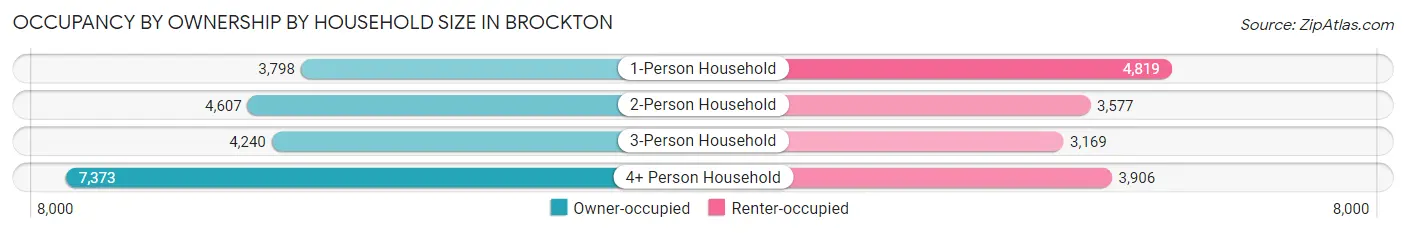
| Household Size | Owner-occupied | Renter-occupied |
| 1-Person Household | 3,798 (44.1%) | 4,819 (55.9%) |
| 2-Person Household | 4,607 (56.3%) | 3,577 (43.7%) |
| 3-Person Household | 4,240 (57.2%) | 3,169 (42.8%) |
| 4+ Person Household | 7,373 (65.4%) | 3,906 (34.6%) |
| Total Housing Units | 20,018 (56.4%) | 15,471 (43.6%) |
Occupancy by Educational Attainment in Brockton
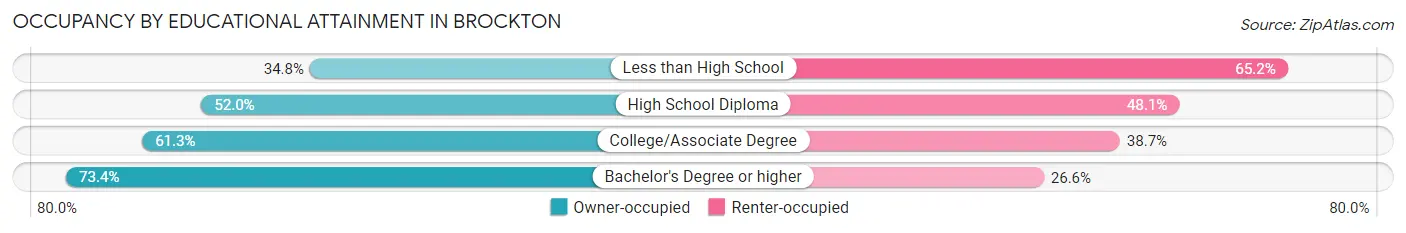
| Household Size | Owner-occupied | Renter-occupied |
| Less than High School | 2,097 (34.8%) | 3,936 (65.2%) |
| High School Diploma | 5,695 (51.9%) | 5,267 (48.0%) |
| College/Associate Degree | 6,857 (61.3%) | 4,322 (38.7%) |
| Bachelor's Degree or higher | 5,369 (73.4%) | 1,946 (26.6%) |
Occupancy by Age of Householder in Brockton
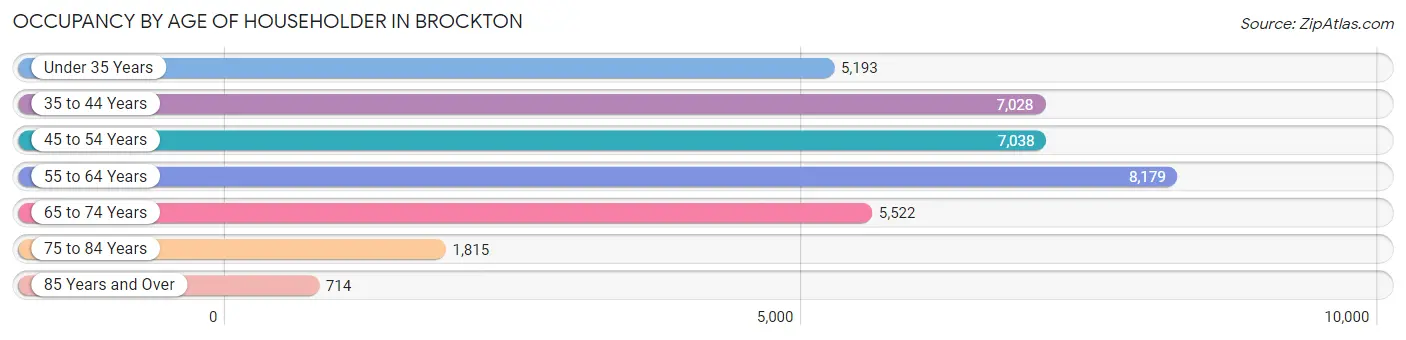
| Age Bracket | # Households | % Households |
| Under 35 Years | 5,193 | 14.6% |
| 35 to 44 Years | 7,028 | 19.8% |
| 45 to 54 Years | 7,038 | 19.8% |
| 55 to 64 Years | 8,179 | 23.1% |
| 65 to 74 Years | 5,522 | 15.6% |
| 75 to 84 Years | 1,815 | 5.1% |
| 85 Years and Over | 714 | 2.0% |
| Total | 35,489 | 100.0% |
Housing Finances in Brockton
Median Income by Occupancy in Brockton
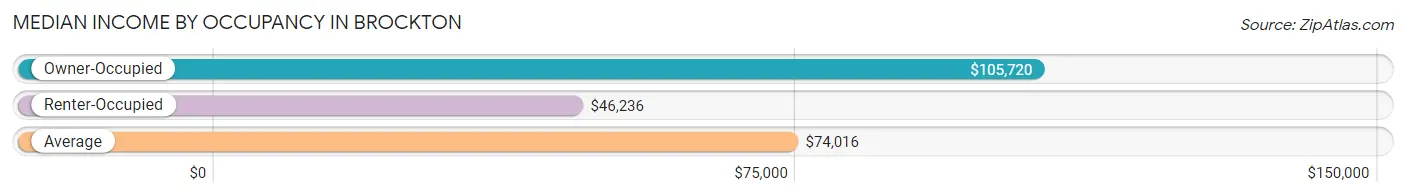
| Occupancy Type | # Households | Median Income |
| Owner-Occupied | 20,018 (56.4%) | $105,720 |
| Renter-Occupied | 15,471 (43.6%) | $46,236 |
| Average | 35,489 (100.0%) | $74,016 |
Occupancy by Householder Income Bracket in Brockton
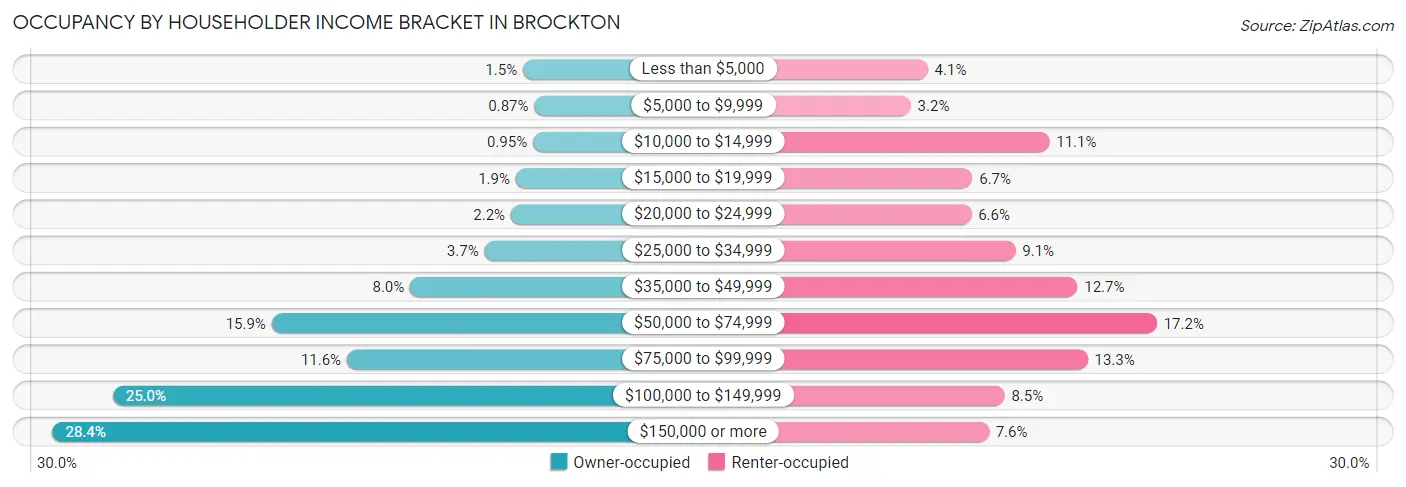
| Income Bracket | Owner-occupied | Renter-occupied |
| Less than $5,000 | 305 (1.5%) | 637 (4.1%) |
| $5,000 to $9,999 | 174 (0.9%) | 487 (3.2%) |
| $10,000 to $14,999 | 191 (0.9%) | 1,713 (11.1%) |
| $15,000 to $19,999 | 386 (1.9%) | 1,032 (6.7%) |
| $20,000 to $24,999 | 443 (2.2%) | 1,022 (6.6%) |
| $25,000 to $34,999 | 744 (3.7%) | 1,412 (9.1%) |
| $35,000 to $49,999 | 1,596 (8.0%) | 1,960 (12.7%) |
| $50,000 to $74,999 | 3,178 (15.9%) | 2,662 (17.2%) |
| $75,000 to $99,999 | 2,319 (11.6%) | 2,052 (13.3%) |
| $100,000 to $149,999 | 4,996 (25.0%) | 1,317 (8.5%) |
| $150,000 or more | 5,686 (28.4%) | 1,177 (7.6%) |
| Total | 20,018 (100.0%) | 15,471 (100.0%) |
Monthly Housing Cost Tiers in Brockton
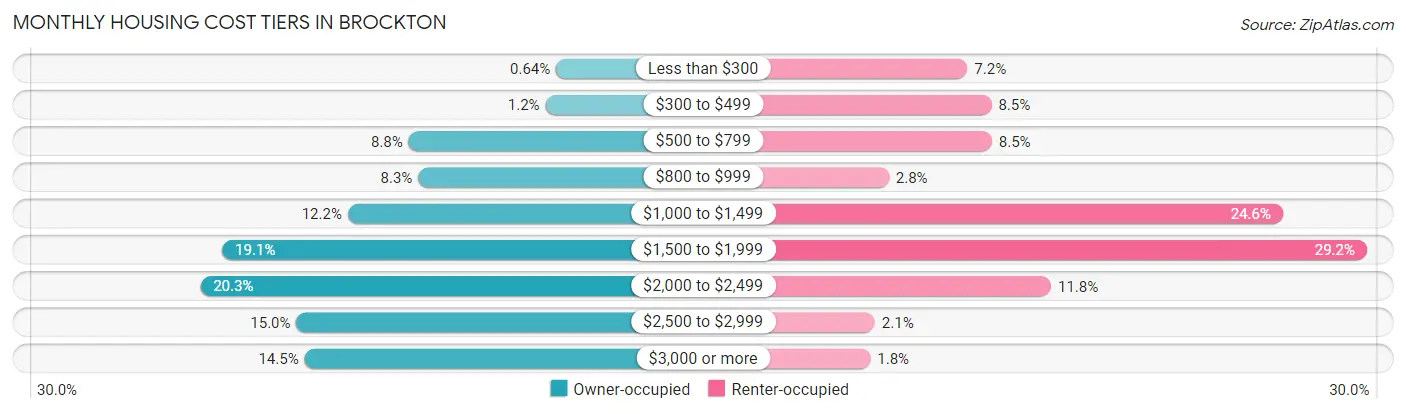
| Monthly Cost | Owner-occupied | Renter-occupied |
| Less than $300 | 129 (0.6%) | 1,111 (7.2%) |
| $300 to $499 | 246 (1.2%) | 1,317 (8.5%) |
| $500 to $799 | 1,760 (8.8%) | 1,320 (8.5%) |
| $800 to $999 | 1,653 (8.3%) | 439 (2.8%) |
| $1,000 to $1,499 | 2,433 (12.1%) | 3,806 (24.6%) |
| $1,500 to $1,999 | 3,822 (19.1%) | 4,524 (29.2%) |
| $2,000 to $2,499 | 4,064 (20.3%) | 1,825 (11.8%) |
| $2,500 to $2,999 | 3,000 (15.0%) | 320 (2.1%) |
| $3,000 or more | 2,911 (14.5%) | 281 (1.8%) |
| Total | 20,018 (100.0%) | 15,471 (100.0%) |
Physical Housing Characteristics in Brockton
Housing Structures in Brockton
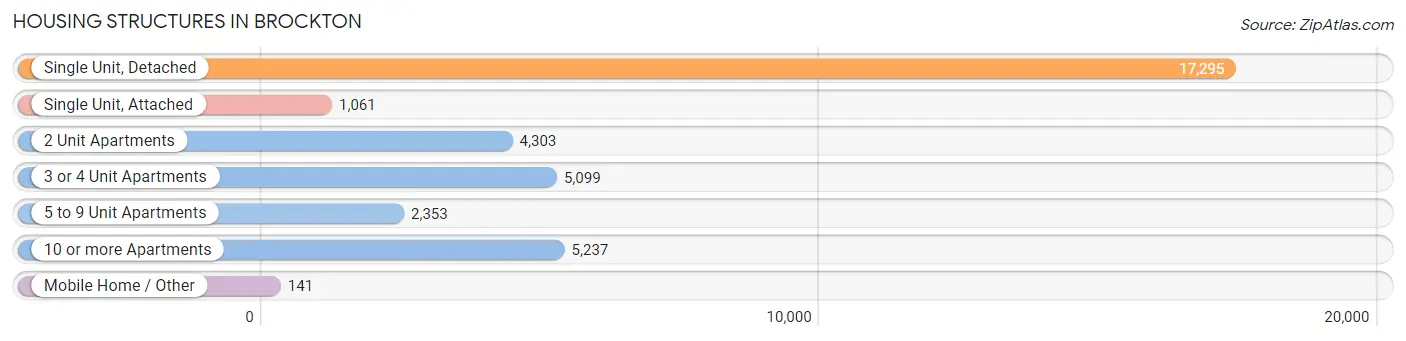
| Structure Type | # Housing Units | % Housing Units |
| Single Unit, Detached | 17,295 | 48.7% |
| Single Unit, Attached | 1,061 | 3.0% |
| 2 Unit Apartments | 4,303 | 12.1% |
| 3 or 4 Unit Apartments | 5,099 | 14.4% |
| 5 to 9 Unit Apartments | 2,353 | 6.6% |
| 10 or more Apartments | 5,237 | 14.8% |
| Mobile Home / Other | 141 | 0.4% |
| Total | 35,489 | 100.0% |
Housing Structures by Occupancy in Brockton
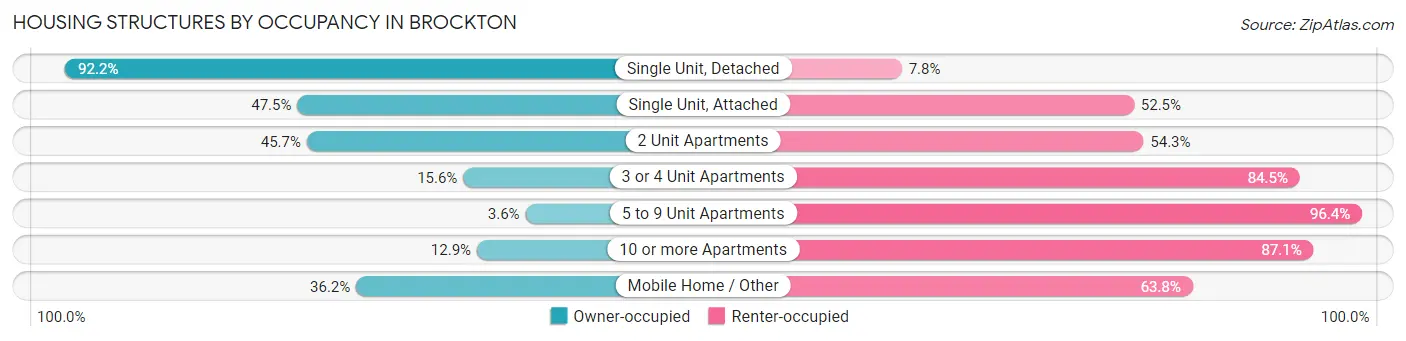
| Structure Type | Owner-occupied | Renter-occupied |
| Single Unit, Detached | 15,945 (92.2%) | 1,350 (7.8%) |
| Single Unit, Attached | 504 (47.5%) | 557 (52.5%) |
| 2 Unit Apartments | 1,965 (45.7%) | 2,338 (54.3%) |
| 3 or 4 Unit Apartments | 793 (15.5%) | 4,306 (84.5%) |
| 5 to 9 Unit Apartments | 84 (3.6%) | 2,269 (96.4%) |
| 10 or more Apartments | 676 (12.9%) | 4,561 (87.1%) |
| Mobile Home / Other | 51 (36.2%) | 90 (63.8%) |
| Total | 20,018 (56.4%) | 15,471 (43.6%) |
Housing Structures by Number of Rooms in Brockton
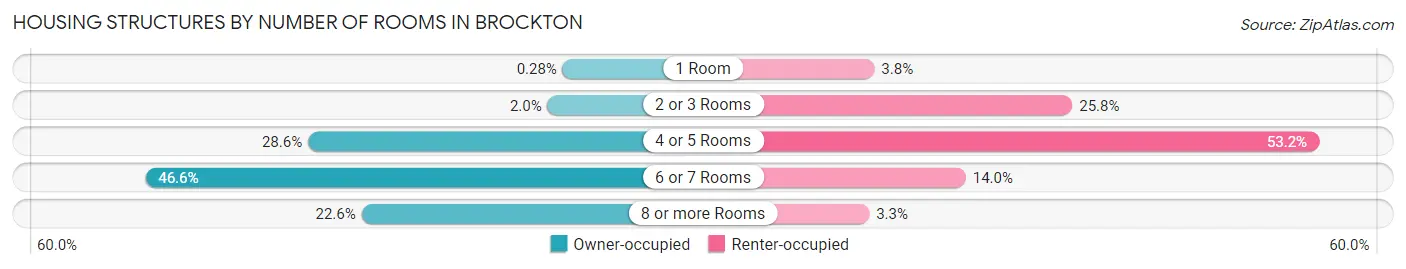
| Number of Rooms | Owner-occupied | Renter-occupied |
| 1 Room | 56 (0.3%) | 593 (3.8%) |
| 2 or 3 Rooms | 393 (2.0%) | 3,990 (25.8%) |
| 4 or 5 Rooms | 5,716 (28.5%) | 8,224 (53.2%) |
| 6 or 7 Rooms | 9,329 (46.6%) | 2,161 (14.0%) |
| 8 or more Rooms | 4,524 (22.6%) | 503 (3.3%) |
| Total | 20,018 (100.0%) | 15,471 (100.0%) |
Housing Structure by Heating Type in Brockton
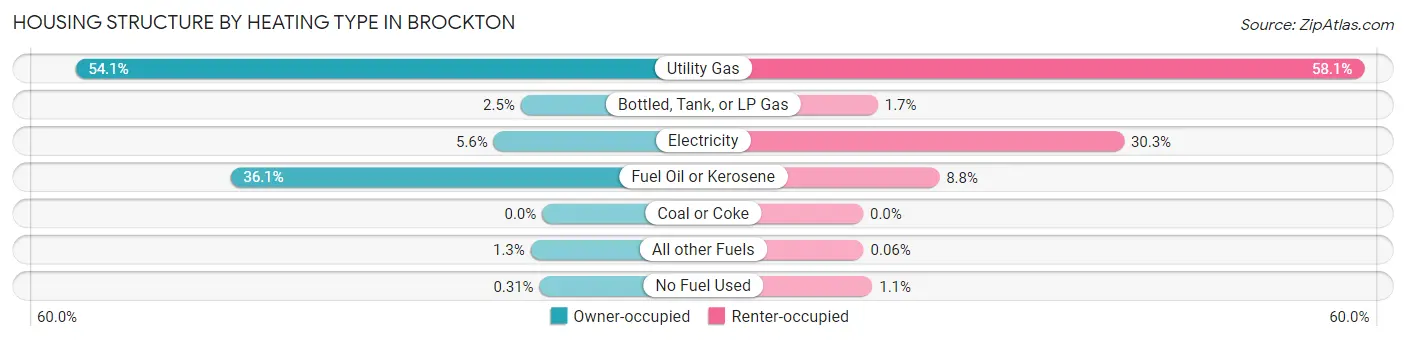
| Heating Type | Owner-occupied | Renter-occupied |
| Utility Gas | 10,834 (54.1%) | 8,987 (58.1%) |
| Bottled, Tank, or LP Gas | 497 (2.5%) | 264 (1.7%) |
| Electricity | 1,125 (5.6%) | 4,680 (30.2%) |
| Fuel Oil or Kerosene | 7,234 (36.1%) | 1,366 (8.8%) |
| Coal or Coke | 0 (0.0%) | 0 (0.0%) |
| All other Fuels | 266 (1.3%) | 9 (0.1%) |
| No Fuel Used | 62 (0.3%) | 165 (1.1%) |
| Total | 20,018 (100.0%) | 15,471 (100.0%) |
Household Vehicle Usage in Brockton
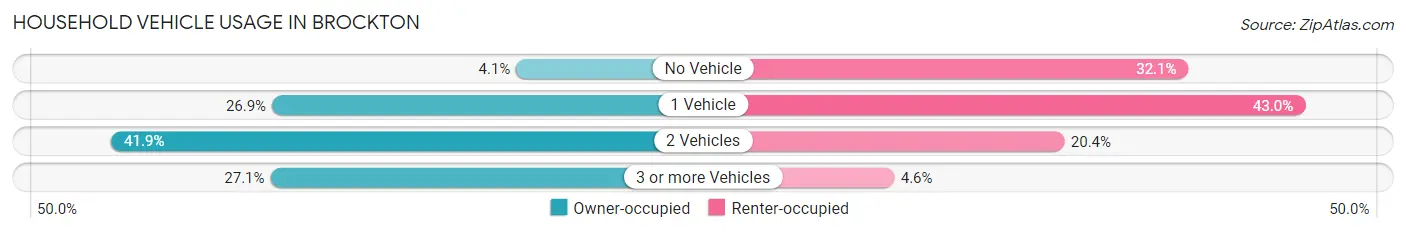
| Vehicles per Household | Owner-occupied | Renter-occupied |
| No Vehicle | 823 (4.1%) | 4,959 (32.1%) |
| 1 Vehicle | 5,387 (26.9%) | 6,645 (42.9%) |
| 2 Vehicles | 8,391 (41.9%) | 3,162 (20.4%) |
| 3 or more Vehicles | 5,417 (27.1%) | 705 (4.6%) |
| Total | 20,018 (100.0%) | 15,471 (100.0%) |
Real Estate & Mortgages in Brockton
Real Estate and Mortgage Overview in Brockton
| Characteristic | Without Mortgage | With Mortgage |
| Housing Units | 4,514 | 15,504 |
| Median Property Value | $336,700 | $373,100 |
| Median Household Income | $74,648 | $4,746 |
| Monthly Housing Costs | $853 | $2,892 |
| Real Estate Taxes | $4,568 | $428 |
Property Value by Mortgage Status in Brockton
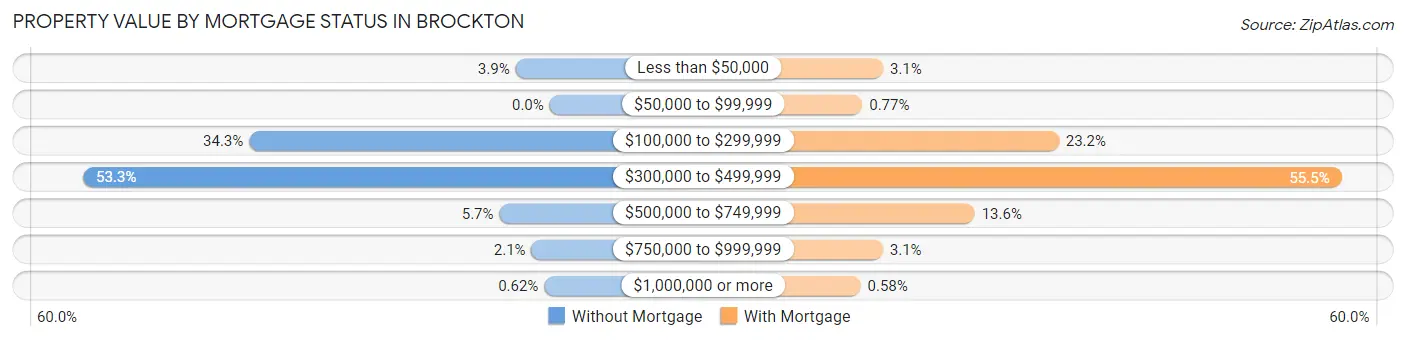
| Property Value | Without Mortgage | With Mortgage |
| Less than $50,000 | 176 (3.9%) | 487 (3.1%) |
| $50,000 to $99,999 | 0 (0.0%) | 119 (0.8%) |
| $100,000 to $299,999 | 1,550 (34.3%) | 3,602 (23.2%) |
| $300,000 to $499,999 | 2,407 (53.3%) | 8,610 (55.5%) |
| $500,000 to $749,999 | 259 (5.7%) | 2,112 (13.6%) |
| $750,000 to $999,999 | 94 (2.1%) | 484 (3.1%) |
| $1,000,000 or more | 28 (0.6%) | 90 (0.6%) |
| Total | 4,514 (100.0%) | 15,504 (100.0%) |
Household Income by Mortgage Status in Brockton
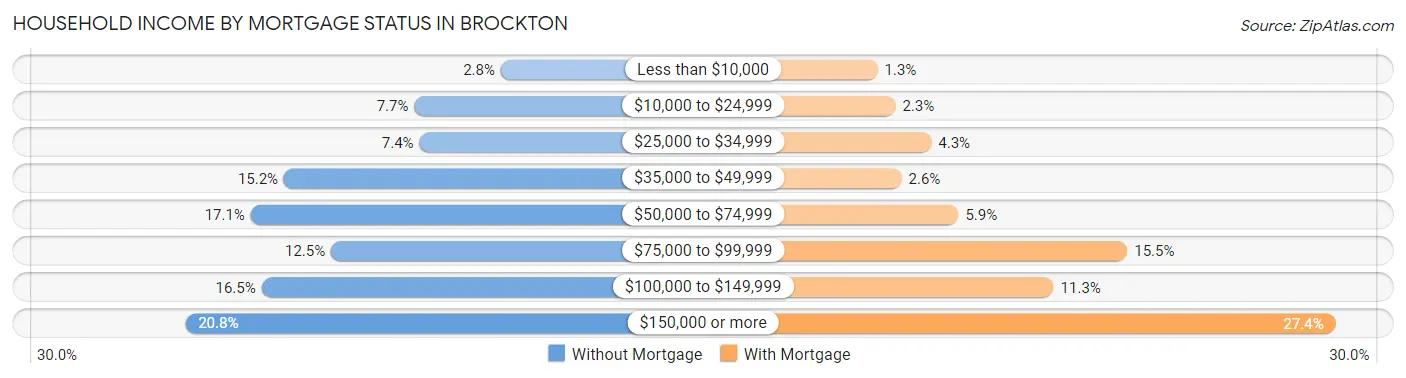
| Household Income | Without Mortgage | With Mortgage |
| Less than $10,000 | 126 (2.8%) | 196 (1.3%) |
| $10,000 to $24,999 | 349 (7.7%) | 353 (2.3%) |
| $25,000 to $34,999 | 336 (7.4%) | 671 (4.3%) |
| $35,000 to $49,999 | 685 (15.2%) | 408 (2.6%) |
| $50,000 to $74,999 | 771 (17.1%) | 911 (5.9%) |
| $75,000 to $99,999 | 564 (12.5%) | 2,407 (15.5%) |
| $100,000 to $149,999 | 743 (16.5%) | 1,755 (11.3%) |
| $150,000 or more | 940 (20.8%) | 4,253 (27.4%) |
| Total | 4,514 (100.0%) | 15,504 (100.0%) |
Property Value to Household Income Ratio in Brockton
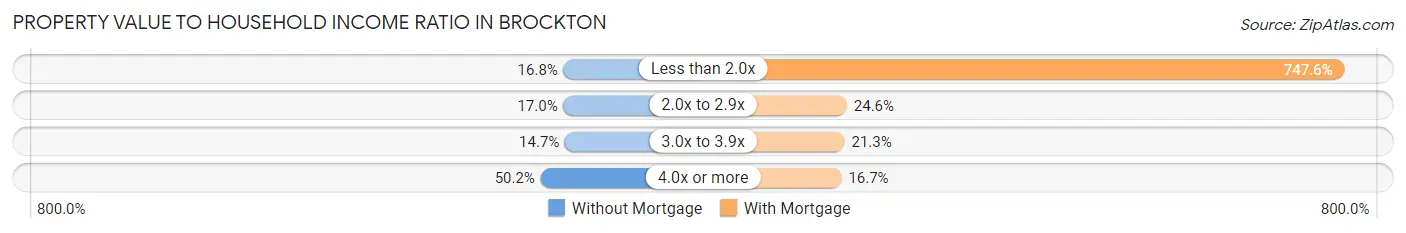
| Value-to-Income Ratio | Without Mortgage | With Mortgage |
| Less than 2.0x | 758 (16.8%) | 115,912 (747.6%) |
| 2.0x to 2.9x | 769 (17.0%) | 3,816 (24.6%) |
| 3.0x to 3.9x | 662 (14.7%) | 3,297 (21.3%) |
| 4.0x or more | 2,265 (50.2%) | 2,593 (16.7%) |
| Total | 4,514 (100.0%) | 15,504 (100.0%) |
Real Estate Taxes by Mortgage Status in Brockton
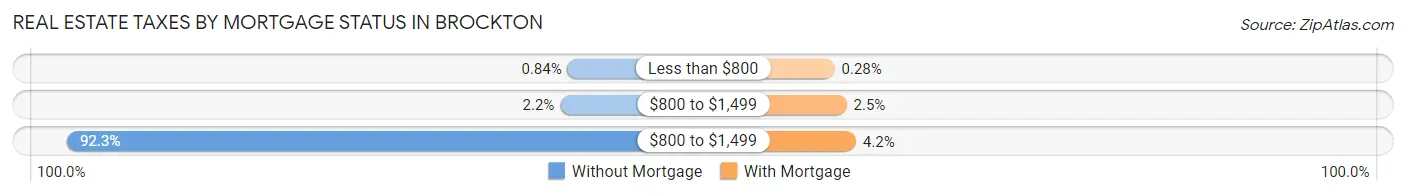
| Property Taxes | Without Mortgage | With Mortgage |
| Less than $800 | 38 (0.8%) | 43 (0.3%) |
| $800 to $1,499 | 98 (2.2%) | 385 (2.5%) |
| $800 to $1,499 | 4,164 (92.2%) | 648 (4.2%) |
| Total | 4,514 (100.0%) | 15,504 (100.0%) |
Health & Disability in Brockton
Health Insurance Coverage by Age in Brockton
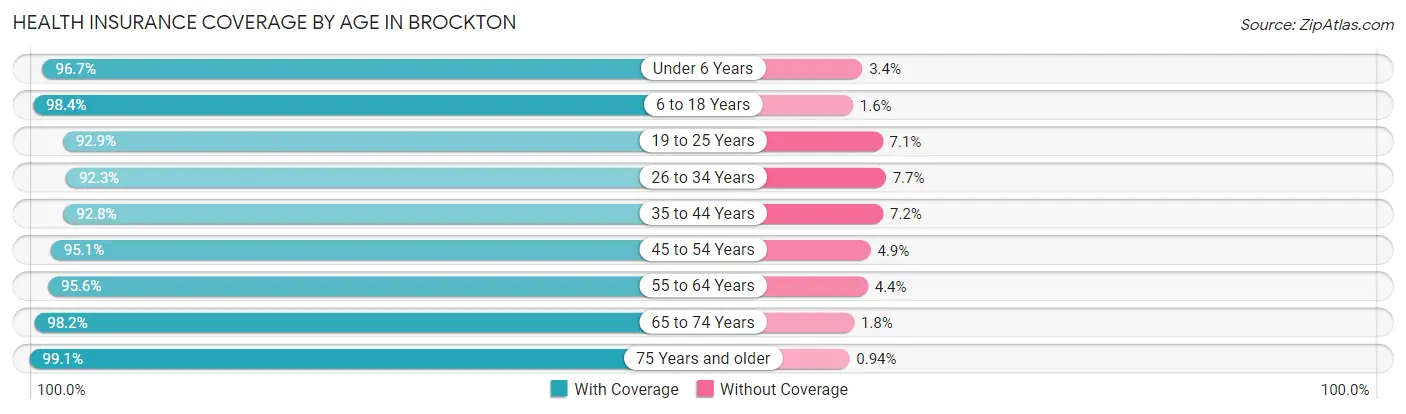
| Age Bracket | With Coverage | Without Coverage |
| Under 6 Years | 7,714 (96.7%) | 267 (3.4%) |
| 6 to 18 Years | 19,250 (98.4%) | 311 (1.6%) |
| 19 to 25 Years | 9,627 (92.9%) | 740 (7.1%) |
| 26 to 34 Years | 11,536 (92.3%) | 965 (7.7%) |
| 35 to 44 Years | 12,526 (92.8%) | 976 (7.2%) |
| 45 to 54 Years | 12,393 (95.1%) | 637 (4.9%) |
| 55 to 64 Years | 12,687 (95.6%) | 581 (4.4%) |
| 65 to 74 Years | 8,413 (98.2%) | 156 (1.8%) |
| 75 Years and older | 4,832 (99.1%) | 46 (0.9%) |
| Total | 98,978 (95.5%) | 4,679 (4.5%) |
Health Insurance Coverage by Citizenship Status in Brockton
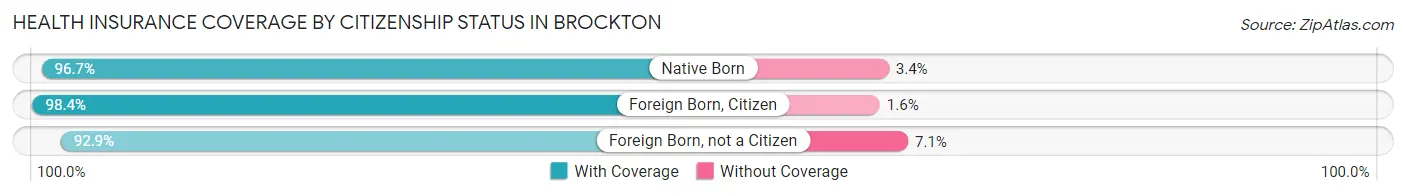
| Citizenship Status | With Coverage | Without Coverage |
| Native Born | 7,714 (96.7%) | 267 (3.4%) |
| Foreign Born, Citizen | 19,250 (98.4%) | 311 (1.6%) |
| Foreign Born, not a Citizen | 9,627 (92.9%) | 740 (7.1%) |
Health Insurance Coverage by Household Income in Brockton
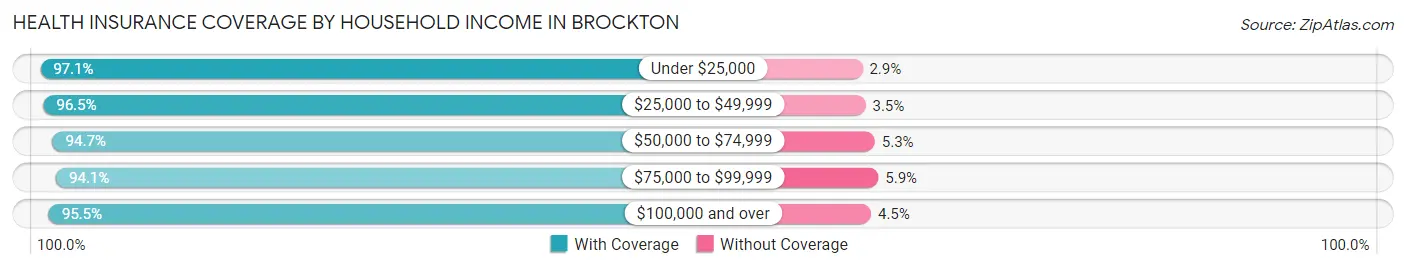
| Household Income | With Coverage | Without Coverage |
| Under $25,000 | 11,356 (97.1%) | 343 (2.9%) |
| $25,000 to $49,999 | 12,133 (96.5%) | 442 (3.5%) |
| $50,000 to $74,999 | 15,893 (94.7%) | 882 (5.3%) |
| $75,000 to $99,999 | 12,933 (94.1%) | 812 (5.9%) |
| $100,000 and over | 45,896 (95.5%) | 2,183 (4.5%) |
Public vs Private Health Insurance Coverage by Age in Brockton
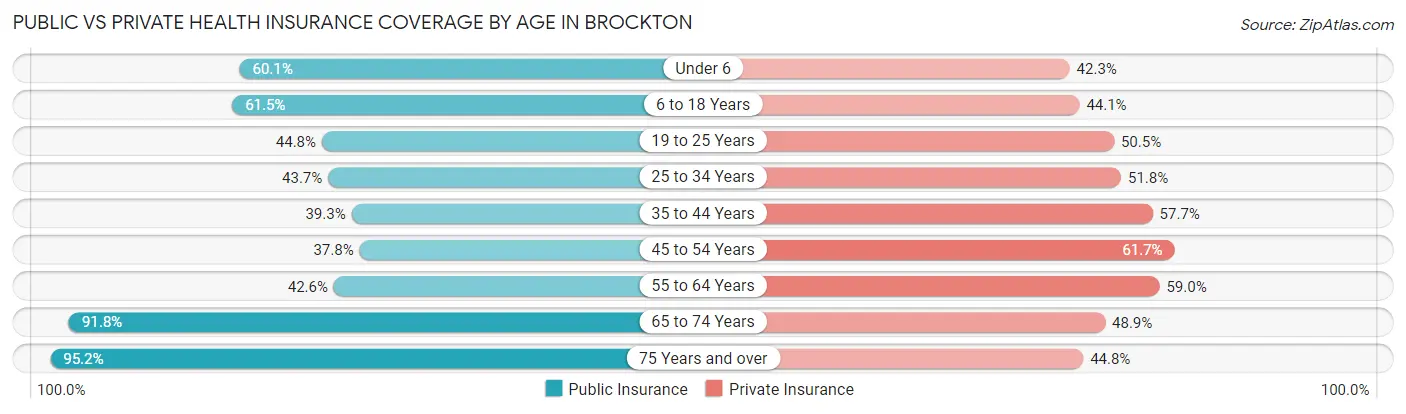
| Age Bracket | Public Insurance | Private Insurance |
| Under 6 | 4,797 (60.1%) | 3,375 (42.3%) |
| 6 to 18 Years | 12,022 (61.5%) | 8,628 (44.1%) |
| 19 to 25 Years | 4,648 (44.8%) | 5,237 (50.5%) |
| 25 to 34 Years | 5,459 (43.7%) | 6,479 (51.8%) |
| 35 to 44 Years | 5,310 (39.3%) | 7,790 (57.7%) |
| 45 to 54 Years | 4,930 (37.8%) | 8,045 (61.7%) |
| 55 to 64 Years | 5,654 (42.6%) | 7,824 (59.0%) |
| 65 to 74 Years | 7,864 (91.8%) | 4,188 (48.9%) |
| 75 Years and over | 4,645 (95.2%) | 2,186 (44.8%) |
| Total | 55,329 (53.4%) | 53,752 (51.9%) |
Disability Status by Sex by Age in Brockton
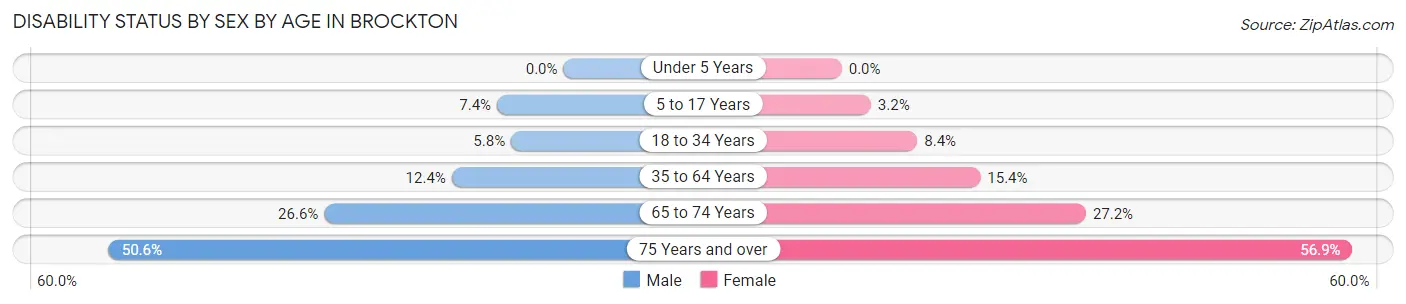
| Age Bracket | Male | Female |
| Under 5 Years | 0 (0.0%) | 0 (0.0%) |
| 5 to 17 Years | 716 (7.4%) | 315 (3.2%) |
| 18 to 34 Years | 707 (5.8%) | 1,020 (8.4%) |
| 35 to 64 Years | 2,421 (12.4%) | 3,138 (15.4%) |
| 65 to 74 Years | 1,067 (26.6%) | 1,241 (27.2%) |
| 75 Years and over | 986 (50.6%) | 1,666 (56.9%) |
Disability Class by Sex by Age in Brockton
Disability Class: Hearing Difficulty
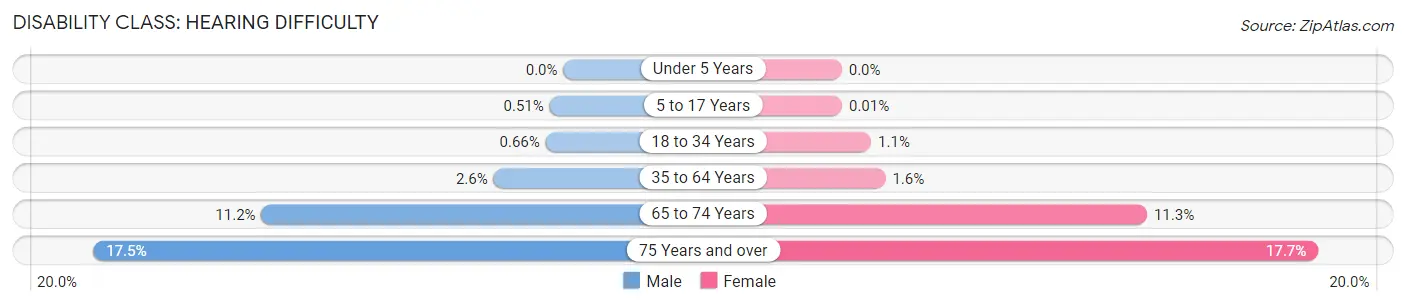
| Age Bracket | Male | Female |
| Under 5 Years | 0 (0.0%) | 0 (0.0%) |
| 5 to 17 Years | 49 (0.5%) | 1 (0.0%) |
| 18 to 34 Years | 80 (0.7%) | 132 (1.1%) |
| 35 to 64 Years | 505 (2.6%) | 330 (1.6%) |
| 65 to 74 Years | 449 (11.2%) | 517 (11.3%) |
| 75 Years and over | 340 (17.4%) | 518 (17.7%) |
Disability Class: Vision Difficulty
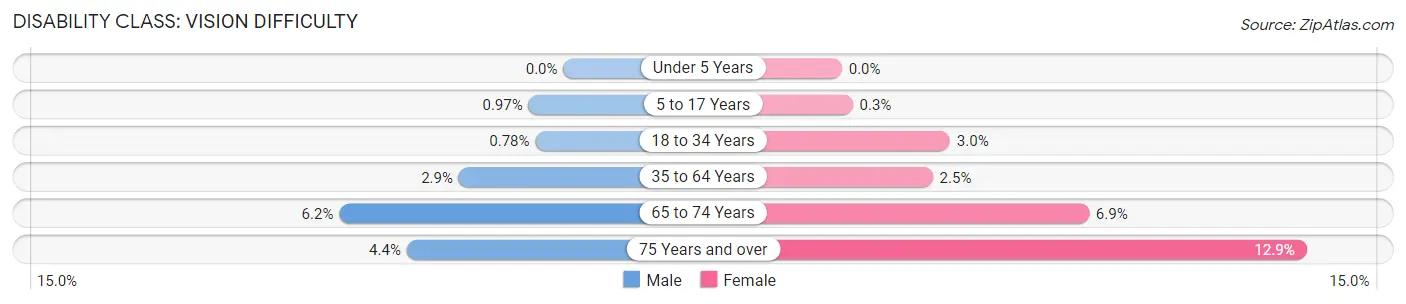
| Age Bracket | Male | Female |
| Under 5 Years | 0 (0.0%) | 0 (0.0%) |
| 5 to 17 Years | 94 (1.0%) | 29 (0.3%) |
| 18 to 34 Years | 95 (0.8%) | 365 (3.0%) |
| 35 to 64 Years | 566 (2.9%) | 515 (2.5%) |
| 65 to 74 Years | 250 (6.2%) | 314 (6.9%) |
| 75 Years and over | 85 (4.4%) | 379 (12.9%) |
Disability Class: Cognitive Difficulty
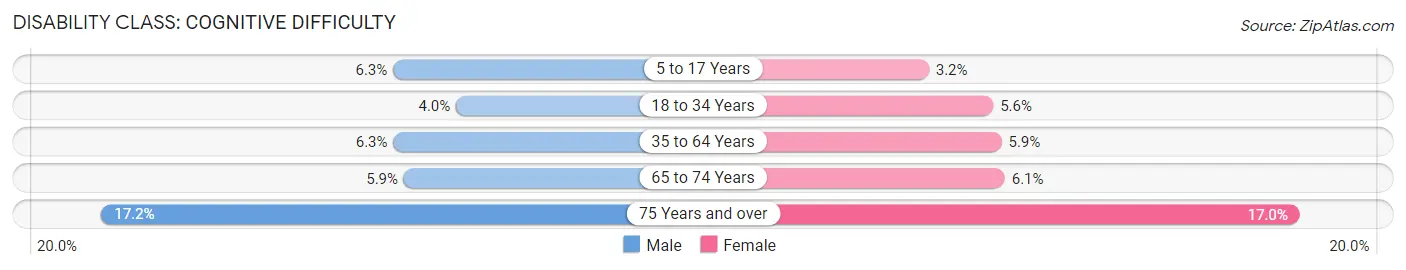
| Age Bracket | Male | Female |
| 5 to 17 Years | 612 (6.3%) | 314 (3.2%) |
| 18 to 34 Years | 483 (4.0%) | 681 (5.6%) |
| 35 to 64 Years | 1,229 (6.3%) | 1,205 (5.9%) |
| 65 to 74 Years | 237 (5.9%) | 276 (6.0%) |
| 75 Years and over | 334 (17.2%) | 498 (17.0%) |
Disability Class: Ambulatory Difficulty
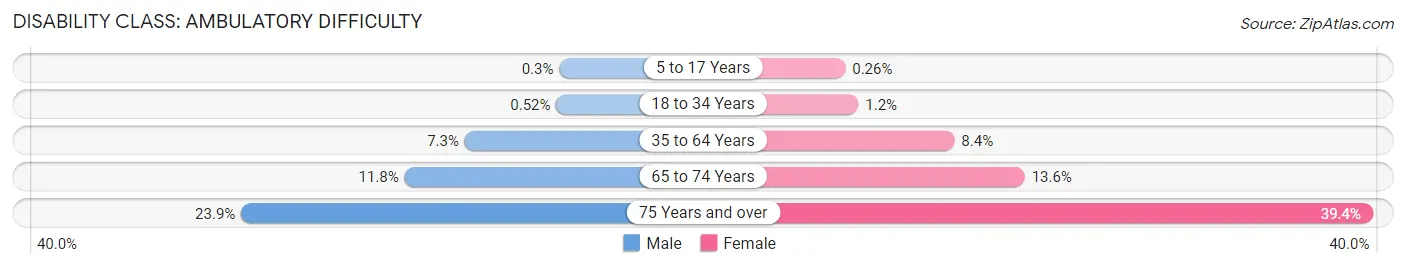
| Age Bracket | Male | Female |
| 5 to 17 Years | 29 (0.3%) | 25 (0.3%) |
| 18 to 34 Years | 63 (0.5%) | 149 (1.2%) |
| 35 to 64 Years | 1,424 (7.3%) | 1,700 (8.4%) |
| 65 to 74 Years | 472 (11.8%) | 620 (13.6%) |
| 75 Years and over | 466 (23.9%) | 1,155 (39.4%) |
Disability Class: Self-Care Difficulty
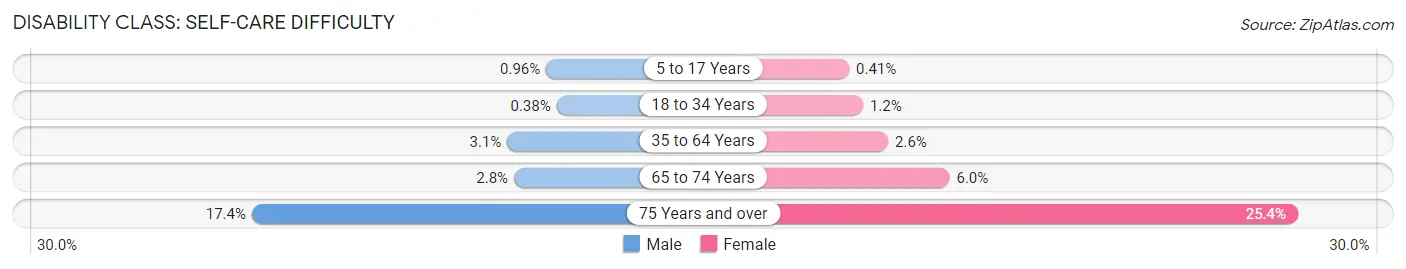
| Age Bracket | Male | Female |
| 5 to 17 Years | 93 (1.0%) | 40 (0.4%) |
| 18 to 34 Years | 46 (0.4%) | 143 (1.2%) |
| 35 to 64 Years | 610 (3.1%) | 524 (2.6%) |
| 65 to 74 Years | 110 (2.8%) | 274 (6.0%) |
| 75 Years and over | 338 (17.3%) | 744 (25.4%) |
Technology Access in Brockton
Computing Device Access in Brockton
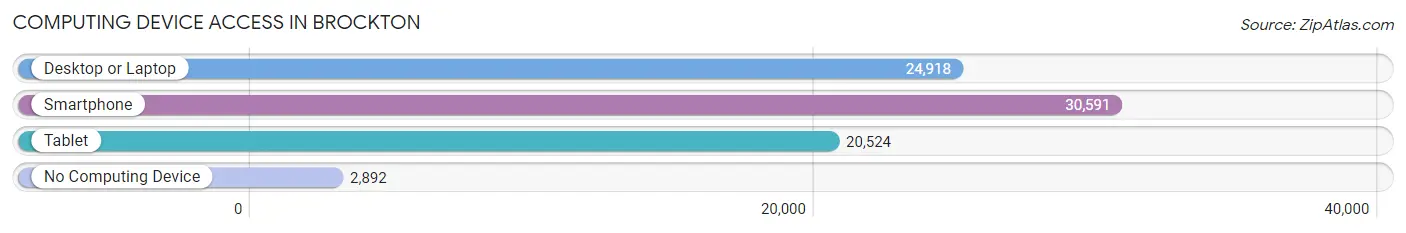
| Device Type | # Households | % Households |
| Desktop or Laptop | 24,918 | 70.2% |
| Smartphone | 30,591 | 86.2% |
| Tablet | 20,524 | 57.8% |
| No Computing Device | 2,892 | 8.2% |
| Total | 35,489 | 100.0% |
Internet Access in Brockton
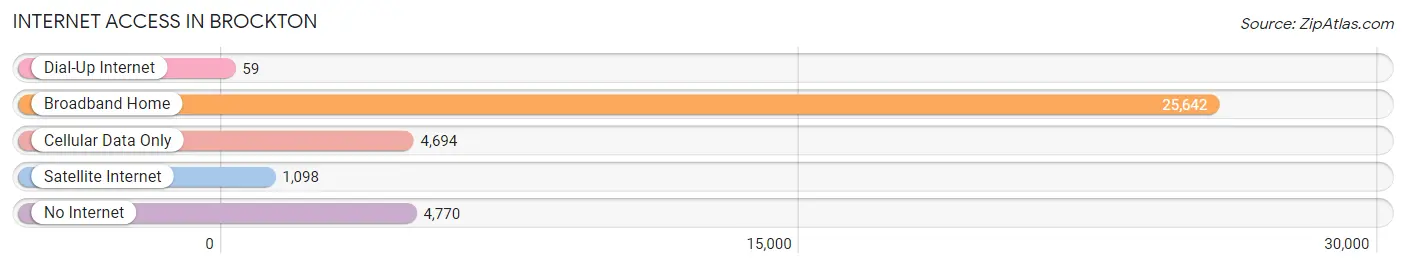
| Internet Type | # Households | % Households |
| Dial-Up Internet | 59 | 0.2% |
| Broadband Home | 25,642 | 72.3% |
| Cellular Data Only | 4,694 | 13.2% |
| Satellite Internet | 1,098 | 3.1% |
| No Internet | 4,770 | 13.4% |
| Total | 35,489 | 100.0% |
Brockton Summary
Brockton, Massachusetts is a city located in Plymouth County, approximately 25 miles south of Boston. It is the seventh largest city in the state, with a population of 95,314 as of the 2010 census. Brockton is known as the “City of Champions” due to its long history of success in professional boxing.
History
Brockton was first settled in 1649 by Europeans, who named it Bridgewater. The town was incorporated in 1821 and renamed Brockton in 1874. The city was a major shoe manufacturing center in the late 19th and early 20th centuries, and was home to the Brockton Shoemakers, a professional baseball team.
Brockton was also the birthplace of the modern boxing industry. In the late 19th century, the city was home to several boxing clubs, and in the early 20th century, it was the site of the first professional boxing match. The city has since produced several world champions, including Rocky Marciano, Marvin Hagler, and Micky Ward.
Geography
Brockton is located in southeastern Massachusetts, approximately 25 miles south of Boston. It is bordered by the towns of Abington, Easton, West Bridgewater, and Whitman. The city is situated on the banks of the Taunton River, and is home to several parks and recreational areas, including D.W. Field Park, Westgate Mall, and the Brockton Fairgrounds.
Economy
Brockton’s economy is largely based on healthcare, retail, and manufacturing. The city is home to several major healthcare providers, including Signature Healthcare, Good Samaritan Medical Center, and Brockton Hospital. It is also home to several major retail stores, including Walmart, Target, and Best Buy.
Manufacturing is also an important part of the city’s economy. Brockton is home to several major manufacturers, including Brockton Manufacturing, Brockton Plastics, and Brockton Steel. The city is also home to several smaller manufacturing companies, including Brockton Machine Works and Brockton Tool & Die.
Demographics
As of the 2010 census, Brockton had a population of 95,314. The racial makeup of the city was 57.3% White, 28.2% African American, 0.4% Native American, 2.2% Asian, 0.1% Pacific Islander, 8.7% from other races, and 3.1% from two or more races. Hispanic or Latino of any race were 16.2% of the population.
The median income for a household in Brockton was $41,945, and the median income for a family was $50,919. The per capita income for the city was $20,945. About 17.2% of families and 20.7% of the population were below the poverty line, including 28.2% of those under age 18 and 13.2% of those age 65 or over.
Brockton is a diverse city with a rich history and a vibrant economy. It is home to several major healthcare providers, retail stores, and manufacturers, and is the birthplace of the modern boxing industry. The city has a population of 95,314, with a median income of $41,945.
Common Questions
What is Per Capita Income in Brockton?
Per Capita income in Brockton is $34,180.
What is the Median Family Income in Brockton?
Median Family Income in Brockton is $85,100.
What is the Median Household income in Brockton?
Median Household Income in Brockton is $74,016.
What is Income or Wage Gap in Brockton?
Income or Wage Gap in Brockton is 27.2%.
Women in Brockton earn 72.8 cents for every dollar earned by a man.
What is Family Income Deficit in Brockton?
Family Income Deficit in Brockton is $10,762.
Families that are below poverty line in Brockton earn $10,762 less on average than the poverty threshold level.
What is Inequality or Gini Index in Brockton?
Inequality or Gini Index in Brockton is 0.46.
What is the Total Population of Brockton?
Total Population of Brockton is 104,713.
What is the Total Male Population of Brockton?
Total Male Population of Brockton is 51,194.
What is the Total Female Population of Brockton?
Total Female Population of Brockton is 53,519.
What is the Ratio of Males per 100 Females in Brockton?
There are 95.66 Males per 100 Females in Brockton.
What is the Ratio of Females per 100 Males in Brockton?
There are 104.54 Females per 100 Males in Brockton.
What is the Median Population Age in Brockton?
Median Population Age in Brockton is 36.4 Years.
What is the Average Family Size in Brockton
Average Family Size in Brockton is 3.4 People.
What is the Average Household Size in Brockton
Average Household Size in Brockton is 2.9 People.
How Large is the Labor Force in Brockton?
There are 56,192 People in the Labor Forcein in Brockton.
What is the Percentage of People in the Labor Force in Brockton?
68.7% of People are in the Labor Force in Brockton.
What is the Unemployment Rate in Brockton?
Unemployment Rate in Brockton is 8.2%.