Newnan, GA Map & Demographics
Newnan Map
Newnan Overview
$37,858
PER CAPITA INCOME
$95,605
AVG FAMILY INCOME
$74,606
AVG HOUSEHOLD INCOME
31.7%
WAGE / INCOME GAP [ % ]
68.3¢/ $1
WAGE / INCOME GAP [ $ ]
0.43
INEQUALITY / GINI INDEX
42,689
TOTAL POPULATION
19,344
MALE POPULATION
23,345
FEMALE POPULATION
82.86
MALES / 100 FEMALES
120.68
FEMALES / 100 MALES
35.0
MEDIAN AGE
3.3
AVG FAMILY SIZE
2.6
AVG HOUSEHOLD SIZE
22,207
LABOR FORCE [ PEOPLE ]
66.9%
PERCENT IN LABOR FORCE
3.1%
UNEMPLOYMENT RATE
Income in Newnan
Income Overview in Newnan
Per Capita Income in Newnan is $37,858, while median incomes of families and households are $95,605 and $74,606 respectively.
| Characteristic | Number | Measure |
| Per Capita Income | 42,689 | $37,858 |
| Median Family Income | 10,567 | $95,605 |
| Mean Family Income | 10,567 | $115,460 |
| Median Household Income | 16,386 | $74,606 |
| Mean Household Income | 16,386 | $95,398 |
| Income Deficit | 10,567 | $0 |
| Wage / Income Gap (%) | 42,689 | 31.66% |
| Wage / Income Gap ($) | 42,689 | 68.34¢ per $1 |
| Gini / Inequality Index | 42,689 | 0.43 |
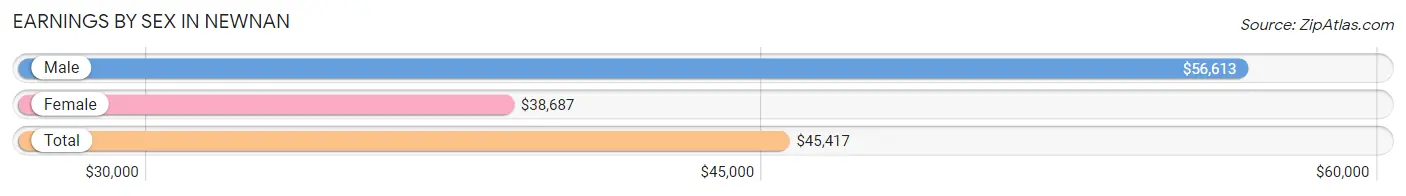
Earnings by Sex in Newnan
Average Earnings in Newnan are $45,417, $56,613 for men and $38,687 for women, a difference of 31.7%.
| Sex | Number | Average Earnings |
| Male | 11,144 (49.5%) | $56,613 |
| Female | 11,365 (50.5%) | $38,687 |
| Total | 22,509 (100.0%) | $45,417 |
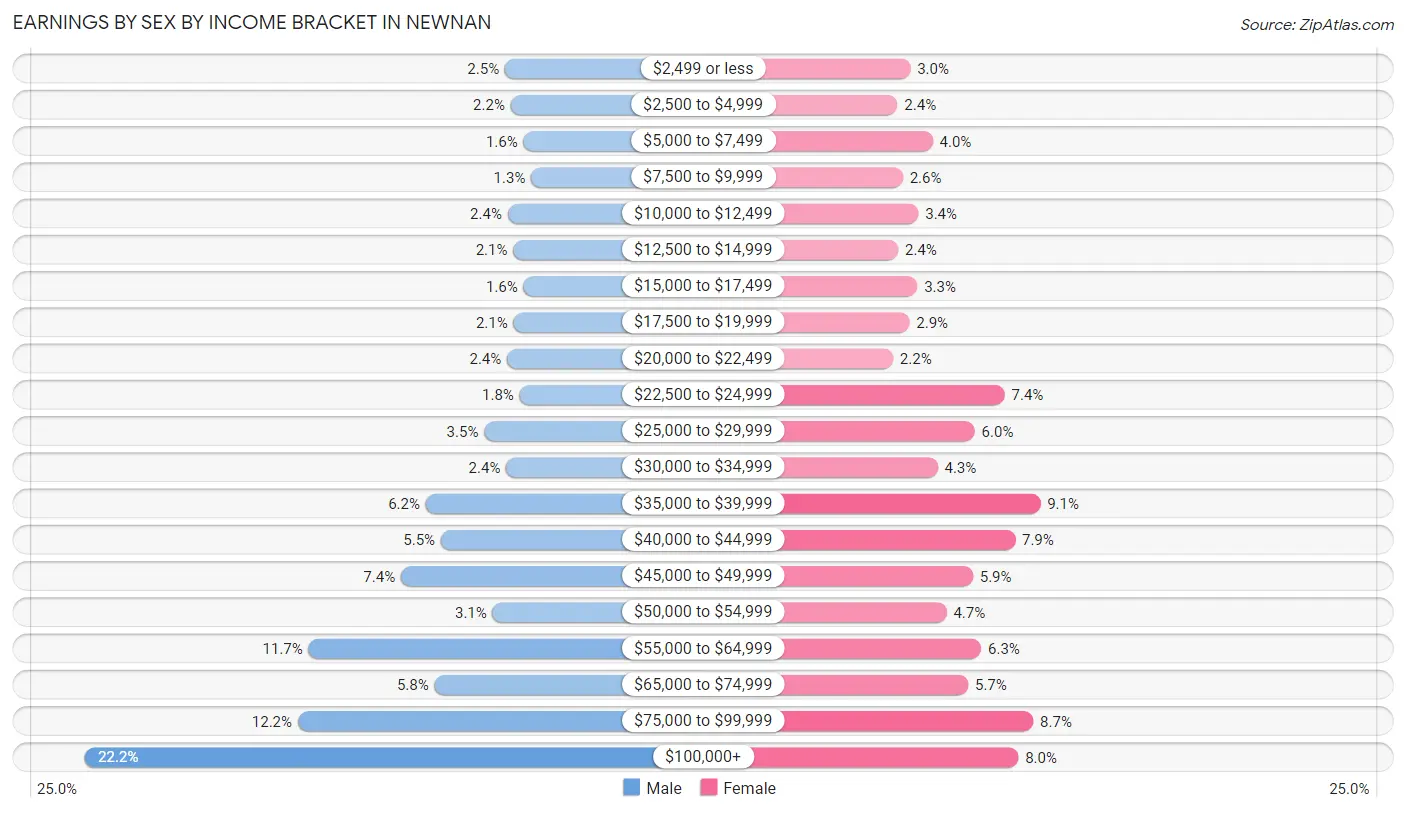
Earnings by Sex by Income Bracket in Newnan
The most common earnings brackets in Newnan are $100,000+ for men (2,471 | 22.2%) and $35,000 to $39,999 for women (1,030 | 9.1%).
| Income | Male | Female |
| $2,499 or less | 279 (2.5%) | 338 (3.0%) |
| $2,500 to $4,999 | 249 (2.2%) | 269 (2.4%) |
| $5,000 to $7,499 | 182 (1.6%) | 457 (4.0%) |
| $7,500 to $9,999 | 141 (1.3%) | 298 (2.6%) |
| $10,000 to $12,499 | 264 (2.4%) | 381 (3.4%) |
| $12,500 to $14,999 | 235 (2.1%) | 273 (2.4%) |
| $15,000 to $17,499 | 182 (1.6%) | 375 (3.3%) |
| $17,500 to $19,999 | 234 (2.1%) | 333 (2.9%) |
| $20,000 to $22,499 | 267 (2.4%) | 246 (2.2%) |
| $22,500 to $24,999 | 202 (1.8%) | 840 (7.4%) |
| $25,000 to $29,999 | 387 (3.5%) | 681 (6.0%) |
| $30,000 to $34,999 | 272 (2.4%) | 483 (4.3%) |
| $35,000 to $39,999 | 692 (6.2%) | 1,030 (9.1%) |
| $40,000 to $44,999 | 613 (5.5%) | 895 (7.9%) |
| $45,000 to $49,999 | 821 (7.4%) | 670 (5.9%) |
| $50,000 to $54,999 | 343 (3.1%) | 531 (4.7%) |
| $55,000 to $64,999 | 1,304 (11.7%) | 715 (6.3%) |
| $65,000 to $74,999 | 646 (5.8%) | 645 (5.7%) |
| $75,000 to $99,999 | 1,360 (12.2%) | 992 (8.7%) |
| $100,000+ | 2,471 (22.2%) | 913 (8.0%) |
| Total | 11,144 (100.0%) | 11,365 (100.0%) |
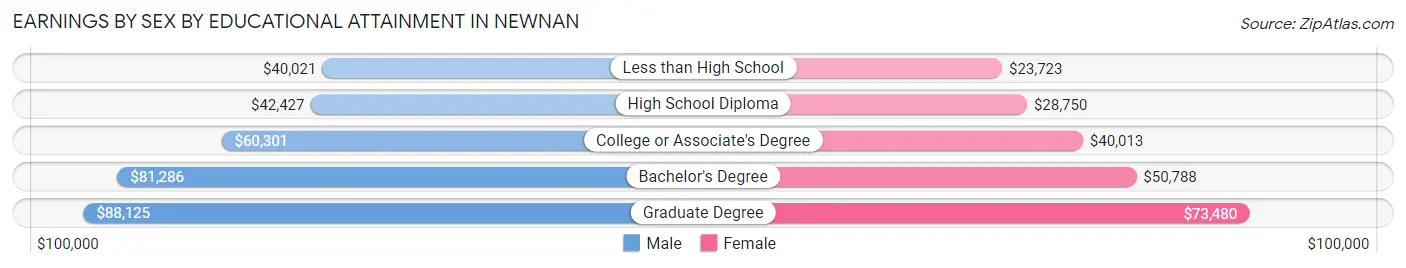
Earnings by Sex by Educational Attainment in Newnan
Average earnings in Newnan are $59,423 for men and $42,063 for women, a difference of 29.2%. Men with an educational attainment of graduate degree enjoy the highest average annual earnings of $88,125, while those with less than high school education earn the least with $40,021. Women with an educational attainment of graduate degree earn the most with the average annual earnings of $73,480, while those with less than high school education have the smallest earnings of $23,723.
| Educational Attainment | Male Income | Female Income |
| Less than High School | $40,021 | $23,723 |
| High School Diploma | $42,427 | $28,750 |
| College or Associate's Degree | $60,301 | $40,013 |
| Bachelor's Degree | $81,286 | $50,788 |
| Graduate Degree | $88,125 | $73,480 |
| Total | $59,423 | $42,063 |
Family Income in Newnan
Family Income Brackets in Newnan
According to the Newnan family income data, there are 2,219 families falling into the $100,000 to $149,999 income range, which is the most common income bracket and makes up 21.0% of all families. Conversely, the less than $10,000 income bracket is the least frequent group with only 32 families (0.3%) belonging to this category.
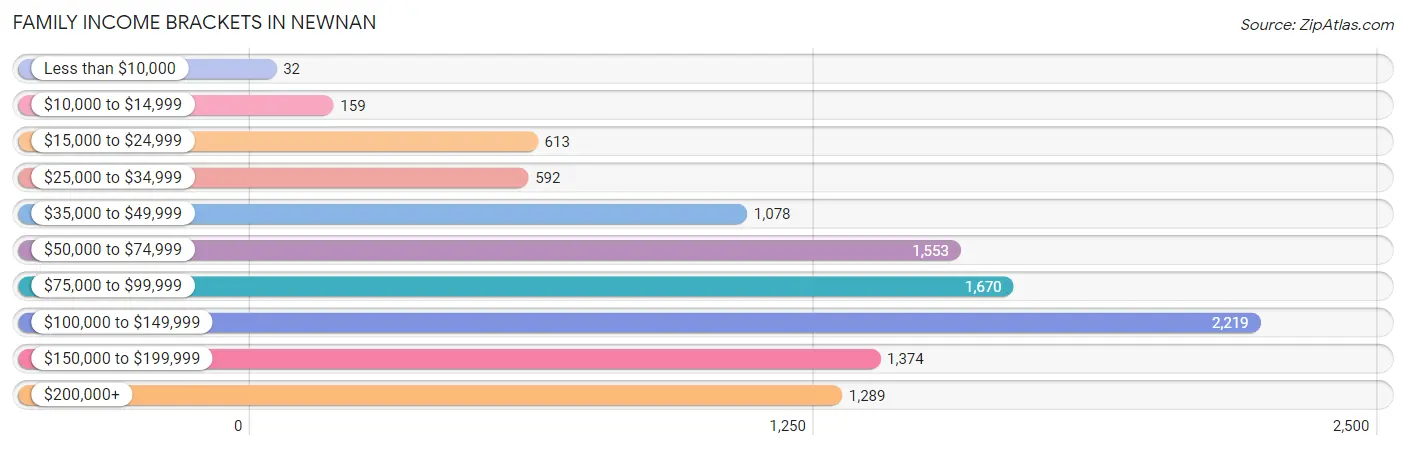
| Income Bracket | # Families | % Families |
| Less than $10,000 | 32 | 0.3% |
| $10,000 to $14,999 | 159 | 1.5% |
| $15,000 to $24,999 | 613 | 5.8% |
| $25,000 to $34,999 | 592 | 5.6% |
| $35,000 to $49,999 | 1,078 | 10.2% |
| $50,000 to $74,999 | 1,553 | 14.7% |
| $75,000 to $99,999 | 1,670 | 15.8% |
| $100,000 to $149,999 | 2,219 | 21.0% |
| $150,000 to $199,999 | 1,374 | 13.0% |
| $200,000+ | 1,289 | 12.2% |
Family Income by Famaliy Size in Newnan
7+ person families (284 | 2.7%) account for the highest median family income in Newnan with $167,794 per family, while 2-person families (4,638 | 43.9%) have the highest median income of $44,972 per family member.
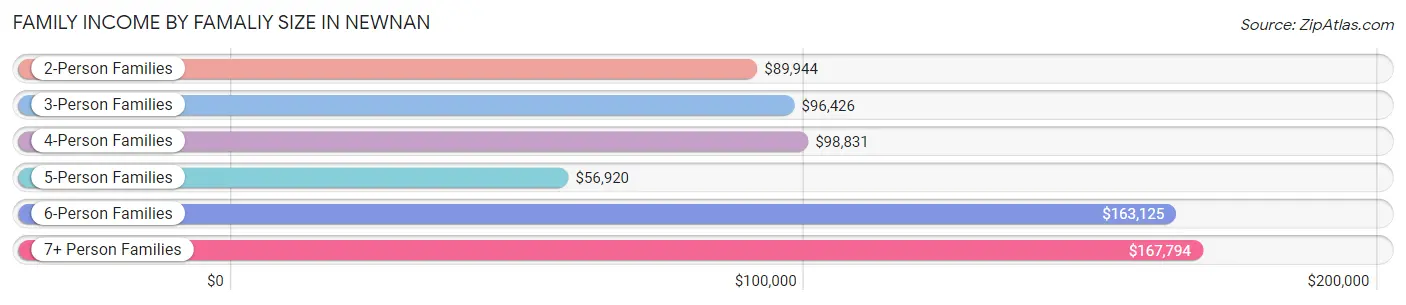
| Income Bracket | # Families | Median Income |
| 2-Person Families | 4,638 (43.9%) | $89,944 |
| 3-Person Families | 2,390 (22.6%) | $96,426 |
| 4-Person Families | 2,486 (23.5%) | $98,831 |
| 5-Person Families | 570 (5.4%) | $56,920 |
| 6-Person Families | 199 (1.9%) | $163,125 |
| 7+ Person Families | 284 (2.7%) | $167,794 |
| Total | 10,567 (100.0%) | $95,605 |
Family Income by Number of Earners in Newnan
The median family income in Newnan is $95,605, with families comprising 3+ earners (824) having the highest median family income of $143,813, while families with no earners (1,219) have the lowest median family income of $51,816, accounting for 7.8% and 11.5% of families, respectively.
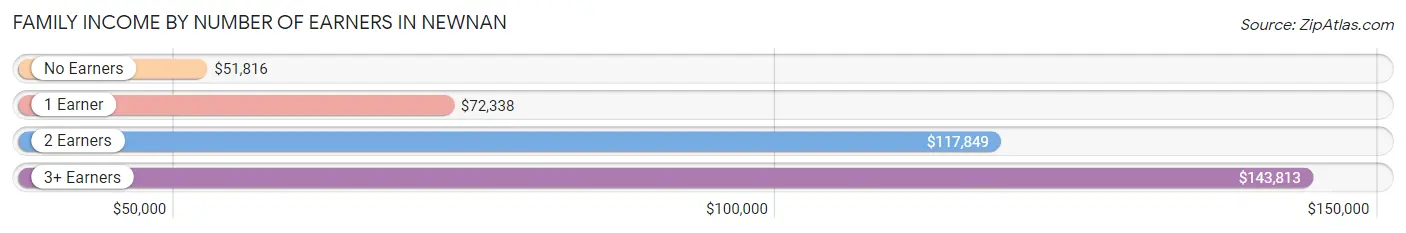
| Number of Earners | # Families | Median Income |
| No Earners | 1,219 (11.5%) | $51,816 |
| 1 Earner | 3,665 (34.7%) | $72,338 |
| 2 Earners | 4,859 (46.0%) | $117,849 |
| 3+ Earners | 824 (7.8%) | $143,813 |
| Total | 10,567 (100.0%) | $95,605 |
Household Income in Newnan
Household Income Brackets in Newnan
With 2,655 households falling in the category, the $100,000 to $149,999 income range is the most frequent in Newnan, accounting for 16.2% of all households. In contrast, only 508 households (3.1%) fall into the $10,000 to $14,999 income bracket, making it the least populous group.
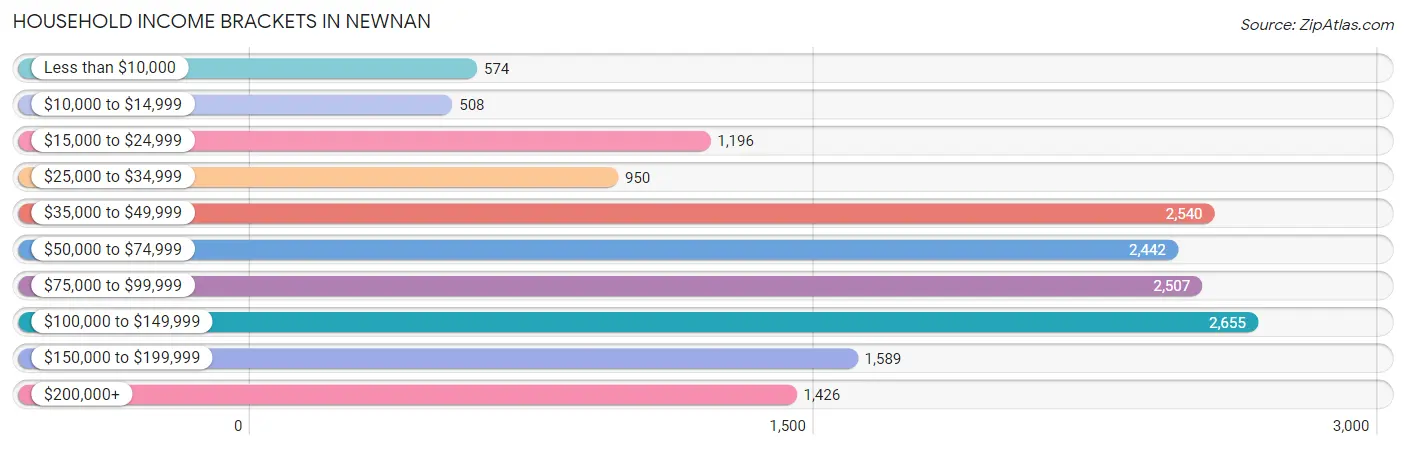
| Income Bracket | # Households | % Households |
| Less than $10,000 | 574 | 3.5% |
| $10,000 to $14,999 | 508 | 3.1% |
| $15,000 to $24,999 | 1,196 | 7.3% |
| $25,000 to $34,999 | 950 | 5.8% |
| $35,000 to $49,999 | 2,540 | 15.5% |
| $50,000 to $74,999 | 2,442 | 14.9% |
| $75,000 to $99,999 | 2,507 | 15.3% |
| $100,000 to $149,999 | 2,655 | 16.2% |
| $150,000 to $199,999 | 1,589 | 9.7% |
| $200,000+ | 1,426 | 8.7% |
Household Income by Householder Age in Newnan
The median household income in Newnan is $74,606, with the highest median household income of $95,490 found in the 45 to 64 years age bracket for the primary householder. A total of 5,777 households (35.3%) fall into this category. Meanwhile, the 65+ years age bracket for the primary householder has the lowest median household income of $50,375, with 3,405 households (20.8%) in this group.
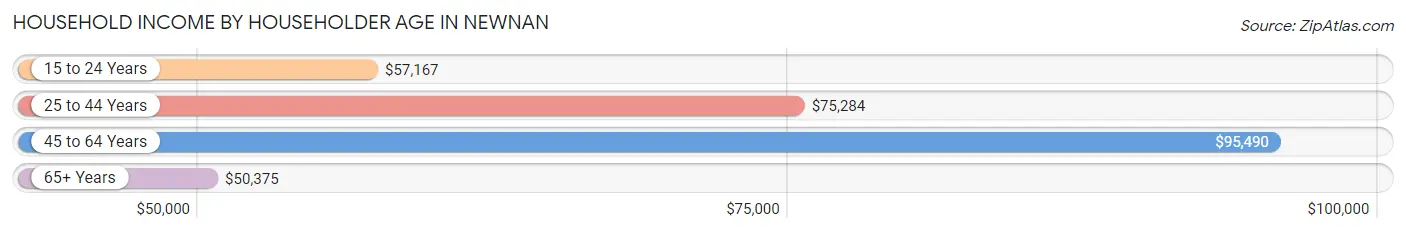
| Income Bracket | # Households | Median Income |
| 15 to 24 Years | 570 (3.5%) | $57,167 |
| 25 to 44 Years | 6,634 (40.5%) | $75,284 |
| 45 to 64 Years | 5,777 (35.3%) | $95,490 |
| 65+ Years | 3,405 (20.8%) | $50,375 |
| Total | 16,386 (100.0%) | $74,606 |
Poverty in Newnan
Income Below Poverty by Sex and Age in Newnan
With 8.9% poverty level for males and 10.6% for females among the residents of Newnan, 15 year old males and 75 year old and over females are the most vulnerable to poverty, with 76 males (27.7%) and 243 females (19.5%) in their respective age groups living below the poverty level.
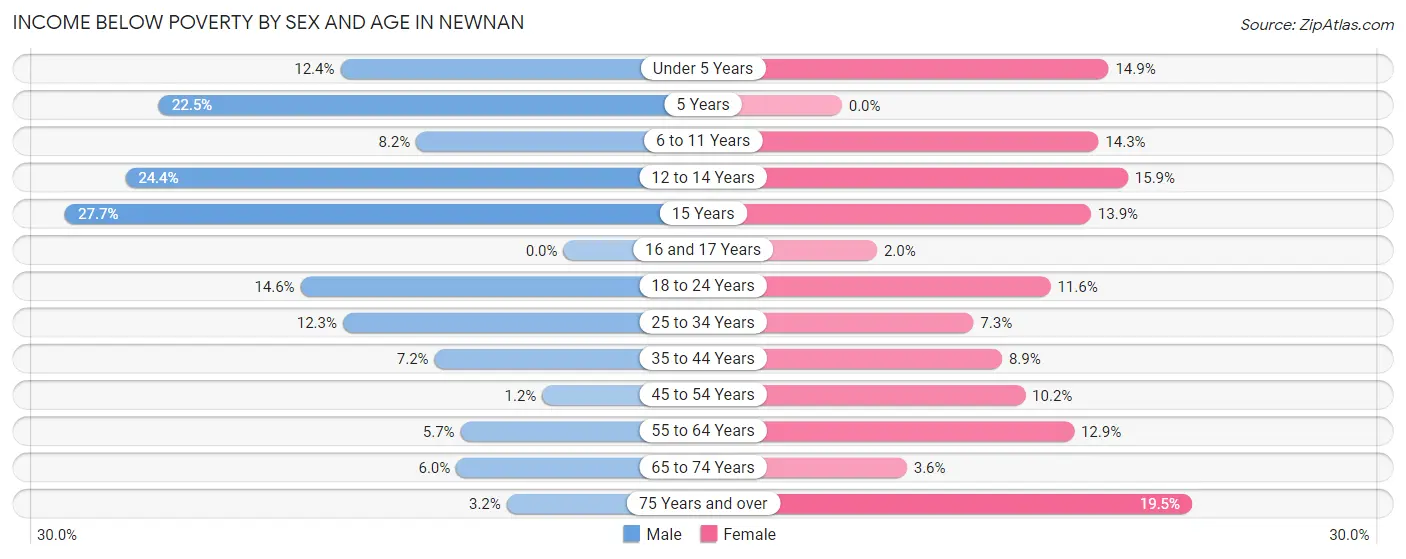
| Age Bracket | Male | Female |
| Under 5 Years | 197 (12.4%) | 177 (14.8%) |
| 5 Years | 75 (22.5%) | 0 (0.0%) |
| 6 to 11 Years | 114 (8.2%) | 329 (14.3%) |
| 12 to 14 Years | 180 (24.4%) | 156 (15.9%) |
| 15 Years | 76 (27.7%) | 77 (13.9%) |
| 16 and 17 Years | 0 (0.0%) | 13 (2.0%) |
| 18 to 24 Years | 193 (14.6%) | 249 (11.6%) |
| 25 to 34 Years | 372 (12.3%) | 277 (7.3%) |
| 35 to 44 Years | 234 (7.2%) | 288 (8.9%) |
| 45 to 54 Years | 27 (1.2%) | 274 (10.2%) |
| 55 to 64 Years | 114 (5.7%) | 321 (12.9%) |
| 65 to 74 Years | 75 (6.0%) | 67 (3.6%) |
| 75 Years and over | 27 (3.2%) | 243 (19.5%) |
| Total | 1,684 (8.9%) | 2,471 (10.6%) |
Income Above Poverty by Sex and Age in Newnan
According to the poverty statistics in Newnan, males aged 16 and 17 years and females aged 5 years are the age groups that are most secure financially, with 100.0% of males and 100.0% of females in these age groups living above the poverty line.
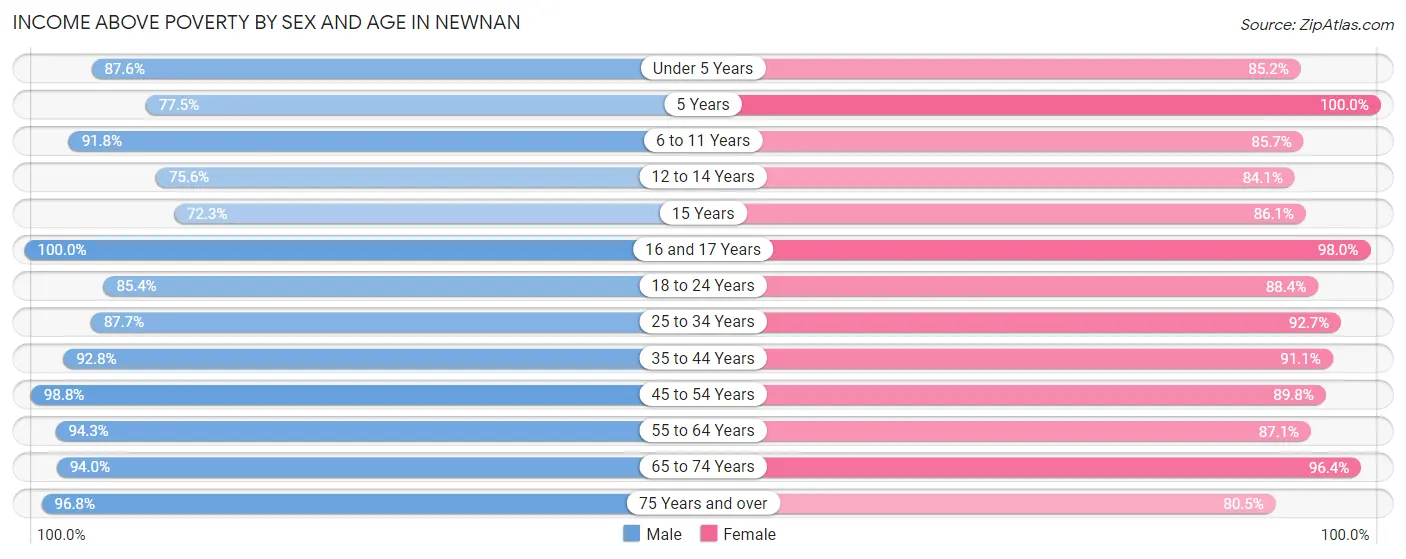
| Age Bracket | Male | Female |
| Under 5 Years | 1,389 (87.6%) | 1,015 (85.2%) |
| 5 Years | 258 (77.5%) | 119 (100.0%) |
| 6 to 11 Years | 1,277 (91.8%) | 1,974 (85.7%) |
| 12 to 14 Years | 558 (75.6%) | 823 (84.1%) |
| 15 Years | 198 (72.3%) | 478 (86.1%) |
| 16 and 17 Years | 659 (100.0%) | 649 (98.0%) |
| 18 to 24 Years | 1,125 (85.4%) | 1,894 (88.4%) |
| 25 to 34 Years | 2,657 (87.7%) | 3,500 (92.7%) |
| 35 to 44 Years | 3,024 (92.8%) | 2,940 (91.1%) |
| 45 to 54 Years | 2,267 (98.8%) | 2,410 (89.8%) |
| 55 to 64 Years | 1,874 (94.3%) | 2,161 (87.1%) |
| 65 to 74 Years | 1,181 (94.0%) | 1,783 (96.4%) |
| 75 Years and over | 827 (96.8%) | 1,004 (80.5%) |
| Total | 17,294 (91.1%) | 20,750 (89.4%) |
Income Below Poverty Among Married-Couple Families in Newnan
The poverty statistics for married-couple families in Newnan show that 3.4% or 248 of the total 7,284 families live below the poverty line. Families with 5 or more children have the highest poverty rate of 51.4%, comprising of 18 families. On the other hand, families with 3 or 4 children have the lowest poverty rate of 0.0%, which includes 0 families.
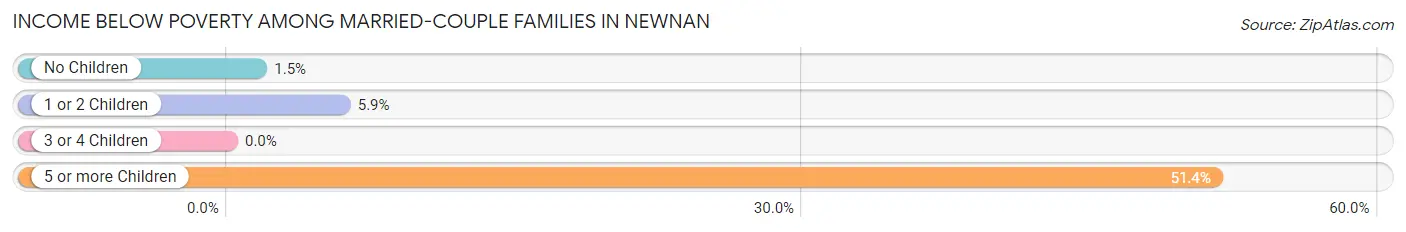
| Children | Above Poverty | Below Poverty |
| No Children | 3,667 (98.5%) | 57 (1.5%) |
| 1 or 2 Children | 2,766 (94.1%) | 173 (5.9%) |
| 3 or 4 Children | 586 (100.0%) | 0 (0.0%) |
| 5 or more Children | 17 (48.6%) | 18 (51.4%) |
| Total | 7,036 (96.6%) | 248 (3.4%) |
Income Below Poverty Among Single-Parent Households in Newnan
According to the poverty data in Newnan, 7.9% or 35 single-father households and 13.3% or 378 single-mother households are living below the poverty line. Among single-father households, those with 1 or 2 children have the highest poverty rate, with 26 households (21.8%) experiencing poverty. Likewise, among single-mother households, those with 3 or 4 children have the highest poverty rate, with 153 households (45.7%) falling below the poverty line.
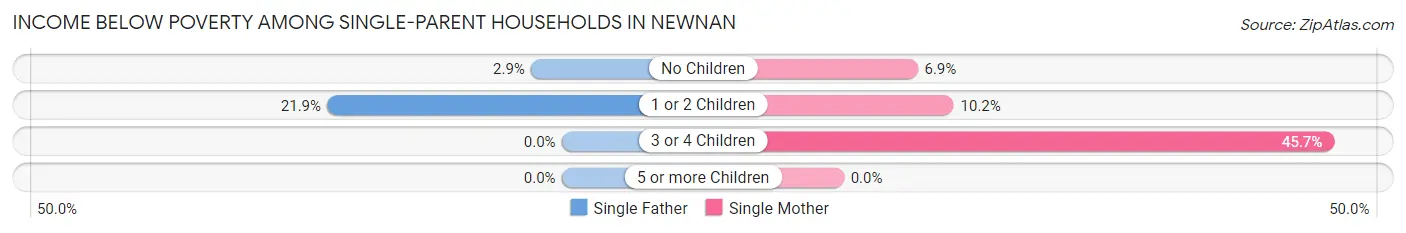
| Children | Single Father | Single Mother |
| No Children | 9 (2.9%) | 65 (6.9%) |
| 1 or 2 Children | 26 (21.8%) | 160 (10.2%) |
| 3 or 4 Children | 0 (0.0%) | 153 (45.7%) |
| 5 or more Children | 0 (0.0%) | 0 (0.0%) |
| Total | 35 (7.9%) | 378 (13.3%) |
Income Below Poverty Among Married-Couple vs Single-Parent Households in Newnan
The poverty data for Newnan shows that 248 of the married-couple family households (3.4%) and 413 of the single-parent households (12.6%) are living below the poverty level. Within the married-couple family households, those with 5 or more children have the highest poverty rate, with 18 households (51.4%) falling below the poverty line. Among the single-parent households, those with 3 or 4 children have the highest poverty rate, with 153 household (44.6%) living below poverty.
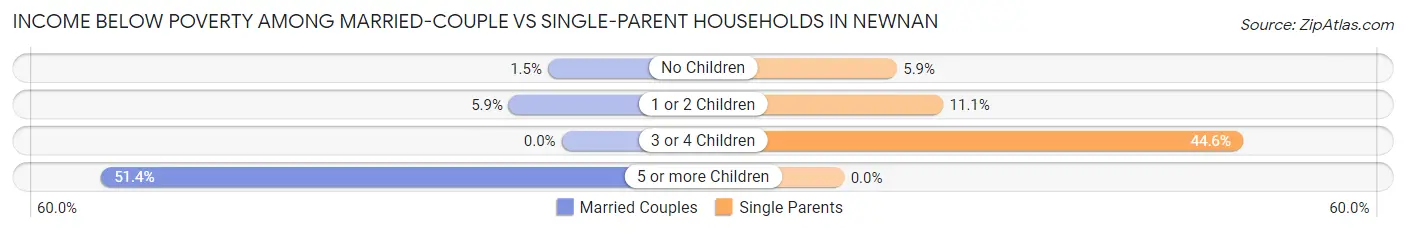
| Children | Married-Couple Families | Single-Parent Households |
| No Children | 57 (1.5%) | 74 (5.9%) |
| 1 or 2 Children | 173 (5.9%) | 186 (11.1%) |
| 3 or 4 Children | 0 (0.0%) | 153 (44.6%) |
| 5 or more Children | 18 (51.4%) | 0 (0.0%) |
| Total | 248 (3.4%) | 413 (12.6%) |
Race in Newnan
The most populous races in Newnan are White / Caucasian (22,227 | 52.1%), Black / African American (14,958 | 35.0%), and Hispanic or Latino (3,583 | 8.4%).
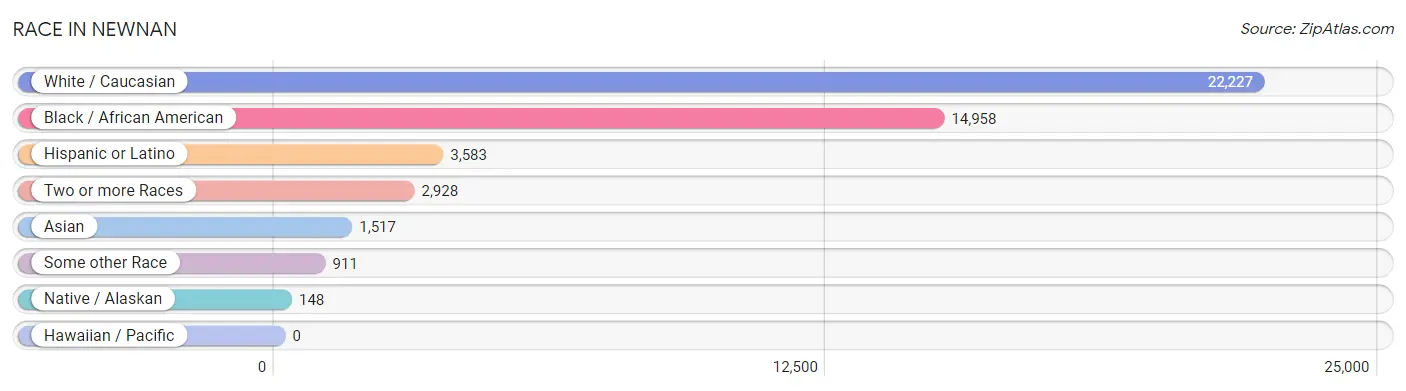
| Race | # Population | % Population |
| Asian | 1,517 | 3.5% |
| Black / African American | 14,958 | 35.0% |
| Hawaiian / Pacific | 0 | 0.0% |
| Hispanic or Latino | 3,583 | 8.4% |
| Native / Alaskan | 148 | 0.4% |
| White / Caucasian | 22,227 | 52.1% |
| Two or more Races | 2,928 | 6.9% |
| Some other Race | 911 | 2.1% |
| Total | 42,689 | 100.0% |
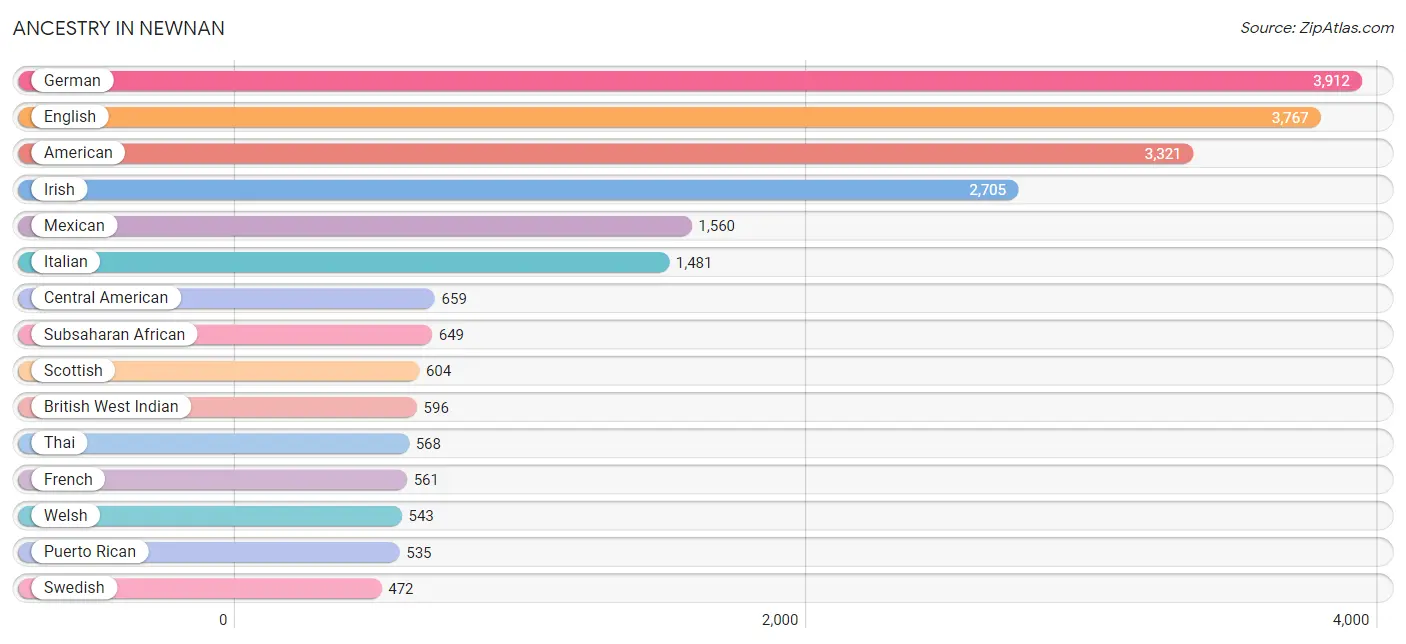
Ancestry in Newnan
The most populous ancestries reported in Newnan are German (3,912 | 9.2%), English (3,767 | 8.8%), American (3,321 | 7.8%), Irish (2,705 | 6.3%), and Mexican (1,560 | 3.6%), together accounting for 35.7% of all Newnan residents.
| Ancestry | # Population | % Population |
| African | 287 | 0.7% |
| Albanian | 163 | 0.4% |
| American | 3,321 | 7.8% |
| Apache | 7 | 0.0% |
| Arab | 63 | 0.2% |
| Argentinean | 18 | 0.0% |
| Australian | 15 | 0.0% |
| Austrian | 31 | 0.1% |
| Bahamian | 5 | 0.0% |
| Belgian | 15 | 0.0% |
| Belizean | 26 | 0.1% |
| Bhutanese | 284 | 0.7% |
| Blackfeet | 18 | 0.0% |
| British | 439 | 1.0% |
| British West Indian | 596 | 1.4% |
| Burmese | 375 | 0.9% |
| Canadian | 30 | 0.1% |
| Central American | 659 | 1.5% |
| Central American Indian | 77 | 0.2% |
| Cherokee | 95 | 0.2% |
| Chippewa | 7 | 0.0% |
| Choctaw | 32 | 0.1% |
| Colombian | 212 | 0.5% |
| Costa Rican | 136 | 0.3% |
| Cuban | 123 | 0.3% |
| Czech | 43 | 0.1% |
| Czechoslovakian | 91 | 0.2% |
| Danish | 99 | 0.2% |
| Dominican | 137 | 0.3% |
| Dutch | 128 | 0.3% |
| Eastern European | 84 | 0.2% |
| Ecuadorian | 23 | 0.1% |
| English | 3,767 | 8.8% |
| Ethiopian | 272 | 0.6% |
| European | 231 | 0.5% |
| Finnish | 112 | 0.3% |
| French | 561 | 1.3% |
| French Canadian | 25 | 0.1% |
| German | 3,912 | 9.2% |
| Greek | 68 | 0.2% |
| Guatemalan | 426 | 1.0% |
| Haitian | 10 | 0.0% |
| Honduran | 34 | 0.1% |
| Hungarian | 84 | 0.2% |
| Indian (Asian) | 471 | 1.1% |
| Irish | 2,705 | 6.3% |
| Iroquois | 7 | 0.0% |
| Italian | 1,481 | 3.5% |
| Jamaican | 114 | 0.3% |
| Korean | 280 | 0.7% |
| Lebanese | 63 | 0.2% |
| Mexican | 1,560 | 3.6% |
| Mexican American Indian | 74 | 0.2% |
| Nicaraguan | 2 | 0.0% |
| Northern European | 15 | 0.0% |
| Norwegian | 250 | 0.6% |
| Panamanian | 2 | 0.0% |
| Pennsylvania German | 14 | 0.0% |
| Peruvian | 18 | 0.0% |
| Polish | 460 | 1.1% |
| Portuguese | 34 | 0.1% |
| Puerto Rican | 535 | 1.3% |
| Russian | 59 | 0.1% |
| Salvadoran | 59 | 0.1% |
| Scandinavian | 47 | 0.1% |
| Scotch-Irish | 361 | 0.9% |
| Scottish | 604 | 1.4% |
| Seminole | 69 | 0.2% |
| Slavic | 15 | 0.0% |
| Slovak | 11 | 0.0% |
| South American | 347 | 0.8% |
| Spaniard | 100 | 0.2% |
| Sri Lankan | 130 | 0.3% |
| Subsaharan African | 649 | 1.5% |
| Swedish | 472 | 1.1% |
| Swiss | 42 | 0.1% |
| Thai | 568 | 1.3% |
| Turkish | 28 | 0.1% |
| U.S. Virgin Islander | 25 | 0.1% |
| Ukrainian | 65 | 0.2% |
| Uruguayan | 76 | 0.2% |
| Welsh | 543 | 1.3% |
| West Indian | 25 | 0.1% | View All 83 Rows |
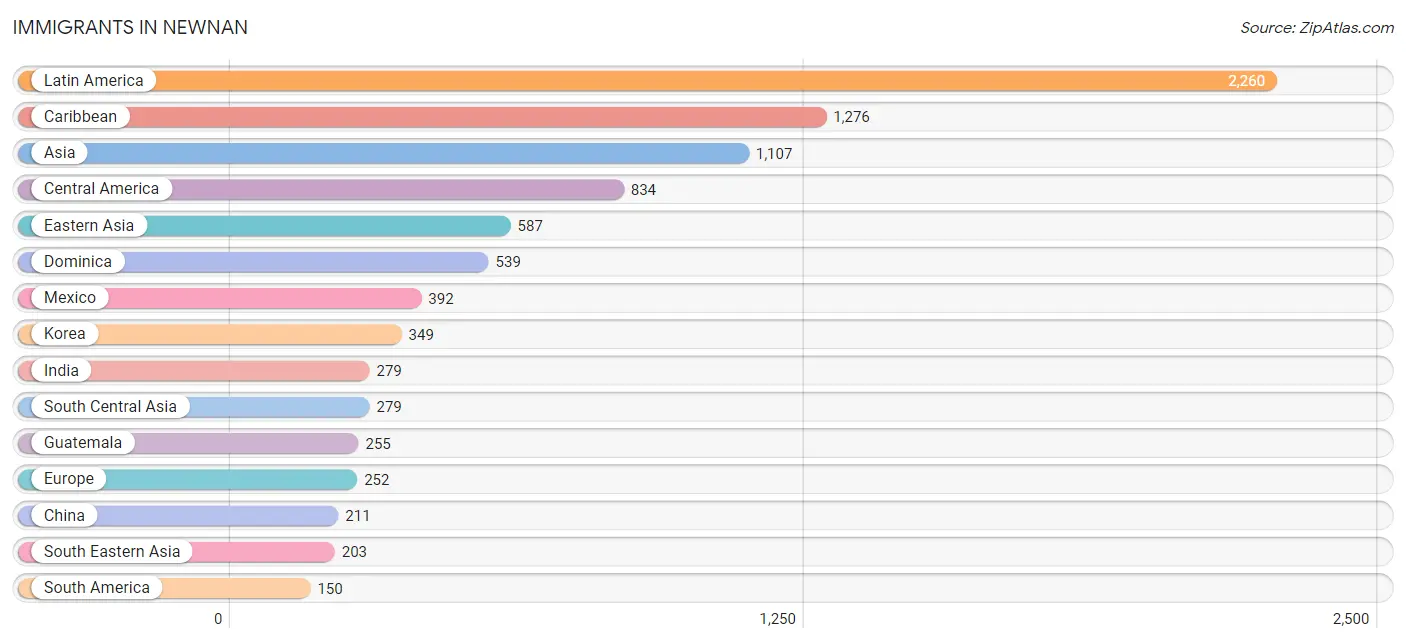
Immigrants in Newnan
The most numerous immigrant groups reported in Newnan came from Latin America (2,260 | 5.3%), Caribbean (1,276 | 3.0%), Asia (1,107 | 2.6%), Central America (834 | 1.9%), and Eastern Asia (587 | 1.4%), together accounting for 14.2% of all Newnan residents.
| Immigration Origin | # Population | % Population |
| Africa | 98 | 0.2% |
| Asia | 1,107 | 2.6% |
| Austria | 15 | 0.0% |
| Bahamas | 5 | 0.0% |
| Belize | 26 | 0.1% |
| Brazil | 17 | 0.0% |
| Canada | 118 | 0.3% |
| Caribbean | 1,276 | 3.0% |
| Central America | 834 | 1.9% |
| China | 211 | 0.5% |
| Colombia | 101 | 0.2% |
| Costa Rica | 87 | 0.2% |
| Cuba | 36 | 0.1% |
| Czechoslovakia | 51 | 0.1% |
| Dominica | 539 | 1.3% |
| Dominican Republic | 1 | 0.0% |
| Eastern Africa | 10 | 0.0% |
| Eastern Asia | 587 | 1.4% |
| Eastern Europe | 111 | 0.3% |
| El Salvador | 59 | 0.1% |
| England | 16 | 0.0% |
| Ethiopia | 10 | 0.0% |
| Europe | 252 | 0.6% |
| France | 14 | 0.0% |
| Germany | 58 | 0.1% |
| Ghana | 32 | 0.1% |
| Guatemala | 255 | 0.6% |
| Haiti | 72 | 0.2% |
| Hungary | 16 | 0.0% |
| India | 279 | 0.6% |
| Italy | 25 | 0.1% |
| Jamaica | 65 | 0.2% |
| Japan | 27 | 0.1% |
| Korea | 349 | 0.8% |
| Latin America | 2,260 | 5.3% |
| Lebanon | 24 | 0.1% |
| Malaysia | 17 | 0.0% |
| Mexico | 392 | 0.9% |
| Nicaragua | 4 | 0.0% |
| Northern Europe | 29 | 0.1% |
| Panama | 11 | 0.0% |
| Peru | 18 | 0.0% |
| Philippines | 144 | 0.3% |
| Poland | 23 | 0.1% |
| South America | 150 | 0.4% |
| South Central Asia | 279 | 0.6% |
| South Eastern Asia | 203 | 0.5% |
| Southern Europe | 25 | 0.1% |
| Sweden | 13 | 0.0% |
| Taiwan | 45 | 0.1% |
| Turkey | 14 | 0.0% |
| Uruguay | 14 | 0.0% |
| Vietnam | 42 | 0.1% |
| Western Africa | 88 | 0.2% |
| Western Asia | 38 | 0.1% |
| Western Europe | 87 | 0.2% | View All 56 Rows |
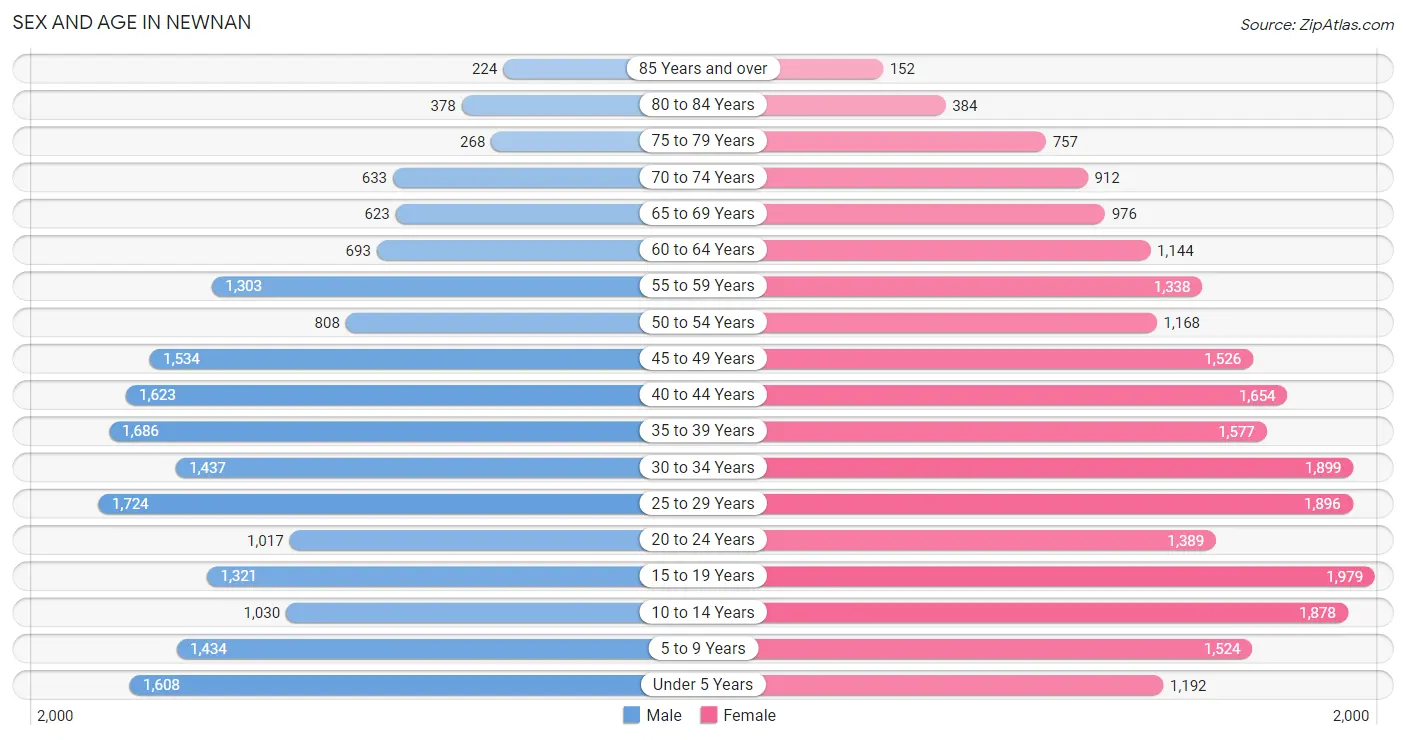
Sex and Age in Newnan
Sex and Age in Newnan
The most populous age groups in Newnan are 25 to 29 Years (1,724 | 8.9%) for men and 15 to 19 Years (1,979 | 8.5%) for women.
| Age Bracket | Male | Female |
| Under 5 Years | 1,608 (8.3%) | 1,192 (5.1%) |
| 5 to 9 Years | 1,434 (7.4%) | 1,524 (6.5%) |
| 10 to 14 Years | 1,030 (5.3%) | 1,878 (8.0%) |
| 15 to 19 Years | 1,321 (6.8%) | 1,979 (8.5%) |
| 20 to 24 Years | 1,017 (5.3%) | 1,389 (5.9%) |
| 25 to 29 Years | 1,724 (8.9%) | 1,896 (8.1%) |
| 30 to 34 Years | 1,437 (7.4%) | 1,899 (8.1%) |
| 35 to 39 Years | 1,686 (8.7%) | 1,577 (6.8%) |
| 40 to 44 Years | 1,623 (8.4%) | 1,654 (7.1%) |
| 45 to 49 Years | 1,534 (7.9%) | 1,526 (6.5%) |
| 50 to 54 Years | 808 (4.2%) | 1,168 (5.0%) |
| 55 to 59 Years | 1,303 (6.7%) | 1,338 (5.7%) |
| 60 to 64 Years | 693 (3.6%) | 1,144 (4.9%) |
| 65 to 69 Years | 623 (3.2%) | 976 (4.2%) |
| 70 to 74 Years | 633 (3.3%) | 912 (3.9%) |
| 75 to 79 Years | 268 (1.4%) | 757 (3.2%) |
| 80 to 84 Years | 378 (1.9%) | 384 (1.6%) |
| 85 Years and over | 224 (1.2%) | 152 (0.6%) |
| Total | 19,344 (100.0%) | 23,345 (100.0%) |
Families and Households in Newnan
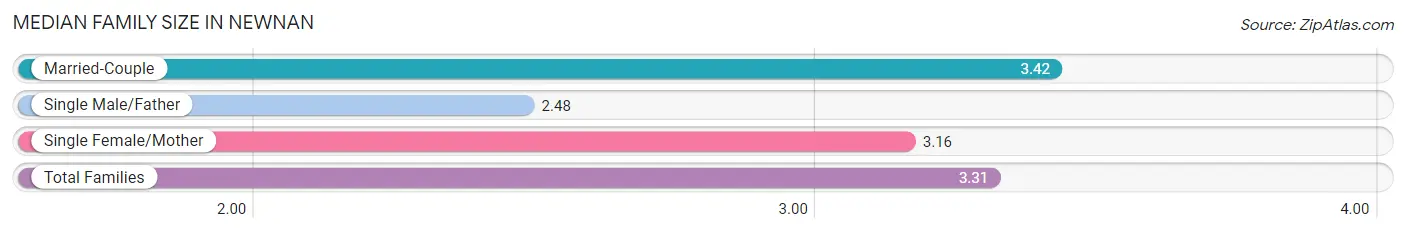
Median Family Size in Newnan
The median family size in Newnan is 3.31 persons per family, with married-couple families (7,284 | 68.9%) accounting for the largest median family size of 3.42 persons per family. On the other hand, single male/father families (441 | 4.2%) represent the smallest median family size with 2.48 persons per family.
| Family Type | # Families | Family Size |
| Married-Couple | 7,284 (68.9%) | 3.42 |
| Single Male/Father | 441 (4.2%) | 2.48 |
| Single Female/Mother | 2,842 (26.9%) | 3.16 |
| Total Families | 10,567 (100.0%) | 3.31 |
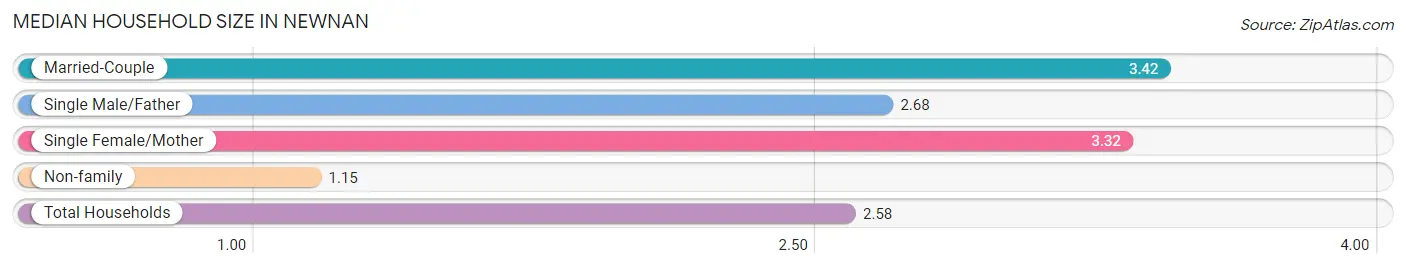
Median Household Size in Newnan
The median household size in Newnan is 2.58 persons per household, with married-couple households (7,284 | 44.5%) accounting for the largest median household size of 3.42 persons per household. non-family households (5,819 | 35.5%) represent the smallest median household size with 1.15 persons per household.
| Household Type | # Households | Household Size |
| Married-Couple | 7,284 (44.5%) | 3.42 |
| Single Male/Father | 441 (2.7%) | 2.68 |
| Single Female/Mother | 2,842 (17.3%) | 3.32 |
| Non-family | 5,819 (35.5%) | 1.15 |
| Total Households | 16,386 (100.0%) | 2.58 |
Household Size by Marriage Status in Newnan
Out of a total of 16,386 households in Newnan, 10,567 (64.5%) are family households, while 5,819 (35.5%) are nonfamily households. The most numerous type of family households are 2-person households, comprising 4,578, and the most common type of nonfamily households are 1-person households, comprising 4,974.
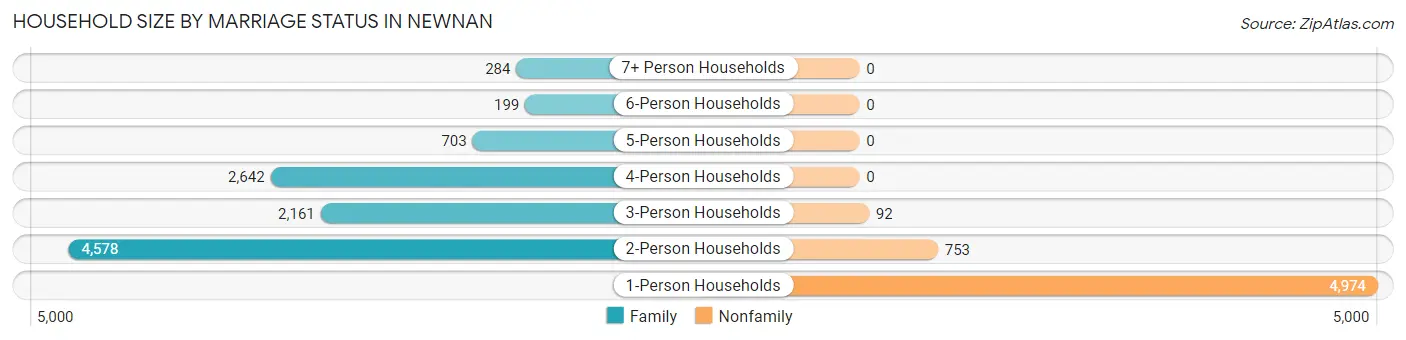
| Household Size | Family Households | Nonfamily Households |
| 1-Person Households | - | 4,974 (30.4%) |
| 2-Person Households | 4,578 (27.9%) | 753 (4.6%) |
| 3-Person Households | 2,161 (13.2%) | 92 (0.6%) |
| 4-Person Households | 2,642 (16.1%) | 0 (0.0%) |
| 5-Person Households | 703 (4.3%) | 0 (0.0%) |
| 6-Person Households | 199 (1.2%) | 0 (0.0%) |
| 7+ Person Households | 284 (1.7%) | 0 (0.0%) |
| Total | 10,567 (64.5%) | 5,819 (35.5%) |
Female Fertility in Newnan
Fertility by Age in Newnan
Average fertility rate in Newnan is 28.0 births per 1,000 women. Women in the age bracket of 20 to 34 years have the highest fertility rate with 45.0 births per 1,000 women. Women in the age bracket of 20 to 34 years acount for 68.5% of all women with births.
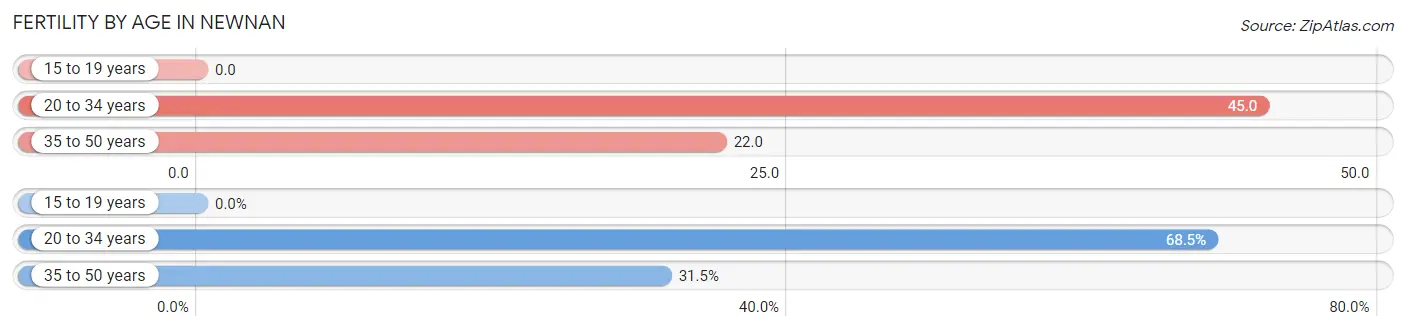
| Age Bracket | Women with Births | Births / 1,000 Women |
| 15 to 19 years | 0 (0.0%) | 0.0 |
| 20 to 34 years | 233 (68.5%) | 45.0 |
| 35 to 50 years | 107 (31.5%) | 22.0 |
| Total | 340 (100.0%) | 28.0 |
Fertility by Age by Marriage Status in Newnan
89.1% of women with births (340) in Newnan are married. The highest percentage of unmarried women with births falls into 35 to 50 years age bracket with 12.1% of them unmarried at the time of birth, while the lowest percentage of unmarried women with births belong to 20 to 34 years age bracket with 10.3% of them unmarried.
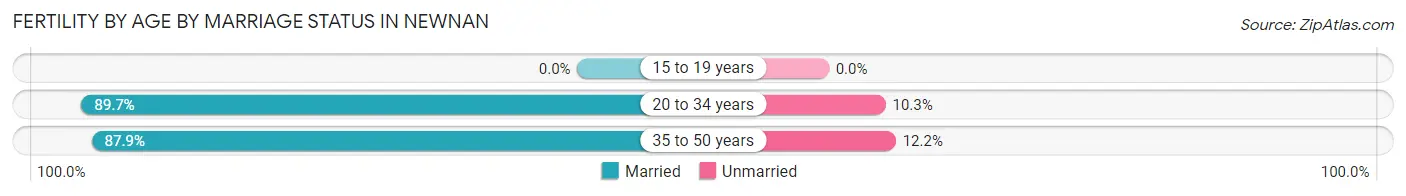
| Age Bracket | Married | Unmarried |
| 15 to 19 years | 0 (0.0%) | 0 (0.0%) |
| 20 to 34 years | 209 (89.7%) | 24 (10.3%) |
| 35 to 50 years | 94 (87.8%) | 13 (12.1%) |
| Total | 303 (89.1%) | 37 (10.9%) |
Fertility by Education in Newnan
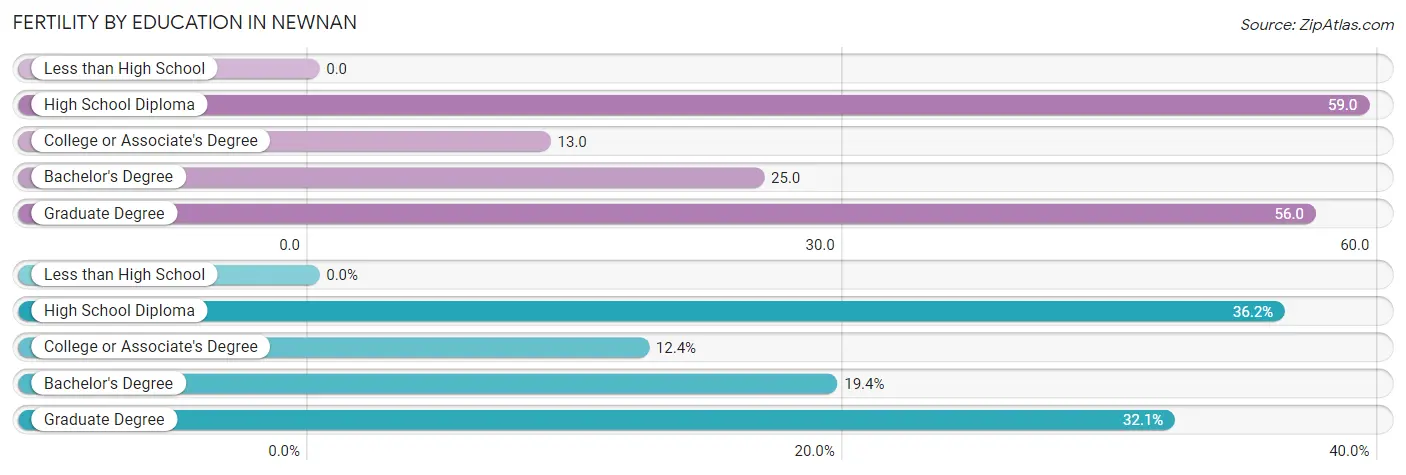
| Educational Attainment | Women with Births | Births / 1,000 Women |
| Less than High School | 0 (0.0%) | 0.0 |
| High School Diploma | 123 (36.2%) | 59.0 |
| College or Associate's Degree | 42 (12.3%) | 13.0 |
| Bachelor's Degree | 66 (19.4%) | 25.0 |
| Graduate Degree | 109 (32.1%) | 56.0 |
| Total | 340 (100.0%) | 28.0 |
Fertility by Education by Marriage Status in Newnan
10.9% of women with births in Newnan are unmarried. Women with the educational attainment of college or associate's degree are most likely to be married with 100.0% of them married at childbirth, while women with the educational attainment of high school diploma are least likely to be married with 30.1% of them unmarried at childbirth.
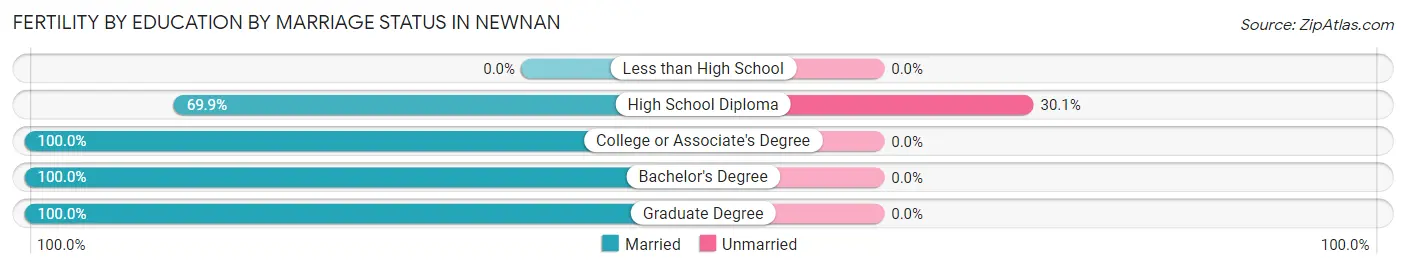
| Educational Attainment | Married | Unmarried |
| Less than High School | 0 (0.0%) | 0 (0.0%) |
| High School Diploma | 86 (69.9%) | 37 (30.1%) |
| College or Associate's Degree | 42 (100.0%) | 0 (0.0%) |
| Bachelor's Degree | 66 (100.0%) | 0 (0.0%) |
| Graduate Degree | 109 (100.0%) | 0 (0.0%) |
| Total | 303 (89.1%) | 37 (10.9%) |
Employment Characteristics in Newnan
Employment by Class of Employer in Newnan
Among the 20,952 employed individuals in Newnan, private company employees (14,830 | 70.8%), local government employees (2,115 | 10.1%), and not-for-profit organizations (1,144 | 5.5%) make up the most common classes of employment.
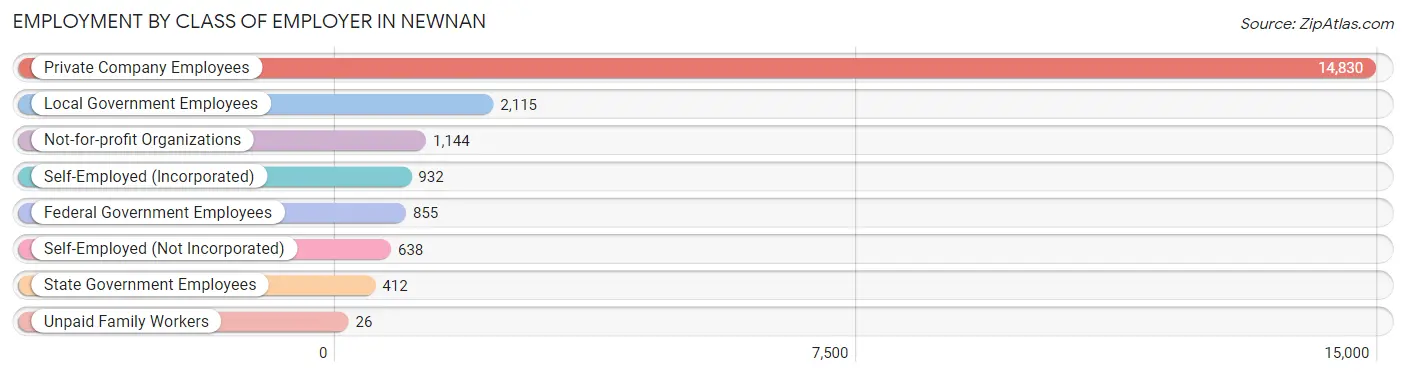
| Employer Class | # Employees | % Employees |
| Private Company Employees | 14,830 | 70.8% |
| Self-Employed (Incorporated) | 932 | 4.4% |
| Self-Employed (Not Incorporated) | 638 | 3.0% |
| Not-for-profit Organizations | 1,144 | 5.5% |
| Local Government Employees | 2,115 | 10.1% |
| State Government Employees | 412 | 2.0% |
| Federal Government Employees | 855 | 4.1% |
| Unpaid Family Workers | 26 | 0.1% |
| Total | 20,952 | 100.0% |
Employment Status by Age in Newnan
According to the labor force statistics for Newnan, out of the total population over 16 years of age (33,194), 66.9% or 22,207 individuals are in the labor force, with 3.1% or 688 of them unemployed. The age group with the highest labor force participation rate is 30 to 34 years, with 84.3% or 2,812 individuals in the labor force. Within the labor force, the 16 to 19 years age range has the highest percentage of unemployed individuals, with 16.9% or 171 of them being unemployed.
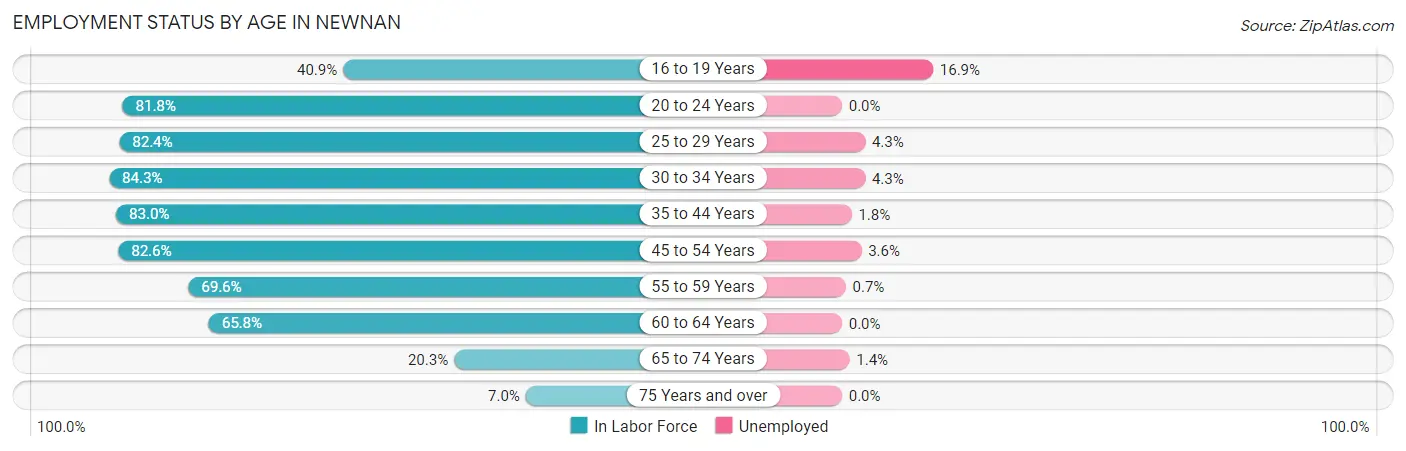
| Age Bracket | In Labor Force | Unemployed |
| 16 to 19 Years | 1,011 (40.9%) | 171 (16.9%) |
| 20 to 24 Years | 1,968 (81.8%) | 0 (0.0%) |
| 25 to 29 Years | 2,983 (82.4%) | 128 (4.3%) |
| 30 to 34 Years | 2,812 (84.3%) | 121 (4.3%) |
| 35 to 44 Years | 5,428 (83.0%) | 98 (1.8%) |
| 45 to 54 Years | 4,160 (82.6%) | 150 (3.6%) |
| 55 to 59 Years | 1,838 (69.6%) | 13 (0.7%) |
| 60 to 64 Years | 1,209 (65.8%) | 0 (0.0%) |
| 65 to 74 Years | 638 (20.3%) | 9 (1.4%) |
| 75 Years and over | 151 (7.0%) | 0 (0.0%) |
| Total | 22,207 (66.9%) | 688 (3.1%) |
Employment Status by Educational Attainment in Newnan
According to labor force statistics for Newnan, 80.1% of individuals (18,431) out of the total population between 25 and 64 years of age (23,010) are in the labor force, with 2.8% or 516 of them being unemployed. The group with the highest labor force participation rate are those with the educational attainment of bachelor's degree or higher, with 85.8% or 8,005 individuals in the labor force. Within the labor force, individuals with college / associate degree education have the highest percentage of unemployment, with 4.4% or 236 of them being unemployed.
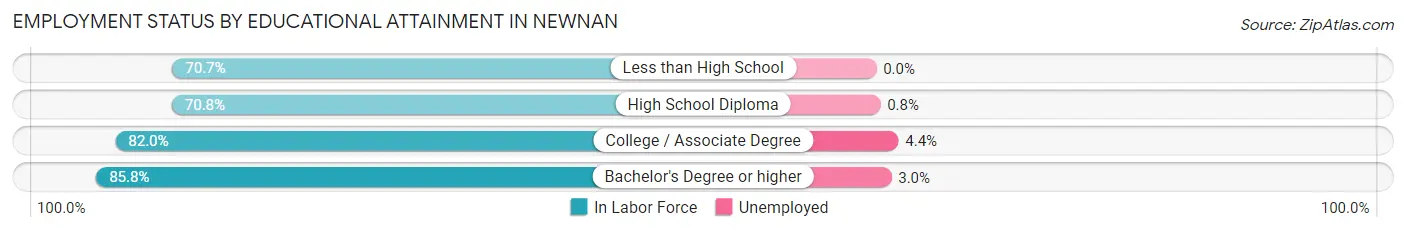
| Educational Attainment | In Labor Force | Unemployed |
| Less than High School | 1,518 (70.7%) | 0 (0.0%) |
| High School Diploma | 3,534 (70.8%) | 40 (0.8%) |
| College / Associate Degree | 5,364 (82.0%) | 288 (4.4%) |
| Bachelor's Degree or higher | 8,005 (85.8%) | 280 (3.0%) |
| Total | 18,431 (80.1%) | 644 (2.8%) |
Employment Occupations by Sex in Newnan
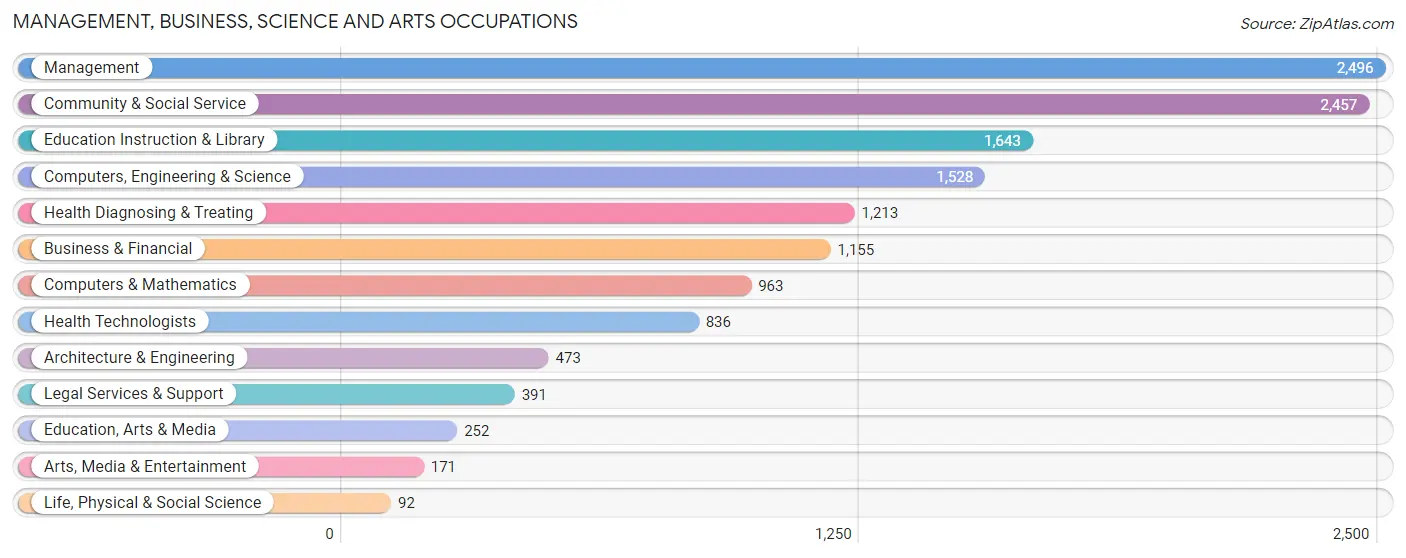
Management, Business, Science and Arts Occupations
The most common Management, Business, Science and Arts occupations in Newnan are Management (2,496 | 11.7%), Community & Social Service (2,457 | 11.5%), Education Instruction & Library (1,643 | 7.7%), Computers, Engineering & Science (1,528 | 7.1%), and Health Diagnosing & Treating (1,213 | 5.7%).
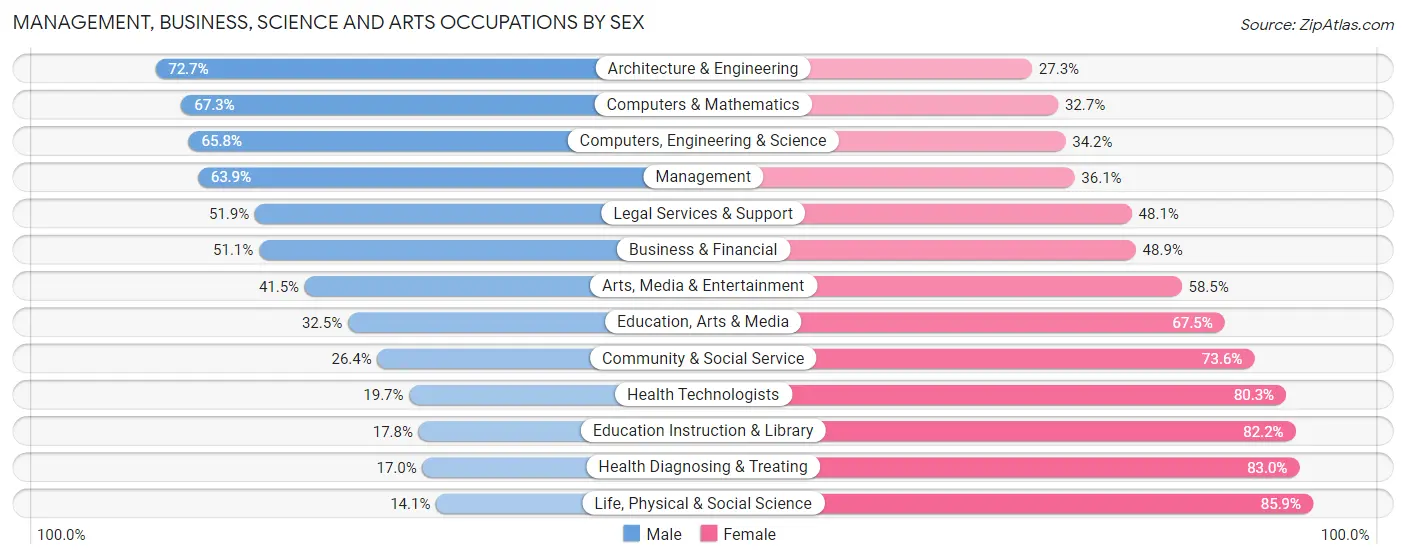
Management, Business, Science and Arts Occupations by Sex
Within the Management, Business, Science and Arts occupations in Newnan, the most male-oriented occupations are Architecture & Engineering (72.7%), Computers & Mathematics (67.3%), and Computers, Engineering & Science (65.8%), while the most female-oriented occupations are Life, Physical & Social Science (85.9%), Health Diagnosing & Treating (83.0%), and Education Instruction & Library (82.2%).
| Occupation | Male | Female |
| Management | 1,594 (63.9%) | 902 (36.1%) |
| Business & Financial | 590 (51.1%) | 565 (48.9%) |
| Computers, Engineering & Science | 1,005 (65.8%) | 523 (34.2%) |
| Computers & Mathematics | 648 (67.3%) | 315 (32.7%) |
| Architecture & Engineering | 344 (72.7%) | 129 (27.3%) |
| Life, Physical & Social Science | 13 (14.1%) | 79 (85.9%) |
| Community & Social Service | 648 (26.4%) | 1,809 (73.6%) |
| Education, Arts & Media | 82 (32.5%) | 170 (67.5%) |
| Legal Services & Support | 203 (51.9%) | 188 (48.1%) |
| Education Instruction & Library | 292 (17.8%) | 1,351 (82.2%) |
| Arts, Media & Entertainment | 71 (41.5%) | 100 (58.5%) |
| Health Diagnosing & Treating | 206 (17.0%) | 1,007 (83.0%) |
| Health Technologists | 165 (19.7%) | 671 (80.3%) |
| Total (Category) | 4,043 (45.7%) | 4,806 (54.3%) |
| Total (Overall) | 10,831 (50.6%) | 10,587 (49.4%) |
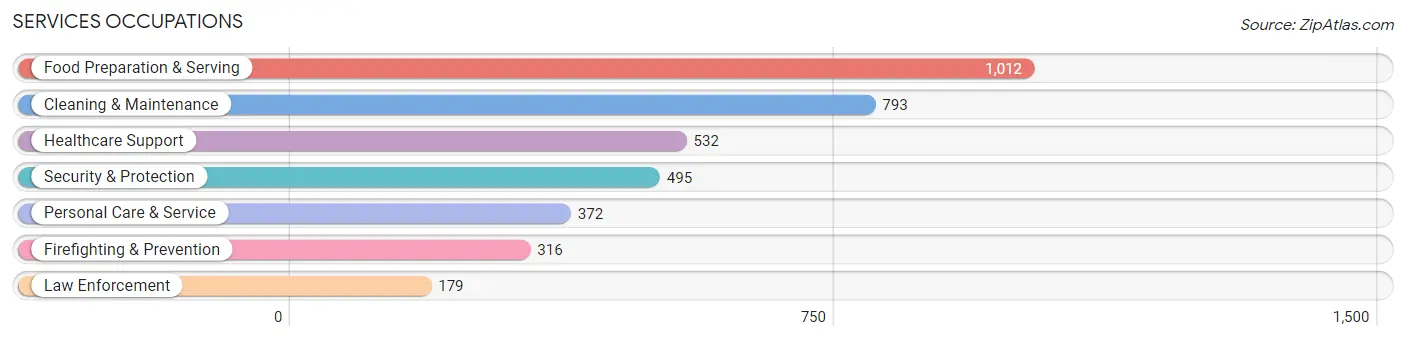
Services Occupations
The most common Services occupations in Newnan are Food Preparation & Serving (1,012 | 4.7%), Cleaning & Maintenance (793 | 3.7%), Healthcare Support (532 | 2.5%), Security & Protection (495 | 2.3%), and Personal Care & Service (372 | 1.7%).
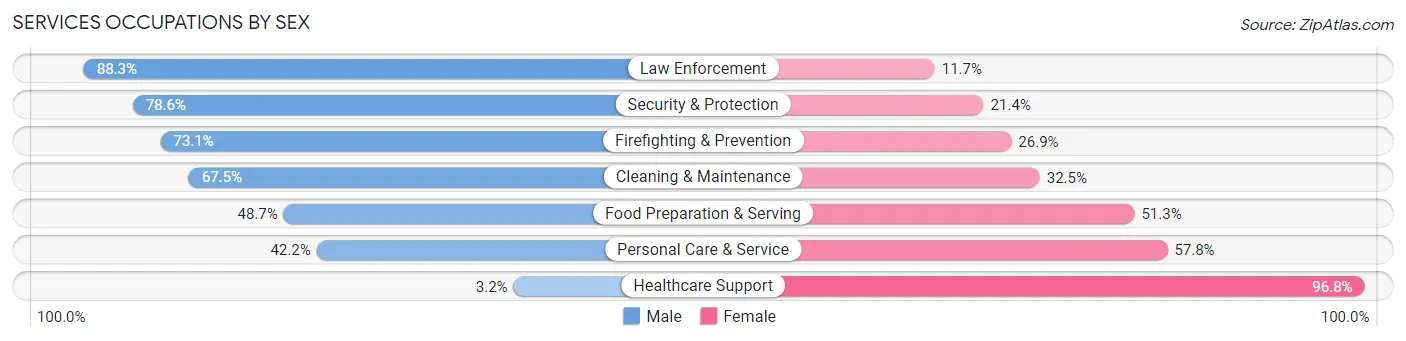
Services Occupations by Sex
Within the Services occupations in Newnan, the most male-oriented occupations are Law Enforcement (88.3%), Security & Protection (78.6%), and Firefighting & Prevention (73.1%), while the most female-oriented occupations are Healthcare Support (96.8%), Personal Care & Service (57.8%), and Food Preparation & Serving (51.3%).
| Occupation | Male | Female |
| Healthcare Support | 17 (3.2%) | 515 (96.8%) |
| Security & Protection | 389 (78.6%) | 106 (21.4%) |
| Firefighting & Prevention | 231 (73.1%) | 85 (26.9%) |
| Law Enforcement | 158 (88.3%) | 21 (11.7%) |
| Food Preparation & Serving | 493 (48.7%) | 519 (51.3%) |
| Cleaning & Maintenance | 535 (67.5%) | 258 (32.5%) |
| Personal Care & Service | 157 (42.2%) | 215 (57.8%) |
| Total (Category) | 1,591 (49.7%) | 1,613 (50.3%) |
| Total (Overall) | 10,831 (50.6%) | 10,587 (49.4%) |
Sales and Office Occupations
The most common Sales and Office occupations in Newnan are Office & Administration (2,453 | 11.5%), and Sales & Related (2,298 | 10.7%).
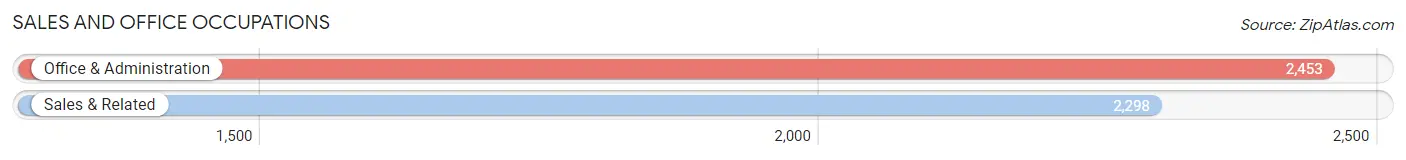
Sales and Office Occupations by Sex

| Occupation | Male | Female |
| Sales & Related | 1,260 (54.8%) | 1,038 (45.2%) |
| Office & Administration | 461 (18.8%) | 1,992 (81.2%) |
| Total (Category) | 1,721 (36.2%) | 3,030 (63.8%) |
| Total (Overall) | 10,831 (50.6%) | 10,587 (49.4%) |
Natural Resources, Construction and Maintenance Occupations
The most common Natural Resources, Construction and Maintenance occupations in Newnan are Installation, Maintenance & Repair (563 | 2.6%), Construction & Extraction (521 | 2.4%), and Farming, Fishing & Forestry (83 | 0.4%).
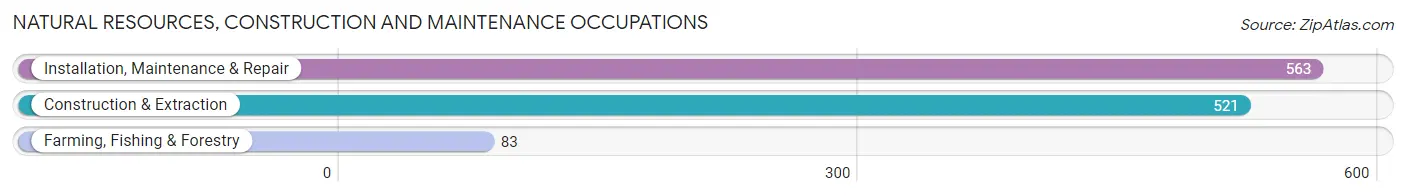
Natural Resources, Construction and Maintenance Occupations by Sex
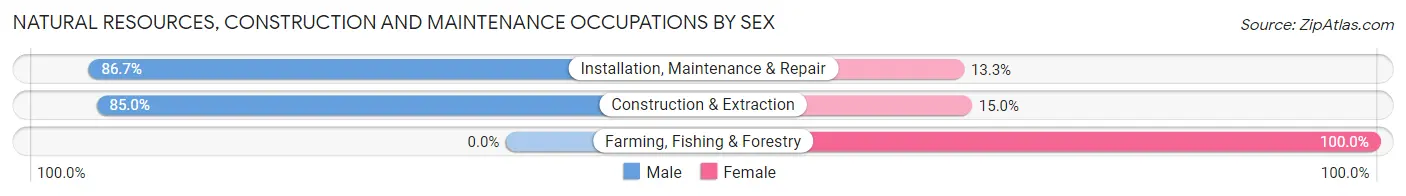
| Occupation | Male | Female |
| Farming, Fishing & Forestry | 0 (0.0%) | 83 (100.0%) |
| Construction & Extraction | 443 (85.0%) | 78 (15.0%) |
| Installation, Maintenance & Repair | 488 (86.7%) | 75 (13.3%) |
| Total (Category) | 931 (79.8%) | 236 (20.2%) |
| Total (Overall) | 10,831 (50.6%) | 10,587 (49.4%) |
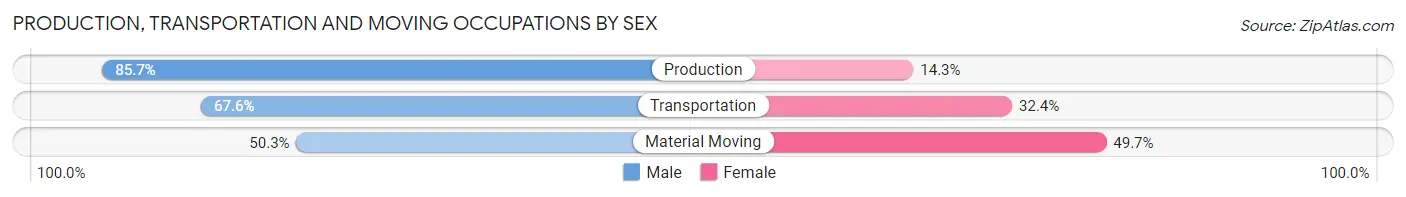
Production, Transportation and Moving Occupations
The most common Production, Transportation and Moving occupations in Newnan are Production (1,800 | 8.4%), Transportation (1,003 | 4.7%), and Material Moving (644 | 3.0%).
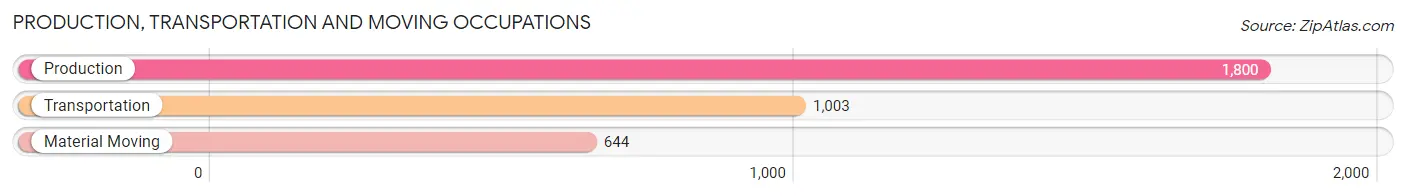
Production, Transportation and Moving Occupations by Sex
| Occupation | Male | Female |
| Production | 1,543 (85.7%) | 257 (14.3%) |
| Transportation | 678 (67.6%) | 325 (32.4%) |
| Material Moving | 324 (50.3%) | 320 (49.7%) |
| Total (Category) | 2,545 (73.8%) | 902 (26.2%) |
| Total (Overall) | 10,831 (50.6%) | 10,587 (49.4%) |
Employment Industries by Sex in Newnan
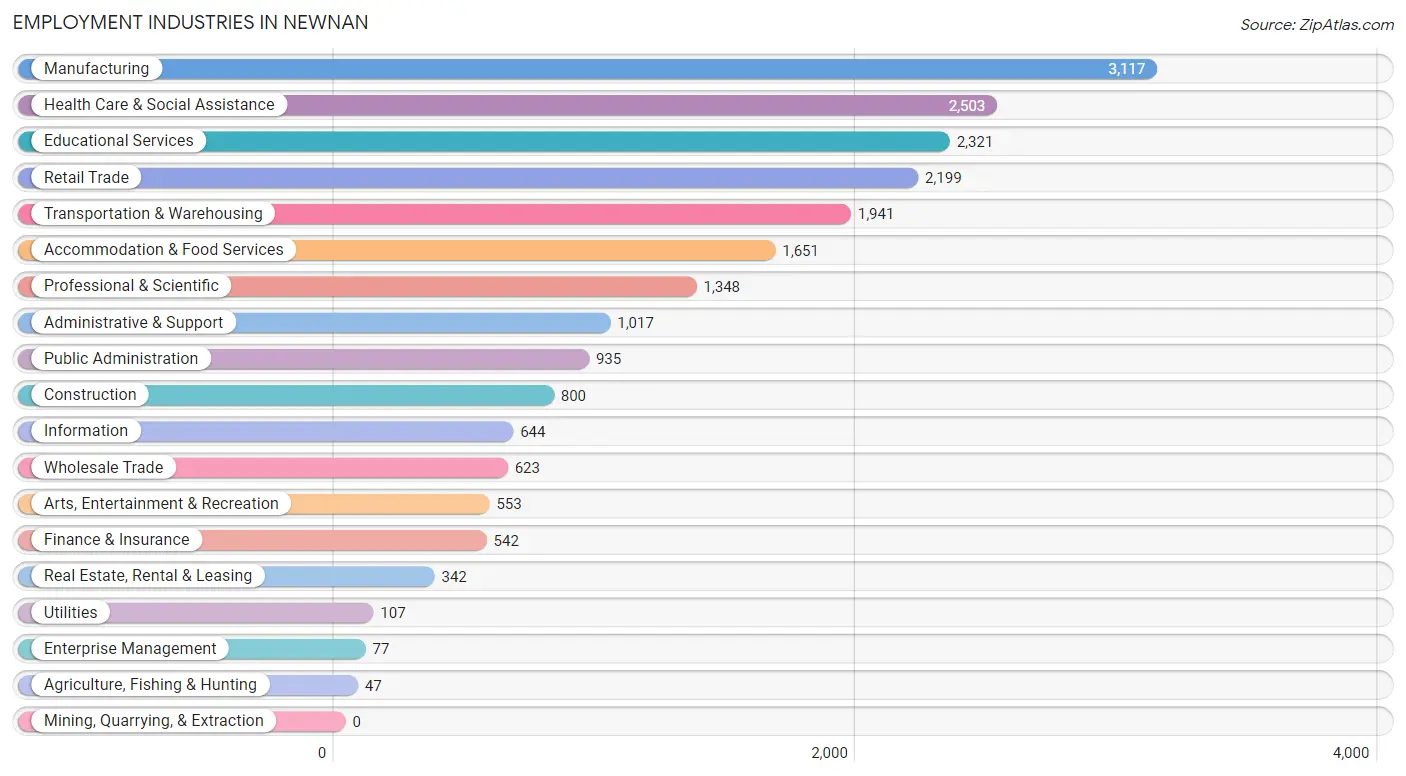
Employment Industries in Newnan
The major employment industries in Newnan include Manufacturing (3,117 | 14.5%), Health Care & Social Assistance (2,503 | 11.7%), Educational Services (2,321 | 10.8%), Retail Trade (2,199 | 10.3%), and Transportation & Warehousing (1,941 | 9.1%).
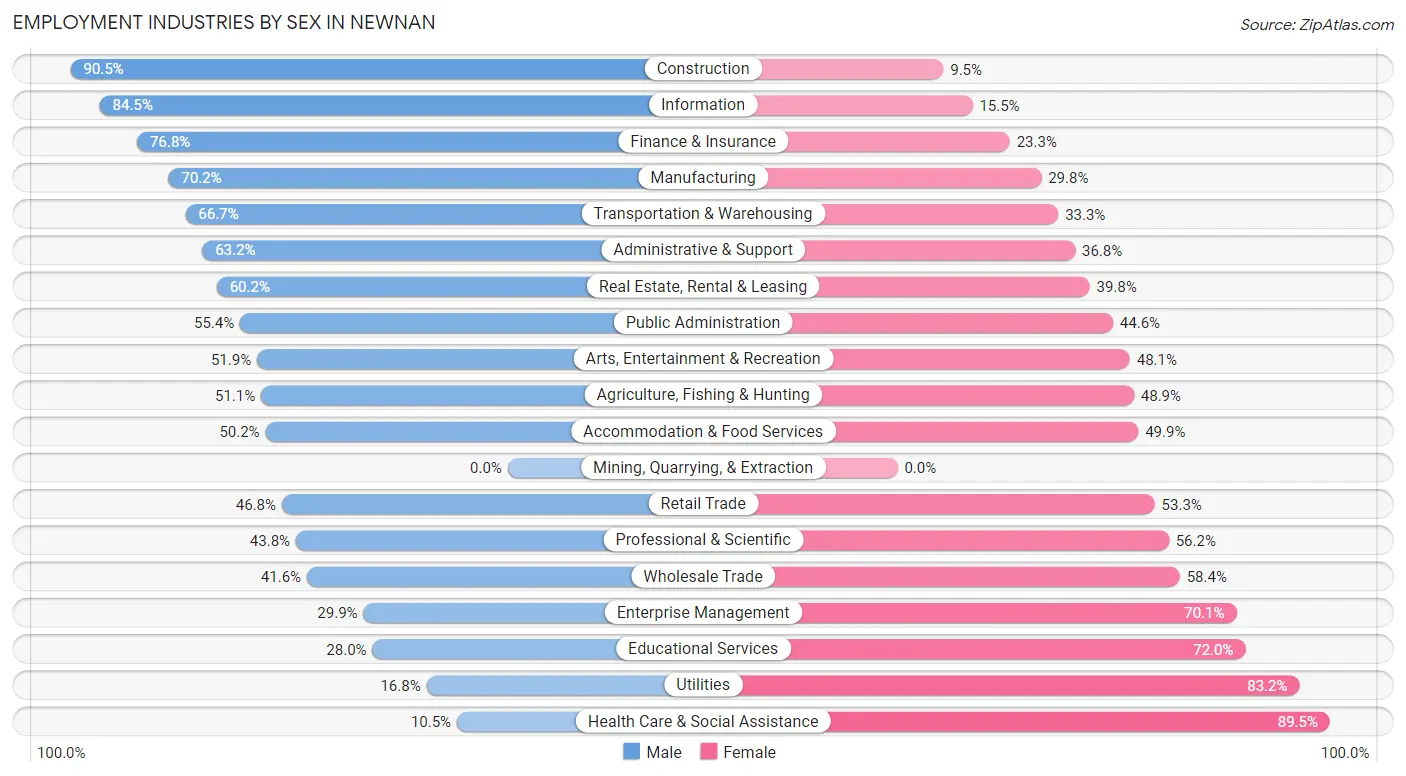
Employment Industries by Sex in Newnan
The Newnan industries that see more men than women are Construction (90.5%), Information (84.5%), and Finance & Insurance (76.7%), whereas the industries that tend to have a higher number of women are Health Care & Social Assistance (89.5%), Utilities (83.2%), and Educational Services (72.0%).
| Industry | Male | Female |
| Agriculture, Fishing & Hunting | 24 (51.1%) | 23 (48.9%) |
| Mining, Quarrying, & Extraction | 0 (0.0%) | 0 (0.0%) |
| Construction | 724 (90.5%) | 76 (9.5%) |
| Manufacturing | 2,189 (70.2%) | 928 (29.8%) |
| Wholesale Trade | 259 (41.6%) | 364 (58.4%) |
| Retail Trade | 1,028 (46.8%) | 1,171 (53.2%) |
| Transportation & Warehousing | 1,295 (66.7%) | 646 (33.3%) |
| Utilities | 18 (16.8%) | 89 (83.2%) |
| Information | 544 (84.5%) | 100 (15.5%) |
| Finance & Insurance | 416 (76.7%) | 126 (23.3%) |
| Real Estate, Rental & Leasing | 206 (60.2%) | 136 (39.8%) |
| Professional & Scientific | 591 (43.8%) | 757 (56.2%) |
| Enterprise Management | 23 (29.9%) | 54 (70.1%) |
| Administrative & Support | 643 (63.2%) | 374 (36.8%) |
| Educational Services | 650 (28.0%) | 1,671 (72.0%) |
| Health Care & Social Assistance | 263 (10.5%) | 2,240 (89.5%) |
| Arts, Entertainment & Recreation | 287 (51.9%) | 266 (48.1%) |
| Accommodation & Food Services | 828 (50.1%) | 823 (49.8%) |
| Public Administration | 518 (55.4%) | 417 (44.6%) |
| Total | 10,831 (50.6%) | 10,587 (49.4%) |
Education in Newnan
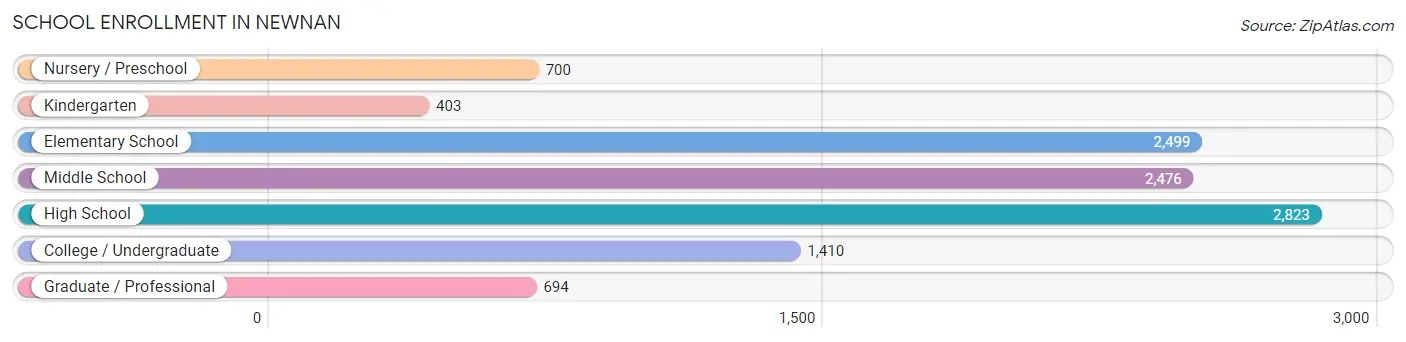
School Enrollment in Newnan
The most common levels of schooling among the 11,005 students in Newnan are high school (2,823 | 25.7%), elementary school (2,499 | 22.7%), and middle school (2,476 | 22.5%).
| School Level | # Students | % Students |
| Nursery / Preschool | 700 | 6.4% |
| Kindergarten | 403 | 3.7% |
| Elementary School | 2,499 | 22.7% |
| Middle School | 2,476 | 22.5% |
| High School | 2,823 | 25.7% |
| College / Undergraduate | 1,410 | 12.8% |
| Graduate / Professional | 694 | 6.3% |
| Total | 11,005 | 100.0% |
School Enrollment by Age by Funding Source in Newnan
Out of a total of 11,005 students who are enrolled in schools in Newnan, 1,849 (16.8%) attend a private institution, while the remaining 9,156 (83.2%) are enrolled in public schools. The age group of 3 to 4 year olds has the highest likelihood of being enrolled in private schools, with 231 (45.8% in the age bracket) enrolled. Conversely, the age group of 20 to 24 year olds has the lowest likelihood of being enrolled in a private school, with 894 (92.9% in the age bracket) attending a public institution.
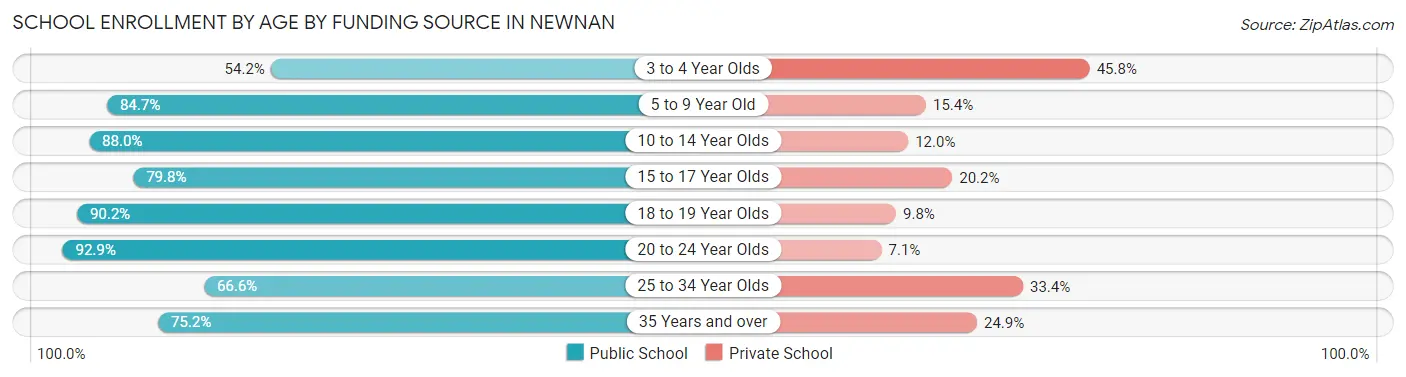
| Age Bracket | Public School | Private School |
| 3 to 4 Year Olds | 273 (54.2%) | 231 (45.8%) |
| 5 to 9 Year Old | 2,404 (84.7%) | 436 (15.3%) |
| 10 to 14 Year Olds | 2,537 (88.0%) | 347 (12.0%) |
| 15 to 17 Year Olds | 1,643 (79.8%) | 417 (20.2%) |
| 18 to 19 Year Olds | 740 (90.2%) | 80 (9.8%) |
| 20 to 24 Year Olds | 894 (92.9%) | 68 (7.1%) |
| 25 to 34 Year Olds | 285 (66.6%) | 143 (33.4%) |
| 35 Years and over | 381 (75.1%) | 126 (24.8%) |
| Total | 9,156 (83.2%) | 1,849 (16.8%) |
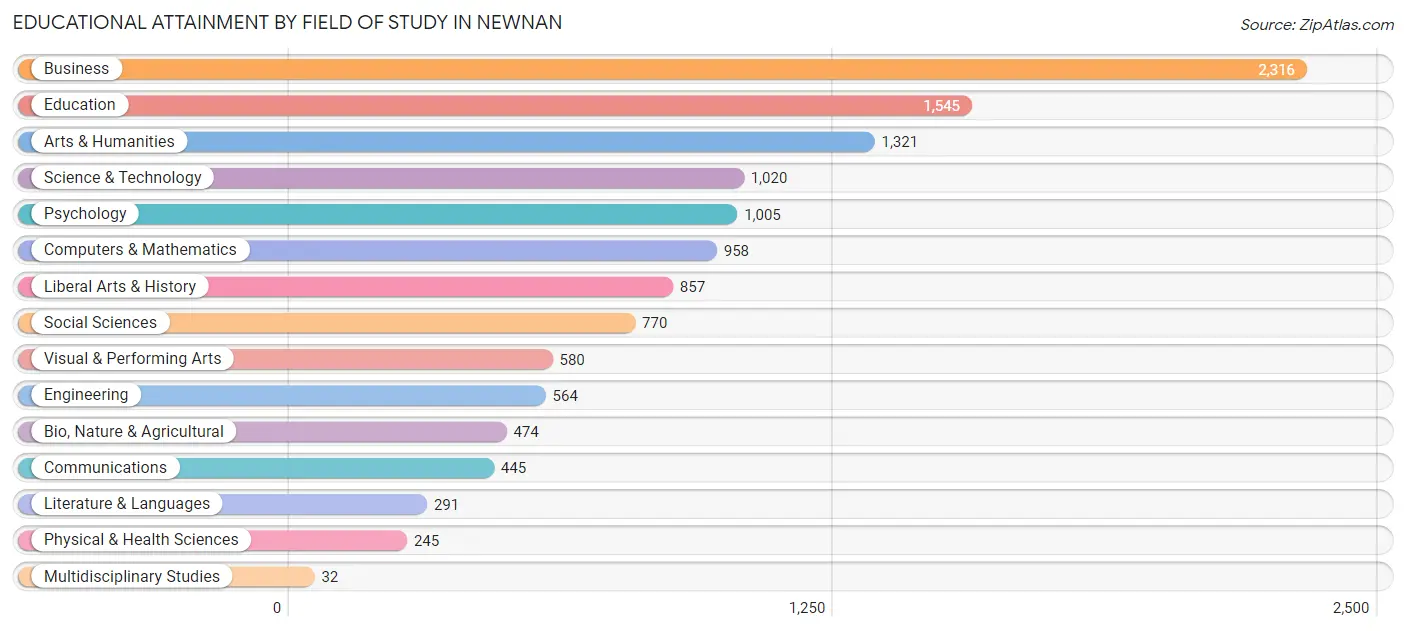
Educational Attainment by Field of Study in Newnan
Business (2,316 | 18.6%), education (1,545 | 12.4%), arts & humanities (1,321 | 10.6%), science & technology (1,020 | 8.2%), and psychology (1,005 | 8.1%) are the most common fields of study among 12,423 individuals in Newnan who have obtained a bachelor's degree or higher.
| Field of Study | # Graduates | % Graduates |
| Computers & Mathematics | 958 | 7.7% |
| Bio, Nature & Agricultural | 474 | 3.8% |
| Physical & Health Sciences | 245 | 2.0% |
| Psychology | 1,005 | 8.1% |
| Social Sciences | 770 | 6.2% |
| Engineering | 564 | 4.5% |
| Multidisciplinary Studies | 32 | 0.3% |
| Science & Technology | 1,020 | 8.2% |
| Business | 2,316 | 18.6% |
| Education | 1,545 | 12.4% |
| Literature & Languages | 291 | 2.3% |
| Liberal Arts & History | 857 | 6.9% |
| Visual & Performing Arts | 580 | 4.7% |
| Communications | 445 | 3.6% |
| Arts & Humanities | 1,321 | 10.6% |
| Total | 12,423 | 100.0% |
Transportation & Commute in Newnan
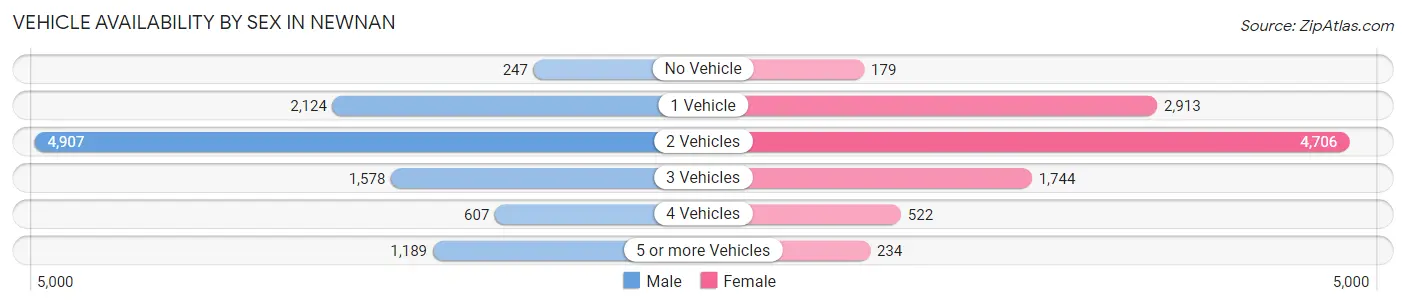
Vehicle Availability by Sex in Newnan
The most prevalent vehicle ownership categories in Newnan are males with 2 vehicles (4,907, accounting for 46.1%) and females with 2 vehicles (4,706, making up 47.6%).
| Vehicles Available | Male | Female |
| No Vehicle | 247 (2.3%) | 179 (1.7%) |
| 1 Vehicle | 2,124 (19.9%) | 2,913 (28.3%) |
| 2 Vehicles | 4,907 (46.1%) | 4,706 (45.7%) |
| 3 Vehicles | 1,578 (14.8%) | 1,744 (16.9%) |
| 4 Vehicles | 607 (5.7%) | 522 (5.1%) |
| 5 or more Vehicles | 1,189 (11.2%) | 234 (2.3%) |
| Total | 10,652 (100.0%) | 10,298 (100.0%) |
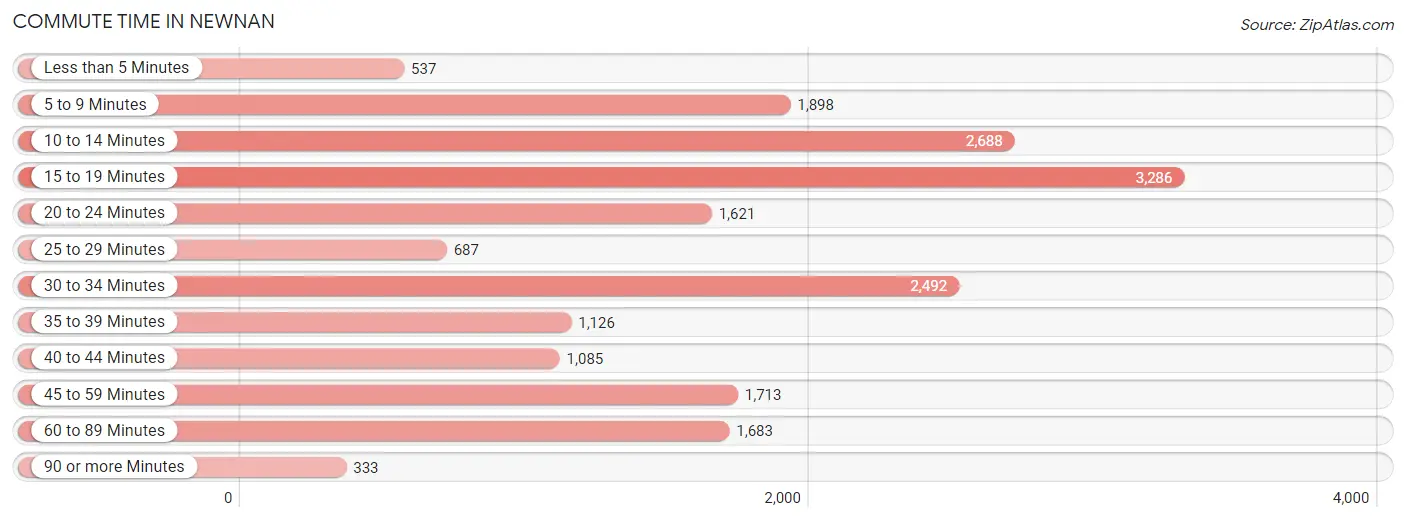
Commute Time in Newnan
The most frequently occuring commute durations in Newnan are 15 to 19 minutes (3,286 commuters, 17.2%), 10 to 14 minutes (2,688 commuters, 14.0%), and 30 to 34 minutes (2,492 commuters, 13.0%).
| Commute Time | # Commuters | % Commuters |
| Less than 5 Minutes | 537 | 2.8% |
| 5 to 9 Minutes | 1,898 | 9.9% |
| 10 to 14 Minutes | 2,688 | 14.0% |
| 15 to 19 Minutes | 3,286 | 17.2% |
| 20 to 24 Minutes | 1,621 | 8.5% |
| 25 to 29 Minutes | 687 | 3.6% |
| 30 to 34 Minutes | 2,492 | 13.0% |
| 35 to 39 Minutes | 1,126 | 5.9% |
| 40 to 44 Minutes | 1,085 | 5.7% |
| 45 to 59 Minutes | 1,713 | 8.9% |
| 60 to 89 Minutes | 1,683 | 8.8% |
| 90 or more Minutes | 333 | 1.7% |
Commute Time by Sex in Newnan
The most common commute times in Newnan are 15 to 19 minutes (2,099 commuters, 21.1%) for males and 10 to 14 minutes (1,578 commuters, 17.2%) for females.
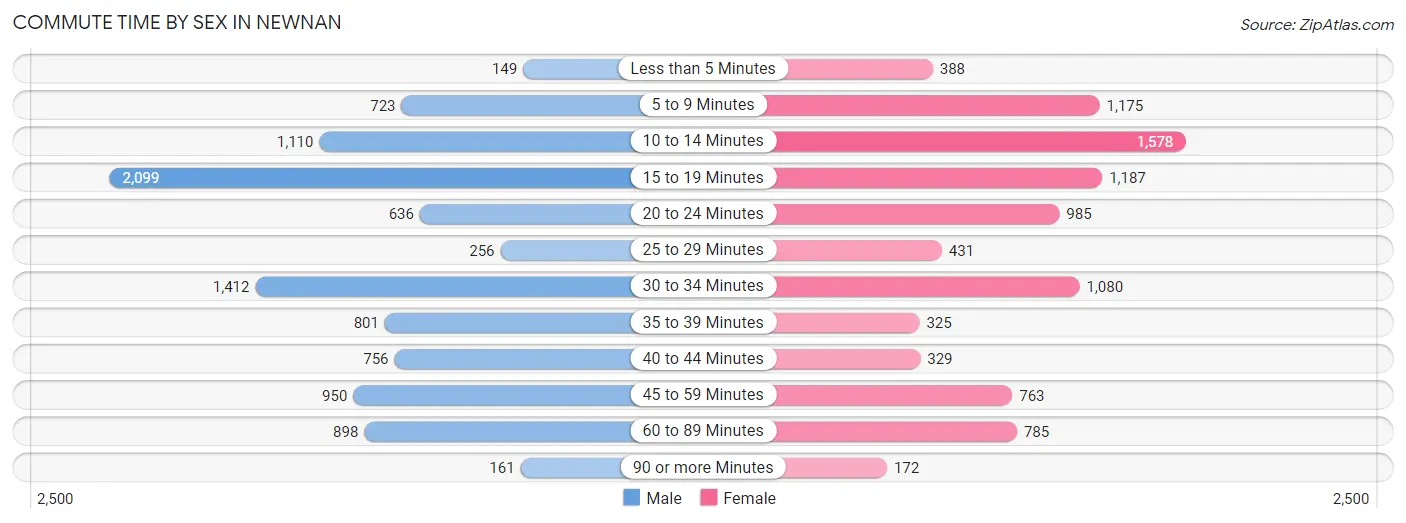
| Commute Time | Male | Female |
| Less than 5 Minutes | 149 (1.5%) | 388 (4.2%) |
| 5 to 9 Minutes | 723 (7.3%) | 1,175 (12.8%) |
| 10 to 14 Minutes | 1,110 (11.2%) | 1,578 (17.2%) |
| 15 to 19 Minutes | 2,099 (21.1%) | 1,187 (12.9%) |
| 20 to 24 Minutes | 636 (6.4%) | 985 (10.7%) |
| 25 to 29 Minutes | 256 (2.6%) | 431 (4.7%) |
| 30 to 34 Minutes | 1,412 (14.2%) | 1,080 (11.7%) |
| 35 to 39 Minutes | 801 (8.1%) | 325 (3.5%) |
| 40 to 44 Minutes | 756 (7.6%) | 329 (3.6%) |
| 45 to 59 Minutes | 950 (9.6%) | 763 (8.3%) |
| 60 to 89 Minutes | 898 (9.0%) | 785 (8.5%) |
| 90 or more Minutes | 161 (1.6%) | 172 (1.9%) |
Time of Departure to Work by Sex in Newnan
The most frequent times of departure to work in Newnan are 7:00 AM to 7:29 AM (1,652, 16.6%) for males and 7:00 AM to 7:29 AM (1,771, 19.3%) for females.
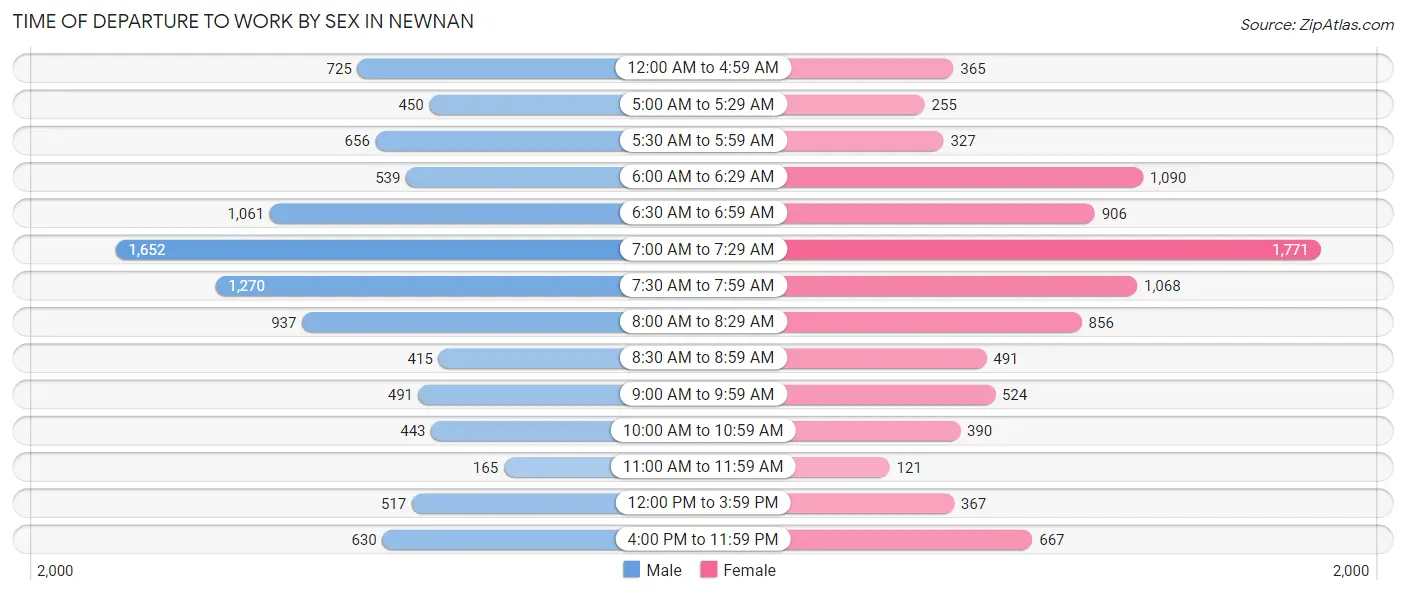
| Time of Departure | Male | Female |
| 12:00 AM to 4:59 AM | 725 (7.3%) | 365 (4.0%) |
| 5:00 AM to 5:29 AM | 450 (4.5%) | 255 (2.8%) |
| 5:30 AM to 5:59 AM | 656 (6.6%) | 327 (3.6%) |
| 6:00 AM to 6:29 AM | 539 (5.4%) | 1,090 (11.8%) |
| 6:30 AM to 6:59 AM | 1,061 (10.7%) | 906 (9.9%) |
| 7:00 AM to 7:29 AM | 1,652 (16.6%) | 1,771 (19.3%) |
| 7:30 AM to 7:59 AM | 1,270 (12.8%) | 1,068 (11.6%) |
| 8:00 AM to 8:29 AM | 937 (9.4%) | 856 (9.3%) |
| 8:30 AM to 8:59 AM | 415 (4.2%) | 491 (5.3%) |
| 9:00 AM to 9:59 AM | 491 (4.9%) | 524 (5.7%) |
| 10:00 AM to 10:59 AM | 443 (4.4%) | 390 (4.2%) |
| 11:00 AM to 11:59 AM | 165 (1.7%) | 121 (1.3%) |
| 12:00 PM to 3:59 PM | 517 (5.2%) | 367 (4.0%) |
| 4:00 PM to 11:59 PM | 630 (6.3%) | 667 (7.2%) |
| Total | 9,951 (100.0%) | 9,198 (100.0%) |
Housing Occupancy in Newnan
Occupancy by Ownership in Newnan
Of the total 16,386 dwellings in Newnan, owner-occupied units account for 9,251 (56.5%), while renter-occupied units make up 7,135 (43.5%).
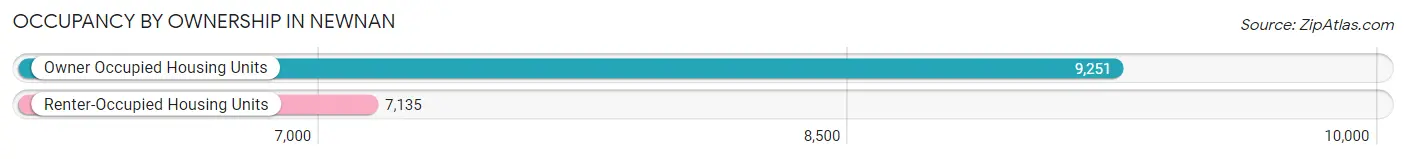
| Occupancy | # Housing Units | % Housing Units |
| Owner Occupied Housing Units | 9,251 | 56.5% |
| Renter-Occupied Housing Units | 7,135 | 43.5% |
| Total Occupied Housing Units | 16,386 | 100.0% |
Occupancy by Household Size in Newnan
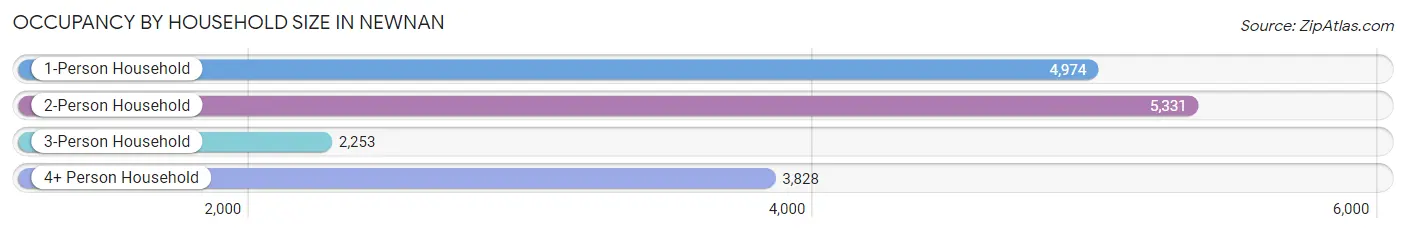
| Household Size | # Housing Units | % Housing Units |
| 1-Person Household | 4,974 | 30.4% |
| 2-Person Household | 5,331 | 32.5% |
| 3-Person Household | 2,253 | 13.8% |
| 4+ Person Household | 3,828 | 23.4% |
| Total Housing Units | 16,386 | 100.0% |
Occupancy by Ownership by Household Size in Newnan
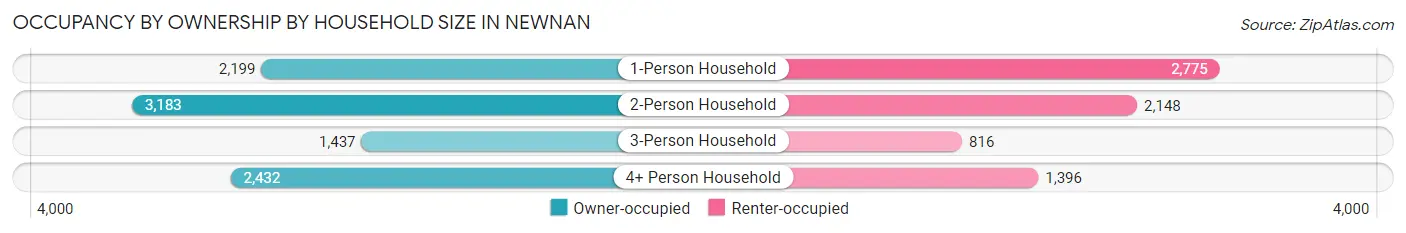
| Household Size | Owner-occupied | Renter-occupied |
| 1-Person Household | 2,199 (44.2%) | 2,775 (55.8%) |
| 2-Person Household | 3,183 (59.7%) | 2,148 (40.3%) |
| 3-Person Household | 1,437 (63.8%) | 816 (36.2%) |
| 4+ Person Household | 2,432 (63.5%) | 1,396 (36.5%) |
| Total Housing Units | 9,251 (56.5%) | 7,135 (43.5%) |
Occupancy by Educational Attainment in Newnan
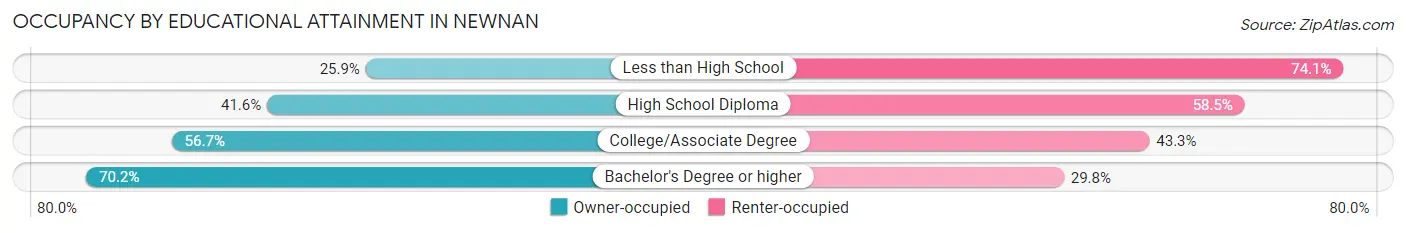
| Household Size | Owner-occupied | Renter-occupied |
| Less than High School | 309 (25.9%) | 884 (74.1%) |
| High School Diploma | 1,569 (41.5%) | 2,207 (58.5%) |
| College/Associate Degree | 2,699 (56.7%) | 2,064 (43.3%) |
| Bachelor's Degree or higher | 4,674 (70.2%) | 1,980 (29.8%) |
Occupancy by Age of Householder in Newnan
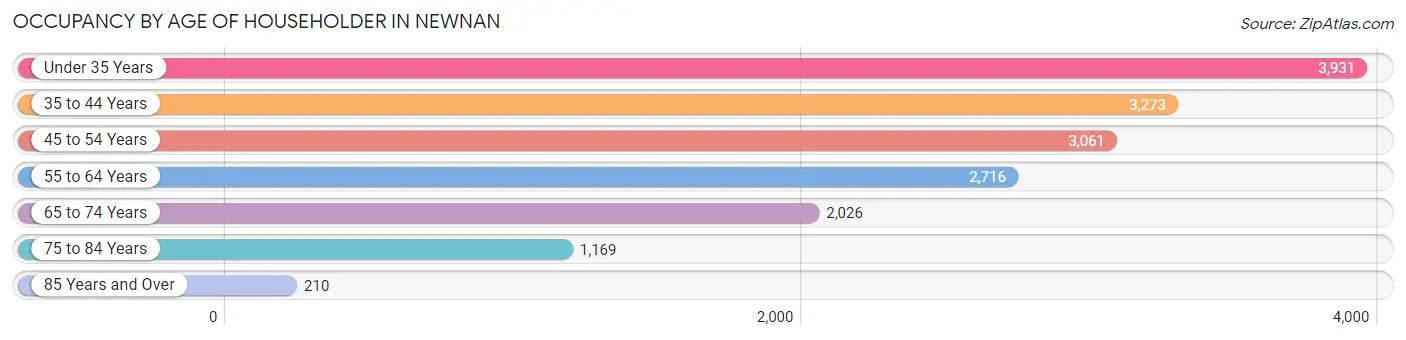
| Age Bracket | # Households | % Households |
| Under 35 Years | 3,931 | 24.0% |
| 35 to 44 Years | 3,273 | 20.0% |
| 45 to 54 Years | 3,061 | 18.7% |
| 55 to 64 Years | 2,716 | 16.6% |
| 65 to 74 Years | 2,026 | 12.4% |
| 75 to 84 Years | 1,169 | 7.1% |
| 85 Years and Over | 210 | 1.3% |
| Total | 16,386 | 100.0% |
Housing Finances in Newnan
Median Income by Occupancy in Newnan
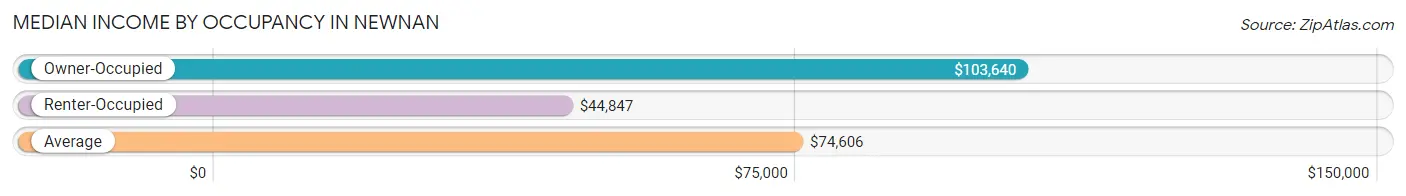
| Occupancy Type | # Households | Median Income |
| Owner-Occupied | 9,251 (56.5%) | $103,640 |
| Renter-Occupied | 7,135 (43.5%) | $44,847 |
| Average | 16,386 (100.0%) | $74,606 |
Occupancy by Householder Income Bracket in Newnan
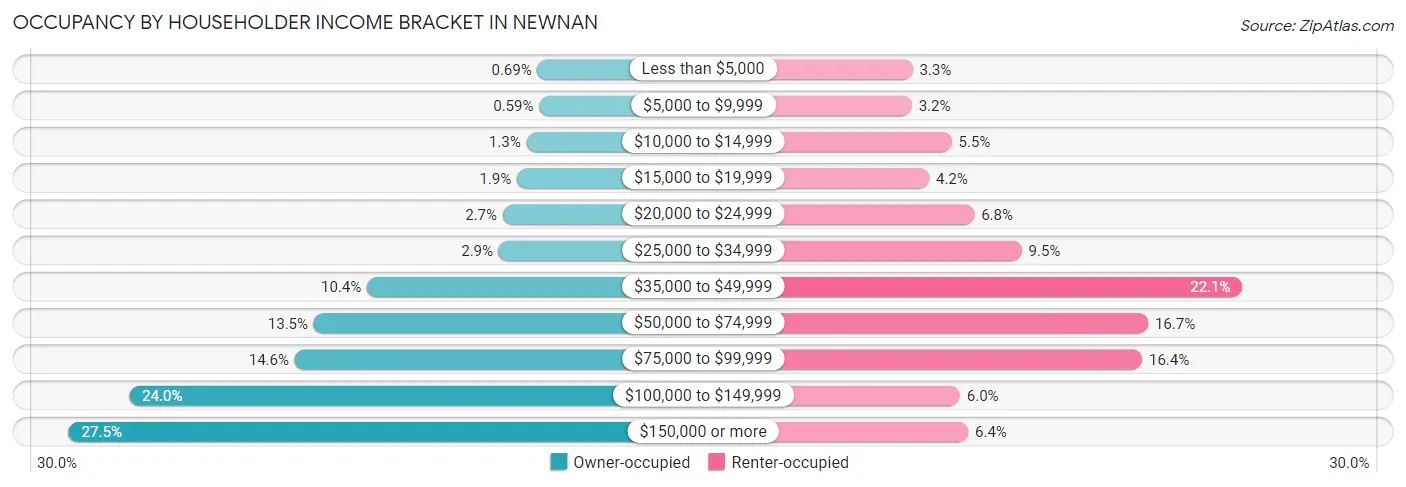
| Income Bracket | Owner-occupied | Renter-occupied |
| Less than $5,000 | 64 (0.7%) | 232 (3.3%) |
| $5,000 to $9,999 | 55 (0.6%) | 229 (3.2%) |
| $10,000 to $14,999 | 122 (1.3%) | 392 (5.5%) |
| $15,000 to $19,999 | 172 (1.9%) | 300 (4.2%) |
| $20,000 to $24,999 | 247 (2.7%) | 484 (6.8%) |
| $25,000 to $34,999 | 268 (2.9%) | 677 (9.5%) |
| $35,000 to $49,999 | 965 (10.4%) | 1,577 (22.1%) |
| $50,000 to $74,999 | 1,246 (13.5%) | 1,192 (16.7%) |
| $75,000 to $99,999 | 1,347 (14.6%) | 1,168 (16.4%) |
| $100,000 to $149,999 | 2,223 (24.0%) | 425 (6.0%) |
| $150,000 or more | 2,542 (27.5%) | 459 (6.4%) |
| Total | 9,251 (100.0%) | 7,135 (100.0%) |
Monthly Housing Cost Tiers in Newnan
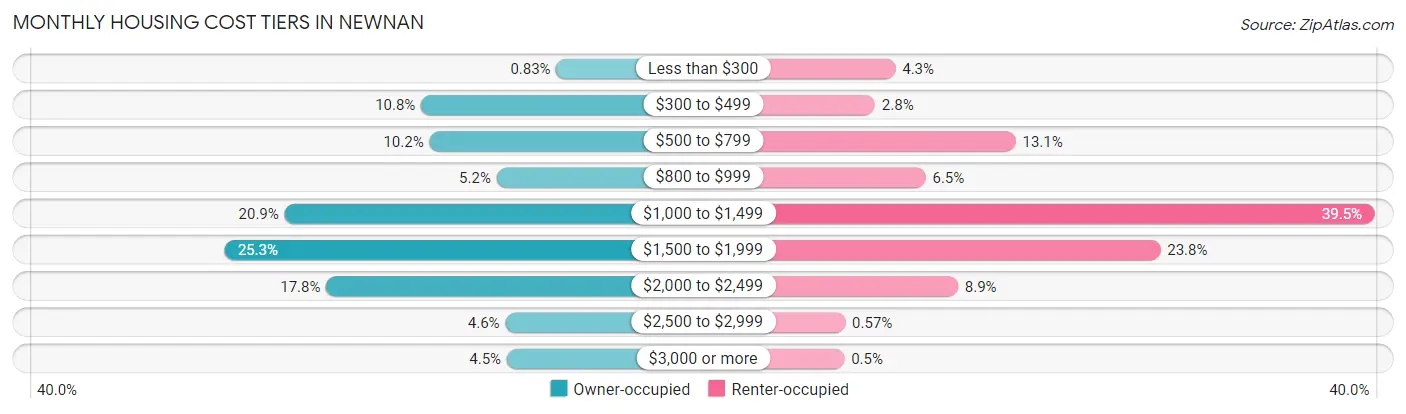
| Monthly Cost | Owner-occupied | Renter-occupied |
| Less than $300 | 77 (0.8%) | 304 (4.3%) |
| $300 to $499 | 998 (10.8%) | 197 (2.8%) |
| $500 to $799 | 942 (10.2%) | 936 (13.1%) |
| $800 to $999 | 484 (5.2%) | 463 (6.5%) |
| $1,000 to $1,499 | 1,929 (20.8%) | 2,819 (39.5%) |
| $1,500 to $1,999 | 2,337 (25.3%) | 1,697 (23.8%) |
| $2,000 to $2,499 | 1,645 (17.8%) | 633 (8.9%) |
| $2,500 to $2,999 | 425 (4.6%) | 41 (0.6%) |
| $3,000 or more | 414 (4.5%) | 36 (0.5%) |
| Total | 9,251 (100.0%) | 7,135 (100.0%) |
Physical Housing Characteristics in Newnan
Housing Structures in Newnan
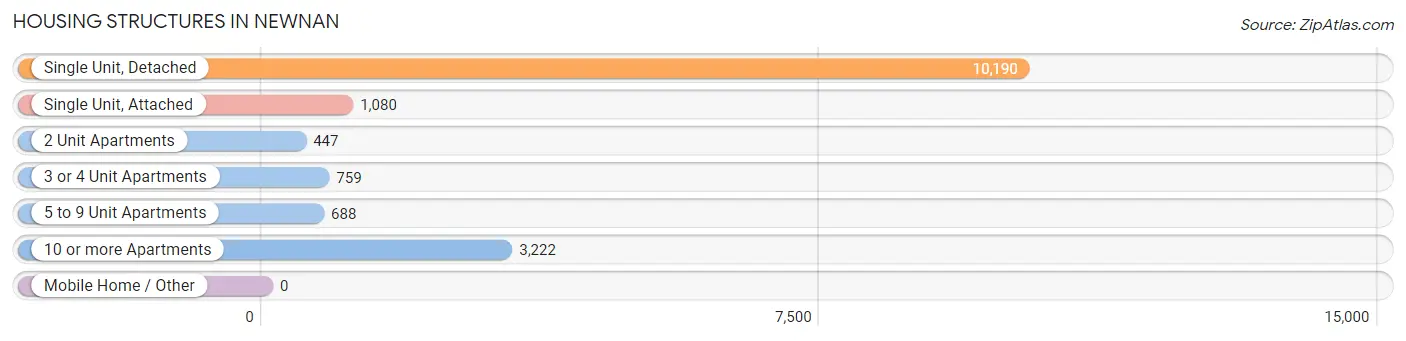
| Structure Type | # Housing Units | % Housing Units |
| Single Unit, Detached | 10,190 | 62.2% |
| Single Unit, Attached | 1,080 | 6.6% |
| 2 Unit Apartments | 447 | 2.7% |
| 3 or 4 Unit Apartments | 759 | 4.6% |
| 5 to 9 Unit Apartments | 688 | 4.2% |
| 10 or more Apartments | 3,222 | 19.7% |
| Mobile Home / Other | 0 | 0.0% |
| Total | 16,386 | 100.0% |
Housing Structures by Occupancy in Newnan
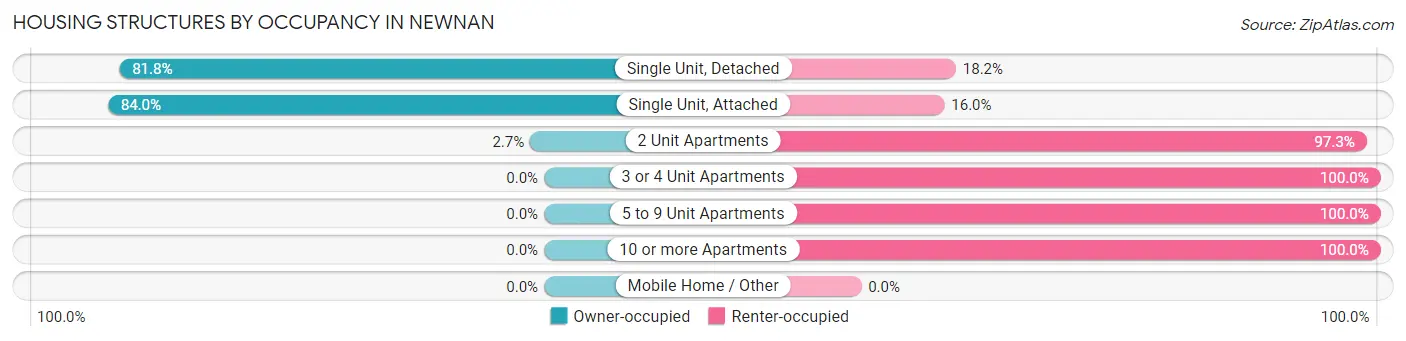
| Structure Type | Owner-occupied | Renter-occupied |
| Single Unit, Detached | 8,332 (81.8%) | 1,858 (18.2%) |
| Single Unit, Attached | 907 (84.0%) | 173 (16.0%) |
| 2 Unit Apartments | 12 (2.7%) | 435 (97.3%) |
| 3 or 4 Unit Apartments | 0 (0.0%) | 759 (100.0%) |
| 5 to 9 Unit Apartments | 0 (0.0%) | 688 (100.0%) |
| 10 or more Apartments | 0 (0.0%) | 3,222 (100.0%) |
| Mobile Home / Other | 0 (0.0%) | 0 (0.0%) |
| Total | 9,251 (56.5%) | 7,135 (43.5%) |
Housing Structures by Number of Rooms in Newnan
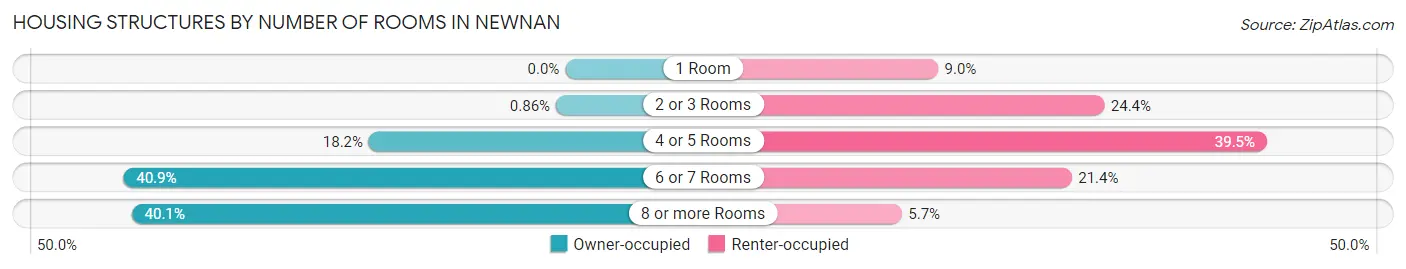
| Number of Rooms | Owner-occupied | Renter-occupied |
| 1 Room | 0 (0.0%) | 644 (9.0%) |
| 2 or 3 Rooms | 80 (0.9%) | 1,742 (24.4%) |
| 4 or 5 Rooms | 1,680 (18.2%) | 2,817 (39.5%) |
| 6 or 7 Rooms | 3,781 (40.9%) | 1,527 (21.4%) |
| 8 or more Rooms | 3,710 (40.1%) | 405 (5.7%) |
| Total | 9,251 (100.0%) | 7,135 (100.0%) |
Housing Structure by Heating Type in Newnan
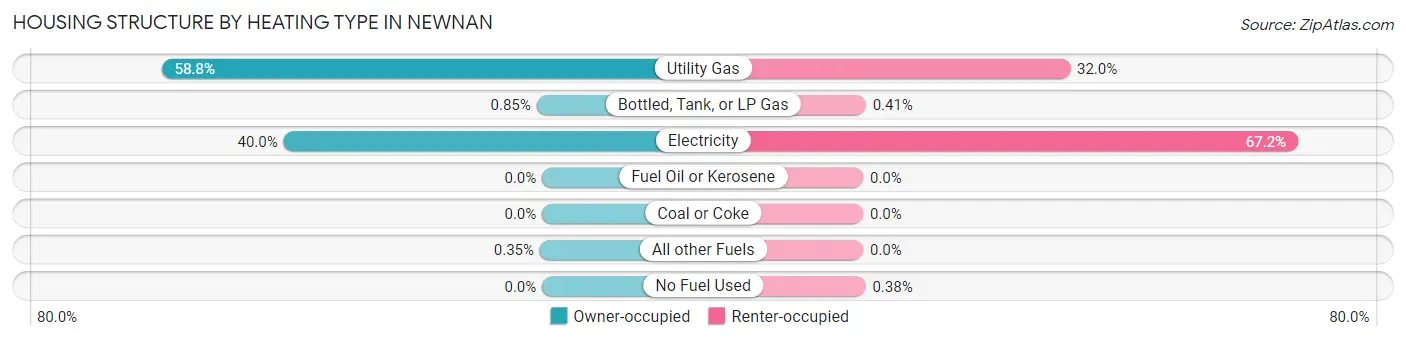
| Heating Type | Owner-occupied | Renter-occupied |
| Utility Gas | 5,442 (58.8%) | 2,283 (32.0%) |
| Bottled, Tank, or LP Gas | 79 (0.9%) | 29 (0.4%) |
| Electricity | 3,698 (40.0%) | 4,796 (67.2%) |
| Fuel Oil or Kerosene | 0 (0.0%) | 0 (0.0%) |
| Coal or Coke | 0 (0.0%) | 0 (0.0%) |
| All other Fuels | 32 (0.4%) | 0 (0.0%) |
| No Fuel Used | 0 (0.0%) | 27 (0.4%) |
| Total | 9,251 (100.0%) | 7,135 (100.0%) |
Household Vehicle Usage in Newnan
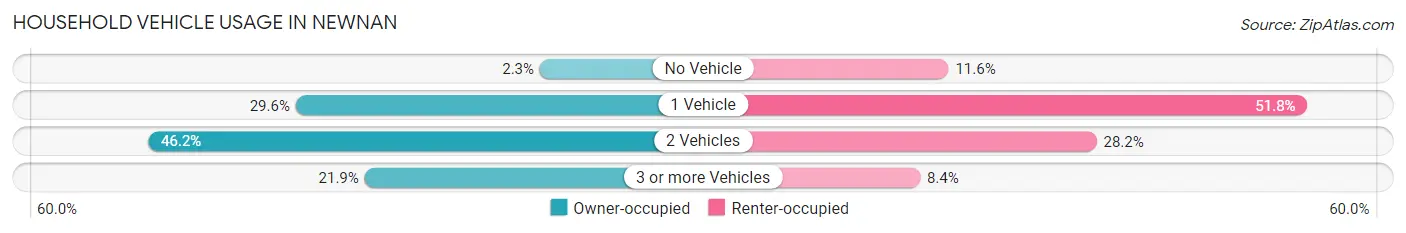
| Vehicles per Household | Owner-occupied | Renter-occupied |
| No Vehicle | 211 (2.3%) | 828 (11.6%) |
| 1 Vehicle | 2,741 (29.6%) | 3,696 (51.8%) |
| 2 Vehicles | 4,272 (46.2%) | 2,011 (28.2%) |
| 3 or more Vehicles | 2,027 (21.9%) | 600 (8.4%) |
| Total | 9,251 (100.0%) | 7,135 (100.0%) |
Real Estate & Mortgages in Newnan
Real Estate and Mortgage Overview in Newnan
| Characteristic | Without Mortgage | With Mortgage |
| Housing Units | 2,340 | 6,911 |
| Median Property Value | $268,900 | $290,800 |
| Median Household Income | $76,377 | $2,120 |
| Monthly Housing Costs | $569 | $405 |
| Real Estate Taxes | $1,898 | $58 |
Property Value by Mortgage Status in Newnan
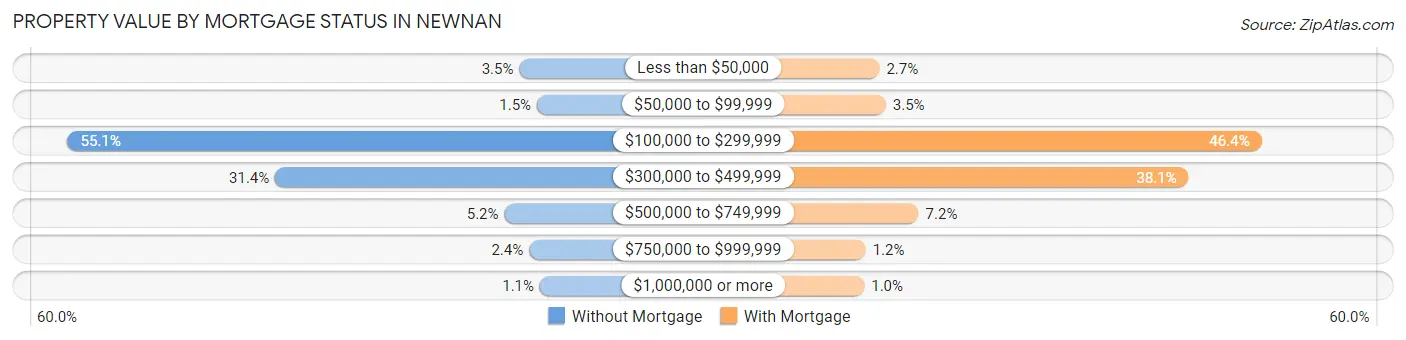
| Property Value | Without Mortgage | With Mortgage |
| Less than $50,000 | 81 (3.5%) | 189 (2.7%) |
| $50,000 to $99,999 | 34 (1.5%) | 239 (3.5%) |
| $100,000 to $299,999 | 1,289 (55.1%) | 3,206 (46.4%) |
| $300,000 to $499,999 | 734 (31.4%) | 2,630 (38.1%) |
| $500,000 to $749,999 | 121 (5.2%) | 498 (7.2%) |
| $750,000 to $999,999 | 55 (2.4%) | 80 (1.2%) |
| $1,000,000 or more | 26 (1.1%) | 69 (1.0%) |
| Total | 2,340 (100.0%) | 6,911 (100.0%) |
Household Income by Mortgage Status in Newnan
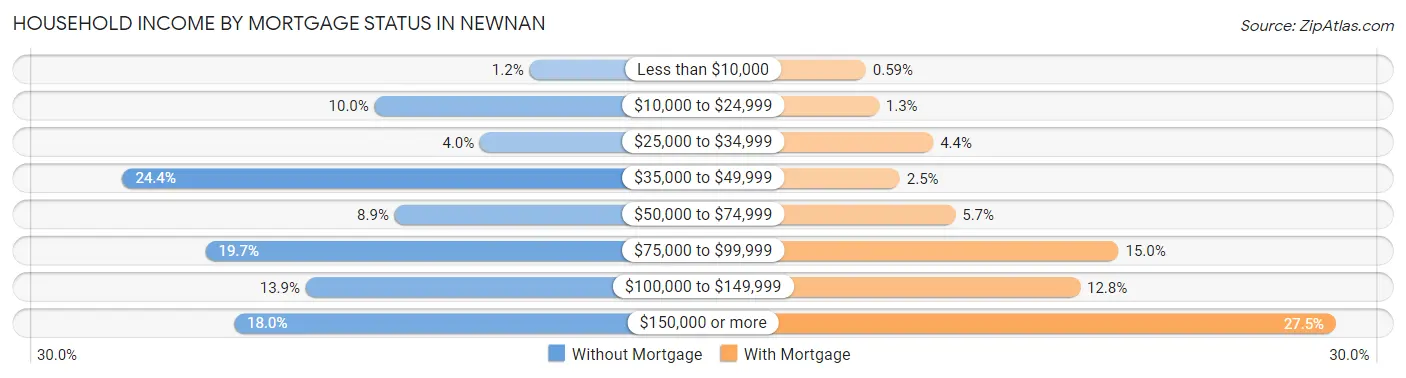
| Household Income | Without Mortgage | With Mortgage |
| Less than $10,000 | 27 (1.1%) | 41 (0.6%) |
| $10,000 to $24,999 | 234 (10.0%) | 92 (1.3%) |
| $25,000 to $34,999 | 93 (4.0%) | 307 (4.4%) |
| $35,000 to $49,999 | 571 (24.4%) | 175 (2.5%) |
| $50,000 to $74,999 | 207 (8.8%) | 394 (5.7%) |
| $75,000 to $99,999 | 460 (19.7%) | 1,039 (15.0%) |
| $100,000 to $149,999 | 326 (13.9%) | 887 (12.8%) |
| $150,000 or more | 422 (18.0%) | 1,897 (27.5%) |
| Total | 2,340 (100.0%) | 6,911 (100.0%) |
Property Value to Household Income Ratio in Newnan
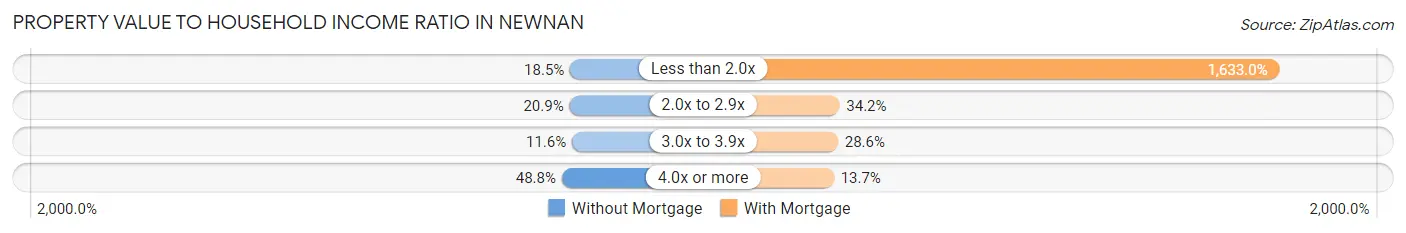
| Value-to-Income Ratio | Without Mortgage | With Mortgage |
| Less than 2.0x | 432 (18.5%) | 112,853 (1,632.9%) |
| 2.0x to 2.9x | 489 (20.9%) | 2,366 (34.2%) |
| 3.0x to 3.9x | 271 (11.6%) | 1,974 (28.6%) |
| 4.0x or more | 1,141 (48.8%) | 947 (13.7%) |
| Total | 2,340 (100.0%) | 6,911 (100.0%) |
Real Estate Taxes by Mortgage Status in Newnan
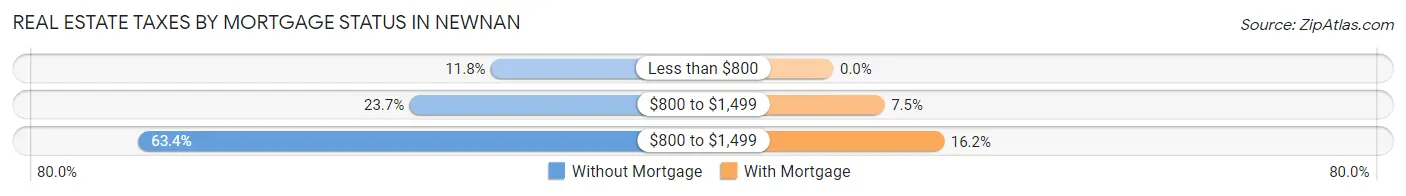
| Property Taxes | Without Mortgage | With Mortgage |
| Less than $800 | 276 (11.8%) | 0 (0.0%) |
| $800 to $1,499 | 554 (23.7%) | 517 (7.5%) |
| $800 to $1,499 | 1,483 (63.4%) | 1,118 (16.2%) |
| Total | 2,340 (100.0%) | 6,911 (100.0%) |
Health & Disability in Newnan
Health Insurance Coverage by Age in Newnan
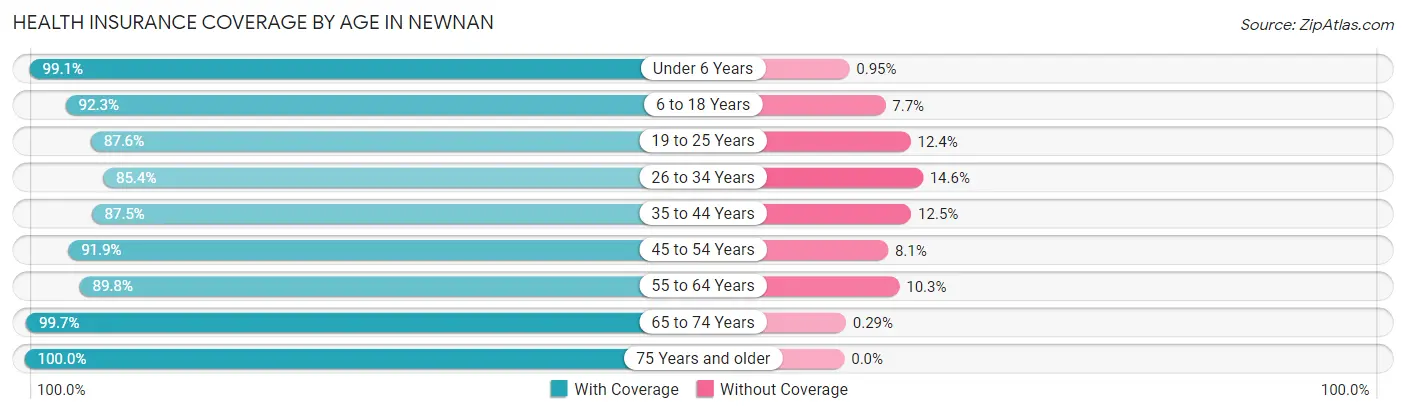
| Age Bracket | With Coverage | Without Coverage |
| Under 6 Years | 3,221 (99.1%) | 31 (0.9%) |
| 6 to 18 Years | 7,773 (92.3%) | 645 (7.7%) |
| 19 to 25 Years | 3,077 (87.6%) | 434 (12.4%) |
| 26 to 34 Years | 4,977 (85.4%) | 853 (14.6%) |
| 35 to 44 Years | 5,677 (87.5%) | 809 (12.5%) |
| 45 to 54 Years | 4,558 (91.9%) | 404 (8.1%) |
| 55 to 64 Years | 4,012 (89.7%) | 458 (10.2%) |
| 65 to 74 Years | 3,097 (99.7%) | 9 (0.3%) |
| 75 Years and older | 2,101 (100.0%) | 0 (0.0%) |
| Total | 38,493 (91.3%) | 3,643 (8.6%) |
Health Insurance Coverage by Citizenship Status in Newnan
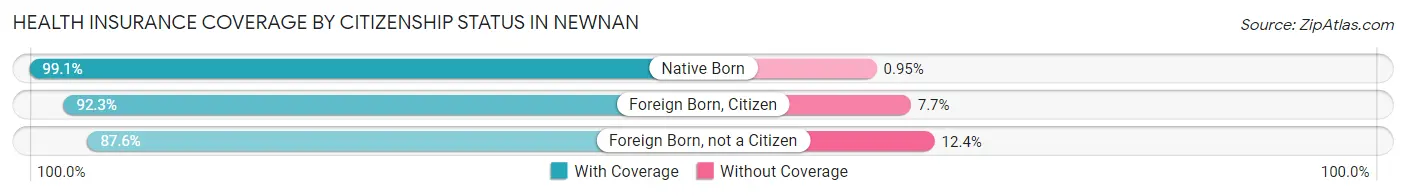
| Citizenship Status | With Coverage | Without Coverage |
| Native Born | 3,221 (99.1%) | 31 (0.9%) |
| Foreign Born, Citizen | 7,773 (92.3%) | 645 (7.7%) |
| Foreign Born, not a Citizen | 3,077 (87.6%) | 434 (12.4%) |
Health Insurance Coverage by Household Income in Newnan
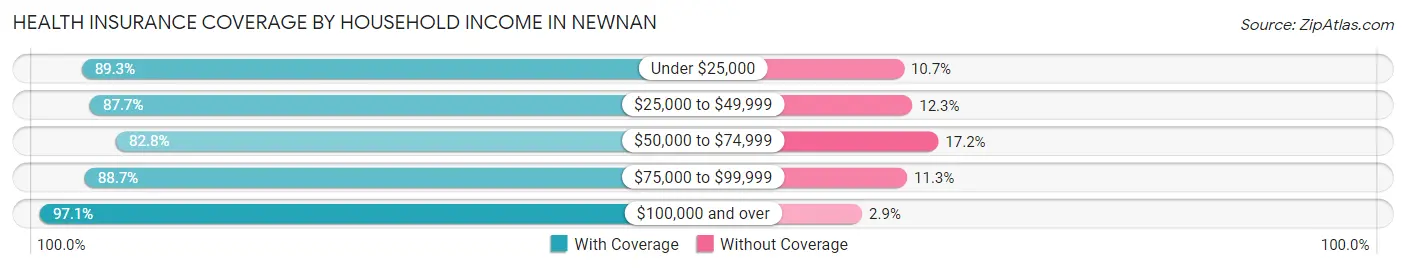
| Household Income | With Coverage | Without Coverage |
| Under $25,000 | 3,427 (89.3%) | 411 (10.7%) |
| $25,000 to $49,999 | 6,786 (87.7%) | 950 (12.3%) |
| $50,000 to $74,999 | 4,795 (82.8%) | 993 (17.2%) |
| $75,000 to $99,999 | 6,062 (88.7%) | 772 (11.3%) |
| $100,000 and over | 17,417 (97.1%) | 517 (2.9%) |
Public vs Private Health Insurance Coverage by Age in Newnan
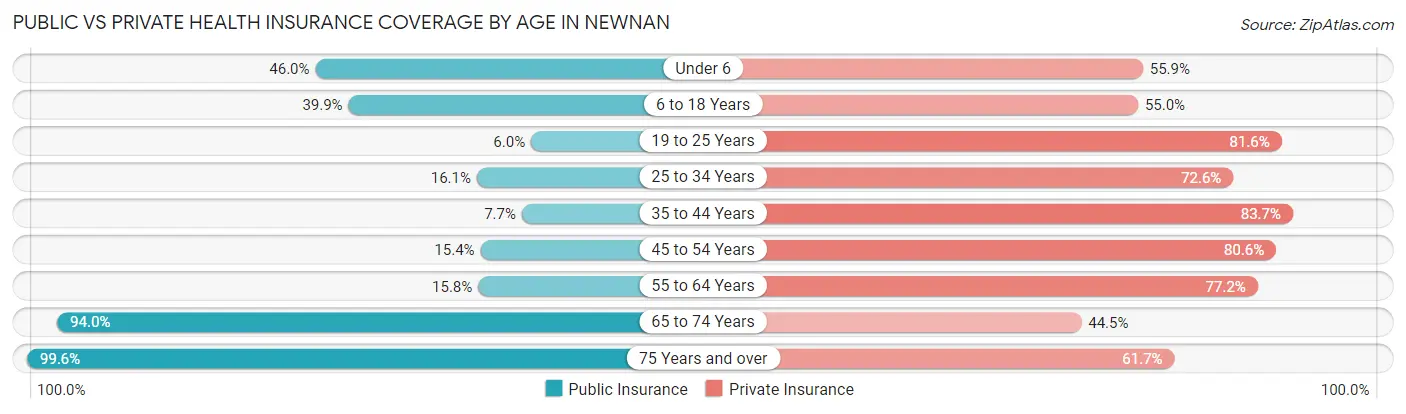
| Age Bracket | Public Insurance | Private Insurance |
| Under 6 | 1,497 (46.0%) | 1,817 (55.9%) |
| 6 to 18 Years | 3,358 (39.9%) | 4,627 (55.0%) |
| 19 to 25 Years | 211 (6.0%) | 2,866 (81.6%) |
| 25 to 34 Years | 937 (16.1%) | 4,235 (72.6%) |
| 35 to 44 Years | 500 (7.7%) | 5,429 (83.7%) |
| 45 to 54 Years | 764 (15.4%) | 4,000 (80.6%) |
| 55 to 64 Years | 707 (15.8%) | 3,450 (77.2%) |
| 65 to 74 Years | 2,918 (94.0%) | 1,381 (44.5%) |
| 75 Years and over | 2,092 (99.6%) | 1,297 (61.7%) |
| Total | 12,984 (30.8%) | 29,102 (69.1%) |
Disability Status by Sex by Age in Newnan
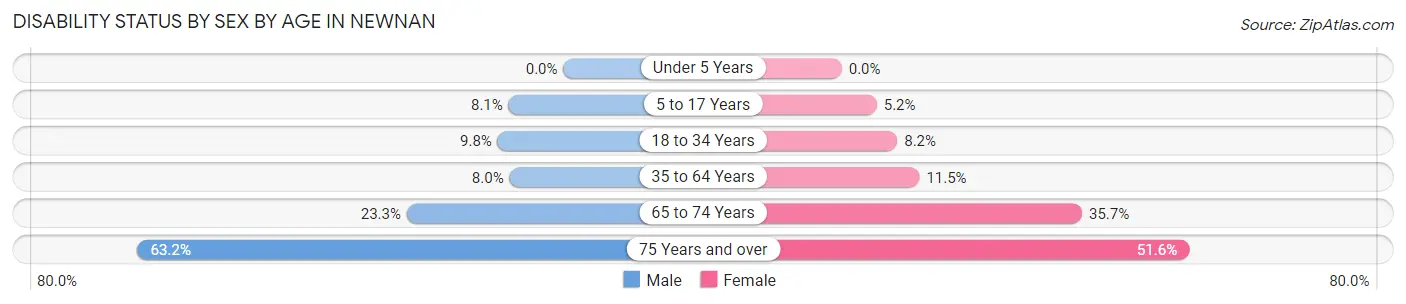
| Age Bracket | Male | Female |
| Under 5 Years | 0 (0.0%) | 0 (0.0%) |
| 5 to 17 Years | 276 (8.1%) | 240 (5.2%) |
| 18 to 34 Years | 424 (9.8%) | 482 (8.2%) |
| 35 to 64 Years | 602 (8.0%) | 968 (11.5%) |
| 65 to 74 Years | 292 (23.3%) | 660 (35.7%) |
| 75 Years and over | 540 (63.2%) | 643 (51.6%) |
Disability Class by Sex by Age in Newnan
Disability Class: Hearing Difficulty
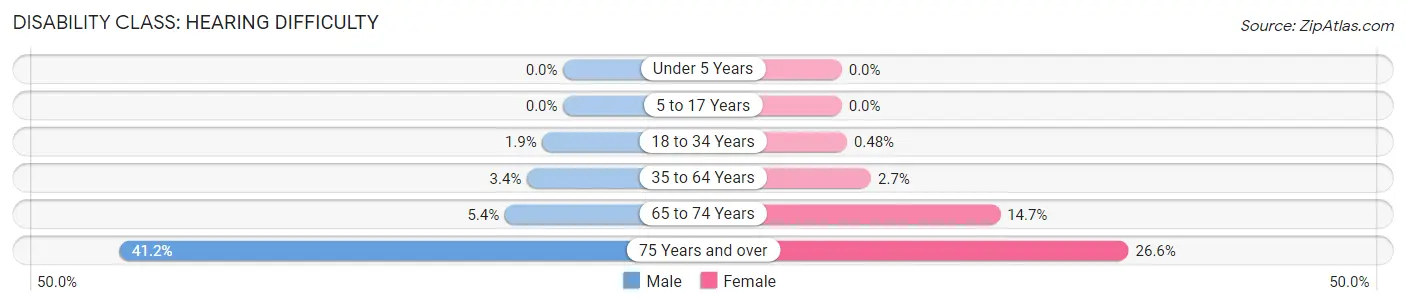
| Age Bracket | Male | Female |
| Under 5 Years | 0 (0.0%) | 0 (0.0%) |
| 5 to 17 Years | 0 (0.0%) | 0 (0.0%) |
| 18 to 34 Years | 84 (1.9%) | 28 (0.5%) |
| 35 to 64 Years | 252 (3.4%) | 228 (2.7%) |
| 65 to 74 Years | 68 (5.4%) | 272 (14.7%) |
| 75 Years and over | 352 (41.2%) | 332 (26.6%) |
Disability Class: Vision Difficulty
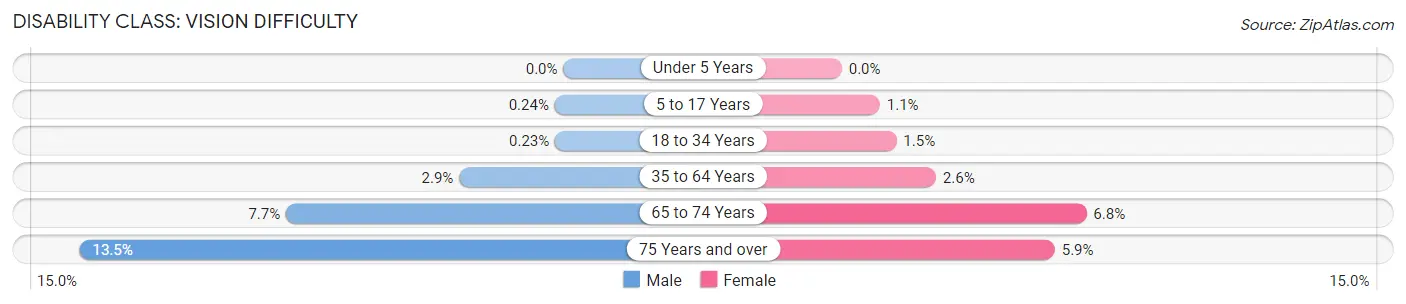
| Age Bracket | Male | Female |
| Under 5 Years | 0 (0.0%) | 0 (0.0%) |
| 5 to 17 Years | 8 (0.2%) | 49 (1.1%) |
| 18 to 34 Years | 10 (0.2%) | 89 (1.5%) |
| 35 to 64 Years | 218 (2.9%) | 220 (2.6%) |
| 65 to 74 Years | 97 (7.7%) | 126 (6.8%) |
| 75 Years and over | 115 (13.5%) | 74 (5.9%) |
Disability Class: Cognitive Difficulty
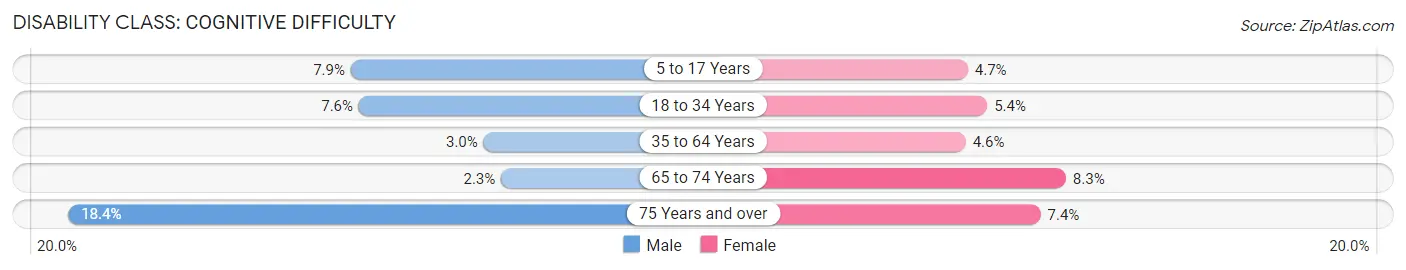
| Age Bracket | Male | Female |
| 5 to 17 Years | 268 (7.9%) | 216 (4.7%) |
| 18 to 34 Years | 330 (7.6%) | 316 (5.4%) |
| 35 to 64 Years | 223 (3.0%) | 386 (4.6%) |
| 65 to 74 Years | 29 (2.3%) | 154 (8.3%) |
| 75 Years and over | 157 (18.4%) | 92 (7.4%) |
Disability Class: Ambulatory Difficulty
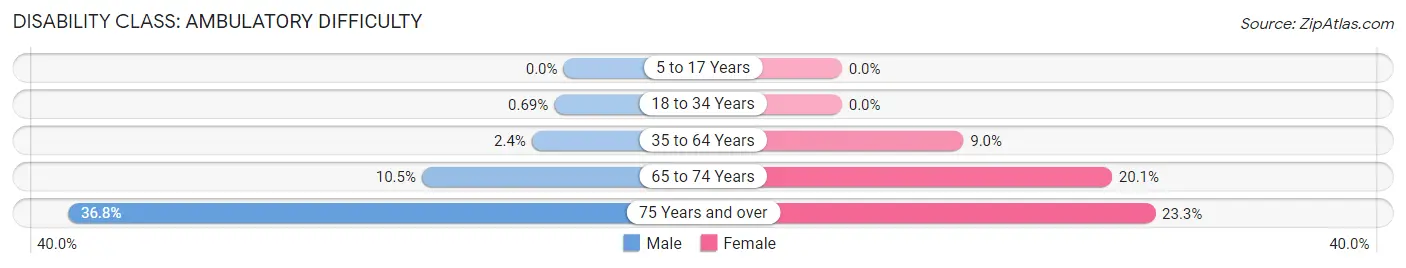
| Age Bracket | Male | Female |
| 5 to 17 Years | 0 (0.0%) | 0 (0.0%) |
| 18 to 34 Years | 30 (0.7%) | 0 (0.0%) |
| 35 to 64 Years | 177 (2.4%) | 757 (9.0%) |
| 65 to 74 Years | 132 (10.5%) | 371 (20.1%) |
| 75 Years and over | 314 (36.8%) | 290 (23.3%) |
Disability Class: Self-Care Difficulty
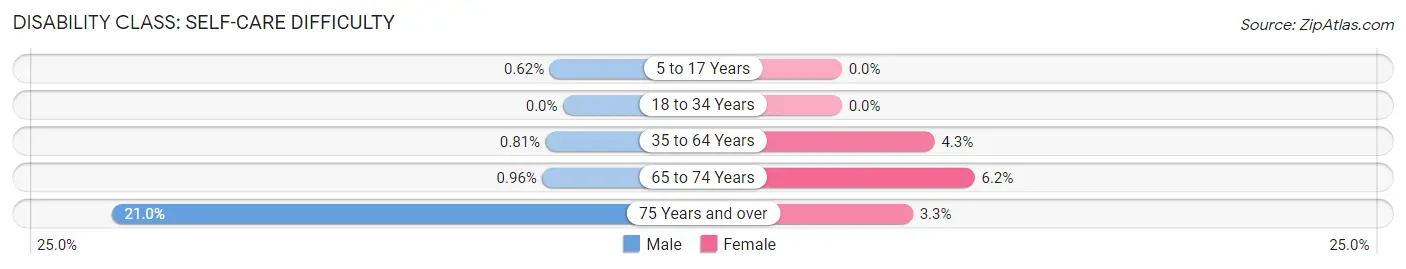
| Age Bracket | Male | Female |
| 5 to 17 Years | 21 (0.6%) | 0 (0.0%) |
| 18 to 34 Years | 0 (0.0%) | 0 (0.0%) |
| 35 to 64 Years | 61 (0.8%) | 361 (4.3%) |
| 65 to 74 Years | 12 (1.0%) | 114 (6.2%) |
| 75 Years and over | 179 (21.0%) | 41 (3.3%) |
Technology Access in Newnan
Computing Device Access in Newnan
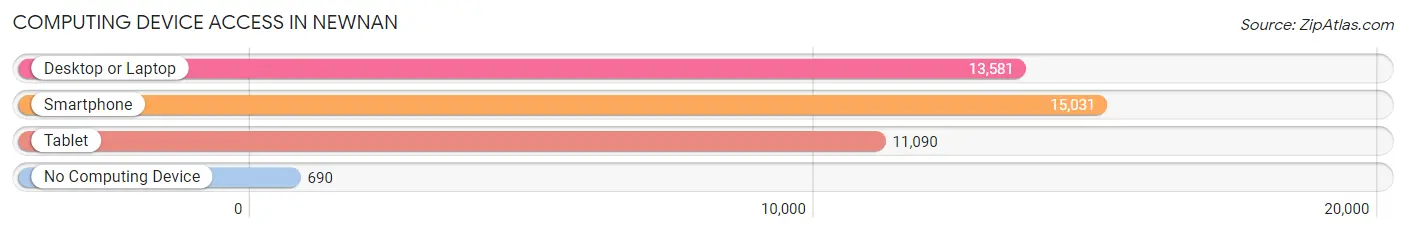
| Device Type | # Households | % Households |
| Desktop or Laptop | 13,581 | 82.9% |
| Smartphone | 15,031 | 91.7% |
| Tablet | 11,090 | 67.7% |
| No Computing Device | 690 | 4.2% |
| Total | 16,386 | 100.0% |
Internet Access in Newnan
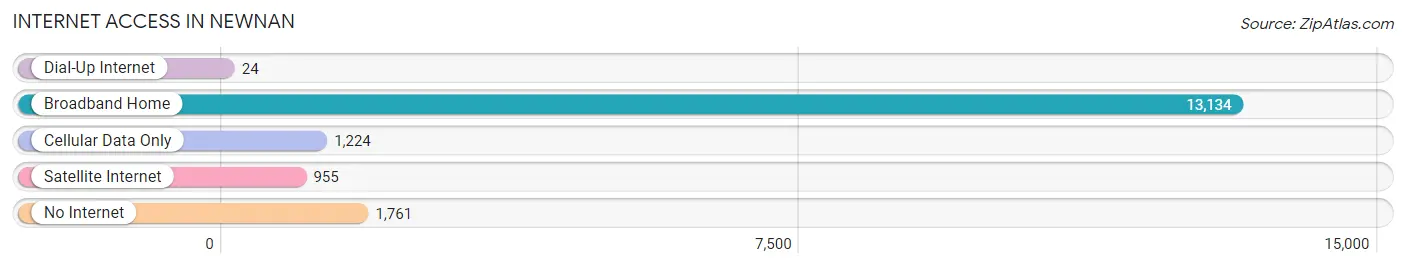
| Internet Type | # Households | % Households |
| Dial-Up Internet | 24 | 0.2% |
| Broadband Home | 13,134 | 80.1% |
| Cellular Data Only | 1,224 | 7.5% |
| Satellite Internet | 955 | 5.8% |
| No Internet | 1,761 | 10.7% |
| Total | 16,386 | 100.0% |
Newnan Summary
Newnan, Georgia is a city located in Coweta County, approximately 40 miles southwest of Atlanta. It is the county seat of Coweta County and is part of the Atlanta metropolitan area. The city has a population of approximately 33,000 people and is the largest city in the county.
History
Newnan was founded in 1828 and named after General Daniel Newnan, a hero of the War of 1812. The city was originally a trading post and was the site of a major battle during the Civil War. After the war, the city experienced a period of growth and development, becoming a major center for cotton production and manufacturing. The city was also home to several prominent businesses, including the Newnan Cotton Mill, which was the largest cotton mill in the world at the time.
In the late 19th century, the city experienced a period of decline due to the decline of the cotton industry. However, in the early 20th century, the city experienced a period of revitalization, with the construction of several new buildings and the establishment of several new businesses.
Geography
Newnan is located in the foothills of the Appalachian Mountains in the Piedmont region of Georgia. The city is situated on the banks of the Chattahoochee River and is surrounded by rolling hills and forests. The city is located approximately 40 miles southwest of Atlanta and is part of the Atlanta metropolitan area.
The climate in Newnan is humid subtropical, with hot, humid summers and mild winters. The average annual temperature is around 64 degrees Fahrenheit, with an average high of around 87 degrees in the summer and an average low of around 41 degrees in the winter.
Economy
Newnan’s economy is largely based on manufacturing and services. The city is home to several major employers, including the Newnan Cotton Mill, which is the largest cotton mill in the world. Other major employers include the Newnan-Coweta County Airport, the Coweta County School System, and the Coweta County Hospital.
The city is also home to several retail and dining establishments, as well as several hotels and motels. The city is also home to several parks and recreational facilities, including the Newnan Country Club and the Newnan Golf Course.
Demographics
As of the 2010 census, the population of Newnan was 33,039. The racial makeup of the city was 73.3% White, 19.2% African American, 0.4% Native American, 1.7% Asian, 0.1% Pacific Islander, and 4.3% from other races. Hispanic or Latino of any race were 8.2% of the population.
The median household income in Newnan was $45,945, and the median family income was $54,945. The per capita income in Newnan was $24,945. About 11.2% of the population was below the poverty line.
Newnan is a diverse city with a rich history and a vibrant economy. The city is home to several major employers and is a popular destination for tourists and residents alike. The city is also home to several parks and recreational facilities, making it an ideal place to live and work.
Common Questions
What is Per Capita Income in Newnan?
Per Capita income in Newnan is $37,858.
What is the Median Family Income in Newnan?
Median Family Income in Newnan is $95,605.
What is the Median Household income in Newnan?
Median Household Income in Newnan is $74,606.
What is Income or Wage Gap in Newnan?
Income or Wage Gap in Newnan is 31.7%.
Women in Newnan earn 68.3 cents for every dollar earned by a man.
What is Inequality or Gini Index in Newnan?
Inequality or Gini Index in Newnan is 0.43.
What is the Total Population of Newnan?
Total Population of Newnan is 42,689.
What is the Total Male Population of Newnan?
Total Male Population of Newnan is 19,344.
What is the Total Female Population of Newnan?
Total Female Population of Newnan is 23,345.
What is the Ratio of Males per 100 Females in Newnan?
There are 82.86 Males per 100 Females in Newnan.
What is the Ratio of Females per 100 Males in Newnan?
There are 120.68 Females per 100 Males in Newnan.
What is the Median Population Age in Newnan?
Median Population Age in Newnan is 35.0 Years.
What is the Average Family Size in Newnan
Average Family Size in Newnan is 3.3 People.
What is the Average Household Size in Newnan
Average Household Size in Newnan is 2.6 People.
How Large is the Labor Force in Newnan?
There are 22,207 People in the Labor Forcein in Newnan.
What is the Percentage of People in the Labor Force in Newnan?
66.9% of People are in the Labor Force in Newnan.
What is the Unemployment Rate in Newnan?
Unemployment Rate in Newnan is 3.1%.