Brandon, FL Map & Demographics
Brandon Map
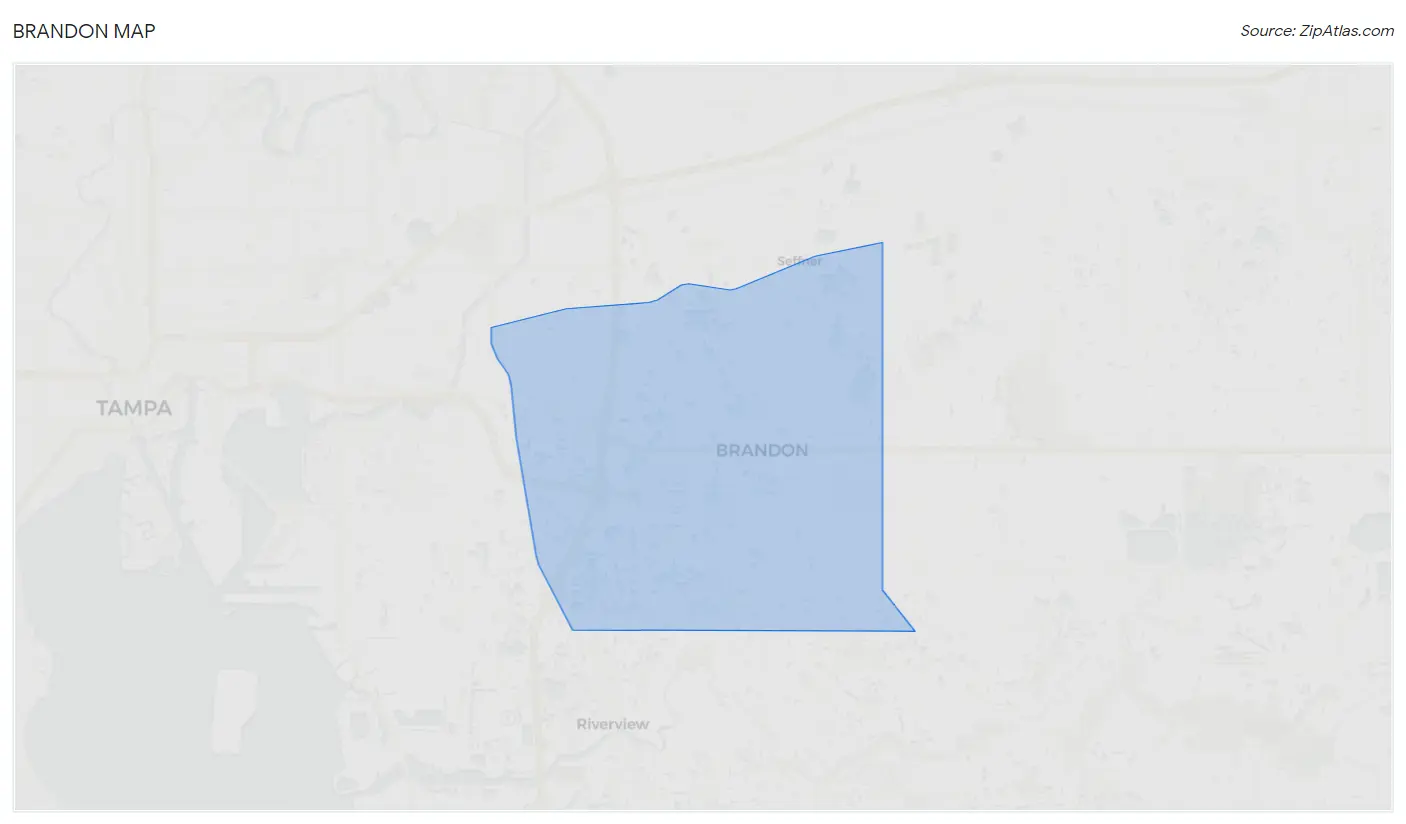
Brandon Overview
$36,952
PER CAPITA INCOME
$81,905
AVG FAMILY INCOME
$71,156
AVG HOUSEHOLD INCOME
17.4%
WAGE / INCOME GAP [ % ]
82.6¢/ $1
WAGE / INCOME GAP [ $ ]
$10,652
FAMILY INCOME DEFICIT
0.41
INEQUALITY / GINI INDEX
114,923
TOTAL POPULATION
56,528
MALE POPULATION
58,395
FEMALE POPULATION
96.80
MALES / 100 FEMALES
103.30
FEMALES / 100 MALES
37.2
MEDIAN AGE
3.1
AVG FAMILY SIZE
2.5
AVG HOUSEHOLD SIZE
62,430
LABOR FORCE [ PEOPLE ]
65.7%
PERCENT IN LABOR FORCE
4.6%
UNEMPLOYMENT RATE
Brandon Area Codes
Income in Brandon
Income Overview in Brandon
Per Capita Income in Brandon is $36,952, while median incomes of families and households are $81,905 and $71,156 respectively.
| Characteristic | Number | Measure |
| Per Capita Income | 114,923 | $36,952 |
| Median Family Income | 28,345 | $81,905 |
| Mean Family Income | 28,345 | $99,340 |
| Median Household Income | 44,836 | $71,156 |
| Mean Household Income | 44,836 | $91,076 |
| Income Deficit | 28,345 | $10,652 |
| Wage / Income Gap (%) | 114,923 | 17.37% |
| Wage / Income Gap ($) | 114,923 | 82.63¢ per $1 |
| Gini / Inequality Index | 114,923 | 0.41 |
Earnings by Sex in Brandon
Average Earnings in Brandon are $41,855, $45,791 for men and $37,836 for women, a difference of 17.4%.
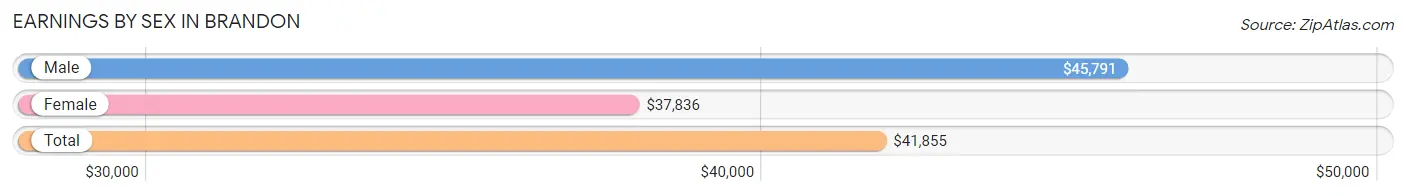
| Sex | Number | Average Earnings |
| Male | 34,192 (52.8%) | $45,791 |
| Female | 30,511 (47.2%) | $37,836 |
| Total | 64,703 (100.0%) | $41,855 |
Earnings by Sex by Income Bracket in Brandon
The most common earnings brackets in Brandon are $100,000+ for men (5,435 | 15.9%) and $55,000 to $64,999 for women (2,552 | 8.4%).
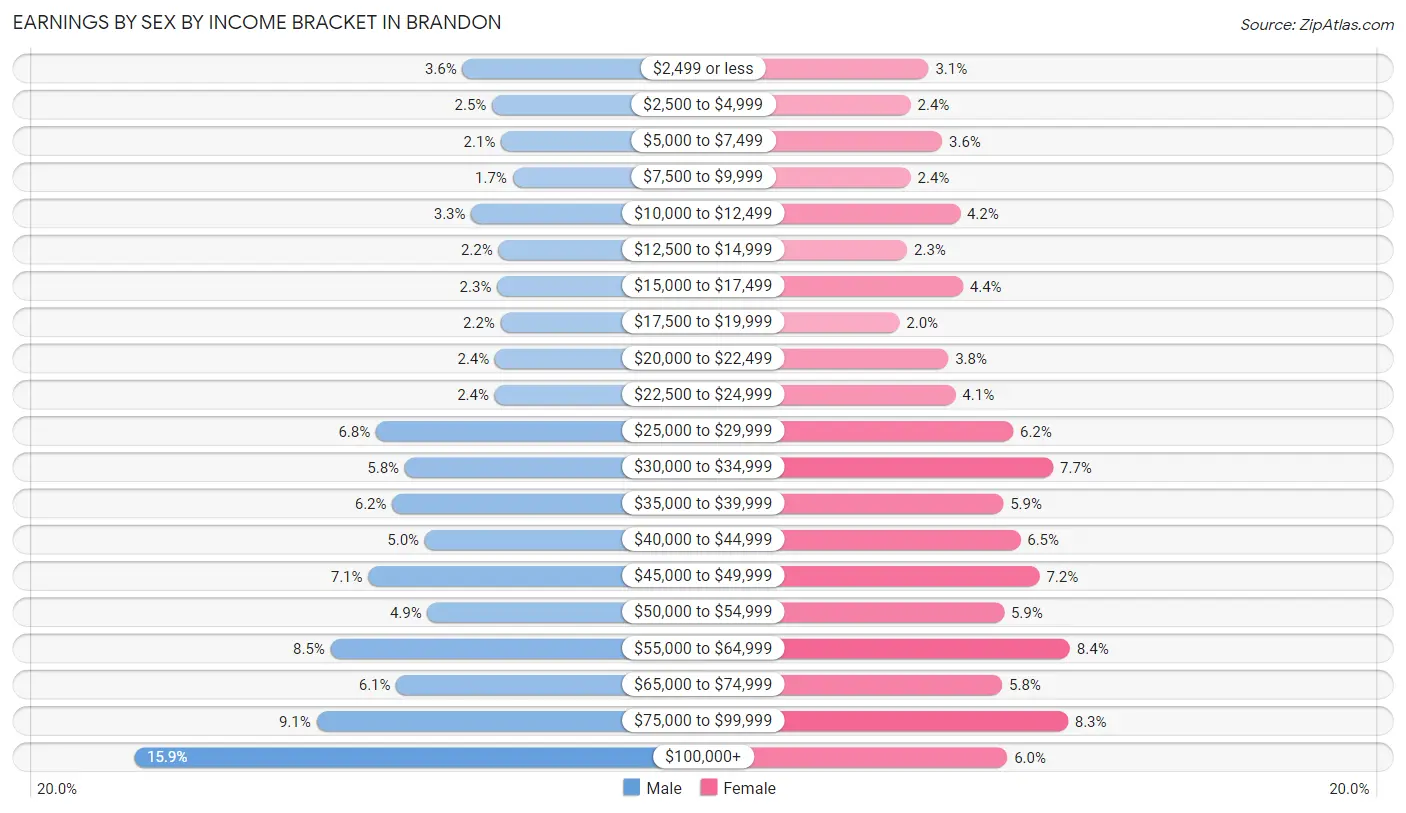
| Income | Male | Female |
| $2,499 or less | 1,229 (3.6%) | 933 (3.1%) |
| $2,500 to $4,999 | 847 (2.5%) | 729 (2.4%) |
| $5,000 to $7,499 | 731 (2.1%) | 1,088 (3.6%) |
| $7,500 to $9,999 | 583 (1.7%) | 730 (2.4%) |
| $10,000 to $12,499 | 1,115 (3.3%) | 1,295 (4.2%) |
| $12,500 to $14,999 | 765 (2.2%) | 689 (2.3%) |
| $15,000 to $17,499 | 782 (2.3%) | 1,326 (4.3%) |
| $17,500 to $19,999 | 738 (2.2%) | 600 (2.0%) |
| $20,000 to $22,499 | 812 (2.4%) | 1,158 (3.8%) |
| $22,500 to $24,999 | 813 (2.4%) | 1,241 (4.1%) |
| $25,000 to $29,999 | 2,337 (6.8%) | 1,902 (6.2%) |
| $30,000 to $34,999 | 1,966 (5.8%) | 2,358 (7.7%) |
| $35,000 to $39,999 | 2,127 (6.2%) | 1,789 (5.9%) |
| $40,000 to $44,999 | 1,710 (5.0%) | 1,984 (6.5%) |
| $45,000 to $49,999 | 2,436 (7.1%) | 2,204 (7.2%) |
| $50,000 to $54,999 | 1,676 (4.9%) | 1,797 (5.9%) |
| $55,000 to $64,999 | 2,915 (8.5%) | 2,552 (8.4%) |
| $65,000 to $74,999 | 2,077 (6.1%) | 1,776 (5.8%) |
| $75,000 to $99,999 | 3,098 (9.1%) | 2,527 (8.3%) |
| $100,000+ | 5,435 (15.9%) | 1,833 (6.0%) |
| Total | 34,192 (100.0%) | 30,511 (100.0%) |
Earnings by Sex by Educational Attainment in Brandon
Average earnings in Brandon are $50,001 for men and $42,361 for women, a difference of 15.3%. Men with an educational attainment of graduate degree enjoy the highest average annual earnings of $78,073, while those with less than high school education earn the least with $32,379. Women with an educational attainment of graduate degree earn the most with the average annual earnings of $67,281, while those with less than high school education have the smallest earnings of $29,958.
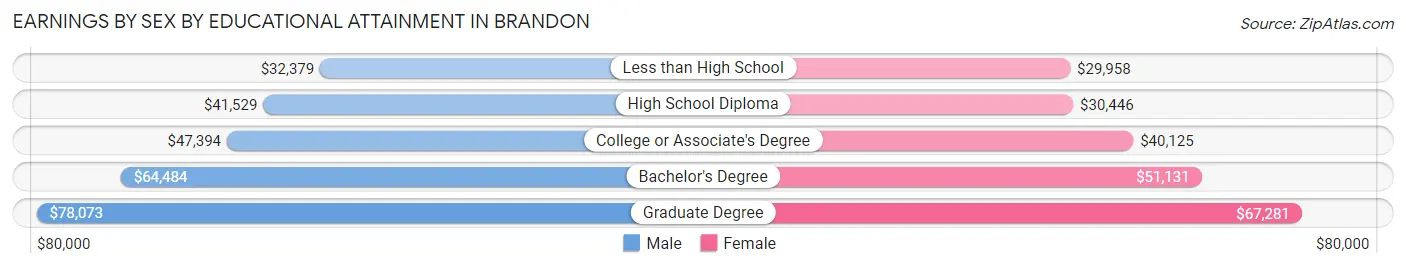
| Educational Attainment | Male Income | Female Income |
| Less than High School | $32,379 | $29,958 |
| High School Diploma | $41,529 | $30,446 |
| College or Associate's Degree | $47,394 | $40,125 |
| Bachelor's Degree | $64,484 | $51,131 |
| Graduate Degree | $78,073 | $67,281 |
| Total | $50,001 | $42,361 |
Family Income in Brandon
Family Income Brackets in Brandon
According to the Brandon family income data, there are 5,952 families falling into the $50,000 to $74,999 income range, which is the most common income bracket and makes up 21.0% of all families. Conversely, the $10,000 to $14,999 income bracket is the least frequent group with only 368 families (1.3%) belonging to this category.
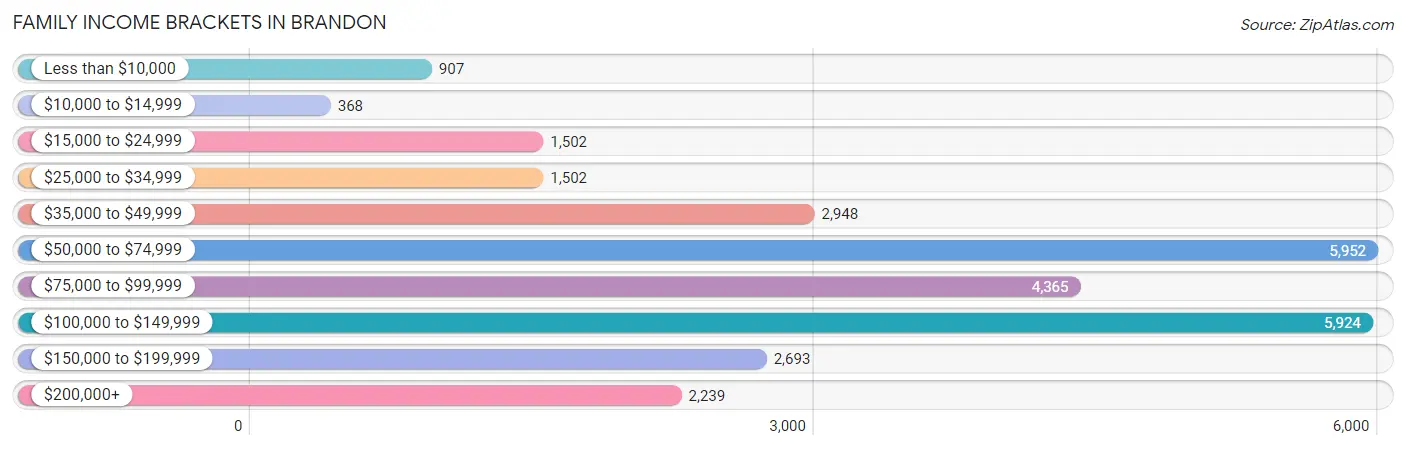
| Income Bracket | # Families | % Families |
| Less than $10,000 | 907 | 3.2% |
| $10,000 to $14,999 | 368 | 1.3% |
| $15,000 to $24,999 | 1,502 | 5.3% |
| $25,000 to $34,999 | 1,502 | 5.3% |
| $35,000 to $49,999 | 2,948 | 10.4% |
| $50,000 to $74,999 | 5,952 | 21.0% |
| $75,000 to $99,999 | 4,365 | 15.4% |
| $100,000 to $149,999 | 5,924 | 20.9% |
| $150,000 to $199,999 | 2,693 | 9.5% |
| $200,000+ | 2,239 | 7.9% |
Family Income by Famaliy Size in Brandon
6-person families (636 | 2.2%) account for the highest median family income in Brandon with $111,923 per family, while 2-person families (13,916 | 49.1%) have the highest median income of $38,074 per family member.
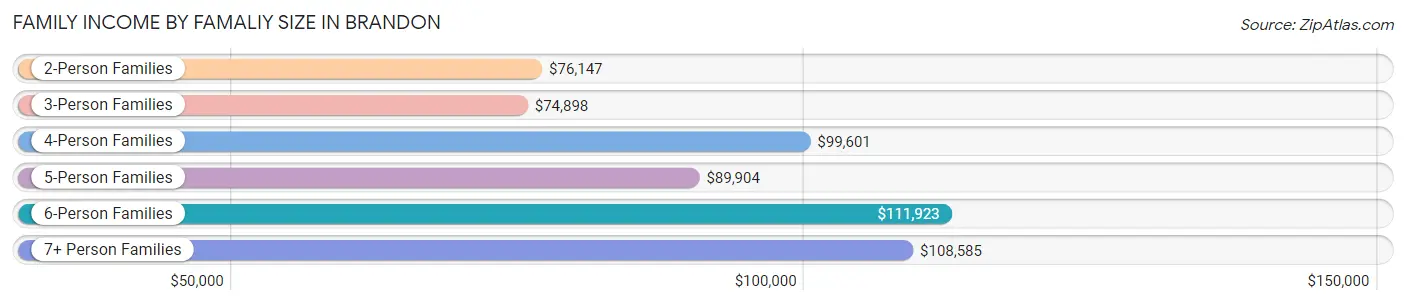
| Income Bracket | # Families | Median Income |
| 2-Person Families | 13,916 (49.1%) | $76,147 |
| 3-Person Families | 7,117 (25.1%) | $74,898 |
| 4-Person Families | 4,545 (16.0%) | $99,601 |
| 5-Person Families | 1,899 (6.7%) | $89,904 |
| 6-Person Families | 636 (2.2%) | $111,923 |
| 7+ Person Families | 232 (0.8%) | $108,585 |
| Total | 28,345 (100.0%) | $81,905 |
Family Income by Number of Earners in Brandon
The median family income in Brandon is $81,905, with families comprising 3+ earners (2,906) having the highest median family income of $121,974, while families with no earners (3,295) have the lowest median family income of $41,616, accounting for 10.2% and 11.6% of families, respectively.
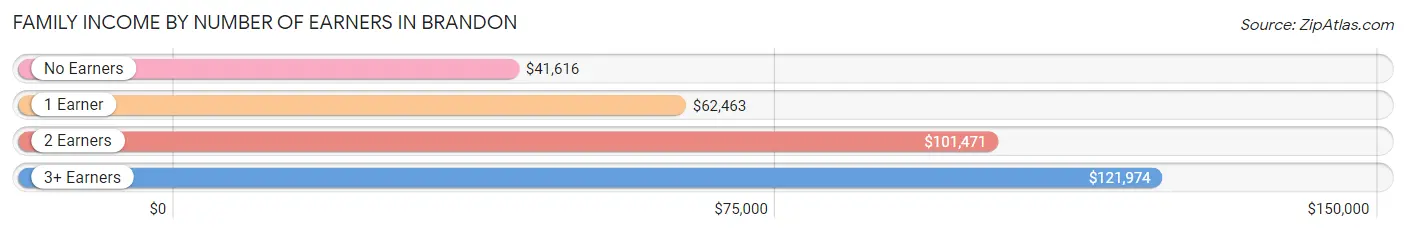
| Number of Earners | # Families | Median Income |
| No Earners | 3,295 (11.6%) | $41,616 |
| 1 Earner | 11,412 (40.3%) | $62,463 |
| 2 Earners | 10,732 (37.9%) | $101,471 |
| 3+ Earners | 2,906 (10.2%) | $121,974 |
| Total | 28,345 (100.0%) | $81,905 |
Household Income in Brandon
Household Income Brackets in Brandon
With 9,505 households falling in the category, the $50,000 to $74,999 income range is the most frequent in Brandon, accounting for 21.2% of all households. In contrast, only 1,435 households (3.2%) fall into the $10,000 to $14,999 income bracket, making it the least populous group.
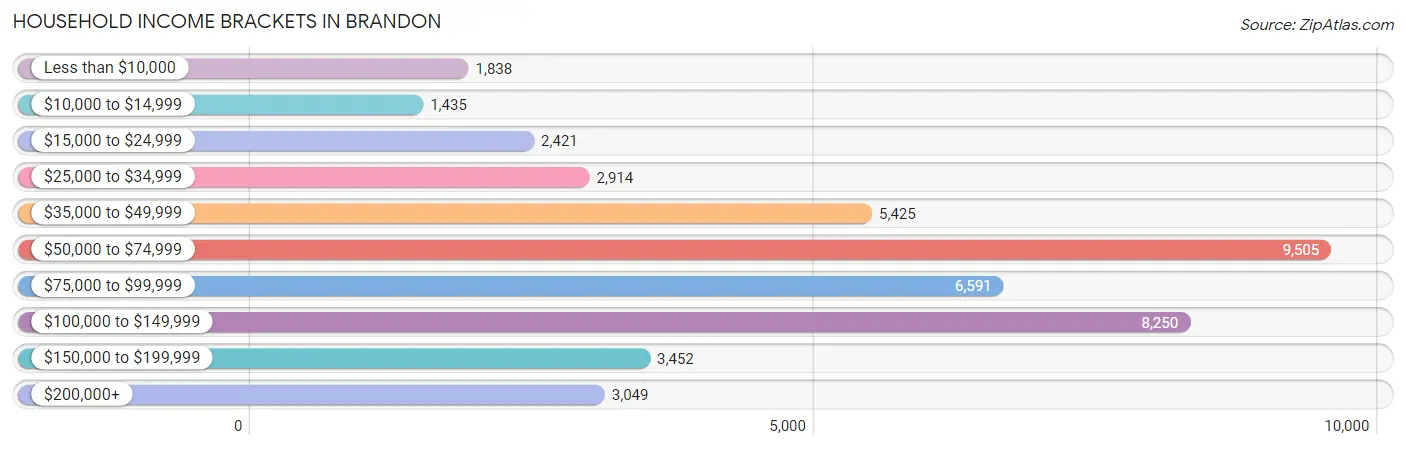
| Income Bracket | # Households | % Households |
| Less than $10,000 | 1,838 | 4.1% |
| $10,000 to $14,999 | 1,435 | 3.2% |
| $15,000 to $24,999 | 2,421 | 5.4% |
| $25,000 to $34,999 | 2,914 | 6.5% |
| $35,000 to $49,999 | 5,425 | 12.1% |
| $50,000 to $74,999 | 9,505 | 21.2% |
| $75,000 to $99,999 | 6,591 | 14.7% |
| $100,000 to $149,999 | 8,250 | 18.4% |
| $150,000 to $199,999 | 3,452 | 7.7% |
| $200,000+ | 3,049 | 6.8% |
Household Income by Householder Age in Brandon
The median household income in Brandon is $71,156, with the highest median household income of $80,759 found in the 45 to 64 years age bracket for the primary householder. A total of 16,594 households (37.0%) fall into this category. Meanwhile, the 15 to 24 years age bracket for the primary householder has the lowest median household income of $45,288, with 1,939 households (4.3%) in this group.
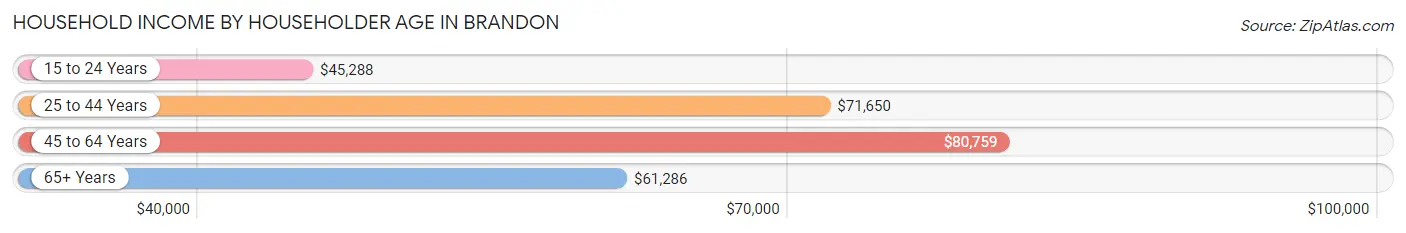
| Income Bracket | # Households | Median Income |
| 15 to 24 Years | 1,939 (4.3%) | $45,288 |
| 25 to 44 Years | 17,788 (39.7%) | $71,650 |
| 45 to 64 Years | 16,594 (37.0%) | $80,759 |
| 65+ Years | 8,515 (19.0%) | $61,286 |
| Total | 44,836 (100.0%) | $71,156 |
Poverty in Brandon
Income Below Poverty by Sex and Age in Brandon
With 10.4% poverty level for males and 13.3% for females among the residents of Brandon, 15 year old males and 5 year old females are the most vulnerable to poverty, with 144 males (21.6%) and 187 females (26.0%) in their respective age groups living below the poverty level.
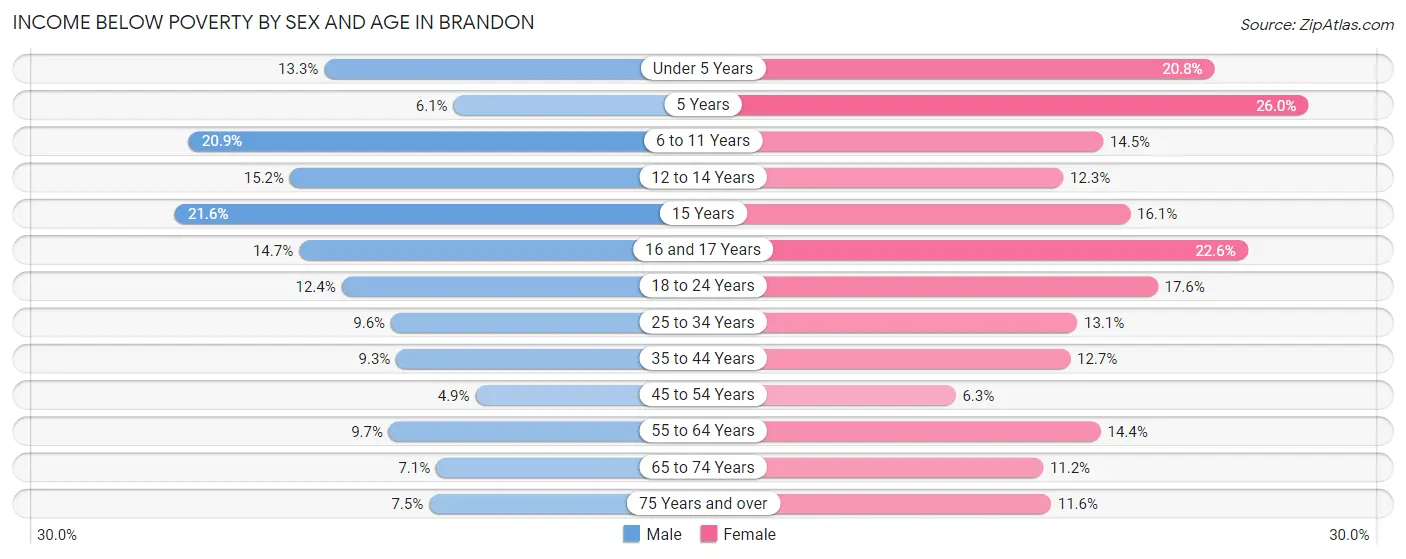
| Age Bracket | Male | Female |
| Under 5 Years | 404 (13.3%) | 561 (20.7%) |
| 5 Years | 38 (6.1%) | 187 (26.0%) |
| 6 to 11 Years | 777 (20.8%) | 498 (14.5%) |
| 12 to 14 Years | 291 (15.2%) | 268 (12.3%) |
| 15 Years | 144 (21.6%) | 78 (16.1%) |
| 16 and 17 Years | 225 (14.7%) | 300 (22.6%) |
| 18 to 24 Years | 589 (12.3%) | 867 (17.6%) |
| 25 to 34 Years | 941 (9.6%) | 1,320 (13.1%) |
| 35 to 44 Years | 767 (9.3%) | 975 (12.7%) |
| 45 to 54 Years | 324 (4.9%) | 474 (6.3%) |
| 55 to 64 Years | 646 (9.7%) | 1,096 (14.4%) |
| 65 to 74 Years | 324 (7.1%) | 577 (11.2%) |
| 75 Years and over | 172 (7.5%) | 434 (11.6%) |
| Total | 5,642 (10.4%) | 7,635 (13.3%) |
Income Above Poverty by Sex and Age in Brandon
According to the poverty statistics in Brandon, males aged 45 to 54 years and females aged 45 to 54 years are the age groups that are most secure financially, with 95.1% of males and 93.7% of females in these age groups living above the poverty line.
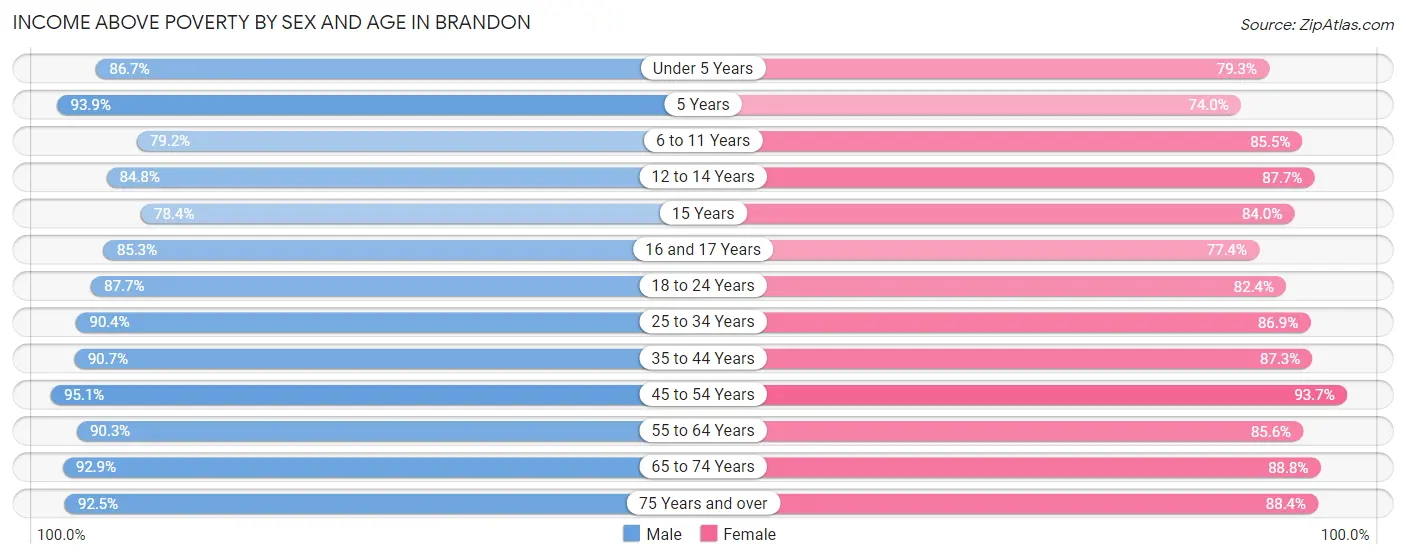
| Age Bracket | Male | Female |
| Under 5 Years | 2,629 (86.7%) | 2,143 (79.2%) |
| 5 Years | 583 (93.9%) | 533 (74.0%) |
| 6 to 11 Years | 2,949 (79.1%) | 2,926 (85.5%) |
| 12 to 14 Years | 1,620 (84.8%) | 1,907 (87.7%) |
| 15 Years | 522 (78.4%) | 408 (84.0%) |
| 16 and 17 Years | 1,304 (85.3%) | 1,028 (77.4%) |
| 18 to 24 Years | 4,179 (87.6%) | 4,065 (82.4%) |
| 25 to 34 Years | 8,863 (90.4%) | 8,755 (86.9%) |
| 35 to 44 Years | 7,472 (90.7%) | 6,694 (87.3%) |
| 45 to 54 Years | 6,293 (95.1%) | 7,010 (93.7%) |
| 55 to 64 Years | 6,002 (90.3%) | 6,512 (85.6%) |
| 65 to 74 Years | 4,247 (92.9%) | 4,573 (88.8%) |
| 75 Years and over | 2,129 (92.5%) | 3,296 (88.4%) |
| Total | 48,792 (89.6%) | 49,850 (86.7%) |
Income Below Poverty Among Married-Couple Families in Brandon
The poverty statistics for married-couple families in Brandon show that 6.0% or 1,105 of the total 18,365 families live below the poverty line. Families with 5 or more children have the highest poverty rate of 50.0%, comprising of 31 families. On the other hand, families with no children have the lowest poverty rate of 4.7%, which includes 541 families.
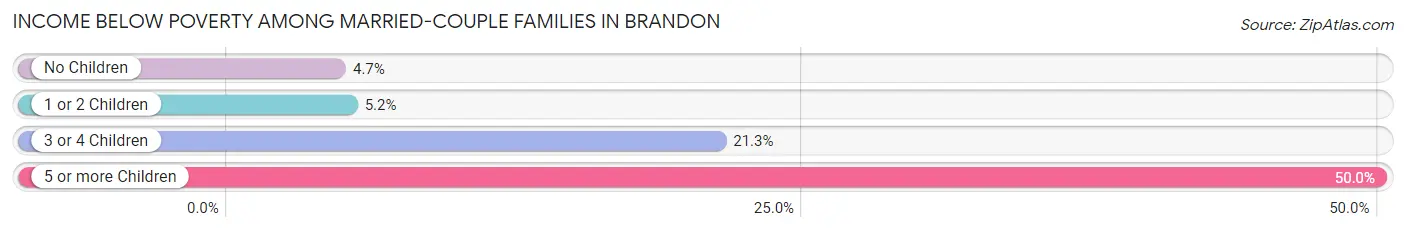
| Children | Above Poverty | Below Poverty |
| No Children | 10,979 (95.3%) | 541 (4.7%) |
| 1 or 2 Children | 5,368 (94.8%) | 295 (5.2%) |
| 3 or 4 Children | 882 (78.7%) | 238 (21.2%) |
| 5 or more Children | 31 (50.0%) | 31 (50.0%) |
| Total | 17,260 (94.0%) | 1,105 (6.0%) |
Income Below Poverty Among Single-Parent Households in Brandon
According to the poverty data in Brandon, 7.3% or 204 single-father households and 18.2% or 1,309 single-mother households are living below the poverty line. Among single-father households, those with 3 or 4 children have the highest poverty rate, with 8 households (38.1%) experiencing poverty. Likewise, among single-mother households, those with 3 or 4 children have the highest poverty rate, with 162 households (34.2%) falling below the poverty line.
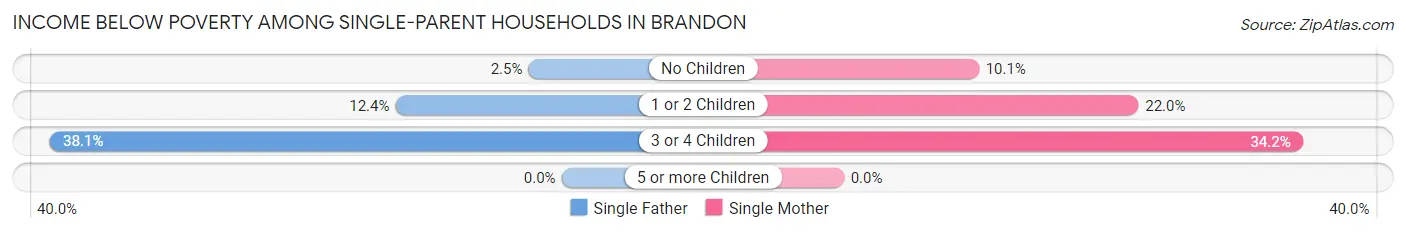
| Children | Single Father | Single Mother |
| No Children | 37 (2.5%) | 274 (10.1%) |
| 1 or 2 Children | 159 (12.4%) | 873 (22.0%) |
| 3 or 4 Children | 8 (38.1%) | 162 (34.2%) |
| 5 or more Children | 0 (0.0%) | 0 (0.0%) |
| Total | 204 (7.3%) | 1,309 (18.2%) |
Income Below Poverty Among Married-Couple vs Single-Parent Households in Brandon
The poverty data for Brandon shows that 1,105 of the married-couple family households (6.0%) and 1,513 of the single-parent households (15.2%) are living below the poverty level. Within the married-couple family households, those with 5 or more children have the highest poverty rate, with 31 households (50.0%) falling below the poverty line. Among the single-parent households, those with 3 or 4 children have the highest poverty rate, with 170 household (34.3%) living below poverty.
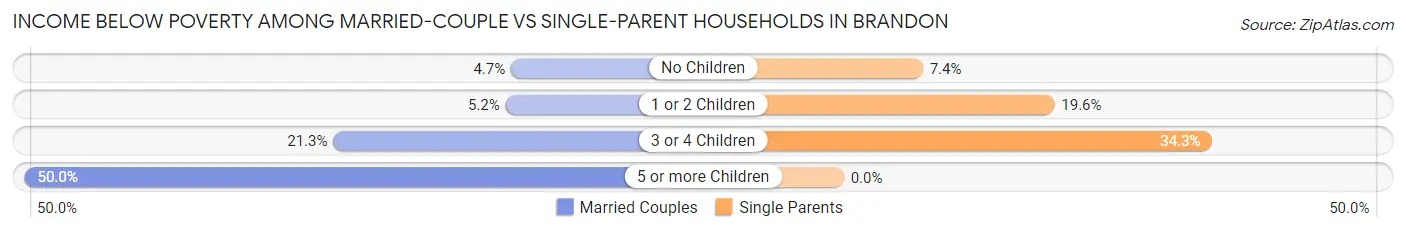
| Children | Married-Couple Families | Single-Parent Households |
| No Children | 541 (4.7%) | 311 (7.4%) |
| 1 or 2 Children | 295 (5.2%) | 1,032 (19.6%) |
| 3 or 4 Children | 238 (21.2%) | 170 (34.3%) |
| 5 or more Children | 31 (50.0%) | 0 (0.0%) |
| Total | 1,105 (6.0%) | 1,513 (15.2%) |
Race in Brandon
The most populous races in Brandon are White / Caucasian (65,138 | 56.7%), Hispanic or Latino (33,323 | 29.0%), and Black / African American (19,255 | 16.8%).
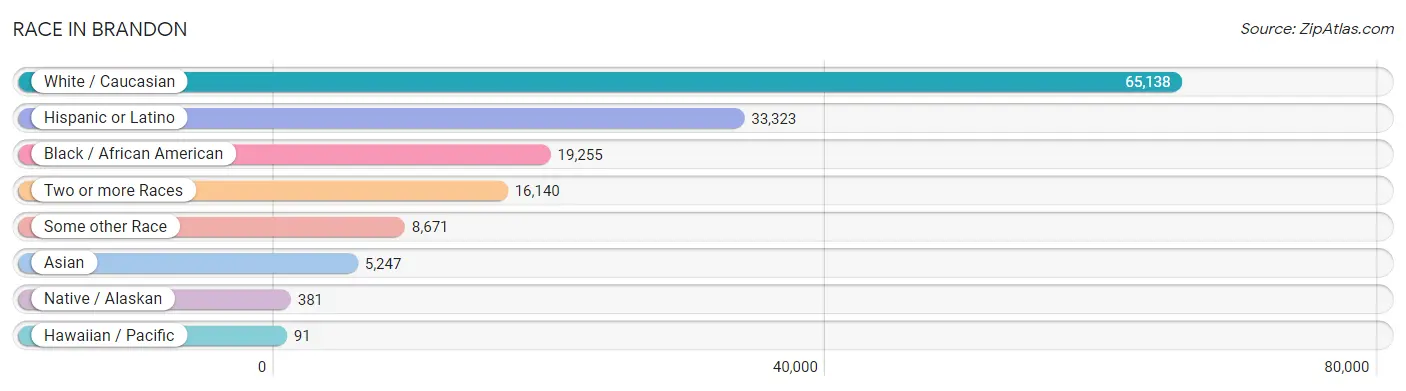
| Race | # Population | % Population |
| Asian | 5,247 | 4.6% |
| Black / African American | 19,255 | 16.8% |
| Hawaiian / Pacific | 91 | 0.1% |
| Hispanic or Latino | 33,323 | 29.0% |
| Native / Alaskan | 381 | 0.3% |
| White / Caucasian | 65,138 | 56.7% |
| Two or more Races | 16,140 | 14.0% |
| Some other Race | 8,671 | 7.5% |
| Total | 114,923 | 100.0% |
Ancestry in Brandon
The most populous ancestries reported in Brandon are Puerto Rican (12,140 | 10.6%), Irish (8,982 | 7.8%), German (8,694 | 7.6%), American (8,680 | 7.5%), and English (7,873 | 6.9%), together accounting for 40.4% of all Brandon residents.
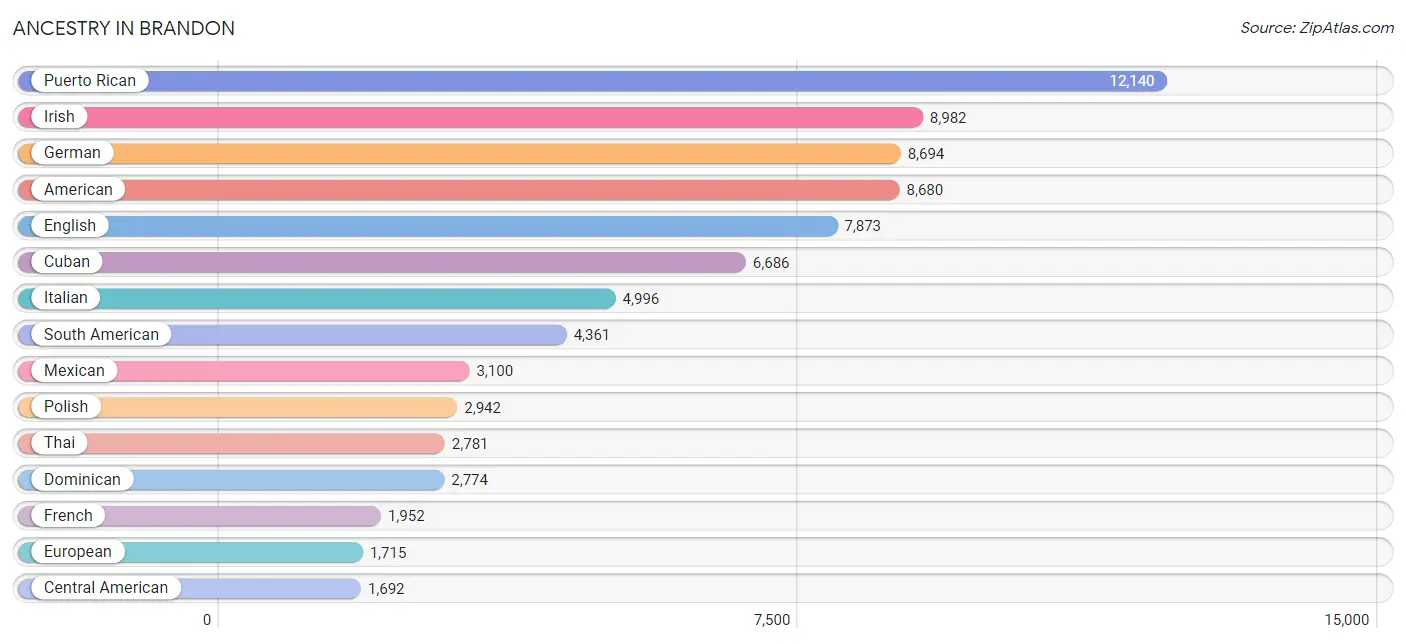
| Ancestry | # Population | % Population |
| African | 856 | 0.7% |
| Albanian | 5 | 0.0% |
| American | 8,680 | 7.5% |
| Arab | 1,026 | 0.9% |
| Argentinean | 218 | 0.2% |
| Armenian | 74 | 0.1% |
| Australian | 21 | 0.0% |
| Austrian | 207 | 0.2% |
| Bahamian | 142 | 0.1% |
| Barbadian | 32 | 0.0% |
| Basque | 7 | 0.0% |
| Belizean | 28 | 0.0% |
| Bermudan | 13 | 0.0% |
| Bhutanese | 389 | 0.3% |
| Blackfeet | 61 | 0.1% |
| Bolivian | 65 | 0.1% |
| Brazilian | 801 | 0.7% |
| British | 1,209 | 1.1% |
| Bulgarian | 59 | 0.1% |
| Burmese | 303 | 0.3% |
| Canadian | 321 | 0.3% |
| Cape Verdean | 157 | 0.1% |
| Celtic | 26 | 0.0% |
| Central American | 1,692 | 1.5% |
| Central American Indian | 452 | 0.4% |
| Cherokee | 366 | 0.3% |
| Chilean | 82 | 0.1% |
| Chippewa | 25 | 0.0% |
| Choctaw | 6 | 0.0% |
| Colombian | 1,084 | 0.9% |
| Costa Rican | 80 | 0.1% |
| Creek | 4 | 0.0% |
| Croatian | 101 | 0.1% |
| Crow | 5 | 0.0% |
| Cuban | 6,686 | 5.8% |
| Czech | 60 | 0.1% |
| Czechoslovakian | 72 | 0.1% |
| Danish | 356 | 0.3% |
| Dominican | 2,774 | 2.4% |
| Dutch | 1,012 | 0.9% |
| Dutch West Indian | 186 | 0.2% |
| Eastern European | 161 | 0.1% |
| Ecuadorian | 809 | 0.7% |
| Egyptian | 60 | 0.1% |
| English | 7,873 | 6.9% |
| Estonian | 28 | 0.0% |
| Ethiopian | 65 | 0.1% |
| European | 1,715 | 1.5% |
| Filipino | 11 | 0.0% |
| Finnish | 171 | 0.2% |
| French | 1,952 | 1.7% |
| French Canadian | 476 | 0.4% |
| German | 8,694 | 7.6% |
| Ghanaian | 130 | 0.1% |
| Greek | 473 | 0.4% |
| Guatemalan | 217 | 0.2% |
| Guyanese | 169 | 0.2% |
| Haitian | 1,528 | 1.3% |
| Honduran | 672 | 0.6% |
| Houma | 9 | 0.0% |
| Hungarian | 302 | 0.3% |
| Indian (Asian) | 779 | 0.7% |
| Iranian | 109 | 0.1% |
| Iraqi | 185 | 0.2% |
| Irish | 8,982 | 7.8% |
| Iroquois | 6 | 0.0% |
| Israeli | 6 | 0.0% |
| Italian | 4,996 | 4.3% |
| Jamaican | 1,193 | 1.0% |
| Japanese | 62 | 0.1% |
| Jordanian | 15 | 0.0% |
| Korean | 1,569 | 1.4% |
| Latvian | 72 | 0.1% |
| Lebanese | 328 | 0.3% |
| Liberian | 26 | 0.0% |
| Lithuanian | 98 | 0.1% |
| Lumbee | 12 | 0.0% |
| Malaysian | 23 | 0.0% |
| Mexican | 3,100 | 2.7% |
| Mexican American Indian | 251 | 0.2% |
| Moroccan | 214 | 0.2% |
| Native Hawaiian | 81 | 0.1% |
| Navajo | 4 | 0.0% |
| Nicaraguan | 366 | 0.3% |
| Nigerian | 302 | 0.3% |
| Northern European | 46 | 0.0% |
| Norwegian | 602 | 0.5% |
| Osage | 7 | 0.0% |
| Pakistani | 39 | 0.0% |
| Palestinian | 58 | 0.1% |
| Panamanian | 99 | 0.1% |
| Pennsylvania German | 63 | 0.1% |
| Peruvian | 665 | 0.6% |
| Polish | 2,942 | 2.6% |
| Portuguese | 810 | 0.7% |
| Puerto Rican | 12,140 | 10.6% |
| Romanian | 60 | 0.1% |
| Russian | 490 | 0.4% |
| Salvadoran | 258 | 0.2% |
| Samoan | 24 | 0.0% |
| Scandinavian | 197 | 0.2% |
| Scotch-Irish | 905 | 0.8% |
| Scottish | 1,536 | 1.3% |
| Seminole | 2 | 0.0% |
| Senegalese | 14 | 0.0% |
| Serbian | 78 | 0.1% |
| Slavic | 29 | 0.0% |
| Slovak | 517 | 0.4% |
| Slovene | 21 | 0.0% |
| Somali | 2 | 0.0% |
| South American | 4,361 | 3.8% |
| Spaniard | 564 | 0.5% |
| Spanish | 275 | 0.2% |
| Spanish American | 214 | 0.2% |
| Sri Lankan | 639 | 0.6% |
| Subsaharan African | 1,646 | 1.4% |
| Swedish | 694 | 0.6% |
| Swiss | 81 | 0.1% |
| Syrian | 34 | 0.0% |
| Thai | 2,781 | 2.4% |
| Trinidadian and Tobagonian | 322 | 0.3% |
| Turkish | 137 | 0.1% |
| U.S. Virgin Islander | 7 | 0.0% |
| Ukrainian | 205 | 0.2% |
| Uruguayan | 50 | 0.0% |
| Venezuelan | 1,388 | 1.2% |
| Welsh | 568 | 0.5% |
| West Indian | 221 | 0.2% |
| Yugoslavian | 47 | 0.0% |
| Zimbabwean | 37 | 0.0% | View All 130 Rows |
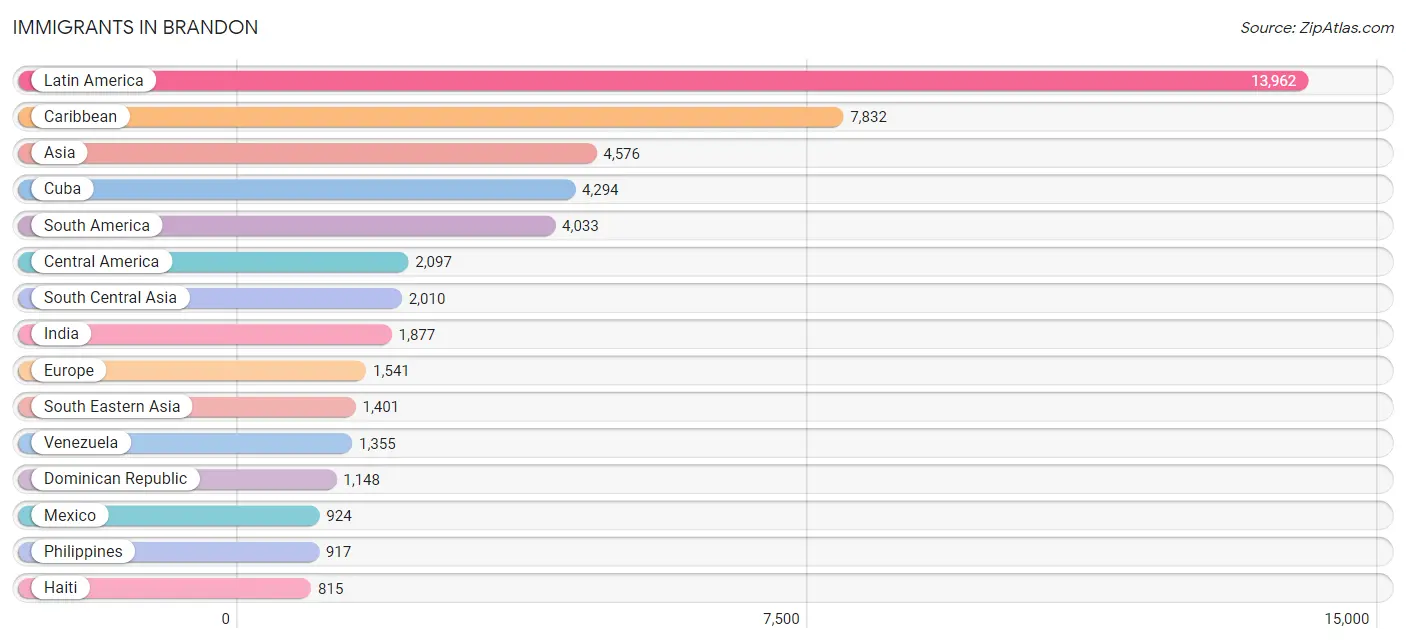
Immigrants in Brandon
The most numerous immigrant groups reported in Brandon came from Latin America (13,962 | 12.1%), Caribbean (7,832 | 6.8%), Asia (4,576 | 4.0%), Cuba (4,294 | 3.7%), and South America (4,033 | 3.5%), together accounting for 30.2% of all Brandon residents.
| Immigration Origin | # Population | % Population |
| Africa | 760 | 0.7% |
| Albania | 5 | 0.0% |
| Argentina | 67 | 0.1% |
| Asia | 4,576 | 4.0% |
| Australia | 40 | 0.0% |
| Austria | 40 | 0.0% |
| Bahamas | 91 | 0.1% |
| Belize | 14 | 0.0% |
| Bosnia and Herzegovina | 8 | 0.0% |
| Brazil | 635 | 0.5% |
| Bulgaria | 87 | 0.1% |
| Cabo Verde | 106 | 0.1% |
| Cambodia | 17 | 0.0% |
| Canada | 389 | 0.3% |
| Caribbean | 7,832 | 6.8% |
| Central America | 2,097 | 1.8% |
| Chile | 26 | 0.0% |
| China | 376 | 0.3% |
| Colombia | 664 | 0.6% |
| Costa Rica | 11 | 0.0% |
| Cuba | 4,294 | 3.7% |
| Denmark | 5 | 0.0% |
| Dominica | 193 | 0.2% |
| Dominican Republic | 1,148 | 1.0% |
| Eastern Africa | 89 | 0.1% |
| Eastern Asia | 678 | 0.6% |
| Eastern Europe | 671 | 0.6% |
| Ecuador | 298 | 0.3% |
| Egypt | 42 | 0.0% |
| El Salvador | 153 | 0.1% |
| England | 137 | 0.1% |
| Eritrea | 9 | 0.0% |
| Ethiopia | 65 | 0.1% |
| Europe | 1,541 | 1.3% |
| Fiji | 7 | 0.0% |
| France | 37 | 0.0% |
| Germany | 393 | 0.3% |
| Ghana | 116 | 0.1% |
| Greece | 9 | 0.0% |
| Grenada | 14 | 0.0% |
| Guatemala | 247 | 0.2% |
| Guyana | 382 | 0.3% |
| Haiti | 815 | 0.7% |
| Honduras | 440 | 0.4% |
| India | 1,877 | 1.6% |
| Iran | 18 | 0.0% |
| Iraq | 140 | 0.1% |
| Israel | 38 | 0.0% |
| Italy | 6 | 0.0% |
| Jamaica | 701 | 0.6% |
| Japan | 179 | 0.2% |
| Jordan | 15 | 0.0% |
| Kenya | 7 | 0.0% |
| Korea | 123 | 0.1% |
| Kuwait | 8 | 0.0% |
| Laos | 34 | 0.0% |
| Latin America | 13,962 | 12.1% |
| Latvia | 9 | 0.0% |
| Lebanon | 113 | 0.1% |
| Liberia | 26 | 0.0% |
| Malaysia | 33 | 0.0% |
| Mexico | 924 | 0.8% |
| Morocco | 136 | 0.1% |
| Nepal | 20 | 0.0% |
| Netherlands | 11 | 0.0% |
| Nicaragua | 252 | 0.2% |
| Nigeria | 216 | 0.2% |
| Northern Africa | 178 | 0.2% |
| Northern Europe | 226 | 0.2% |
| Oceania | 71 | 0.1% |
| Pakistan | 84 | 0.1% |
| Panama | 56 | 0.1% |
| Peru | 568 | 0.5% |
| Philippines | 917 | 0.8% |
| Poland | 262 | 0.2% |
| Portugal | 19 | 0.0% |
| Romania | 7 | 0.0% |
| Russia | 213 | 0.2% |
| Saudi Arabia | 67 | 0.1% |
| South Africa | 6 | 0.0% |
| South America | 4,033 | 3.5% |
| South Central Asia | 2,010 | 1.8% |
| South Eastern Asia | 1,401 | 1.2% |
| Southern Europe | 163 | 0.1% |
| Spain | 129 | 0.1% |
| Sri Lanka | 11 | 0.0% |
| Taiwan | 17 | 0.0% |
| Thailand | 17 | 0.0% |
| Trinidad and Tobago | 293 | 0.3% |
| Turkey | 106 | 0.1% |
| Ukraine | 22 | 0.0% |
| Uruguay | 38 | 0.0% |
| Venezuela | 1,355 | 1.2% |
| Vietnam | 383 | 0.3% |
| West Indies | 24 | 0.0% |
| Western Africa | 487 | 0.4% |
| Western Asia | 487 | 0.4% |
| Western Europe | 481 | 0.4% | View All 98 Rows |
Sex and Age in Brandon
Sex and Age in Brandon
The most populous age groups in Brandon are 25 to 29 Years (5,404 | 9.6%) for men and 25 to 29 Years (5,130 | 8.8%) for women.
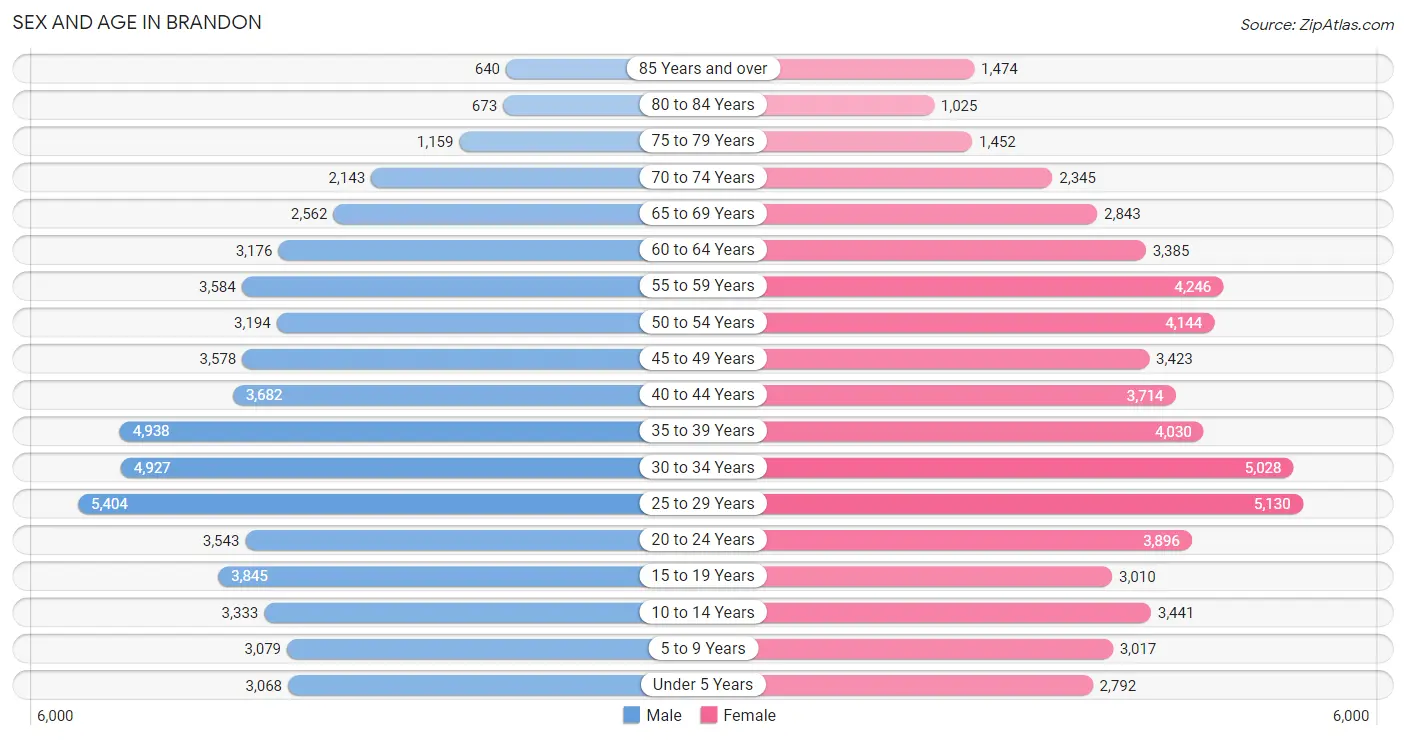
| Age Bracket | Male | Female |
| Under 5 Years | 3,068 (5.4%) | 2,792 (4.8%) |
| 5 to 9 Years | 3,079 (5.4%) | 3,017 (5.2%) |
| 10 to 14 Years | 3,333 (5.9%) | 3,441 (5.9%) |
| 15 to 19 Years | 3,845 (6.8%) | 3,010 (5.1%) |
| 20 to 24 Years | 3,543 (6.3%) | 3,896 (6.7%) |
| 25 to 29 Years | 5,404 (9.6%) | 5,130 (8.8%) |
| 30 to 34 Years | 4,927 (8.7%) | 5,028 (8.6%) |
| 35 to 39 Years | 4,938 (8.7%) | 4,030 (6.9%) |
| 40 to 44 Years | 3,682 (6.5%) | 3,714 (6.4%) |
| 45 to 49 Years | 3,578 (6.3%) | 3,423 (5.9%) |
| 50 to 54 Years | 3,194 (5.7%) | 4,144 (7.1%) |
| 55 to 59 Years | 3,584 (6.3%) | 4,246 (7.3%) |
| 60 to 64 Years | 3,176 (5.6%) | 3,385 (5.8%) |
| 65 to 69 Years | 2,562 (4.5%) | 2,843 (4.9%) |
| 70 to 74 Years | 2,143 (3.8%) | 2,345 (4.0%) |
| 75 to 79 Years | 1,159 (2.1%) | 1,452 (2.5%) |
| 80 to 84 Years | 673 (1.2%) | 1,025 (1.8%) |
| 85 Years and over | 640 (1.1%) | 1,474 (2.5%) |
| Total | 56,528 (100.0%) | 58,395 (100.0%) |
Families and Households in Brandon
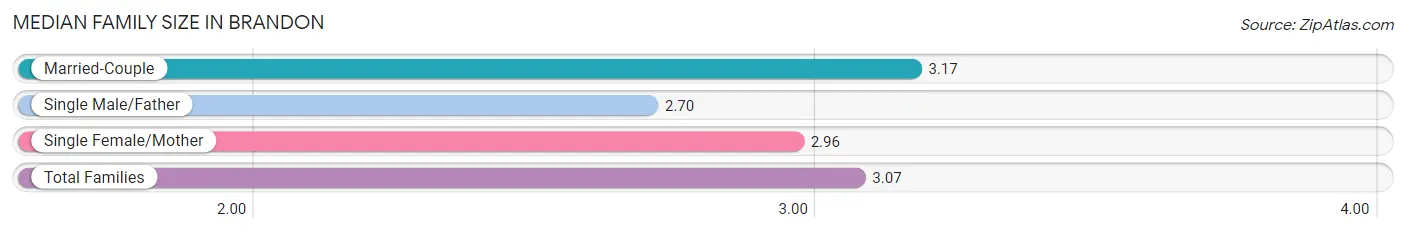
Median Family Size in Brandon
The median family size in Brandon is 3.07 persons per family, with married-couple families (18,365 | 64.8%) accounting for the largest median family size of 3.17 persons per family. On the other hand, single male/father families (2,805 | 9.9%) represent the smallest median family size with 2.70 persons per family.
| Family Type | # Families | Family Size |
| Married-Couple | 18,365 (64.8%) | 3.17 |
| Single Male/Father | 2,805 (9.9%) | 2.70 |
| Single Female/Mother | 7,175 (25.3%) | 2.96 |
| Total Families | 28,345 (100.0%) | 3.07 |
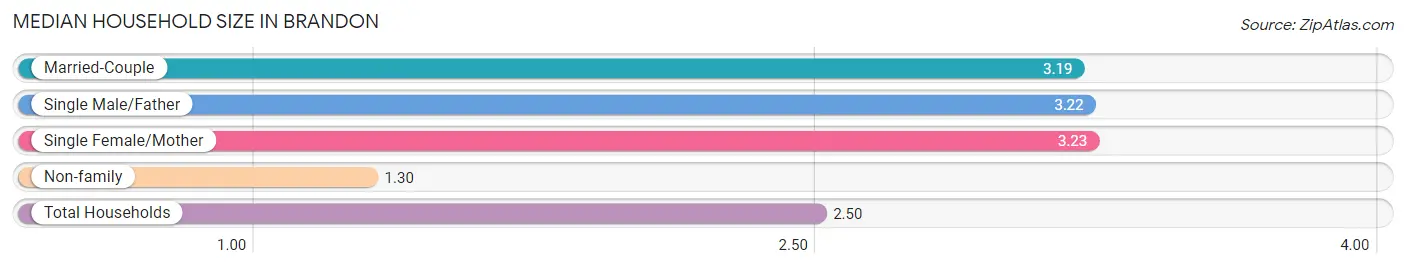
Median Household Size in Brandon
The median household size in Brandon is 2.50 persons per household, with single female/mother households (7,175 | 16.0%) accounting for the largest median household size of 3.23 persons per household. non-family households (16,491 | 36.8%) represent the smallest median household size with 1.30 persons per household.
| Household Type | # Households | Household Size |
| Married-Couple | 18,365 (41.0%) | 3.19 |
| Single Male/Father | 2,805 (6.3%) | 3.22 |
| Single Female/Mother | 7,175 (16.0%) | 3.23 |
| Non-family | 16,491 (36.8%) | 1.30 |
| Total Households | 44,836 (100.0%) | 2.50 |
Household Size by Marriage Status in Brandon
Out of a total of 44,836 households in Brandon, 28,345 (63.2%) are family households, while 16,491 (36.8%) are nonfamily households. The most numerous type of family households are 2-person households, comprising 12,456, and the most common type of nonfamily households are 1-person households, comprising 12,821.
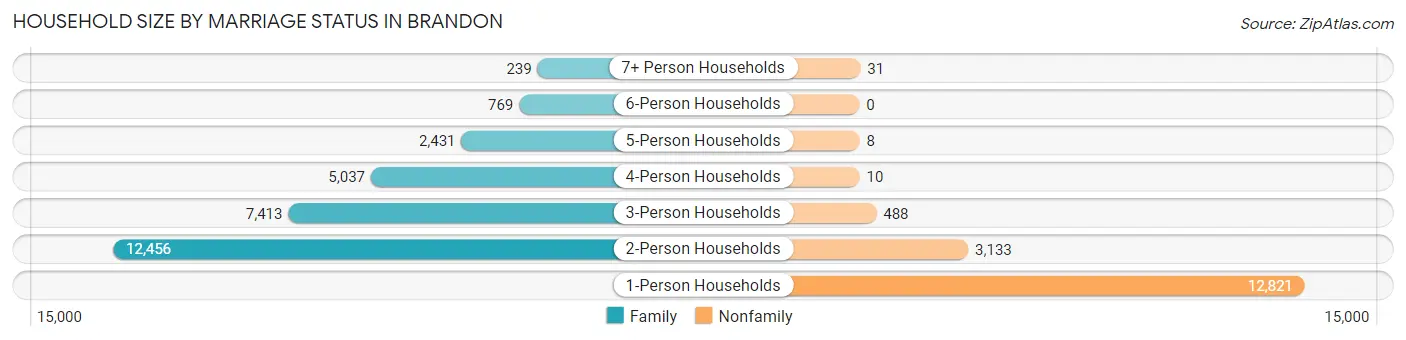
| Household Size | Family Households | Nonfamily Households |
| 1-Person Households | - | 12,821 (28.6%) |
| 2-Person Households | 12,456 (27.8%) | 3,133 (7.0%) |
| 3-Person Households | 7,413 (16.5%) | 488 (1.1%) |
| 4-Person Households | 5,037 (11.2%) | 10 (0.0%) |
| 5-Person Households | 2,431 (5.4%) | 8 (0.0%) |
| 6-Person Households | 769 (1.7%) | 0 (0.0%) |
| 7+ Person Households | 239 (0.5%) | 31 (0.1%) |
| Total | 28,345 (63.2%) | 16,491 (36.8%) |
Female Fertility in Brandon
Fertility by Age in Brandon
Average fertility rate in Brandon is 40.0 births per 1,000 women. Women in the age bracket of 20 to 34 years have the highest fertility rate with 57.0 births per 1,000 women. Women in the age bracket of 20 to 34 years acount for 68.9% of all women with births.
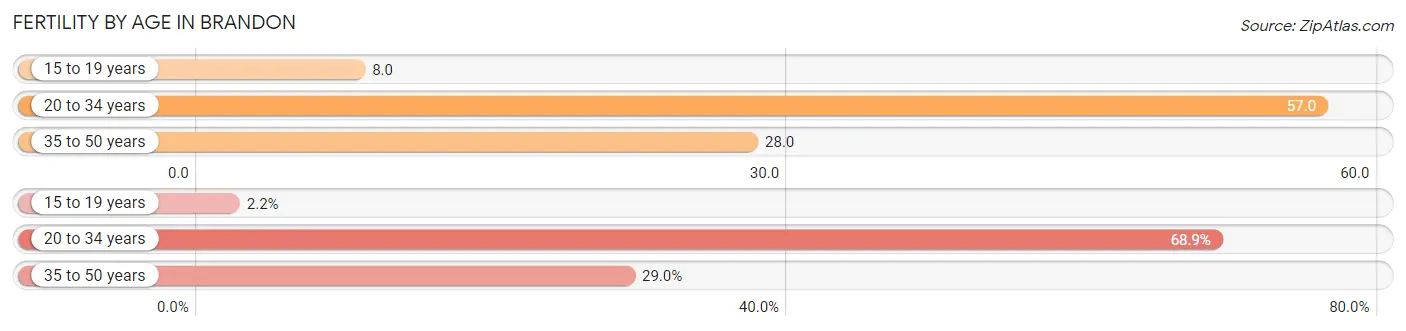
| Age Bracket | Women with Births | Births / 1,000 Women |
| 15 to 19 years | 25 (2.2%) | 8.0 |
| 20 to 34 years | 796 (68.9%) | 57.0 |
| 35 to 50 years | 335 (29.0%) | 28.0 |
| Total | 1,156 (100.0%) | 40.0 |
Fertility by Age by Marriage Status in Brandon
67.2% of women with births (1,156) in Brandon are married. The highest percentage of unmarried women with births falls into 15 to 19 years age bracket with 100.0% of them unmarried at the time of birth, while the lowest percentage of unmarried women with births belong to 35 to 50 years age bracket with 28.7% of them unmarried.
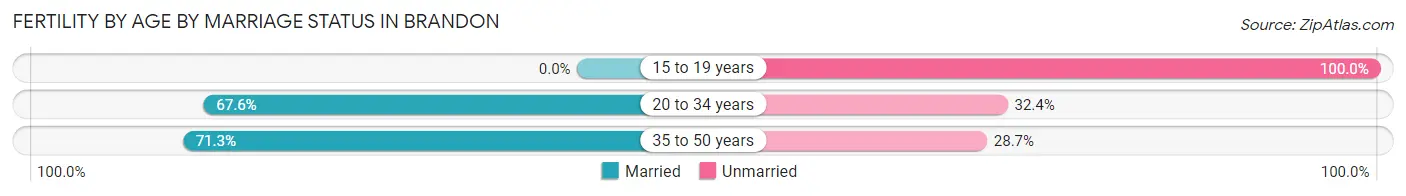
| Age Bracket | Married | Unmarried |
| 15 to 19 years | 0 (0.0%) | 25 (100.0%) |
| 20 to 34 years | 538 (67.6%) | 258 (32.4%) |
| 35 to 50 years | 239 (71.3%) | 96 (28.7%) |
| Total | 777 (67.2%) | 379 (32.8%) |
Fertility by Education in Brandon
Average fertility rate in Brandon is 40.0 births per 1,000 women. Women with the education attainment of less than high school have the highest fertility rate of 57.0 births per 1,000 women, while women with the education attainment of high school diploma have the lowest fertility at 16.0 births per 1,000 women. Women with the education attainment of college or associate's degree represent 33.5% of all women with births.
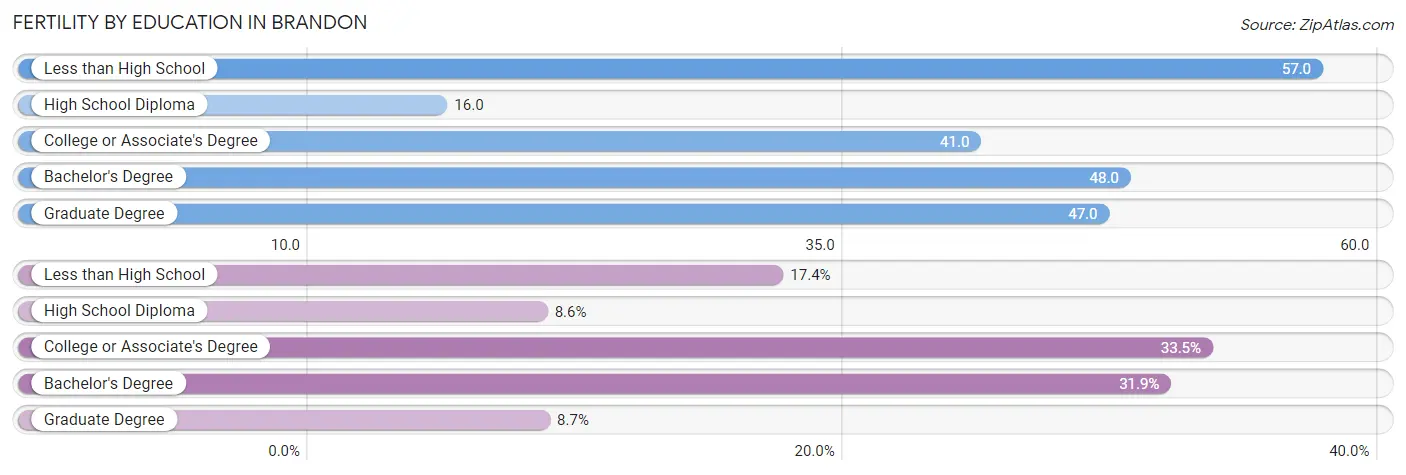
| Educational Attainment | Women with Births | Births / 1,000 Women |
| Less than High School | 201 (17.4%) | 57.0 |
| High School Diploma | 99 (8.6%) | 16.0 |
| College or Associate's Degree | 387 (33.5%) | 41.0 |
| Bachelor's Degree | 369 (31.9%) | 48.0 |
| Graduate Degree | 100 (8.6%) | 47.0 |
| Total | 1,156 (100.0%) | 40.0 |
Fertility by Education by Marriage Status in Brandon
32.8% of women with births in Brandon are unmarried. Women with the educational attainment of graduate degree are most likely to be married with 83.0% of them married at childbirth, while women with the educational attainment of high school diploma are least likely to be married with 59.6% of them unmarried at childbirth.
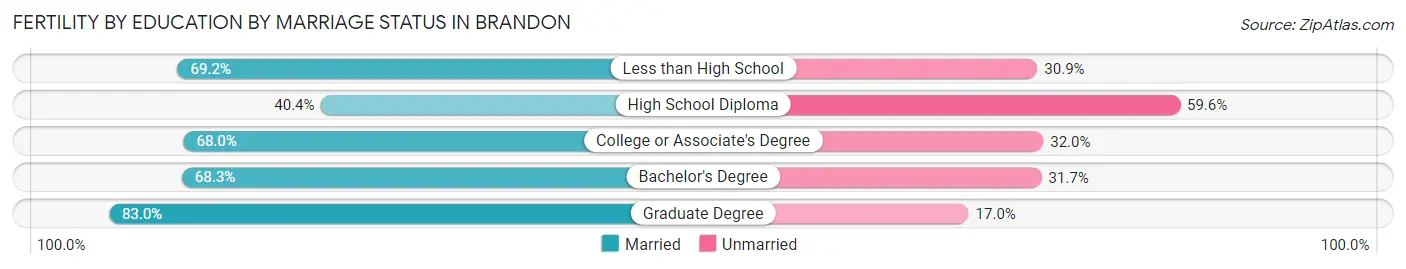
| Educational Attainment | Married | Unmarried |
| Less than High School | 139 (69.2%) | 62 (30.8%) |
| High School Diploma | 40 (40.4%) | 59 (59.6%) |
| College or Associate's Degree | 263 (68.0%) | 124 (32.0%) |
| Bachelor's Degree | 252 (68.3%) | 117 (31.7%) |
| Graduate Degree | 83 (83.0%) | 17 (17.0%) |
| Total | 777 (67.2%) | 379 (32.8%) |
Employment Characteristics in Brandon
Employment by Class of Employer in Brandon
Among the 58,410 employed individuals in Brandon, private company employees (42,786 | 73.3%), local government employees (3,953 | 6.8%), and not-for-profit organizations (3,336 | 5.7%) make up the most common classes of employment.
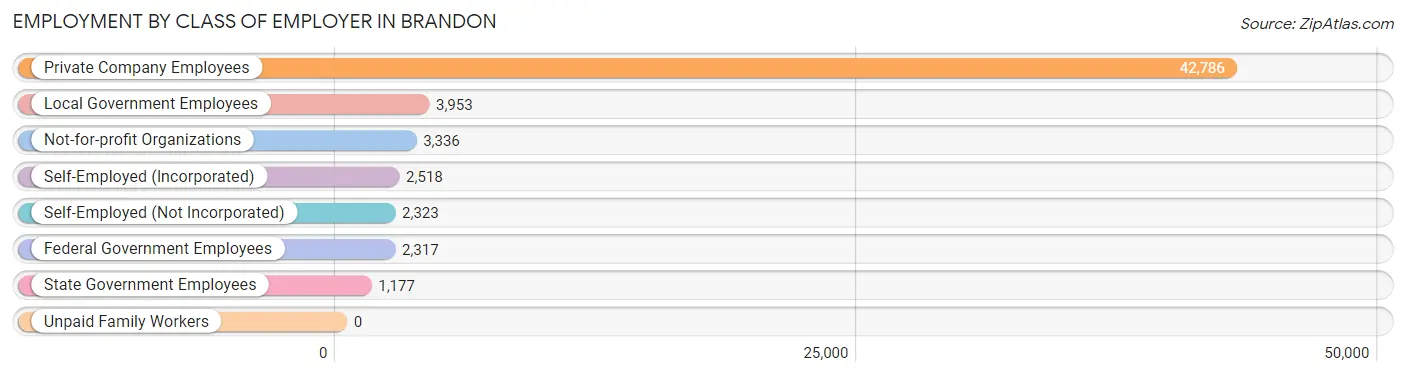
| Employer Class | # Employees | % Employees |
| Private Company Employees | 42,786 | 73.3% |
| Self-Employed (Incorporated) | 2,518 | 4.3% |
| Self-Employed (Not Incorporated) | 2,323 | 4.0% |
| Not-for-profit Organizations | 3,336 | 5.7% |
| Local Government Employees | 3,953 | 6.8% |
| State Government Employees | 1,177 | 2.0% |
| Federal Government Employees | 2,317 | 4.0% |
| Unpaid Family Workers | 0 | 0.0% |
| Total | 58,410 | 100.0% |
Employment Status by Age in Brandon
According to the labor force statistics for Brandon, out of the total population over 16 years of age (95,023), 65.7% or 62,430 individuals are in the labor force, with 4.6% or 2,872 of them unemployed. The age group with the highest labor force participation rate is 25 to 29 years, with 83.0% or 8,743 individuals in the labor force. Within the labor force, the 16 to 19 years age range has the highest percentage of unemployed individuals, with 13.4% or 264 of them being unemployed.
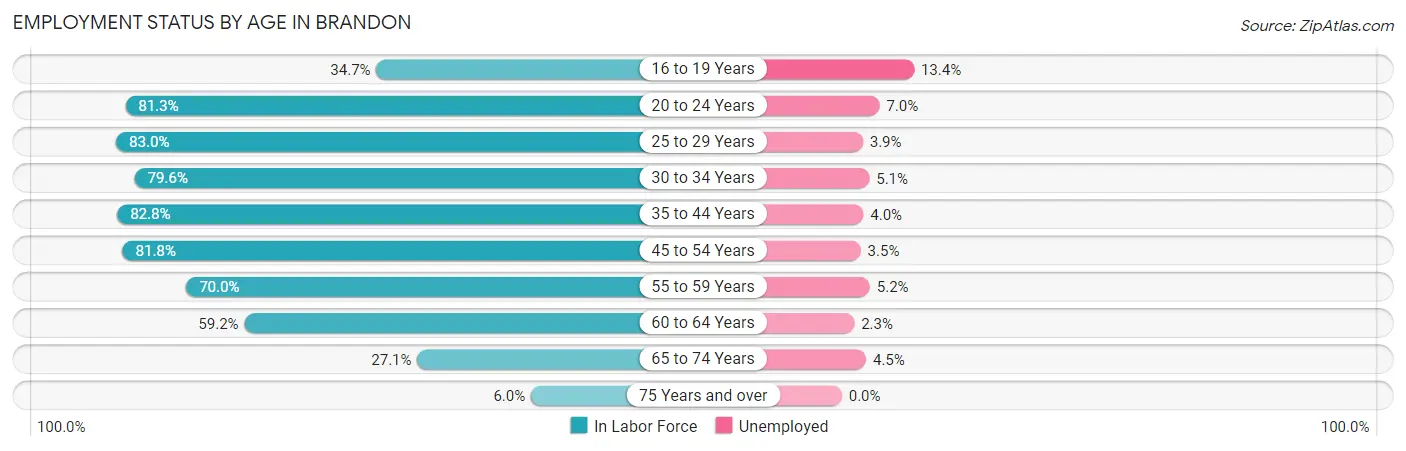
| Age Bracket | In Labor Force | Unemployed |
| 16 to 19 Years | 1,973 (34.7%) | 264 (13.4%) |
| 20 to 24 Years | 6,048 (81.3%) | 423 (7.0%) |
| 25 to 29 Years | 8,743 (83.0%) | 341 (3.9%) |
| 30 to 34 Years | 7,924 (79.6%) | 404 (5.1%) |
| 35 to 44 Years | 13,549 (82.8%) | 542 (4.0%) |
| 45 to 54 Years | 11,729 (81.8%) | 411 (3.5%) |
| 55 to 59 Years | 5,481 (70.0%) | 285 (5.2%) |
| 60 to 64 Years | 3,884 (59.2%) | 89 (2.3%) |
| 65 to 74 Years | 2,681 (27.1%) | 121 (4.5%) |
| 75 Years and over | 385 (6.0%) | 0 (0.0%) |
| Total | 62,430 (65.7%) | 2,872 (4.6%) |
Employment Status by Educational Attainment in Brandon
According to labor force statistics for Brandon, 78.2% of individuals (51,286) out of the total population between 25 and 64 years of age (65,583) are in the labor force, with 4.0% or 2,051 of them being unemployed. The group with the highest labor force participation rate are those with the educational attainment of bachelor's degree or higher, with 83.2% or 19,686 individuals in the labor force. Within the labor force, individuals with less than high school education have the highest percentage of unemployment, with 6.7% or 246 of them being unemployed.
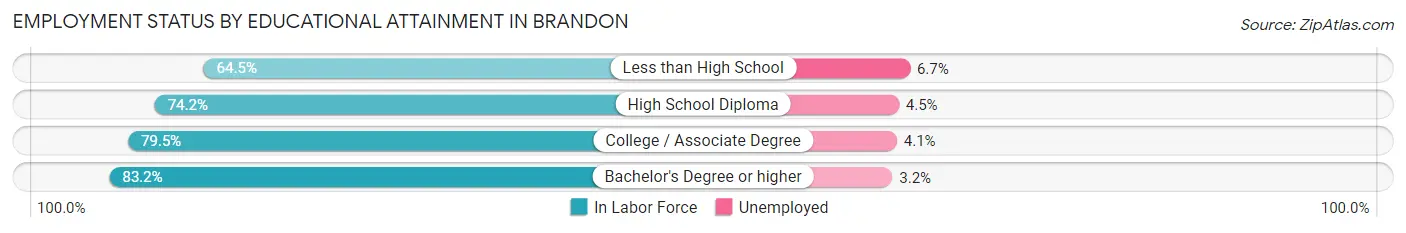
| Educational Attainment | In Labor Force | Unemployed |
| Less than High School | 3,676 (64.5%) | 382 (6.7%) |
| High School Diploma | 11,598 (74.2%) | 703 (4.5%) |
| College / Associate Degree | 16,371 (79.5%) | 844 (4.1%) |
| Bachelor's Degree or higher | 19,686 (83.2%) | 757 (3.2%) |
| Total | 51,286 (78.2%) | 2,623 (4.0%) |
Employment Occupations by Sex in Brandon
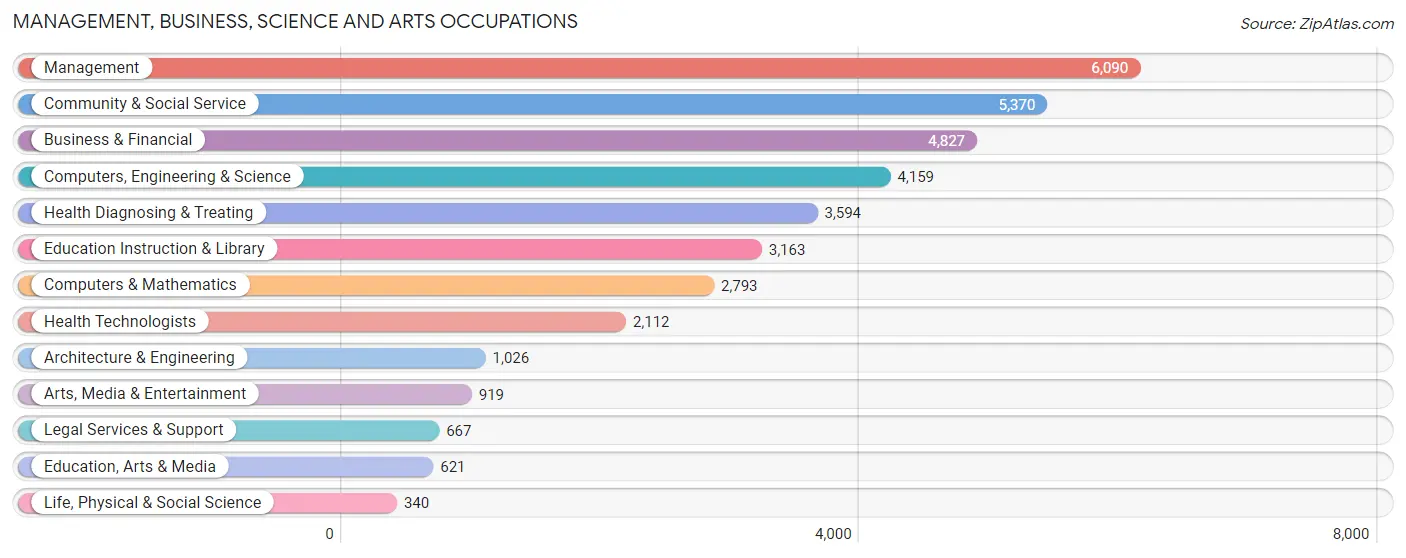
Management, Business, Science and Arts Occupations
The most common Management, Business, Science and Arts occupations in Brandon are Management (6,090 | 10.3%), Community & Social Service (5,370 | 9.1%), Business & Financial (4,827 | 8.2%), Computers, Engineering & Science (4,159 | 7.0%), and Health Diagnosing & Treating (3,594 | 6.1%).
Management, Business, Science and Arts Occupations by Sex
Within the Management, Business, Science and Arts occupations in Brandon, the most male-oriented occupations are Architecture & Engineering (83.2%), Computers, Engineering & Science (75.1%), and Computers & Mathematics (74.6%), while the most female-oriented occupations are Education Instruction & Library (78.8%), Health Technologists (78.7%), and Health Diagnosing & Treating (76.1%).
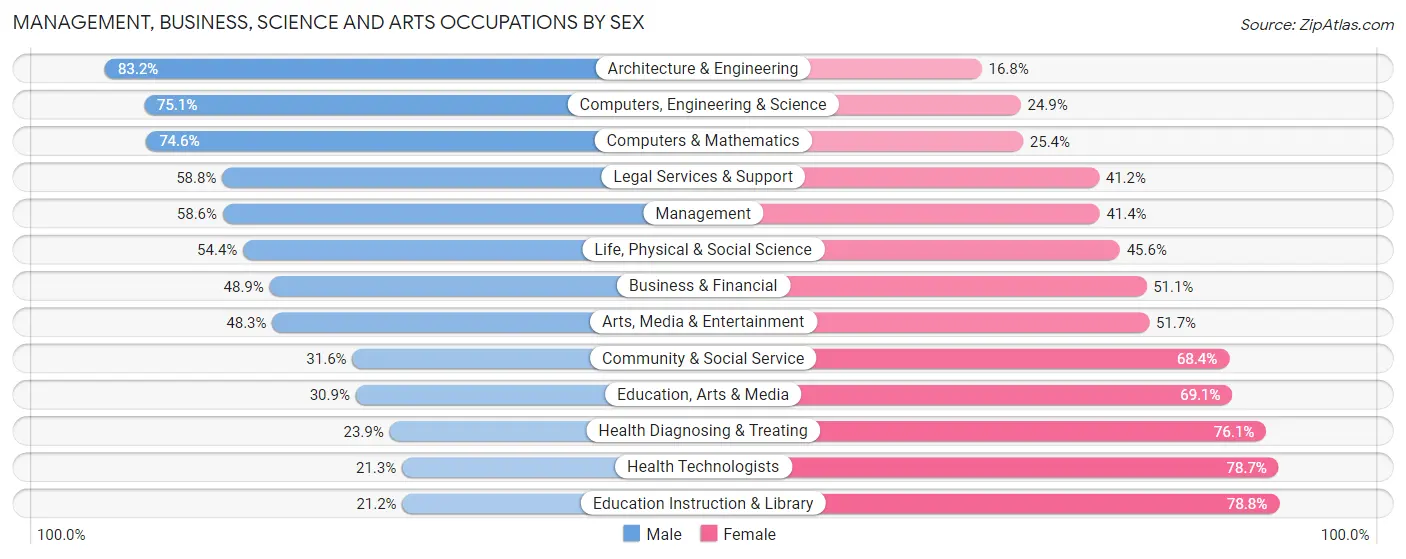
| Occupation | Male | Female |
| Management | 3,571 (58.6%) | 2,519 (41.4%) |
| Business & Financial | 2,360 (48.9%) | 2,467 (51.1%) |
| Computers, Engineering & Science | 3,123 (75.1%) | 1,036 (24.9%) |
| Computers & Mathematics | 2,084 (74.6%) | 709 (25.4%) |
| Architecture & Engineering | 854 (83.2%) | 172 (16.8%) |
| Life, Physical & Social Science | 185 (54.4%) | 155 (45.6%) |
| Community & Social Service | 1,698 (31.6%) | 3,672 (68.4%) |
| Education, Arts & Media | 192 (30.9%) | 429 (69.1%) |
| Legal Services & Support | 392 (58.8%) | 275 (41.2%) |
| Education Instruction & Library | 670 (21.2%) | 2,493 (78.8%) |
| Arts, Media & Entertainment | 444 (48.3%) | 475 (51.7%) |
| Health Diagnosing & Treating | 858 (23.9%) | 2,736 (76.1%) |
| Health Technologists | 449 (21.3%) | 1,663 (78.7%) |
| Total (Category) | 11,610 (48.3%) | 12,430 (51.7%) |
| Total (Overall) | 31,088 (52.6%) | 28,027 (47.4%) |
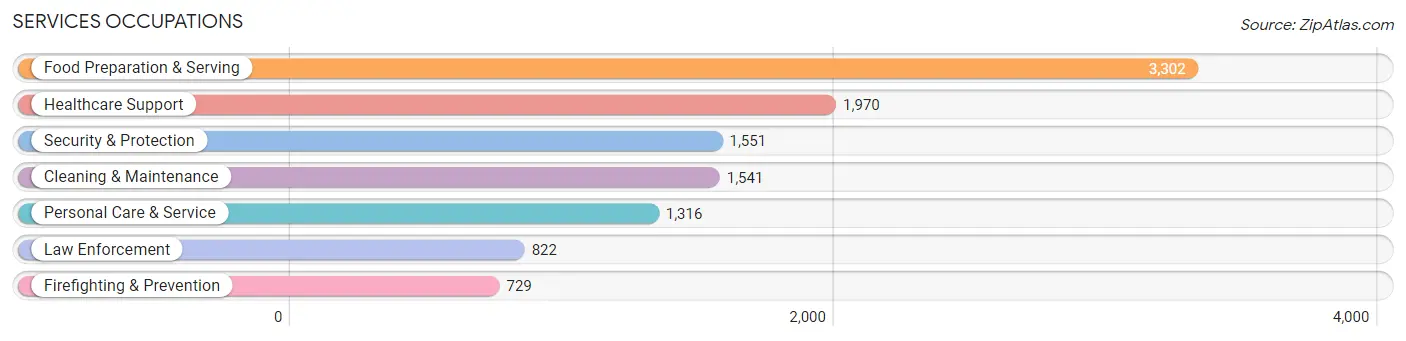
Services Occupations
The most common Services occupations in Brandon are Food Preparation & Serving (3,302 | 5.6%), Healthcare Support (1,970 | 3.3%), Security & Protection (1,551 | 2.6%), Cleaning & Maintenance (1,541 | 2.6%), and Personal Care & Service (1,316 | 2.2%).
Services Occupations by Sex
Within the Services occupations in Brandon, the most male-oriented occupations are Firefighting & Prevention (82.6%), Security & Protection (81.8%), and Law Enforcement (81.1%), while the most female-oriented occupations are Healthcare Support (82.6%), Personal Care & Service (66.4%), and Food Preparation & Serving (49.7%).
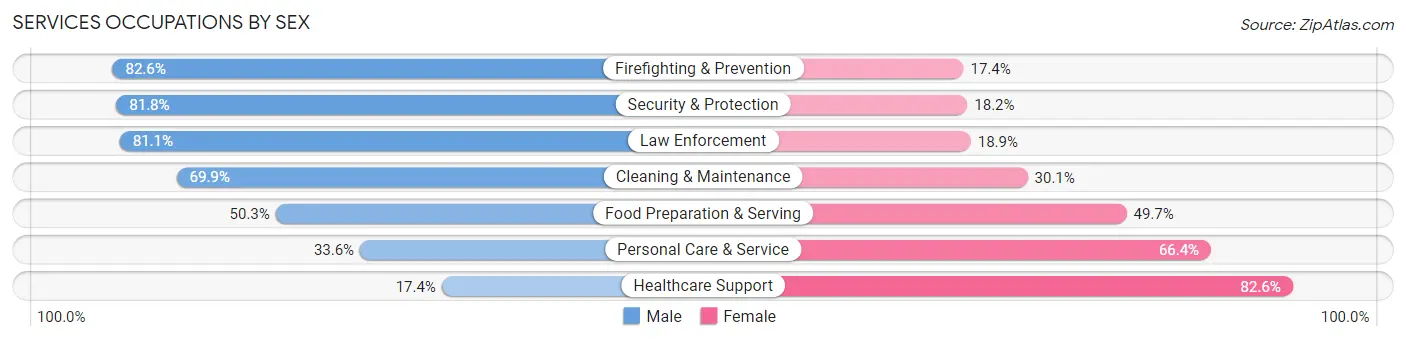
| Occupation | Male | Female |
| Healthcare Support | 343 (17.4%) | 1,627 (82.6%) |
| Security & Protection | 1,269 (81.8%) | 282 (18.2%) |
| Firefighting & Prevention | 602 (82.6%) | 127 (17.4%) |
| Law Enforcement | 667 (81.1%) | 155 (18.9%) |
| Food Preparation & Serving | 1,661 (50.3%) | 1,641 (49.7%) |
| Cleaning & Maintenance | 1,077 (69.9%) | 464 (30.1%) |
| Personal Care & Service | 442 (33.6%) | 874 (66.4%) |
| Total (Category) | 4,792 (49.5%) | 4,888 (50.5%) |
| Total (Overall) | 31,088 (52.6%) | 28,027 (47.4%) |
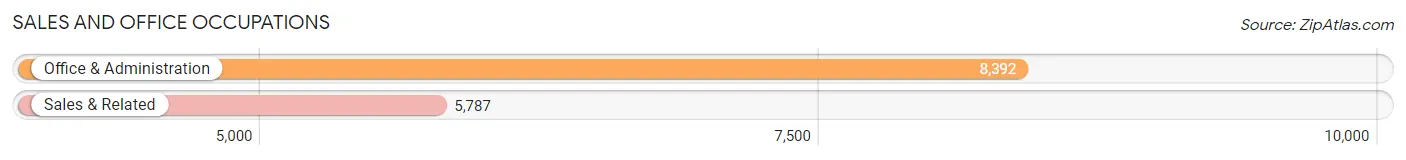
Sales and Office Occupations
The most common Sales and Office occupations in Brandon are Office & Administration (8,392 | 14.2%), and Sales & Related (5,787 | 9.8%).
Sales and Office Occupations by Sex
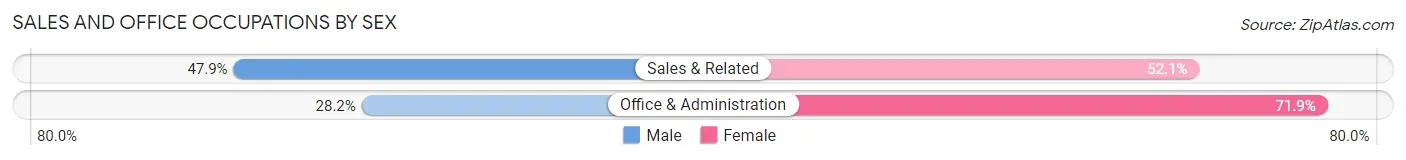
| Occupation | Male | Female |
| Sales & Related | 2,770 (47.9%) | 3,017 (52.1%) |
| Office & Administration | 2,362 (28.1%) | 6,030 (71.9%) |
| Total (Category) | 5,132 (36.2%) | 9,047 (63.8%) |
| Total (Overall) | 31,088 (52.6%) | 28,027 (47.4%) |
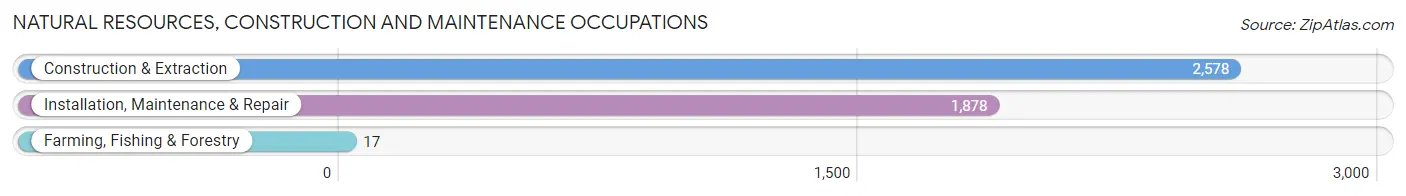
Natural Resources, Construction and Maintenance Occupations
The most common Natural Resources, Construction and Maintenance occupations in Brandon are Construction & Extraction (2,578 | 4.4%), Installation, Maintenance & Repair (1,878 | 3.2%), and Farming, Fishing & Forestry (17 | 0.0%).
Natural Resources, Construction and Maintenance Occupations by Sex
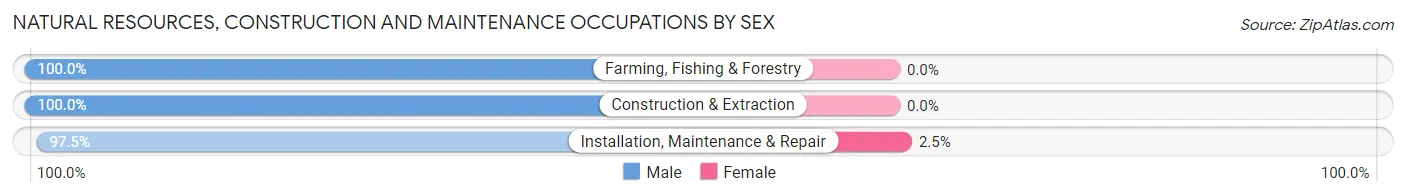
| Occupation | Male | Female |
| Farming, Fishing & Forestry | 17 (100.0%) | 0 (0.0%) |
| Construction & Extraction | 2,578 (100.0%) | 0 (0.0%) |
| Installation, Maintenance & Repair | 1,831 (97.5%) | 47 (2.5%) |
| Total (Category) | 4,426 (99.0%) | 47 (1.1%) |
| Total (Overall) | 31,088 (52.6%) | 28,027 (47.4%) |
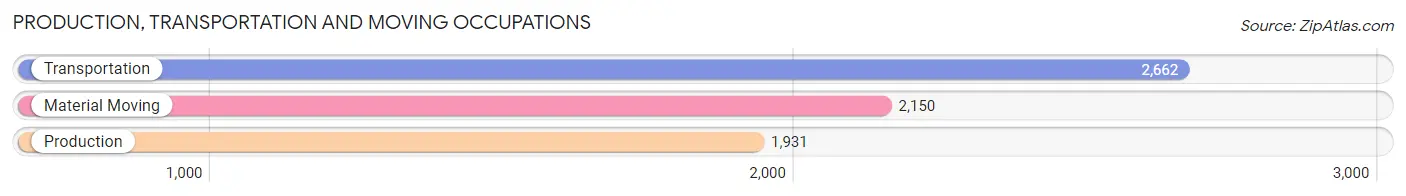
Production, Transportation and Moving Occupations
The most common Production, Transportation and Moving occupations in Brandon are Transportation (2,662 | 4.5%), Material Moving (2,150 | 3.6%), and Production (1,931 | 3.3%).
Production, Transportation and Moving Occupations by Sex
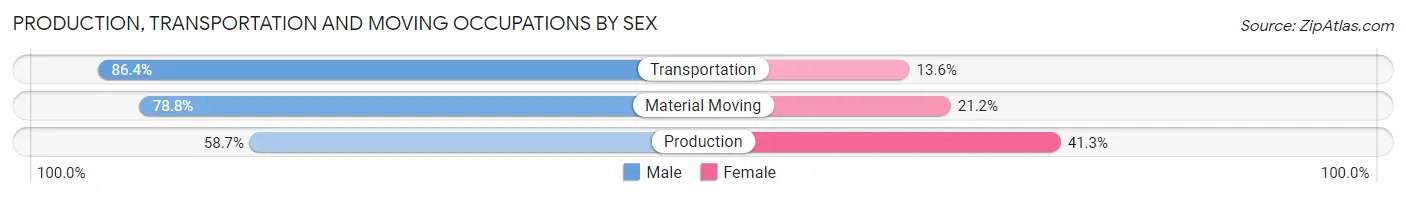
| Occupation | Male | Female |
| Production | 1,133 (58.7%) | 798 (41.3%) |
| Transportation | 2,300 (86.4%) | 362 (13.6%) |
| Material Moving | 1,695 (78.8%) | 455 (21.2%) |
| Total (Category) | 5,128 (76.0%) | 1,615 (23.9%) |
| Total (Overall) | 31,088 (52.6%) | 28,027 (47.4%) |
Employment Industries by Sex in Brandon
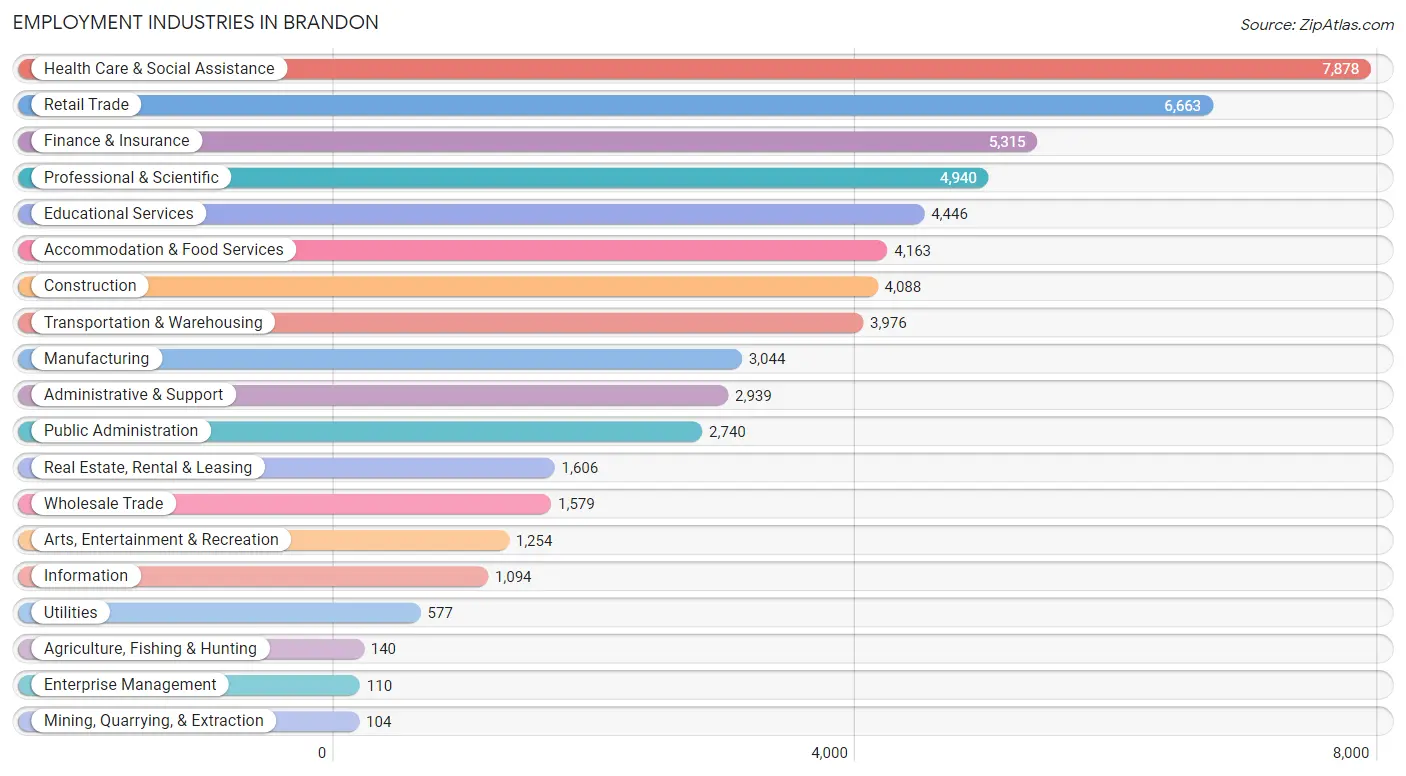
Employment Industries in Brandon
The major employment industries in Brandon include Health Care & Social Assistance (7,878 | 13.3%), Retail Trade (6,663 | 11.3%), Finance & Insurance (5,315 | 9.0%), Professional & Scientific (4,940 | 8.4%), and Educational Services (4,446 | 7.5%).
Employment Industries by Sex in Brandon
The Brandon industries that see more men than women are Mining, Quarrying, & Extraction (100.0%), Construction (92.0%), and Wholesale Trade (79.7%), whereas the industries that tend to have a higher number of women are Health Care & Social Assistance (78.3%), Agriculture, Fishing & Hunting (67.9%), and Educational Services (67.1%).
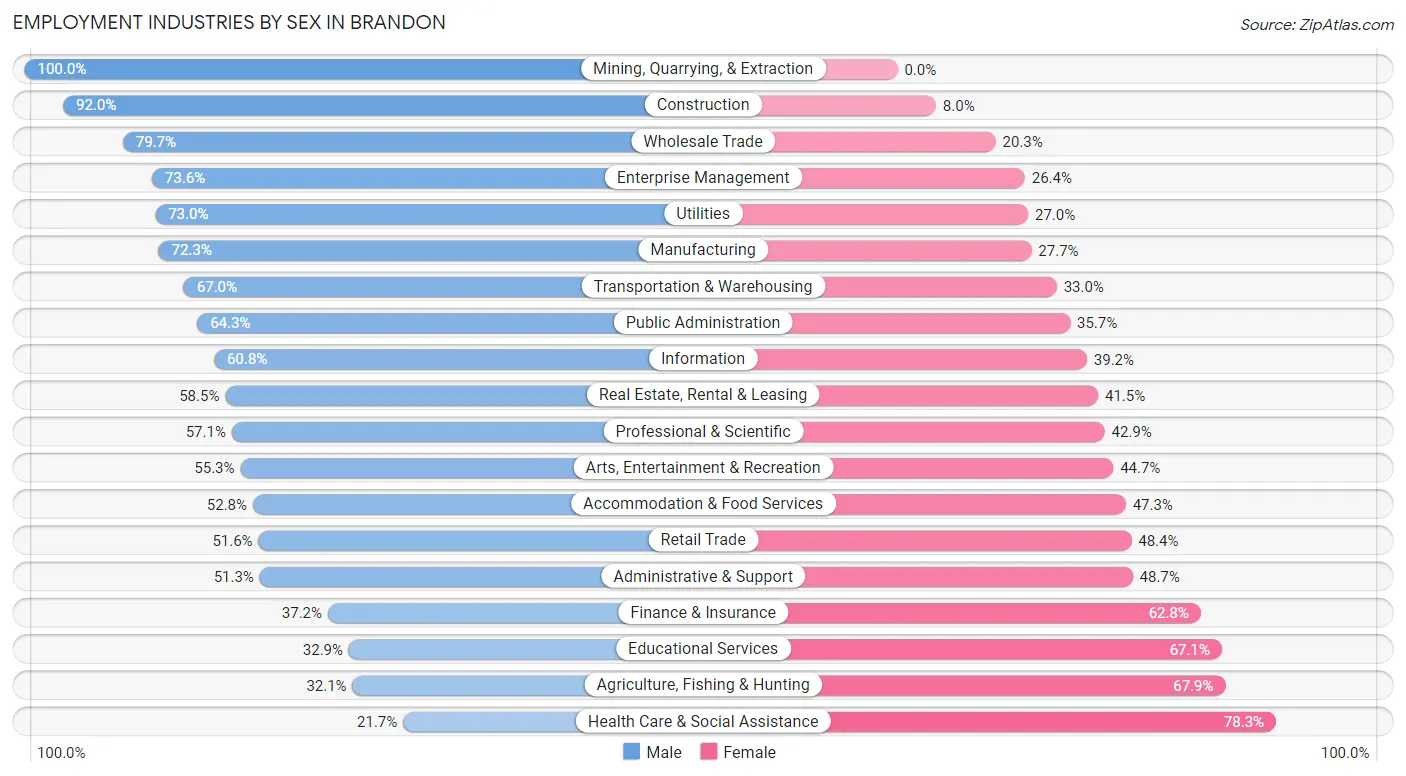
| Industry | Male | Female |
| Agriculture, Fishing & Hunting | 45 (32.1%) | 95 (67.9%) |
| Mining, Quarrying, & Extraction | 104 (100.0%) | 0 (0.0%) |
| Construction | 3,762 (92.0%) | 326 (8.0%) |
| Manufacturing | 2,200 (72.3%) | 844 (27.7%) |
| Wholesale Trade | 1,258 (79.7%) | 321 (20.3%) |
| Retail Trade | 3,438 (51.6%) | 3,225 (48.4%) |
| Transportation & Warehousing | 2,665 (67.0%) | 1,311 (33.0%) |
| Utilities | 421 (73.0%) | 156 (27.0%) |
| Information | 665 (60.8%) | 429 (39.2%) |
| Finance & Insurance | 1,979 (37.2%) | 3,336 (62.8%) |
| Real Estate, Rental & Leasing | 939 (58.5%) | 667 (41.5%) |
| Professional & Scientific | 2,822 (57.1%) | 2,118 (42.9%) |
| Enterprise Management | 81 (73.6%) | 29 (26.4%) |
| Administrative & Support | 1,509 (51.3%) | 1,430 (48.7%) |
| Educational Services | 1,462 (32.9%) | 2,984 (67.1%) |
| Health Care & Social Assistance | 1,706 (21.7%) | 6,172 (78.3%) |
| Arts, Entertainment & Recreation | 694 (55.3%) | 560 (44.7%) |
| Accommodation & Food Services | 2,196 (52.7%) | 1,967 (47.2%) |
| Public Administration | 1,761 (64.3%) | 979 (35.7%) |
| Total | 31,088 (52.6%) | 28,027 (47.4%) |
Education in Brandon
School Enrollment in Brandon
The most common levels of schooling among the 25,328 students in Brandon are college / undergraduate (6,037 | 23.8%), high school (5,493 | 21.7%), and middle school (5,020 | 19.8%).
| School Level | # Students | % Students |
| Nursery / Preschool | 1,235 | 4.9% |
| Kindergarten | 1,155 | 4.6% |
| Elementary School | 4,796 | 18.9% |
| Middle School | 5,020 | 19.8% |
| High School | 5,493 | 21.7% |
| College / Undergraduate | 6,037 | 23.8% |
| Graduate / Professional | 1,592 | 6.3% |
| Total | 25,328 | 100.0% |
School Enrollment by Age by Funding Source in Brandon
Out of a total of 25,328 students who are enrolled in schools in Brandon, 4,812 (19.0%) attend a private institution, while the remaining 20,516 (81.0%) are enrolled in public schools. The age group of 3 to 4 year olds has the highest likelihood of being enrolled in private schools, with 356 (37.6% in the age bracket) enrolled. Conversely, the age group of 18 to 19 year olds has the lowest likelihood of being enrolled in a private school, with 1,613 (93.5% in the age bracket) attending a public institution.
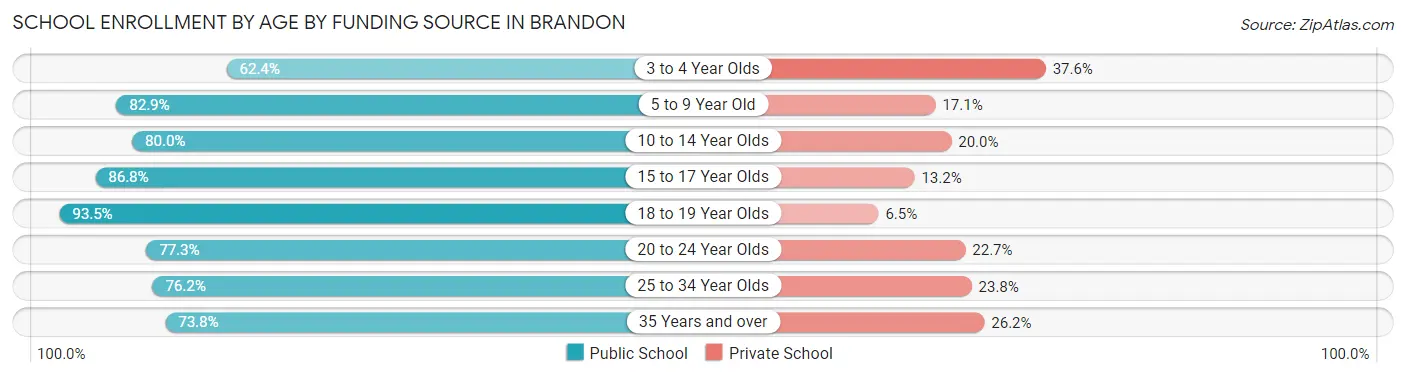
| Age Bracket | Public School | Private School |
| 3 to 4 Year Olds | 590 (62.4%) | 356 (37.6%) |
| 5 to 9 Year Old | 4,794 (82.9%) | 989 (17.1%) |
| 10 to 14 Year Olds | 5,216 (80.0%) | 1,307 (20.0%) |
| 15 to 17 Year Olds | 3,467 (86.8%) | 527 (13.2%) |
| 18 to 19 Year Olds | 1,613 (93.5%) | 112 (6.5%) |
| 20 to 24 Year Olds | 1,685 (77.3%) | 494 (22.7%) |
| 25 to 34 Year Olds | 1,924 (76.2%) | 602 (23.8%) |
| 35 Years and over | 1,219 (73.8%) | 433 (26.2%) |
| Total | 20,516 (81.0%) | 4,812 (19.0%) |
Educational Attainment by Field of Study in Brandon
Business (6,178 | 21.0%), education (3,252 | 11.1%), science & technology (3,238 | 11.0%), social sciences (2,403 | 8.2%), and arts & humanities (2,213 | 7.5%) are the most common fields of study among 29,425 individuals in Brandon who have obtained a bachelor's degree or higher.
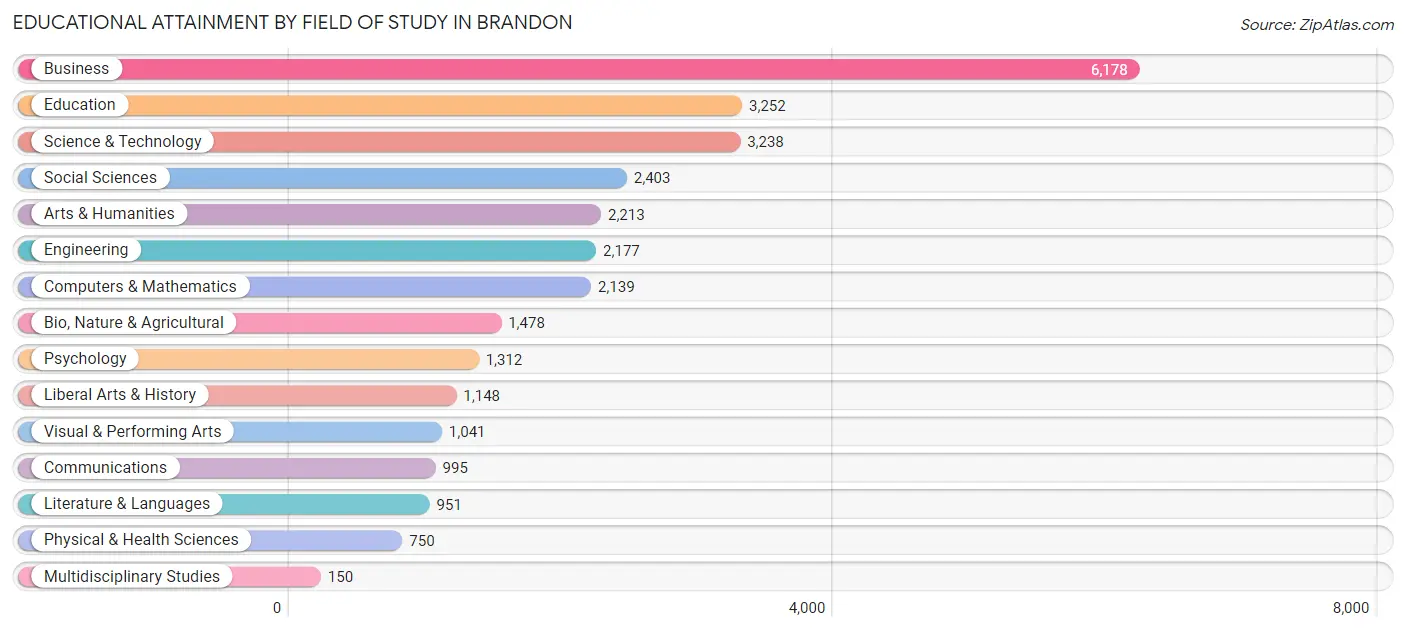
| Field of Study | # Graduates | % Graduates |
| Computers & Mathematics | 2,139 | 7.3% |
| Bio, Nature & Agricultural | 1,478 | 5.0% |
| Physical & Health Sciences | 750 | 2.5% |
| Psychology | 1,312 | 4.5% |
| Social Sciences | 2,403 | 8.2% |
| Engineering | 2,177 | 7.4% |
| Multidisciplinary Studies | 150 | 0.5% |
| Science & Technology | 3,238 | 11.0% |
| Business | 6,178 | 21.0% |
| Education | 3,252 | 11.1% |
| Literature & Languages | 951 | 3.2% |
| Liberal Arts & History | 1,148 | 3.9% |
| Visual & Performing Arts | 1,041 | 3.5% |
| Communications | 995 | 3.4% |
| Arts & Humanities | 2,213 | 7.5% |
| Total | 29,425 | 100.0% |
Transportation & Commute in Brandon
Vehicle Availability by Sex in Brandon
The most prevalent vehicle ownership categories in Brandon are males with 2 vehicles (14,356, accounting for 46.8%) and females with 2 vehicles (12,292, making up 51.8%).
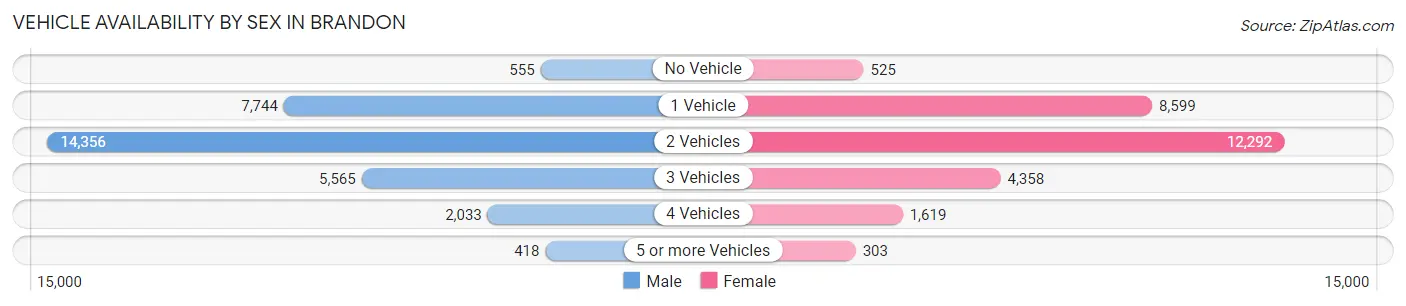
| Vehicles Available | Male | Female |
| No Vehicle | 555 (1.8%) | 525 (1.9%) |
| 1 Vehicle | 7,744 (25.3%) | 8,599 (31.0%) |
| 2 Vehicles | 14,356 (46.8%) | 12,292 (44.4%) |
| 3 Vehicles | 5,565 (18.1%) | 4,358 (15.7%) |
| 4 Vehicles | 2,033 (6.6%) | 1,619 (5.9%) |
| 5 or more Vehicles | 418 (1.4%) | 303 (1.1%) |
| Total | 30,671 (100.0%) | 27,696 (100.0%) |
Commute Time in Brandon
The most frequently occuring commute durations in Brandon are 30 to 34 minutes (9,266 commuters, 18.4%), 15 to 19 minutes (8,205 commuters, 16.3%), and 20 to 24 minutes (7,535 commuters, 15.0%).
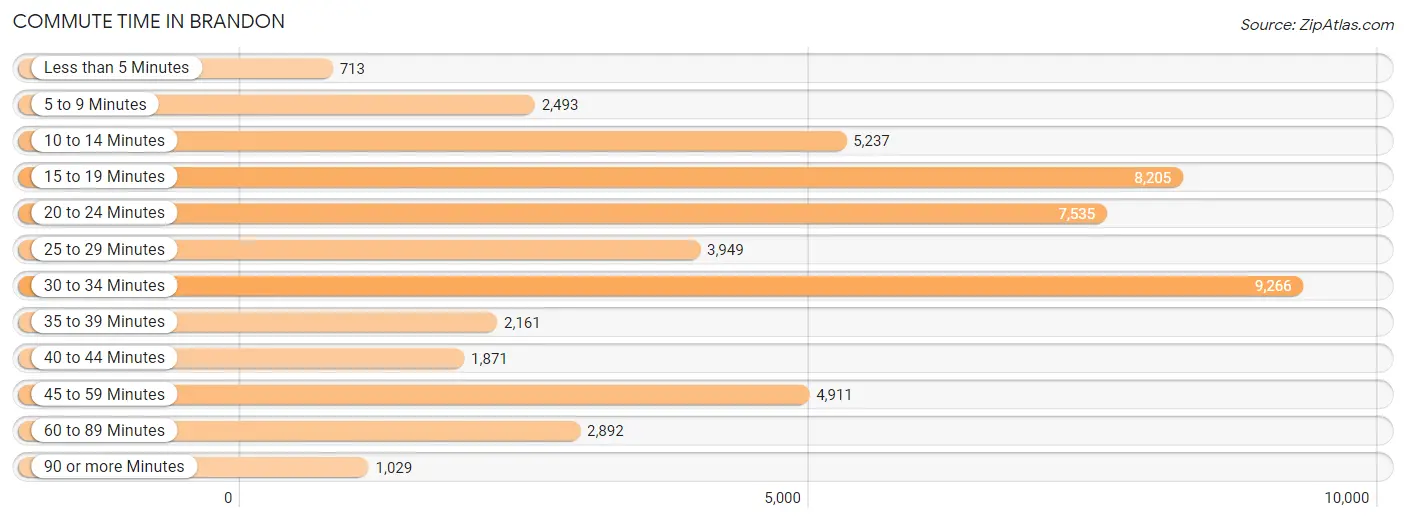
| Commute Time | # Commuters | % Commuters |
| Less than 5 Minutes | 713 | 1.4% |
| 5 to 9 Minutes | 2,493 | 5.0% |
| 10 to 14 Minutes | 5,237 | 10.4% |
| 15 to 19 Minutes | 8,205 | 16.3% |
| 20 to 24 Minutes | 7,535 | 15.0% |
| 25 to 29 Minutes | 3,949 | 7.9% |
| 30 to 34 Minutes | 9,266 | 18.4% |
| 35 to 39 Minutes | 2,161 | 4.3% |
| 40 to 44 Minutes | 1,871 | 3.7% |
| 45 to 59 Minutes | 4,911 | 9.8% |
| 60 to 89 Minutes | 2,892 | 5.8% |
| 90 or more Minutes | 1,029 | 2.1% |
Commute Time by Sex in Brandon
The most common commute times in Brandon are 30 to 34 minutes (4,806 commuters, 18.3%) for males and 30 to 34 minutes (4,460 commuters, 18.5%) for females.
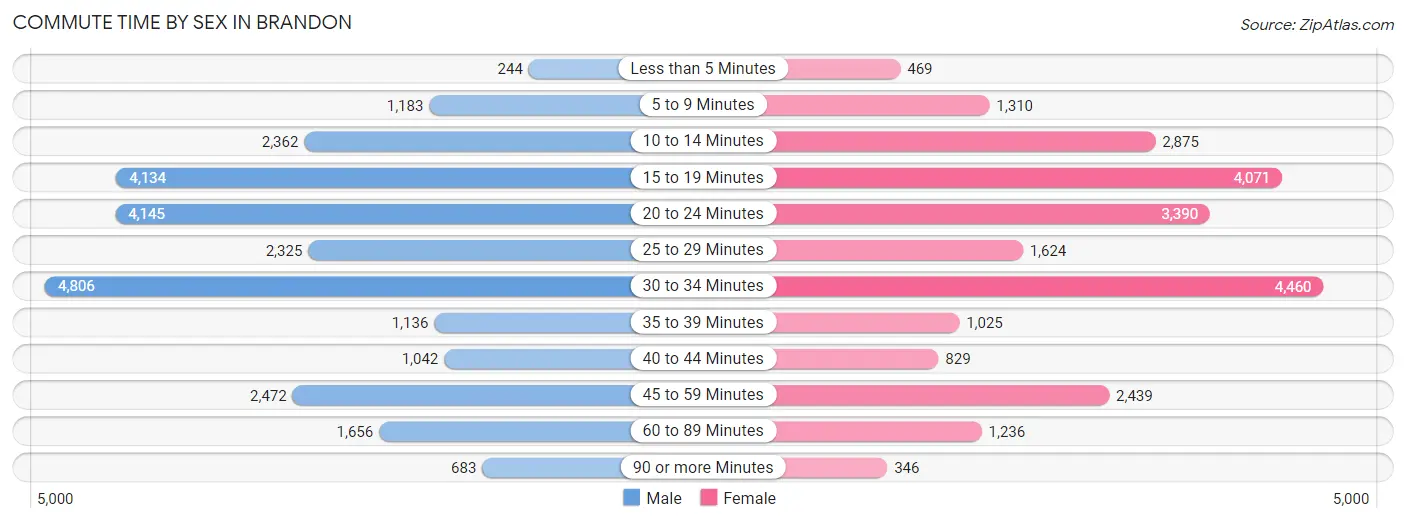
| Commute Time | Male | Female |
| Less than 5 Minutes | 244 (0.9%) | 469 (1.9%) |
| 5 to 9 Minutes | 1,183 (4.5%) | 1,310 (5.4%) |
| 10 to 14 Minutes | 2,362 (9.0%) | 2,875 (11.9%) |
| 15 to 19 Minutes | 4,134 (15.8%) | 4,071 (16.9%) |
| 20 to 24 Minutes | 4,145 (15.8%) | 3,390 (14.1%) |
| 25 to 29 Minutes | 2,325 (8.9%) | 1,624 (6.8%) |
| 30 to 34 Minutes | 4,806 (18.3%) | 4,460 (18.5%) |
| 35 to 39 Minutes | 1,136 (4.3%) | 1,025 (4.3%) |
| 40 to 44 Minutes | 1,042 (4.0%) | 829 (3.4%) |
| 45 to 59 Minutes | 2,472 (9.4%) | 2,439 (10.1%) |
| 60 to 89 Minutes | 1,656 (6.3%) | 1,236 (5.1%) |
| 90 or more Minutes | 683 (2.6%) | 346 (1.4%) |
Time of Departure to Work by Sex in Brandon
The most frequent times of departure to work in Brandon are 7:00 AM to 7:29 AM (3,512, 13.4%) for males and 7:00 AM to 7:29 AM (3,786, 15.7%) for females.
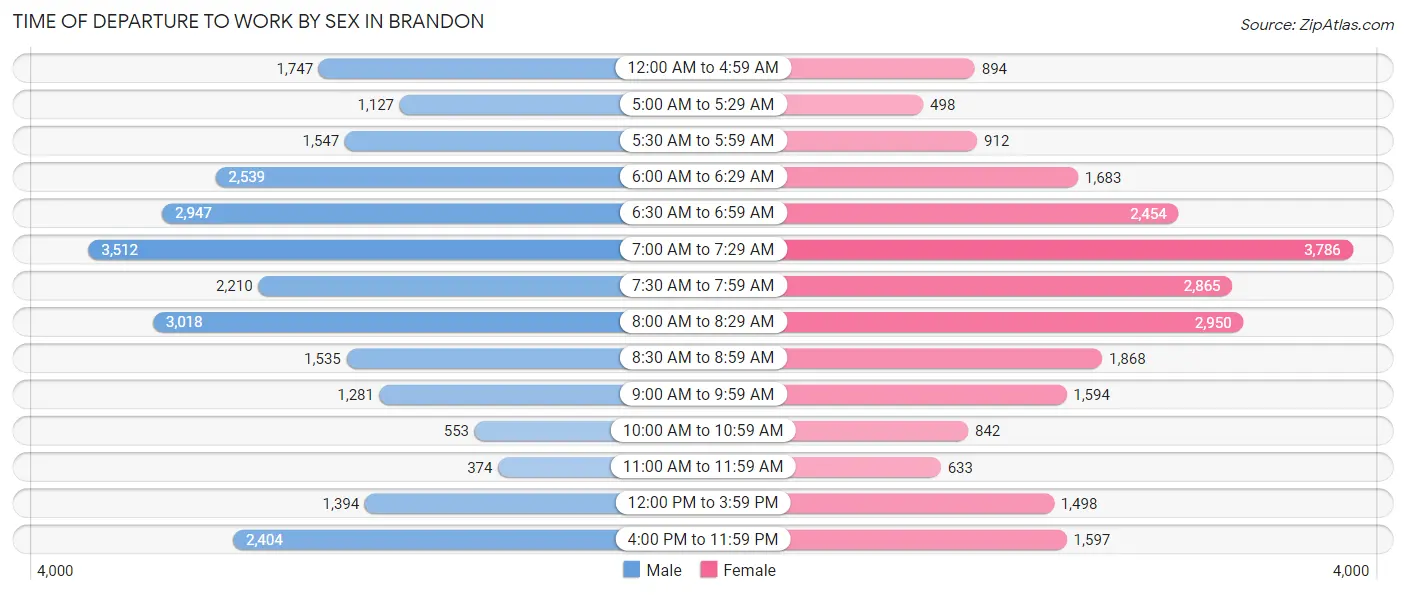
| Time of Departure | Male | Female |
| 12:00 AM to 4:59 AM | 1,747 (6.7%) | 894 (3.7%) |
| 5:00 AM to 5:29 AM | 1,127 (4.3%) | 498 (2.1%) |
| 5:30 AM to 5:59 AM | 1,547 (5.9%) | 912 (3.8%) |
| 6:00 AM to 6:29 AM | 2,539 (9.7%) | 1,683 (7.0%) |
| 6:30 AM to 6:59 AM | 2,947 (11.3%) | 2,454 (10.2%) |
| 7:00 AM to 7:29 AM | 3,512 (13.4%) | 3,786 (15.7%) |
| 7:30 AM to 7:59 AM | 2,210 (8.4%) | 2,865 (11.9%) |
| 8:00 AM to 8:29 AM | 3,018 (11.5%) | 2,950 (12.2%) |
| 8:30 AM to 8:59 AM | 1,535 (5.9%) | 1,868 (7.8%) |
| 9:00 AM to 9:59 AM | 1,281 (4.9%) | 1,594 (6.6%) |
| 10:00 AM to 10:59 AM | 553 (2.1%) | 842 (3.5%) |
| 11:00 AM to 11:59 AM | 374 (1.4%) | 633 (2.6%) |
| 12:00 PM to 3:59 PM | 1,394 (5.3%) | 1,498 (6.2%) |
| 4:00 PM to 11:59 PM | 2,404 (9.2%) | 1,597 (6.6%) |
| Total | 26,188 (100.0%) | 24,074 (100.0%) |
Housing Occupancy in Brandon
Occupancy by Ownership in Brandon
Of the total 44,836 dwellings in Brandon, owner-occupied units account for 24,707 (55.1%), while renter-occupied units make up 20,129 (44.9%).
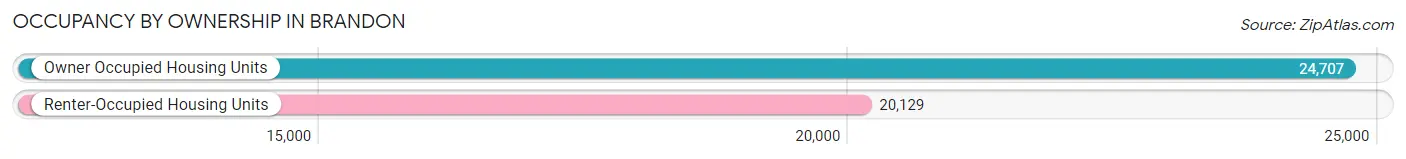
| Occupancy | # Housing Units | % Housing Units |
| Owner Occupied Housing Units | 24,707 | 55.1% |
| Renter-Occupied Housing Units | 20,129 | 44.9% |
| Total Occupied Housing Units | 44,836 | 100.0% |
Occupancy by Household Size in Brandon
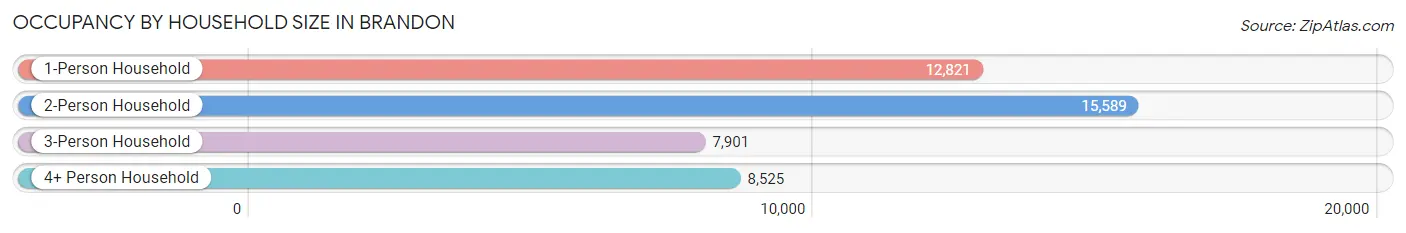
| Household Size | # Housing Units | % Housing Units |
| 1-Person Household | 12,821 | 28.6% |
| 2-Person Household | 15,589 | 34.8% |
| 3-Person Household | 7,901 | 17.6% |
| 4+ Person Household | 8,525 | 19.0% |
| Total Housing Units | 44,836 | 100.0% |
Occupancy by Ownership by Household Size in Brandon
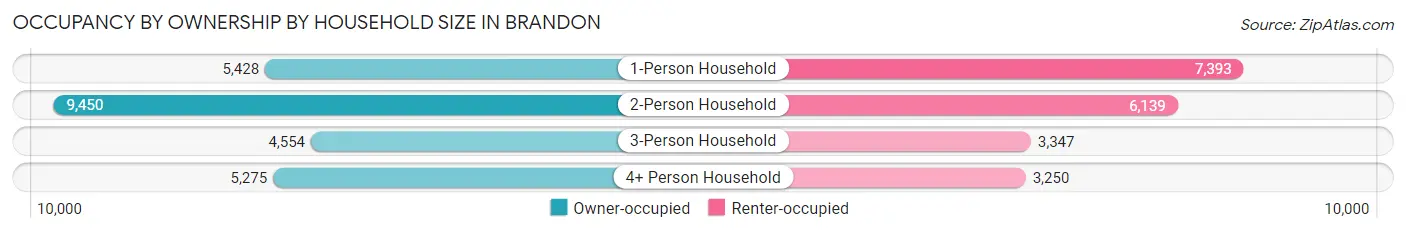
| Household Size | Owner-occupied | Renter-occupied |
| 1-Person Household | 5,428 (42.3%) | 7,393 (57.7%) |
| 2-Person Household | 9,450 (60.6%) | 6,139 (39.4%) |
| 3-Person Household | 4,554 (57.6%) | 3,347 (42.4%) |
| 4+ Person Household | 5,275 (61.9%) | 3,250 (38.1%) |
| Total Housing Units | 24,707 (55.1%) | 20,129 (44.9%) |
Occupancy by Educational Attainment in Brandon
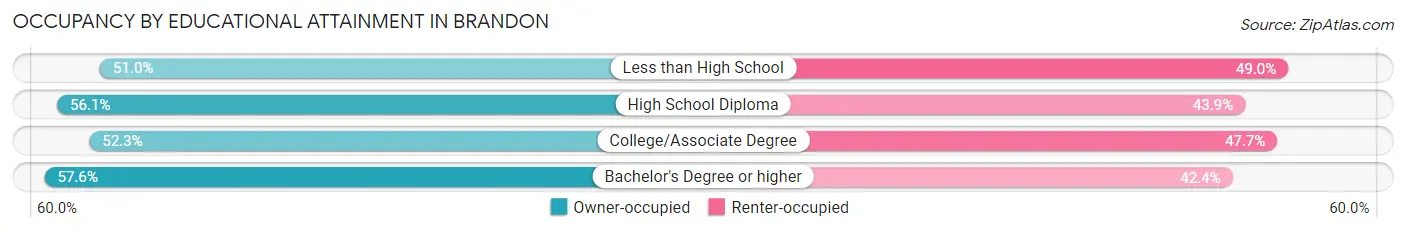
| Household Size | Owner-occupied | Renter-occupied |
| Less than High School | 1,435 (51.0%) | 1,378 (49.0%) |
| High School Diploma | 5,648 (56.1%) | 4,414 (43.9%) |
| College/Associate Degree | 7,785 (52.3%) | 7,101 (47.7%) |
| Bachelor's Degree or higher | 9,839 (57.6%) | 7,236 (42.4%) |
Occupancy by Age of Householder in Brandon
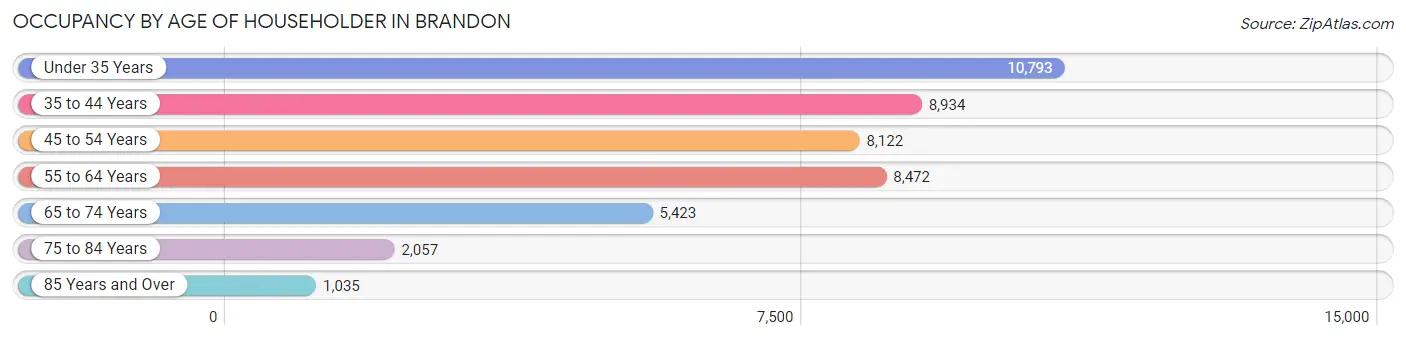
| Age Bracket | # Households | % Households |
| Under 35 Years | 10,793 | 24.1% |
| 35 to 44 Years | 8,934 | 19.9% |
| 45 to 54 Years | 8,122 | 18.1% |
| 55 to 64 Years | 8,472 | 18.9% |
| 65 to 74 Years | 5,423 | 12.1% |
| 75 to 84 Years | 2,057 | 4.6% |
| 85 Years and Over | 1,035 | 2.3% |
| Total | 44,836 | 100.0% |
Housing Finances in Brandon
Median Income by Occupancy in Brandon
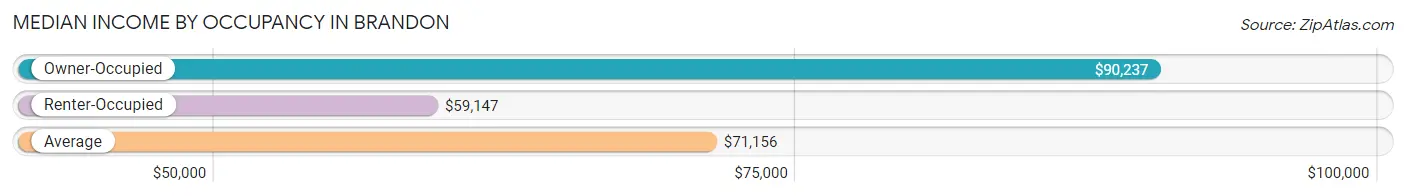
| Occupancy Type | # Households | Median Income |
| Owner-Occupied | 24,707 (55.1%) | $90,237 |
| Renter-Occupied | 20,129 (44.9%) | $59,147 |
| Average | 44,836 (100.0%) | $71,156 |
Occupancy by Householder Income Bracket in Brandon
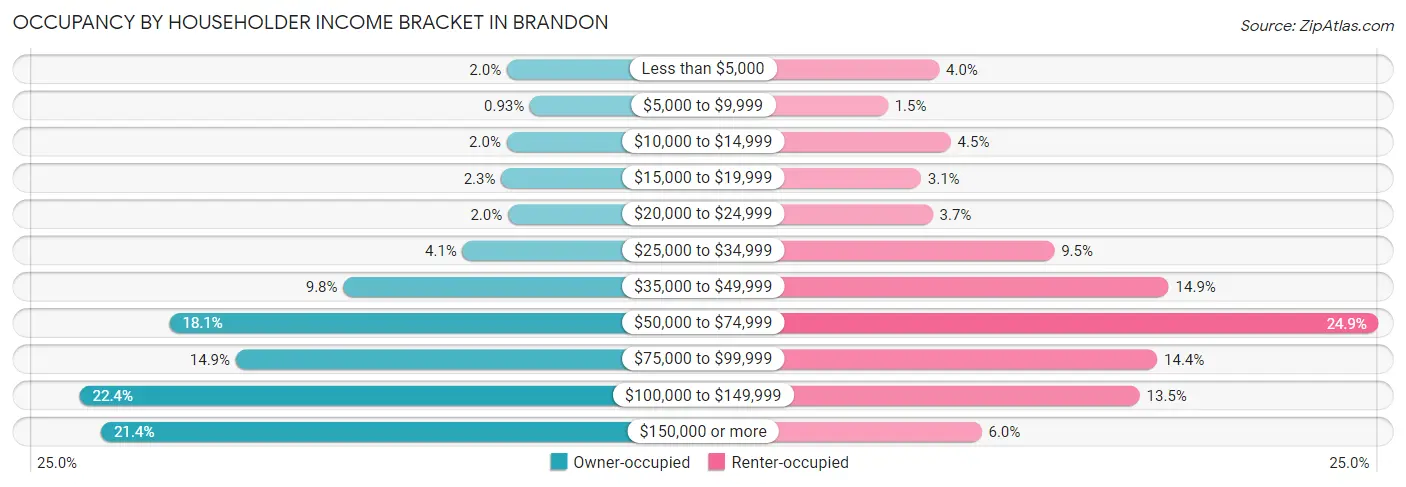
| Income Bracket | Owner-occupied | Renter-occupied |
| Less than $5,000 | 502 (2.0%) | 802 (4.0%) |
| $5,000 to $9,999 | 229 (0.9%) | 307 (1.5%) |
| $10,000 to $14,999 | 504 (2.0%) | 912 (4.5%) |
| $15,000 to $19,999 | 568 (2.3%) | 627 (3.1%) |
| $20,000 to $24,999 | 488 (2.0%) | 738 (3.7%) |
| $25,000 to $34,999 | 1,022 (4.1%) | 1,905 (9.5%) |
| $35,000 to $49,999 | 2,425 (9.8%) | 3,002 (14.9%) |
| $50,000 to $74,999 | 4,471 (18.1%) | 5,014 (24.9%) |
| $75,000 to $99,999 | 3,691 (14.9%) | 2,891 (14.4%) |
| $100,000 to $149,999 | 5,529 (22.4%) | 2,724 (13.5%) |
| $150,000 or more | 5,278 (21.4%) | 1,207 (6.0%) |
| Total | 24,707 (100.0%) | 20,129 (100.0%) |
Monthly Housing Cost Tiers in Brandon
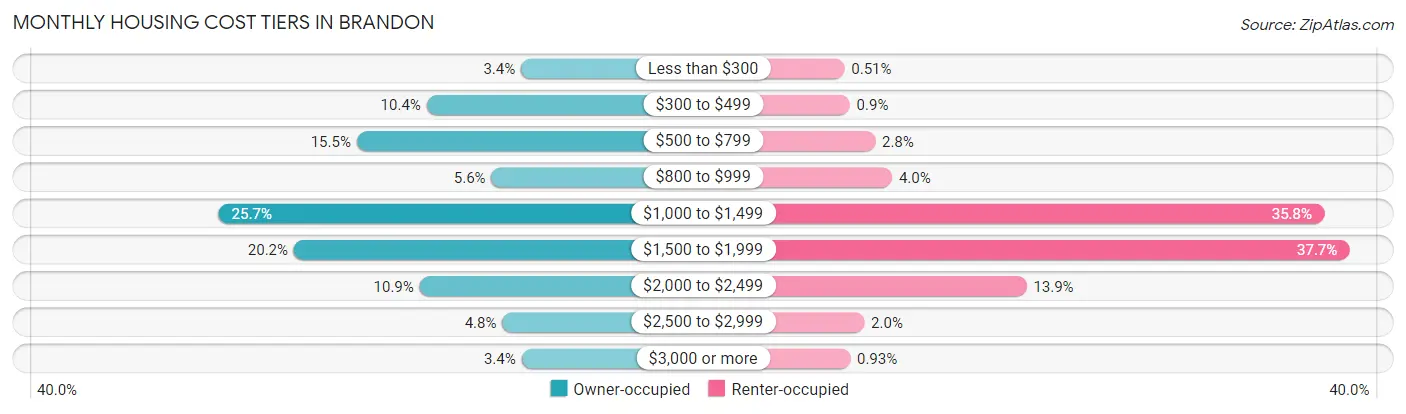
| Monthly Cost | Owner-occupied | Renter-occupied |
| Less than $300 | 849 (3.4%) | 102 (0.5%) |
| $300 to $499 | 2,567 (10.4%) | 181 (0.9%) |
| $500 to $799 | 3,840 (15.5%) | 557 (2.8%) |
| $800 to $999 | 1,388 (5.6%) | 809 (4.0%) |
| $1,000 to $1,499 | 6,353 (25.7%) | 7,211 (35.8%) |
| $1,500 to $1,999 | 4,984 (20.2%) | 7,584 (37.7%) |
| $2,000 to $2,499 | 2,695 (10.9%) | 2,802 (13.9%) |
| $2,500 to $2,999 | 1,191 (4.8%) | 397 (2.0%) |
| $3,000 or more | 840 (3.4%) | 187 (0.9%) |
| Total | 24,707 (100.0%) | 20,129 (100.0%) |
Physical Housing Characteristics in Brandon
Housing Structures in Brandon
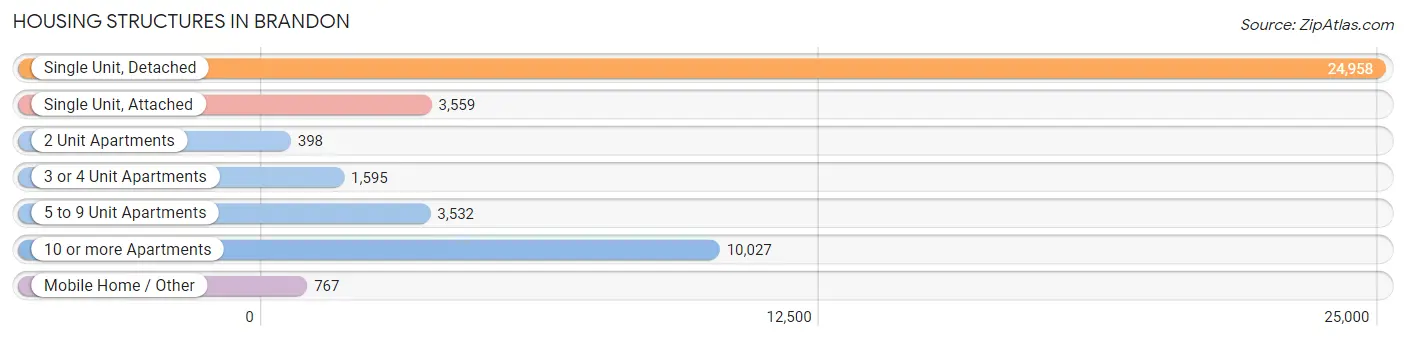
| Structure Type | # Housing Units | % Housing Units |
| Single Unit, Detached | 24,958 | 55.7% |
| Single Unit, Attached | 3,559 | 7.9% |
| 2 Unit Apartments | 398 | 0.9% |
| 3 or 4 Unit Apartments | 1,595 | 3.6% |
| 5 to 9 Unit Apartments | 3,532 | 7.9% |
| 10 or more Apartments | 10,027 | 22.4% |
| Mobile Home / Other | 767 | 1.7% |
| Total | 44,836 | 100.0% |
Housing Structures by Occupancy in Brandon
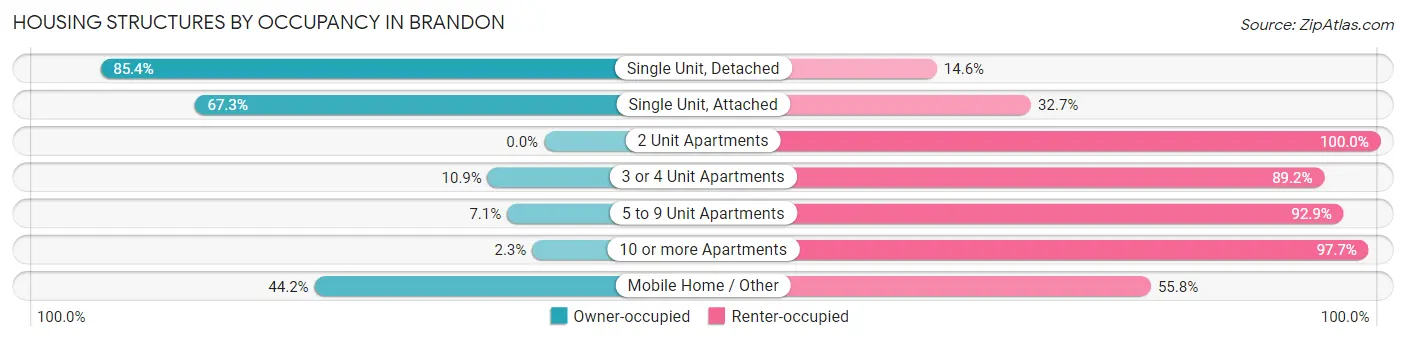
| Structure Type | Owner-occupied | Renter-occupied |
| Single Unit, Detached | 21,320 (85.4%) | 3,638 (14.6%) |
| Single Unit, Attached | 2,394 (67.3%) | 1,165 (32.7%) |
| 2 Unit Apartments | 0 (0.0%) | 398 (100.0%) |
| 3 or 4 Unit Apartments | 173 (10.8%) | 1,422 (89.1%) |
| 5 to 9 Unit Apartments | 251 (7.1%) | 3,281 (92.9%) |
| 10 or more Apartments | 230 (2.3%) | 9,797 (97.7%) |
| Mobile Home / Other | 339 (44.2%) | 428 (55.8%) |
| Total | 24,707 (55.1%) | 20,129 (44.9%) |
Housing Structures by Number of Rooms in Brandon
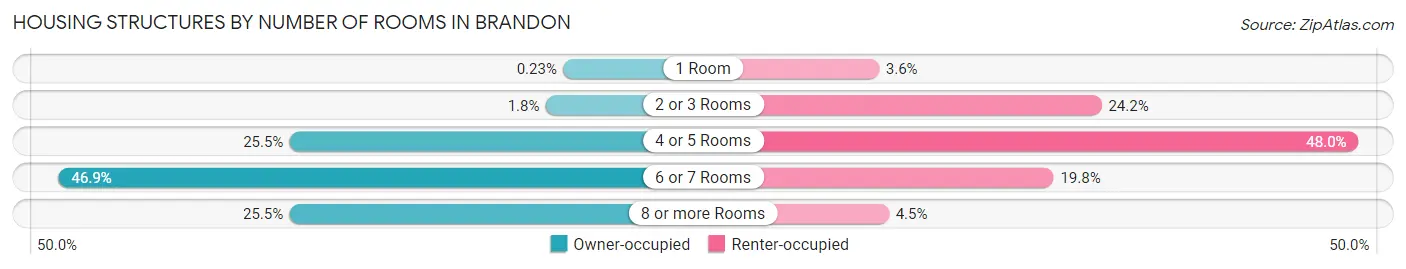
| Number of Rooms | Owner-occupied | Renter-occupied |
| 1 Room | 57 (0.2%) | 724 (3.6%) |
| 2 or 3 Rooms | 454 (1.8%) | 4,869 (24.2%) |
| 4 or 5 Rooms | 6,307 (25.5%) | 9,652 (47.9%) |
| 6 or 7 Rooms | 11,579 (46.9%) | 3,976 (19.8%) |
| 8 or more Rooms | 6,310 (25.5%) | 908 (4.5%) |
| Total | 24,707 (100.0%) | 20,129 (100.0%) |
Housing Structure by Heating Type in Brandon
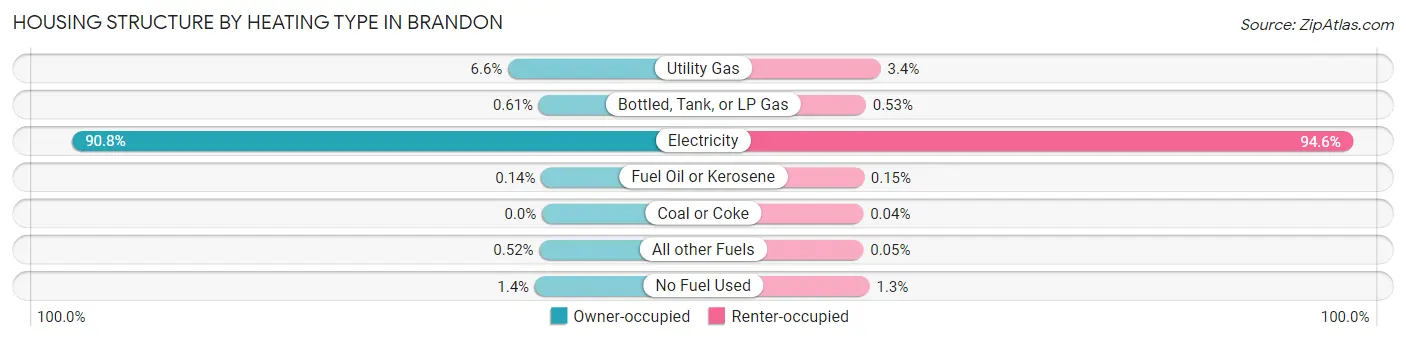
| Heating Type | Owner-occupied | Renter-occupied |
| Utility Gas | 1,620 (6.6%) | 681 (3.4%) |
| Bottled, Tank, or LP Gas | 151 (0.6%) | 106 (0.5%) |
| Electricity | 22,431 (90.8%) | 19,039 (94.6%) |
| Fuel Oil or Kerosene | 34 (0.1%) | 31 (0.2%) |
| Coal or Coke | 0 (0.0%) | 9 (0.0%) |
| All other Fuels | 129 (0.5%) | 10 (0.1%) |
| No Fuel Used | 342 (1.4%) | 253 (1.3%) |
| Total | 24,707 (100.0%) | 20,129 (100.0%) |
Household Vehicle Usage in Brandon
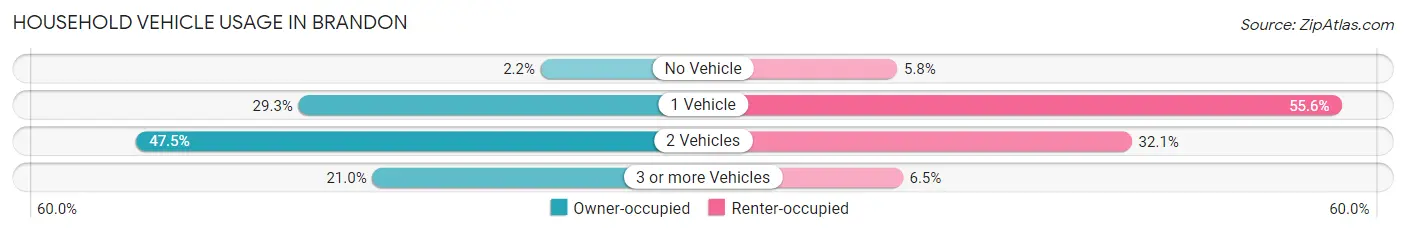
| Vehicles per Household | Owner-occupied | Renter-occupied |
| No Vehicle | 539 (2.2%) | 1,175 (5.8%) |
| 1 Vehicle | 7,240 (29.3%) | 11,189 (55.6%) |
| 2 Vehicles | 11,732 (47.5%) | 6,466 (32.1%) |
| 3 or more Vehicles | 5,196 (21.0%) | 1,299 (6.5%) |
| Total | 24,707 (100.0%) | 20,129 (100.0%) |
Real Estate & Mortgages in Brandon
Real Estate and Mortgage Overview in Brandon
| Characteristic | Without Mortgage | With Mortgage |
| Housing Units | 7,608 | 17,099 |
| Median Property Value | $262,100 | $268,000 |
| Median Household Income | $73,763 | $3,826 |
| Monthly Housing Costs | $533 | $821 |
| Real Estate Taxes | $1,825 | $355 |
Property Value by Mortgage Status in Brandon
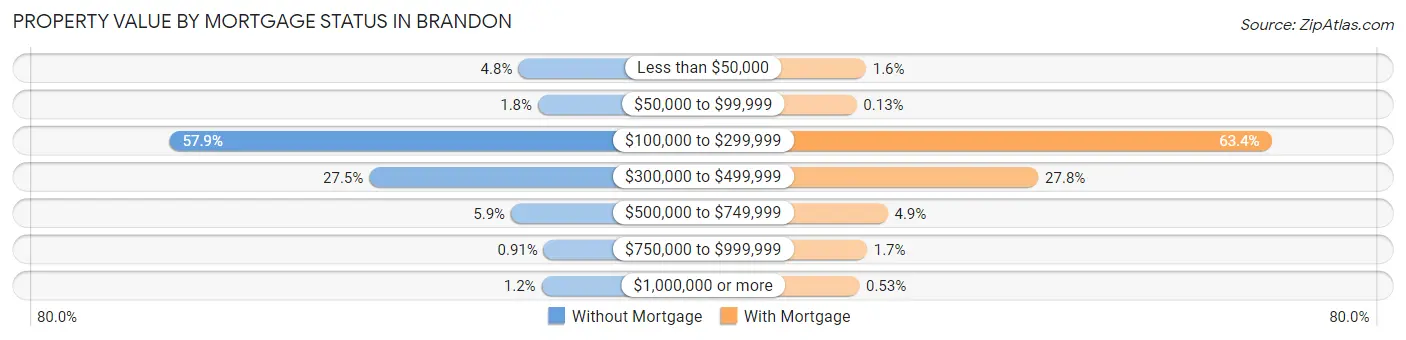
| Property Value | Without Mortgage | With Mortgage |
| Less than $50,000 | 364 (4.8%) | 266 (1.6%) |
| $50,000 to $99,999 | 136 (1.8%) | 23 (0.1%) |
| $100,000 to $299,999 | 4,405 (57.9%) | 10,836 (63.4%) |
| $300,000 to $499,999 | 2,092 (27.5%) | 4,758 (27.8%) |
| $500,000 to $749,999 | 448 (5.9%) | 833 (4.9%) |
| $750,000 to $999,999 | 69 (0.9%) | 292 (1.7%) |
| $1,000,000 or more | 94 (1.2%) | 91 (0.5%) |
| Total | 7,608 (100.0%) | 17,099 (100.0%) |
Household Income by Mortgage Status in Brandon
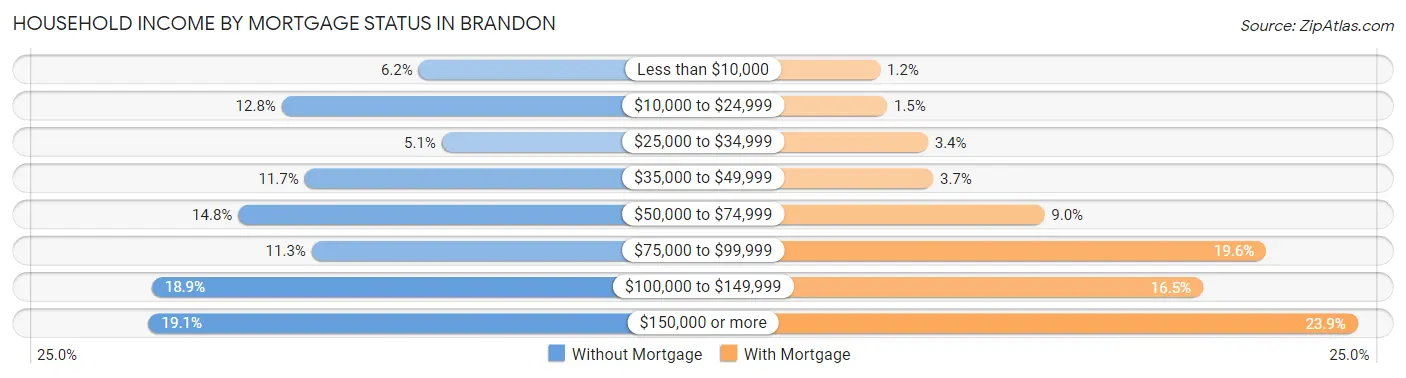
| Household Income | Without Mortgage | With Mortgage |
| Less than $10,000 | 475 (6.2%) | 200 (1.2%) |
| $10,000 to $24,999 | 971 (12.8%) | 256 (1.5%) |
| $25,000 to $34,999 | 391 (5.1%) | 589 (3.4%) |
| $35,000 to $49,999 | 888 (11.7%) | 631 (3.7%) |
| $50,000 to $74,999 | 1,128 (14.8%) | 1,537 (9.0%) |
| $75,000 to $99,999 | 862 (11.3%) | 3,343 (19.6%) |
| $100,000 to $149,999 | 1,441 (18.9%) | 2,829 (16.5%) |
| $150,000 or more | 1,452 (19.1%) | 4,088 (23.9%) |
| Total | 7,608 (100.0%) | 17,099 (100.0%) |
Property Value to Household Income Ratio in Brandon
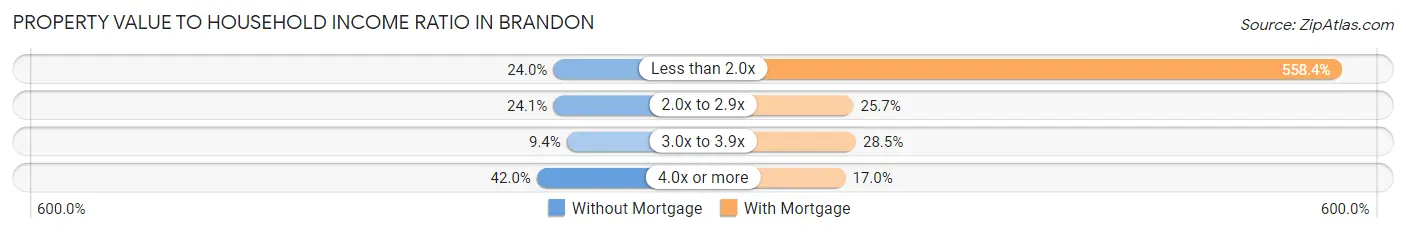
| Value-to-Income Ratio | Without Mortgage | With Mortgage |
| Less than 2.0x | 1,826 (24.0%) | 95,485 (558.4%) |
| 2.0x to 2.9x | 1,836 (24.1%) | 4,397 (25.7%) |
| 3.0x to 3.9x | 713 (9.4%) | 4,871 (28.5%) |
| 4.0x or more | 3,198 (42.0%) | 2,899 (17.0%) |
| Total | 7,608 (100.0%) | 17,099 (100.0%) |
Real Estate Taxes by Mortgage Status in Brandon
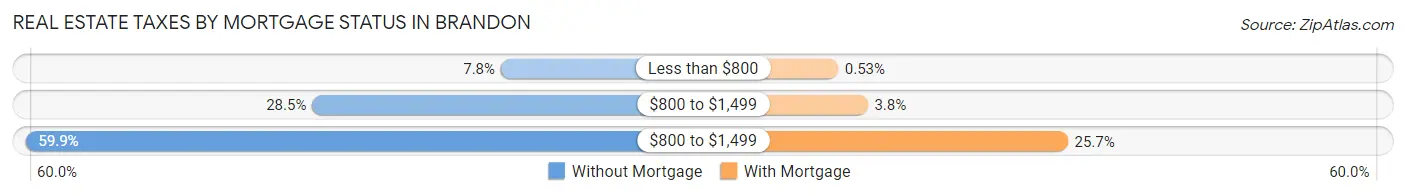
| Property Taxes | Without Mortgage | With Mortgage |
| Less than $800 | 594 (7.8%) | 90 (0.5%) |
| $800 to $1,499 | 2,167 (28.5%) | 644 (3.8%) |
| $800 to $1,499 | 4,558 (59.9%) | 4,394 (25.7%) |
| Total | 7,608 (100.0%) | 17,099 (100.0%) |
Health & Disability in Brandon
Health Insurance Coverage by Age in Brandon
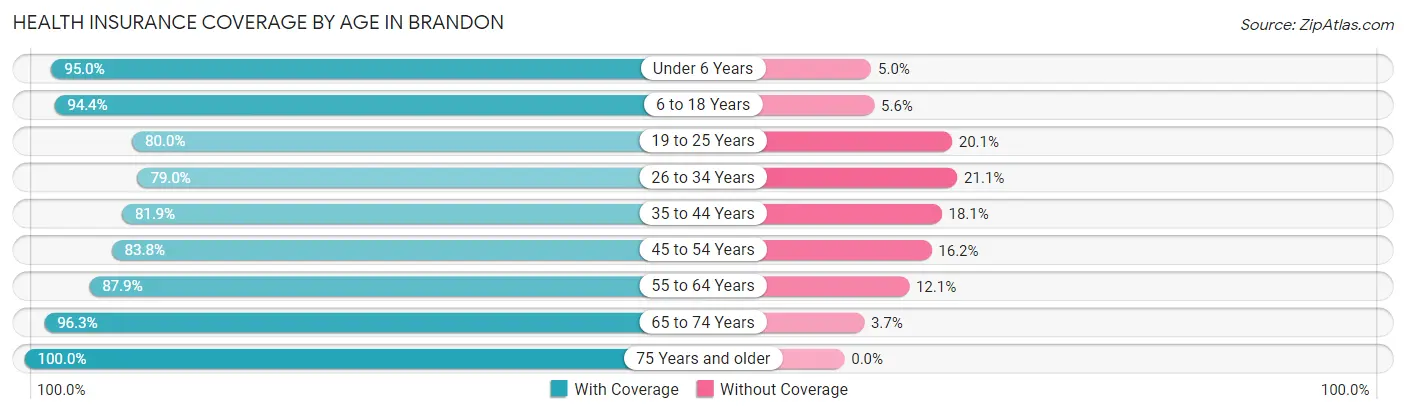
| Age Bracket | With Coverage | Without Coverage |
| Under 6 Years | 6,918 (95.0%) | 363 (5.0%) |
| 6 to 18 Years | 15,766 (94.4%) | 928 (5.6%) |
| 19 to 25 Years | 8,635 (79.9%) | 2,166 (20.1%) |
| 26 to 34 Years | 13,776 (78.9%) | 3,674 (21.0%) |
| 35 to 44 Years | 12,908 (81.9%) | 2,861 (18.1%) |
| 45 to 54 Years | 11,714 (83.8%) | 2,271 (16.2%) |
| 55 to 64 Years | 12,537 (87.9%) | 1,719 (12.1%) |
| 65 to 74 Years | 9,364 (96.3%) | 357 (3.7%) |
| 75 Years and older | 6,031 (100.0%) | 0 (0.0%) |
| Total | 97,649 (87.2%) | 14,339 (12.8%) |
Health Insurance Coverage by Citizenship Status in Brandon
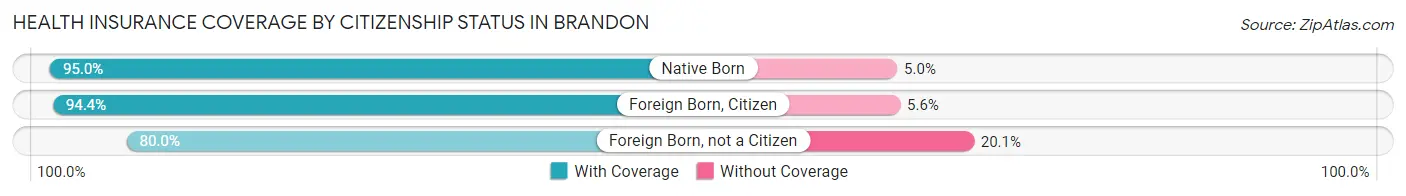
| Citizenship Status | With Coverage | Without Coverage |
| Native Born | 6,918 (95.0%) | 363 (5.0%) |
| Foreign Born, Citizen | 15,766 (94.4%) | 928 (5.6%) |
| Foreign Born, not a Citizen | 8,635 (79.9%) | 2,166 (20.1%) |
Health Insurance Coverage by Household Income in Brandon
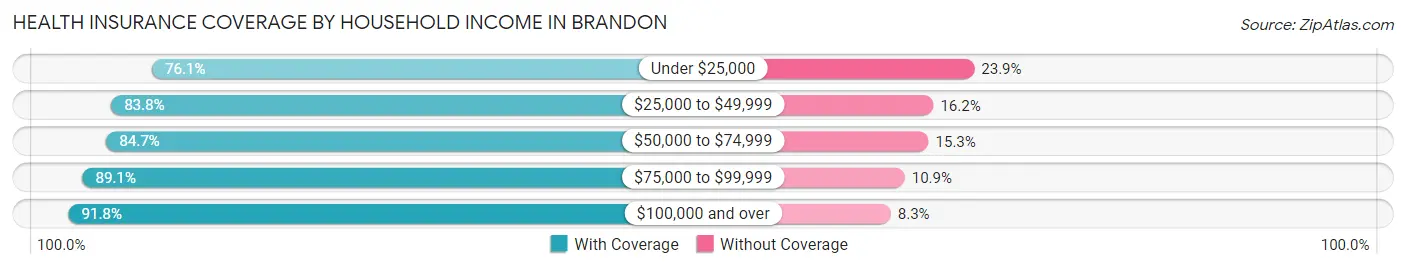
| Household Income | With Coverage | Without Coverage |
| Under $25,000 | 8,185 (76.1%) | 2,570 (23.9%) |
| $25,000 to $49,999 | 14,241 (83.8%) | 2,762 (16.2%) |
| $50,000 to $74,999 | 18,769 (84.7%) | 3,399 (15.3%) |
| $75,000 to $99,999 | 15,347 (89.1%) | 1,872 (10.9%) |
| $100,000 and over | 40,915 (91.7%) | 3,680 (8.3%) |
Public vs Private Health Insurance Coverage by Age in Brandon
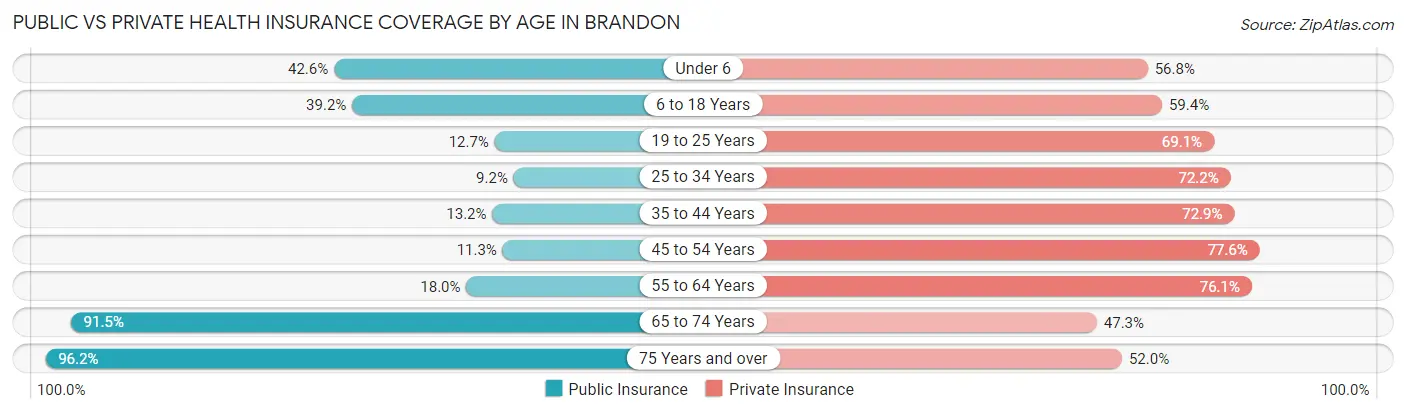
| Age Bracket | Public Insurance | Private Insurance |
| Under 6 | 3,099 (42.6%) | 4,135 (56.8%) |
| 6 to 18 Years | 6,544 (39.2%) | 9,921 (59.4%) |
| 19 to 25 Years | 1,376 (12.7%) | 7,459 (69.1%) |
| 25 to 34 Years | 1,607 (9.2%) | 12,591 (72.2%) |
| 35 to 44 Years | 2,079 (13.2%) | 11,489 (72.9%) |
| 45 to 54 Years | 1,575 (11.3%) | 10,847 (77.6%) |
| 55 to 64 Years | 2,566 (18.0%) | 10,849 (76.1%) |
| 65 to 74 Years | 8,890 (91.4%) | 4,602 (47.3%) |
| 75 Years and over | 5,800 (96.2%) | 3,137 (52.0%) |
| Total | 33,536 (29.9%) | 75,030 (67.0%) |
Disability Status by Sex by Age in Brandon
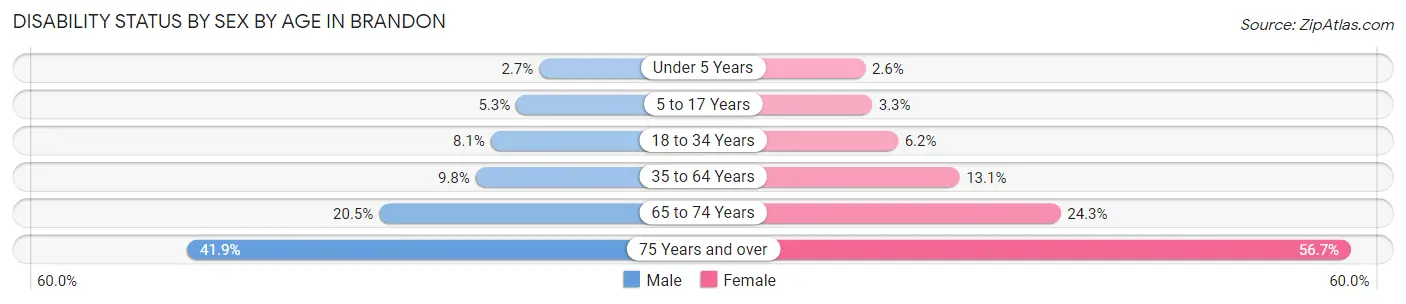
| Age Bracket | Male | Female |
| Under 5 Years | 83 (2.7%) | 72 (2.6%) |
| 5 to 17 Years | 452 (5.3%) | 276 (3.3%) |
| 18 to 34 Years | 1,174 (8.1%) | 935 (6.2%) |
| 35 to 64 Years | 2,092 (9.8%) | 2,955 (13.1%) |
| 65 to 74 Years | 938 (20.5%) | 1,253 (24.3%) |
| 75 Years and over | 964 (41.9%) | 2,115 (56.7%) |
Disability Class by Sex by Age in Brandon
Disability Class: Hearing Difficulty
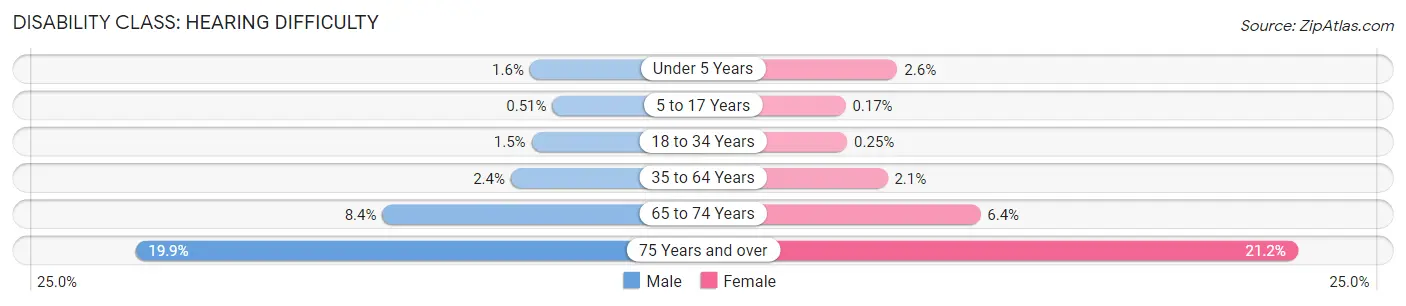
| Age Bracket | Male | Female |
| Under 5 Years | 48 (1.6%) | 72 (2.6%) |
| 5 to 17 Years | 44 (0.5%) | 14 (0.2%) |
| 18 to 34 Years | 214 (1.5%) | 38 (0.3%) |
| 35 to 64 Years | 523 (2.4%) | 479 (2.1%) |
| 65 to 74 Years | 384 (8.4%) | 331 (6.4%) |
| 75 Years and over | 457 (19.9%) | 789 (21.1%) |
Disability Class: Vision Difficulty
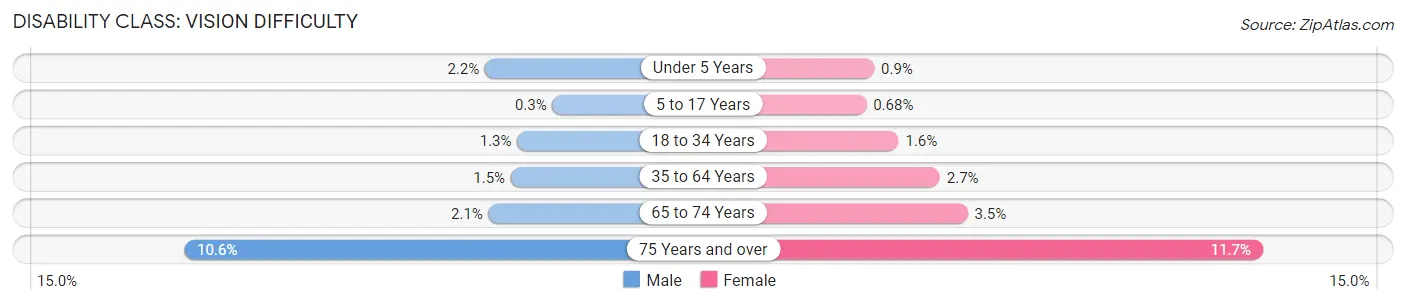
| Age Bracket | Male | Female |
| Under 5 Years | 67 (2.2%) | 25 (0.9%) |
| 5 to 17 Years | 26 (0.3%) | 56 (0.7%) |
| 18 to 34 Years | 186 (1.3%) | 238 (1.6%) |
| 35 to 64 Years | 313 (1.5%) | 616 (2.7%) |
| 65 to 74 Years | 95 (2.1%) | 180 (3.5%) |
| 75 Years and over | 243 (10.6%) | 437 (11.7%) |
Disability Class: Cognitive Difficulty
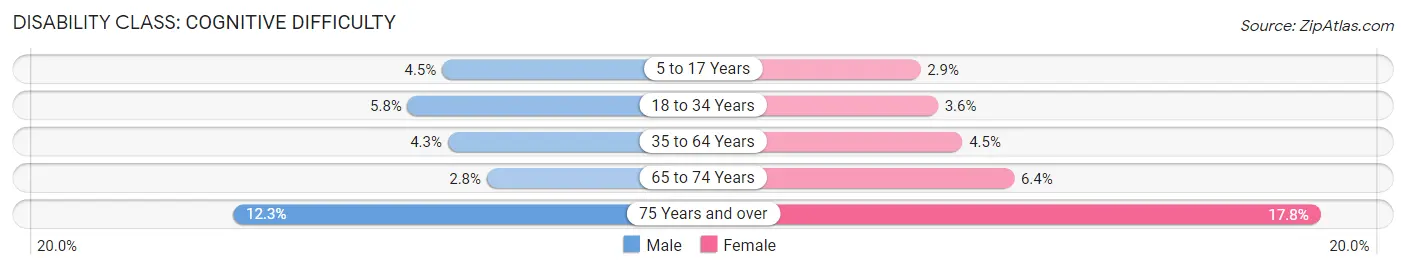
| Age Bracket | Male | Female |
| 5 to 17 Years | 387 (4.5%) | 240 (2.9%) |
| 18 to 34 Years | 838 (5.8%) | 534 (3.6%) |
| 35 to 64 Years | 918 (4.3%) | 1,009 (4.5%) |
| 65 to 74 Years | 130 (2.8%) | 329 (6.4%) |
| 75 Years and over | 282 (12.3%) | 663 (17.8%) |
Disability Class: Ambulatory Difficulty
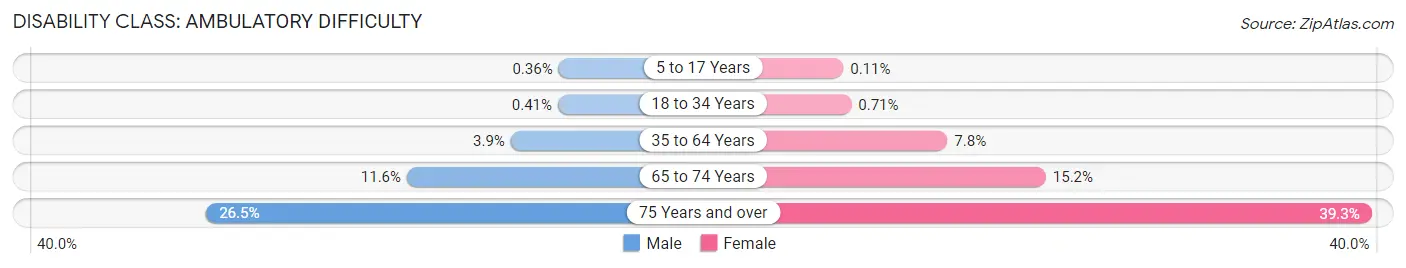
| Age Bracket | Male | Female |
| 5 to 17 Years | 31 (0.4%) | 9 (0.1%) |
| 18 to 34 Years | 59 (0.4%) | 107 (0.7%) |
| 35 to 64 Years | 838 (3.9%) | 1,771 (7.8%) |
| 65 to 74 Years | 531 (11.6%) | 780 (15.1%) |
| 75 Years and over | 610 (26.5%) | 1,467 (39.3%) |
Disability Class: Self-Care Difficulty
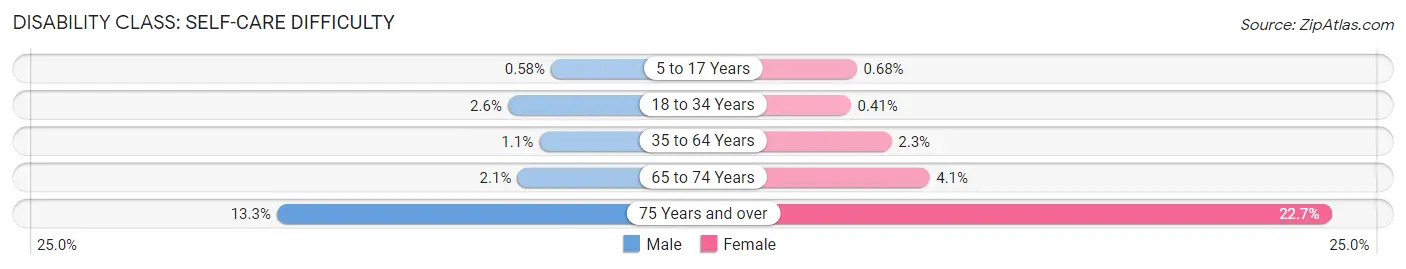
| Age Bracket | Male | Female |
| 5 to 17 Years | 50 (0.6%) | 56 (0.7%) |
| 18 to 34 Years | 374 (2.6%) | 62 (0.4%) |
| 35 to 64 Years | 243 (1.1%) | 519 (2.3%) |
| 65 to 74 Years | 98 (2.1%) | 209 (4.1%) |
| 75 Years and over | 306 (13.3%) | 847 (22.7%) |
Technology Access in Brandon
Computing Device Access in Brandon
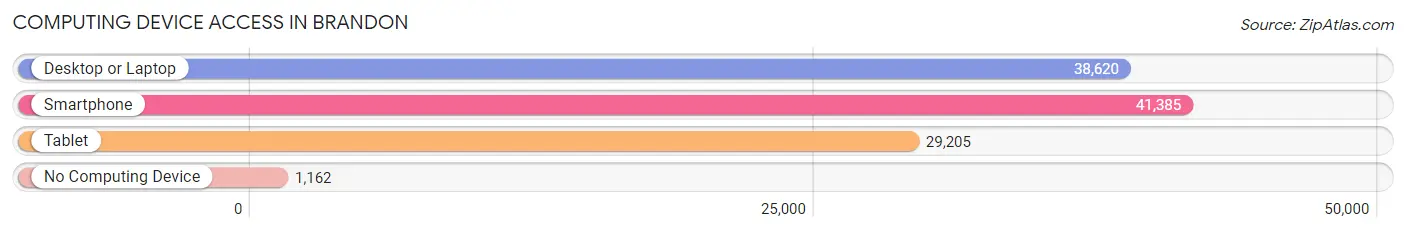
| Device Type | # Households | % Households |
| Desktop or Laptop | 38,620 | 86.1% |
| Smartphone | 41,385 | 92.3% |
| Tablet | 29,205 | 65.1% |
| No Computing Device | 1,162 | 2.6% |
| Total | 44,836 | 100.0% |
Internet Access in Brandon
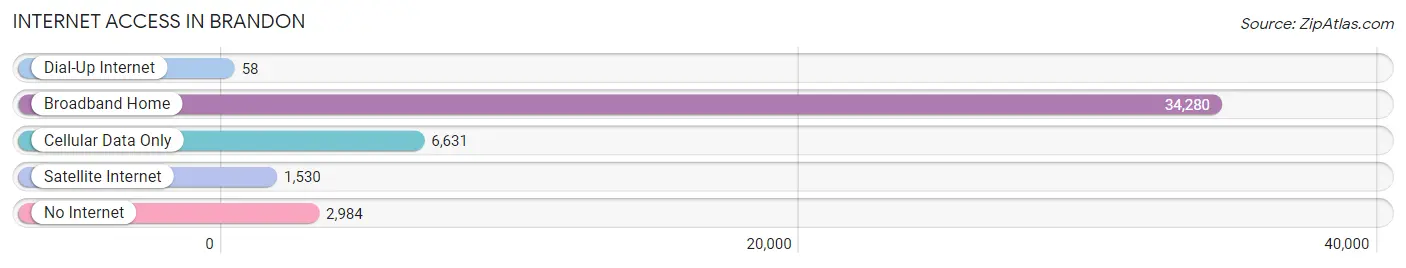
| Internet Type | # Households | % Households |
| Dial-Up Internet | 58 | 0.1% |
| Broadband Home | 34,280 | 76.5% |
| Cellular Data Only | 6,631 | 14.8% |
| Satellite Internet | 1,530 | 3.4% |
| No Internet | 2,984 | 6.7% |
| Total | 44,836 | 100.0% |
Brandon Summary
Brandon, Florida is a census-designated place located in Hillsborough County, Florida. It is located just east of Tampa and is part of the Tampa-St. Petersburg-Clearwater metropolitan area. As of the 2010 census, the population of Brandon was 103,483, making it the third-largest unincorporated community in the state.
Geography
Brandon is located at 27°54'N 82°19'W (27.9000, -82.3167). It is situated in the central part of Hillsborough County, just east of Tampa. The city is bordered by Valrico to the east, Riverview to the south, and Seffner to the west. The city is located in the Tampa Bay area, which is known for its warm climate and abundant sunshine.
The terrain of Brandon is mostly flat, with some rolling hills in the northern part of the city. The city is located on the Hillsborough River, which flows through the city and provides a source of recreation for residents.
Climate
Brandon has a humid subtropical climate, with hot, humid summers and mild winters. The average temperature in the summer is around 90°F (32°C), while the average temperature in the winter is around 70°F (21°C). The city receives an average of 54 inches (137 cm) of rain per year.
Demographics
As of the 2010 census, the population of Brandon was 103,483. The racial makeup of the city was 75.3% White, 14.2% African American, 0.4% Native American, 4.2% Asian, 0.1% Pacific Islander, 3.7% from other races, and 2.1% from two or more races. Hispanic or Latino of any race were 11.3% of the population.
The median income for a household in Brandon was $50,945, and the median income for a family was $60,945. The per capita income for the city was $25,945. About 8.3% of families and 10.7% of the population were below the poverty line, including 15.2% of those under age 18 and 6.2% of those age 65 or over.
Economy
Brandon is home to a variety of businesses, including retail stores, restaurants, and professional services. The city is also home to several large employers, including the Brandon Regional Medical Center, Publix Super Markets, and the University of South Florida.
The city is also home to several shopping centers, including the Brandon Town Center, which is the largest shopping center in the city. The city also has a variety of restaurants, ranging from fast food to fine dining.
Conclusion
Brandon, Florida is a census-designated place located in Hillsborough County, Florida. It is located just east of Tampa and is part of the Tampa-St. Petersburg-Clearwater metropolitan area. As of the 2010 census, the population of Brandon was 103,483, making it the third-largest unincorporated community in the state. The city is located on the Hillsborough River and has a humid subtropical climate. The racial makeup of the city was 75.3% White, 14.2% African American, 0.4% Native American, 4.2% Asian, 0.1% Pacific Islander, 3.7% from other races, and 2.1% from two or more races. The median income for a household in Brandon was $50,945, and the median income for a family was $60,945. The city is home to a variety of businesses, including retail stores, restaurants, and professional services. The city is also home to several large employers, including the Brandon Regional Medical Center, Publix Super Markets, and the University of South Florida.
Common Questions
What is Per Capita Income in Brandon?
Per Capita income in Brandon is $36,952.
What is the Median Family Income in Brandon?
Median Family Income in Brandon is $81,905.
What is the Median Household income in Brandon?
Median Household Income in Brandon is $71,156.
What is Income or Wage Gap in Brandon?
Income or Wage Gap in Brandon is 17.4%.
Women in Brandon earn 82.6 cents for every dollar earned by a man.
What is Family Income Deficit in Brandon?
Family Income Deficit in Brandon is $10,652.
Families that are below poverty line in Brandon earn $10,652 less on average than the poverty threshold level.
What is Inequality or Gini Index in Brandon?
Inequality or Gini Index in Brandon is 0.41.
What is the Total Population of Brandon?
Total Population of Brandon is 114,923.
What is the Total Male Population of Brandon?
Total Male Population of Brandon is 56,528.
What is the Total Female Population of Brandon?
Total Female Population of Brandon is 58,395.
What is the Ratio of Males per 100 Females in Brandon?
There are 96.80 Males per 100 Females in Brandon.
What is the Ratio of Females per 100 Males in Brandon?
There are 103.30 Females per 100 Males in Brandon.
What is the Median Population Age in Brandon?
Median Population Age in Brandon is 37.2 Years.
What is the Average Family Size in Brandon
Average Family Size in Brandon is 3.1 People.
What is the Average Household Size in Brandon
Average Household Size in Brandon is 2.5 People.
How Large is the Labor Force in Brandon?
There are 62,430 People in the Labor Forcein in Brandon.
What is the Percentage of People in the Labor Force in Brandon?
65.7% of People are in the Labor Force in Brandon.
What is the Unemployment Rate in Brandon?
Unemployment Rate in Brandon is 4.6%.