Eastlake, OH Map & Demographics
Eastlake Map
Eastlake Overview
$34,750
PER CAPITA INCOME
$79,044
AVG FAMILY INCOME
$59,648
AVG HOUSEHOLD INCOME
15.4%
WAGE / INCOME GAP [ % ]
84.6¢/ $1
WAGE / INCOME GAP [ $ ]
$8,376
FAMILY INCOME DEFICIT
0.39
INEQUALITY / GINI INDEX
17,625
TOTAL POPULATION
8,696
MALE POPULATION
8,929
FEMALE POPULATION
97.39
MALES / 100 FEMALES
102.68
FEMALES / 100 MALES
46.8
MEDIAN AGE
2.9
AVG FAMILY SIZE
2.2
AVG HOUSEHOLD SIZE
9,669
LABOR FORCE [ PEOPLE ]
63.6%
PERCENT IN LABOR FORCE
5.8%
UNEMPLOYMENT RATE
Eastlake Zip Codes
Eastlake Area Codes
Income in Eastlake
Income Overview in Eastlake
Per Capita Income in Eastlake is $34,750, while median incomes of families and households are $79,044 and $59,648 respectively.
| Characteristic | Number | Measure |
| Per Capita Income | 17,625 | $34,750 |
| Median Family Income | 4,324 | $79,044 |
| Mean Family Income | 4,324 | $92,566 |
| Median Household Income | 8,083 | $59,648 |
| Mean Household Income | 8,083 | $74,843 |
| Income Deficit | 4,324 | $8,376 |
| Wage / Income Gap (%) | 17,625 | 15.42% |
| Wage / Income Gap ($) | 17,625 | 84.58¢ per $1 |
| Gini / Inequality Index | 17,625 | 0.39 |
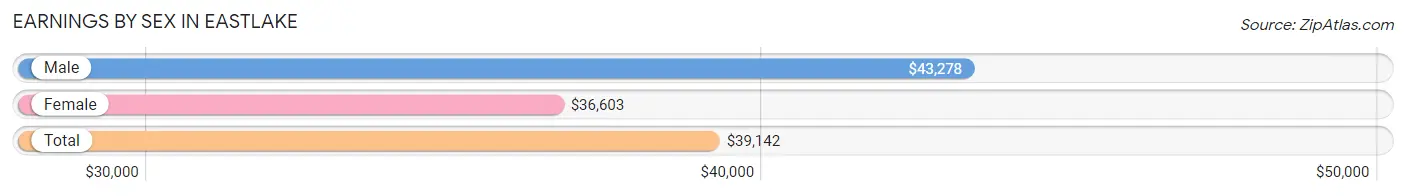
Earnings by Sex in Eastlake
Average Earnings in Eastlake are $39,142, $43,278 for men and $36,603 for women, a difference of 15.4%.
| Sex | Number | Average Earnings |
| Male | 5,384 (54.1%) | $43,278 |
| Female | 4,571 (45.9%) | $36,603 |
| Total | 9,955 (100.0%) | $39,142 |
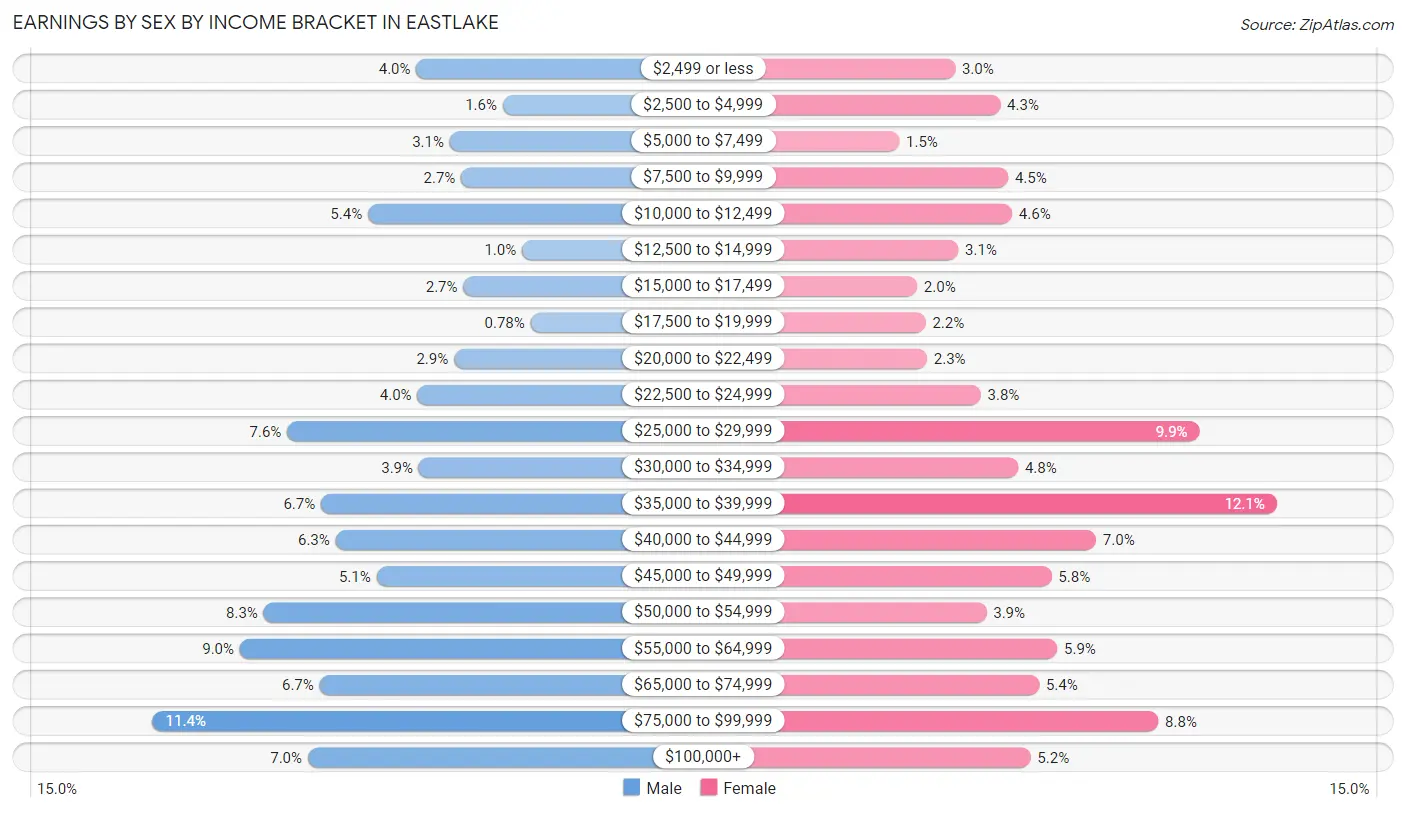
Earnings by Sex by Income Bracket in Eastlake
The most common earnings brackets in Eastlake are $75,000 to $99,999 for men (614 | 11.4%) and $35,000 to $39,999 for women (552 | 12.1%).
| Income | Male | Female |
| $2,499 or less | 215 (4.0%) | 139 (3.0%) |
| $2,500 to $4,999 | 84 (1.6%) | 197 (4.3%) |
| $5,000 to $7,499 | 164 (3.0%) | 67 (1.5%) |
| $7,500 to $9,999 | 147 (2.7%) | 207 (4.5%) |
| $10,000 to $12,499 | 288 (5.3%) | 212 (4.6%) |
| $12,500 to $14,999 | 55 (1.0%) | 143 (3.1%) |
| $15,000 to $17,499 | 144 (2.7%) | 90 (2.0%) |
| $17,500 to $19,999 | 42 (0.8%) | 101 (2.2%) |
| $20,000 to $22,499 | 158 (2.9%) | 103 (2.2%) |
| $22,500 to $24,999 | 213 (4.0%) | 172 (3.8%) |
| $25,000 to $29,999 | 410 (7.6%) | 453 (9.9%) |
| $30,000 to $34,999 | 211 (3.9%) | 220 (4.8%) |
| $35,000 to $39,999 | 359 (6.7%) | 552 (12.1%) |
| $40,000 to $44,999 | 337 (6.3%) | 320 (7.0%) |
| $45,000 to $49,999 | 275 (5.1%) | 263 (5.8%) |
| $50,000 to $54,999 | 446 (8.3%) | 179 (3.9%) |
| $55,000 to $64,999 | 482 (8.9%) | 270 (5.9%) |
| $65,000 to $74,999 | 361 (6.7%) | 247 (5.4%) |
| $75,000 to $99,999 | 614 (11.4%) | 400 (8.7%) |
| $100,000+ | 379 (7.0%) | 236 (5.2%) |
| Total | 5,384 (100.0%) | 4,571 (100.0%) |
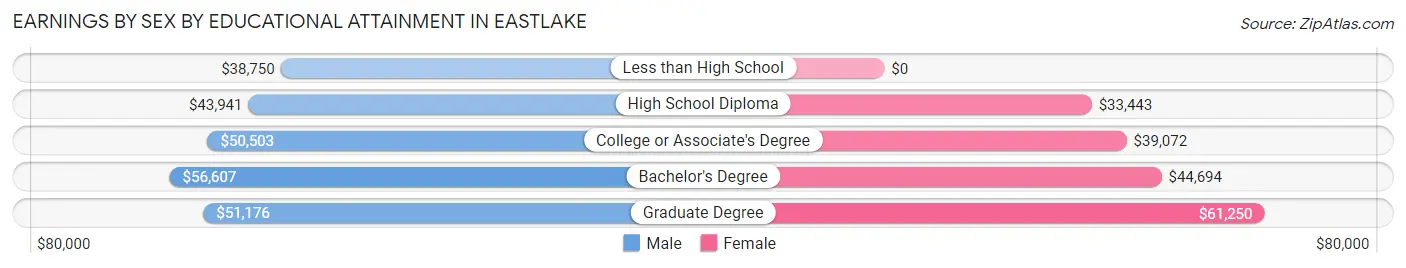
Earnings by Sex by Educational Attainment in Eastlake
Average earnings in Eastlake are $47,476 for men and $39,605 for women, a difference of 16.6%. Men with an educational attainment of bachelor's degree enjoy the highest average annual earnings of $56,607, while those with less than high school education earn the least with $38,750. Women with an educational attainment of graduate degree earn the most with the average annual earnings of $61,250, while those with high school diploma education have the smallest earnings of $33,443.
| Educational Attainment | Male Income | Female Income |
| Less than High School | $38,750 | $0 |
| High School Diploma | $43,941 | $33,443 |
| College or Associate's Degree | $50,503 | $39,072 |
| Bachelor's Degree | $56,607 | $44,694 |
| Graduate Degree | $51,176 | $61,250 |
| Total | $47,476 | $39,605 |
Family Income in Eastlake
Family Income Brackets in Eastlake
According to the Eastlake family income data, there are 925 families falling into the $100,000 to $149,999 income range, which is the most common income bracket and makes up 21.4% of all families. Conversely, the less than $10,000 income bracket is the least frequent group with only 17 families (0.4%) belonging to this category.
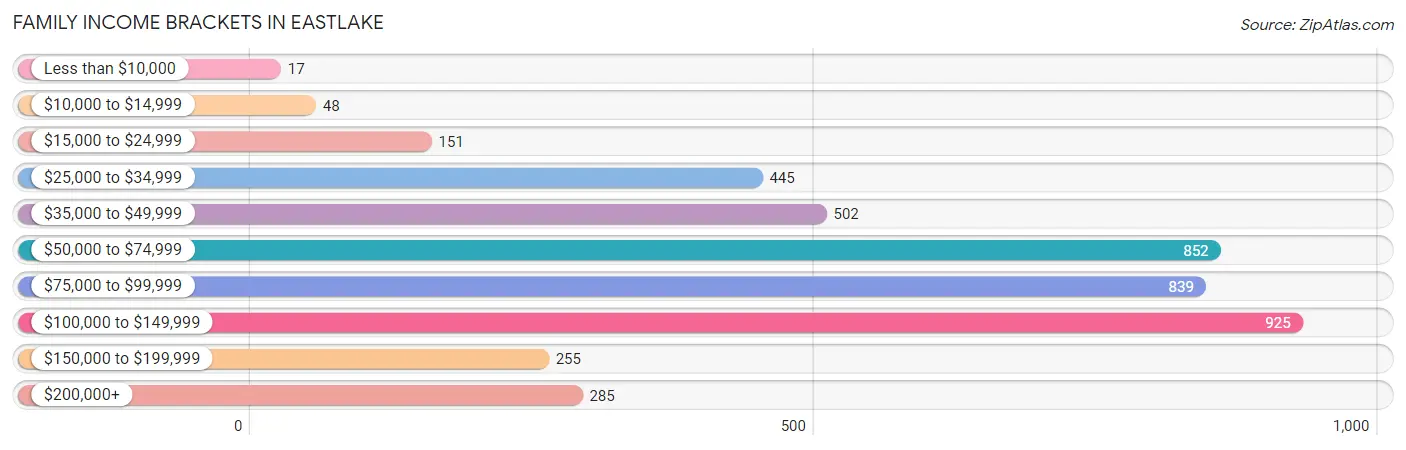
| Income Bracket | # Families | % Families |
| Less than $10,000 | 17 | 0.4% |
| $10,000 to $14,999 | 48 | 1.1% |
| $15,000 to $24,999 | 151 | 3.5% |
| $25,000 to $34,999 | 445 | 10.3% |
| $35,000 to $49,999 | 502 | 11.6% |
| $50,000 to $74,999 | 852 | 19.7% |
| $75,000 to $99,999 | 839 | 19.4% |
| $100,000 to $149,999 | 925 | 21.4% |
| $150,000 to $199,999 | 255 | 5.9% |
| $200,000+ | 285 | 6.6% |
Family Income by Famaliy Size in Eastlake
5-person families (237 | 5.5%) account for the highest median family income in Eastlake with $116,033 per family, while 2-person families (2,444 | 56.5%) have the highest median income of $33,203 per family member.
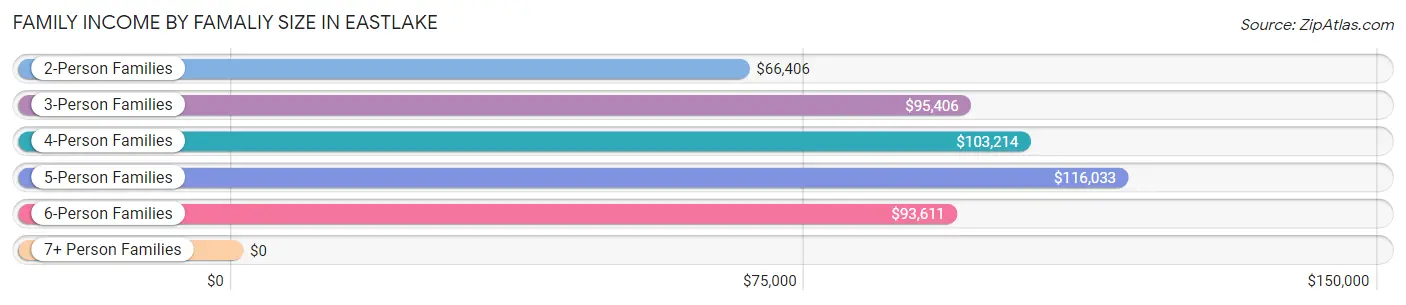
| Income Bracket | # Families | Median Income |
| 2-Person Families | 2,444 (56.5%) | $66,406 |
| 3-Person Families | 743 (17.2%) | $95,406 |
| 4-Person Families | 828 (19.2%) | $103,214 |
| 5-Person Families | 237 (5.5%) | $116,033 |
| 6-Person Families | 72 (1.7%) | $93,611 |
| 7+ Person Families | 0 (0.0%) | $0 |
| Total | 4,324 (100.0%) | $79,044 |
Family Income by Number of Earners in Eastlake
The median family income in Eastlake is $79,044, with families comprising 3+ earners (664) having the highest median family income of $138,125, while families with 1 earner (1,365) have the lowest median family income of $49,053, accounting for 15.4% and 31.6% of families, respectively.
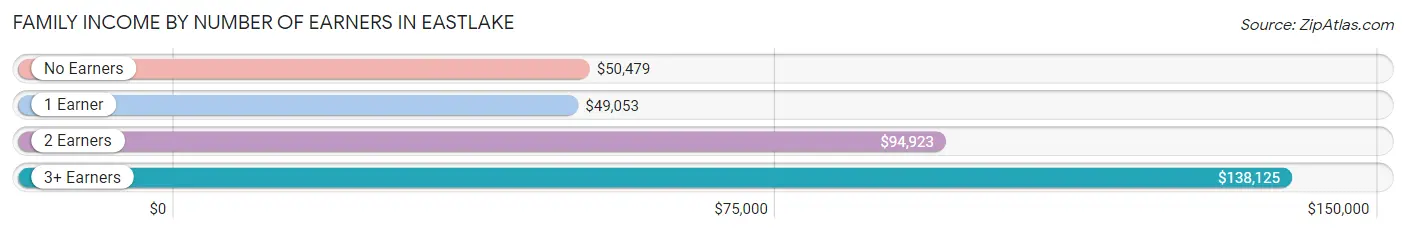
| Number of Earners | # Families | Median Income |
| No Earners | 793 (18.3%) | $50,479 |
| 1 Earner | 1,365 (31.6%) | $49,053 |
| 2 Earners | 1,502 (34.7%) | $94,923 |
| 3+ Earners | 664 (15.4%) | $138,125 |
| Total | 4,324 (100.0%) | $79,044 |
Household Income in Eastlake
Household Income Brackets in Eastlake
With 1,657 households falling in the category, the $50,000 to $74,999 income range is the most frequent in Eastlake, accounting for 20.5% of all households. In contrast, only 210 households (2.6%) fall into the $10,000 to $14,999 income bracket, making it the least populous group.
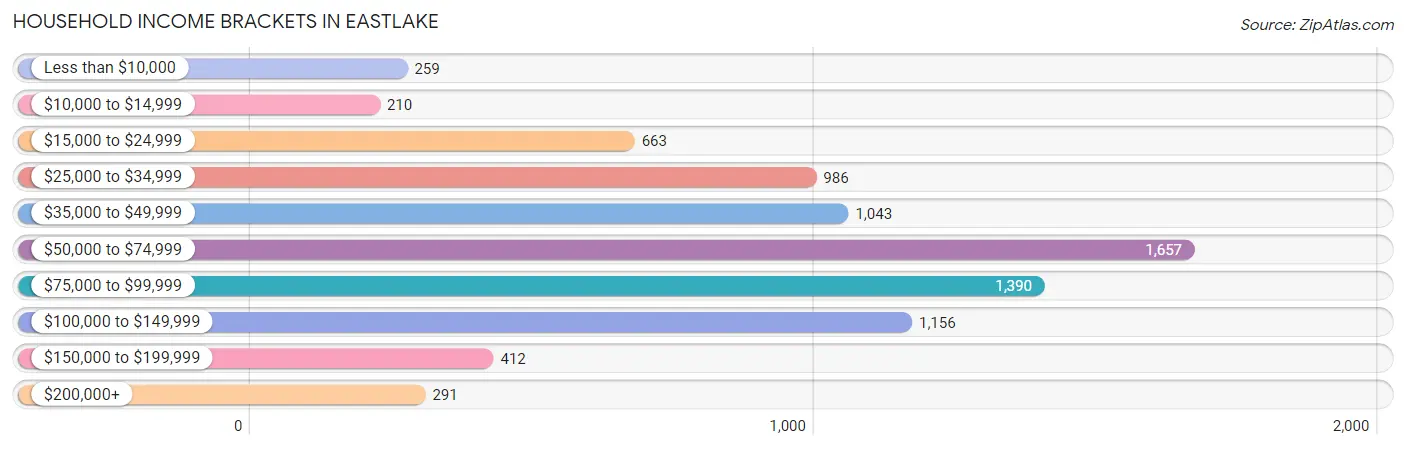
| Income Bracket | # Households | % Households |
| Less than $10,000 | 259 | 3.2% |
| $10,000 to $14,999 | 210 | 2.6% |
| $15,000 to $24,999 | 663 | 8.2% |
| $25,000 to $34,999 | 986 | 12.2% |
| $35,000 to $49,999 | 1,043 | 12.9% |
| $50,000 to $74,999 | 1,657 | 20.5% |
| $75,000 to $99,999 | 1,390 | 17.2% |
| $100,000 to $149,999 | 1,156 | 14.3% |
| $150,000 to $199,999 | 412 | 5.1% |
| $200,000+ | 291 | 3.6% |
Household Income by Householder Age in Eastlake
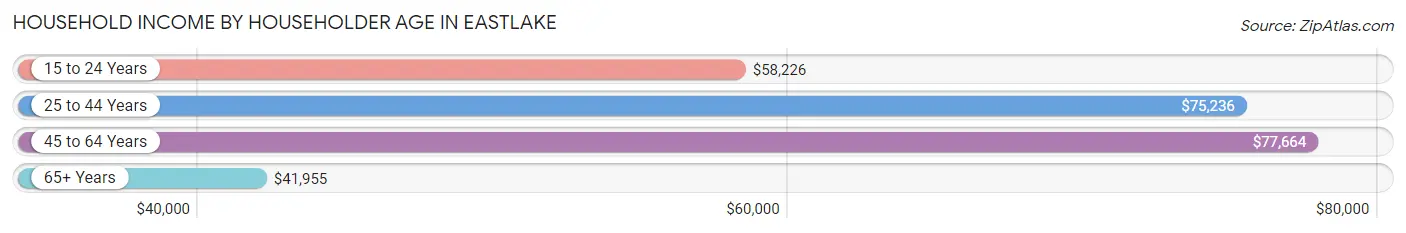
The median household income in Eastlake is $59,648, with the highest median household income of $77,664 found in the 45 to 64 years age bracket for the primary householder. A total of 2,910 households (36.0%) fall into this category. Meanwhile, the 65+ years age bracket for the primary householder has the lowest median household income of $41,955, with 2,990 households (37.0%) in this group.
| Income Bracket | # Households | Median Income |
| 15 to 24 Years | 402 (5.0%) | $58,226 |
| 25 to 44 Years | 1,781 (22.0%) | $75,236 |
| 45 to 64 Years | 2,910 (36.0%) | $77,664 |
| 65+ Years | 2,990 (37.0%) | $41,955 |
| Total | 8,083 (100.0%) | $59,648 |
Poverty in Eastlake
Income Below Poverty by Sex and Age in Eastlake
With 7.4% poverty level for males and 7.6% for females among the residents of Eastlake, 16 and 17 year old males and 18 to 24 year old females are the most vulnerable to poverty, with 95 males (45.2%) and 168 females (21.4%) in their respective age groups living below the poverty level.
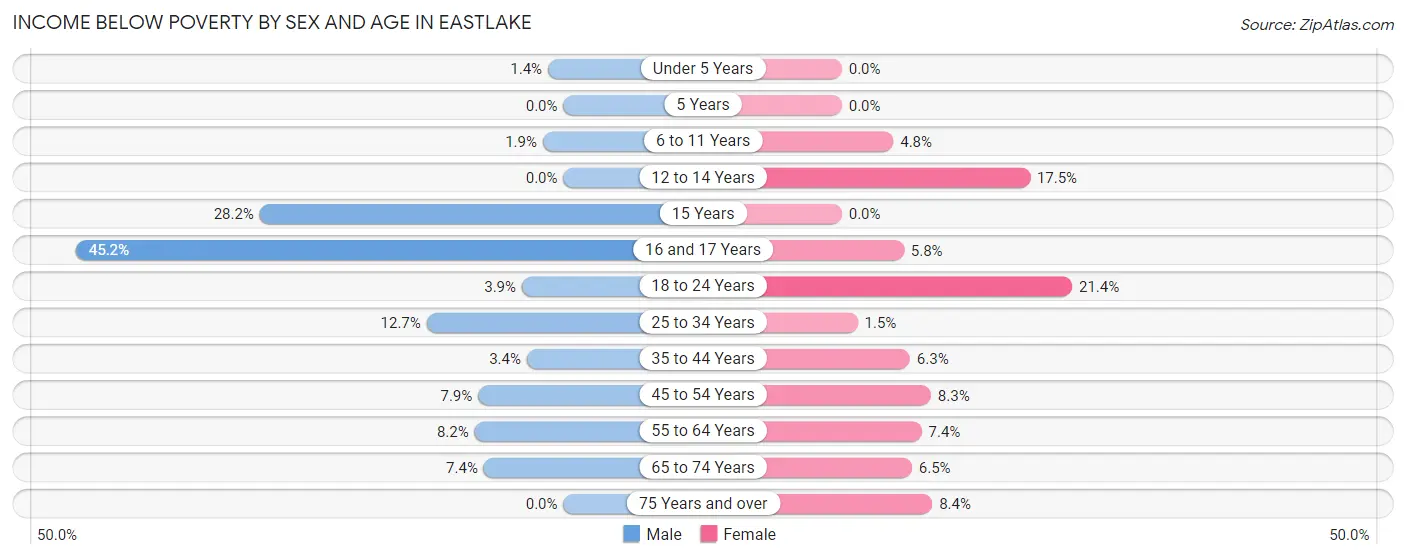
| Age Bracket | Male | Female |
| Under 5 Years | 6 (1.4%) | 0 (0.0%) |
| 5 Years | 0 (0.0%) | 0 (0.0%) |
| 6 to 11 Years | 8 (1.9%) | 23 (4.8%) |
| 12 to 14 Years | 0 (0.0%) | 33 (17.5%) |
| 15 Years | 31 (28.2%) | 0 (0.0%) |
| 16 and 17 Years | 95 (45.2%) | 11 (5.8%) |
| 18 to 24 Years | 36 (3.8%) | 168 (21.4%) |
| 25 to 34 Years | 170 (12.7%) | 15 (1.5%) |
| 35 to 44 Years | 22 (3.4%) | 59 (6.3%) |
| 45 to 54 Years | 81 (7.9%) | 104 (8.3%) |
| 55 to 64 Years | 113 (8.2%) | 90 (7.4%) |
| 65 to 74 Years | 83 (7.4%) | 87 (6.5%) |
| 75 Years and over | 0 (0.0%) | 85 (8.4%) |
| Total | 645 (7.4%) | 675 (7.6%) |
Income Above Poverty by Sex and Age in Eastlake
According to the poverty statistics in Eastlake, males aged 5 years and females aged under 5 years are the age groups that are most secure financially, with 100.0% of males and 100.0% of females in these age groups living above the poverty line.
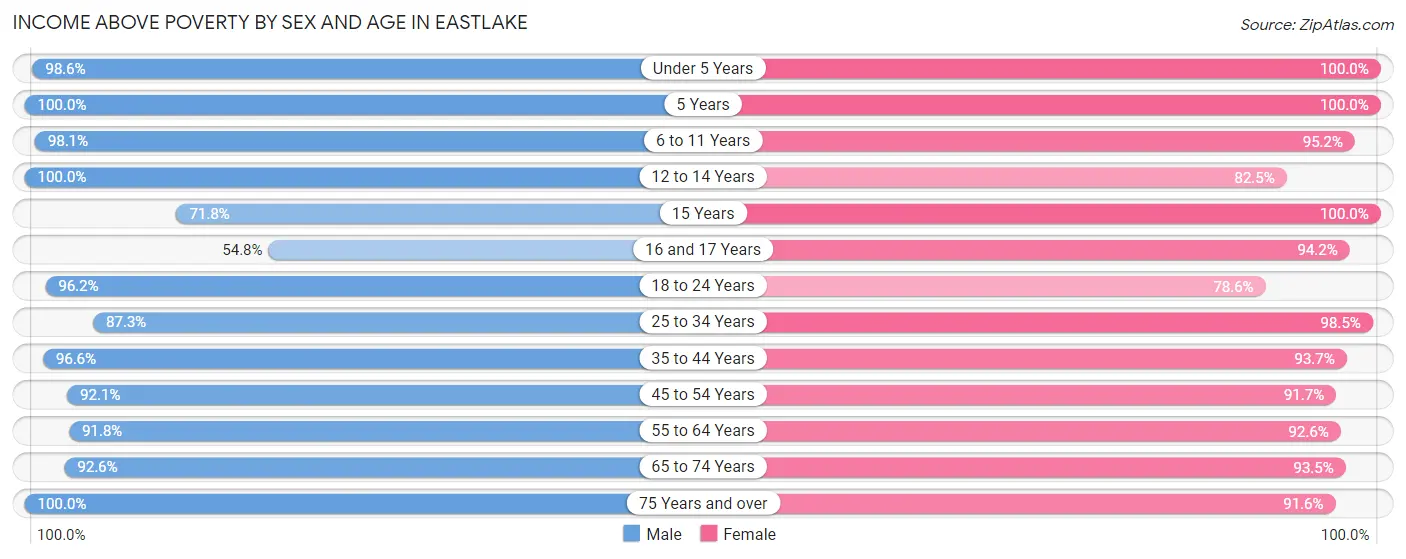
| Age Bracket | Male | Female |
| Under 5 Years | 413 (98.6%) | 322 (100.0%) |
| 5 Years | 58 (100.0%) | 29 (100.0%) |
| 6 to 11 Years | 410 (98.1%) | 458 (95.2%) |
| 12 to 14 Years | 219 (100.0%) | 156 (82.5%) |
| 15 Years | 79 (71.8%) | 72 (100.0%) |
| 16 and 17 Years | 115 (54.8%) | 180 (94.2%) |
| 18 to 24 Years | 898 (96.2%) | 618 (78.6%) |
| 25 to 34 Years | 1,170 (87.3%) | 1,008 (98.5%) |
| 35 to 44 Years | 627 (96.6%) | 874 (93.7%) |
| 45 to 54 Years | 943 (92.1%) | 1,153 (91.7%) |
| 55 to 64 Years | 1,259 (91.8%) | 1,124 (92.6%) |
| 65 to 74 Years | 1,040 (92.6%) | 1,252 (93.5%) |
| 75 Years and over | 781 (100.0%) | 928 (91.6%) |
| Total | 8,012 (92.5%) | 8,174 (92.4%) |
Income Below Poverty Among Married-Couple Families in Eastlake
The poverty statistics for married-couple families in Eastlake show that 1.6% or 48 of the total 3,021 families live below the poverty line. Families with 1 or 2 children have the highest poverty rate of 2.0%, comprising of 16 families. On the other hand, families with 3 or 4 children have the lowest poverty rate of 0.0%, which includes 0 families.
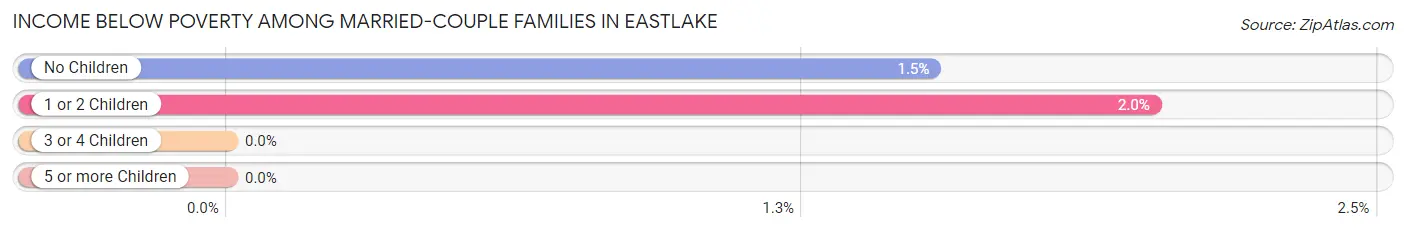
| Children | Above Poverty | Below Poverty |
| No Children | 2,055 (98.5%) | 32 (1.5%) |
| 1 or 2 Children | 780 (98.0%) | 16 (2.0%) |
| 3 or 4 Children | 138 (100.0%) | 0 (0.0%) |
| 5 or more Children | 0 (0.0%) | 0 (0.0%) |
| Total | 2,973 (98.4%) | 48 (1.6%) |
Income Below Poverty Among Single-Parent Households in Eastlake
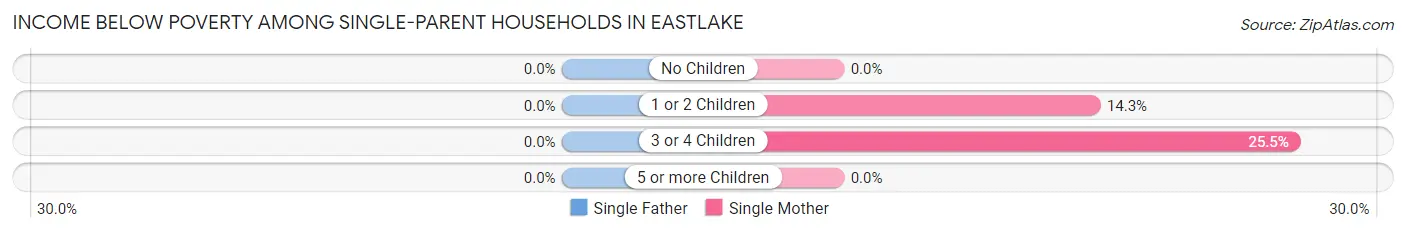
| Children | Single Father | Single Mother |
| No Children | 0 (0.0%) | 0 (0.0%) |
| 1 or 2 Children | 0 (0.0%) | 63 (14.3%) |
| 3 or 4 Children | 0 (0.0%) | 12 (25.5%) |
| 5 or more Children | 0 (0.0%) | 0 (0.0%) |
| Total | 0 (0.0%) | 75 (7.9%) |
Income Below Poverty Among Married-Couple vs Single-Parent Households in Eastlake
The poverty data for Eastlake shows that 48 of the married-couple family households (1.6%) and 75 of the single-parent households (5.8%) are living below the poverty level. Within the married-couple family households, those with 1 or 2 children have the highest poverty rate, with 16 households (2.0%) falling below the poverty line. Among the single-parent households, those with 3 or 4 children have the highest poverty rate, with 12 household (22.6%) living below poverty.
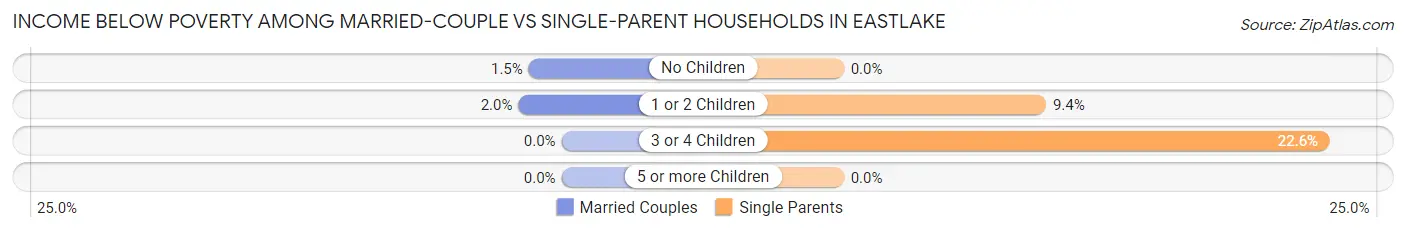
| Children | Married-Couple Families | Single-Parent Households |
| No Children | 32 (1.5%) | 0 (0.0%) |
| 1 or 2 Children | 16 (2.0%) | 63 (9.4%) |
| 3 or 4 Children | 0 (0.0%) | 12 (22.6%) |
| 5 or more Children | 0 (0.0%) | 0 (0.0%) |
| Total | 48 (1.6%) | 75 (5.8%) |
Race in Eastlake
The most populous races in Eastlake are White / Caucasian (15,650 | 88.8%), Two or more Races (951 | 5.4%), and Black / African American (674 | 3.8%).
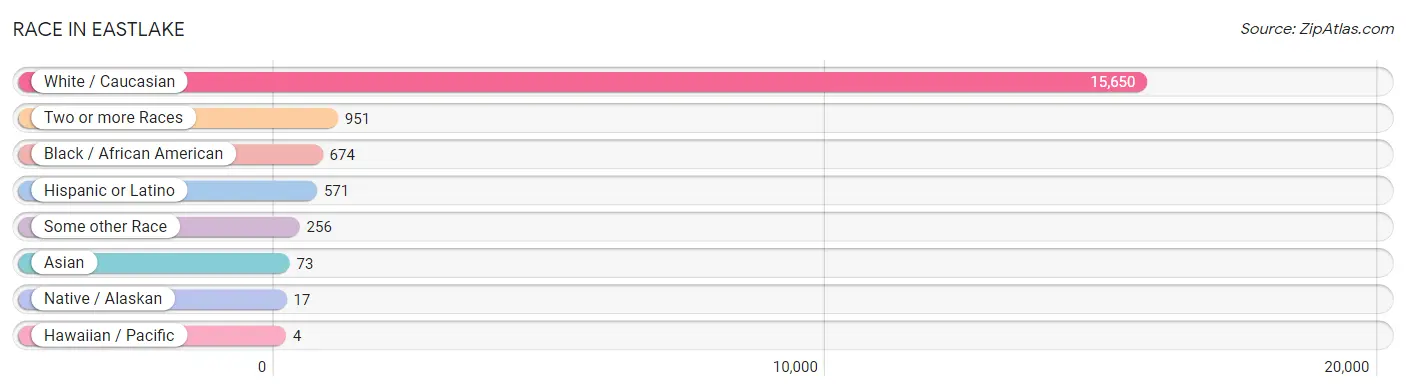
| Race | # Population | % Population |
| Asian | 73 | 0.4% |
| Black / African American | 674 | 3.8% |
| Hawaiian / Pacific | 4 | 0.0% |
| Hispanic or Latino | 571 | 3.2% |
| Native / Alaskan | 17 | 0.1% |
| White / Caucasian | 15,650 | 88.8% |
| Two or more Races | 951 | 5.4% |
| Some other Race | 256 | 1.5% |
| Total | 17,625 | 100.0% |
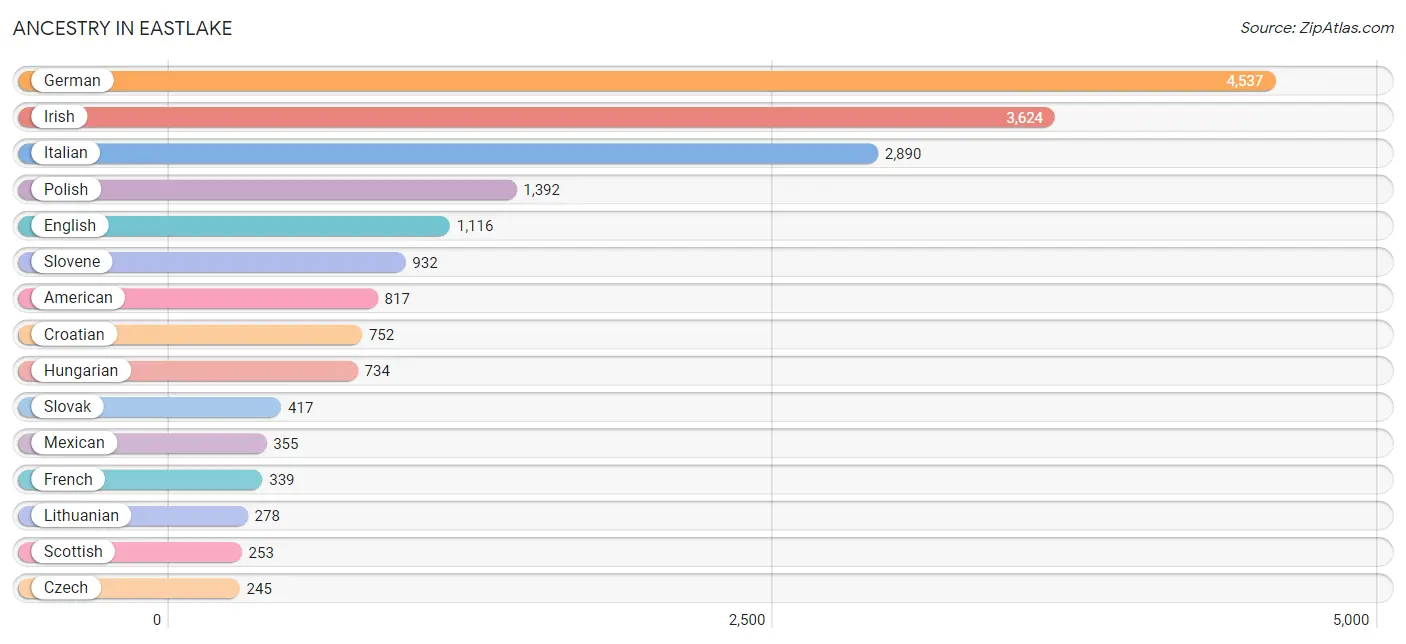
Ancestry in Eastlake
The most populous ancestries reported in Eastlake are German (4,537 | 25.7%), Irish (3,624 | 20.6%), Italian (2,890 | 16.4%), Polish (1,392 | 7.9%), and English (1,116 | 6.3%), together accounting for 76.9% of all Eastlake residents.
| Ancestry | # Population | % Population |
| African | 13 | 0.1% |
| American | 817 | 4.6% |
| Apache | 44 | 0.3% |
| Arab | 94 | 0.5% |
| Austrian | 54 | 0.3% |
| Blackfeet | 5 | 0.0% |
| British | 19 | 0.1% |
| Bulgarian | 14 | 0.1% |
| Celtic | 7 | 0.0% |
| Cherokee | 25 | 0.1% |
| Croatian | 752 | 4.3% |
| Cuban | 18 | 0.1% |
| Czech | 245 | 1.4% |
| Czechoslovakian | 21 | 0.1% |
| Dutch | 186 | 1.1% |
| Eastern European | 40 | 0.2% |
| English | 1,116 | 6.3% |
| European | 164 | 0.9% |
| Finnish | 118 | 0.7% |
| French | 339 | 1.9% |
| French Canadian | 50 | 0.3% |
| German | 4,537 | 25.7% |
| Greek | 37 | 0.2% |
| Guamanian / Chamorro | 4 | 0.0% |
| Hungarian | 734 | 4.2% |
| Indian (Asian) | 19 | 0.1% |
| Irish | 3,624 | 20.6% |
| Italian | 2,890 | 16.4% |
| Korean | 34 | 0.2% |
| Lebanese | 84 | 0.5% |
| Lithuanian | 278 | 1.6% |
| Mexican | 355 | 2.0% |
| Mexican American Indian | 13 | 0.1% |
| Northern European | 10 | 0.1% |
| Norwegian | 43 | 0.2% |
| Pennsylvania German | 10 | 0.1% |
| Polish | 1,392 | 7.9% |
| Puerto Rican | 198 | 1.1% |
| Romanian | 37 | 0.2% |
| Russian | 125 | 0.7% |
| Scandinavian | 15 | 0.1% |
| Scotch-Irish | 146 | 0.8% |
| Scottish | 253 | 1.4% |
| Serbian | 79 | 0.4% |
| Sioux | 2 | 0.0% |
| Slavic | 22 | 0.1% |
| Slovak | 417 | 2.4% |
| Slovene | 932 | 5.3% |
| Sri Lankan | 9 | 0.1% |
| Subsaharan African | 30 | 0.2% |
| Swedish | 161 | 0.9% |
| Syrian | 10 | 0.1% |
| Thai | 38 | 0.2% |
| Ukrainian | 31 | 0.2% |
| Welsh | 134 | 0.8% |
| Yugoslavian | 56 | 0.3% | View All 56 Rows |
Immigrants in Eastlake
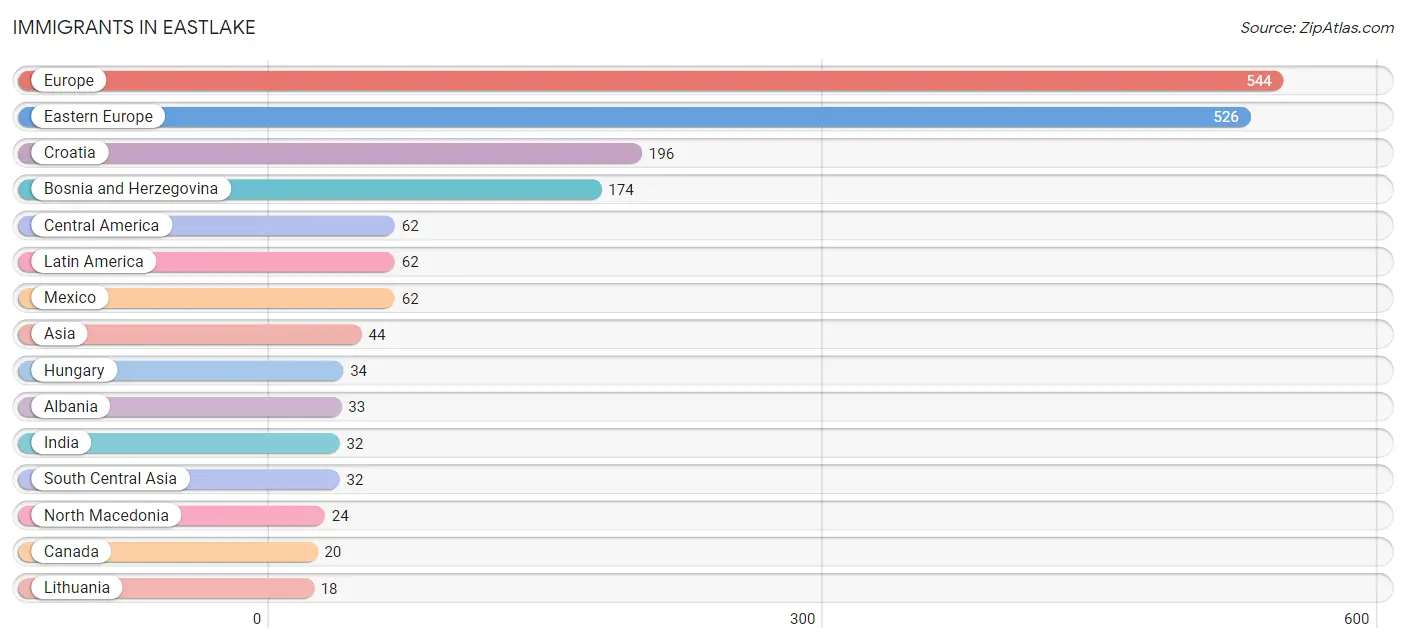
The most numerous immigrant groups reported in Eastlake came from Europe (544 | 3.1%), Eastern Europe (526 | 3.0%), Croatia (196 | 1.1%), Bosnia and Herzegovina (174 | 1.0%), and Central America (62 | 0.4%), together accounting for 8.5% of all Eastlake residents.
| Immigration Origin | # Population | % Population |
| Africa | 9 | 0.1% |
| Albania | 33 | 0.2% |
| Asia | 44 | 0.3% |
| Austria | 11 | 0.1% |
| Bosnia and Herzegovina | 174 | 1.0% |
| Canada | 20 | 0.1% |
| Central America | 62 | 0.4% |
| Croatia | 196 | 1.1% |
| Eastern Europe | 526 | 3.0% |
| Europe | 544 | 3.1% |
| Ghana | 9 | 0.1% |
| Hungary | 34 | 0.2% |
| India | 32 | 0.2% |
| Latin America | 62 | 0.4% |
| Lithuania | 18 | 0.1% |
| Mexico | 62 | 0.4% |
| North Macedonia | 24 | 0.1% |
| Northern Europe | 7 | 0.0% |
| Philippines | 12 | 0.1% |
| Poland | 9 | 0.1% |
| Russia | 11 | 0.1% |
| South Central Asia | 32 | 0.2% |
| South Eastern Asia | 12 | 0.1% |
| Western Africa | 9 | 0.1% |
| Western Europe | 11 | 0.1% | View All 25 Rows |
Sex and Age in Eastlake
Sex and Age in Eastlake
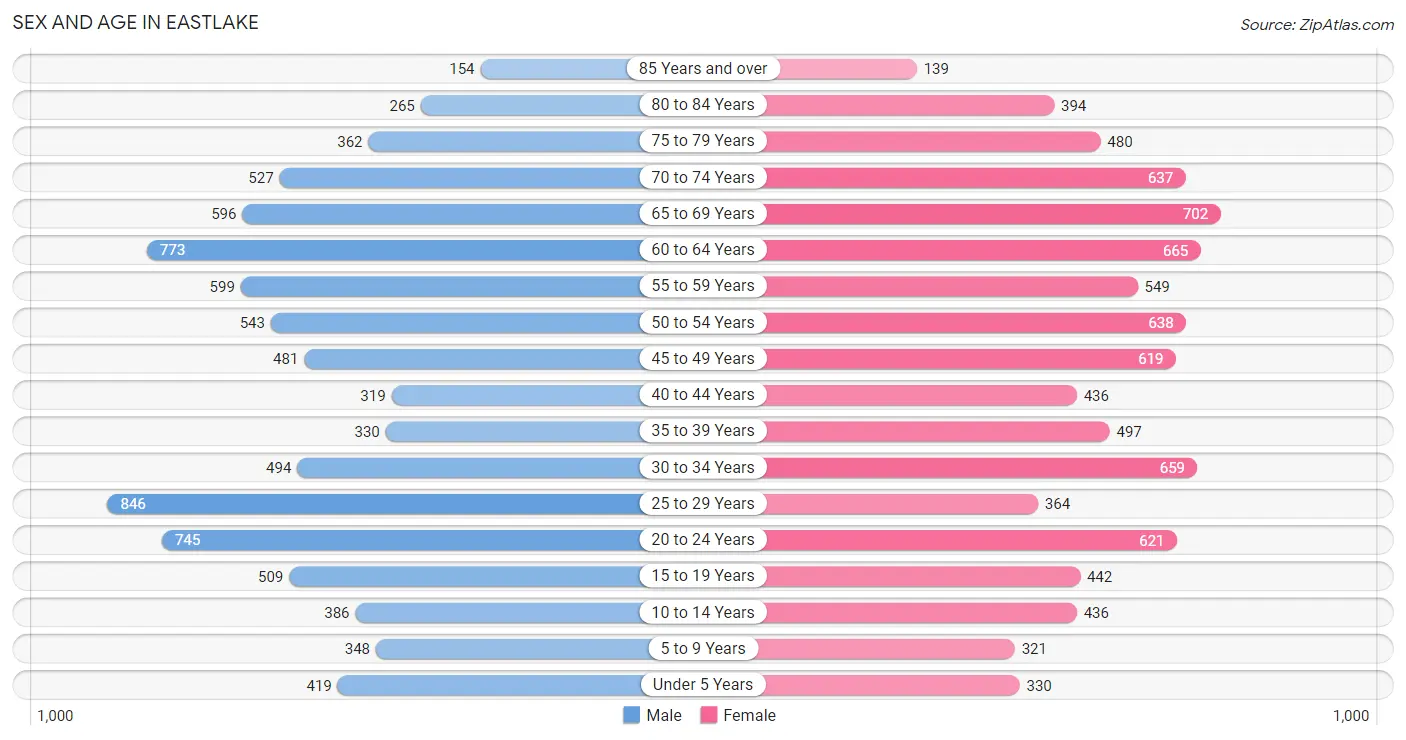
The most populous age groups in Eastlake are 25 to 29 Years (846 | 9.7%) for men and 65 to 69 Years (702 | 7.9%) for women.
| Age Bracket | Male | Female |
| Under 5 Years | 419 (4.8%) | 330 (3.7%) |
| 5 to 9 Years | 348 (4.0%) | 321 (3.6%) |
| 10 to 14 Years | 386 (4.4%) | 436 (4.9%) |
| 15 to 19 Years | 509 (5.9%) | 442 (5.0%) |
| 20 to 24 Years | 745 (8.6%) | 621 (7.0%) |
| 25 to 29 Years | 846 (9.7%) | 364 (4.1%) |
| 30 to 34 Years | 494 (5.7%) | 659 (7.4%) |
| 35 to 39 Years | 330 (3.8%) | 497 (5.6%) |
| 40 to 44 Years | 319 (3.7%) | 436 (4.9%) |
| 45 to 49 Years | 481 (5.5%) | 619 (6.9%) |
| 50 to 54 Years | 543 (6.2%) | 638 (7.1%) |
| 55 to 59 Years | 599 (6.9%) | 549 (6.1%) |
| 60 to 64 Years | 773 (8.9%) | 665 (7.4%) |
| 65 to 69 Years | 596 (6.9%) | 702 (7.9%) |
| 70 to 74 Years | 527 (6.1%) | 637 (7.1%) |
| 75 to 79 Years | 362 (4.2%) | 480 (5.4%) |
| 80 to 84 Years | 265 (3.0%) | 394 (4.4%) |
| 85 Years and over | 154 (1.8%) | 139 (1.6%) |
| Total | 8,696 (100.0%) | 8,929 (100.0%) |
Families and Households in Eastlake
Median Family Size in Eastlake
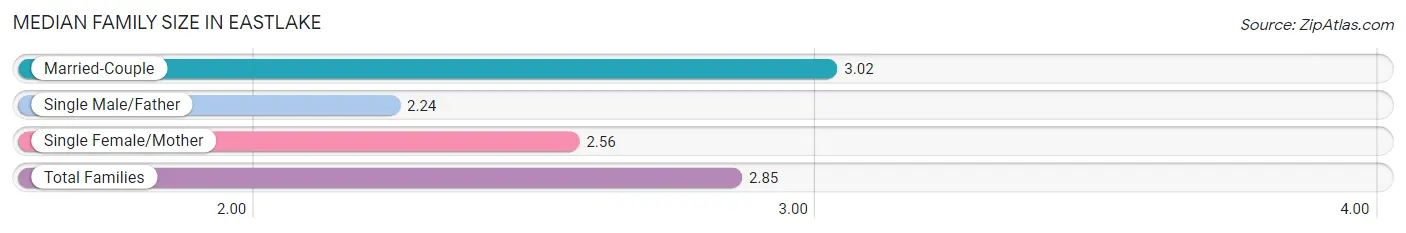
The median family size in Eastlake is 2.85 persons per family, with married-couple families (3,021 | 69.9%) accounting for the largest median family size of 3.02 persons per family. On the other hand, single male/father families (357 | 8.3%) represent the smallest median family size with 2.24 persons per family.
| Family Type | # Families | Family Size |
| Married-Couple | 3,021 (69.9%) | 3.02 |
| Single Male/Father | 357 (8.3%) | 2.24 |
| Single Female/Mother | 946 (21.9%) | 2.56 |
| Total Families | 4,324 (100.0%) | 2.85 |
Median Household Size in Eastlake
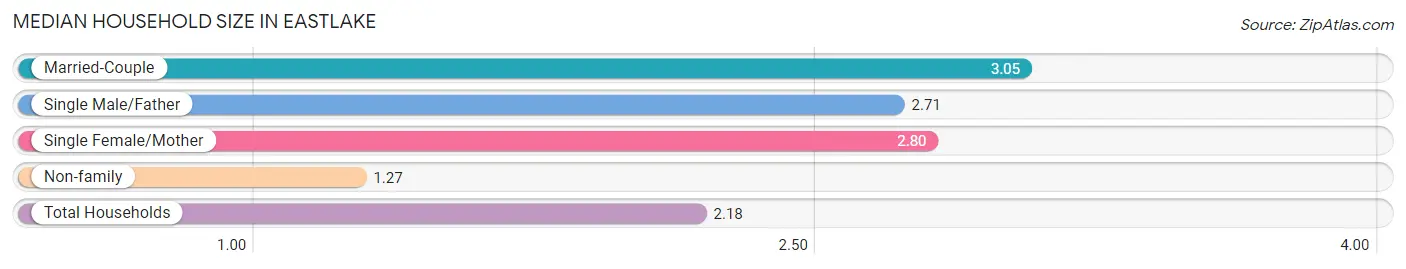
The median household size in Eastlake is 2.18 persons per household, with married-couple households (3,021 | 37.4%) accounting for the largest median household size of 3.05 persons per household. non-family households (3,759 | 46.5%) represent the smallest median household size with 1.27 persons per household.
| Household Type | # Households | Household Size |
| Married-Couple | 3,021 (37.4%) | 3.05 |
| Single Male/Father | 357 (4.4%) | 2.71 |
| Single Female/Mother | 946 (11.7%) | 2.80 |
| Non-family | 3,759 (46.5%) | 1.27 |
| Total Households | 8,083 (100.0%) | 2.18 |
Household Size by Marriage Status in Eastlake
Out of a total of 8,083 households in Eastlake, 4,324 (53.5%) are family households, while 3,759 (46.5%) are nonfamily households. The most numerous type of family households are 2-person households, comprising 2,252, and the most common type of nonfamily households are 1-person households, comprising 2,852.
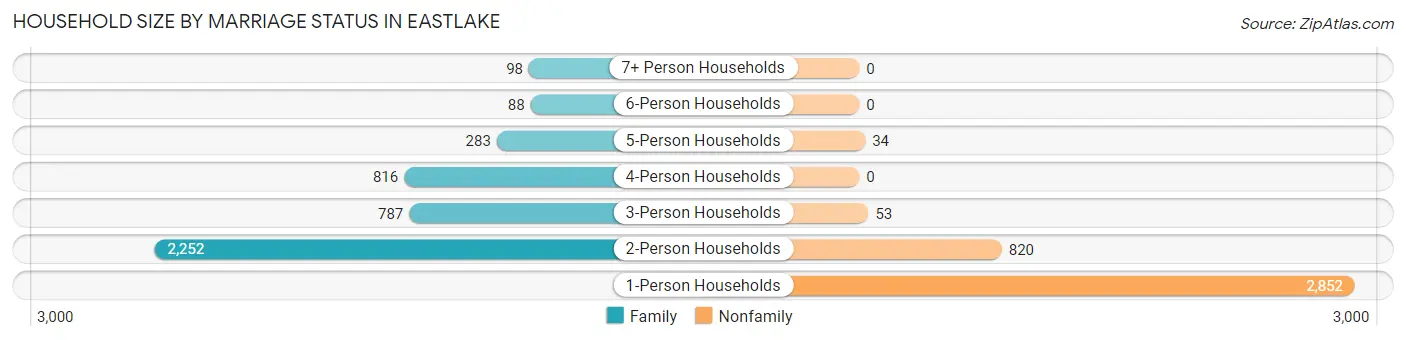
| Household Size | Family Households | Nonfamily Households |
| 1-Person Households | - | 2,852 (35.3%) |
| 2-Person Households | 2,252 (27.9%) | 820 (10.1%) |
| 3-Person Households | 787 (9.7%) | 53 (0.7%) |
| 4-Person Households | 816 (10.1%) | 0 (0.0%) |
| 5-Person Households | 283 (3.5%) | 34 (0.4%) |
| 6-Person Households | 88 (1.1%) | 0 (0.0%) |
| 7+ Person Households | 98 (1.2%) | 0 (0.0%) |
| Total | 4,324 (53.5%) | 3,759 (46.5%) |
Female Fertility in Eastlake
Fertility by Age in Eastlake
Average fertility rate in Eastlake is 41.0 births per 1,000 women. Women in the age bracket of 20 to 34 years have the highest fertility rate with 85.0 births per 1,000 women. Women in the age bracket of 20 to 34 years acount for 88.5% of all women with births.
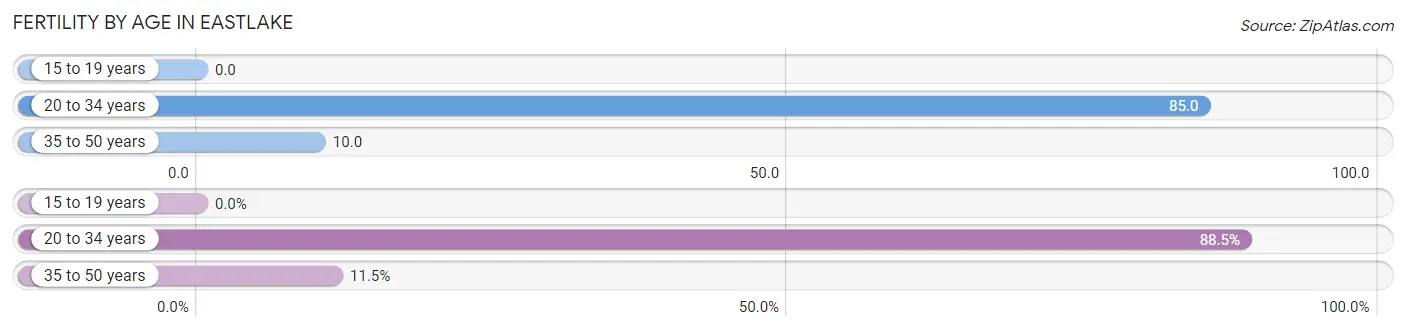
| Age Bracket | Women with Births | Births / 1,000 Women |
| 15 to 19 years | 0 (0.0%) | 0.0 |
| 20 to 34 years | 139 (88.5%) | 85.0 |
| 35 to 50 years | 18 (11.5%) | 10.0 |
| Total | 157 (100.0%) | 41.0 |
Fertility by Age by Marriage Status in Eastlake
70.7% of women with births (157) in Eastlake are married. The highest percentage of unmarried women with births falls into 35 to 50 years age bracket with 55.6% of them unmarried at the time of birth, while the lowest percentage of unmarried women with births belong to 20 to 34 years age bracket with 25.9% of them unmarried.
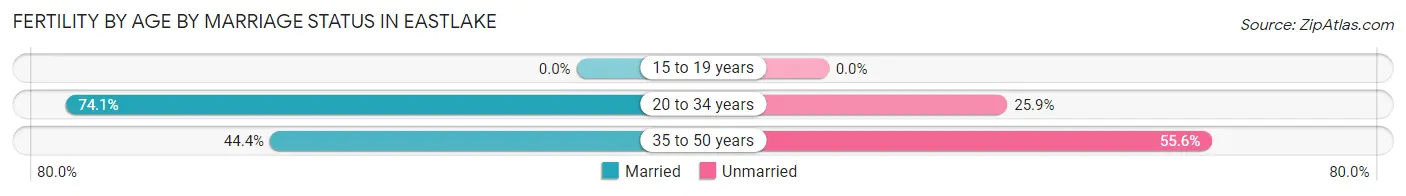
| Age Bracket | Married | Unmarried |
| 15 to 19 years | 0 (0.0%) | 0 (0.0%) |
| 20 to 34 years | 103 (74.1%) | 36 (25.9%) |
| 35 to 50 years | 8 (44.4%) | 10 (55.6%) |
| Total | 111 (70.7%) | 46 (29.3%) |
Fertility by Education in Eastlake
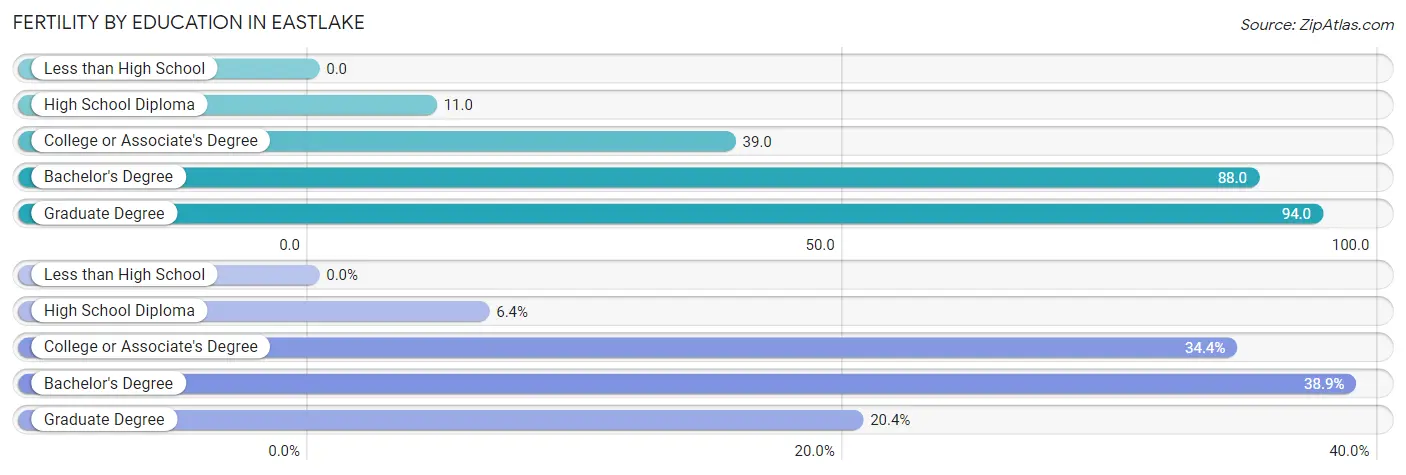
| Educational Attainment | Women with Births | Births / 1,000 Women |
| Less than High School | 0 (0.0%) | 0.0 |
| High School Diploma | 10 (6.4%) | 11.0 |
| College or Associate's Degree | 54 (34.4%) | 39.0 |
| Bachelor's Degree | 61 (38.9%) | 88.0 |
| Graduate Degree | 32 (20.4%) | 94.0 |
| Total | 157 (100.0%) | 41.0 |
Fertility by Education by Marriage Status in Eastlake
29.3% of women with births in Eastlake are unmarried. Women with the educational attainment of bachelor's degree are most likely to be married with 100.0% of them married at childbirth, while women with the educational attainment of high school diploma are least likely to be married with 100.0% of them unmarried at childbirth.
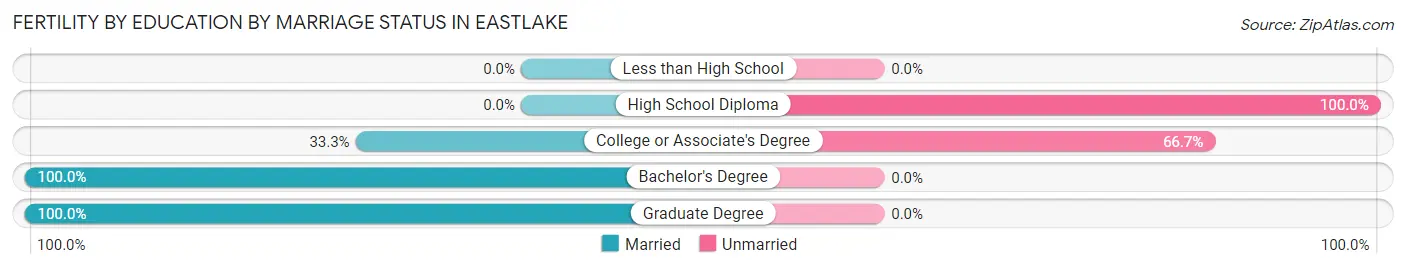
| Educational Attainment | Married | Unmarried |
| Less than High School | 0 (0.0%) | 0 (0.0%) |
| High School Diploma | 0 (0.0%) | 10 (100.0%) |
| College or Associate's Degree | 18 (33.3%) | 36 (66.7%) |
| Bachelor's Degree | 61 (100.0%) | 0 (0.0%) |
| Graduate Degree | 32 (100.0%) | 0 (0.0%) |
| Total | 111 (70.7%) | 46 (29.3%) |
Employment Characteristics in Eastlake
Employment by Class of Employer in Eastlake
Among the 8,901 employed individuals in Eastlake, private company employees (7,199 | 80.9%), not-for-profit organizations (601 | 6.8%), and local government employees (443 | 5.0%) make up the most common classes of employment.
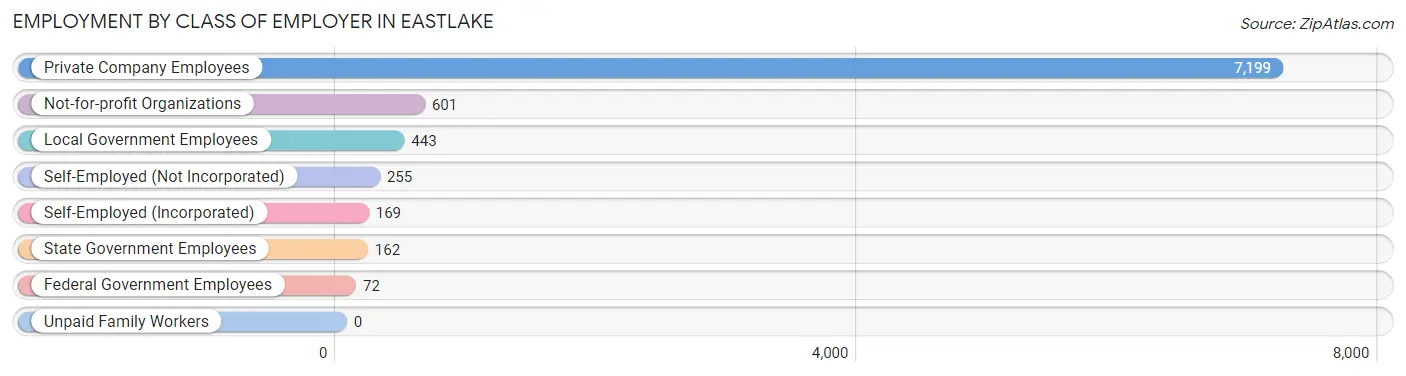
| Employer Class | # Employees | % Employees |
| Private Company Employees | 7,199 | 80.9% |
| Self-Employed (Incorporated) | 169 | 1.9% |
| Self-Employed (Not Incorporated) | 255 | 2.9% |
| Not-for-profit Organizations | 601 | 6.8% |
| Local Government Employees | 443 | 5.0% |
| State Government Employees | 162 | 1.8% |
| Federal Government Employees | 72 | 0.8% |
| Unpaid Family Workers | 0 | 0.0% |
| Total | 8,901 | 100.0% |
Employment Status by Age in Eastlake
According to the labor force statistics for Eastlake, out of the total population over 16 years of age (15,203), 63.6% or 9,669 individuals are in the labor force, with 5.8% or 561 of them unemployed. The age group with the highest labor force participation rate is 25 to 29 years, with 94.5% or 1,143 individuals in the labor force. Within the labor force, the 65 to 74 years age range has the highest percentage of unemployed individuals, with 21.7% or 149 of them being unemployed.
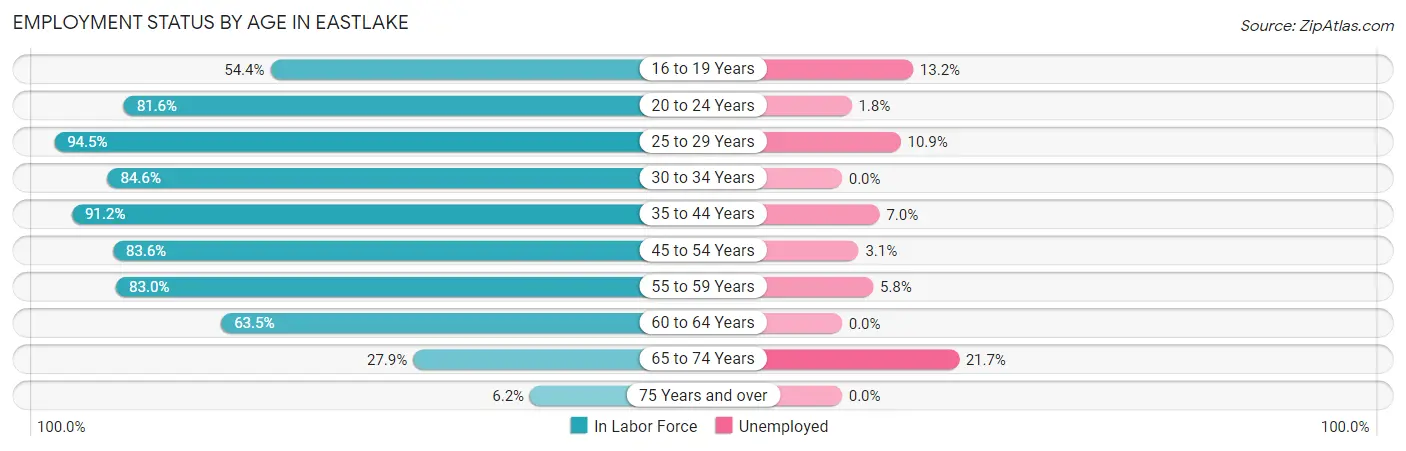
| Age Bracket | In Labor Force | Unemployed |
| 16 to 19 Years | 418 (54.4%) | 55 (13.2%) |
| 20 to 24 Years | 1,115 (81.6%) | 20 (1.8%) |
| 25 to 29 Years | 1,143 (94.5%) | 125 (10.9%) |
| 30 to 34 Years | 975 (84.6%) | 0 (0.0%) |
| 35 to 44 Years | 1,443 (91.2%) | 101 (7.0%) |
| 45 to 54 Years | 1,907 (83.6%) | 59 (3.1%) |
| 55 to 59 Years | 953 (83.0%) | 55 (5.8%) |
| 60 to 64 Years | 913 (63.5%) | 0 (0.0%) |
| 65 to 74 Years | 687 (27.9%) | 149 (21.7%) |
| 75 Years and over | 111 (6.2%) | 0 (0.0%) |
| Total | 9,669 (63.6%) | 561 (5.8%) |
Employment Status by Educational Attainment in Eastlake
According to labor force statistics for Eastlake, 83.2% of individuals (7,332) out of the total population between 25 and 64 years of age (8,812) are in the labor force, with 4.6% or 337 of them being unemployed. The group with the highest labor force participation rate are those with the educational attainment of college / associate degree, with 86.5% or 2,446 individuals in the labor force. Within the labor force, individuals with less than high school education have the highest percentage of unemployment, with 10.5% or 30 of them being unemployed.
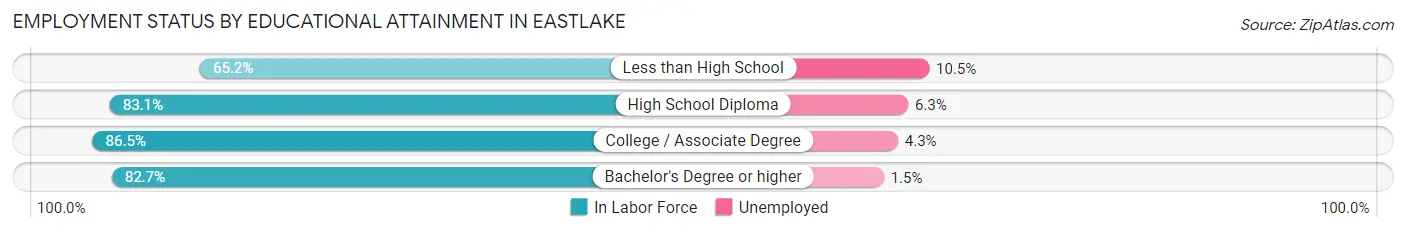
| Educational Attainment | In Labor Force | Unemployed |
| Less than High School | 285 (65.2%) | 46 (10.5%) |
| High School Diploma | 2,842 (83.1%) | 215 (6.3%) |
| College / Associate Degree | 2,446 (86.5%) | 122 (4.3%) |
| Bachelor's Degree or higher | 1,759 (82.7%) | 32 (1.5%) |
| Total | 7,332 (83.2%) | 405 (4.6%) |
Employment Occupations by Sex in Eastlake
Management, Business, Science and Arts Occupations
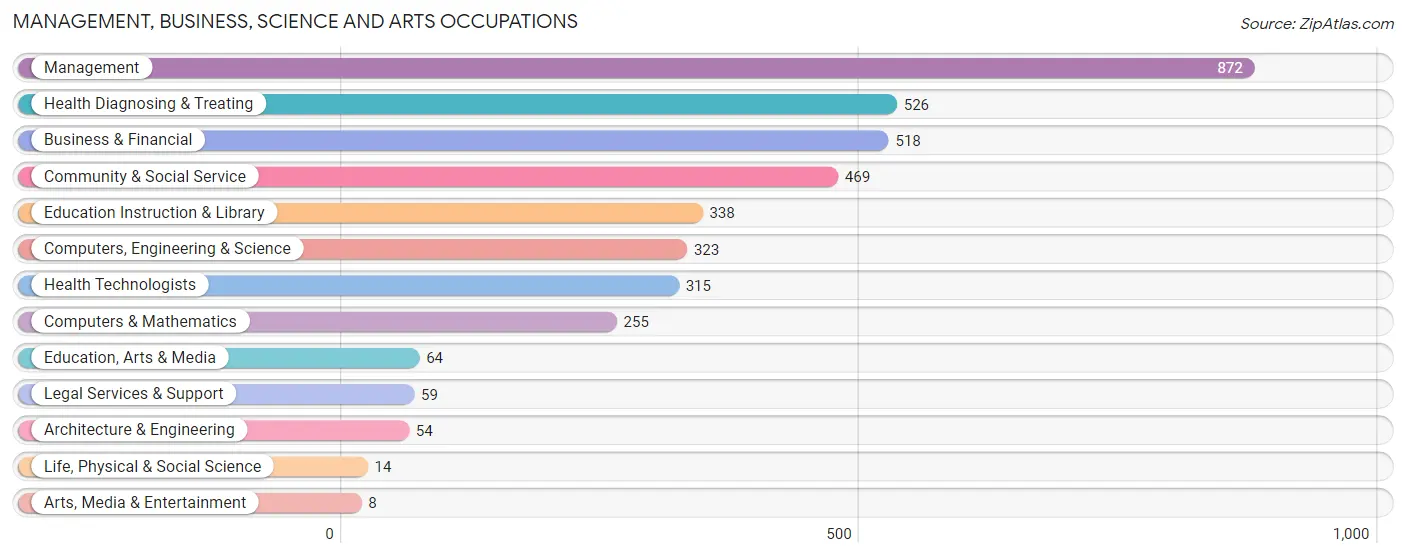
The most common Management, Business, Science and Arts occupations in Eastlake are Management (872 | 9.6%), Health Diagnosing & Treating (526 | 5.8%), Business & Financial (518 | 5.7%), Community & Social Service (469 | 5.1%), and Education Instruction & Library (338 | 3.7%).
Management, Business, Science and Arts Occupations by Sex
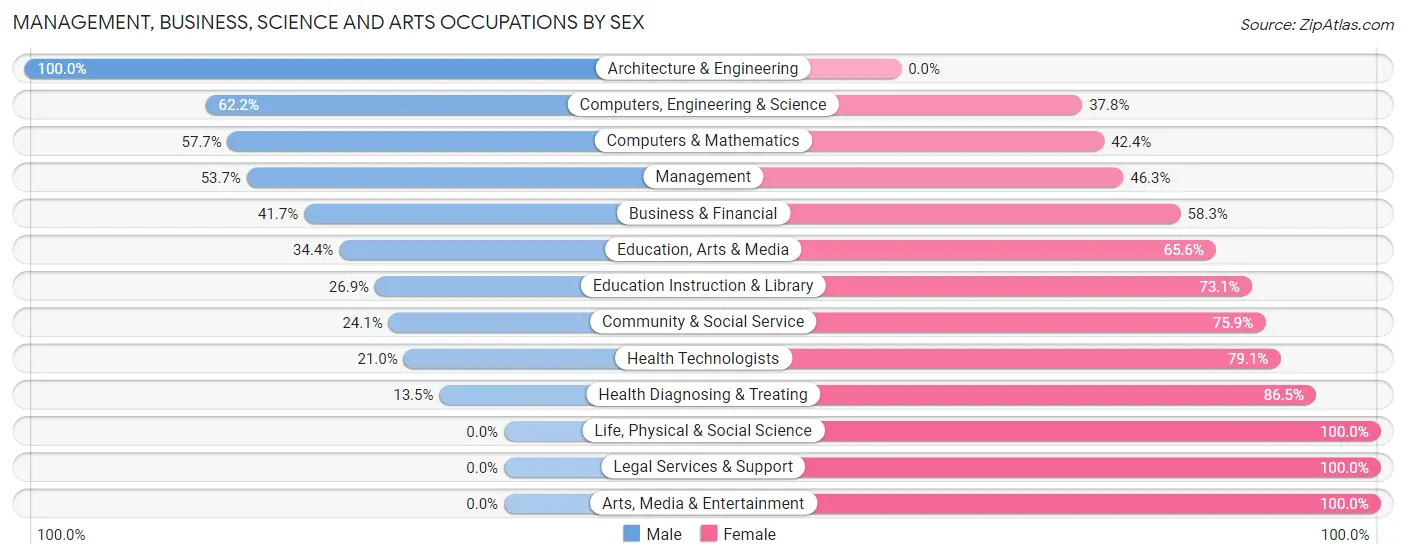
Within the Management, Business, Science and Arts occupations in Eastlake, the most male-oriented occupations are Architecture & Engineering (100.0%), Computers, Engineering & Science (62.2%), and Computers & Mathematics (57.7%), while the most female-oriented occupations are Life, Physical & Social Science (100.0%), Legal Services & Support (100.0%), and Arts, Media & Entertainment (100.0%).
| Occupation | Male | Female |
| Management | 468 (53.7%) | 404 (46.3%) |
| Business & Financial | 216 (41.7%) | 302 (58.3%) |
| Computers, Engineering & Science | 201 (62.2%) | 122 (37.8%) |
| Computers & Mathematics | 147 (57.7%) | 108 (42.3%) |
| Architecture & Engineering | 54 (100.0%) | 0 (0.0%) |
| Life, Physical & Social Science | 0 (0.0%) | 14 (100.0%) |
| Community & Social Service | 113 (24.1%) | 356 (75.9%) |
| Education, Arts & Media | 22 (34.4%) | 42 (65.6%) |
| Legal Services & Support | 0 (0.0%) | 59 (100.0%) |
| Education Instruction & Library | 91 (26.9%) | 247 (73.1%) |
| Arts, Media & Entertainment | 0 (0.0%) | 8 (100.0%) |
| Health Diagnosing & Treating | 71 (13.5%) | 455 (86.5%) |
| Health Technologists | 66 (20.9%) | 249 (79.0%) |
| Total (Category) | 1,069 (39.5%) | 1,639 (60.5%) |
| Total (Overall) | 4,814 (52.9%) | 4,288 (47.1%) |
Services Occupations
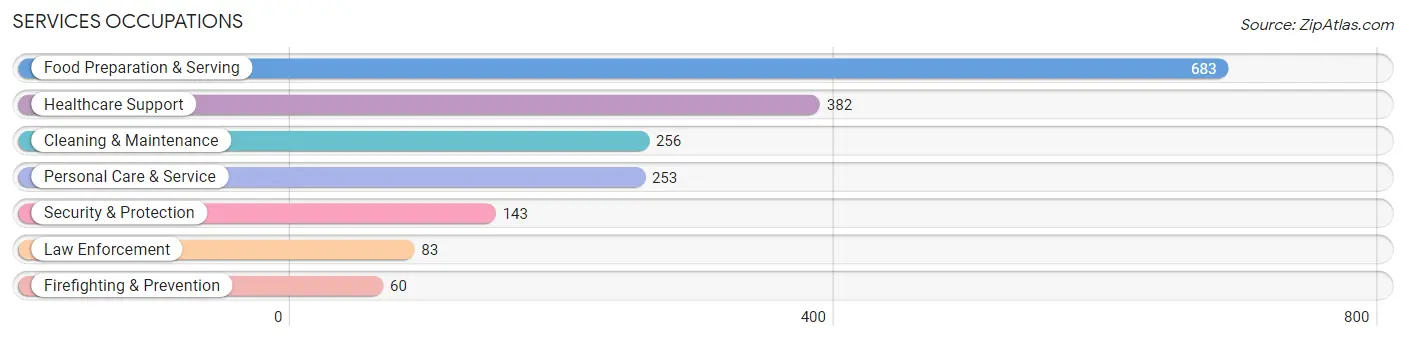
The most common Services occupations in Eastlake are Food Preparation & Serving (683 | 7.5%), Healthcare Support (382 | 4.2%), Cleaning & Maintenance (256 | 2.8%), Personal Care & Service (253 | 2.8%), and Security & Protection (143 | 1.6%).
Services Occupations by Sex
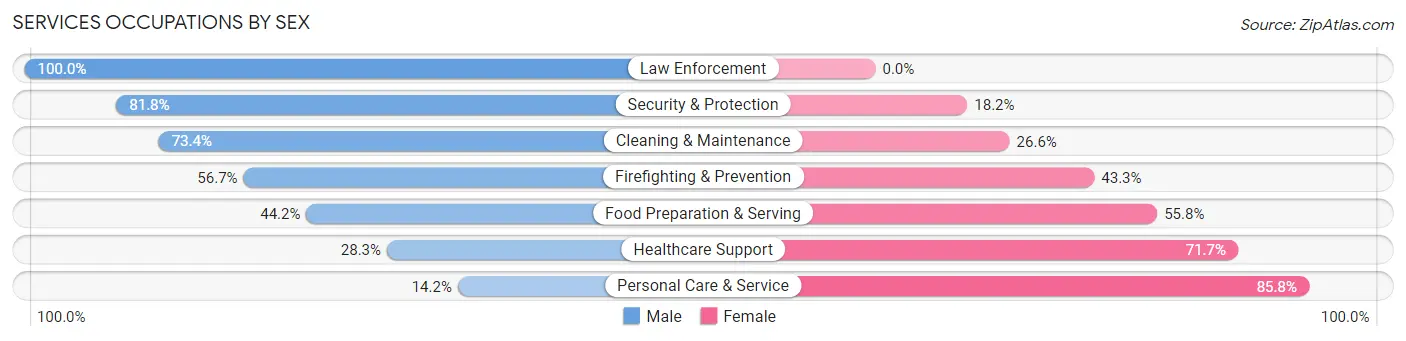
Within the Services occupations in Eastlake, the most male-oriented occupations are Law Enforcement (100.0%), Security & Protection (81.8%), and Cleaning & Maintenance (73.4%), while the most female-oriented occupations are Personal Care & Service (85.8%), Healthcare Support (71.7%), and Food Preparation & Serving (55.8%).
| Occupation | Male | Female |
| Healthcare Support | 108 (28.3%) | 274 (71.7%) |
| Security & Protection | 117 (81.8%) | 26 (18.2%) |
| Firefighting & Prevention | 34 (56.7%) | 26 (43.3%) |
| Law Enforcement | 83 (100.0%) | 0 (0.0%) |
| Food Preparation & Serving | 302 (44.2%) | 381 (55.8%) |
| Cleaning & Maintenance | 188 (73.4%) | 68 (26.6%) |
| Personal Care & Service | 36 (14.2%) | 217 (85.8%) |
| Total (Category) | 751 (43.7%) | 966 (56.3%) |
| Total (Overall) | 4,814 (52.9%) | 4,288 (47.1%) |
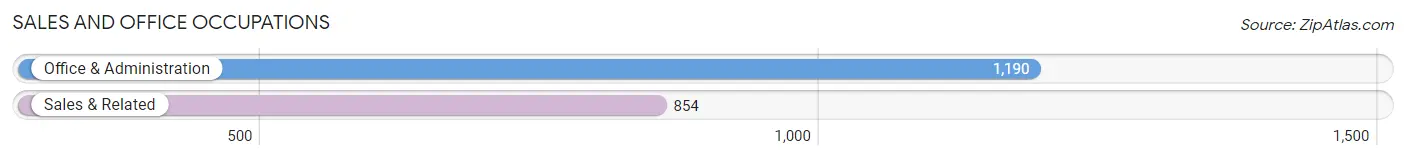
Sales and Office Occupations
The most common Sales and Office occupations in Eastlake are Office & Administration (1,190 | 13.1%), and Sales & Related (854 | 9.4%).
Sales and Office Occupations by Sex
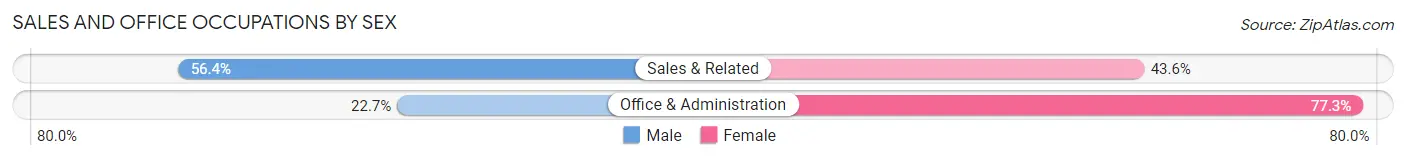
| Occupation | Male | Female |
| Sales & Related | 482 (56.4%) | 372 (43.6%) |
| Office & Administration | 270 (22.7%) | 920 (77.3%) |
| Total (Category) | 752 (36.8%) | 1,292 (63.2%) |
| Total (Overall) | 4,814 (52.9%) | 4,288 (47.1%) |
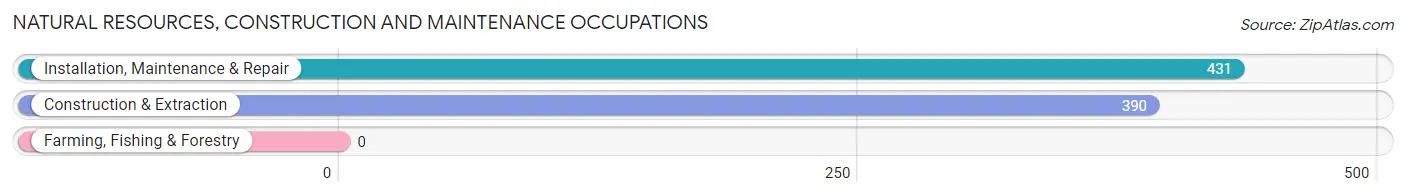
Natural Resources, Construction and Maintenance Occupations
The most common Natural Resources, Construction and Maintenance occupations in Eastlake are Installation, Maintenance & Repair (431 | 4.7%), and Construction & Extraction (390 | 4.3%).
Natural Resources, Construction and Maintenance Occupations by Sex
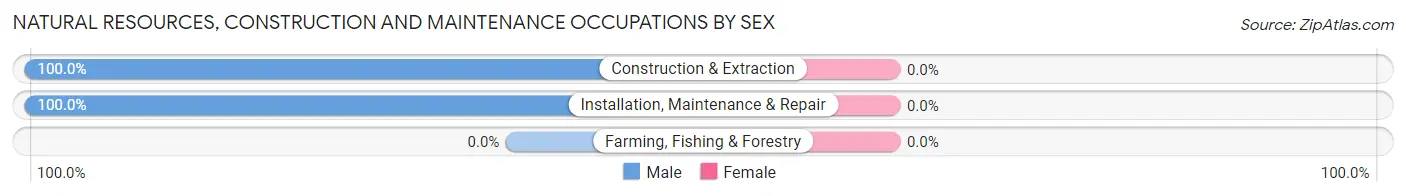
| Occupation | Male | Female |
| Farming, Fishing & Forestry | 0 (0.0%) | 0 (0.0%) |
| Construction & Extraction | 390 (100.0%) | 0 (0.0%) |
| Installation, Maintenance & Repair | 431 (100.0%) | 0 (0.0%) |
| Total (Category) | 821 (100.0%) | 0 (0.0%) |
| Total (Overall) | 4,814 (52.9%) | 4,288 (47.1%) |
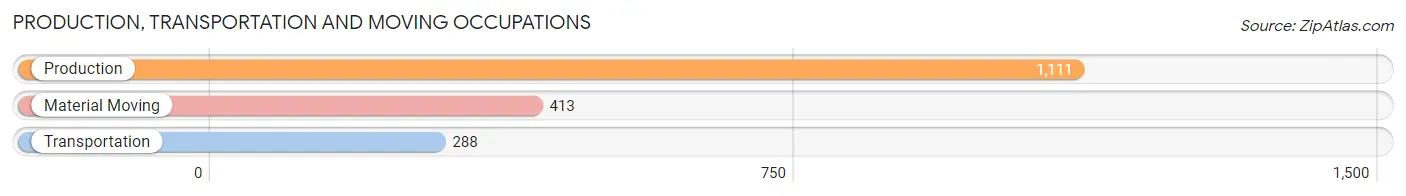
Production, Transportation and Moving Occupations
The most common Production, Transportation and Moving occupations in Eastlake are Production (1,111 | 12.2%), Material Moving (413 | 4.5%), and Transportation (288 | 3.2%).
Production, Transportation and Moving Occupations by Sex
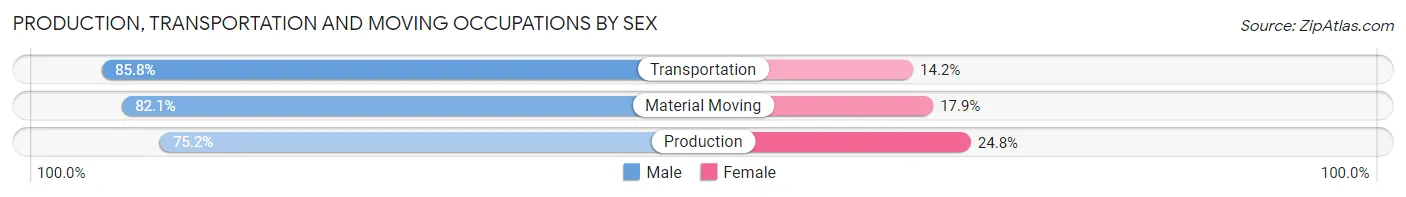
| Occupation | Male | Female |
| Production | 835 (75.2%) | 276 (24.8%) |
| Transportation | 247 (85.8%) | 41 (14.2%) |
| Material Moving | 339 (82.1%) | 74 (17.9%) |
| Total (Category) | 1,421 (78.4%) | 391 (21.6%) |
| Total (Overall) | 4,814 (52.9%) | 4,288 (47.1%) |
Employment Industries by Sex in Eastlake
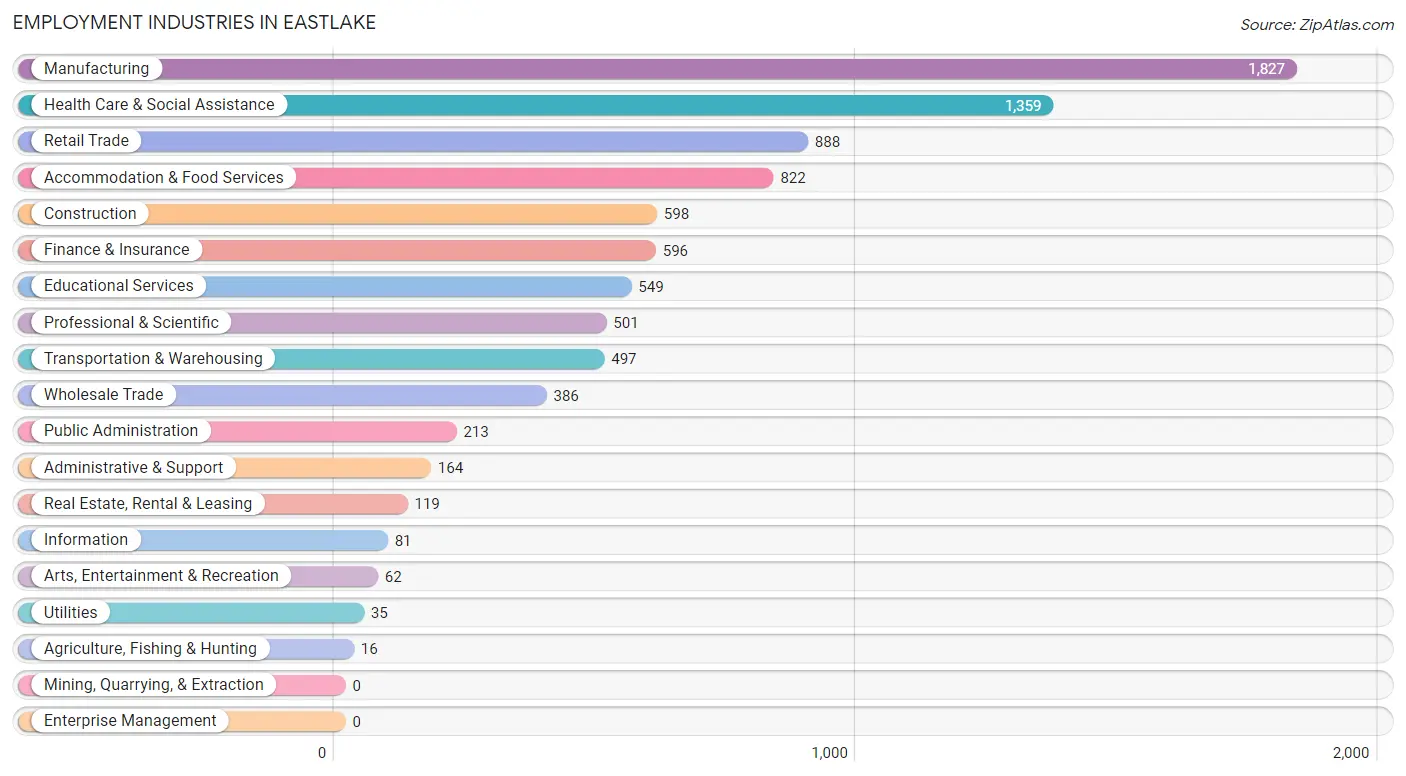
Employment Industries in Eastlake
The major employment industries in Eastlake include Manufacturing (1,827 | 20.1%), Health Care & Social Assistance (1,359 | 14.9%), Retail Trade (888 | 9.8%), Accommodation & Food Services (822 | 9.0%), and Construction (598 | 6.6%).
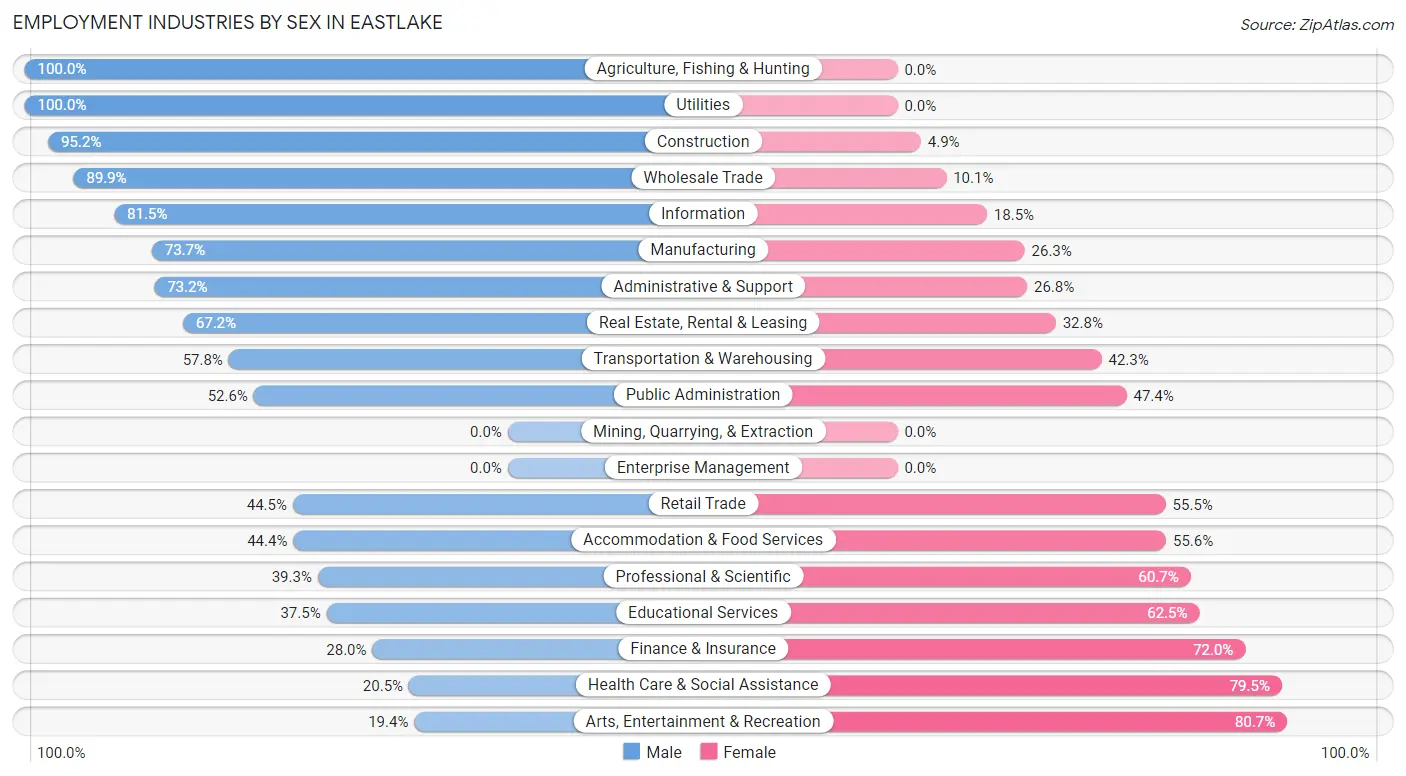
Employment Industries by Sex in Eastlake
The Eastlake industries that see more men than women are Agriculture, Fishing & Hunting (100.0%), Utilities (100.0%), and Construction (95.2%), whereas the industries that tend to have a higher number of women are Arts, Entertainment & Recreation (80.6%), Health Care & Social Assistance (79.5%), and Finance & Insurance (72.0%).
| Industry | Male | Female |
| Agriculture, Fishing & Hunting | 16 (100.0%) | 0 (0.0%) |
| Mining, Quarrying, & Extraction | 0 (0.0%) | 0 (0.0%) |
| Construction | 569 (95.2%) | 29 (4.9%) |
| Manufacturing | 1,346 (73.7%) | 481 (26.3%) |
| Wholesale Trade | 347 (89.9%) | 39 (10.1%) |
| Retail Trade | 395 (44.5%) | 493 (55.5%) |
| Transportation & Warehousing | 287 (57.8%) | 210 (42.2%) |
| Utilities | 35 (100.0%) | 0 (0.0%) |
| Information | 66 (81.5%) | 15 (18.5%) |
| Finance & Insurance | 167 (28.0%) | 429 (72.0%) |
| Real Estate, Rental & Leasing | 80 (67.2%) | 39 (32.8%) |
| Professional & Scientific | 197 (39.3%) | 304 (60.7%) |
| Enterprise Management | 0 (0.0%) | 0 (0.0%) |
| Administrative & Support | 120 (73.2%) | 44 (26.8%) |
| Educational Services | 206 (37.5%) | 343 (62.5%) |
| Health Care & Social Assistance | 278 (20.5%) | 1,081 (79.5%) |
| Arts, Entertainment & Recreation | 12 (19.4%) | 50 (80.6%) |
| Accommodation & Food Services | 365 (44.4%) | 457 (55.6%) |
| Public Administration | 112 (52.6%) | 101 (47.4%) |
| Total | 4,814 (52.9%) | 4,288 (47.1%) |
Education in Eastlake
School Enrollment in Eastlake
The most common levels of schooling among the 3,240 students in Eastlake are high school (752 | 23.2%), college / undergraduate (730 | 22.5%), and middle school (664 | 20.5%).
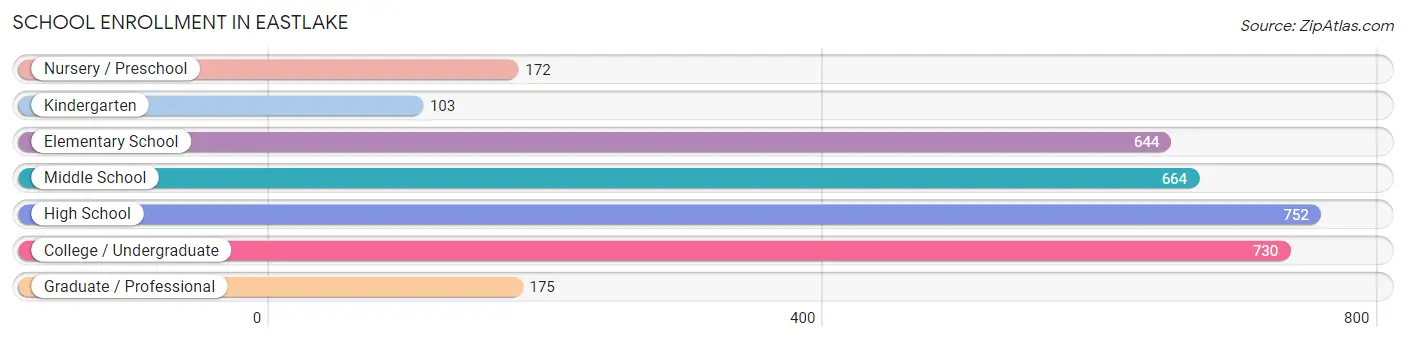
| School Level | # Students | % Students |
| Nursery / Preschool | 172 | 5.3% |
| Kindergarten | 103 | 3.2% |
| Elementary School | 644 | 19.9% |
| Middle School | 664 | 20.5% |
| High School | 752 | 23.2% |
| College / Undergraduate | 730 | 22.5% |
| Graduate / Professional | 175 | 5.4% |
| Total | 3,240 | 100.0% |
School Enrollment by Age by Funding Source in Eastlake
Out of a total of 3,240 students who are enrolled in schools in Eastlake, 505 (15.6%) attend a private institution, while the remaining 2,735 (84.4%) are enrolled in public schools. The age group of 3 to 4 year olds has the highest likelihood of being enrolled in private schools, with 84 (60.9% in the age bracket) enrolled. Conversely, the age group of 15 to 17 year olds has the lowest likelihood of being enrolled in a private school, with 551 (96.0% in the age bracket) attending a public institution.
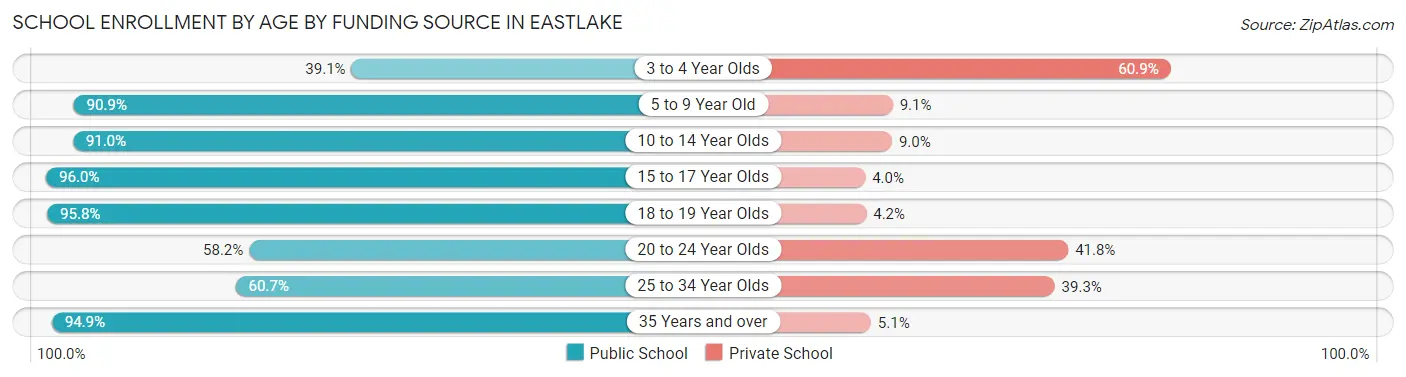
| Age Bracket | Public School | Private School |
| 3 to 4 Year Olds | 54 (39.1%) | 84 (60.9%) |
| 5 to 9 Year Old | 597 (90.9%) | 60 (9.1%) |
| 10 to 14 Year Olds | 748 (91.0%) | 74 (9.0%) |
| 15 to 17 Year Olds | 551 (96.0%) | 23 (4.0%) |
| 18 to 19 Year Olds | 296 (95.8%) | 13 (4.2%) |
| 20 to 24 Year Olds | 217 (58.2%) | 156 (41.8%) |
| 25 to 34 Year Olds | 139 (60.7%) | 90 (39.3%) |
| 35 Years and over | 131 (94.9%) | 7 (5.1%) |
| Total | 2,735 (84.4%) | 505 (15.6%) |
Educational Attainment by Field of Study in Eastlake
Business (740 | 28.3%), science & technology (473 | 18.1%), education (352 | 13.5%), engineering (169 | 6.5%), and communications (149 | 5.7%) are the most common fields of study among 2,614 individuals in Eastlake who have obtained a bachelor's degree or higher.
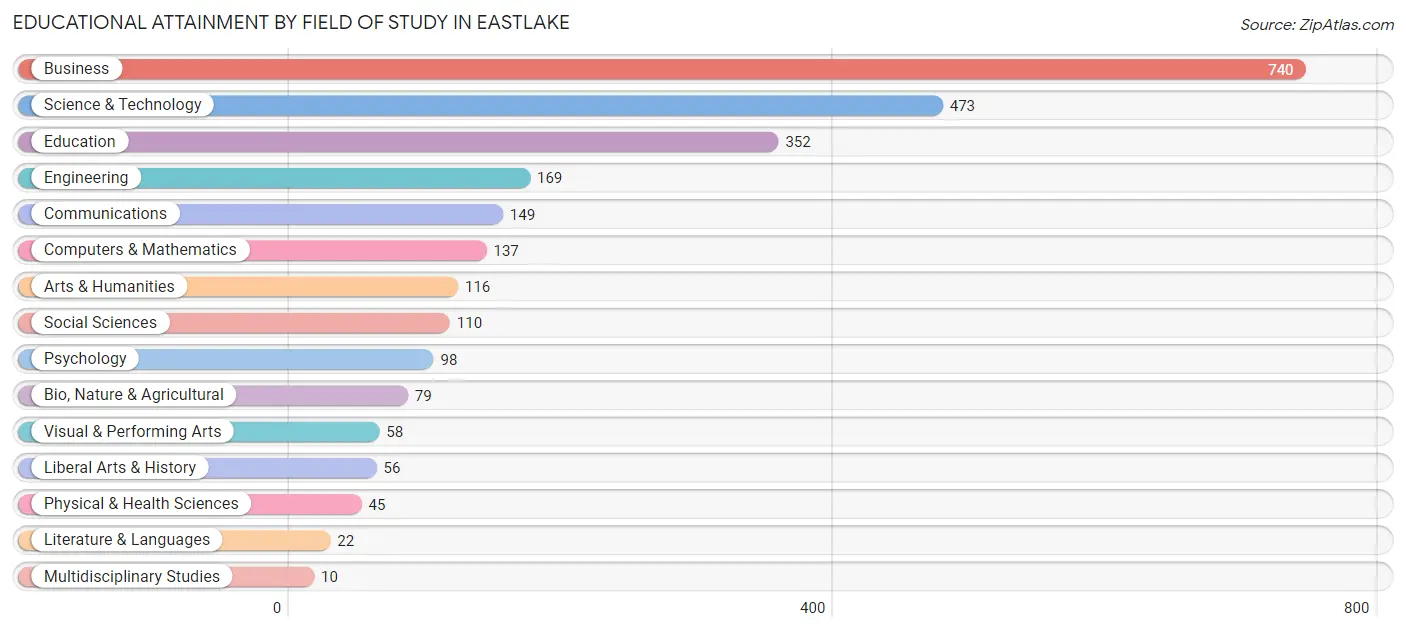
| Field of Study | # Graduates | % Graduates |
| Computers & Mathematics | 137 | 5.2% |
| Bio, Nature & Agricultural | 79 | 3.0% |
| Physical & Health Sciences | 45 | 1.7% |
| Psychology | 98 | 3.7% |
| Social Sciences | 110 | 4.2% |
| Engineering | 169 | 6.5% |
| Multidisciplinary Studies | 10 | 0.4% |
| Science & Technology | 473 | 18.1% |
| Business | 740 | 28.3% |
| Education | 352 | 13.5% |
| Literature & Languages | 22 | 0.8% |
| Liberal Arts & History | 56 | 2.1% |
| Visual & Performing Arts | 58 | 2.2% |
| Communications | 149 | 5.7% |
| Arts & Humanities | 116 | 4.4% |
| Total | 2,614 | 100.0% |
Transportation & Commute in Eastlake
Vehicle Availability by Sex in Eastlake
The most prevalent vehicle ownership categories in Eastlake are males with 2 vehicles (2,348, accounting for 50.5%) and females with 2 vehicles (1,922, making up 55.2%).
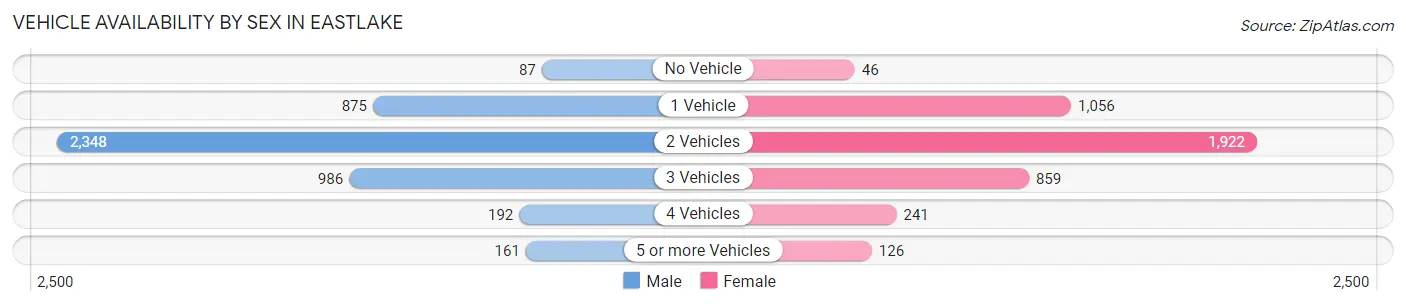
| Vehicles Available | Male | Female |
| No Vehicle | 87 (1.9%) | 46 (1.1%) |
| 1 Vehicle | 875 (18.8%) | 1,056 (24.8%) |
| 2 Vehicles | 2,348 (50.5%) | 1,922 (45.2%) |
| 3 Vehicles | 986 (21.2%) | 859 (20.2%) |
| 4 Vehicles | 192 (4.1%) | 241 (5.7%) |
| 5 or more Vehicles | 161 (3.5%) | 126 (3.0%) |
| Total | 4,649 (100.0%) | 4,250 (100.0%) |
Commute Time in Eastlake
The most frequently occuring commute durations in Eastlake are 20 to 24 minutes (1,933 commuters, 23.2%), 15 to 19 minutes (1,671 commuters, 20.0%), and 30 to 34 minutes (1,038 commuters, 12.4%).
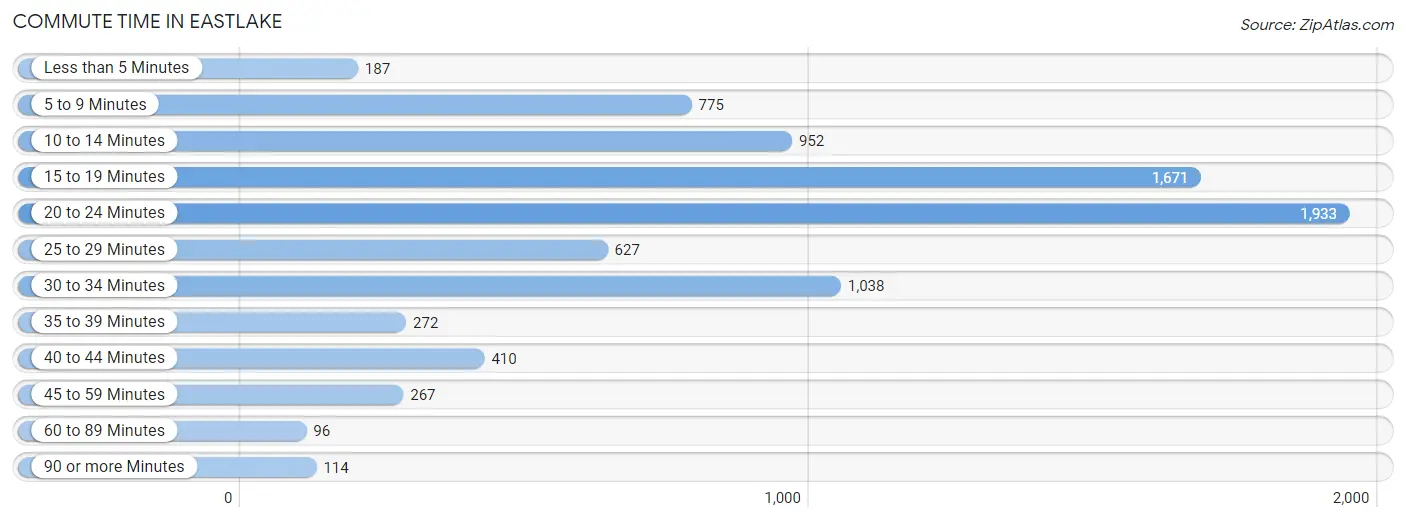
| Commute Time | # Commuters | % Commuters |
| Less than 5 Minutes | 187 | 2.2% |
| 5 to 9 Minutes | 775 | 9.3% |
| 10 to 14 Minutes | 952 | 11.4% |
| 15 to 19 Minutes | 1,671 | 20.0% |
| 20 to 24 Minutes | 1,933 | 23.2% |
| 25 to 29 Minutes | 627 | 7.5% |
| 30 to 34 Minutes | 1,038 | 12.4% |
| 35 to 39 Minutes | 272 | 3.3% |
| 40 to 44 Minutes | 410 | 4.9% |
| 45 to 59 Minutes | 267 | 3.2% |
| 60 to 89 Minutes | 96 | 1.1% |
| 90 or more Minutes | 114 | 1.4% |
Commute Time by Sex in Eastlake
The most common commute times in Eastlake are 15 to 19 minutes (991 commuters, 22.8%) for males and 20 to 24 minutes (1,157 commuters, 29.0%) for females.
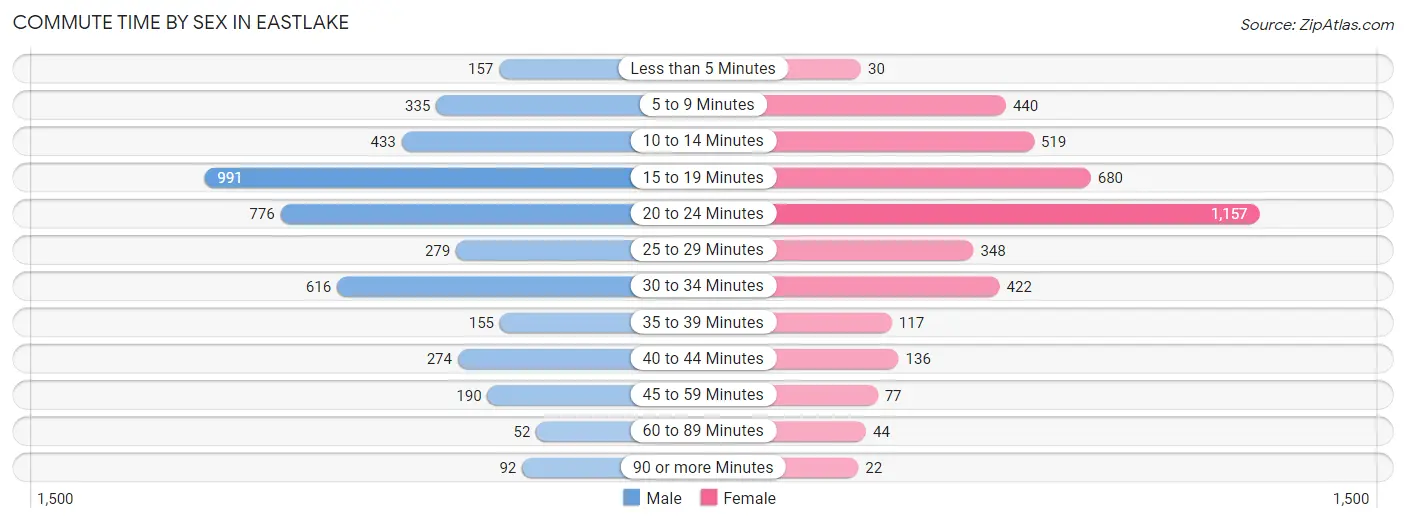
| Commute Time | Male | Female |
| Less than 5 Minutes | 157 (3.6%) | 30 (0.7%) |
| 5 to 9 Minutes | 335 (7.7%) | 440 (11.0%) |
| 10 to 14 Minutes | 433 (10.0%) | 519 (13.0%) |
| 15 to 19 Minutes | 991 (22.8%) | 680 (17.0%) |
| 20 to 24 Minutes | 776 (17.8%) | 1,157 (29.0%) |
| 25 to 29 Minutes | 279 (6.4%) | 348 (8.7%) |
| 30 to 34 Minutes | 616 (14.2%) | 422 (10.6%) |
| 35 to 39 Minutes | 155 (3.6%) | 117 (2.9%) |
| 40 to 44 Minutes | 274 (6.3%) | 136 (3.4%) |
| 45 to 59 Minutes | 190 (4.4%) | 77 (1.9%) |
| 60 to 89 Minutes | 52 (1.2%) | 44 (1.1%) |
| 90 or more Minutes | 92 (2.1%) | 22 (0.5%) |
Time of Departure to Work by Sex in Eastlake
The most frequent times of departure to work in Eastlake are 6:30 AM to 6:59 AM (566, 13.0%) for males and 7:00 AM to 7:29 AM (716, 17.9%) for females.
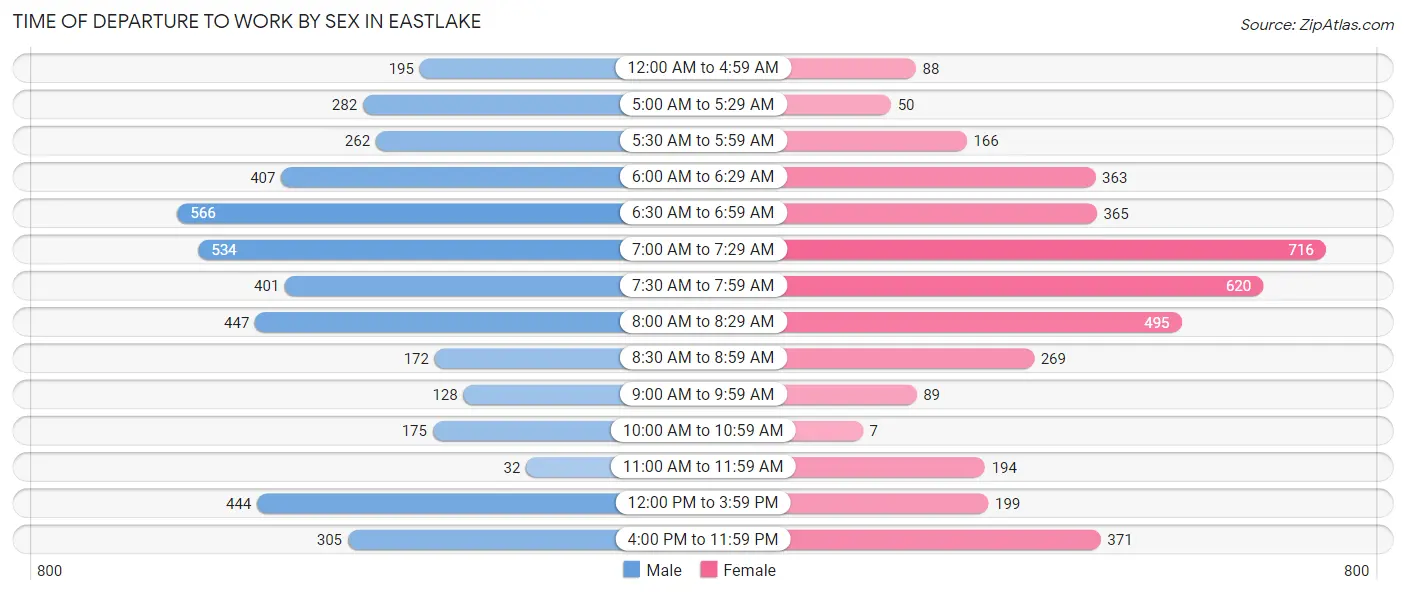
| Time of Departure | Male | Female |
| 12:00 AM to 4:59 AM | 195 (4.5%) | 88 (2.2%) |
| 5:00 AM to 5:29 AM | 282 (6.5%) | 50 (1.3%) |
| 5:30 AM to 5:59 AM | 262 (6.0%) | 166 (4.2%) |
| 6:00 AM to 6:29 AM | 407 (9.4%) | 363 (9.1%) |
| 6:30 AM to 6:59 AM | 566 (13.0%) | 365 (9.1%) |
| 7:00 AM to 7:29 AM | 534 (12.3%) | 716 (17.9%) |
| 7:30 AM to 7:59 AM | 401 (9.2%) | 620 (15.5%) |
| 8:00 AM to 8:29 AM | 447 (10.3%) | 495 (12.4%) |
| 8:30 AM to 8:59 AM | 172 (4.0%) | 269 (6.7%) |
| 9:00 AM to 9:59 AM | 128 (2.9%) | 89 (2.2%) |
| 10:00 AM to 10:59 AM | 175 (4.0%) | 7 (0.2%) |
| 11:00 AM to 11:59 AM | 32 (0.7%) | 194 (4.9%) |
| 12:00 PM to 3:59 PM | 444 (10.2%) | 199 (5.0%) |
| 4:00 PM to 11:59 PM | 305 (7.0%) | 371 (9.3%) |
| Total | 4,350 (100.0%) | 3,992 (100.0%) |
Housing Occupancy in Eastlake
Occupancy by Ownership in Eastlake
Of the total 8,083 dwellings in Eastlake, owner-occupied units account for 6,031 (74.6%), while renter-occupied units make up 2,052 (25.4%).
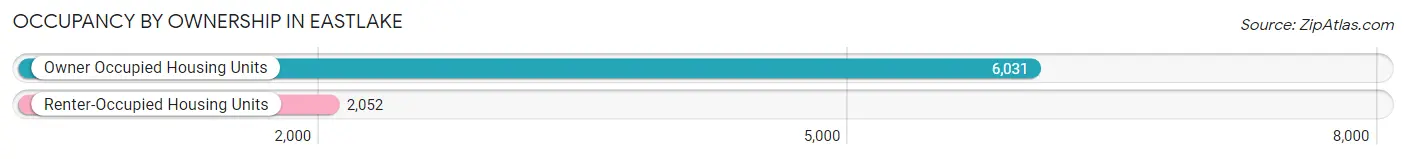
| Occupancy | # Housing Units | % Housing Units |
| Owner Occupied Housing Units | 6,031 | 74.6% |
| Renter-Occupied Housing Units | 2,052 | 25.4% |
| Total Occupied Housing Units | 8,083 | 100.0% |
Occupancy by Household Size in Eastlake
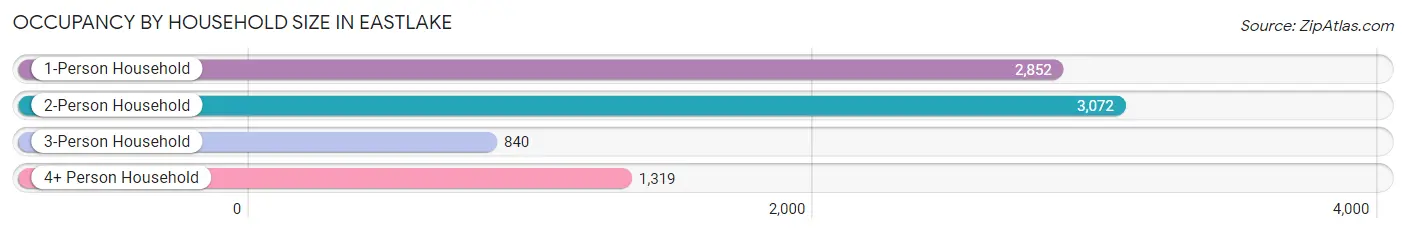
| Household Size | # Housing Units | % Housing Units |
| 1-Person Household | 2,852 | 35.3% |
| 2-Person Household | 3,072 | 38.0% |
| 3-Person Household | 840 | 10.4% |
| 4+ Person Household | 1,319 | 16.3% |
| Total Housing Units | 8,083 | 100.0% |
Occupancy by Ownership by Household Size in Eastlake
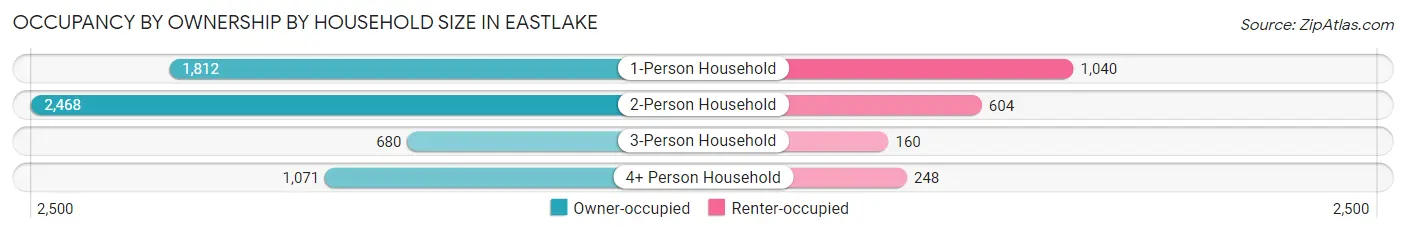
| Household Size | Owner-occupied | Renter-occupied |
| 1-Person Household | 1,812 (63.5%) | 1,040 (36.5%) |
| 2-Person Household | 2,468 (80.3%) | 604 (19.7%) |
| 3-Person Household | 680 (80.9%) | 160 (19.1%) |
| 4+ Person Household | 1,071 (81.2%) | 248 (18.8%) |
| Total Housing Units | 6,031 (74.6%) | 2,052 (25.4%) |
Occupancy by Educational Attainment in Eastlake
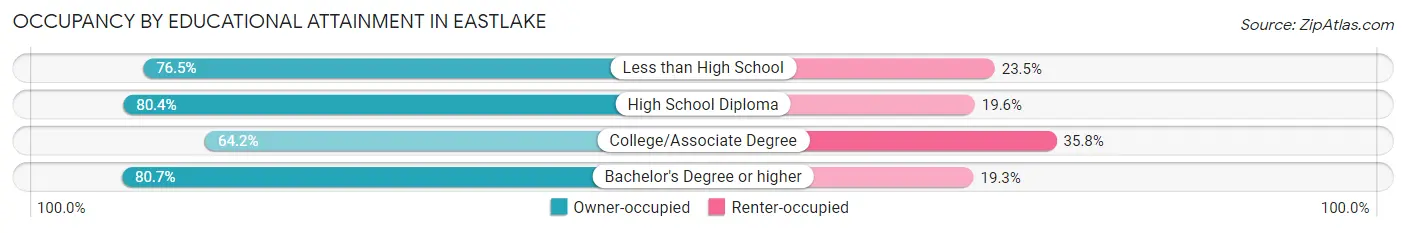
| Household Size | Owner-occupied | Renter-occupied |
| Less than High School | 465 (76.5%) | 143 (23.5%) |
| High School Diploma | 2,531 (80.4%) | 616 (19.6%) |
| College/Associate Degree | 1,782 (64.2%) | 993 (35.8%) |
| Bachelor's Degree or higher | 1,253 (80.7%) | 300 (19.3%) |
Occupancy by Age of Householder in Eastlake
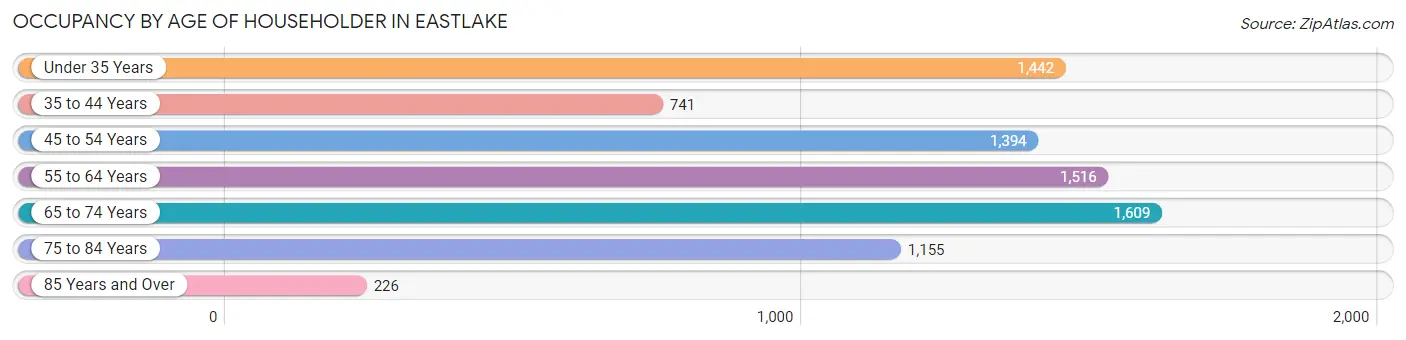
| Age Bracket | # Households | % Households |
| Under 35 Years | 1,442 | 17.8% |
| 35 to 44 Years | 741 | 9.2% |
| 45 to 54 Years | 1,394 | 17.2% |
| 55 to 64 Years | 1,516 | 18.8% |
| 65 to 74 Years | 1,609 | 19.9% |
| 75 to 84 Years | 1,155 | 14.3% |
| 85 Years and Over | 226 | 2.8% |
| Total | 8,083 | 100.0% |
Housing Finances in Eastlake
Median Income by Occupancy in Eastlake
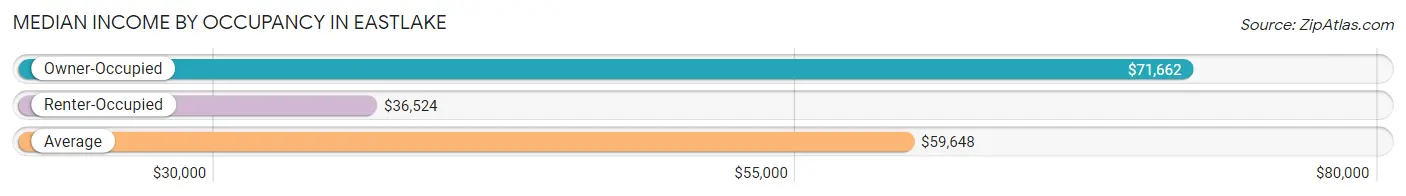
| Occupancy Type | # Households | Median Income |
| Owner-Occupied | 6,031 (74.6%) | $71,662 |
| Renter-Occupied | 2,052 (25.4%) | $36,524 |
| Average | 8,083 (100.0%) | $59,648 |
Occupancy by Householder Income Bracket in Eastlake
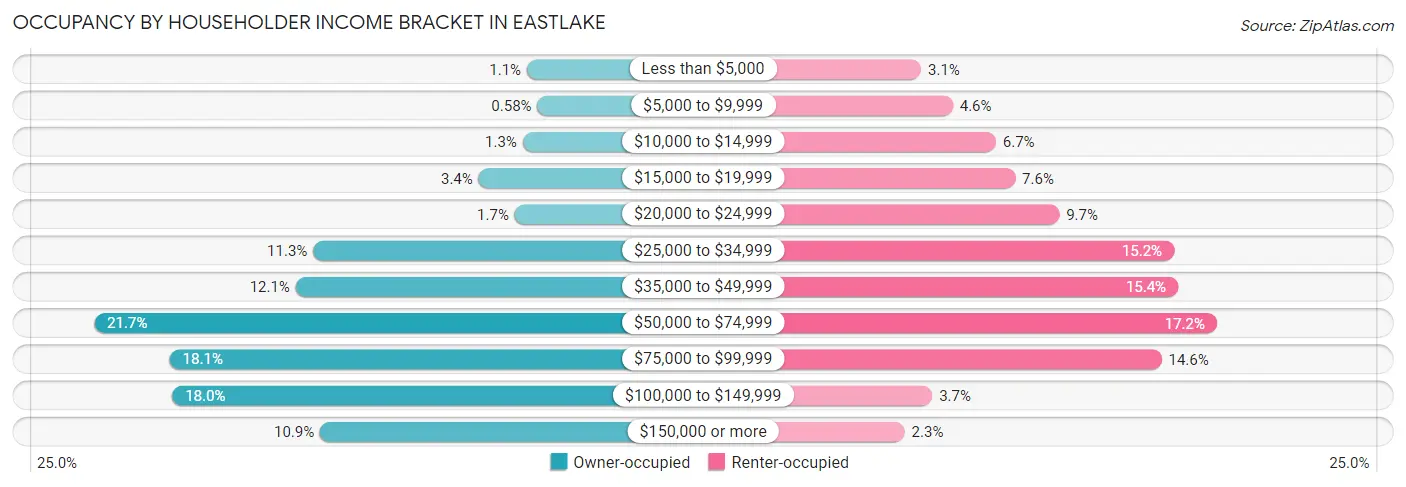
| Income Bracket | Owner-occupied | Renter-occupied |
| Less than $5,000 | 65 (1.1%) | 64 (3.1%) |
| $5,000 to $9,999 | 35 (0.6%) | 95 (4.6%) |
| $10,000 to $14,999 | 77 (1.3%) | 137 (6.7%) |
| $15,000 to $19,999 | 204 (3.4%) | 156 (7.6%) |
| $20,000 to $24,999 | 100 (1.7%) | 199 (9.7%) |
| $25,000 to $34,999 | 679 (11.3%) | 311 (15.2%) |
| $35,000 to $49,999 | 729 (12.1%) | 315 (15.3%) |
| $50,000 to $74,999 | 1,308 (21.7%) | 353 (17.2%) |
| $75,000 to $99,999 | 1,091 (18.1%) | 299 (14.6%) |
| $100,000 to $149,999 | 1,084 (18.0%) | 75 (3.6%) |
| $150,000 or more | 659 (10.9%) | 48 (2.3%) |
| Total | 6,031 (100.0%) | 2,052 (100.0%) |
Monthly Housing Cost Tiers in Eastlake
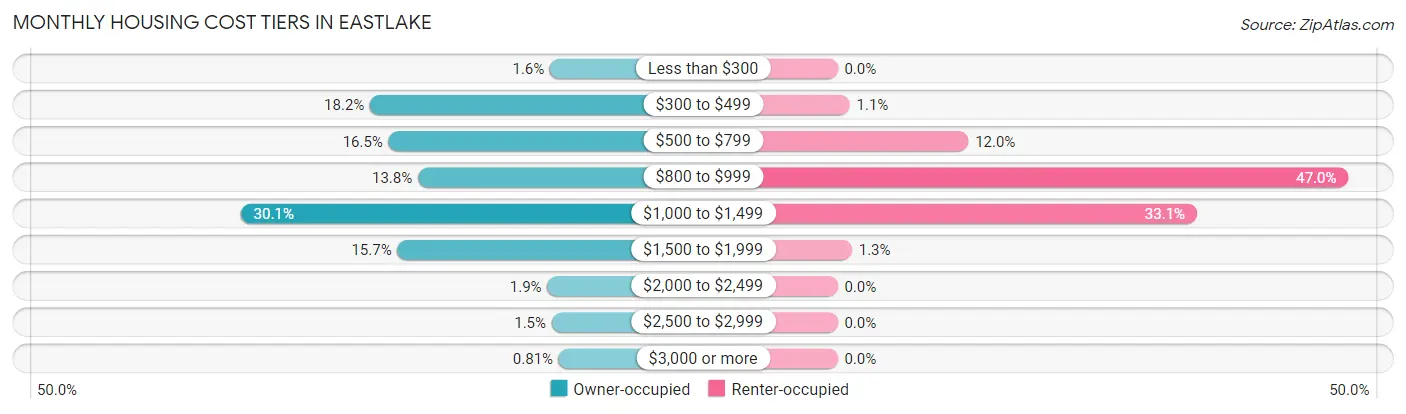
| Monthly Cost | Owner-occupied | Renter-occupied |
| Less than $300 | 98 (1.6%) | 0 (0.0%) |
| $300 to $499 | 1,097 (18.2%) | 23 (1.1%) |
| $500 to $799 | 994 (16.5%) | 247 (12.0%) |
| $800 to $999 | 831 (13.8%) | 965 (47.0%) |
| $1,000 to $1,499 | 1,816 (30.1%) | 679 (33.1%) |
| $1,500 to $1,999 | 945 (15.7%) | 27 (1.3%) |
| $2,000 to $2,499 | 113 (1.9%) | 0 (0.0%) |
| $2,500 to $2,999 | 88 (1.5%) | 0 (0.0%) |
| $3,000 or more | 49 (0.8%) | 0 (0.0%) |
| Total | 6,031 (100.0%) | 2,052 (100.0%) |
Physical Housing Characteristics in Eastlake
Housing Structures in Eastlake
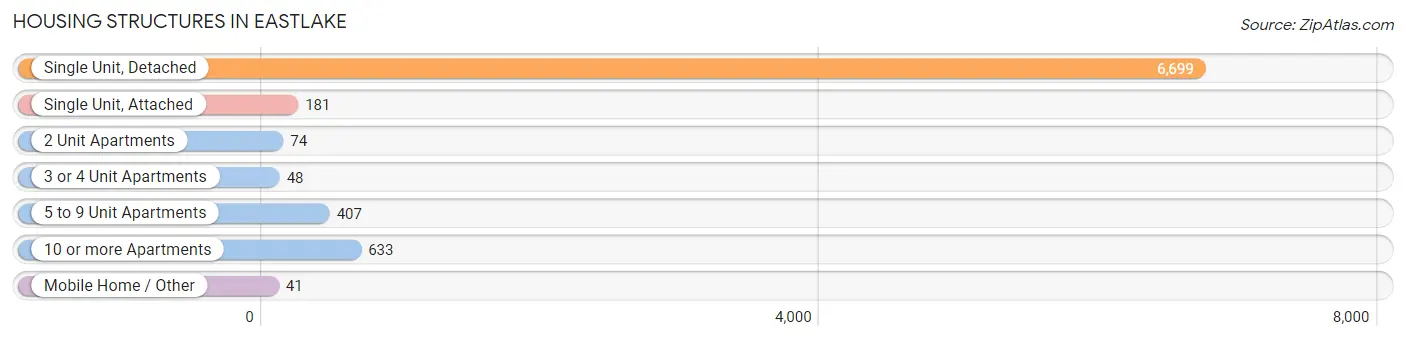
| Structure Type | # Housing Units | % Housing Units |
| Single Unit, Detached | 6,699 | 82.9% |
| Single Unit, Attached | 181 | 2.2% |
| 2 Unit Apartments | 74 | 0.9% |
| 3 or 4 Unit Apartments | 48 | 0.6% |
| 5 to 9 Unit Apartments | 407 | 5.0% |
| 10 or more Apartments | 633 | 7.8% |
| Mobile Home / Other | 41 | 0.5% |
| Total | 8,083 | 100.0% |
Housing Structures by Occupancy in Eastlake
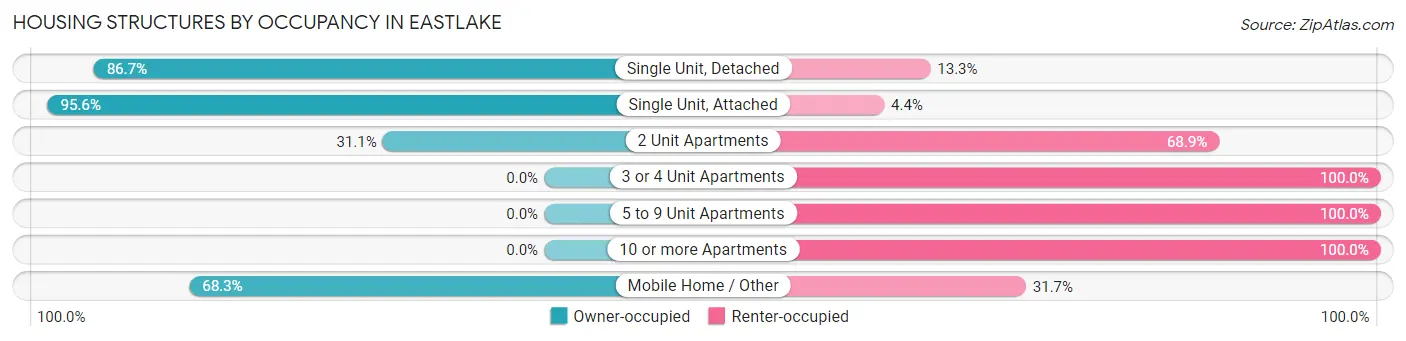
| Structure Type | Owner-occupied | Renter-occupied |
| Single Unit, Detached | 5,807 (86.7%) | 892 (13.3%) |
| Single Unit, Attached | 173 (95.6%) | 8 (4.4%) |
| 2 Unit Apartments | 23 (31.1%) | 51 (68.9%) |
| 3 or 4 Unit Apartments | 0 (0.0%) | 48 (100.0%) |
| 5 to 9 Unit Apartments | 0 (0.0%) | 407 (100.0%) |
| 10 or more Apartments | 0 (0.0%) | 633 (100.0%) |
| Mobile Home / Other | 28 (68.3%) | 13 (31.7%) |
| Total | 6,031 (74.6%) | 2,052 (25.4%) |
Housing Structures by Number of Rooms in Eastlake
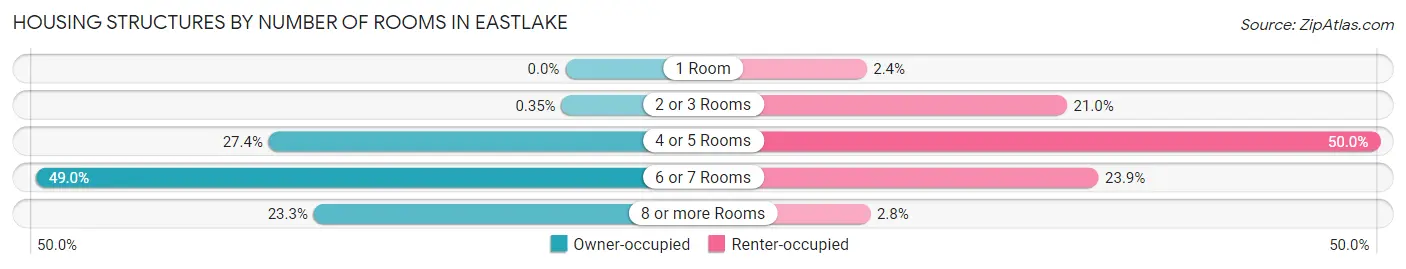
| Number of Rooms | Owner-occupied | Renter-occupied |
| 1 Room | 0 (0.0%) | 50 (2.4%) |
| 2 or 3 Rooms | 21 (0.4%) | 430 (21.0%) |
| 4 or 5 Rooms | 1,654 (27.4%) | 1,025 (49.9%) |
| 6 or 7 Rooms | 2,953 (49.0%) | 490 (23.9%) |
| 8 or more Rooms | 1,403 (23.3%) | 57 (2.8%) |
| Total | 6,031 (100.0%) | 2,052 (100.0%) |
Housing Structure by Heating Type in Eastlake
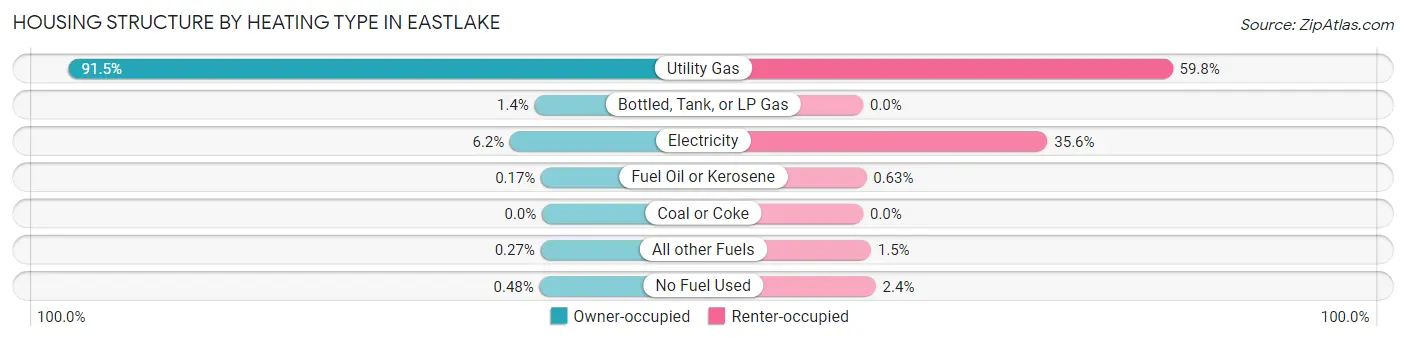
| Heating Type | Owner-occupied | Renter-occupied |
| Utility Gas | 5,517 (91.5%) | 1,227 (59.8%) |
| Bottled, Tank, or LP Gas | 86 (1.4%) | 0 (0.0%) |
| Electricity | 373 (6.2%) | 731 (35.6%) |
| Fuel Oil or Kerosene | 10 (0.2%) | 13 (0.6%) |
| Coal or Coke | 0 (0.0%) | 0 (0.0%) |
| All other Fuels | 16 (0.3%) | 31 (1.5%) |
| No Fuel Used | 29 (0.5%) | 50 (2.4%) |
| Total | 6,031 (100.0%) | 2,052 (100.0%) |
Household Vehicle Usage in Eastlake
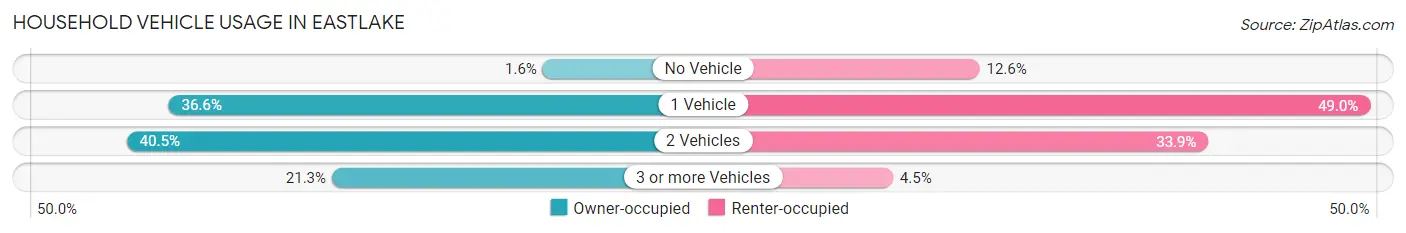
| Vehicles per Household | Owner-occupied | Renter-occupied |
| No Vehicle | 99 (1.6%) | 258 (12.6%) |
| 1 Vehicle | 2,205 (36.6%) | 1,006 (49.0%) |
| 2 Vehicles | 2,441 (40.5%) | 696 (33.9%) |
| 3 or more Vehicles | 1,286 (21.3%) | 92 (4.5%) |
| Total | 6,031 (100.0%) | 2,052 (100.0%) |
Real Estate & Mortgages in Eastlake
Real Estate and Mortgage Overview in Eastlake
| Characteristic | Without Mortgage | With Mortgage |
| Housing Units | 2,024 | 4,007 |
| Median Property Value | $155,100 | $155,600 |
| Median Household Income | $58,442 | $552 |
| Monthly Housing Costs | $507 | $20 |
| Real Estate Taxes | $2,680 | $65 |
Property Value by Mortgage Status in Eastlake
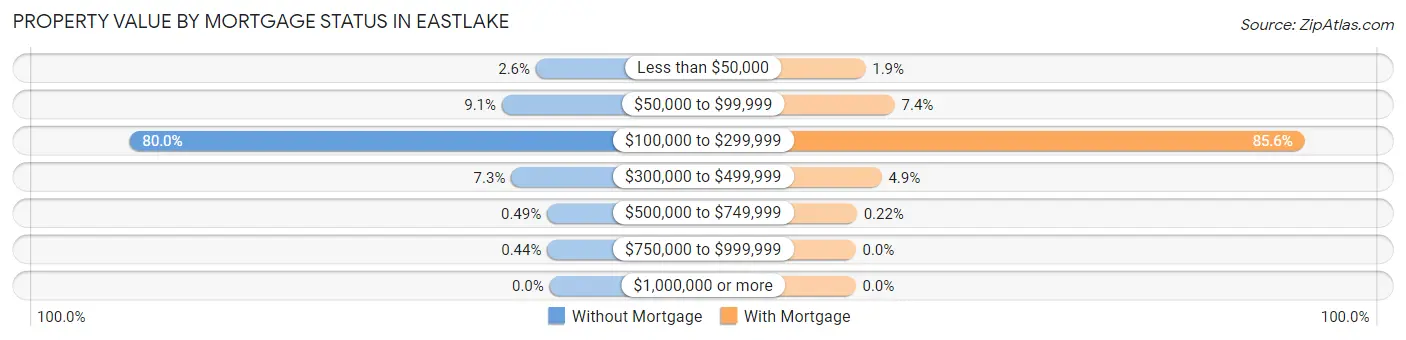
| Property Value | Without Mortgage | With Mortgage |
| Less than $50,000 | 53 (2.6%) | 74 (1.8%) |
| $50,000 to $99,999 | 184 (9.1%) | 298 (7.4%) |
| $100,000 to $299,999 | 1,620 (80.0%) | 3,428 (85.6%) |
| $300,000 to $499,999 | 148 (7.3%) | 198 (4.9%) |
| $500,000 to $749,999 | 10 (0.5%) | 9 (0.2%) |
| $750,000 to $999,999 | 9 (0.4%) | 0 (0.0%) |
| $1,000,000 or more | 0 (0.0%) | 0 (0.0%) |
| Total | 2,024 (100.0%) | 4,007 (100.0%) |
Household Income by Mortgage Status in Eastlake
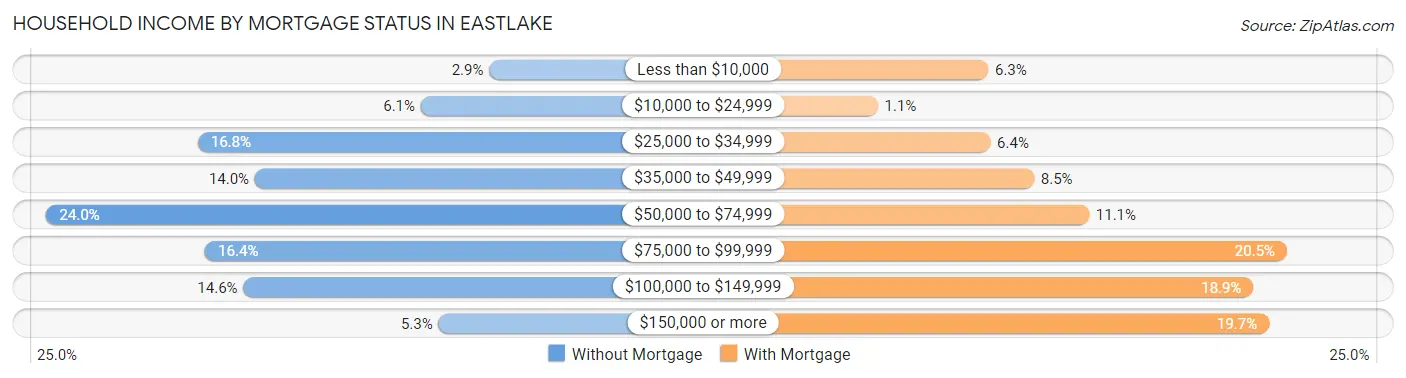
| Household Income | Without Mortgage | With Mortgage |
| Less than $10,000 | 58 (2.9%) | 253 (6.3%) |
| $10,000 to $24,999 | 124 (6.1%) | 42 (1.1%) |
| $25,000 to $34,999 | 339 (16.8%) | 257 (6.4%) |
| $35,000 to $49,999 | 284 (14.0%) | 340 (8.5%) |
| $50,000 to $74,999 | 485 (24.0%) | 445 (11.1%) |
| $75,000 to $99,999 | 332 (16.4%) | 823 (20.5%) |
| $100,000 to $149,999 | 295 (14.6%) | 759 (18.9%) |
| $150,000 or more | 107 (5.3%) | 789 (19.7%) |
| Total | 2,024 (100.0%) | 4,007 (100.0%) |
Property Value to Household Income Ratio in Eastlake
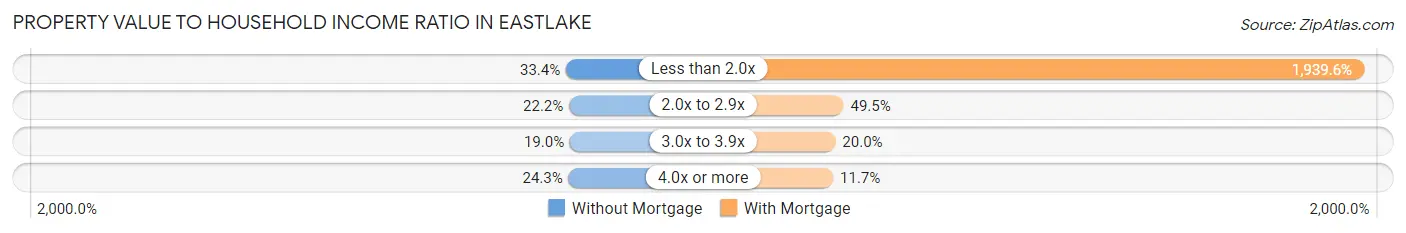
| Value-to-Income Ratio | Without Mortgage | With Mortgage |
| Less than 2.0x | 675 (33.4%) | 77,718 (1,939.6%) |
| 2.0x to 2.9x | 450 (22.2%) | 1,983 (49.5%) |
| 3.0x to 3.9x | 385 (19.0%) | 801 (20.0%) |
| 4.0x or more | 491 (24.3%) | 468 (11.7%) |
| Total | 2,024 (100.0%) | 4,007 (100.0%) |
Real Estate Taxes by Mortgage Status in Eastlake
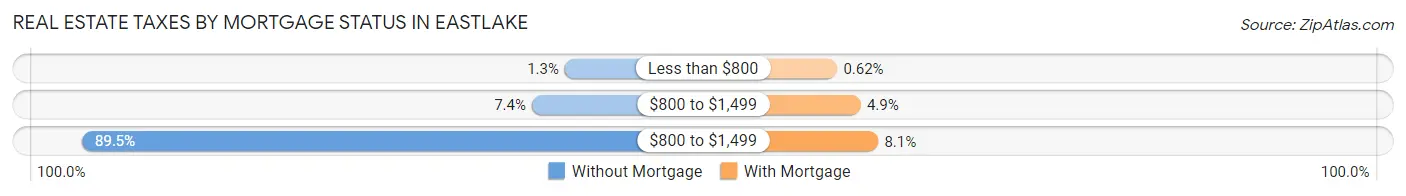
| Property Taxes | Without Mortgage | With Mortgage |
| Less than $800 | 27 (1.3%) | 25 (0.6%) |
| $800 to $1,499 | 149 (7.4%) | 197 (4.9%) |
| $800 to $1,499 | 1,812 (89.5%) | 325 (8.1%) |
| Total | 2,024 (100.0%) | 4,007 (100.0%) |
Health & Disability in Eastlake
Health Insurance Coverage by Age in Eastlake
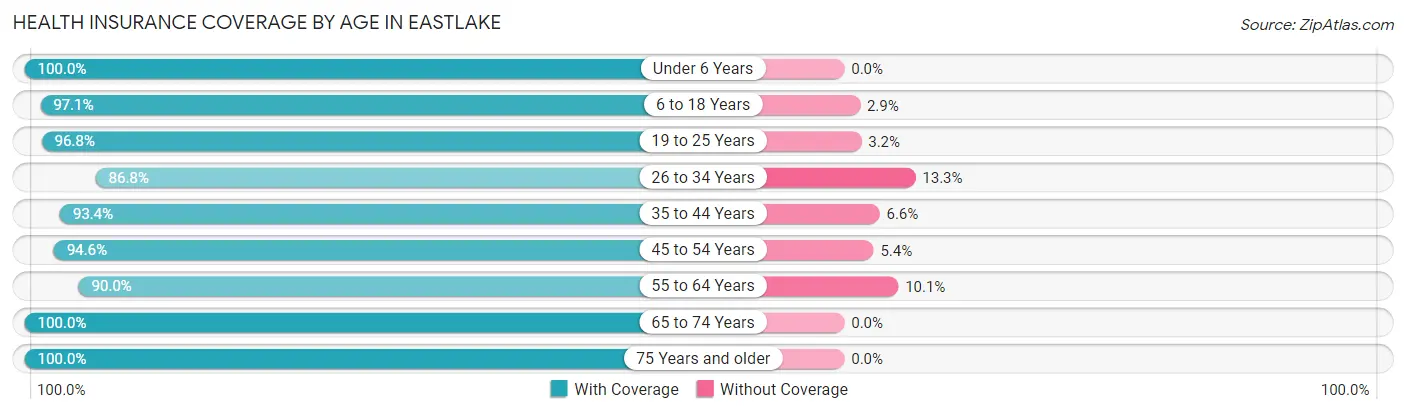
| Age Bracket | With Coverage | Without Coverage |
| Under 6 Years | 836 (100.0%) | 0 (0.0%) |
| 6 to 18 Years | 2,063 (97.1%) | 62 (2.9%) |
| 19 to 25 Years | 1,773 (96.8%) | 58 (3.2%) |
| 26 to 34 Years | 1,834 (86.8%) | 280 (13.3%) |
| 35 to 44 Years | 1,478 (93.4%) | 104 (6.6%) |
| 45 to 54 Years | 2,157 (94.6%) | 124 (5.4%) |
| 55 to 64 Years | 2,326 (89.9%) | 260 (10.1%) |
| 65 to 74 Years | 2,462 (100.0%) | 0 (0.0%) |
| 75 Years and older | 1,794 (100.0%) | 0 (0.0%) |
| Total | 16,723 (95.0%) | 888 (5.0%) |
Health Insurance Coverage by Citizenship Status in Eastlake
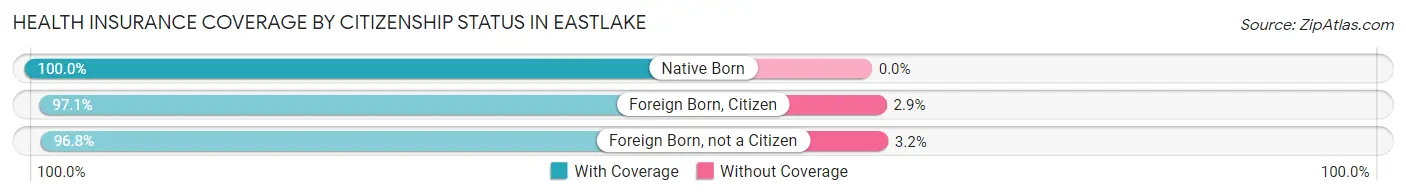
| Citizenship Status | With Coverage | Without Coverage |
| Native Born | 836 (100.0%) | 0 (0.0%) |
| Foreign Born, Citizen | 2,063 (97.1%) | 62 (2.9%) |
| Foreign Born, not a Citizen | 1,773 (96.8%) | 58 (3.2%) |
Health Insurance Coverage by Household Income in Eastlake
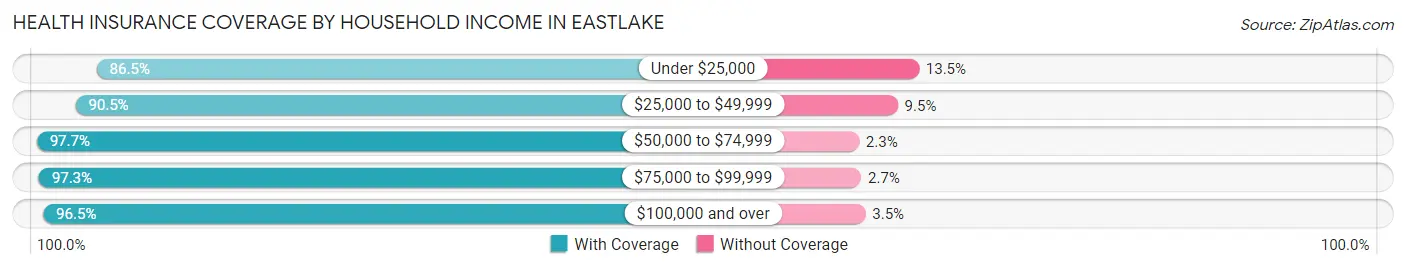
| Household Income | With Coverage | Without Coverage |
| Under $25,000 | 1,224 (86.5%) | 191 (13.5%) |
| $25,000 to $49,999 | 3,104 (90.5%) | 327 (9.5%) |
| $50,000 to $74,999 | 3,835 (97.7%) | 89 (2.3%) |
| $75,000 to $99,999 | 3,234 (97.3%) | 89 (2.7%) |
| $100,000 and over | 5,321 (96.5%) | 192 (3.5%) |
Public vs Private Health Insurance Coverage by Age in Eastlake
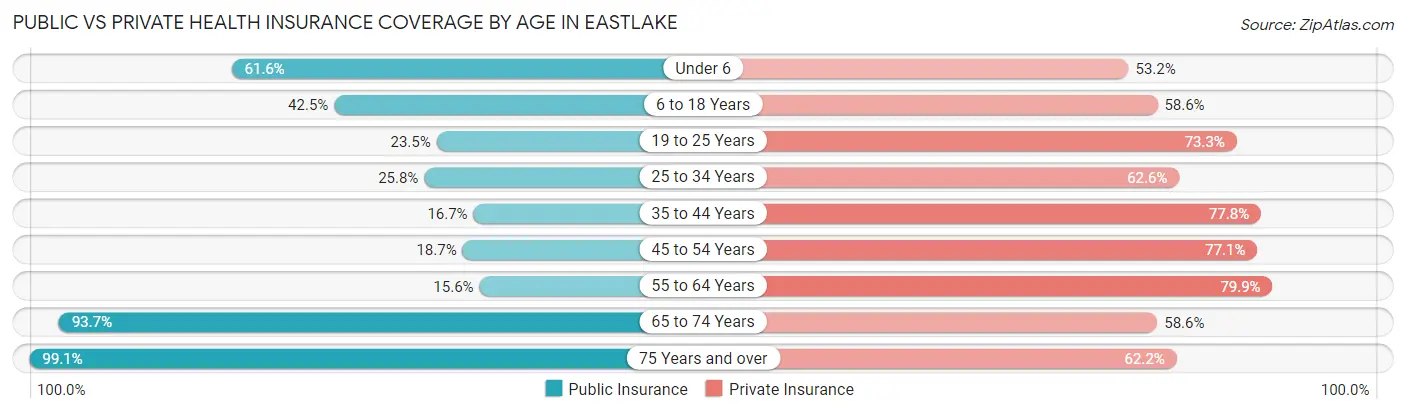
| Age Bracket | Public Insurance | Private Insurance |
| Under 6 | 515 (61.6%) | 445 (53.2%) |
| 6 to 18 Years | 904 (42.5%) | 1,245 (58.6%) |
| 19 to 25 Years | 431 (23.5%) | 1,342 (73.3%) |
| 25 to 34 Years | 546 (25.8%) | 1,324 (62.6%) |
| 35 to 44 Years | 264 (16.7%) | 1,231 (77.8%) |
| 45 to 54 Years | 427 (18.7%) | 1,759 (77.1%) |
| 55 to 64 Years | 403 (15.6%) | 2,067 (79.9%) |
| 65 to 74 Years | 2,306 (93.7%) | 1,442 (58.6%) |
| 75 Years and over | 1,778 (99.1%) | 1,115 (62.2%) |
| Total | 7,574 (43.0%) | 11,970 (68.0%) |
Disability Status by Sex by Age in Eastlake
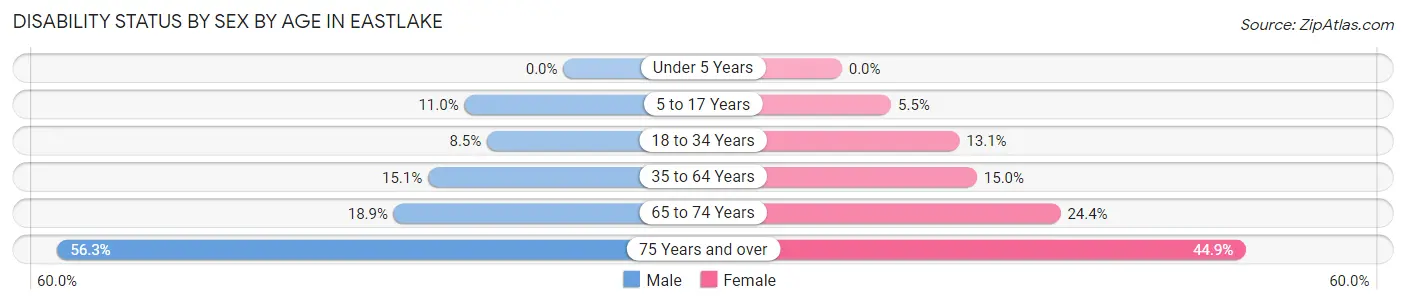
| Age Bracket | Male | Female |
| Under 5 Years | 0 (0.0%) | 0 (0.0%) |
| 5 to 17 Years | 116 (11.0%) | 56 (5.5%) |
| 18 to 34 Years | 193 (8.5%) | 237 (13.1%) |
| 35 to 64 Years | 459 (15.1%) | 512 (15.0%) |
| 65 to 74 Years | 212 (18.9%) | 326 (24.3%) |
| 75 Years and over | 440 (56.3%) | 455 (44.9%) |
Disability Class by Sex by Age in Eastlake
Disability Class: Hearing Difficulty
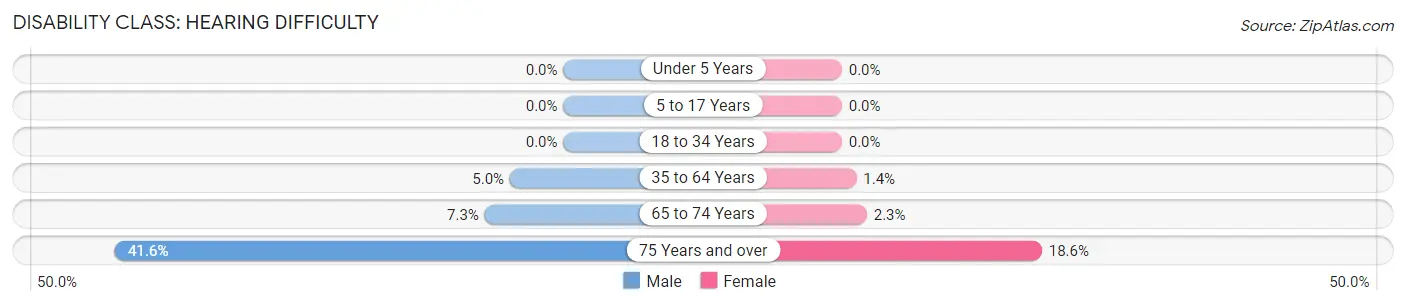
| Age Bracket | Male | Female |
| Under 5 Years | 0 (0.0%) | 0 (0.0%) |
| 5 to 17 Years | 0 (0.0%) | 0 (0.0%) |
| 18 to 34 Years | 0 (0.0%) | 0 (0.0%) |
| 35 to 64 Years | 151 (5.0%) | 46 (1.3%) |
| 65 to 74 Years | 82 (7.3%) | 31 (2.3%) |
| 75 Years and over | 325 (41.6%) | 188 (18.6%) |
Disability Class: Vision Difficulty
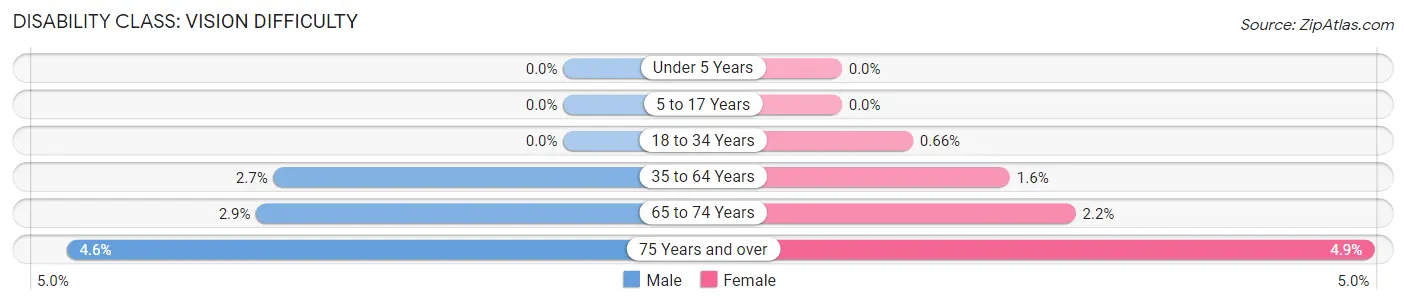
| Age Bracket | Male | Female |
| Under 5 Years | 0 (0.0%) | 0 (0.0%) |
| 5 to 17 Years | 0 (0.0%) | 0 (0.0%) |
| 18 to 34 Years | 0 (0.0%) | 12 (0.7%) |
| 35 to 64 Years | 82 (2.7%) | 53 (1.6%) |
| 65 to 74 Years | 32 (2.9%) | 29 (2.2%) |
| 75 Years and over | 36 (4.6%) | 50 (4.9%) |
Disability Class: Cognitive Difficulty
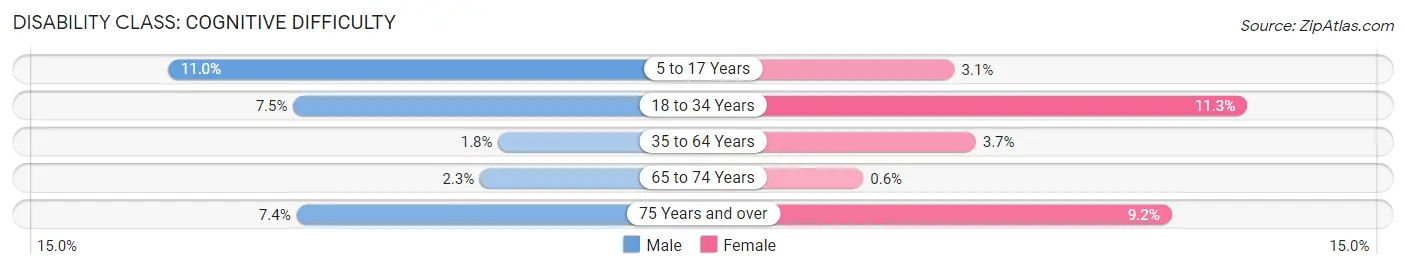
| Age Bracket | Male | Female |
| 5 to 17 Years | 116 (11.0%) | 32 (3.1%) |
| 18 to 34 Years | 171 (7.5%) | 204 (11.3%) |
| 35 to 64 Years | 55 (1.8%) | 127 (3.7%) |
| 65 to 74 Years | 26 (2.3%) | 8 (0.6%) |
| 75 Years and over | 58 (7.4%) | 93 (9.2%) |
Disability Class: Ambulatory Difficulty
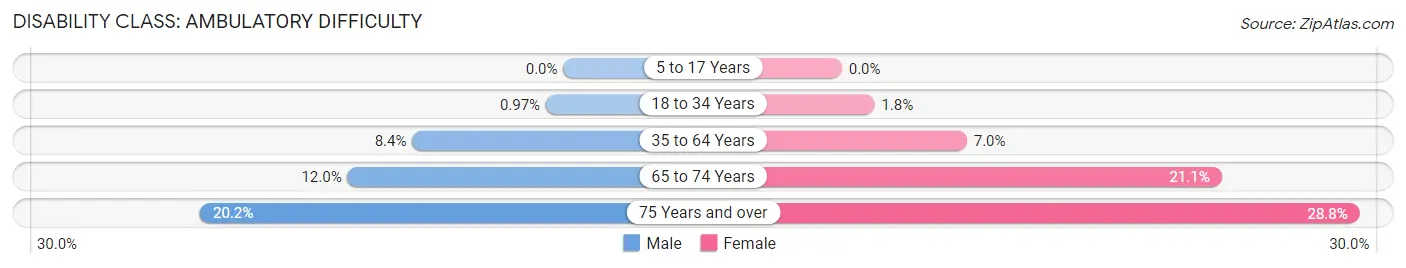
| Age Bracket | Male | Female |
| 5 to 17 Years | 0 (0.0%) | 0 (0.0%) |
| 18 to 34 Years | 22 (1.0%) | 33 (1.8%) |
| 35 to 64 Years | 256 (8.4%) | 237 (7.0%) |
| 65 to 74 Years | 135 (12.0%) | 283 (21.1%) |
| 75 Years and over | 158 (20.2%) | 292 (28.8%) |
Disability Class: Self-Care Difficulty
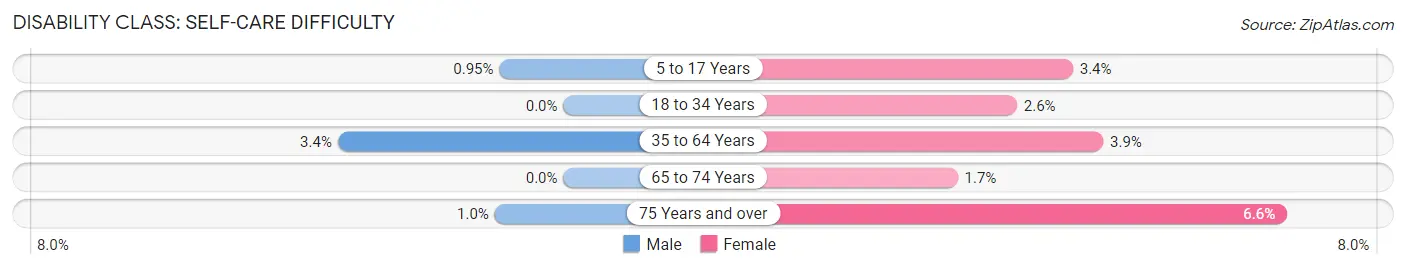
| Age Bracket | Male | Female |
| 5 to 17 Years | 10 (0.9%) | 35 (3.4%) |
| 18 to 34 Years | 0 (0.0%) | 47 (2.6%) |
| 35 to 64 Years | 102 (3.4%) | 132 (3.9%) |
| 65 to 74 Years | 0 (0.0%) | 23 (1.7%) |
| 75 Years and over | 8 (1.0%) | 67 (6.6%) |
Technology Access in Eastlake
Computing Device Access in Eastlake
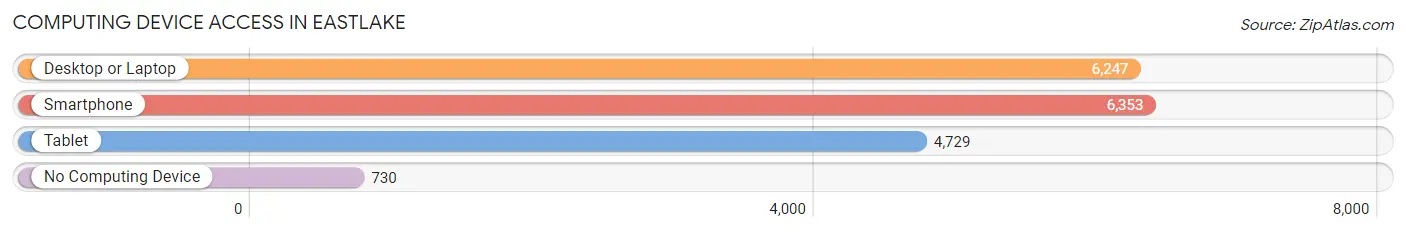
| Device Type | # Households | % Households |
| Desktop or Laptop | 6,247 | 77.3% |
| Smartphone | 6,353 | 78.6% |
| Tablet | 4,729 | 58.5% |
| No Computing Device | 730 | 9.0% |
| Total | 8,083 | 100.0% |
Internet Access in Eastlake
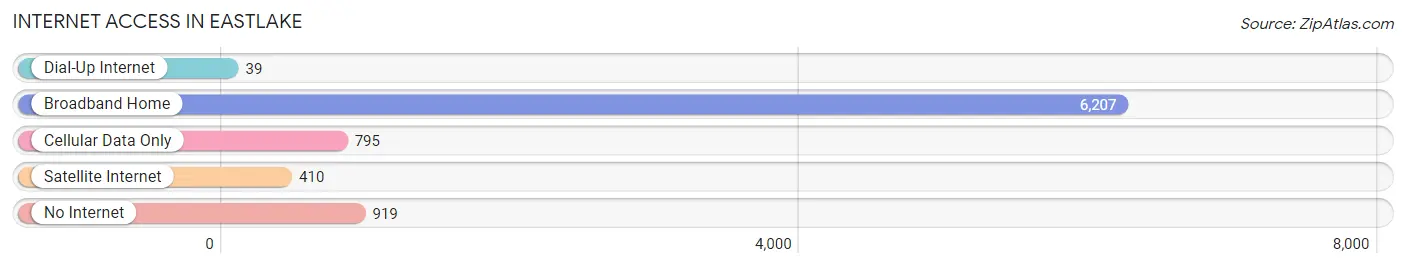
| Internet Type | # Households | % Households |
| Dial-Up Internet | 39 | 0.5% |
| Broadband Home | 6,207 | 76.8% |
| Cellular Data Only | 795 | 9.8% |
| Satellite Internet | 410 | 5.1% |
| No Internet | 919 | 11.4% |
| Total | 8,083 | 100.0% |
Eastlake Summary
Eastlake, Ohio is a city located in Lake County, Ohio, United States. It is part of the Greater Cleveland metropolitan area. The population was 18,577 at the 2010 census.
History
Eastlake was first settled in 1814 by a group of settlers from Connecticut. The town was originally known as East Fork, but was later changed to Eastlake in 1832. The town was officially incorporated in 1891.
Eastlake was a major industrial center in the early 20th century, with several steel mills and other factories located in the city. The city was also home to the Eastlake Speedway, a popular auto racing track.
Geography
Eastlake is located at 41°37′N 81°33′W (41.619, -81.547). According to the United States Census Bureau, the city has a total area of 8.2 square miles (21.2 km2), of which 8.1 square miles (21.0 km2) is land and 0.1 square miles (0.2 km2) is water.
Economy
Eastlake’s economy is largely based on manufacturing and retail. The city is home to several large manufacturing companies, including the Eastlake Manufacturing Company, which produces automotive parts, and the Eastlake Tool and Die Company, which produces industrial tools.
The city is also home to several retail stores including Walmart Target and Home Depot
Demographics
As of the 2010 census, there were 18,577 people, 7,845 households, and 5,072 families residing in the city. The population density was 2,288.3 people per square mile (886.2/km2). There were 8,445 housing units at an average density of 1,039.2 per square mile (400.7/km2). The racial makeup of the city was 94.2% White, 1.7% African American, 0.2% Native American, 1.2% Asian, 0.1% Pacific Islander, 0.7% from other races, and 1.9% from two or more races. Hispanic or Latino of any race were 2.7% of the population.
There were 7,845 households, out of which 28.2% had children under the age of 18 living with them, 48.2% were married couples living together, 12.3% had a female householder with no husband present, and 34.3% were non-families. 28.7% of all households were made up of individuals, and 10.2% had someone living alone who was 65 years of age or older. The average household size was 2.36 and the average family size was 2.90.
In the city, the population was spread out, with 22.2% under the age of 18, 8.2% from 18 to 24, 28.7% from 25 to 44, 25.2% from 45 to 64, and 15.7% who were 65 years of age or older. The median age was 39 years. For every 100 females, there were 93.2 males. For every 100 females age 18 and over, there were 90.2 males.
The median income for a household in the city was $45,945, and the median income for a family was $54,945. Males had a median income of $41,945 versus $30,945 for females. The per capita income for the city was $22,945. About 5.2% of families and 7.2% of the population were below the poverty line, including 9.2% of those under age 18 and 6.2% of those age 65 or over.
Common Questions
What is Per Capita Income in Eastlake?
Per Capita income in Eastlake is $34,750.
What is the Median Family Income in Eastlake?
Median Family Income in Eastlake is $79,044.
What is the Median Household income in Eastlake?
Median Household Income in Eastlake is $59,648.
What is Income or Wage Gap in Eastlake?
Income or Wage Gap in Eastlake is 15.4%.
Women in Eastlake earn 84.6 cents for every dollar earned by a man.
What is Family Income Deficit in Eastlake?
Family Income Deficit in Eastlake is $8,376.
Families that are below poverty line in Eastlake earn $8,376 less on average than the poverty threshold level.
What is Inequality or Gini Index in Eastlake?
Inequality or Gini Index in Eastlake is 0.39.
What is the Total Population of Eastlake?
Total Population of Eastlake is 17,625.
What is the Total Male Population of Eastlake?
Total Male Population of Eastlake is 8,696.
What is the Total Female Population of Eastlake?
Total Female Population of Eastlake is 8,929.
What is the Ratio of Males per 100 Females in Eastlake?
There are 97.39 Males per 100 Females in Eastlake.
What is the Ratio of Females per 100 Males in Eastlake?
There are 102.68 Females per 100 Males in Eastlake.
What is the Median Population Age in Eastlake?
Median Population Age in Eastlake is 46.8 Years.
What is the Average Family Size in Eastlake
Average Family Size in Eastlake is 2.9 People.
What is the Average Household Size in Eastlake
Average Household Size in Eastlake is 2.2 People.
How Large is the Labor Force in Eastlake?
There are 9,669 People in the Labor Forcein in Eastlake.
What is the Percentage of People in the Labor Force in Eastlake?
63.6% of People are in the Labor Force in Eastlake.
What is the Unemployment Rate in Eastlake?
Unemployment Rate in Eastlake is 5.8%.