Royal Oak, MI Map & Demographics
Royal Oak Map
Royal Oak Overview
$59,760
PER CAPITA INCOME
$128,868
AVG FAMILY INCOME
$92,799
AVG HOUSEHOLD INCOME
33.3%
WAGE / INCOME GAP [ % ]
66.7¢/ $1
WAGE / INCOME GAP [ $ ]
$9,619
FAMILY INCOME DEFICIT
0.42
INEQUALITY / GINI INDEX
58,053
TOTAL POPULATION
29,749
MALE POPULATION
28,304
FEMALE POPULATION
105.11
MALES / 100 FEMALES
95.14
FEMALES / 100 MALES
35.9
MEDIAN AGE
2.8
AVG FAMILY SIZE
2.0
AVG HOUSEHOLD SIZE
38,033
LABOR FORCE [ PEOPLE ]
75.5%
PERCENT IN LABOR FORCE
3.0%
UNEMPLOYMENT RATE
Income in Royal Oak
Income Overview in Royal Oak
Per Capita Income in Royal Oak is $59,760, while median incomes of families and households are $128,868 and $92,799 respectively.
| Characteristic | Number | Measure |
| Per Capita Income | 58,053 | $59,760 |
| Median Family Income | 12,802 | $128,868 |
| Mean Family Income | 12,802 | $153,821 |
| Median Household Income | 28,986 | $92,799 |
| Mean Household Income | 28,986 | $117,048 |
| Income Deficit | 12,802 | $9,619 |
| Wage / Income Gap (%) | 58,053 | 33.33% |
| Wage / Income Gap ($) | 58,053 | 66.67¢ per $1 |
| Gini / Inequality Index | 58,053 | 0.42 |
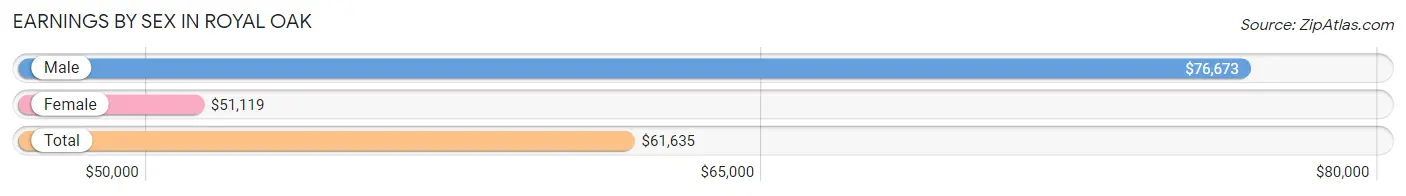
Earnings by Sex in Royal Oak
Average Earnings in Royal Oak are $61,635, $76,673 for men and $51,119 for women, a difference of 33.3%.
| Sex | Number | Average Earnings |
| Male | 21,079 (54.1%) | $76,673 |
| Female | 17,845 (45.9%) | $51,119 |
| Total | 38,924 (100.0%) | $61,635 |
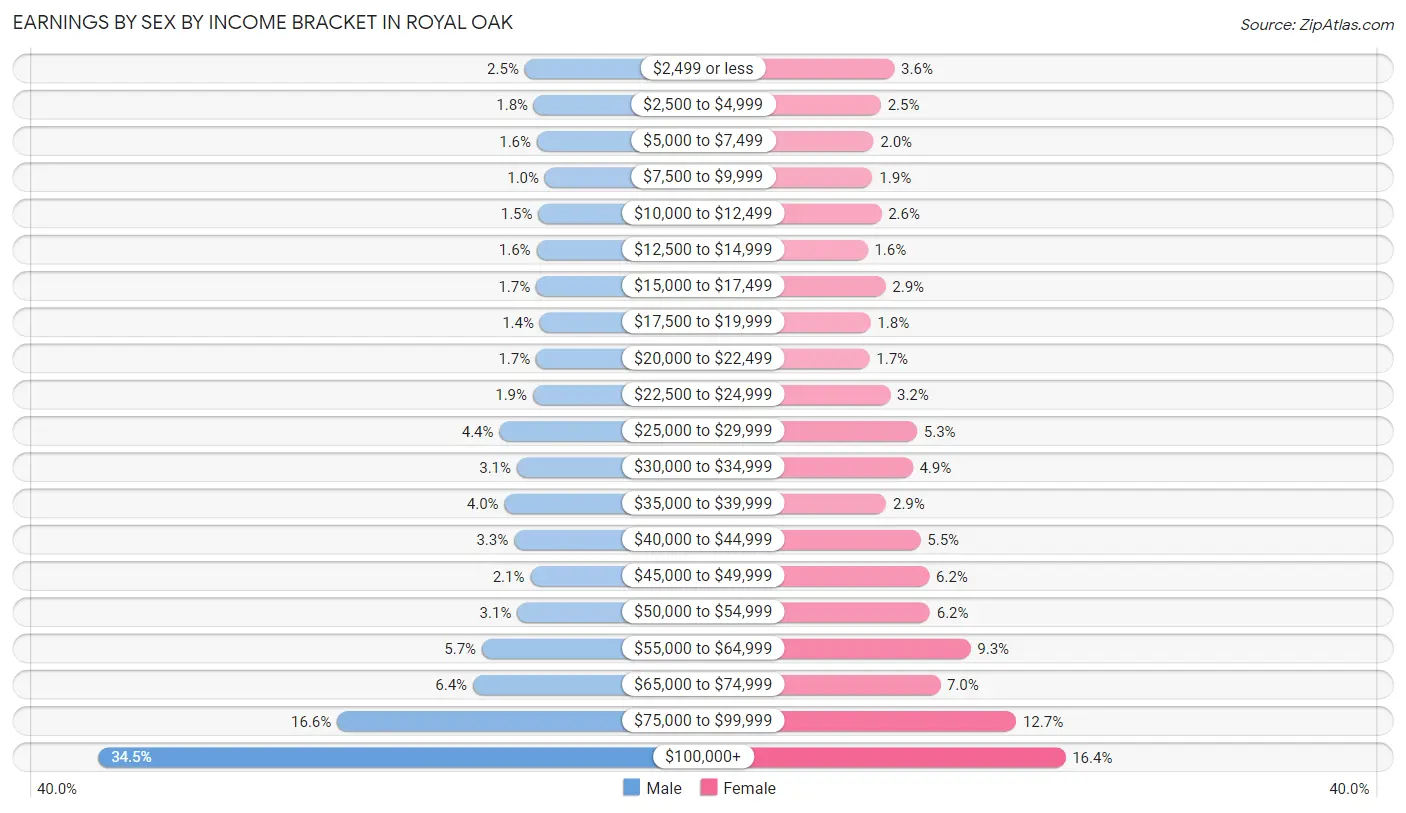
Earnings by Sex by Income Bracket in Royal Oak
The most common earnings brackets in Royal Oak are $100,000+ for men (7,267 | 34.5%) and $100,000+ for women (2,921 | 16.4%).
| Income | Male | Female |
| $2,499 or less | 532 (2.5%) | 633 (3.5%) |
| $2,500 to $4,999 | 385 (1.8%) | 453 (2.5%) |
| $5,000 to $7,499 | 340 (1.6%) | 355 (2.0%) |
| $7,500 to $9,999 | 213 (1.0%) | 343 (1.9%) |
| $10,000 to $12,499 | 317 (1.5%) | 460 (2.6%) |
| $12,500 to $14,999 | 345 (1.6%) | 276 (1.5%) |
| $15,000 to $17,499 | 352 (1.7%) | 515 (2.9%) |
| $17,500 to $19,999 | 292 (1.4%) | 316 (1.8%) |
| $20,000 to $22,499 | 352 (1.7%) | 301 (1.7%) |
| $22,500 to $24,999 | 403 (1.9%) | 579 (3.2%) |
| $25,000 to $29,999 | 932 (4.4%) | 937 (5.2%) |
| $30,000 to $34,999 | 655 (3.1%) | 878 (4.9%) |
| $35,000 to $39,999 | 852 (4.0%) | 524 (2.9%) |
| $40,000 to $44,999 | 699 (3.3%) | 983 (5.5%) |
| $45,000 to $49,999 | 442 (2.1%) | 1,101 (6.2%) |
| $50,000 to $54,999 | 650 (3.1%) | 1,110 (6.2%) |
| $55,000 to $64,999 | 1,207 (5.7%) | 1,652 (9.3%) |
| $65,000 to $74,999 | 1,350 (6.4%) | 1,246 (7.0%) |
| $75,000 to $99,999 | 3,494 (16.6%) | 2,262 (12.7%) |
| $100,000+ | 7,267 (34.5%) | 2,921 (16.4%) |
| Total | 21,079 (100.0%) | 17,845 (100.0%) |
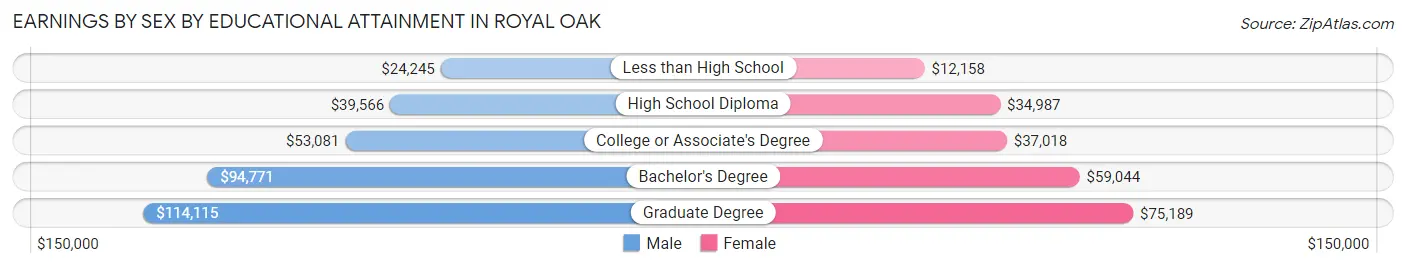
Earnings by Sex by Educational Attainment in Royal Oak
Average earnings in Royal Oak are $84,027 for men and $54,497 for women, a difference of 35.1%. Men with an educational attainment of graduate degree enjoy the highest average annual earnings of $114,115, while those with less than high school education earn the least with $24,245. Women with an educational attainment of graduate degree earn the most with the average annual earnings of $75,189, while those with less than high school education have the smallest earnings of $12,158.
| Educational Attainment | Male Income | Female Income |
| Less than High School | $24,245 | $12,158 |
| High School Diploma | $39,566 | $34,987 |
| College or Associate's Degree | $53,081 | $37,018 |
| Bachelor's Degree | $94,771 | $59,044 |
| Graduate Degree | $114,115 | $75,189 |
| Total | $84,027 | $54,497 |
Family Income in Royal Oak
Family Income Brackets in Royal Oak
According to the Royal Oak family income data, there are 3,008 families falling into the $200,000+ income range, which is the most common income bracket and makes up 23.5% of all families. Conversely, the $10,000 to $14,999 income bracket is the least frequent group with only 26 families (0.2%) belonging to this category.
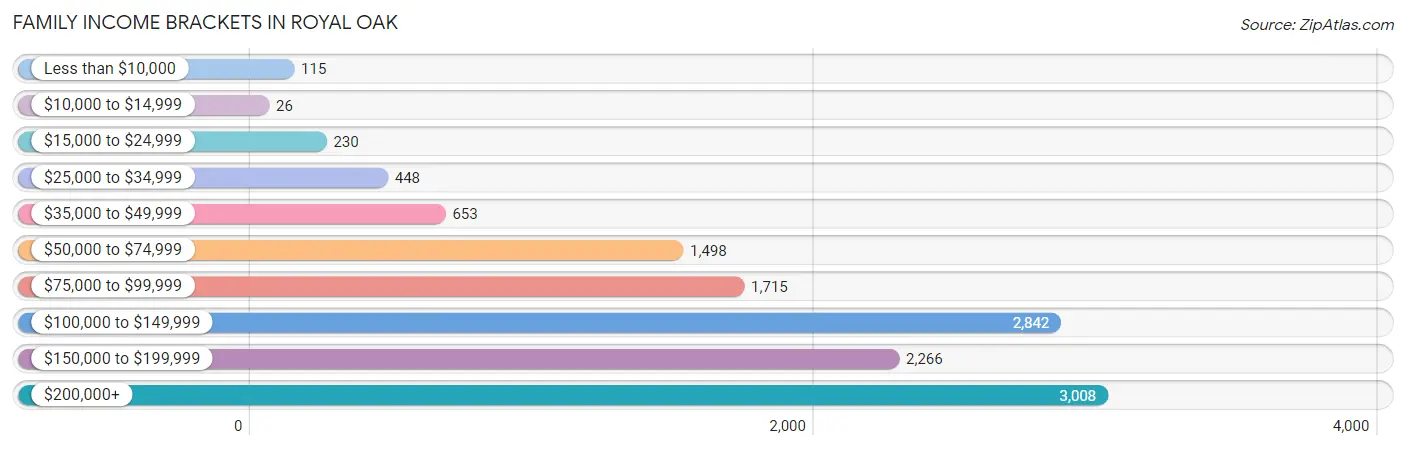
| Income Bracket | # Families | % Families |
| Less than $10,000 | 115 | 0.9% |
| $10,000 to $14,999 | 26 | 0.2% |
| $15,000 to $24,999 | 230 | 1.8% |
| $25,000 to $34,999 | 448 | 3.5% |
| $35,000 to $49,999 | 653 | 5.1% |
| $50,000 to $74,999 | 1,498 | 11.7% |
| $75,000 to $99,999 | 1,715 | 13.4% |
| $100,000 to $149,999 | 2,842 | 22.2% |
| $150,000 to $199,999 | 2,266 | 17.7% |
| $200,000+ | 3,008 | 23.5% |
Family Income by Famaliy Size in Royal Oak
7+ person families (141 | 1.1%) account for the highest median family income in Royal Oak with $198,841 per family, while 2-person families (7,121 | 55.6%) have the highest median income of $55,777 per family member.
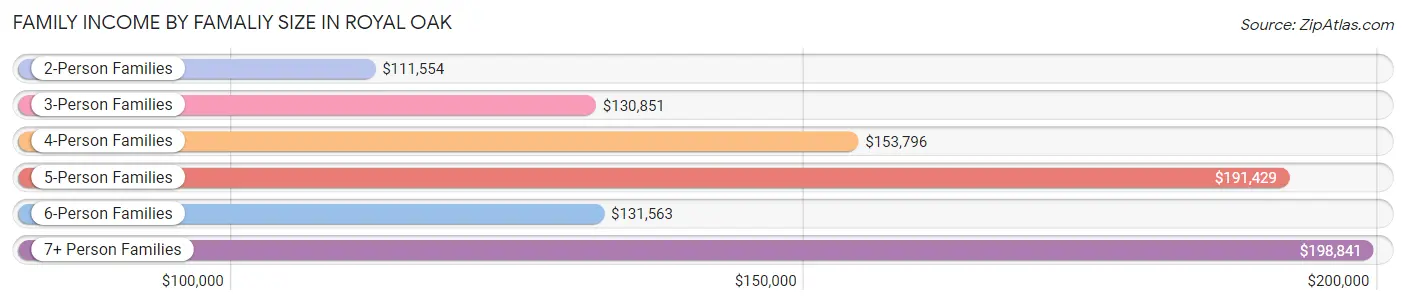
| Income Bracket | # Families | Median Income |
| 2-Person Families | 7,121 (55.6%) | $111,554 |
| 3-Person Families | 2,776 (21.7%) | $130,851 |
| 4-Person Families | 2,166 (16.9%) | $153,796 |
| 5-Person Families | 504 (3.9%) | $191,429 |
| 6-Person Families | 94 (0.7%) | $131,563 |
| 7+ Person Families | 141 (1.1%) | $198,841 |
| Total | 12,802 (100.0%) | $128,868 |
Family Income by Number of Earners in Royal Oak
The median family income in Royal Oak is $128,868, with families comprising 2 earners (6,849) having the highest median family income of $158,211, while families with no earners (1,485) have the lowest median family income of $67,886, accounting for 53.5% and 11.6% of families, respectively.
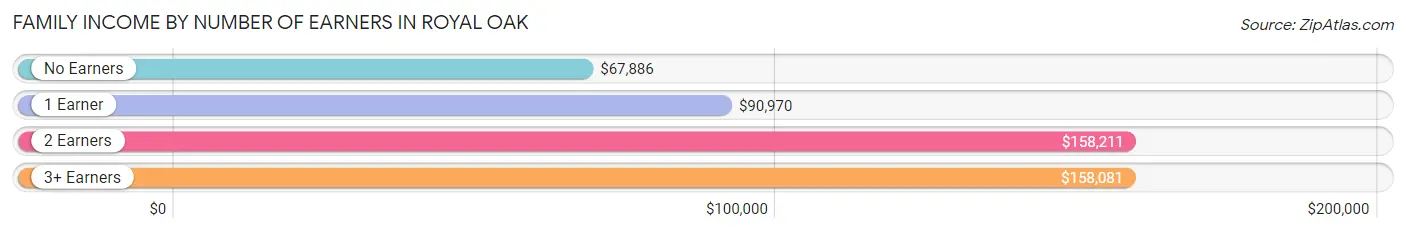
| Number of Earners | # Families | Median Income |
| No Earners | 1,485 (11.6%) | $67,886 |
| 1 Earner | 3,376 (26.4%) | $90,970 |
| 2 Earners | 6,849 (53.5%) | $158,211 |
| 3+ Earners | 1,092 (8.5%) | $158,081 |
| Total | 12,802 (100.0%) | $128,868 |
Household Income in Royal Oak
Household Income Brackets in Royal Oak
With 5,826 households falling in the category, the $100,000 to $149,999 income range is the most frequent in Royal Oak, accounting for 20.1% of all households. In contrast, only 522 households (1.8%) fall into the $10,000 to $14,999 income bracket, making it the least populous group.
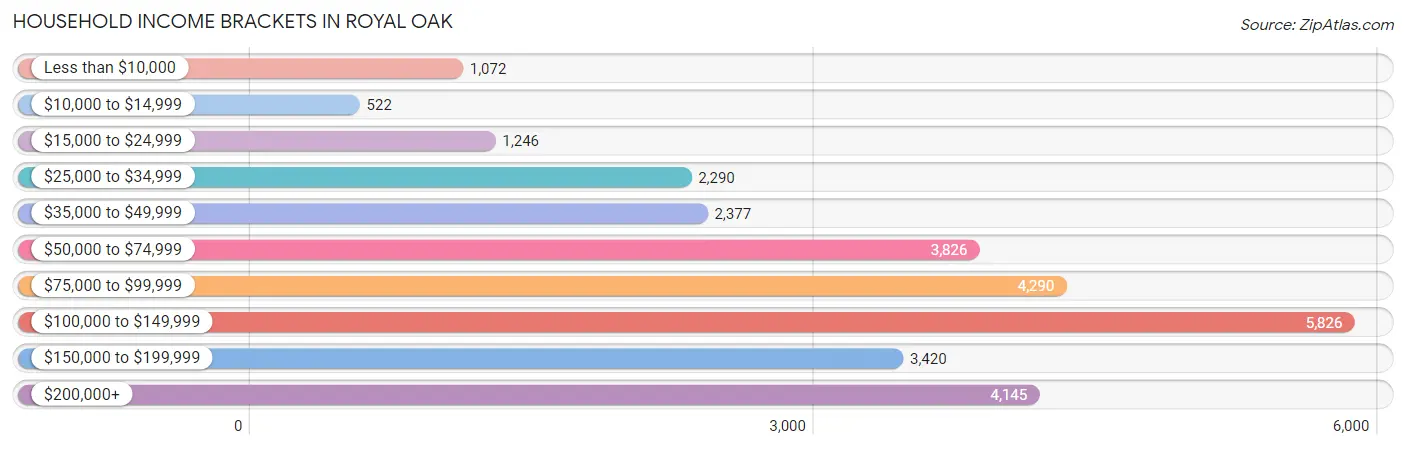
| Income Bracket | # Households | % Households |
| Less than $10,000 | 1,072 | 3.7% |
| $10,000 to $14,999 | 522 | 1.8% |
| $15,000 to $24,999 | 1,246 | 4.3% |
| $25,000 to $34,999 | 2,290 | 7.9% |
| $35,000 to $49,999 | 2,377 | 8.2% |
| $50,000 to $74,999 | 3,826 | 13.2% |
| $75,000 to $99,999 | 4,290 | 14.8% |
| $100,000 to $149,999 | 5,826 | 20.1% |
| $150,000 to $199,999 | 3,420 | 11.8% |
| $200,000+ | 4,145 | 14.3% |
Household Income by Householder Age in Royal Oak
The median household income in Royal Oak is $92,799, with the highest median household income of $115,640 found in the 25 to 44 years age bracket for the primary householder. A total of 12,572 households (43.4%) fall into this category. Meanwhile, the 65+ years age bracket for the primary householder has the lowest median household income of $54,815, with 5,974 households (20.6%) in this group.
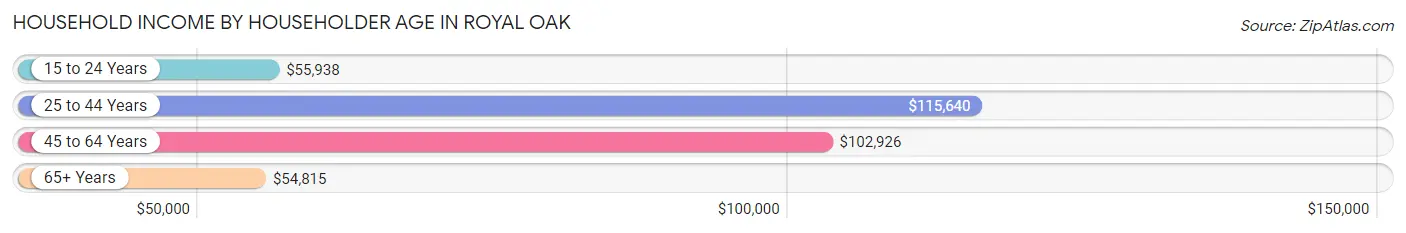
| Income Bracket | # Households | Median Income |
| 15 to 24 Years | 2,065 (7.1%) | $55,938 |
| 25 to 44 Years | 12,572 (43.4%) | $115,640 |
| 45 to 64 Years | 8,375 (28.9%) | $102,926 |
| 65+ Years | 5,974 (20.6%) | $54,815 |
| Total | 28,986 (100.0%) | $92,799 |
Poverty in Royal Oak
Income Below Poverty by Sex and Age in Royal Oak
With 6.5% poverty level for males and 6.5% for females among the residents of Royal Oak, 16 and 17 year old males and 75 year old and over females are the most vulnerable to poverty, with 102 males (22.6%) and 314 females (17.6%) in their respective age groups living below the poverty level.
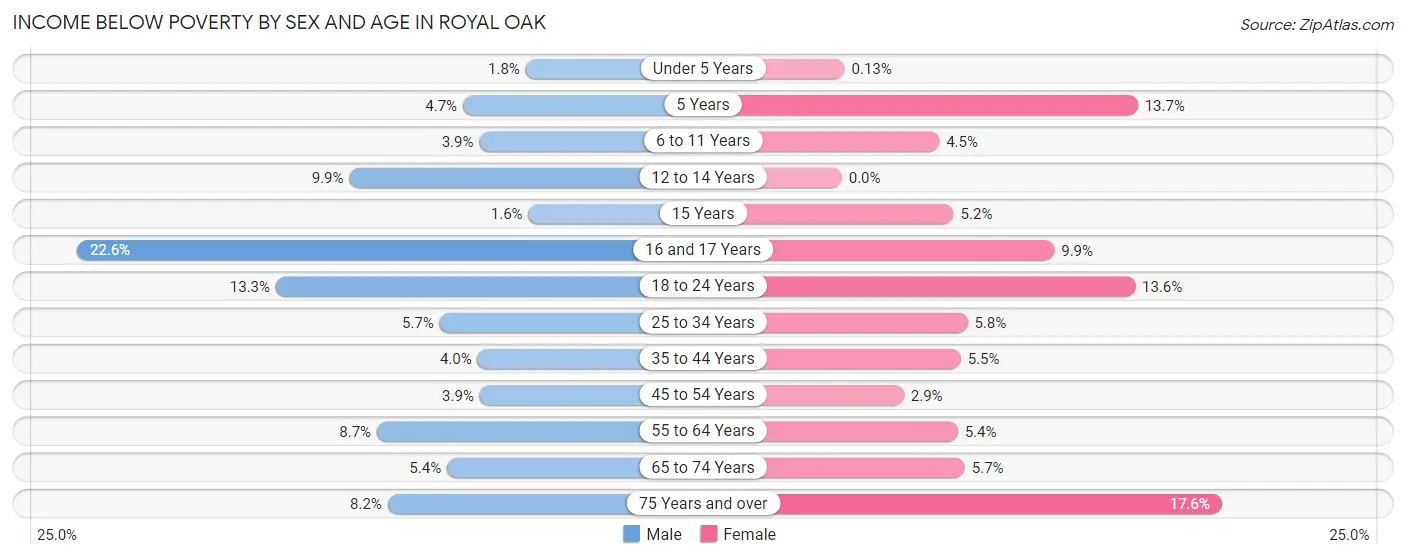
| Age Bracket | Male | Female |
| Under 5 Years | 28 (1.8%) | 2 (0.1%) |
| 5 Years | 15 (4.7%) | 57 (13.7%) |
| 6 to 11 Years | 44 (3.9%) | 62 (4.5%) |
| 12 to 14 Years | 40 (9.9%) | 0 (0.0%) |
| 15 Years | 3 (1.6%) | 14 (5.2%) |
| 16 and 17 Years | 102 (22.6%) | 29 (9.9%) |
| 18 to 24 Years | 417 (13.3%) | 320 (13.6%) |
| 25 to 34 Years | 428 (5.7%) | 387 (5.8%) |
| 35 to 44 Years | 163 (4.0%) | 199 (5.5%) |
| 45 to 54 Years | 126 (3.9%) | 94 (2.9%) |
| 55 to 64 Years | 332 (8.6%) | 190 (5.4%) |
| 65 to 74 Years | 141 (5.4%) | 154 (5.7%) |
| 75 Years and over | 97 (8.2%) | 314 (17.6%) |
| Total | 1,936 (6.5%) | 1,822 (6.5%) |
Income Above Poverty by Sex and Age in Royal Oak
According to the poverty statistics in Royal Oak, males aged 15 years and females aged 12 to 14 years are the age groups that are most secure financially, with 98.4% of males and 100.0% of females in these age groups living above the poverty line.
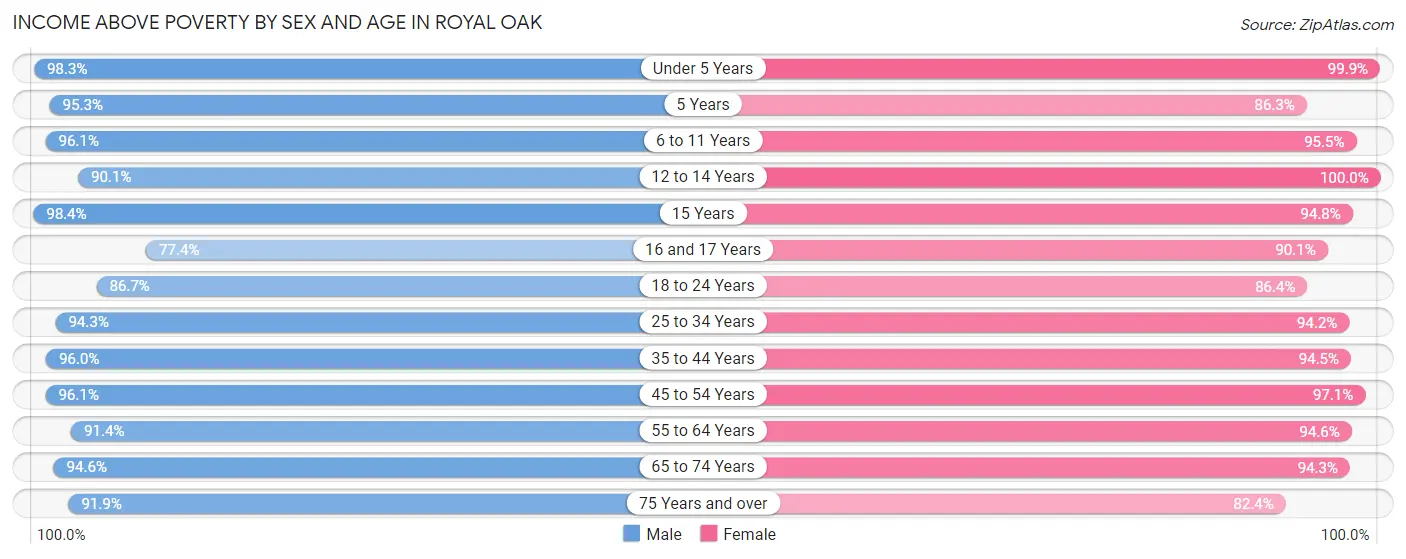
| Age Bracket | Male | Female |
| Under 5 Years | 1,576 (98.3%) | 1,586 (99.9%) |
| 5 Years | 307 (95.3%) | 358 (86.3%) |
| 6 to 11 Years | 1,083 (96.1%) | 1,310 (95.5%) |
| 12 to 14 Years | 363 (90.1%) | 319 (100.0%) |
| 15 Years | 182 (98.4%) | 256 (94.8%) |
| 16 and 17 Years | 350 (77.4%) | 265 (90.1%) |
| 18 to 24 Years | 2,710 (86.7%) | 2,031 (86.4%) |
| 25 to 34 Years | 7,032 (94.3%) | 6,249 (94.2%) |
| 35 to 44 Years | 3,936 (96.0%) | 3,406 (94.5%) |
| 45 to 54 Years | 3,120 (96.1%) | 3,172 (97.1%) |
| 55 to 64 Years | 3,505 (91.3%) | 3,343 (94.6%) |
| 65 to 74 Years | 2,468 (94.6%) | 2,543 (94.3%) |
| 75 Years and over | 1,093 (91.8%) | 1,467 (82.4%) |
| Total | 27,725 (93.5%) | 26,305 (93.5%) |
Income Below Poverty Among Married-Couple Families in Royal Oak
The poverty statistics for married-couple families in Royal Oak show that 1.2% or 117 of the total 10,043 families live below the poverty line. Families with 3 or 4 children have the highest poverty rate of 3.4%, comprising of 14 families. On the other hand, families with 5 or more children have the lowest poverty rate of 0.0%, which includes 0 families.
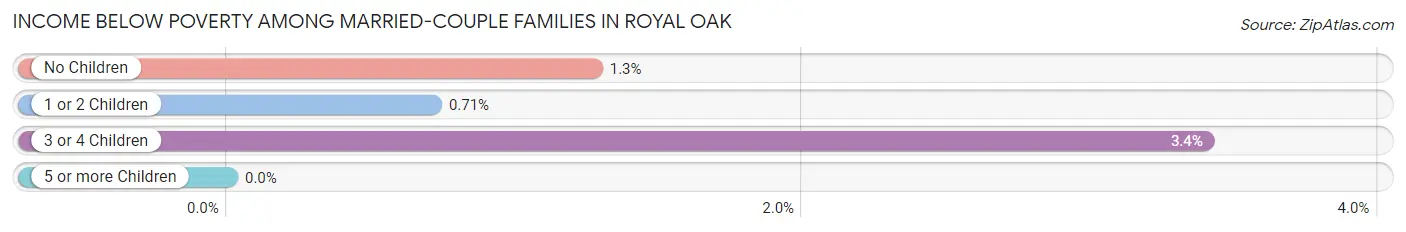
| Children | Above Poverty | Below Poverty |
| No Children | 6,223 (98.7%) | 80 (1.3%) |
| 1 or 2 Children | 3,233 (99.3%) | 23 (0.7%) |
| 3 or 4 Children | 398 (96.6%) | 14 (3.4%) |
| 5 or more Children | 72 (100.0%) | 0 (0.0%) |
| Total | 9,926 (98.8%) | 117 (1.2%) |
Income Below Poverty Among Single-Parent Households in Royal Oak
According to the poverty data in Royal Oak, 5.3% or 54 single-father households and 7.4% or 129 single-mother households are living below the poverty line. Among single-father households, those with 1 or 2 children have the highest poverty rate, with 31 households (10.6%) experiencing poverty. Likewise, among single-mother households, those with 1 or 2 children have the highest poverty rate, with 99 households (15.6%) falling below the poverty line.
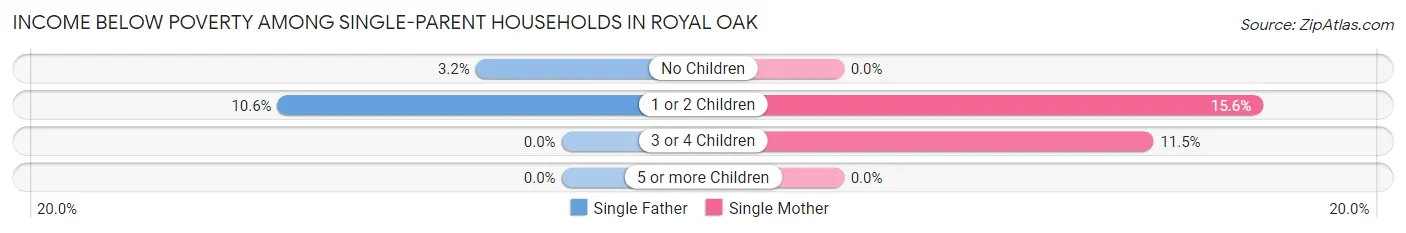
| Children | Single Father | Single Mother |
| No Children | 23 (3.2%) | 0 (0.0%) |
| 1 or 2 Children | 31 (10.6%) | 99 (15.6%) |
| 3 or 4 Children | 0 (0.0%) | 30 (11.5%) |
| 5 or more Children | 0 (0.0%) | 0 (0.0%) |
| Total | 54 (5.3%) | 129 (7.4%) |
Income Below Poverty Among Married-Couple vs Single-Parent Households in Royal Oak
The poverty data for Royal Oak shows that 117 of the married-couple family households (1.2%) and 183 of the single-parent households (6.6%) are living below the poverty level. Within the married-couple family households, those with 3 or 4 children have the highest poverty rate, with 14 households (3.4%) falling below the poverty line. Among the single-parent households, those with 1 or 2 children have the highest poverty rate, with 130 household (14.0%) living below poverty.
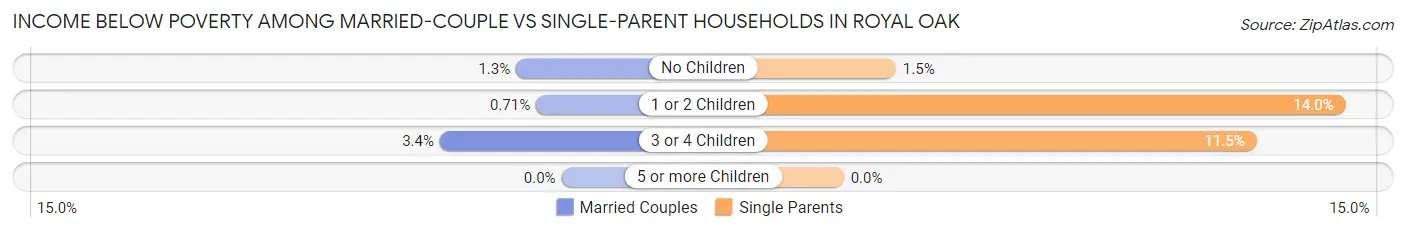
| Children | Married-Couple Families | Single-Parent Households |
| No Children | 80 (1.3%) | 23 (1.5%) |
| 1 or 2 Children | 23 (0.7%) | 130 (14.0%) |
| 3 or 4 Children | 14 (3.4%) | 30 (11.5%) |
| 5 or more Children | 0 (0.0%) | 0 (0.0%) |
| Total | 117 (1.2%) | 183 (6.6%) |
Race in Royal Oak
The most populous races in Royal Oak are White / Caucasian (49,322 | 85.0%), Black / African American (3,221 | 5.6%), and Two or more Races (2,810 | 4.8%).
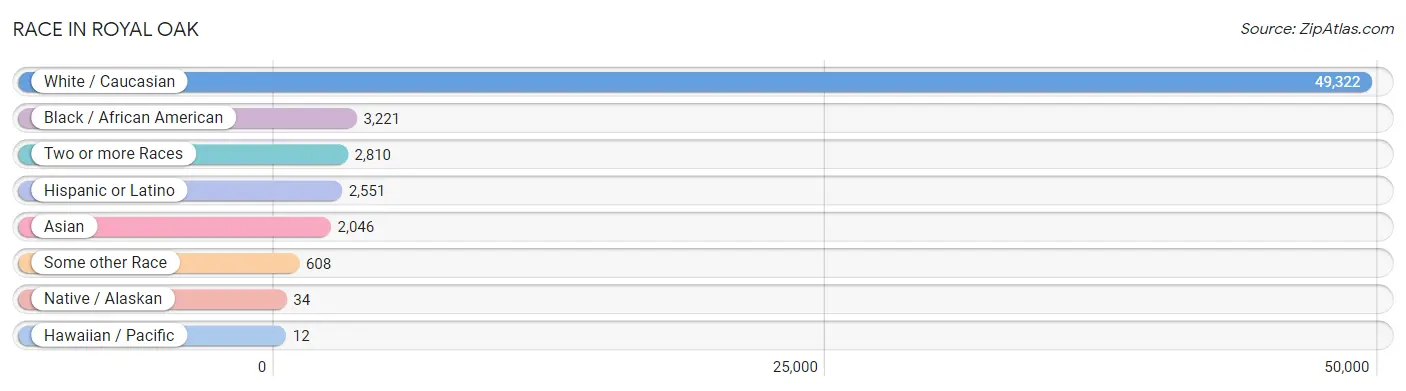
| Race | # Population | % Population |
| Asian | 2,046 | 3.5% |
| Black / African American | 3,221 | 5.6% |
| Hawaiian / Pacific | 12 | 0.0% |
| Hispanic or Latino | 2,551 | 4.4% |
| Native / Alaskan | 34 | 0.1% |
| White / Caucasian | 49,322 | 85.0% |
| Two or more Races | 2,810 | 4.8% |
| Some other Race | 608 | 1.1% |
| Total | 58,053 | 100.0% |
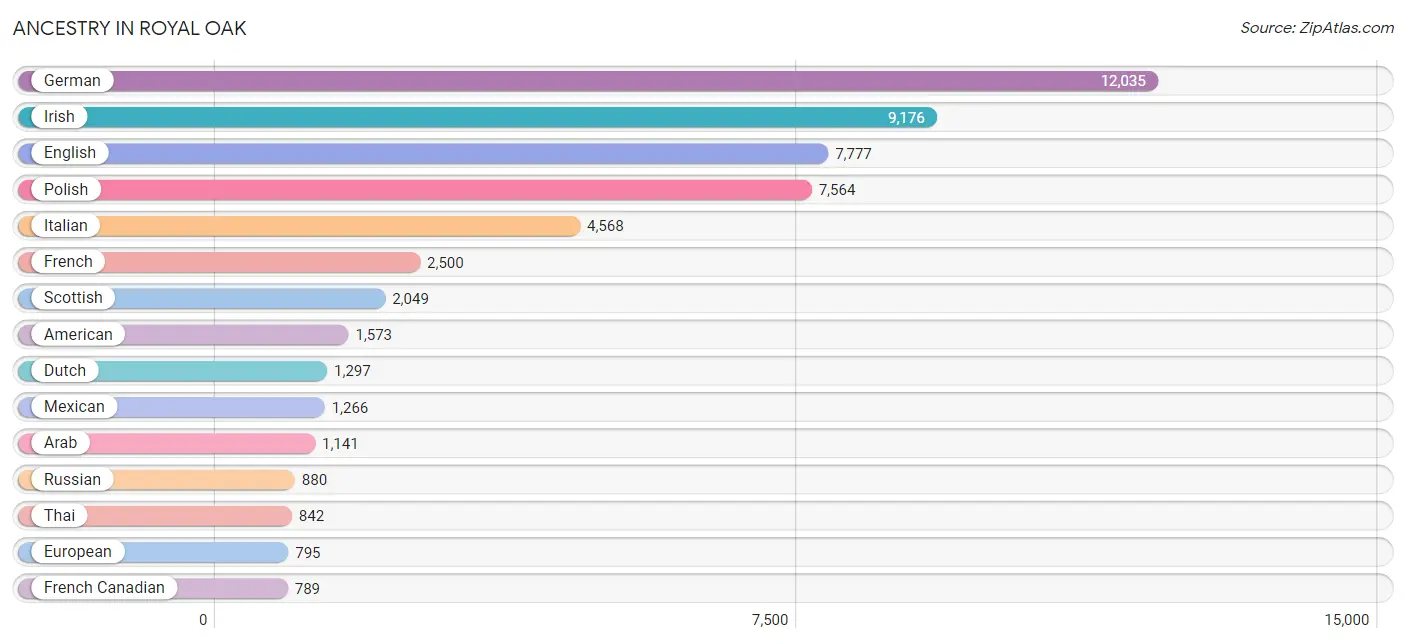
Ancestry in Royal Oak
The most populous ancestries reported in Royal Oak are German (12,035 | 20.7%), Irish (9,176 | 15.8%), English (7,777 | 13.4%), Polish (7,564 | 13.0%), and Italian (4,568 | 7.9%), together accounting for 70.8% of all Royal Oak residents.
| Ancestry | # Population | % Population |
| Afghan | 15 | 0.0% |
| African | 152 | 0.3% |
| Albanian | 233 | 0.4% |
| American | 1,573 | 2.7% |
| Apache | 49 | 0.1% |
| Arab | 1,141 | 2.0% |
| Argentinean | 125 | 0.2% |
| Armenian | 254 | 0.4% |
| Assyrian / Chaldean / Syriac | 149 | 0.3% |
| Australian | 23 | 0.0% |
| Austrian | 215 | 0.4% |
| Bangladeshi | 11 | 0.0% |
| Basque | 5 | 0.0% |
| Belgian | 395 | 0.7% |
| Bhutanese | 207 | 0.4% |
| Blackfeet | 13 | 0.0% |
| Brazilian | 155 | 0.3% |
| British | 450 | 0.8% |
| Bulgarian | 16 | 0.0% |
| Burmese | 494 | 0.9% |
| Canadian | 365 | 0.6% |
| Carpatho Rusyn | 101 | 0.2% |
| Celtic | 25 | 0.0% |
| Central American | 80 | 0.1% |
| Cherokee | 74 | 0.1% |
| Chilean | 31 | 0.1% |
| Chippewa | 11 | 0.0% |
| Colombian | 49 | 0.1% |
| Costa Rican | 43 | 0.1% |
| Croatian | 94 | 0.2% |
| Cuban | 119 | 0.2% |
| Cypriot | 27 | 0.1% |
| Czech | 394 | 0.7% |
| Czechoslovakian | 153 | 0.3% |
| Danish | 212 | 0.4% |
| Dominican | 99 | 0.2% |
| Dutch | 1,297 | 2.2% |
| Eastern European | 344 | 0.6% |
| Egyptian | 136 | 0.2% |
| English | 7,777 | 13.4% |
| Ethiopian | 11 | 0.0% |
| European | 795 | 1.4% |
| Filipino | 24 | 0.0% |
| Finnish | 719 | 1.2% |
| French | 2,500 | 4.3% |
| French American Indian | 12 | 0.0% |
| French Canadian | 789 | 1.4% |
| German | 12,035 | 20.7% |
| German Russian | 9 | 0.0% |
| Greek | 580 | 1.0% |
| Guamanian / Chamorro | 12 | 0.0% |
| Guatemalan | 12 | 0.0% |
| Guyanese | 59 | 0.1% |
| Hungarian | 546 | 0.9% |
| Icelander | 8 | 0.0% |
| Indian (Asian) | 632 | 1.1% |
| Iranian | 30 | 0.1% |
| Iraqi | 146 | 0.3% |
| Irish | 9,176 | 15.8% |
| Iroquois | 32 | 0.1% |
| Israeli | 45 | 0.1% |
| Italian | 4,568 | 7.9% |
| Jamaican | 13 | 0.0% |
| Japanese | 9 | 0.0% |
| Jordanian | 15 | 0.0% |
| Korean | 388 | 0.7% |
| Laotian | 60 | 0.1% |
| Latvian | 27 | 0.1% |
| Lebanese | 507 | 0.9% |
| Lithuanian | 327 | 0.6% |
| Macedonian | 103 | 0.2% |
| Maltese | 121 | 0.2% |
| Mexican | 1,266 | 2.2% |
| Moroccan | 4 | 0.0% |
| Native Hawaiian | 34 | 0.1% |
| New Zealander | 7 | 0.0% |
| Northern European | 153 | 0.3% |
| Norwegian | 586 | 1.0% |
| Palestinian | 14 | 0.0% |
| Panamanian | 16 | 0.0% |
| Pennsylvania German | 11 | 0.0% |
| Peruvian | 16 | 0.0% |
| Polish | 7,564 | 13.0% |
| Portuguese | 60 | 0.1% |
| Potawatomi | 7 | 0.0% |
| Puerto Rican | 161 | 0.3% |
| Romanian | 266 | 0.5% |
| Russian | 880 | 1.5% |
| Samoan | 10 | 0.0% |
| Scandinavian | 98 | 0.2% |
| Scotch-Irish | 673 | 1.2% |
| Scottish | 2,049 | 3.5% |
| Seminole | 4 | 0.0% |
| Serbian | 42 | 0.1% |
| Sioux | 14 | 0.0% |
| Slavic | 19 | 0.0% |
| Slovak | 166 | 0.3% |
| Slovene | 53 | 0.1% |
| South American | 235 | 0.4% |
| Spaniard | 82 | 0.1% |
| Spanish | 414 | 0.7% |
| Sri Lankan | 90 | 0.2% |
| Subsaharan African | 163 | 0.3% |
| Swedish | 537 | 0.9% |
| Swiss | 247 | 0.4% |
| Syrian | 120 | 0.2% |
| Thai | 842 | 1.5% |
| Ukrainian | 472 | 0.8% |
| Venezuelan | 14 | 0.0% |
| Welsh | 403 | 0.7% |
| Yugoslavian | 62 | 0.1% | View All 111 Rows |
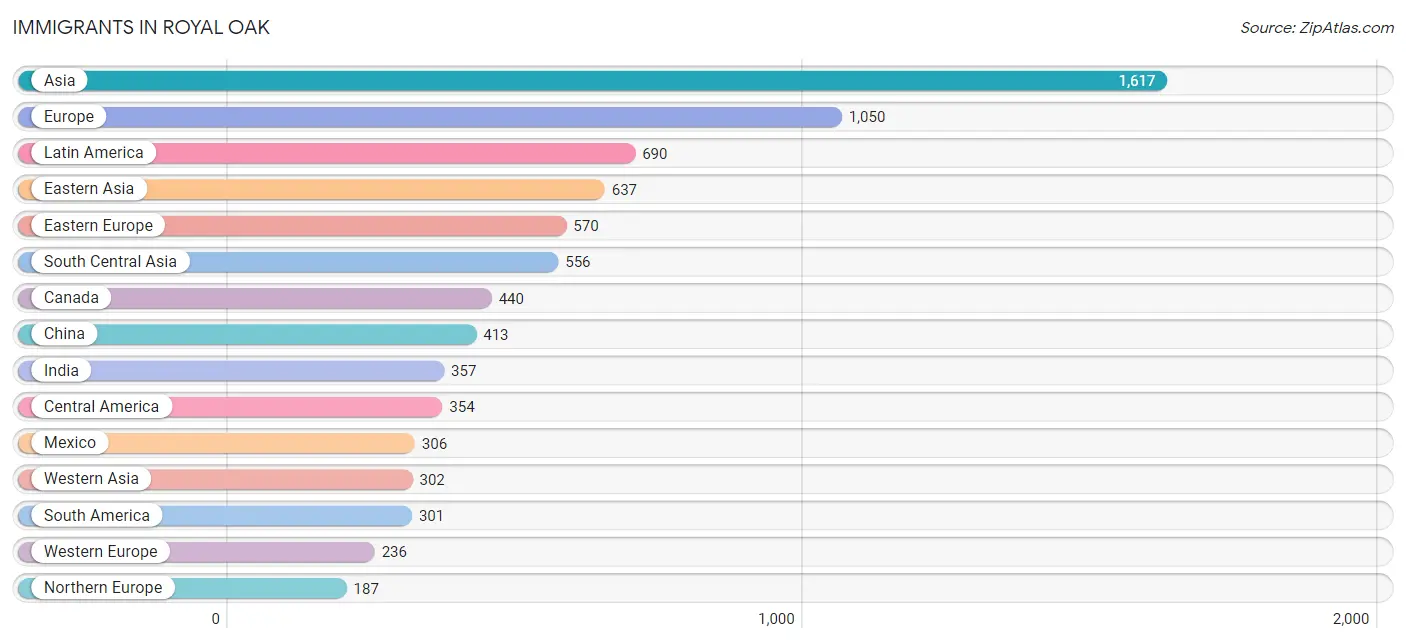
Immigrants in Royal Oak
The most numerous immigrant groups reported in Royal Oak came from Asia (1,617 | 2.8%), Europe (1,050 | 1.8%), Latin America (690 | 1.2%), Eastern Asia (637 | 1.1%), and Eastern Europe (570 | 1.0%), together accounting for 7.9% of all Royal Oak residents.
| Immigration Origin | # Population | % Population |
| Africa | 61 | 0.1% |
| Albania | 98 | 0.2% |
| Argentina | 77 | 0.1% |
| Asia | 1,617 | 2.8% |
| Australia | 10 | 0.0% |
| Belarus | 25 | 0.0% |
| Belgium | 16 | 0.0% |
| Brazil | 177 | 0.3% |
| Bulgaria | 9 | 0.0% |
| Canada | 440 | 0.8% |
| Caribbean | 35 | 0.1% |
| Central America | 354 | 0.6% |
| Chile | 13 | 0.0% |
| China | 413 | 0.7% |
| Colombia | 13 | 0.0% |
| Costa Rica | 43 | 0.1% |
| Cuba | 8 | 0.0% |
| Czechoslovakia | 8 | 0.0% |
| Dominican Republic | 27 | 0.1% |
| Eastern Asia | 637 | 1.1% |
| Eastern Europe | 570 | 1.0% |
| England | 77 | 0.1% |
| Europe | 1,050 | 1.8% |
| France | 125 | 0.2% |
| Germany | 88 | 0.2% |
| Greece | 12 | 0.0% |
| Guatemala | 5 | 0.0% |
| Hungary | 15 | 0.0% |
| India | 357 | 0.6% |
| Indonesia | 21 | 0.0% |
| Iran | 18 | 0.0% |
| Iraq | 185 | 0.3% |
| Israel | 57 | 0.1% |
| Italy | 33 | 0.1% |
| Japan | 79 | 0.1% |
| Jordan | 20 | 0.0% |
| Korea | 145 | 0.3% |
| Laos | 4 | 0.0% |
| Latin America | 690 | 1.2% |
| Latvia | 19 | 0.0% |
| Lebanon | 21 | 0.0% |
| Mexico | 306 | 0.5% |
| Moldova | 31 | 0.1% |
| Nepal | 145 | 0.3% |
| Netherlands | 4 | 0.0% |
| Northern Africa | 25 | 0.0% |
| Northern Europe | 187 | 0.3% |
| Norway | 11 | 0.0% |
| Oceania | 10 | 0.0% |
| Pakistan | 16 | 0.0% |
| Peru | 7 | 0.0% |
| Philippines | 80 | 0.1% |
| Poland | 126 | 0.2% |
| Romania | 25 | 0.0% |
| Russia | 178 | 0.3% |
| Scotland | 8 | 0.0% |
| Senegal | 36 | 0.1% |
| South America | 301 | 0.5% |
| South Central Asia | 556 | 1.0% |
| South Eastern Asia | 122 | 0.2% |
| Southern Europe | 45 | 0.1% |
| Sri Lanka | 5 | 0.0% |
| Switzerland | 3 | 0.0% |
| Syria | 9 | 0.0% |
| Taiwan | 74 | 0.1% |
| Ukraine | 26 | 0.0% |
| Uzbekistan | 15 | 0.0% |
| Venezuela | 14 | 0.0% |
| Vietnam | 17 | 0.0% |
| Western Africa | 36 | 0.1% |
| Western Asia | 302 | 0.5% |
| Western Europe | 236 | 0.4% | View All 72 Rows |
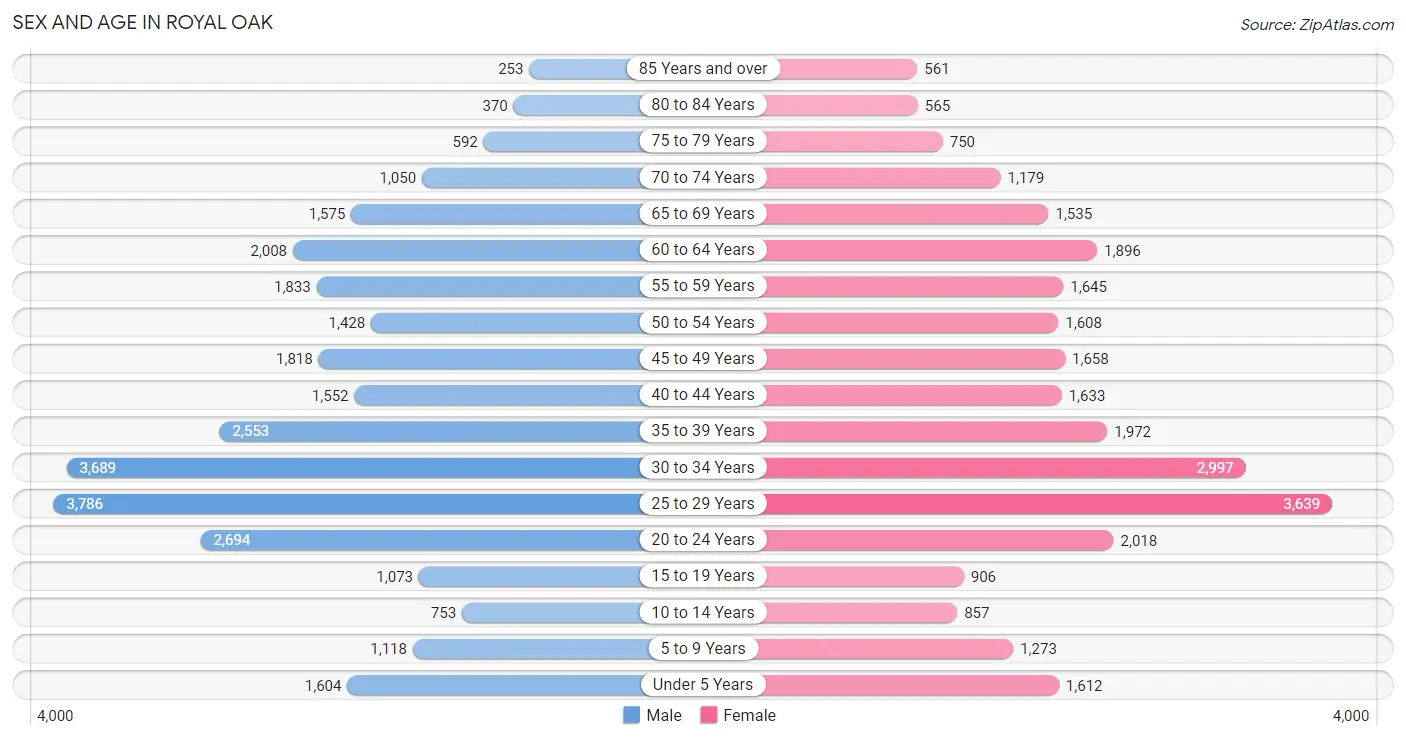
Sex and Age in Royal Oak
Sex and Age in Royal Oak
The most populous age groups in Royal Oak are 25 to 29 Years (3,786 | 12.7%) for men and 25 to 29 Years (3,639 | 12.9%) for women.
| Age Bracket | Male | Female |
| Under 5 Years | 1,604 (5.4%) | 1,612 (5.7%) |
| 5 to 9 Years | 1,118 (3.8%) | 1,273 (4.5%) |
| 10 to 14 Years | 753 (2.5%) | 857 (3.0%) |
| 15 to 19 Years | 1,073 (3.6%) | 906 (3.2%) |
| 20 to 24 Years | 2,694 (9.1%) | 2,018 (7.1%) |
| 25 to 29 Years | 3,786 (12.7%) | 3,639 (12.9%) |
| 30 to 34 Years | 3,689 (12.4%) | 2,997 (10.6%) |
| 35 to 39 Years | 2,553 (8.6%) | 1,972 (7.0%) |
| 40 to 44 Years | 1,552 (5.2%) | 1,633 (5.8%) |
| 45 to 49 Years | 1,818 (6.1%) | 1,658 (5.9%) |
| 50 to 54 Years | 1,428 (4.8%) | 1,608 (5.7%) |
| 55 to 59 Years | 1,833 (6.2%) | 1,645 (5.8%) |
| 60 to 64 Years | 2,008 (6.8%) | 1,896 (6.7%) |
| 65 to 69 Years | 1,575 (5.3%) | 1,535 (5.4%) |
| 70 to 74 Years | 1,050 (3.5%) | 1,179 (4.2%) |
| 75 to 79 Years | 592 (2.0%) | 750 (2.6%) |
| 80 to 84 Years | 370 (1.2%) | 565 (2.0%) |
| 85 Years and over | 253 (0.9%) | 561 (2.0%) |
| Total | 29,749 (100.0%) | 28,304 (100.0%) |
Families and Households in Royal Oak
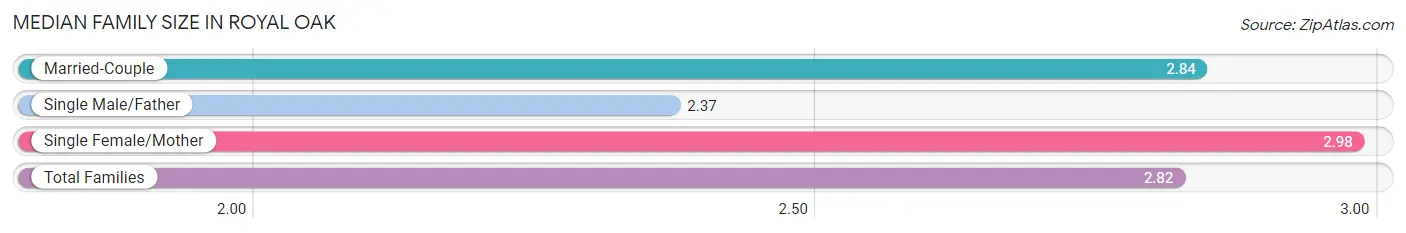
Median Family Size in Royal Oak
The median family size in Royal Oak is 2.82 persons per family, with single female/mother families (1,748 | 13.7%) accounting for the largest median family size of 2.98 persons per family. On the other hand, single male/father families (1,011 | 7.9%) represent the smallest median family size with 2.37 persons per family.
| Family Type | # Families | Family Size |
| Married-Couple | 10,043 (78.4%) | 2.84 |
| Single Male/Father | 1,011 (7.9%) | 2.37 |
| Single Female/Mother | 1,748 (13.7%) | 2.98 |
| Total Families | 12,802 (100.0%) | 2.82 |
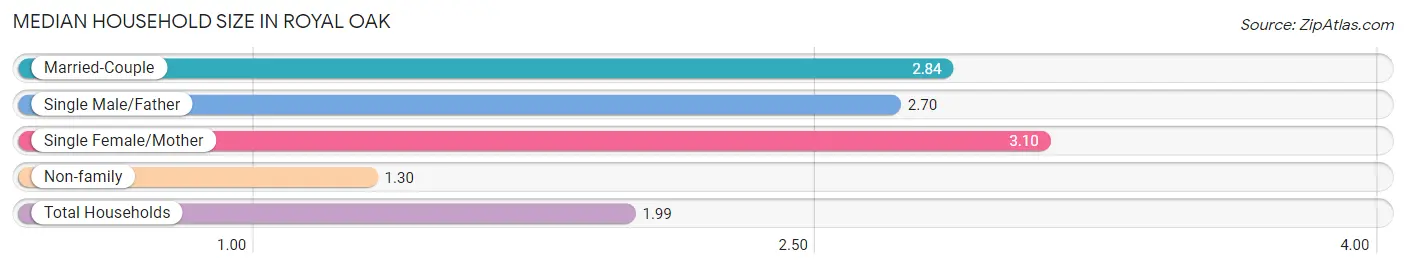
Median Household Size in Royal Oak
The median household size in Royal Oak is 1.99 persons per household, with single female/mother households (1,748 | 6.0%) accounting for the largest median household size of 3.1 persons per household. non-family households (16,184 | 55.8%) represent the smallest median household size with 1.30 persons per household.
| Household Type | # Households | Household Size |
| Married-Couple | 10,043 (34.6%) | 2.84 |
| Single Male/Father | 1,011 (3.5%) | 2.70 |
| Single Female/Mother | 1,748 (6.0%) | 3.10 |
| Non-family | 16,184 (55.8%) | 1.30 |
| Total Households | 28,986 (100.0%) | 1.99 |
Household Size by Marriage Status in Royal Oak
Out of a total of 28,986 households in Royal Oak, 12,802 (44.2%) are family households, while 16,184 (55.8%) are nonfamily households. The most numerous type of family households are 2-person households, comprising 6,783, and the most common type of nonfamily households are 1-person households, comprising 12,434.
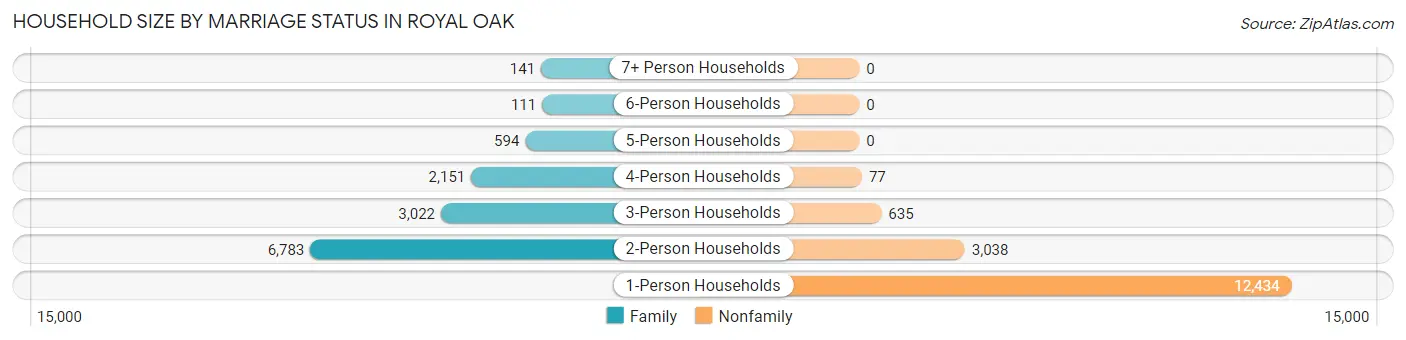
| Household Size | Family Households | Nonfamily Households |
| 1-Person Households | - | 12,434 (42.9%) |
| 2-Person Households | 6,783 (23.4%) | 3,038 (10.5%) |
| 3-Person Households | 3,022 (10.4%) | 635 (2.2%) |
| 4-Person Households | 2,151 (7.4%) | 77 (0.3%) |
| 5-Person Households | 594 (2.1%) | 0 (0.0%) |
| 6-Person Households | 111 (0.4%) | 0 (0.0%) |
| 7+ Person Households | 141 (0.5%) | 0 (0.0%) |
| Total | 12,802 (44.2%) | 16,184 (55.8%) |
Female Fertility in Royal Oak
Fertility by Age in Royal Oak
Average fertility rate in Royal Oak is 45.0 births per 1,000 women. Women in the age bracket of 20 to 34 years have the highest fertility rate with 56.0 births per 1,000 women. Women in the age bracket of 20 to 34 years acount for 71.6% of all women with births.
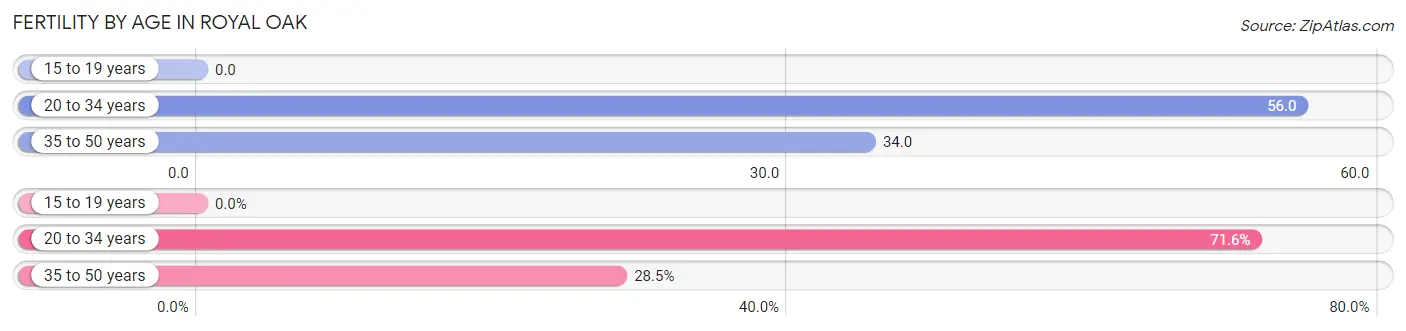
| Age Bracket | Women with Births | Births / 1,000 Women |
| 15 to 19 years | 0 (0.0%) | 0.0 |
| 20 to 34 years | 488 (71.6%) | 56.0 |
| 35 to 50 years | 194 (28.4%) | 34.0 |
| Total | 682 (100.0%) | 45.0 |
Fertility by Age by Marriage Status in Royal Oak
92.1% of women with births (682) in Royal Oak are married. The highest percentage of unmarried women with births falls into 20 to 34 years age bracket with 11.1% of them unmarried at the time of birth, while the lowest percentage of unmarried women with births belong to 35 to 50 years age bracket with 0.0% of them unmarried.
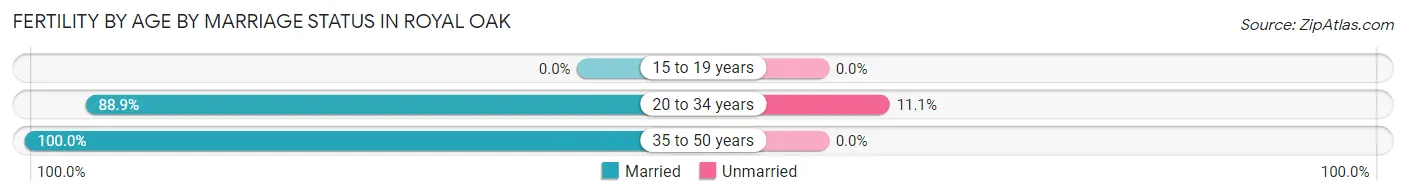
| Age Bracket | Married | Unmarried |
| 15 to 19 years | 0 (0.0%) | 0 (0.0%) |
| 20 to 34 years | 434 (88.9%) | 54 (11.1%) |
| 35 to 50 years | 194 (100.0%) | 0 (0.0%) |
| Total | 628 (92.1%) | 54 (7.9%) |
Fertility by Education in Royal Oak
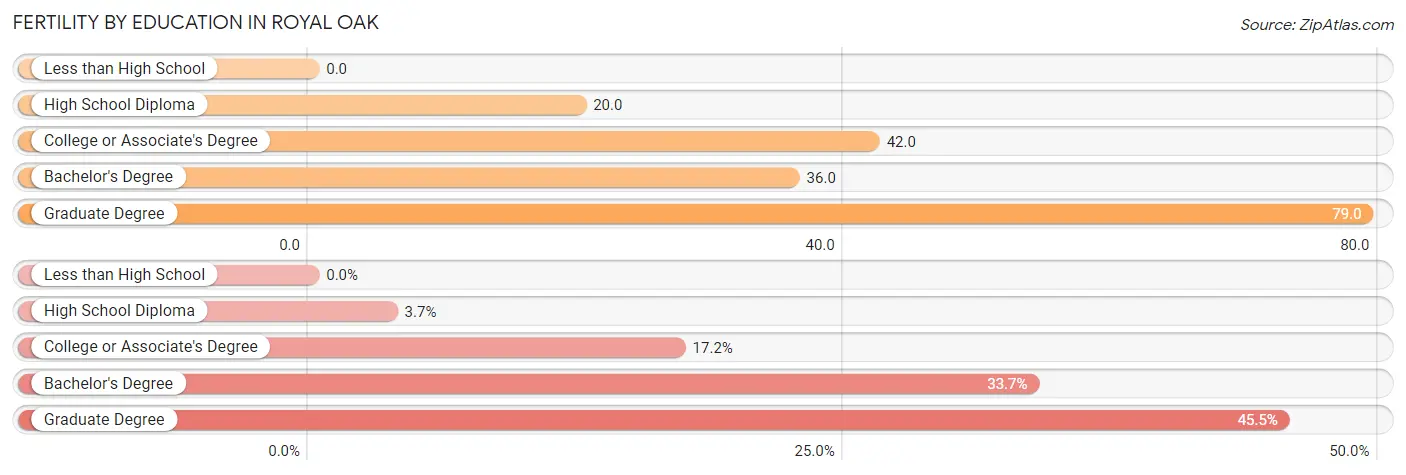
| Educational Attainment | Women with Births | Births / 1,000 Women |
| Less than High School | 0 (0.0%) | 0.0 |
| High School Diploma | 25 (3.7%) | 20.0 |
| College or Associate's Degree | 117 (17.2%) | 42.0 |
| Bachelor's Degree | 230 (33.7%) | 36.0 |
| Graduate Degree | 310 (45.5%) | 79.0 |
| Total | 682 (100.0%) | 45.0 |
Fertility by Education by Marriage Status in Royal Oak
7.9% of women with births in Royal Oak are unmarried. Women with the educational attainment of high school diploma are most likely to be married with 100.0% of them married at childbirth, while women with the educational attainment of college or associate's degree are least likely to be married with 33.3% of them unmarried at childbirth.
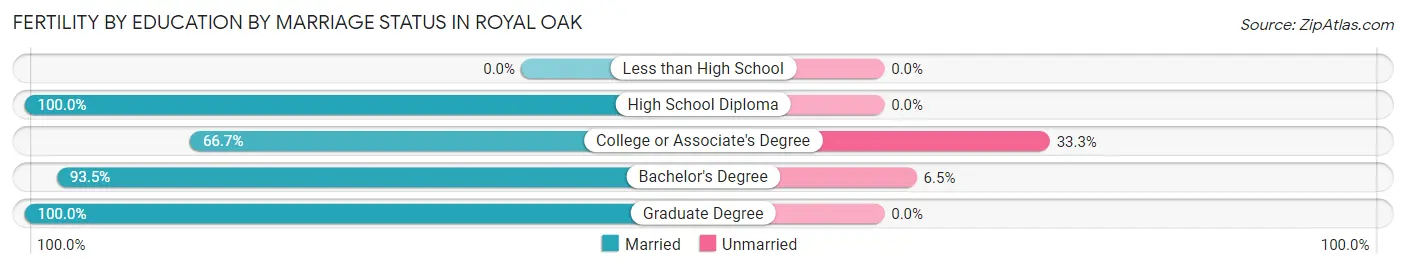
| Educational Attainment | Married | Unmarried |
| Less than High School | 0 (0.0%) | 0 (0.0%) |
| High School Diploma | 25 (100.0%) | 0 (0.0%) |
| College or Associate's Degree | 78 (66.7%) | 39 (33.3%) |
| Bachelor's Degree | 215 (93.5%) | 15 (6.5%) |
| Graduate Degree | 310 (100.0%) | 0 (0.0%) |
| Total | 628 (92.1%) | 54 (7.9%) |
Employment Characteristics in Royal Oak
Employment by Class of Employer in Royal Oak
Among the 36,317 employed individuals in Royal Oak, private company employees (26,165 | 72.1%), not-for-profit organizations (4,087 | 11.3%), and self-employed (not incorporated) (1,715 | 4.7%) make up the most common classes of employment.
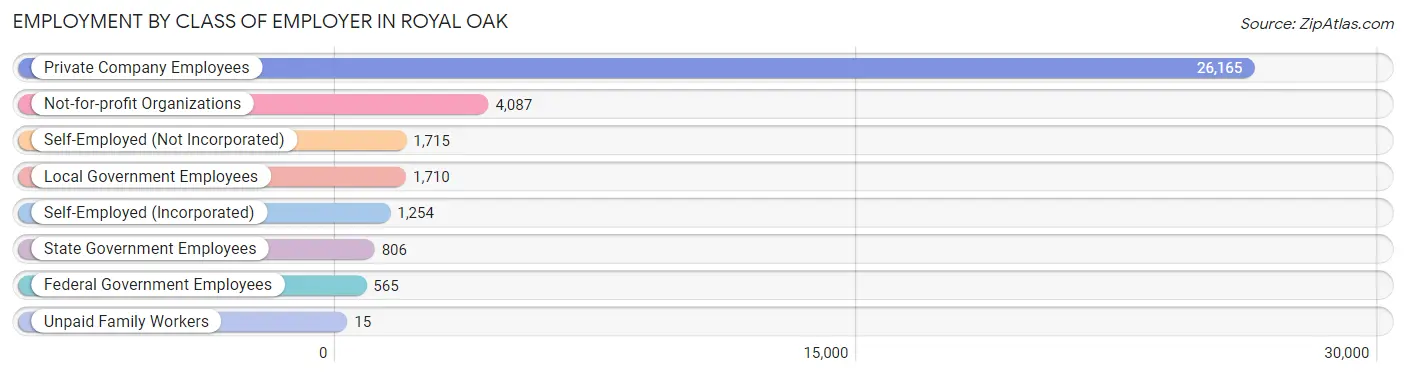
| Employer Class | # Employees | % Employees |
| Private Company Employees | 26,165 | 72.1% |
| Self-Employed (Incorporated) | 1,254 | 3.5% |
| Self-Employed (Not Incorporated) | 1,715 | 4.7% |
| Not-for-profit Organizations | 4,087 | 11.3% |
| Local Government Employees | 1,710 | 4.7% |
| State Government Employees | 806 | 2.2% |
| Federal Government Employees | 565 | 1.6% |
| Unpaid Family Workers | 15 | 0.0% |
| Total | 36,317 | 100.0% |
Employment Status by Age in Royal Oak
According to the labor force statistics for Royal Oak, out of the total population over 16 years of age (50,375), 75.5% or 38,033 individuals are in the labor force, with 3.0% or 1,141 of them unemployed. The age group with the highest labor force participation rate is 25 to 29 years, with 94.0% or 6,980 individuals in the labor force. Within the labor force, the 16 to 19 years age range has the highest percentage of unemployed individuals, with 12.1% or 97 of them being unemployed.
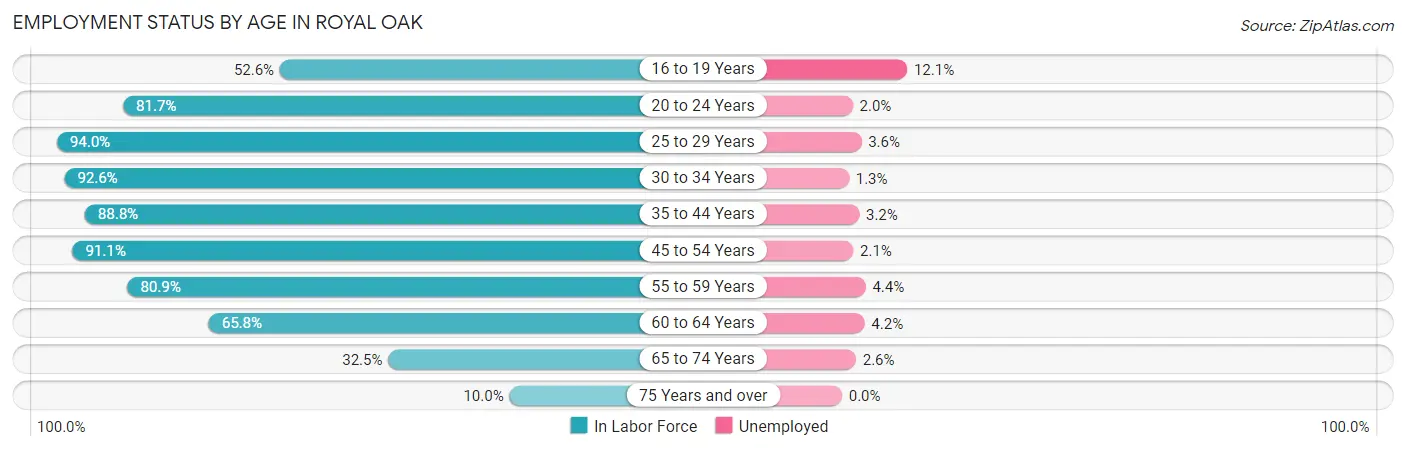
| Age Bracket | In Labor Force | Unemployed |
| 16 to 19 Years | 798 (52.6%) | 97 (12.1%) |
| 20 to 24 Years | 3,850 (81.7%) | 77 (2.0%) |
| 25 to 29 Years | 6,980 (94.0%) | 251 (3.6%) |
| 30 to 34 Years | 6,191 (92.6%) | 80 (1.3%) |
| 35 to 44 Years | 6,846 (88.8%) | 219 (3.2%) |
| 45 to 54 Years | 5,932 (91.1%) | 125 (2.1%) |
| 55 to 59 Years | 2,814 (80.9%) | 124 (4.4%) |
| 60 to 64 Years | 2,569 (65.8%) | 108 (4.2%) |
| 65 to 74 Years | 1,735 (32.5%) | 45 (2.6%) |
| 75 Years and over | 309 (10.0%) | 0 (0.0%) |
| Total | 38,033 (75.5%) | 1,141 (3.0%) |
Employment Status by Educational Attainment in Royal Oak
According to labor force statistics for Royal Oak, 87.7% of individuals (31,322) out of the total population between 25 and 64 years of age (35,715) are in the labor force, with 2.9% or 908 of them being unemployed. The group with the highest labor force participation rate are those with the educational attainment of bachelor's degree or higher, with 91.2% or 22,043 individuals in the labor force. Within the labor force, individuals with college / associate degree education have the highest percentage of unemployment, with 4.8% or 293 of them being unemployed.
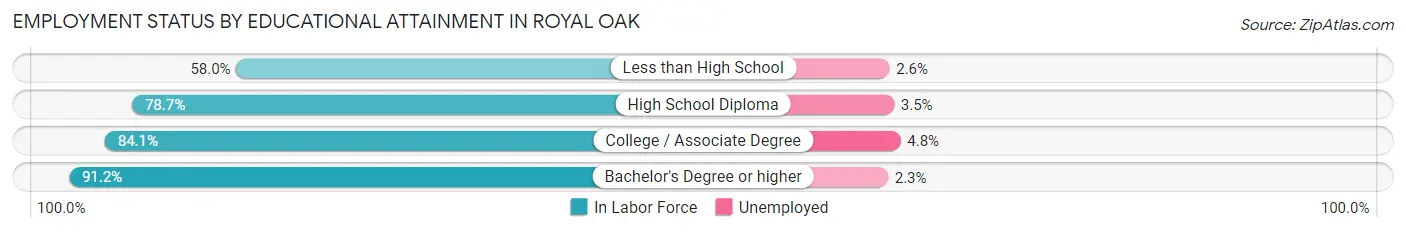
| Educational Attainment | In Labor Force | Unemployed |
| Less than High School | 545 (58.0%) | 24 (2.6%) |
| High School Diploma | 2,628 (78.7%) | 117 (3.5%) |
| College / Associate Degree | 6,111 (84.1%) | 349 (4.8%) |
| Bachelor's Degree or higher | 22,043 (91.2%) | 556 (2.3%) |
| Total | 31,322 (87.7%) | 1,036 (2.9%) |
Employment Occupations by Sex in Royal Oak
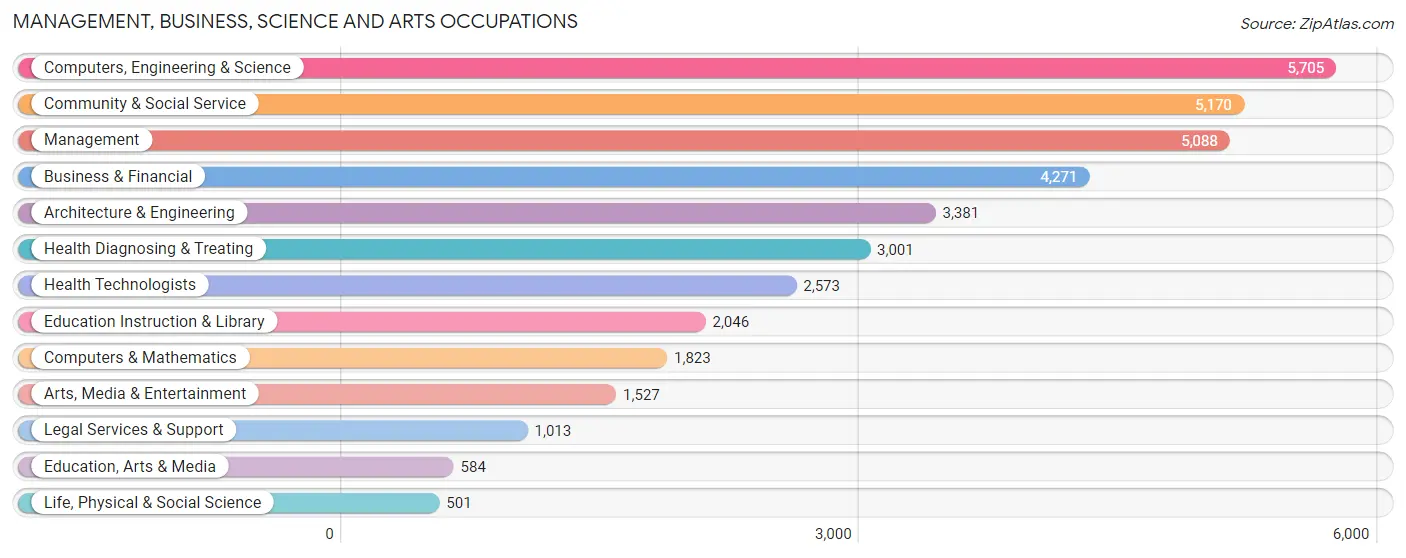
Management, Business, Science and Arts Occupations
The most common Management, Business, Science and Arts occupations in Royal Oak are Computers, Engineering & Science (5,705 | 15.5%), Community & Social Service (5,170 | 14.0%), Management (5,088 | 13.8%), Business & Financial (4,271 | 11.6%), and Architecture & Engineering (3,381 | 9.2%).
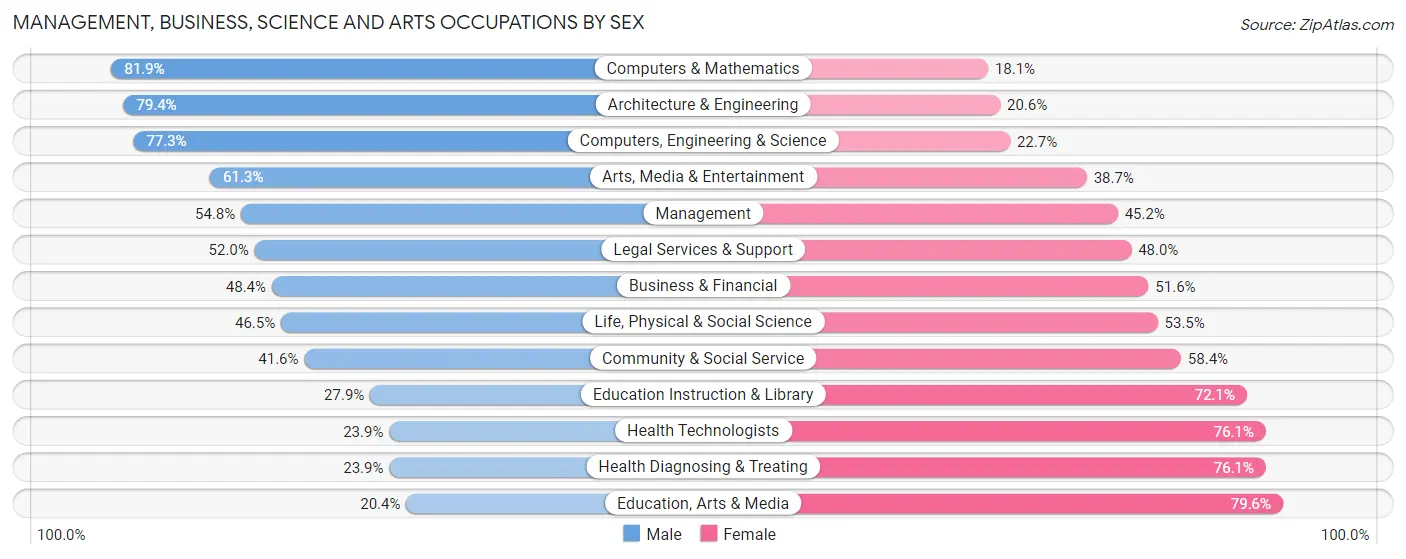
Management, Business, Science and Arts Occupations by Sex
Within the Management, Business, Science and Arts occupations in Royal Oak, the most male-oriented occupations are Computers & Mathematics (81.9%), Architecture & Engineering (79.4%), and Computers, Engineering & Science (77.3%), while the most female-oriented occupations are Education, Arts & Media (79.6%), Health Diagnosing & Treating (76.1%), and Health Technologists (76.1%).
| Occupation | Male | Female |
| Management | 2,790 (54.8%) | 2,298 (45.2%) |
| Business & Financial | 2,068 (48.4%) | 2,203 (51.6%) |
| Computers, Engineering & Science | 4,410 (77.3%) | 1,295 (22.7%) |
| Computers & Mathematics | 1,493 (81.9%) | 330 (18.1%) |
| Architecture & Engineering | 2,684 (79.4%) | 697 (20.6%) |
| Life, Physical & Social Science | 233 (46.5%) | 268 (53.5%) |
| Community & Social Service | 2,153 (41.6%) | 3,017 (58.4%) |
| Education, Arts & Media | 119 (20.4%) | 465 (79.6%) |
| Legal Services & Support | 527 (52.0%) | 486 (48.0%) |
| Education Instruction & Library | 571 (27.9%) | 1,475 (72.1%) |
| Arts, Media & Entertainment | 936 (61.3%) | 591 (38.7%) |
| Health Diagnosing & Treating | 718 (23.9%) | 2,283 (76.1%) |
| Health Technologists | 616 (23.9%) | 1,957 (76.1%) |
| Total (Category) | 12,139 (52.2%) | 11,096 (47.8%) |
| Total (Overall) | 19,901 (54.0%) | 16,949 (46.0%) |
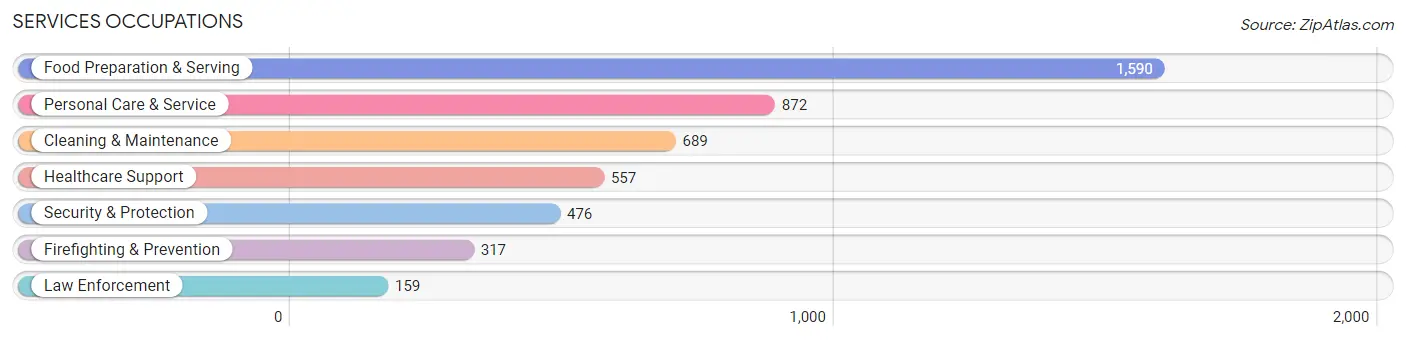
Services Occupations
The most common Services occupations in Royal Oak are Food Preparation & Serving (1,590 | 4.3%), Personal Care & Service (872 | 2.4%), Cleaning & Maintenance (689 | 1.9%), Healthcare Support (557 | 1.5%), and Security & Protection (476 | 1.3%).
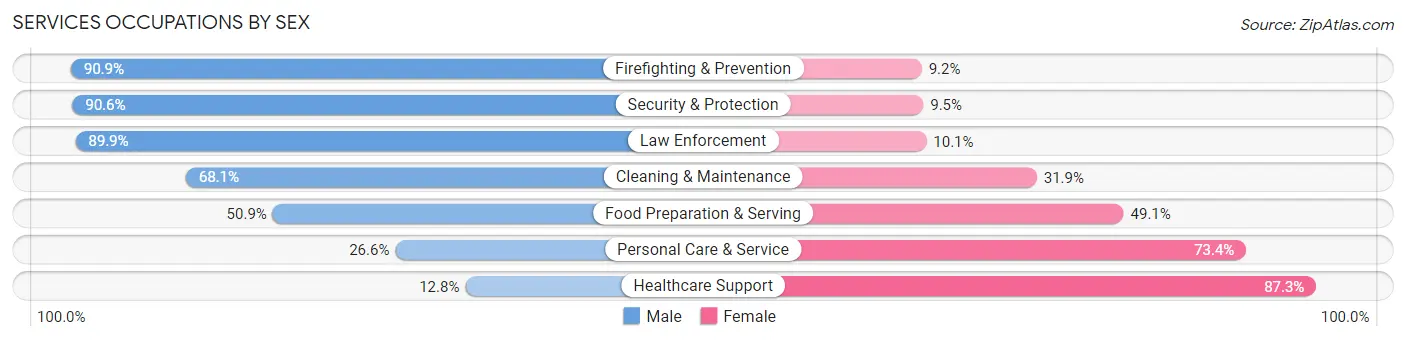
Services Occupations by Sex
Within the Services occupations in Royal Oak, the most male-oriented occupations are Firefighting & Prevention (90.8%), Security & Protection (90.5%), and Law Enforcement (89.9%), while the most female-oriented occupations are Healthcare Support (87.3%), Personal Care & Service (73.4%), and Food Preparation & Serving (49.1%).
| Occupation | Male | Female |
| Healthcare Support | 71 (12.8%) | 486 (87.3%) |
| Security & Protection | 431 (90.5%) | 45 (9.5%) |
| Firefighting & Prevention | 288 (90.8%) | 29 (9.1%) |
| Law Enforcement | 143 (89.9%) | 16 (10.1%) |
| Food Preparation & Serving | 809 (50.9%) | 781 (49.1%) |
| Cleaning & Maintenance | 469 (68.1%) | 220 (31.9%) |
| Personal Care & Service | 232 (26.6%) | 640 (73.4%) |
| Total (Category) | 2,012 (48.1%) | 2,172 (51.9%) |
| Total (Overall) | 19,901 (54.0%) | 16,949 (46.0%) |
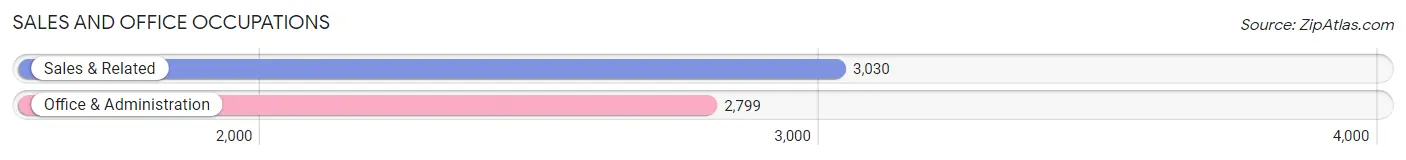
Sales and Office Occupations
The most common Sales and Office occupations in Royal Oak are Sales & Related (3,030 | 8.2%), and Office & Administration (2,799 | 7.6%).
Sales and Office Occupations by Sex
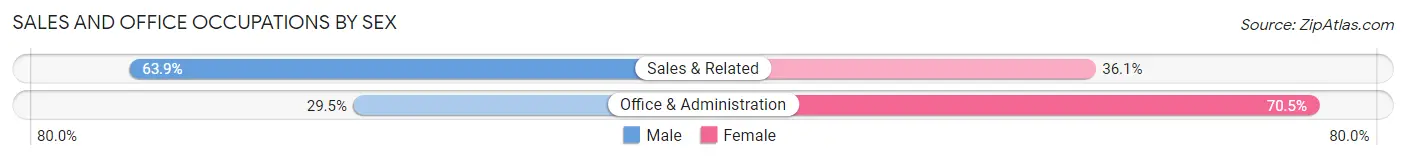
| Occupation | Male | Female |
| Sales & Related | 1,936 (63.9%) | 1,094 (36.1%) |
| Office & Administration | 826 (29.5%) | 1,973 (70.5%) |
| Total (Category) | 2,762 (47.4%) | 3,067 (52.6%) |
| Total (Overall) | 19,901 (54.0%) | 16,949 (46.0%) |
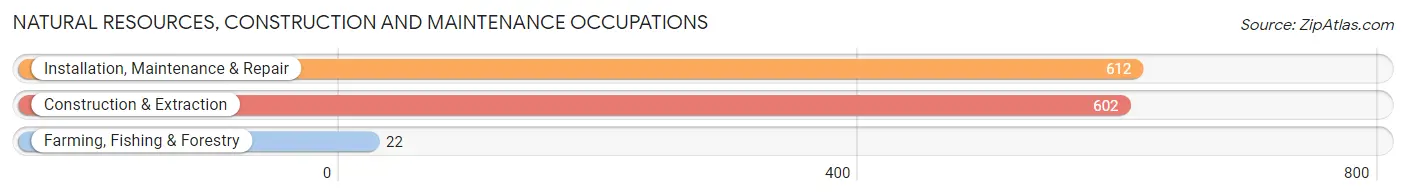
Natural Resources, Construction and Maintenance Occupations
The most common Natural Resources, Construction and Maintenance occupations in Royal Oak are Installation, Maintenance & Repair (612 | 1.7%), Construction & Extraction (602 | 1.6%), and Farming, Fishing & Forestry (22 | 0.1%).
Natural Resources, Construction and Maintenance Occupations by Sex
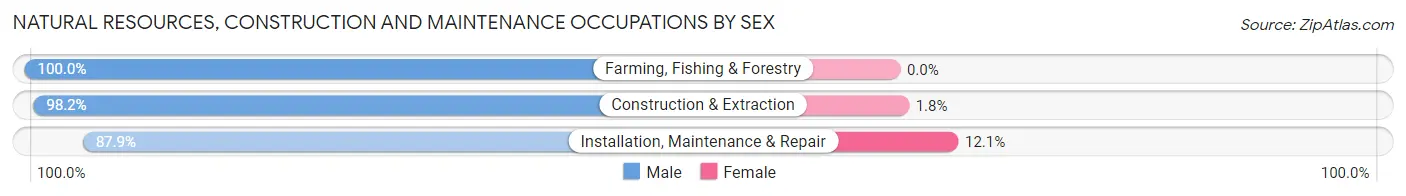
| Occupation | Male | Female |
| Farming, Fishing & Forestry | 22 (100.0%) | 0 (0.0%) |
| Construction & Extraction | 591 (98.2%) | 11 (1.8%) |
| Installation, Maintenance & Repair | 538 (87.9%) | 74 (12.1%) |
| Total (Category) | 1,151 (93.1%) | 85 (6.9%) |
| Total (Overall) | 19,901 (54.0%) | 16,949 (46.0%) |
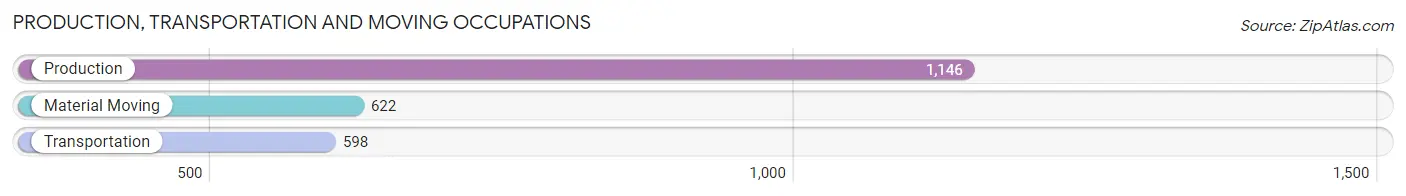
Production, Transportation and Moving Occupations
The most common Production, Transportation and Moving occupations in Royal Oak are Production (1,146 | 3.1%), Material Moving (622 | 1.7%), and Transportation (598 | 1.6%).
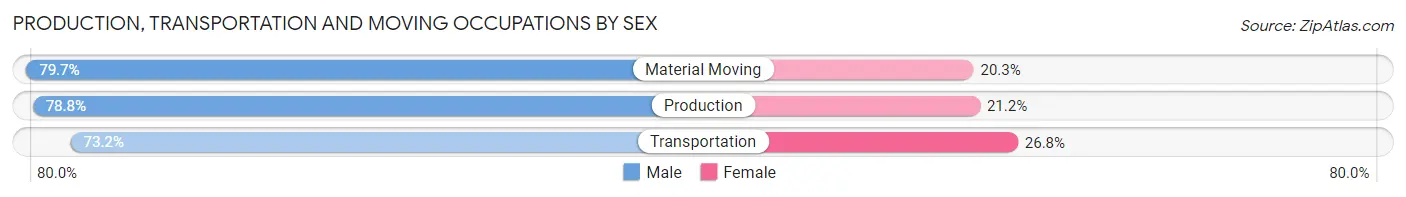
Production, Transportation and Moving Occupations by Sex
| Occupation | Male | Female |
| Production | 903 (78.8%) | 243 (21.2%) |
| Transportation | 438 (73.2%) | 160 (26.8%) |
| Material Moving | 496 (79.7%) | 126 (20.3%) |
| Total (Category) | 1,837 (77.6%) | 529 (22.4%) |
| Total (Overall) | 19,901 (54.0%) | 16,949 (46.0%) |
Employment Industries by Sex in Royal Oak
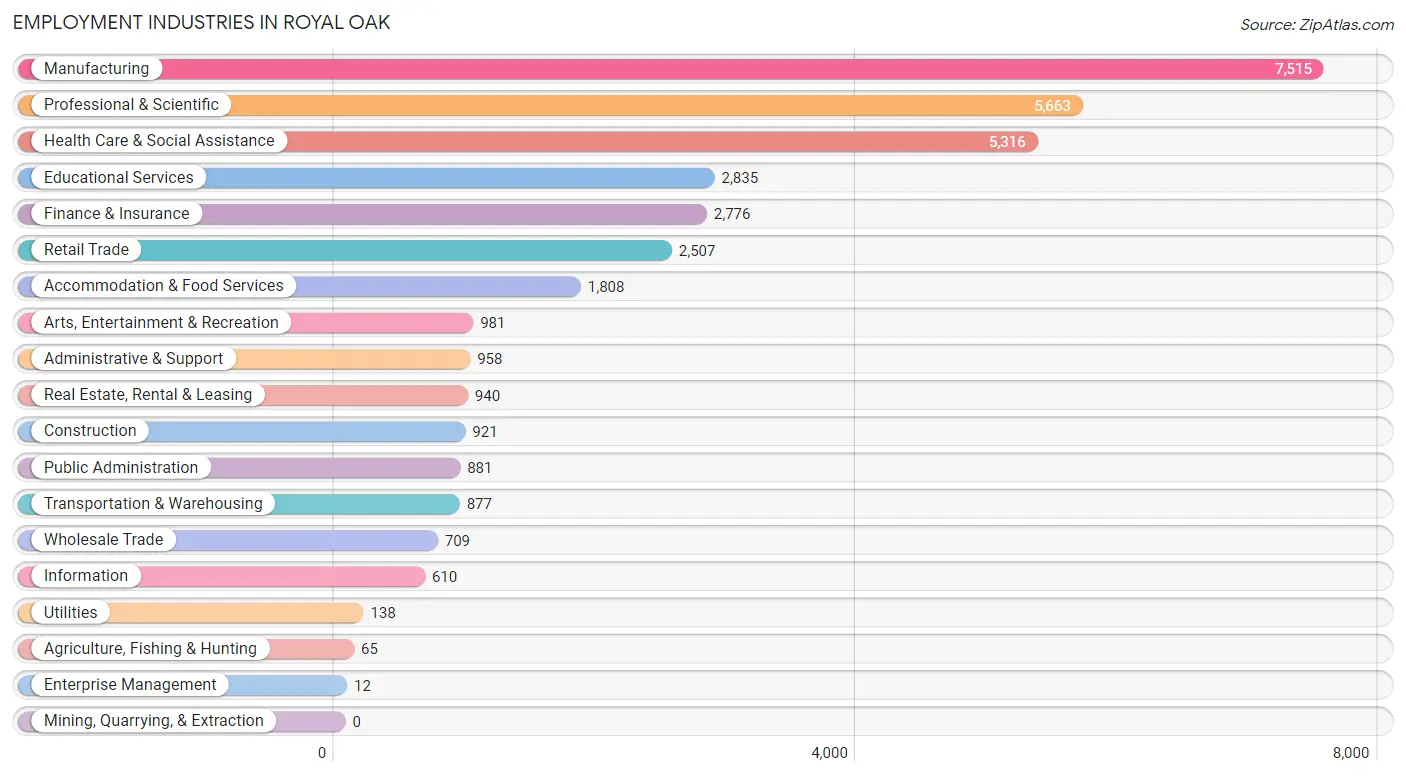
Employment Industries in Royal Oak
The major employment industries in Royal Oak include Manufacturing (7,515 | 20.4%), Professional & Scientific (5,663 | 15.4%), Health Care & Social Assistance (5,316 | 14.4%), Educational Services (2,835 | 7.7%), and Finance & Insurance (2,776 | 7.5%).
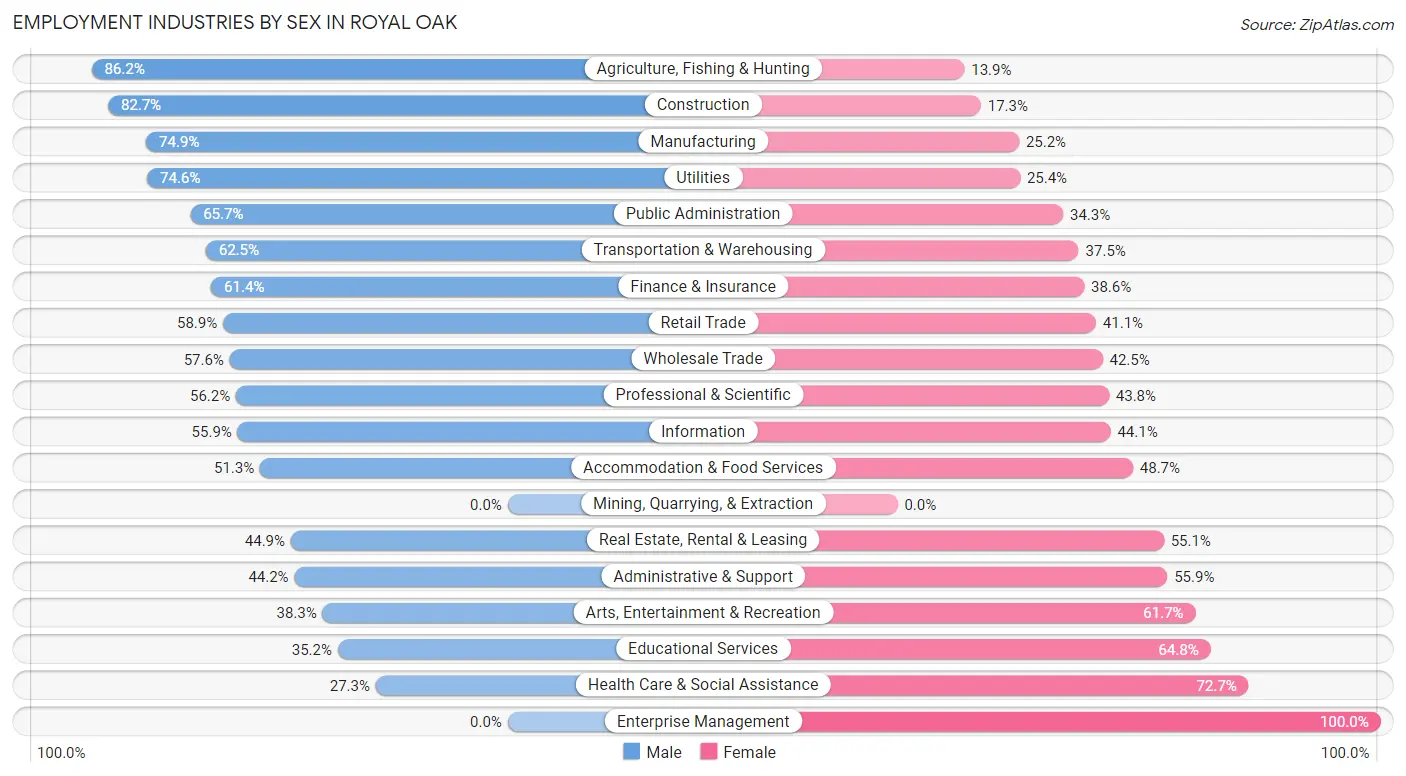
Employment Industries by Sex in Royal Oak
The Royal Oak industries that see more men than women are Agriculture, Fishing & Hunting (86.2%), Construction (82.7%), and Manufacturing (74.9%), whereas the industries that tend to have a higher number of women are Enterprise Management (100.0%), Health Care & Social Assistance (72.7%), and Educational Services (64.8%).
| Industry | Male | Female |
| Agriculture, Fishing & Hunting | 56 (86.2%) | 9 (13.9%) |
| Mining, Quarrying, & Extraction | 0 (0.0%) | 0 (0.0%) |
| Construction | 762 (82.7%) | 159 (17.3%) |
| Manufacturing | 5,625 (74.9%) | 1,890 (25.2%) |
| Wholesale Trade | 408 (57.6%) | 301 (42.4%) |
| Retail Trade | 1,477 (58.9%) | 1,030 (41.1%) |
| Transportation & Warehousing | 548 (62.5%) | 329 (37.5%) |
| Utilities | 103 (74.6%) | 35 (25.4%) |
| Information | 341 (55.9%) | 269 (44.1%) |
| Finance & Insurance | 1,704 (61.4%) | 1,072 (38.6%) |
| Real Estate, Rental & Leasing | 422 (44.9%) | 518 (55.1%) |
| Professional & Scientific | 3,185 (56.2%) | 2,478 (43.8%) |
| Enterprise Management | 0 (0.0%) | 12 (100.0%) |
| Administrative & Support | 423 (44.2%) | 535 (55.8%) |
| Educational Services | 997 (35.2%) | 1,838 (64.8%) |
| Health Care & Social Assistance | 1,452 (27.3%) | 3,864 (72.7%) |
| Arts, Entertainment & Recreation | 376 (38.3%) | 605 (61.7%) |
| Accommodation & Food Services | 927 (51.3%) | 881 (48.7%) |
| Public Administration | 579 (65.7%) | 302 (34.3%) |
| Total | 19,901 (54.0%) | 16,949 (46.0%) |
Education in Royal Oak
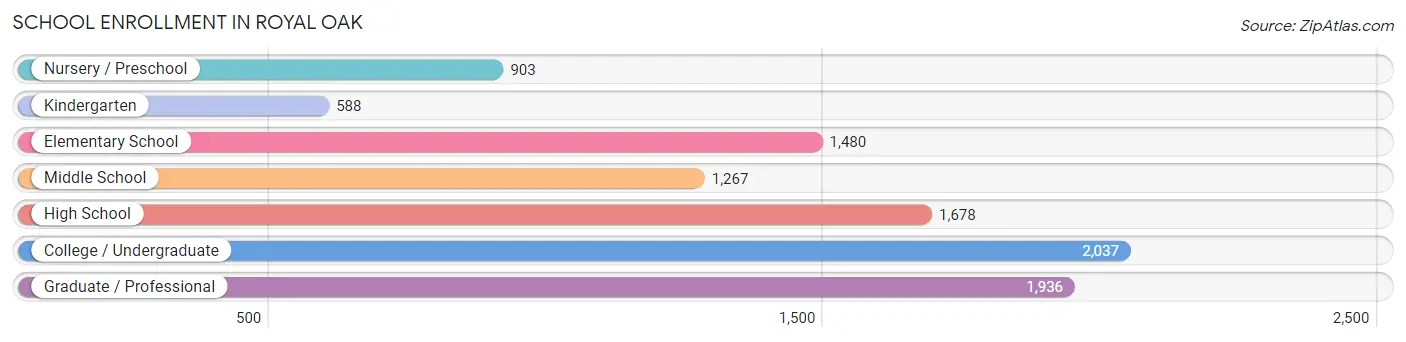
School Enrollment in Royal Oak
The most common levels of schooling among the 9,889 students in Royal Oak are college / undergraduate (2,037 | 20.6%), graduate / professional (1,936 | 19.6%), and high school (1,678 | 17.0%).
| School Level | # Students | % Students |
| Nursery / Preschool | 903 | 9.1% |
| Kindergarten | 588 | 5.9% |
| Elementary School | 1,480 | 15.0% |
| Middle School | 1,267 | 12.8% |
| High School | 1,678 | 17.0% |
| College / Undergraduate | 2,037 | 20.6% |
| Graduate / Professional | 1,936 | 19.6% |
| Total | 9,889 | 100.0% |
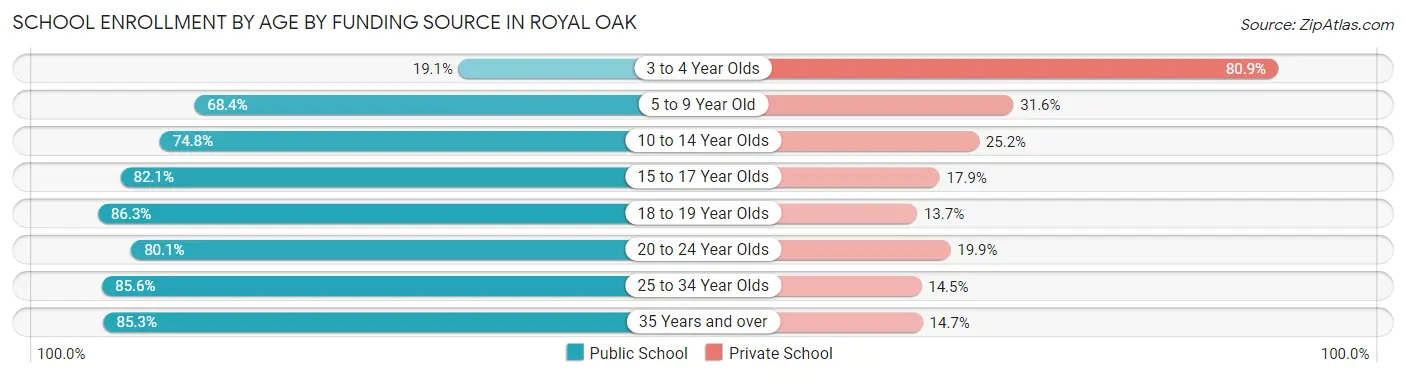
School Enrollment by Age by Funding Source in Royal Oak
Out of a total of 9,889 students who are enrolled in schools in Royal Oak, 2,462 (24.9%) attend a private institution, while the remaining 7,427 (75.1%) are enrolled in public schools. The age group of 3 to 4 year olds has the highest likelihood of being enrolled in private schools, with 406 (80.9% in the age bracket) enrolled. Conversely, the age group of 18 to 19 year olds has the lowest likelihood of being enrolled in a private school, with 436 (86.3% in the age bracket) attending a public institution.
| Age Bracket | Public School | Private School |
| 3 to 4 Year Olds | 96 (19.1%) | 406 (80.9%) |
| 5 to 9 Year Old | 1,597 (68.4%) | 738 (31.6%) |
| 10 to 14 Year Olds | 1,194 (74.8%) | 402 (25.2%) |
| 15 to 17 Year Olds | 946 (82.1%) | 206 (17.9%) |
| 18 to 19 Year Olds | 436 (86.3%) | 69 (13.7%) |
| 20 to 24 Year Olds | 1,416 (80.1%) | 351 (19.9%) |
| 25 to 34 Year Olds | 1,308 (85.6%) | 221 (14.4%) |
| 35 Years and over | 429 (85.3%) | 74 (14.7%) |
| Total | 7,427 (75.1%) | 2,462 (24.9%) |
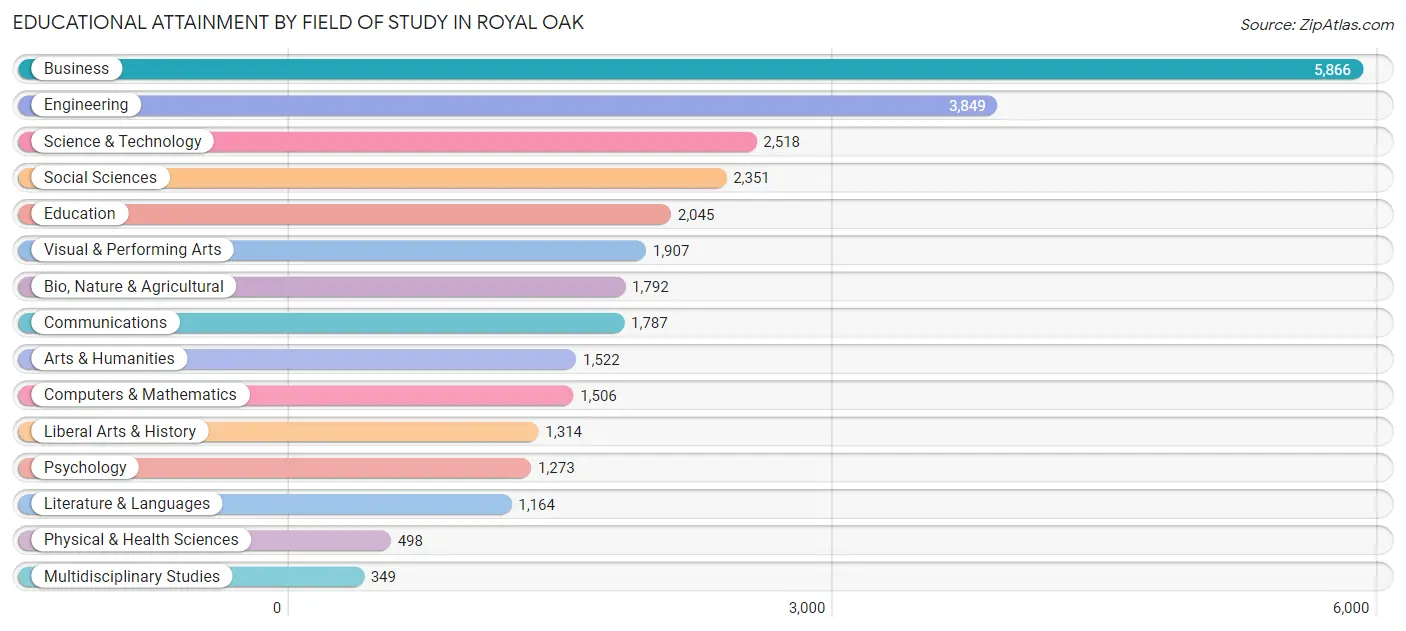
Educational Attainment by Field of Study in Royal Oak
Business (5,866 | 19.7%), engineering (3,849 | 12.9%), science & technology (2,518 | 8.5%), social sciences (2,351 | 7.9%), and education (2,045 | 6.9%) are the most common fields of study among 29,741 individuals in Royal Oak who have obtained a bachelor's degree or higher.
| Field of Study | # Graduates | % Graduates |
| Computers & Mathematics | 1,506 | 5.1% |
| Bio, Nature & Agricultural | 1,792 | 6.0% |
| Physical & Health Sciences | 498 | 1.7% |
| Psychology | 1,273 | 4.3% |
| Social Sciences | 2,351 | 7.9% |
| Engineering | 3,849 | 12.9% |
| Multidisciplinary Studies | 349 | 1.2% |
| Science & Technology | 2,518 | 8.5% |
| Business | 5,866 | 19.7% |
| Education | 2,045 | 6.9% |
| Literature & Languages | 1,164 | 3.9% |
| Liberal Arts & History | 1,314 | 4.4% |
| Visual & Performing Arts | 1,907 | 6.4% |
| Communications | 1,787 | 6.0% |
| Arts & Humanities | 1,522 | 5.1% |
| Total | 29,741 | 100.0% |
Transportation & Commute in Royal Oak
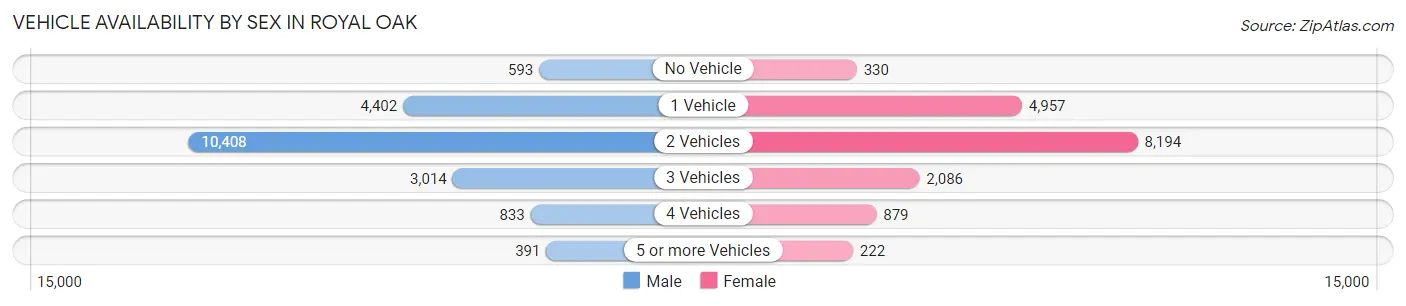
Vehicle Availability by Sex in Royal Oak
The most prevalent vehicle ownership categories in Royal Oak are males with 2 vehicles (10,408, accounting for 53.0%) and females with 2 vehicles (8,194, making up 62.4%).
| Vehicles Available | Male | Female |
| No Vehicle | 593 (3.0%) | 330 (2.0%) |
| 1 Vehicle | 4,402 (22.4%) | 4,957 (29.7%) |
| 2 Vehicles | 10,408 (53.0%) | 8,194 (49.2%) |
| 3 Vehicles | 3,014 (15.3%) | 2,086 (12.5%) |
| 4 Vehicles | 833 (4.2%) | 879 (5.3%) |
| 5 or more Vehicles | 391 (2.0%) | 222 (1.3%) |
| Total | 19,641 (100.0%) | 16,668 (100.0%) |
Commute Time in Royal Oak
The most frequently occuring commute durations in Royal Oak are 20 to 24 minutes (5,357 commuters, 18.3%), 30 to 34 minutes (5,118 commuters, 17.5%), and 15 to 19 minutes (4,378 commuters, 15.0%).
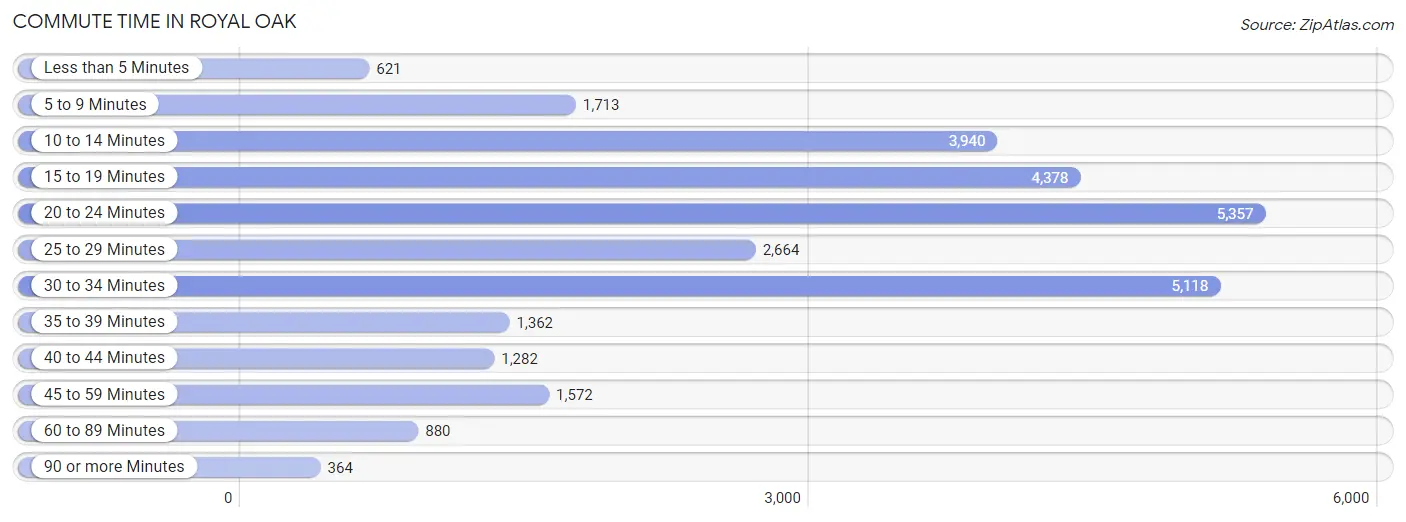
| Commute Time | # Commuters | % Commuters |
| Less than 5 Minutes | 621 | 2.1% |
| 5 to 9 Minutes | 1,713 | 5.9% |
| 10 to 14 Minutes | 3,940 | 13.5% |
| 15 to 19 Minutes | 4,378 | 15.0% |
| 20 to 24 Minutes | 5,357 | 18.3% |
| 25 to 29 Minutes | 2,664 | 9.1% |
| 30 to 34 Minutes | 5,118 | 17.5% |
| 35 to 39 Minutes | 1,362 | 4.7% |
| 40 to 44 Minutes | 1,282 | 4.4% |
| 45 to 59 Minutes | 1,572 | 5.4% |
| 60 to 89 Minutes | 880 | 3.0% |
| 90 or more Minutes | 364 | 1.2% |
Commute Time by Sex in Royal Oak
The most common commute times in Royal Oak are 30 to 34 minutes (3,046 commuters, 19.1%) for males and 20 to 24 minutes (2,313 commuters, 17.4%) for females.
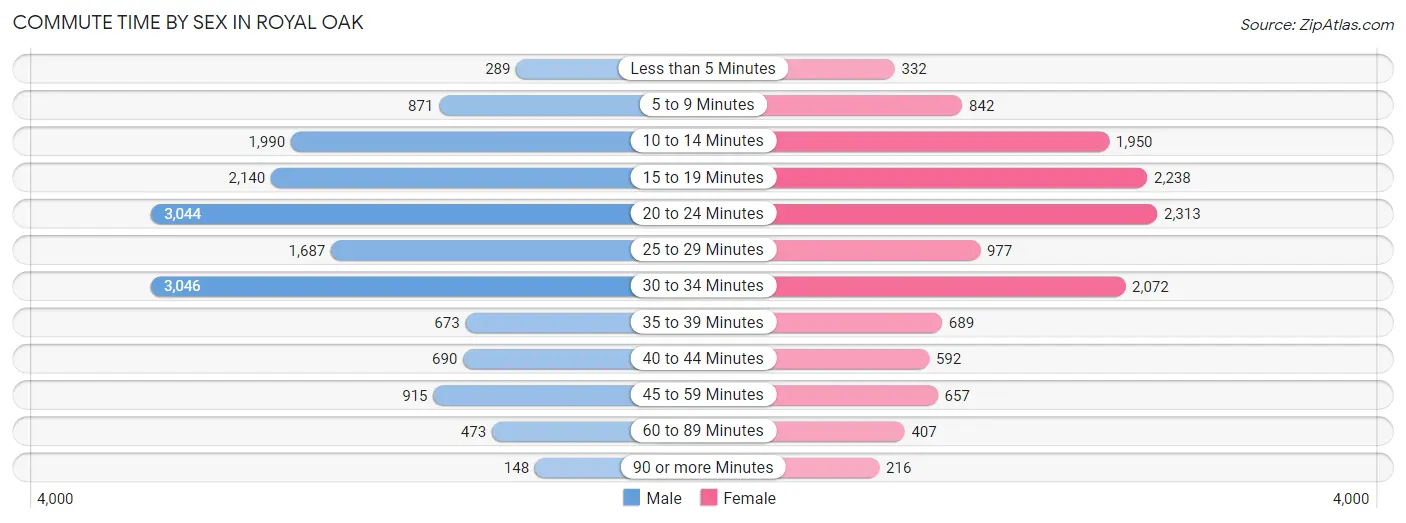
| Commute Time | Male | Female |
| Less than 5 Minutes | 289 (1.8%) | 332 (2.5%) |
| 5 to 9 Minutes | 871 (5.5%) | 842 (6.3%) |
| 10 to 14 Minutes | 1,990 (12.5%) | 1,950 (14.7%) |
| 15 to 19 Minutes | 2,140 (13.4%) | 2,238 (16.9%) |
| 20 to 24 Minutes | 3,044 (19.1%) | 2,313 (17.4%) |
| 25 to 29 Minutes | 1,687 (10.6%) | 977 (7.3%) |
| 30 to 34 Minutes | 3,046 (19.1%) | 2,072 (15.6%) |
| 35 to 39 Minutes | 673 (4.2%) | 689 (5.2%) |
| 40 to 44 Minutes | 690 (4.3%) | 592 (4.5%) |
| 45 to 59 Minutes | 915 (5.7%) | 657 (5.0%) |
| 60 to 89 Minutes | 473 (3.0%) | 407 (3.1%) |
| 90 or more Minutes | 148 (0.9%) | 216 (1.6%) |
Time of Departure to Work by Sex in Royal Oak
The most frequent times of departure to work in Royal Oak are 7:00 AM to 7:29 AM (2,328, 14.6%) for males and 8:00 AM to 8:29 AM (2,416, 18.2%) for females.
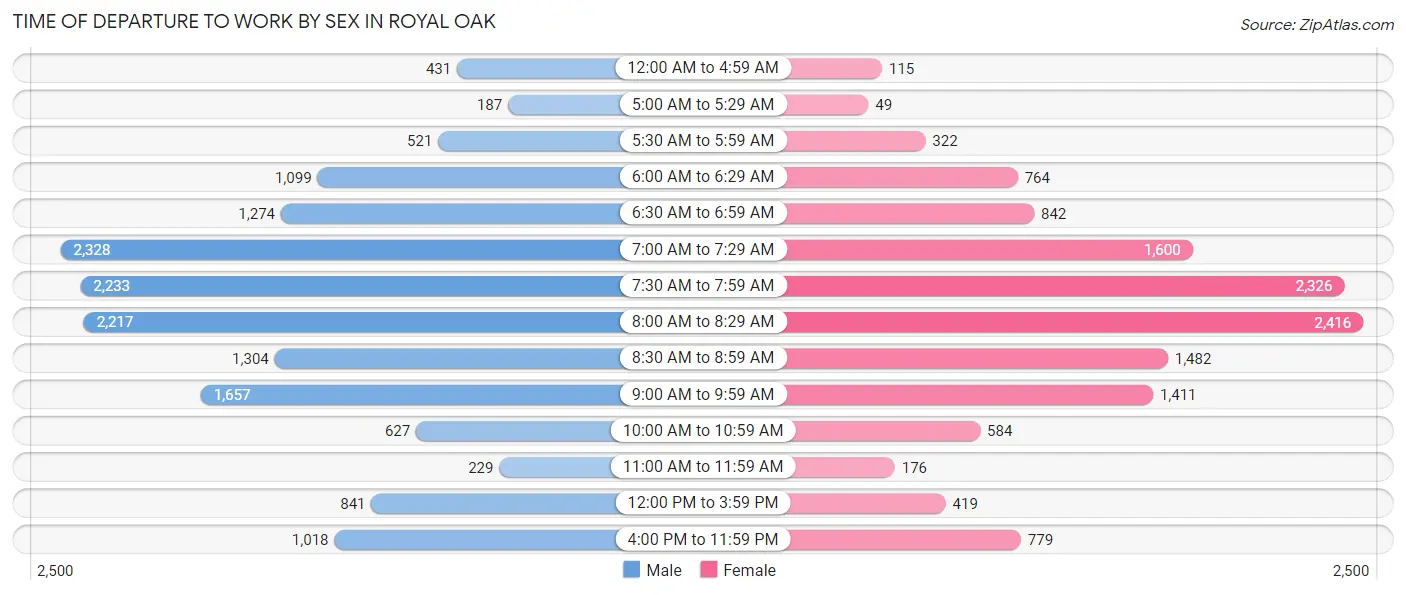
| Time of Departure | Male | Female |
| 12:00 AM to 4:59 AM | 431 (2.7%) | 115 (0.9%) |
| 5:00 AM to 5:29 AM | 187 (1.2%) | 49 (0.4%) |
| 5:30 AM to 5:59 AM | 521 (3.3%) | 322 (2.4%) |
| 6:00 AM to 6:29 AM | 1,099 (6.9%) | 764 (5.8%) |
| 6:30 AM to 6:59 AM | 1,274 (8.0%) | 842 (6.3%) |
| 7:00 AM to 7:29 AM | 2,328 (14.6%) | 1,600 (12.0%) |
| 7:30 AM to 7:59 AM | 2,233 (14.0%) | 2,326 (17.5%) |
| 8:00 AM to 8:29 AM | 2,217 (13.9%) | 2,416 (18.2%) |
| 8:30 AM to 8:59 AM | 1,304 (8.2%) | 1,482 (11.2%) |
| 9:00 AM to 9:59 AM | 1,657 (10.4%) | 1,411 (10.6%) |
| 10:00 AM to 10:59 AM | 627 (3.9%) | 584 (4.4%) |
| 11:00 AM to 11:59 AM | 229 (1.4%) | 176 (1.3%) |
| 12:00 PM to 3:59 PM | 841 (5.3%) | 419 (3.2%) |
| 4:00 PM to 11:59 PM | 1,018 (6.4%) | 779 (5.9%) |
| Total | 15,966 (100.0%) | 13,285 (100.0%) |
Housing Occupancy in Royal Oak
Occupancy by Ownership in Royal Oak
Of the total 28,986 dwellings in Royal Oak, owner-occupied units account for 18,968 (65.4%), while renter-occupied units make up 10,018 (34.6%).
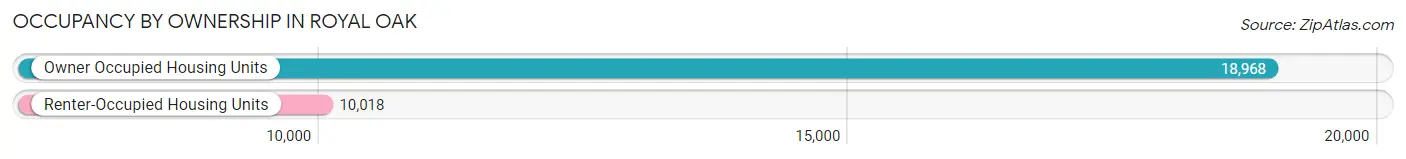
| Occupancy | # Housing Units | % Housing Units |
| Owner Occupied Housing Units | 18,968 | 65.4% |
| Renter-Occupied Housing Units | 10,018 | 34.6% |
| Total Occupied Housing Units | 28,986 | 100.0% |
Occupancy by Household Size in Royal Oak
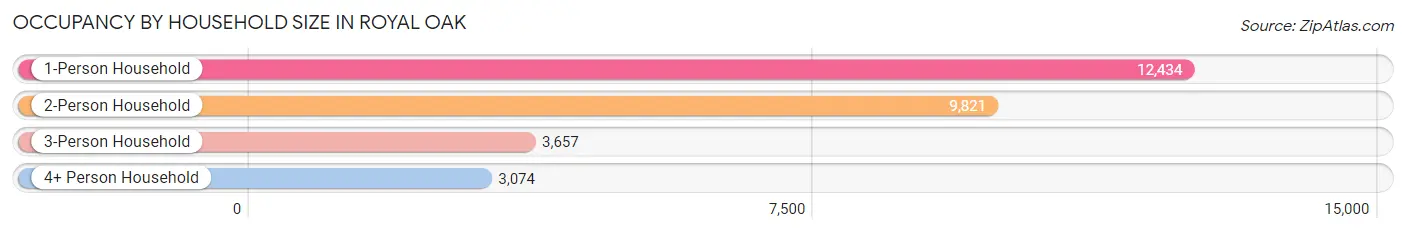
| Household Size | # Housing Units | % Housing Units |
| 1-Person Household | 12,434 | 42.9% |
| 2-Person Household | 9,821 | 33.9% |
| 3-Person Household | 3,657 | 12.6% |
| 4+ Person Household | 3,074 | 10.6% |
| Total Housing Units | 28,986 | 100.0% |
Occupancy by Ownership by Household Size in Royal Oak
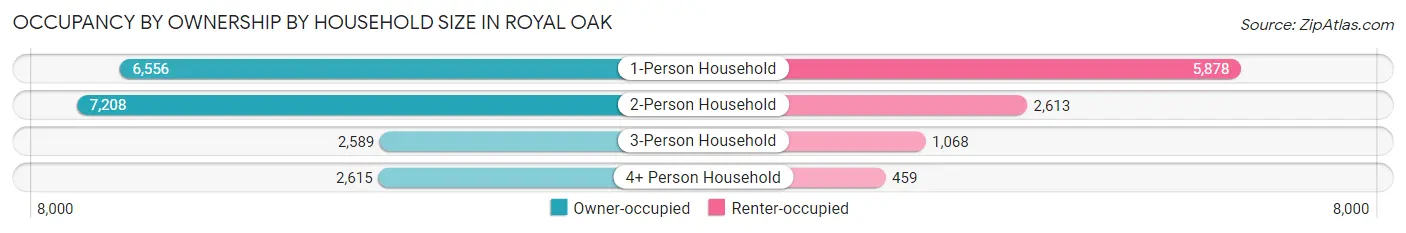
| Household Size | Owner-occupied | Renter-occupied |
| 1-Person Household | 6,556 (52.7%) | 5,878 (47.3%) |
| 2-Person Household | 7,208 (73.4%) | 2,613 (26.6%) |
| 3-Person Household | 2,589 (70.8%) | 1,068 (29.2%) |
| 4+ Person Household | 2,615 (85.1%) | 459 (14.9%) |
| Total Housing Units | 18,968 (65.4%) | 10,018 (34.6%) |
Occupancy by Educational Attainment in Royal Oak
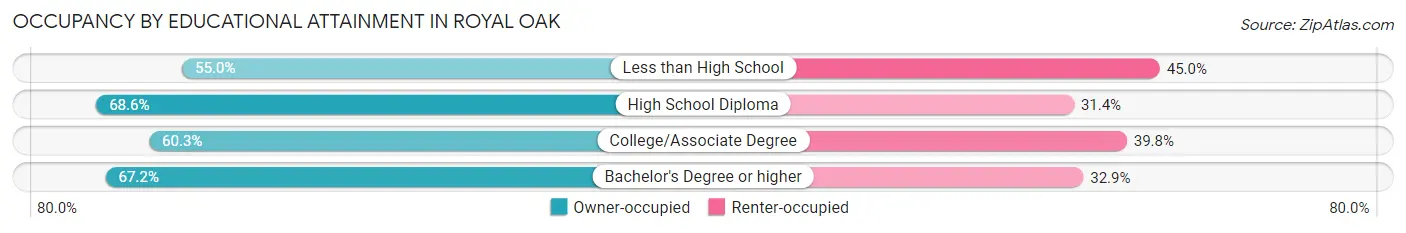
| Household Size | Owner-occupied | Renter-occupied |
| Less than High School | 395 (55.0%) | 323 (45.0%) |
| High School Diploma | 2,162 (68.6%) | 988 (31.4%) |
| College/Associate Degree | 3,982 (60.3%) | 2,627 (39.8%) |
| Bachelor's Degree or higher | 12,429 (67.1%) | 6,080 (32.9%) |
Occupancy by Age of Householder in Royal Oak
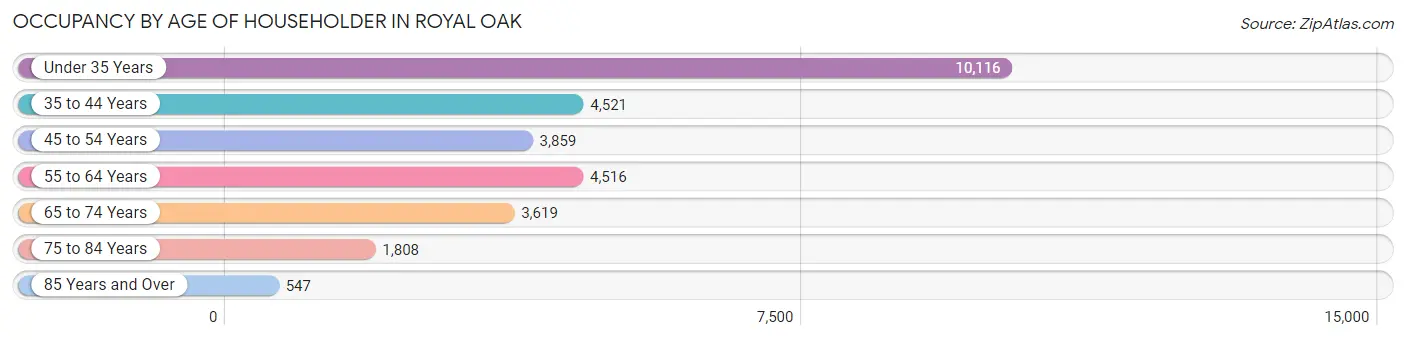
| Age Bracket | # Households | % Households |
| Under 35 Years | 10,116 | 34.9% |
| 35 to 44 Years | 4,521 | 15.6% |
| 45 to 54 Years | 3,859 | 13.3% |
| 55 to 64 Years | 4,516 | 15.6% |
| 65 to 74 Years | 3,619 | 12.5% |
| 75 to 84 Years | 1,808 | 6.2% |
| 85 Years and Over | 547 | 1.9% |
| Total | 28,986 | 100.0% |
Housing Finances in Royal Oak
Median Income by Occupancy in Royal Oak
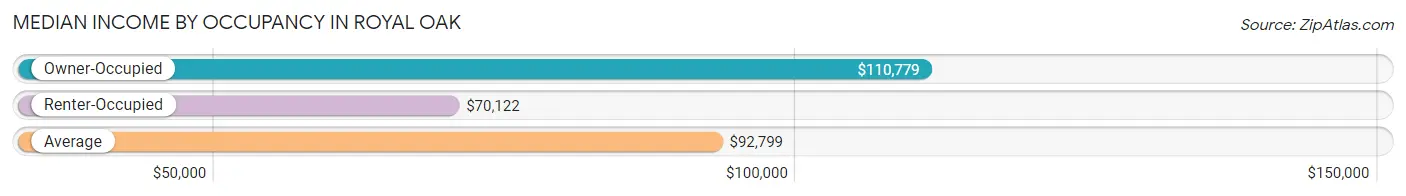
| Occupancy Type | # Households | Median Income |
| Owner-Occupied | 18,968 (65.4%) | $110,779 |
| Renter-Occupied | 10,018 (34.6%) | $70,122 |
| Average | 28,986 (100.0%) | $92,799 |
Occupancy by Householder Income Bracket in Royal Oak
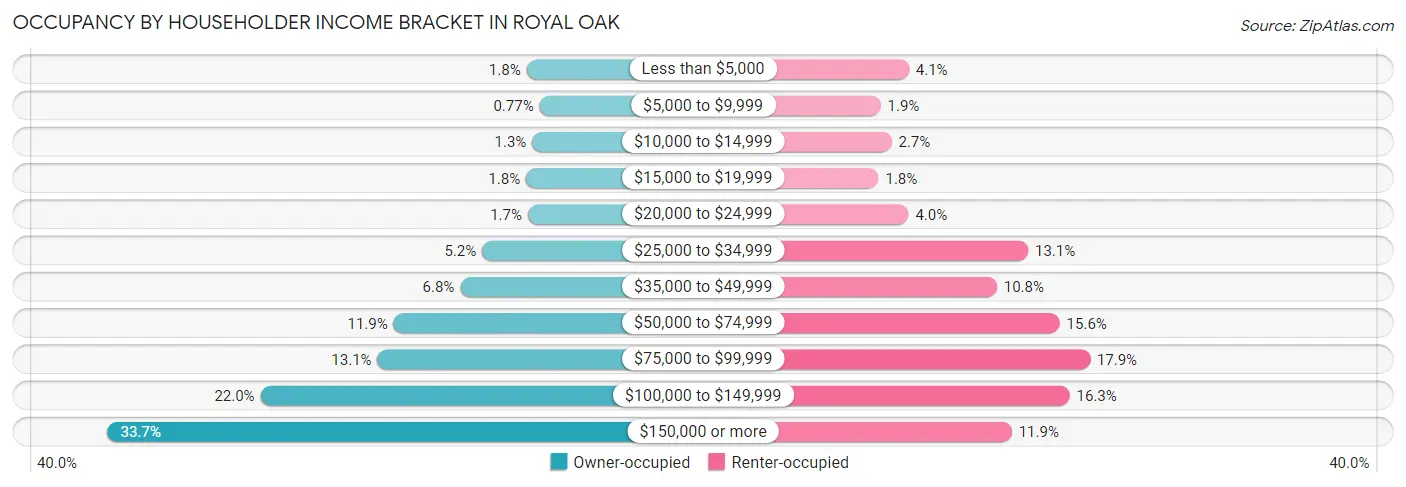
| Income Bracket | Owner-occupied | Renter-occupied |
| Less than $5,000 | 334 (1.8%) | 407 (4.1%) |
| $5,000 to $9,999 | 147 (0.8%) | 191 (1.9%) |
| $10,000 to $14,999 | 252 (1.3%) | 274 (2.7%) |
| $15,000 to $19,999 | 341 (1.8%) | 175 (1.8%) |
| $20,000 to $24,999 | 315 (1.7%) | 404 (4.0%) |
| $25,000 to $34,999 | 977 (5.1%) | 1,316 (13.1%) |
| $35,000 to $49,999 | 1,291 (6.8%) | 1,078 (10.8%) |
| $50,000 to $74,999 | 2,256 (11.9%) | 1,558 (15.5%) |
| $75,000 to $99,999 | 2,488 (13.1%) | 1,789 (17.9%) |
| $100,000 to $149,999 | 4,179 (22.0%) | 1,634 (16.3%) |
| $150,000 or more | 6,388 (33.7%) | 1,192 (11.9%) |
| Total | 18,968 (100.0%) | 10,018 (100.0%) |
Monthly Housing Cost Tiers in Royal Oak
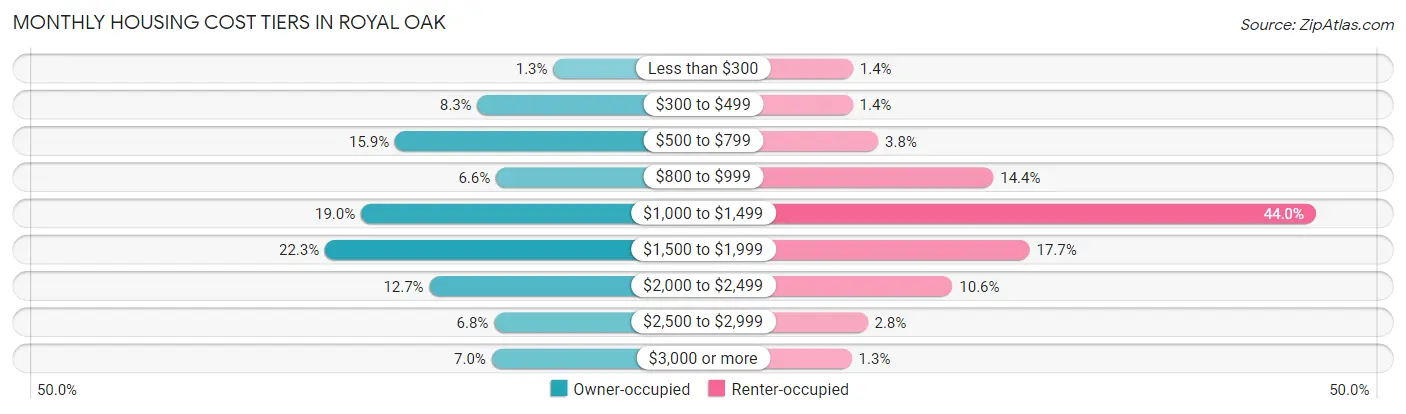
| Monthly Cost | Owner-occupied | Renter-occupied |
| Less than $300 | 250 (1.3%) | 142 (1.4%) |
| $300 to $499 | 1,576 (8.3%) | 140 (1.4%) |
| $500 to $799 | 3,016 (15.9%) | 376 (3.7%) |
| $800 to $999 | 1,252 (6.6%) | 1,438 (14.3%) |
| $1,000 to $1,499 | 3,609 (19.0%) | 4,412 (44.0%) |
| $1,500 to $1,999 | 4,238 (22.3%) | 1,772 (17.7%) |
| $2,000 to $2,499 | 2,415 (12.7%) | 1,060 (10.6%) |
| $2,500 to $2,999 | 1,285 (6.8%) | 277 (2.8%) |
| $3,000 or more | 1,327 (7.0%) | 131 (1.3%) |
| Total | 18,968 (100.0%) | 10,018 (100.0%) |
Physical Housing Characteristics in Royal Oak
Housing Structures in Royal Oak
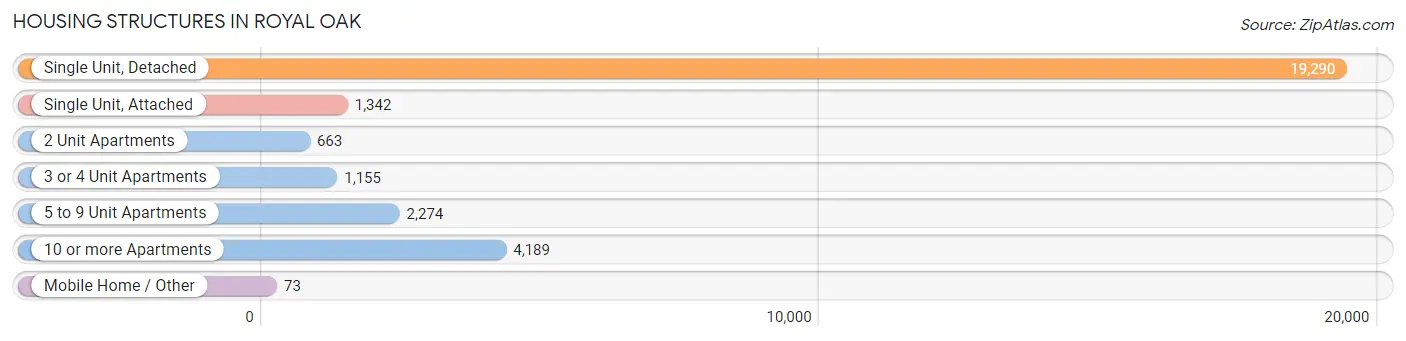
| Structure Type | # Housing Units | % Housing Units |
| Single Unit, Detached | 19,290 | 66.5% |
| Single Unit, Attached | 1,342 | 4.6% |
| 2 Unit Apartments | 663 | 2.3% |
| 3 or 4 Unit Apartments | 1,155 | 4.0% |
| 5 to 9 Unit Apartments | 2,274 | 7.9% |
| 10 or more Apartments | 4,189 | 14.4% |
| Mobile Home / Other | 73 | 0.3% |
| Total | 28,986 | 100.0% |
Housing Structures by Occupancy in Royal Oak
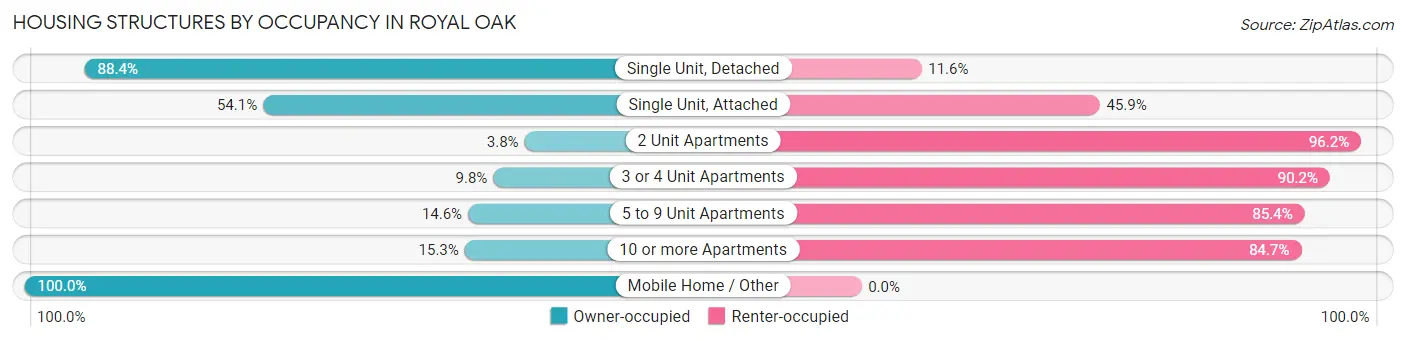
| Structure Type | Owner-occupied | Renter-occupied |
| Single Unit, Detached | 17,058 (88.4%) | 2,232 (11.6%) |
| Single Unit, Attached | 726 (54.1%) | 616 (45.9%) |
| 2 Unit Apartments | 25 (3.8%) | 638 (96.2%) |
| 3 or 4 Unit Apartments | 113 (9.8%) | 1,042 (90.2%) |
| 5 to 9 Unit Apartments | 333 (14.6%) | 1,941 (85.4%) |
| 10 or more Apartments | 640 (15.3%) | 3,549 (84.7%) |
| Mobile Home / Other | 73 (100.0%) | 0 (0.0%) |
| Total | 18,968 (65.4%) | 10,018 (34.6%) |
Housing Structures by Number of Rooms in Royal Oak
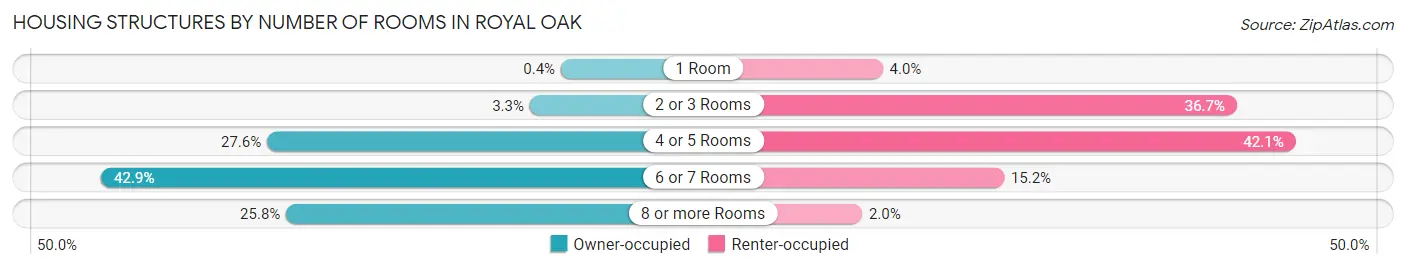
| Number of Rooms | Owner-occupied | Renter-occupied |
| 1 Room | 76 (0.4%) | 396 (4.0%) |
| 2 or 3 Rooms | 622 (3.3%) | 3,677 (36.7%) |
| 4 or 5 Rooms | 5,232 (27.6%) | 4,221 (42.1%) |
| 6 or 7 Rooms | 8,143 (42.9%) | 1,520 (15.2%) |
| 8 or more Rooms | 4,895 (25.8%) | 204 (2.0%) |
| Total | 18,968 (100.0%) | 10,018 (100.0%) |
Housing Structure by Heating Type in Royal Oak
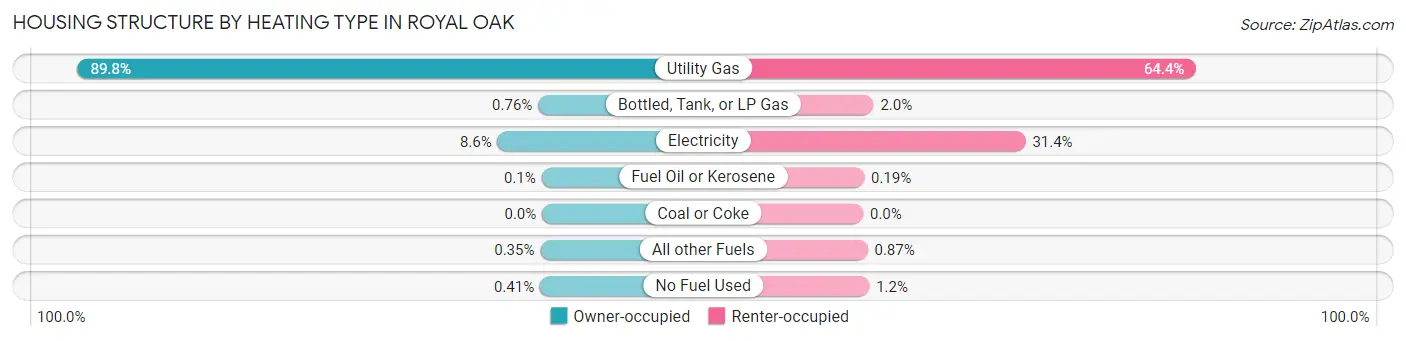
| Heating Type | Owner-occupied | Renter-occupied |
| Utility Gas | 17,025 (89.8%) | 6,448 (64.4%) |
| Bottled, Tank, or LP Gas | 145 (0.8%) | 201 (2.0%) |
| Electricity | 1,634 (8.6%) | 3,144 (31.4%) |
| Fuel Oil or Kerosene | 19 (0.1%) | 19 (0.2%) |
| Coal or Coke | 0 (0.0%) | 0 (0.0%) |
| All other Fuels | 67 (0.4%) | 87 (0.9%) |
| No Fuel Used | 78 (0.4%) | 119 (1.2%) |
| Total | 18,968 (100.0%) | 10,018 (100.0%) |
Household Vehicle Usage in Royal Oak
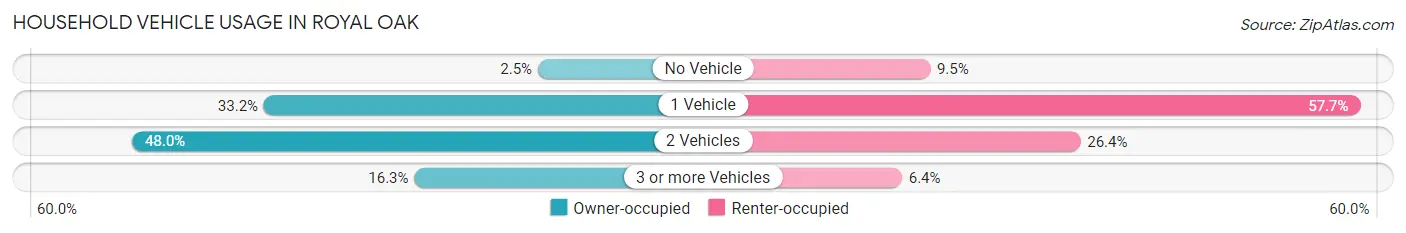
| Vehicles per Household | Owner-occupied | Renter-occupied |
| No Vehicle | 475 (2.5%) | 955 (9.5%) |
| 1 Vehicle | 6,295 (33.2%) | 5,783 (57.7%) |
| 2 Vehicles | 9,099 (48.0%) | 2,642 (26.4%) |
| 3 or more Vehicles | 3,099 (16.3%) | 638 (6.4%) |
| Total | 18,968 (100.0%) | 10,018 (100.0%) |
Real Estate & Mortgages in Royal Oak
Real Estate and Mortgage Overview in Royal Oak
| Characteristic | Without Mortgage | With Mortgage |
| Housing Units | 6,023 | 12,945 |
| Median Property Value | $256,000 | $302,200 |
| Median Household Income | $70,063 | $5,258 |
| Monthly Housing Costs | $612 | $1,308 |
| Real Estate Taxes | $3,435 | $183 |
Property Value by Mortgage Status in Royal Oak
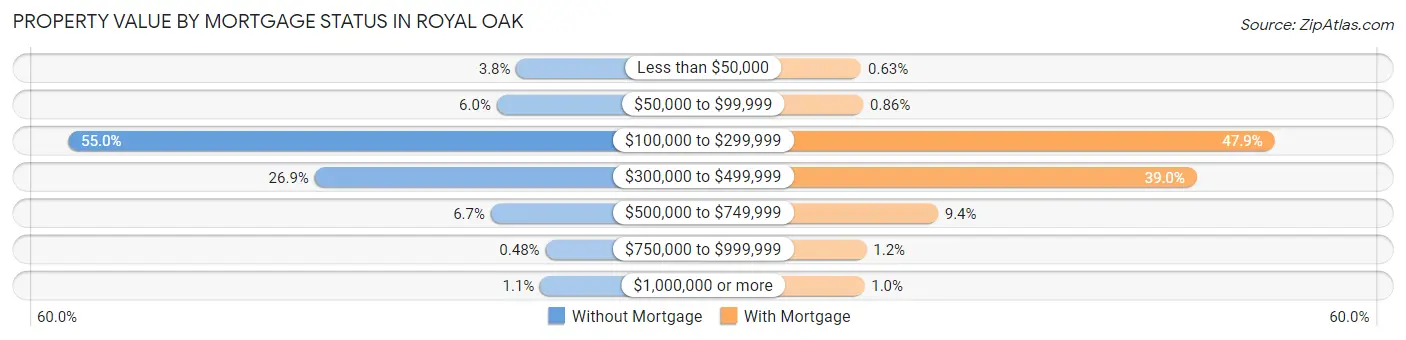
| Property Value | Without Mortgage | With Mortgage |
| Less than $50,000 | 229 (3.8%) | 82 (0.6%) |
| $50,000 to $99,999 | 364 (6.0%) | 111 (0.9%) |
| $100,000 to $299,999 | 3,314 (55.0%) | 6,199 (47.9%) |
| $300,000 to $499,999 | 1,617 (26.9%) | 5,048 (39.0%) |
| $500,000 to $749,999 | 405 (6.7%) | 1,217 (9.4%) |
| $750,000 to $999,999 | 29 (0.5%) | 159 (1.2%) |
| $1,000,000 or more | 65 (1.1%) | 129 (1.0%) |
| Total | 6,023 (100.0%) | 12,945 (100.0%) |
Household Income by Mortgage Status in Royal Oak
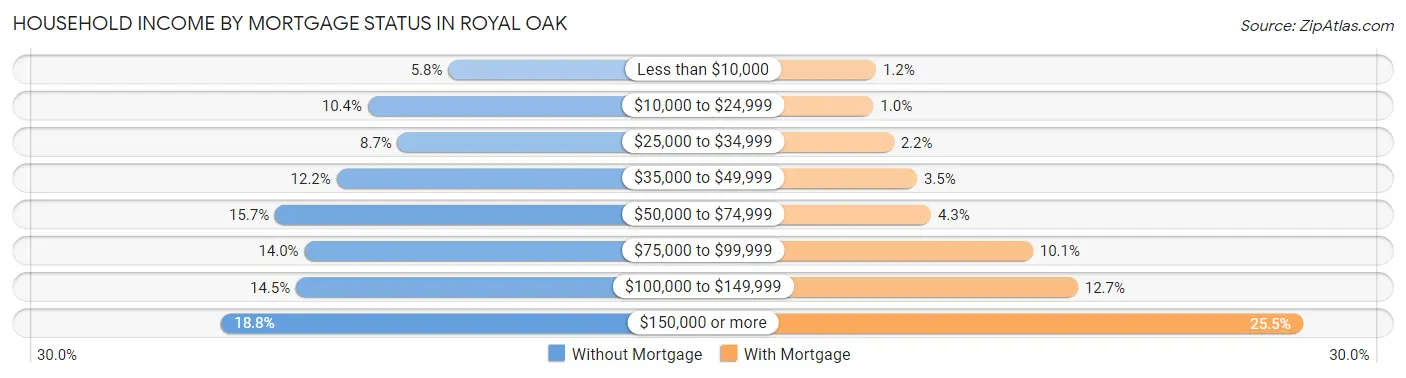
| Household Income | Without Mortgage | With Mortgage |
| Less than $10,000 | 349 (5.8%) | 151 (1.2%) |
| $10,000 to $24,999 | 626 (10.4%) | 132 (1.0%) |
| $25,000 to $34,999 | 523 (8.7%) | 282 (2.2%) |
| $35,000 to $49,999 | 733 (12.2%) | 454 (3.5%) |
| $50,000 to $74,999 | 945 (15.7%) | 558 (4.3%) |
| $75,000 to $99,999 | 844 (14.0%) | 1,311 (10.1%) |
| $100,000 to $149,999 | 873 (14.5%) | 1,644 (12.7%) |
| $150,000 or more | 1,130 (18.8%) | 3,306 (25.5%) |
| Total | 6,023 (100.0%) | 12,945 (100.0%) |
Property Value to Household Income Ratio in Royal Oak
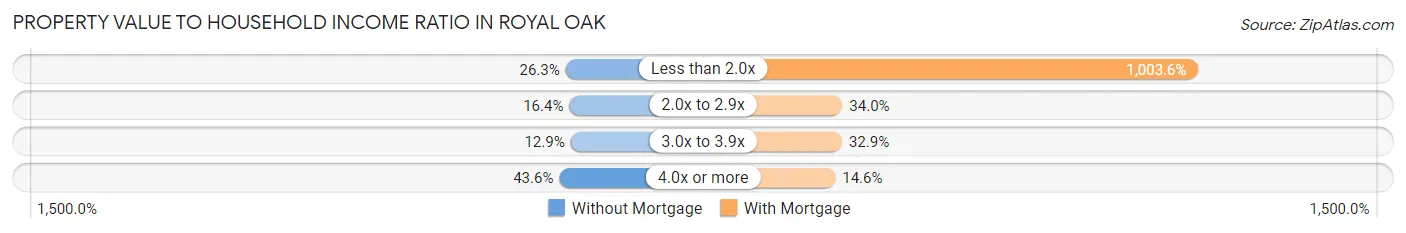
| Value-to-Income Ratio | Without Mortgage | With Mortgage |
| Less than 2.0x | 1,585 (26.3%) | 129,909 (1,003.6%) |
| 2.0x to 2.9x | 986 (16.4%) | 4,407 (34.0%) |
| 3.0x to 3.9x | 776 (12.9%) | 4,260 (32.9%) |
| 4.0x or more | 2,627 (43.6%) | 1,895 (14.6%) |
| Total | 6,023 (100.0%) | 12,945 (100.0%) |
Real Estate Taxes by Mortgage Status in Royal Oak
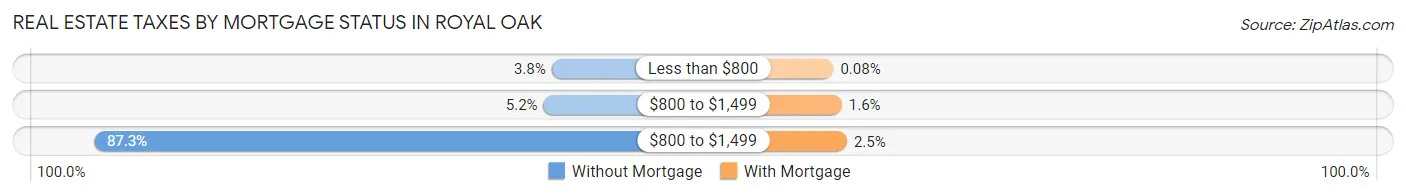
| Property Taxes | Without Mortgage | With Mortgage |
| Less than $800 | 226 (3.7%) | 10 (0.1%) |
| $800 to $1,499 | 315 (5.2%) | 208 (1.6%) |
| $800 to $1,499 | 5,260 (87.3%) | 329 (2.5%) |
| Total | 6,023 (100.0%) | 12,945 (100.0%) |
Health & Disability in Royal Oak
Health Insurance Coverage by Age in Royal Oak
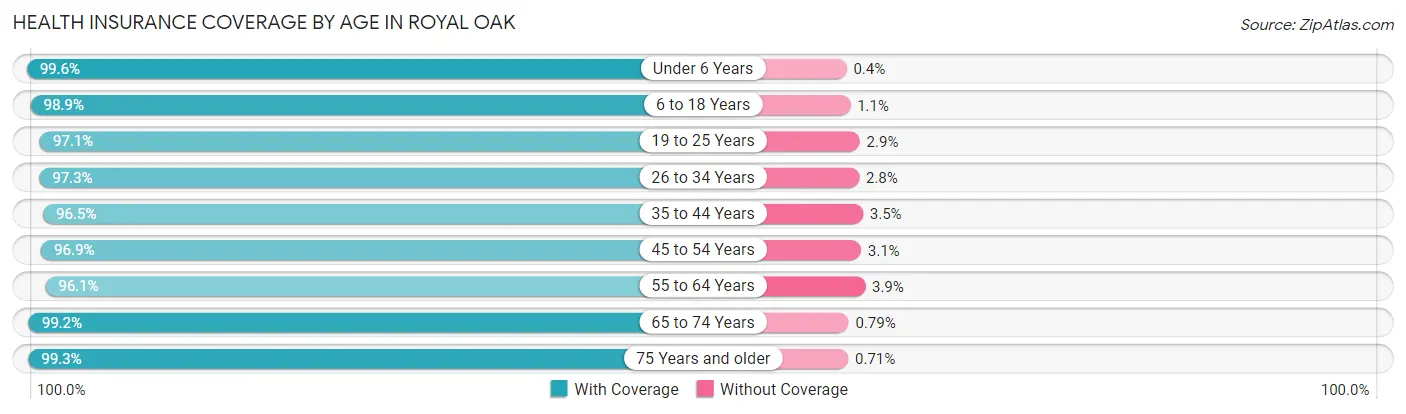
| Age Bracket | With Coverage | Without Coverage |
| Under 6 Years | 3,937 (99.6%) | 16 (0.4%) |
| 6 to 18 Years | 4,790 (98.9%) | 54 (1.1%) |
| 19 to 25 Years | 6,277 (97.1%) | 185 (2.9%) |
| 26 to 34 Years | 12,356 (97.3%) | 349 (2.8%) |
| 35 to 44 Years | 7,416 (96.5%) | 266 (3.5%) |
| 45 to 54 Years | 6,311 (96.9%) | 201 (3.1%) |
| 55 to 64 Years | 7,085 (96.1%) | 285 (3.9%) |
| 65 to 74 Years | 5,264 (99.2%) | 42 (0.8%) |
| 75 Years and older | 2,950 (99.3%) | 21 (0.7%) |
| Total | 56,386 (97.6%) | 1,419 (2.5%) |
Health Insurance Coverage by Citizenship Status in Royal Oak
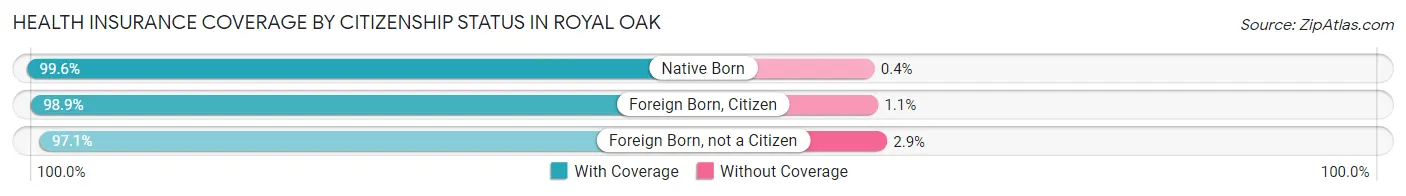
| Citizenship Status | With Coverage | Without Coverage |
| Native Born | 3,937 (99.6%) | 16 (0.4%) |
| Foreign Born, Citizen | 4,790 (98.9%) | 54 (1.1%) |
| Foreign Born, not a Citizen | 6,277 (97.1%) | 185 (2.9%) |
Health Insurance Coverage by Household Income in Royal Oak
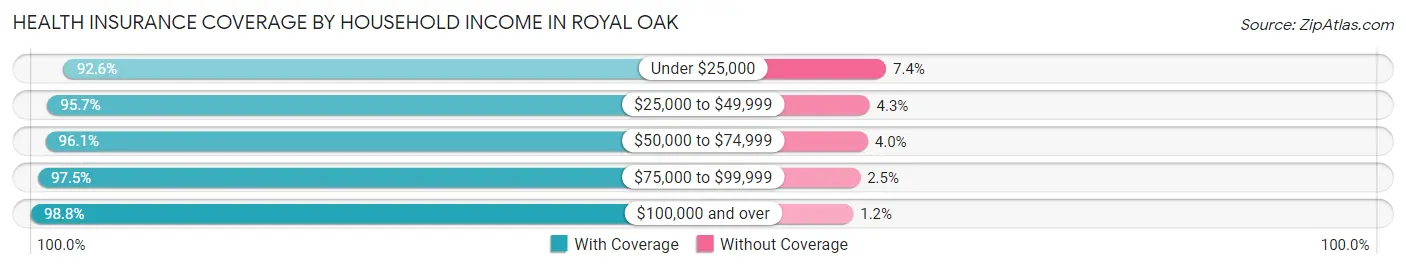
| Household Income | With Coverage | Without Coverage |
| Under $25,000 | 3,437 (92.6%) | 273 (7.4%) |
| $25,000 to $49,999 | 6,661 (95.7%) | 297 (4.3%) |
| $50,000 to $74,999 | 5,964 (96.1%) | 245 (4.0%) |
| $75,000 to $99,999 | 7,777 (97.5%) | 200 (2.5%) |
| $100,000 and over | 32,471 (98.8%) | 401 (1.2%) |
Public vs Private Health Insurance Coverage by Age in Royal Oak
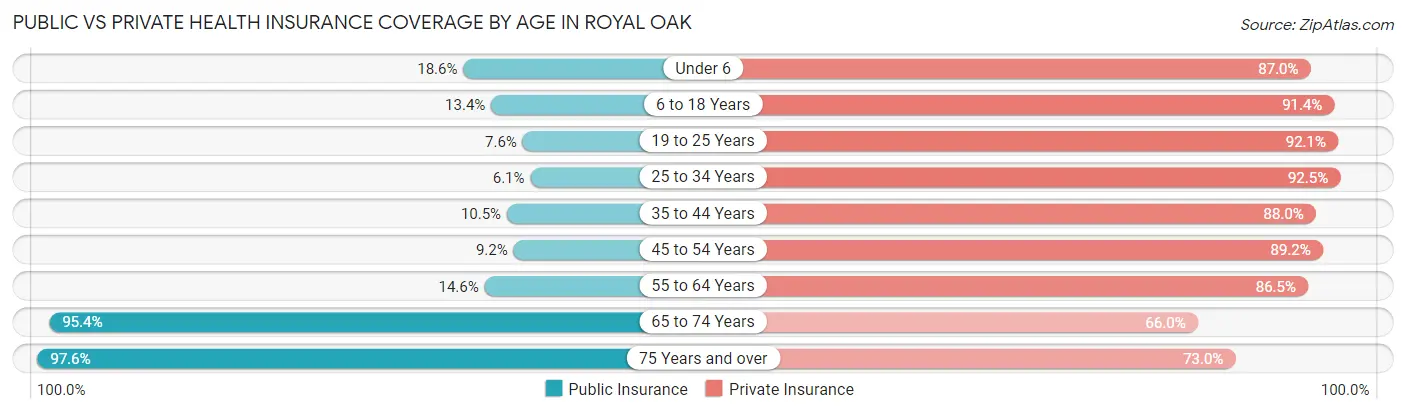
| Age Bracket | Public Insurance | Private Insurance |
| Under 6 | 734 (18.6%) | 3,438 (87.0%) |
| 6 to 18 Years | 649 (13.4%) | 4,427 (91.4%) |
| 19 to 25 Years | 488 (7.5%) | 5,948 (92.0%) |
| 25 to 34 Years | 778 (6.1%) | 11,747 (92.5%) |
| 35 to 44 Years | 804 (10.5%) | 6,756 (87.9%) |
| 45 to 54 Years | 602 (9.2%) | 5,811 (89.2%) |
| 55 to 64 Years | 1,078 (14.6%) | 6,374 (86.5%) |
| 65 to 74 Years | 5,063 (95.4%) | 3,504 (66.0%) |
| 75 Years and over | 2,901 (97.6%) | 2,169 (73.0%) |
| Total | 13,097 (22.7%) | 50,174 (86.8%) |
Disability Status by Sex by Age in Royal Oak
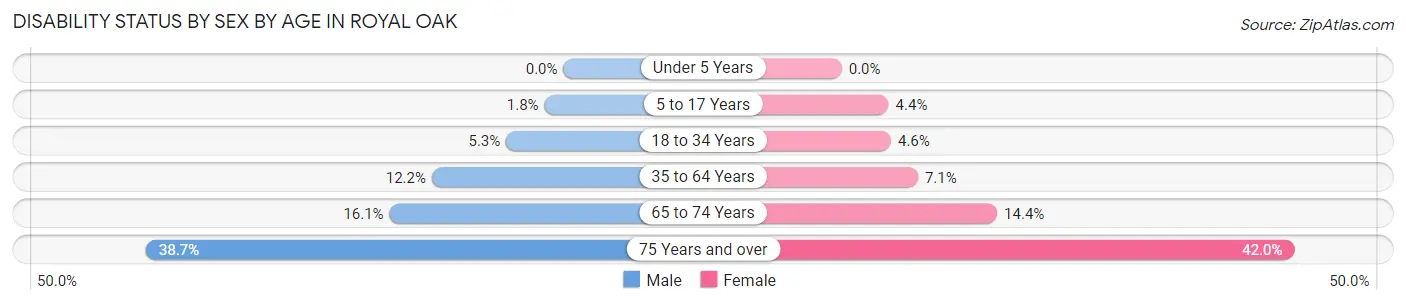
| Age Bracket | Male | Female |
| Under 5 Years | 0 (0.0%) | 0 (0.0%) |
| 5 to 17 Years | 44 (1.8%) | 117 (4.3%) |
| 18 to 34 Years | 561 (5.3%) | 411 (4.6%) |
| 35 to 64 Years | 1,363 (12.2%) | 736 (7.1%) |
| 65 to 74 Years | 421 (16.1%) | 389 (14.4%) |
| 75 Years and over | 461 (38.7%) | 748 (42.0%) |
Disability Class by Sex by Age in Royal Oak
Disability Class: Hearing Difficulty
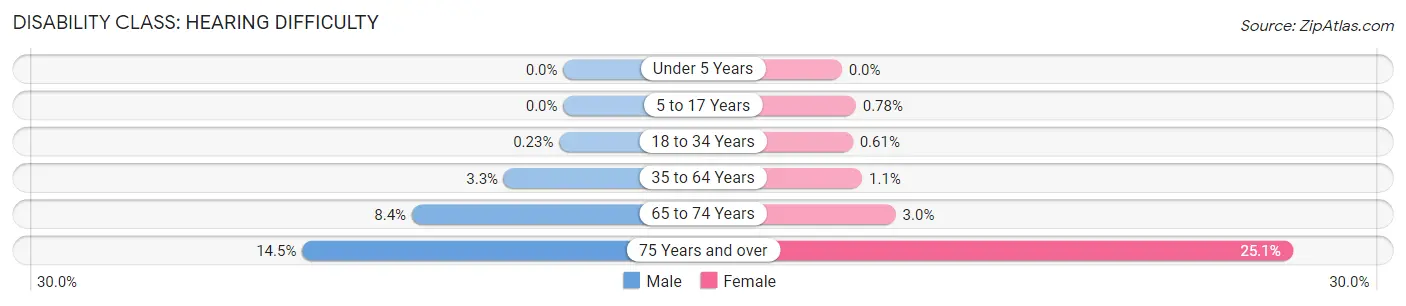
| Age Bracket | Male | Female |
| Under 5 Years | 0 (0.0%) | 0 (0.0%) |
| 5 to 17 Years | 0 (0.0%) | 21 (0.8%) |
| 18 to 34 Years | 24 (0.2%) | 55 (0.6%) |
| 35 to 64 Years | 369 (3.3%) | 118 (1.1%) |
| 65 to 74 Years | 220 (8.4%) | 81 (3.0%) |
| 75 Years and over | 173 (14.5%) | 447 (25.1%) |
Disability Class: Vision Difficulty
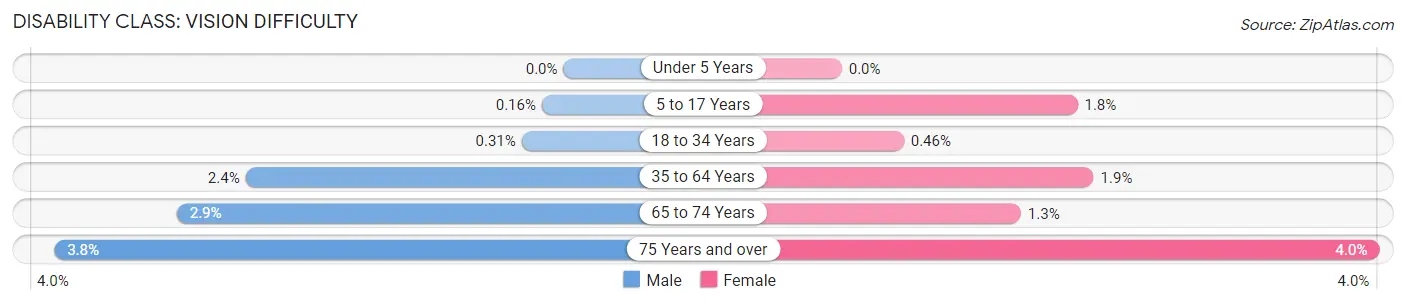
| Age Bracket | Male | Female |
| Under 5 Years | 0 (0.0%) | 0 (0.0%) |
| 5 to 17 Years | 4 (0.2%) | 47 (1.8%) |
| 18 to 34 Years | 33 (0.3%) | 41 (0.5%) |
| 35 to 64 Years | 263 (2.4%) | 195 (1.9%) |
| 65 to 74 Years | 75 (2.9%) | 36 (1.3%) |
| 75 Years and over | 45 (3.8%) | 71 (4.0%) |
Disability Class: Cognitive Difficulty
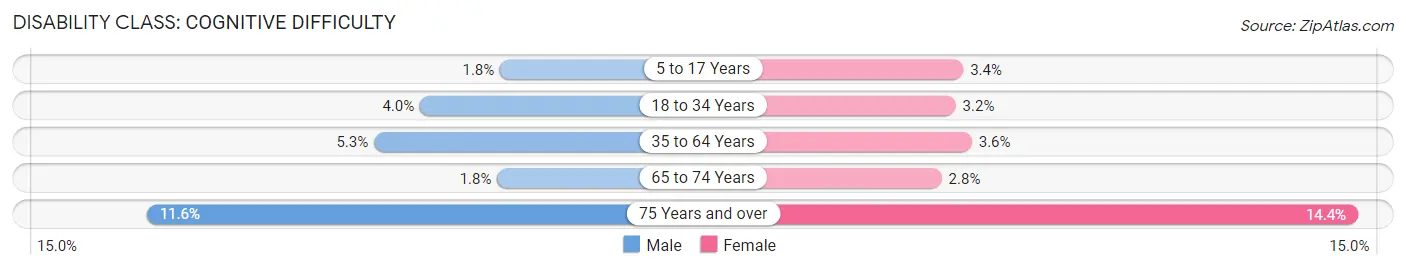
| Age Bracket | Male | Female |
| 5 to 17 Years | 44 (1.8%) | 91 (3.4%) |
| 18 to 34 Years | 421 (4.0%) | 285 (3.2%) |
| 35 to 64 Years | 588 (5.3%) | 377 (3.6%) |
| 65 to 74 Years | 48 (1.8%) | 75 (2.8%) |
| 75 Years and over | 138 (11.6%) | 256 (14.4%) |
Disability Class: Ambulatory Difficulty
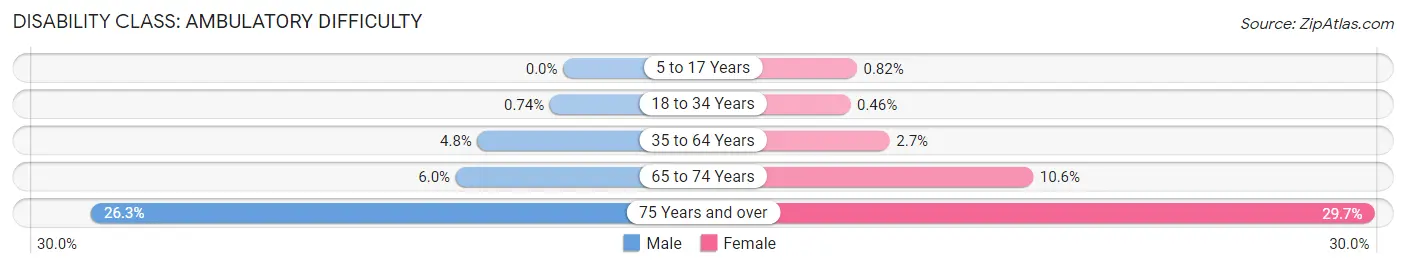
| Age Bracket | Male | Female |
| 5 to 17 Years | 0 (0.0%) | 22 (0.8%) |
| 18 to 34 Years | 78 (0.7%) | 41 (0.5%) |
| 35 to 64 Years | 532 (4.8%) | 276 (2.6%) |
| 65 to 74 Years | 156 (6.0%) | 287 (10.6%) |
| 75 Years and over | 313 (26.3%) | 528 (29.6%) |
Disability Class: Self-Care Difficulty
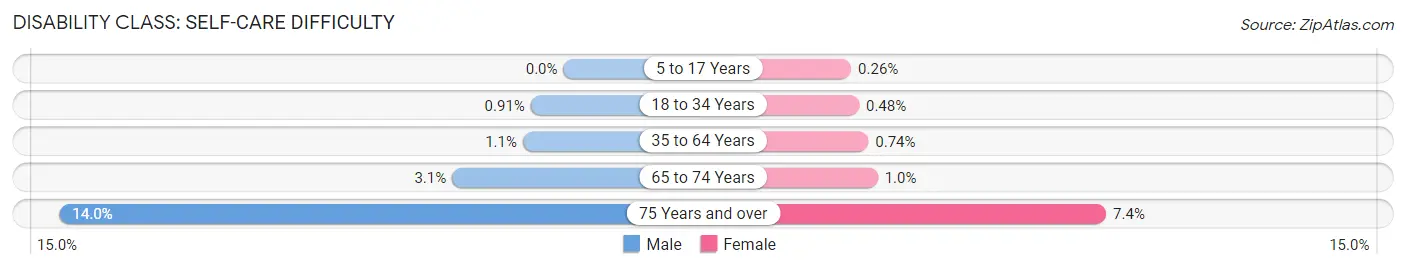
| Age Bracket | Male | Female |
| 5 to 17 Years | 0 (0.0%) | 7 (0.3%) |
| 18 to 34 Years | 96 (0.9%) | 43 (0.5%) |
| 35 to 64 Years | 126 (1.1%) | 77 (0.7%) |
| 65 to 74 Years | 81 (3.1%) | 27 (1.0%) |
| 75 Years and over | 167 (14.0%) | 131 (7.4%) |
Technology Access in Royal Oak
Computing Device Access in Royal Oak
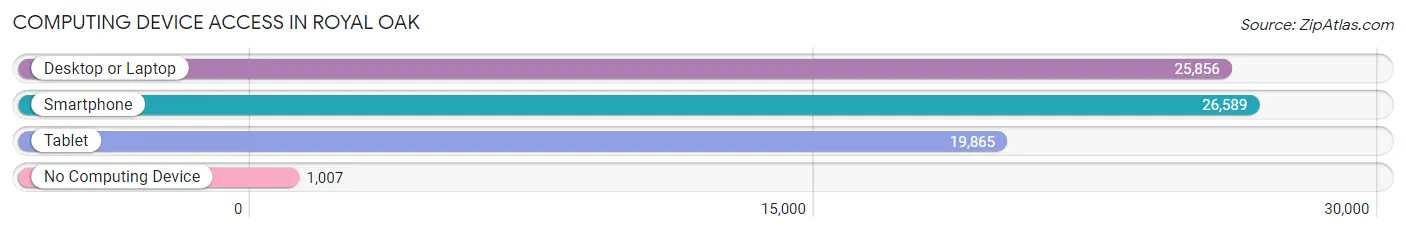
| Device Type | # Households | % Households |
| Desktop or Laptop | 25,856 | 89.2% |
| Smartphone | 26,589 | 91.7% |
| Tablet | 19,865 | 68.5% |
| No Computing Device | 1,007 | 3.5% |
| Total | 28,986 | 100.0% |
Internet Access in Royal Oak
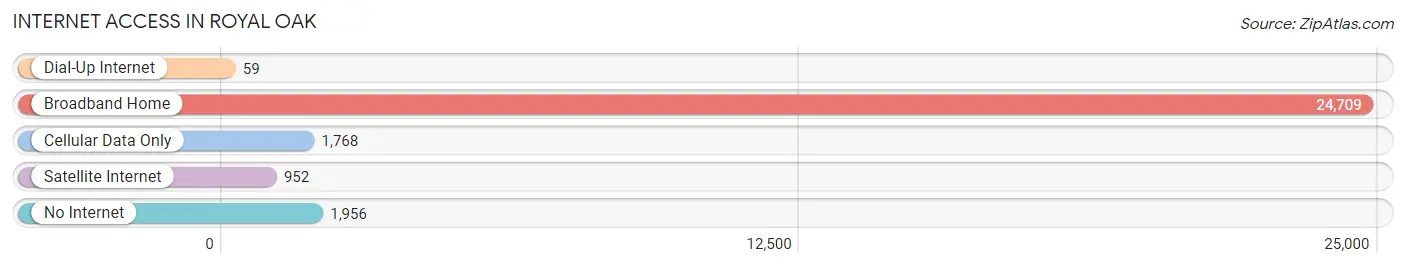
| Internet Type | # Households | % Households |
| Dial-Up Internet | 59 | 0.2% |
| Broadband Home | 24,709 | 85.2% |
| Cellular Data Only | 1,768 | 6.1% |
| Satellite Internet | 952 | 3.3% |
| No Internet | 1,956 | 6.8% |
| Total | 28,986 | 100.0% |
Royal Oak Summary
Oakland County, Michigan is home to the city of Royal Oak, a vibrant and diverse community located just north of Detroit. Royal Oak is a city of approximately 59,000 people, and is the 8th largest city in the state of Michigan. The city is known for its vibrant downtown area, which is home to a variety of restaurants, shops, and entertainment venues.
History
Royal Oak was first settled in 1819 by a group of settlers from New York. The city was originally known as "Beverly," and was later renamed "Royal Oak" in 1891. The name was chosen to honor the Royal Oak tree, which was planted in the city's center in 1819.
The city was incorporated in 1921, and has since grown to become a major suburb of Detroit. The city has a rich history, and is home to many historic buildings, including the Royal Oak Historical Museum, which houses artifacts from the city's past.
Geography
Royal Oak is located in Oakland County, Michigan, and is situated just north of Detroit. The city is bordered by the cities of Ferndale, Madison Heights, and Troy. The city is located on the banks of the Rouge River, and is home to several parks and recreational areas.
The city has a total area of 8.3 square miles, and has a population density of 7,092 people per square mile. The city is home to several neighborhoods, including Downtown Royal Oak, which is the city's main commercial district.
Economy
Royal Oak is home to a diverse economy, with a variety of industries represented in the city. The city is home to several major employers, including Beaumont Health, DTE Energy, and the Detroit Medical Center. The city is also home to a variety of small businesses, including restaurants, retail stores, and professional services.
The city's economy is largely driven by the automotive industry, which is a major employer in the city. The city is also home to several technology companies, including Microsoft, Oracle, and IBM.
Demographics
As of the 2010 census, the population of Royal Oak was 59,069. The city has a diverse population, with a variety of ethnic and racial backgrounds represented. The city is home to a large number of immigrants, with the largest groups being from Mexico, India, and China.
The median household income in Royal Oak is $60,945, and the median home value is $179,400. The city has a high rate of homeownership, with over 70% of residents owning their own homes. The city also has a high rate of educational attainment, with over 90% of residents having at least a high school diploma.
Common Questions
What is Per Capita Income in Royal Oak?
Per Capita income in Royal Oak is $59,760.
What is the Median Family Income in Royal Oak?
Median Family Income in Royal Oak is $128,868.
What is the Median Household income in Royal Oak?
Median Household Income in Royal Oak is $92,799.
What is Income or Wage Gap in Royal Oak?
Income or Wage Gap in Royal Oak is 33.3%.
Women in Royal Oak earn 66.7 cents for every dollar earned by a man.
What is Family Income Deficit in Royal Oak?
Family Income Deficit in Royal Oak is $9,619.
Families that are below poverty line in Royal Oak earn $9,619 less on average than the poverty threshold level.
What is Inequality or Gini Index in Royal Oak?
Inequality or Gini Index in Royal Oak is 0.42.
What is the Total Population of Royal Oak?
Total Population of Royal Oak is 58,053.
What is the Total Male Population of Royal Oak?
Total Male Population of Royal Oak is 29,749.
What is the Total Female Population of Royal Oak?
Total Female Population of Royal Oak is 28,304.
What is the Ratio of Males per 100 Females in Royal Oak?
There are 105.11 Males per 100 Females in Royal Oak.
What is the Ratio of Females per 100 Males in Royal Oak?
There are 95.14 Females per 100 Males in Royal Oak.
What is the Median Population Age in Royal Oak?
Median Population Age in Royal Oak is 35.9 Years.
What is the Average Family Size in Royal Oak
Average Family Size in Royal Oak is 2.8 People.
What is the Average Household Size in Royal Oak
Average Household Size in Royal Oak is 2.0 People.
How Large is the Labor Force in Royal Oak?
There are 38,033 People in the Labor Forcein in Royal Oak.
What is the Percentage of People in the Labor Force in Royal Oak?
75.5% of People are in the Labor Force in Royal Oak.
What is the Unemployment Rate in Royal Oak?
Unemployment Rate in Royal Oak is 3.0%.