Southern Pines, NC Map & Demographics
Southern Pines Map
Southern Pines Overview
$50,199
PER CAPITA INCOME
$109,495
AVG FAMILY INCOME
$81,867
AVG HOUSEHOLD INCOME
43.2%
WAGE / INCOME GAP [ % ]
56.8¢/ $1
WAGE / INCOME GAP [ $ ]
0.48
INEQUALITY / GINI INDEX
15,701
TOTAL POPULATION
7,477
MALE POPULATION
8,224
FEMALE POPULATION
90.92
MALES / 100 FEMALES
109.99
FEMALES / 100 MALES
38.4
MEDIAN AGE
2.8
AVG FAMILY SIZE
2.1
AVG HOUSEHOLD SIZE
7,653
LABOR FORCE [ PEOPLE ]
59.0%
PERCENT IN LABOR FORCE
6.7%
UNEMPLOYMENT RATE
Southern Pines Zip Codes
Southern Pines Area Codes
Income in Southern Pines
Income Overview in Southern Pines
Per Capita Income in Southern Pines is $50,199, while median incomes of families and households are $109,495 and $81,867 respectively.
| Characteristic | Number | Measure |
| Per Capita Income | 15,701 | $50,199 |
| Median Family Income | 4,075 | $109,495 |
| Mean Family Income | 4,075 | $145,644 |
| Median Household Income | 7,080 | $81,867 |
| Mean Household Income | 7,080 | $110,507 |
| Income Deficit | 4,075 | $0 |
| Wage / Income Gap (%) | 15,701 | 43.22% |
| Wage / Income Gap ($) | 15,701 | 56.78¢ per $1 |
| Gini / Inequality Index | 15,701 | 0.48 |
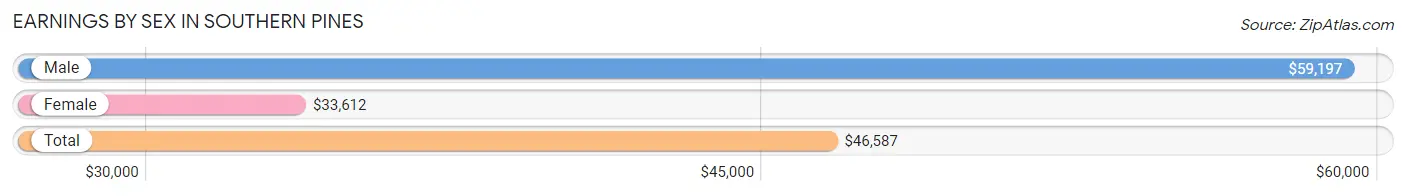
Earnings by Sex in Southern Pines
Average Earnings in Southern Pines are $46,587, $59,197 for men and $33,612 for women, a difference of 43.2%.
| Sex | Number | Average Earnings |
| Male | 4,014 (51.1%) | $59,197 |
| Female | 3,839 (48.9%) | $33,612 |
| Total | 7,853 (100.0%) | $46,587 |
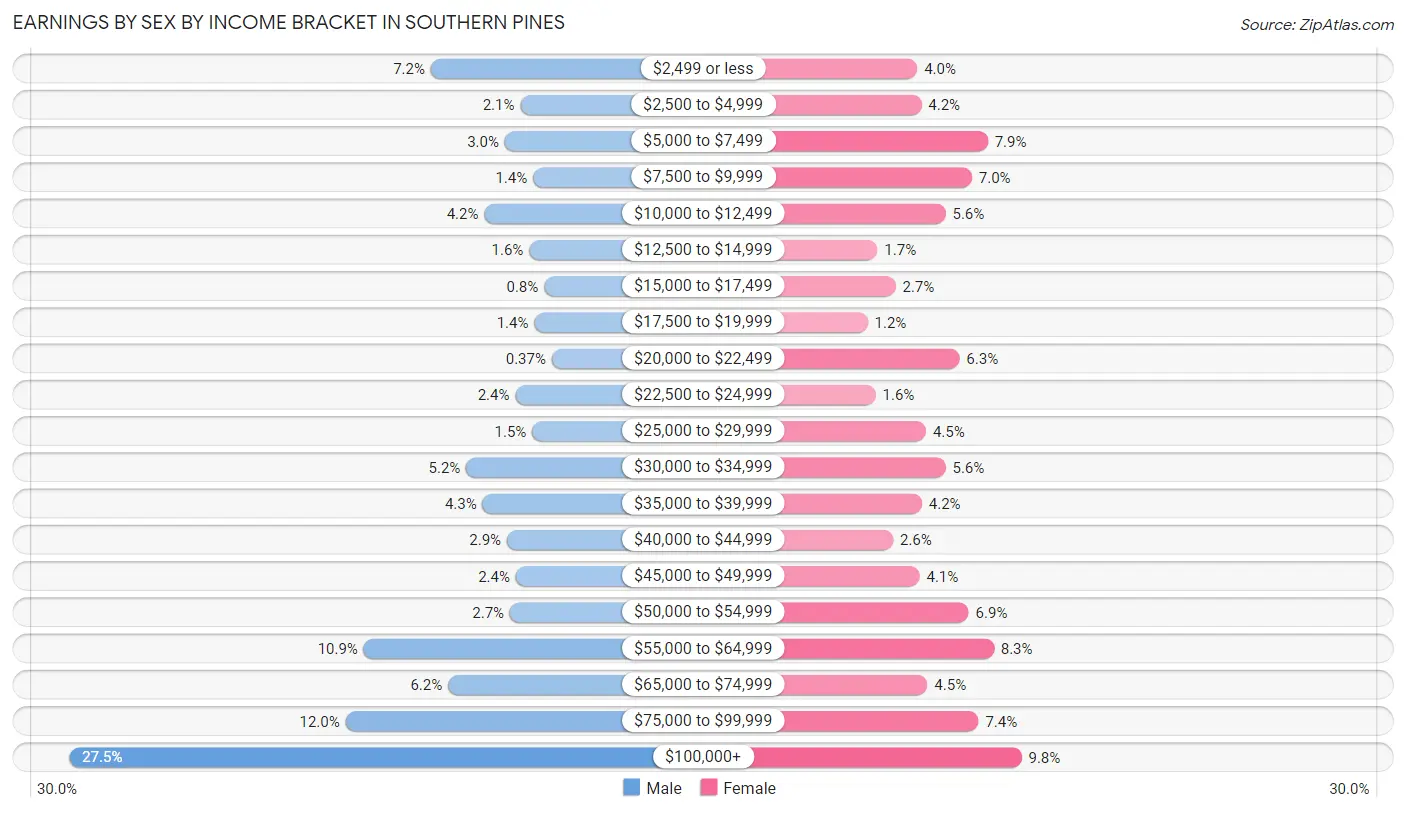
Earnings by Sex by Income Bracket in Southern Pines
The most common earnings brackets in Southern Pines are $100,000+ for men (1,104 | 27.5%) and $100,000+ for women (377 | 9.8%).
| Income | Male | Female |
| $2,499 or less | 288 (7.2%) | 152 (4.0%) |
| $2,500 to $4,999 | 86 (2.1%) | 161 (4.2%) |
| $5,000 to $7,499 | 121 (3.0%) | 304 (7.9%) |
| $7,500 to $9,999 | 57 (1.4%) | 270 (7.0%) |
| $10,000 to $12,499 | 167 (4.2%) | 213 (5.6%) |
| $12,500 to $14,999 | 66 (1.6%) | 66 (1.7%) |
| $15,000 to $17,499 | 32 (0.8%) | 105 (2.7%) |
| $17,500 to $19,999 | 54 (1.3%) | 45 (1.2%) |
| $20,000 to $22,499 | 15 (0.4%) | 243 (6.3%) |
| $22,500 to $24,999 | 97 (2.4%) | 62 (1.6%) |
| $25,000 to $29,999 | 59 (1.5%) | 171 (4.4%) |
| $30,000 to $34,999 | 208 (5.2%) | 213 (5.6%) |
| $35,000 to $39,999 | 171 (4.3%) | 162 (4.2%) |
| $40,000 to $44,999 | 116 (2.9%) | 100 (2.6%) |
| $45,000 to $49,999 | 96 (2.4%) | 157 (4.1%) |
| $50,000 to $54,999 | 109 (2.7%) | 263 (6.9%) |
| $55,000 to $64,999 | 439 (10.9%) | 317 (8.3%) |
| $65,000 to $74,999 | 249 (6.2%) | 174 (4.5%) |
| $75,000 to $99,999 | 480 (12.0%) | 284 (7.4%) |
| $100,000+ | 1,104 (27.5%) | 377 (9.8%) |
| Total | 4,014 (100.0%) | 3,839 (100.0%) |
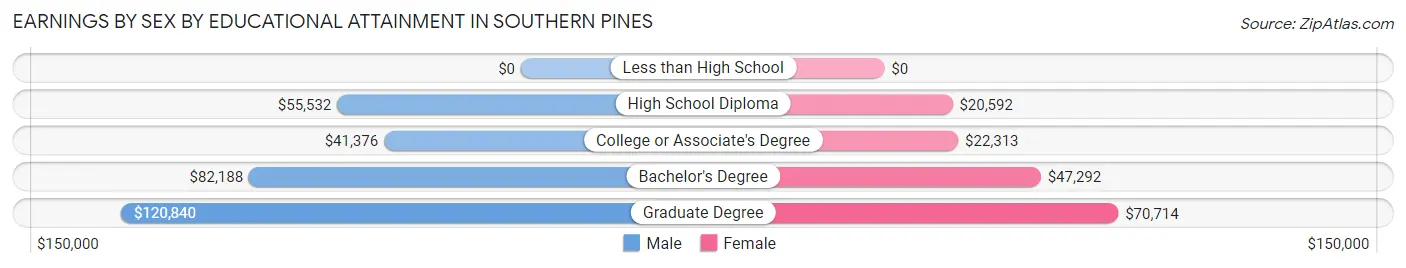
Earnings by Sex by Educational Attainment in Southern Pines
Average earnings in Southern Pines are $66,080 for men and $35,490 for women, a difference of 46.3%. Men with an educational attainment of graduate degree enjoy the highest average annual earnings of $120,840, while those with college or associate's degree education earn the least with $41,376. Women with an educational attainment of graduate degree earn the most with the average annual earnings of $70,714, while those with high school diploma education have the smallest earnings of $20,592.
| Educational Attainment | Male Income | Female Income |
| Less than High School | - | - |
| High School Diploma | $55,532 | $20,592 |
| College or Associate's Degree | $41,376 | $22,313 |
| Bachelor's Degree | $82,188 | $47,292 |
| Graduate Degree | $120,840 | $70,714 |
| Total | $66,080 | $35,490 |
Family Income in Southern Pines
Family Income Brackets in Southern Pines
According to the Southern Pines family income data, there are 1,165 families falling into the $100,000 to $149,999 income range, which is the most common income bracket and makes up 28.6% of all families. Conversely, the $10,000 to $14,999 income bracket is the least frequent group with only 69 families (1.7%) belonging to this category.
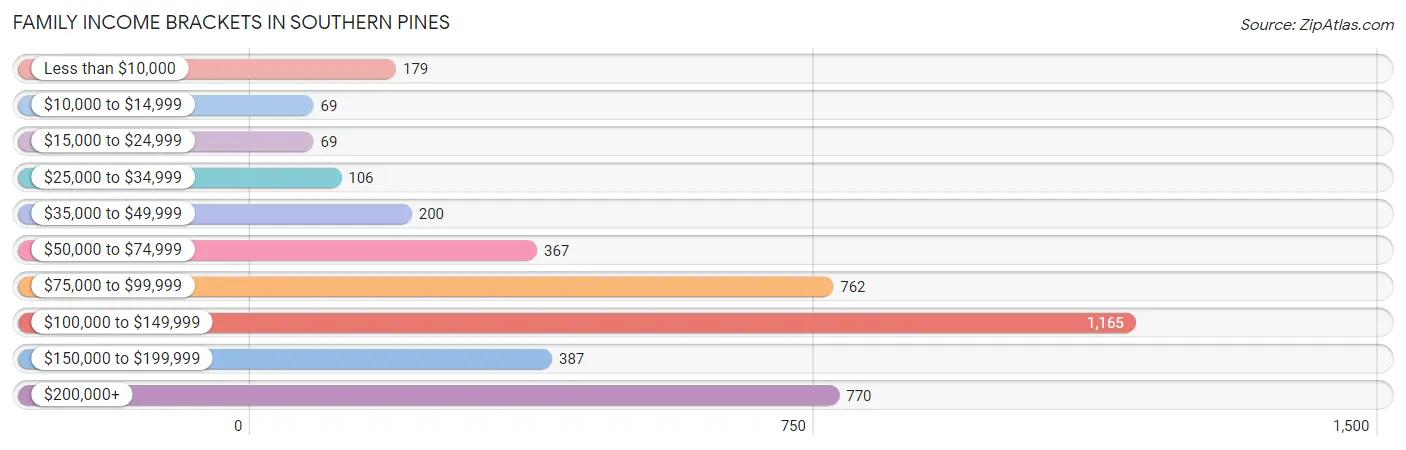
| Income Bracket | # Families | % Families |
| Less than $10,000 | 179 | 4.4% |
| $10,000 to $14,999 | 69 | 1.7% |
| $15,000 to $24,999 | 69 | 1.7% |
| $25,000 to $34,999 | 106 | 2.6% |
| $35,000 to $49,999 | 200 | 4.9% |
| $50,000 to $74,999 | 367 | 9.0% |
| $75,000 to $99,999 | 762 | 18.7% |
| $100,000 to $149,999 | 1,165 | 28.6% |
| $150,000 to $199,999 | 387 | 9.5% |
| $200,000+ | 770 | 18.9% |
Family Income by Famaliy Size in Southern Pines
6-person families (60 | 1.5%) account for the highest median family income in Southern Pines with $250,001 per family, while 2-person families (2,271 | 55.7%) have the highest median income of $47,001 per family member.
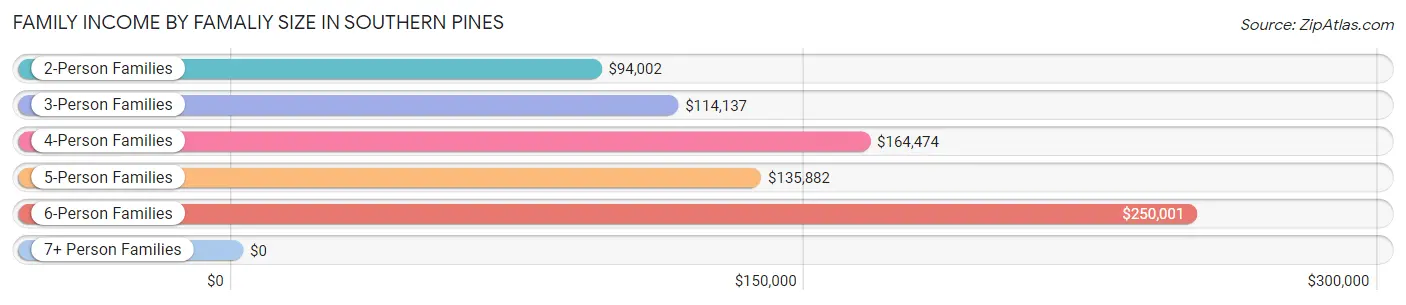
| Income Bracket | # Families | Median Income |
| 2-Person Families | 2,271 (55.7%) | $94,002 |
| 3-Person Families | 818 (20.1%) | $114,137 |
| 4-Person Families | 696 (17.1%) | $164,474 |
| 5-Person Families | 230 (5.6%) | $135,882 |
| 6-Person Families | 60 (1.5%) | $250,001 |
| 7+ Person Families | 0 (0.0%) | $0 |
| Total | 4,075 (100.0%) | $109,495 |
Family Income by Number of Earners in Southern Pines
The median family income in Southern Pines is $109,495, with families comprising 3+ earners (165) having the highest median family income of $179,763, while families with no earners (921) have the lowest median family income of $70,066, accounting for 4.1% and 22.6% of families, respectively.
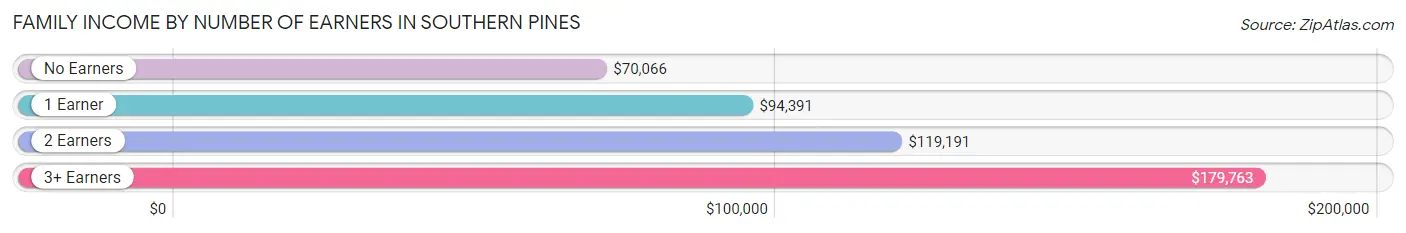
| Number of Earners | # Families | Median Income |
| No Earners | 921 (22.6%) | $70,066 |
| 1 Earner | 1,194 (29.3%) | $94,391 |
| 2 Earners | 1,795 (44.1%) | $119,191 |
| 3+ Earners | 165 (4.1%) | $179,763 |
| Total | 4,075 (100.0%) | $109,495 |
Household Income in Southern Pines
Household Income Brackets in Southern Pines
With 1,437 households falling in the category, the $100,000 to $149,999 income range is the most frequent in Southern Pines, accounting for 20.3% of all households. In contrast, only 326 households (4.6%) fall into the less than $10,000 income bracket, making it the least populous group.
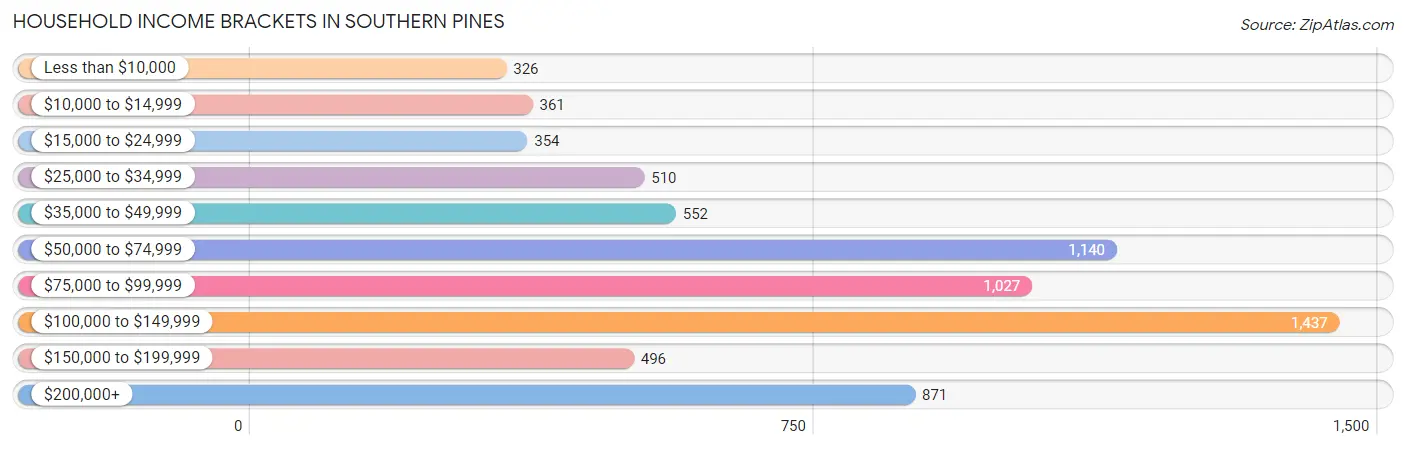
| Income Bracket | # Households | % Households |
| Less than $10,000 | 326 | 4.6% |
| $10,000 to $14,999 | 361 | 5.1% |
| $15,000 to $24,999 | 354 | 5.0% |
| $25,000 to $34,999 | 510 | 7.2% |
| $35,000 to $49,999 | 552 | 7.8% |
| $50,000 to $74,999 | 1,140 | 16.1% |
| $75,000 to $99,999 | 1,027 | 14.5% |
| $100,000 to $149,999 | 1,437 | 20.3% |
| $150,000 to $199,999 | 496 | 7.0% |
| $200,000+ | 871 | 12.3% |
Household Income by Householder Age in Southern Pines
The median household income in Southern Pines is $81,867, with the highest median household income of $101,311 found in the 25 to 44 years age bracket for the primary householder. A total of 2,401 households (33.9%) fall into this category. Meanwhile, the 65+ years age bracket for the primary householder has the lowest median household income of $56,385, with 2,487 households (35.1%) in this group.
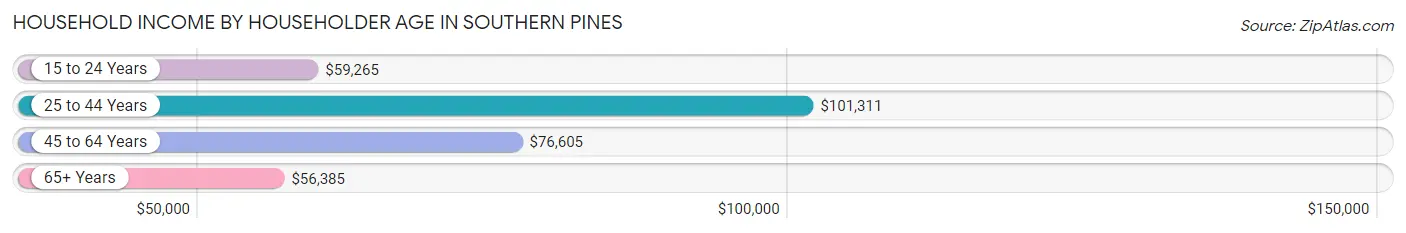
| Income Bracket | # Households | Median Income |
| 15 to 24 Years | 304 (4.3%) | $59,265 |
| 25 to 44 Years | 2,401 (33.9%) | $101,311 |
| 45 to 64 Years | 1,888 (26.7%) | $76,605 |
| 65+ Years | 2,487 (35.1%) | $56,385 |
| Total | 7,080 (100.0%) | $81,867 |
Poverty in Southern Pines
Income Below Poverty by Sex and Age in Southern Pines
With 9.2% poverty level for males and 10.2% for females among the residents of Southern Pines, 15 year old males and 18 to 24 year old females are the most vulnerable to poverty, with 41 males (75.9%) and 116 females (24.6%) in their respective age groups living below the poverty level.
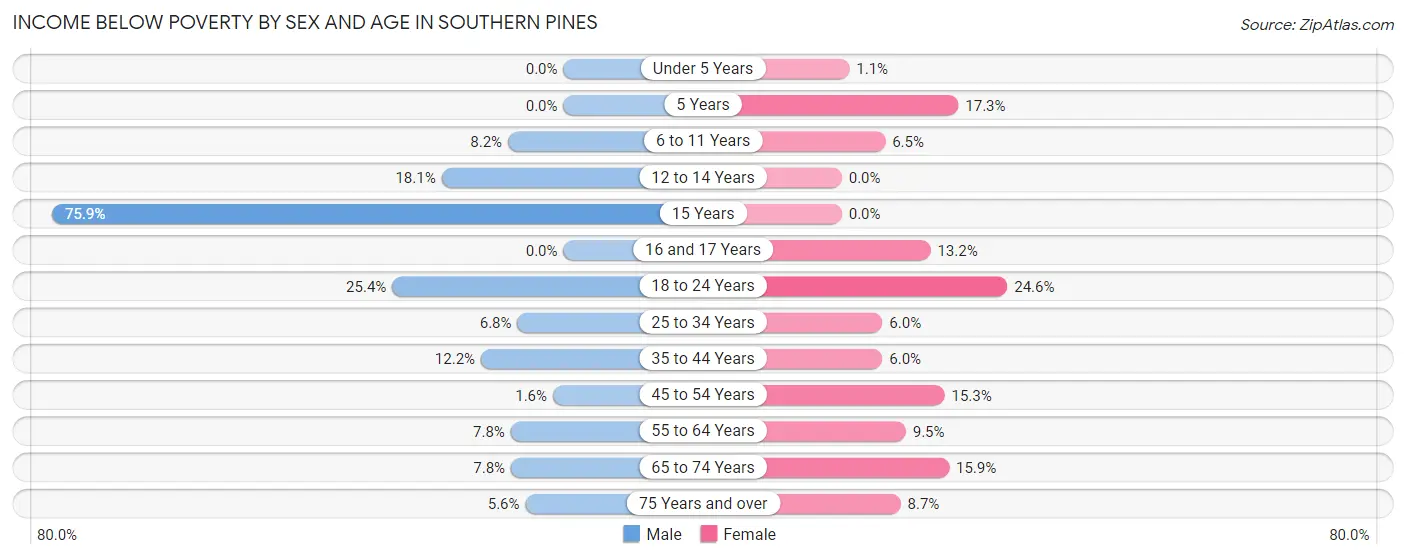
| Age Bracket | Male | Female |
| Under 5 Years | 0 (0.0%) | 5 (1.1%) |
| 5 Years | 0 (0.0%) | 49 (17.3%) |
| 6 to 11 Years | 45 (8.2%) | 24 (6.5%) |
| 12 to 14 Years | 40 (18.1%) | 0 (0.0%) |
| 15 Years | 41 (75.9%) | 0 (0.0%) |
| 16 and 17 Years | 0 (0.0%) | 22 (13.2%) |
| 18 to 24 Years | 181 (25.4%) | 116 (24.6%) |
| 25 to 34 Years | 83 (6.8%) | 81 (6.0%) |
| 35 to 44 Years | 125 (12.2%) | 60 (6.0%) |
| 45 to 54 Years | 12 (1.6%) | 132 (15.3%) |
| 55 to 64 Years | 52 (7.8%) | 57 (9.5%) |
| 65 to 74 Years | 53 (7.8%) | 159 (15.9%) |
| 75 Years and over | 39 (5.6%) | 108 (8.7%) |
| Total | 671 (9.2%) | 813 (10.2%) |
Income Above Poverty by Sex and Age in Southern Pines
According to the poverty statistics in Southern Pines, males aged under 5 years and females aged 12 to 14 years are the age groups that are most secure financially, with 100.0% of males and 100.0% of females in these age groups living above the poverty line.
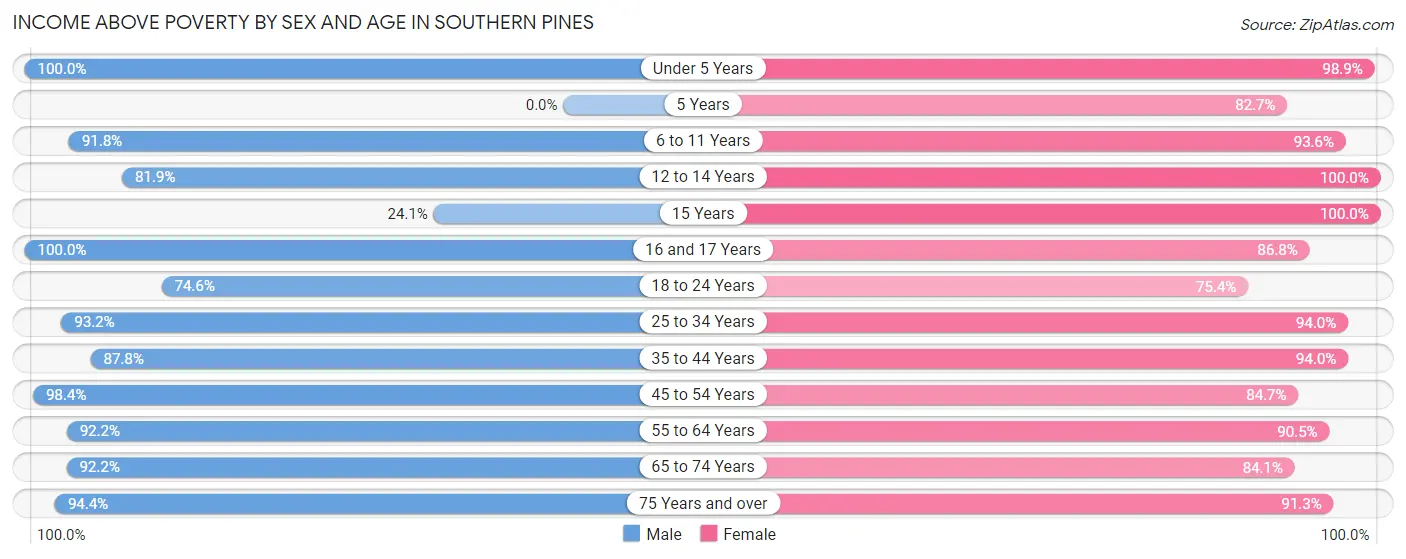
| Age Bracket | Male | Female |
| Under 5 Years | 590 (100.0%) | 443 (98.9%) |
| 5 Years | 0 (0.0%) | 234 (82.7%) |
| 6 to 11 Years | 502 (91.8%) | 348 (93.5%) |
| 12 to 14 Years | 181 (81.9%) | 146 (100.0%) |
| 15 Years | 13 (24.1%) | 35 (100.0%) |
| 16 and 17 Years | 91 (100.0%) | 145 (86.8%) |
| 18 to 24 Years | 531 (74.6%) | 356 (75.4%) |
| 25 to 34 Years | 1,133 (93.2%) | 1,262 (94.0%) |
| 35 to 44 Years | 896 (87.8%) | 937 (94.0%) |
| 45 to 54 Years | 756 (98.4%) | 733 (84.7%) |
| 55 to 64 Years | 613 (92.2%) | 543 (90.5%) |
| 65 to 74 Years | 628 (92.2%) | 840 (84.1%) |
| 75 Years and over | 652 (94.4%) | 1,129 (91.3%) |
| Total | 6,586 (90.7%) | 7,151 (89.8%) |
Income Below Poverty Among Married-Couple Families in Southern Pines
The poverty statistics for married-couple families in Southern Pines show that 1.4% or 46 of the total 3,275 families live below the poverty line. Families with no children have the highest poverty rate of 2.3%, comprising of 46 families. On the other hand, families with 1 or 2 children have the lowest poverty rate of 0.0%, which includes 0 families.
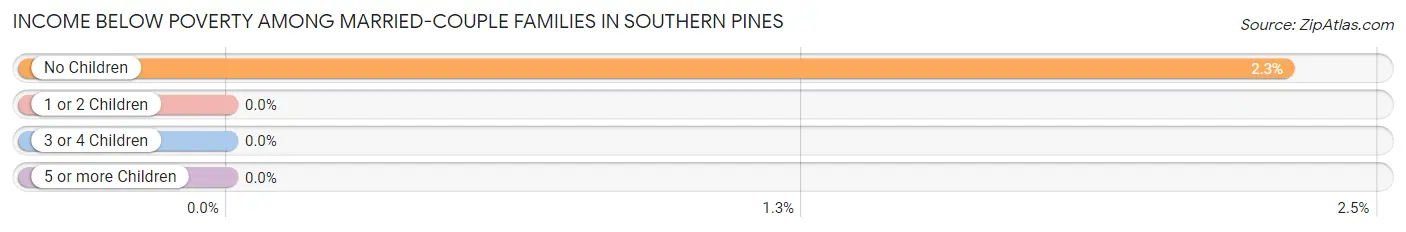
| Children | Above Poverty | Below Poverty |
| No Children | 1,954 (97.7%) | 46 (2.3%) |
| 1 or 2 Children | 1,015 (100.0%) | 0 (0.0%) |
| 3 or 4 Children | 260 (100.0%) | 0 (0.0%) |
| 5 or more Children | 0 (0.0%) | 0 (0.0%) |
| Total | 3,229 (98.6%) | 46 (1.4%) |
Income Below Poverty Among Single-Parent Households in Southern Pines
According to the poverty data in Southern Pines, 39.1% or 43 single-father households and 33.6% or 232 single-mother households are living below the poverty line. Among single-father households, those with 3 or 4 children have the highest poverty rate, with 7 households (100.0%) experiencing poverty. Likewise, among single-mother households, those with 3 or 4 children have the highest poverty rate, with 19 households (100.0%) falling below the poverty line.
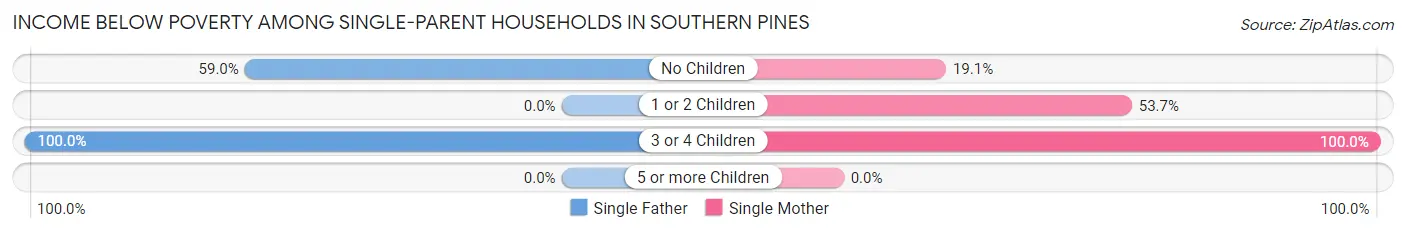
| Children | Single Father | Single Mother |
| No Children | 36 (59.0%) | 81 (19.1%) |
| 1 or 2 Children | 0 (0.0%) | 132 (53.7%) |
| 3 or 4 Children | 7 (100.0%) | 19 (100.0%) |
| 5 or more Children | 0 (0.0%) | 0 (0.0%) |
| Total | 43 (39.1%) | 232 (33.6%) |
Income Below Poverty Among Married-Couple vs Single-Parent Households in Southern Pines
The poverty data for Southern Pines shows that 46 of the married-couple family households (1.4%) and 275 of the single-parent households (34.4%) are living below the poverty level. Within the married-couple family households, those with no children have the highest poverty rate, with 46 households (2.3%) falling below the poverty line. Among the single-parent households, those with 3 or 4 children have the highest poverty rate, with 26 household (100.0%) living below poverty.
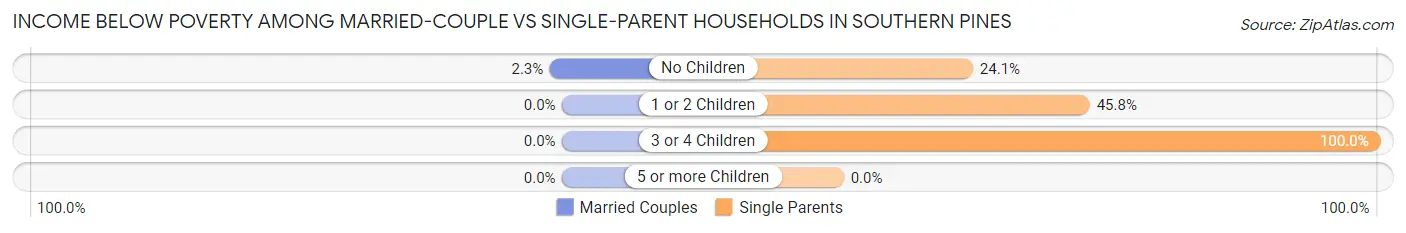
| Children | Married-Couple Families | Single-Parent Households |
| No Children | 46 (2.3%) | 117 (24.1%) |
| 1 or 2 Children | 0 (0.0%) | 132 (45.8%) |
| 3 or 4 Children | 0 (0.0%) | 26 (100.0%) |
| 5 or more Children | 0 (0.0%) | 0 (0.0%) |
| Total | 46 (1.4%) | 275 (34.4%) |
Race in Southern Pines
The most populous races in Southern Pines are White / Caucasian (11,850 | 75.5%), Black / African American (2,087 | 13.3%), and Hispanic or Latino (1,225 | 7.8%).
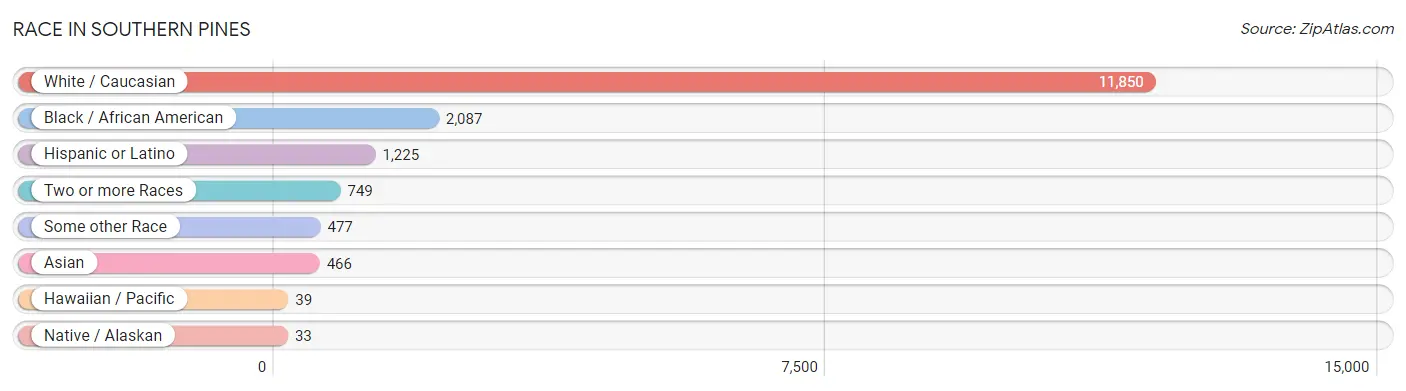
| Race | # Population | % Population |
| Asian | 466 | 3.0% |
| Black / African American | 2,087 | 13.3% |
| Hawaiian / Pacific | 39 | 0.3% |
| Hispanic or Latino | 1,225 | 7.8% |
| Native / Alaskan | 33 | 0.2% |
| White / Caucasian | 11,850 | 75.5% |
| Two or more Races | 749 | 4.8% |
| Some other Race | 477 | 3.0% |
| Total | 15,701 | 100.0% |
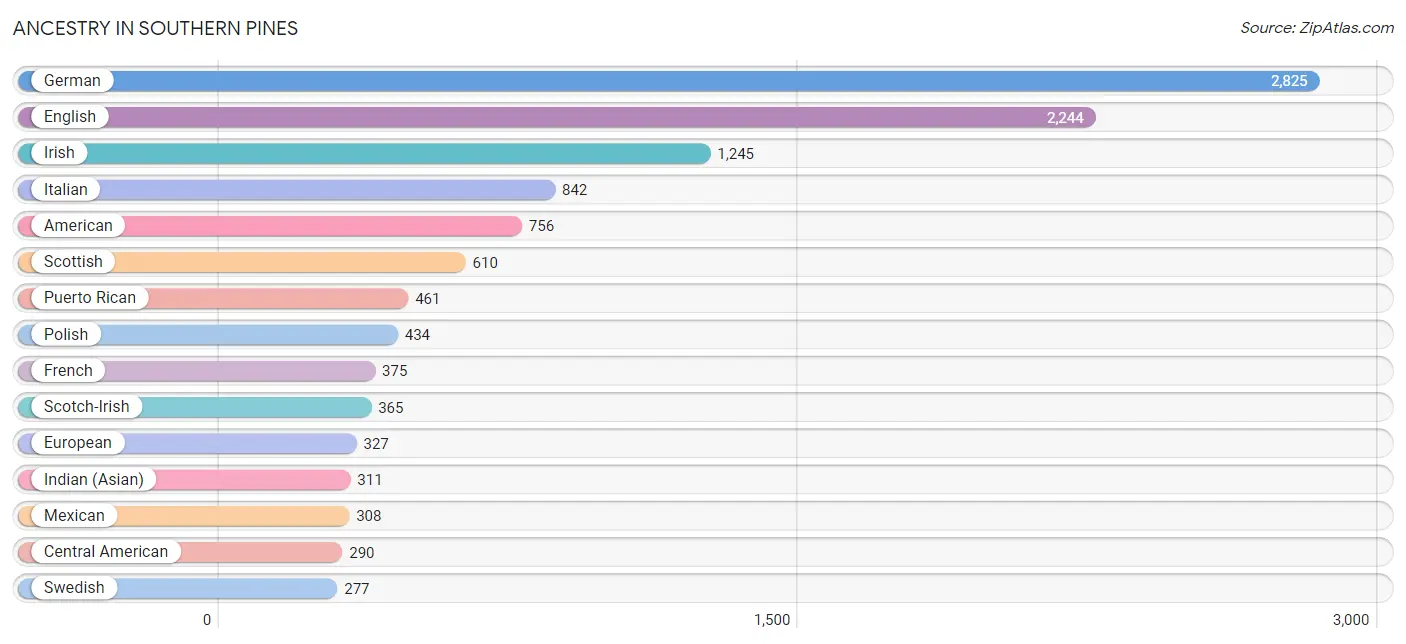
Ancestry in Southern Pines
The most populous ancestries reported in Southern Pines are German (2,825 | 18.0%), English (2,244 | 14.3%), Irish (1,245 | 7.9%), Italian (842 | 5.4%), and American (756 | 4.8%), together accounting for 50.4% of all Southern Pines residents.
| Ancestry | # Population | % Population |
| African | 6 | 0.0% |
| American | 756 | 4.8% |
| Arab | 30 | 0.2% |
| Austrian | 28 | 0.2% |
| Bhutanese | 32 | 0.2% |
| Blackfeet | 28 | 0.2% |
| British | 221 | 1.4% |
| Burmese | 149 | 0.9% |
| Cajun | 8 | 0.1% |
| Canadian | 37 | 0.2% |
| Central American | 290 | 1.8% |
| Cherokee | 45 | 0.3% |
| Chinese | 2 | 0.0% |
| Chippewa | 21 | 0.1% |
| Choctaw | 8 | 0.1% |
| Costa Rican | 109 | 0.7% |
| Cuban | 54 | 0.3% |
| Czech | 27 | 0.2% |
| Danish | 30 | 0.2% |
| Dutch | 126 | 0.8% |
| Eastern European | 13 | 0.1% |
| Egyptian | 30 | 0.2% |
| English | 2,244 | 14.3% |
| Estonian | 27 | 0.2% |
| European | 327 | 2.1% |
| Finnish | 95 | 0.6% |
| French | 375 | 2.4% |
| French Canadian | 24 | 0.2% |
| German | 2,825 | 18.0% |
| Greek | 20 | 0.1% |
| Guamanian / Chamorro | 39 | 0.3% |
| Guatemalan | 14 | 0.1% |
| Honduran | 136 | 0.9% |
| Hungarian | 49 | 0.3% |
| Icelander | 13 | 0.1% |
| Indian (Asian) | 311 | 2.0% |
| Irish | 1,245 | 7.9% |
| Italian | 842 | 5.4% |
| Jamaican | 13 | 0.1% |
| Korean | 94 | 0.6% |
| Latvian | 8 | 0.1% |
| Lumbee | 24 | 0.2% |
| Luxembourger | 24 | 0.2% |
| Mexican | 308 | 2.0% |
| Norwegian | 225 | 1.4% |
| Polish | 434 | 2.8% |
| Portuguese | 20 | 0.1% |
| Puerto Rican | 461 | 2.9% |
| Russian | 116 | 0.7% |
| Salvadoran | 31 | 0.2% |
| Scandinavian | 28 | 0.2% |
| Scotch-Irish | 365 | 2.3% |
| Scottish | 610 | 3.9% |
| Slovak | 106 | 0.7% |
| Spanish | 56 | 0.4% |
| Sri Lankan | 115 | 0.7% |
| Subsaharan African | 6 | 0.0% |
| Swedish | 277 | 1.8% |
| Swiss | 14 | 0.1% |
| Thai | 41 | 0.3% |
| Ukrainian | 94 | 0.6% |
| Welsh | 101 | 0.6% |
| Yugoslavian | 13 | 0.1% | View All 63 Rows |
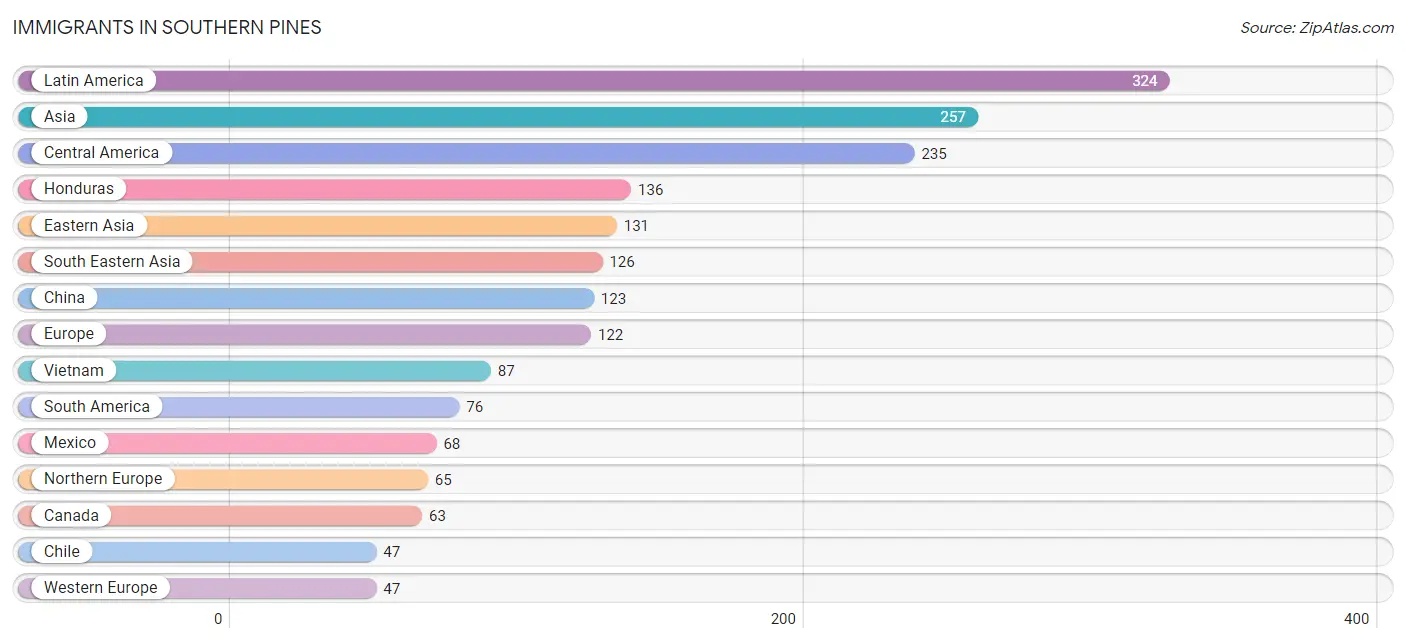
Immigrants in Southern Pines
The most numerous immigrant groups reported in Southern Pines came from Latin America (324 | 2.1%), Asia (257 | 1.6%), Central America (235 | 1.5%), Honduras (136 | 0.9%), and Eastern Asia (131 | 0.8%), together accounting for 6.9% of all Southern Pines residents.
| Immigration Origin | # Population | % Population |
| Africa | 30 | 0.2% |
| Asia | 257 | 1.6% |
| Australia | 25 | 0.2% |
| Brazil | 29 | 0.2% |
| Canada | 63 | 0.4% |
| Caribbean | 13 | 0.1% |
| Central America | 235 | 1.5% |
| Chile | 47 | 0.3% |
| China | 123 | 0.8% |
| Eastern Asia | 131 | 0.8% |
| Eastern Europe | 10 | 0.1% |
| Egypt | 30 | 0.2% |
| England | 10 | 0.1% |
| Europe | 122 | 0.8% |
| France | 8 | 0.1% |
| Germany | 39 | 0.3% |
| Guatemala | 31 | 0.2% |
| Honduras | 136 | 0.9% |
| Jamaica | 13 | 0.1% |
| Korea | 8 | 0.1% |
| Latin America | 324 | 2.1% |
| Mexico | 68 | 0.4% |
| Northern Africa | 30 | 0.2% |
| Northern Europe | 65 | 0.4% |
| Oceania | 25 | 0.2% |
| Philippines | 39 | 0.3% |
| South America | 76 | 0.5% |
| South Eastern Asia | 126 | 0.8% |
| Taiwan | 23 | 0.2% |
| Ukraine | 10 | 0.1% |
| Vietnam | 87 | 0.5% |
| Western Europe | 47 | 0.3% | View All 32 Rows |
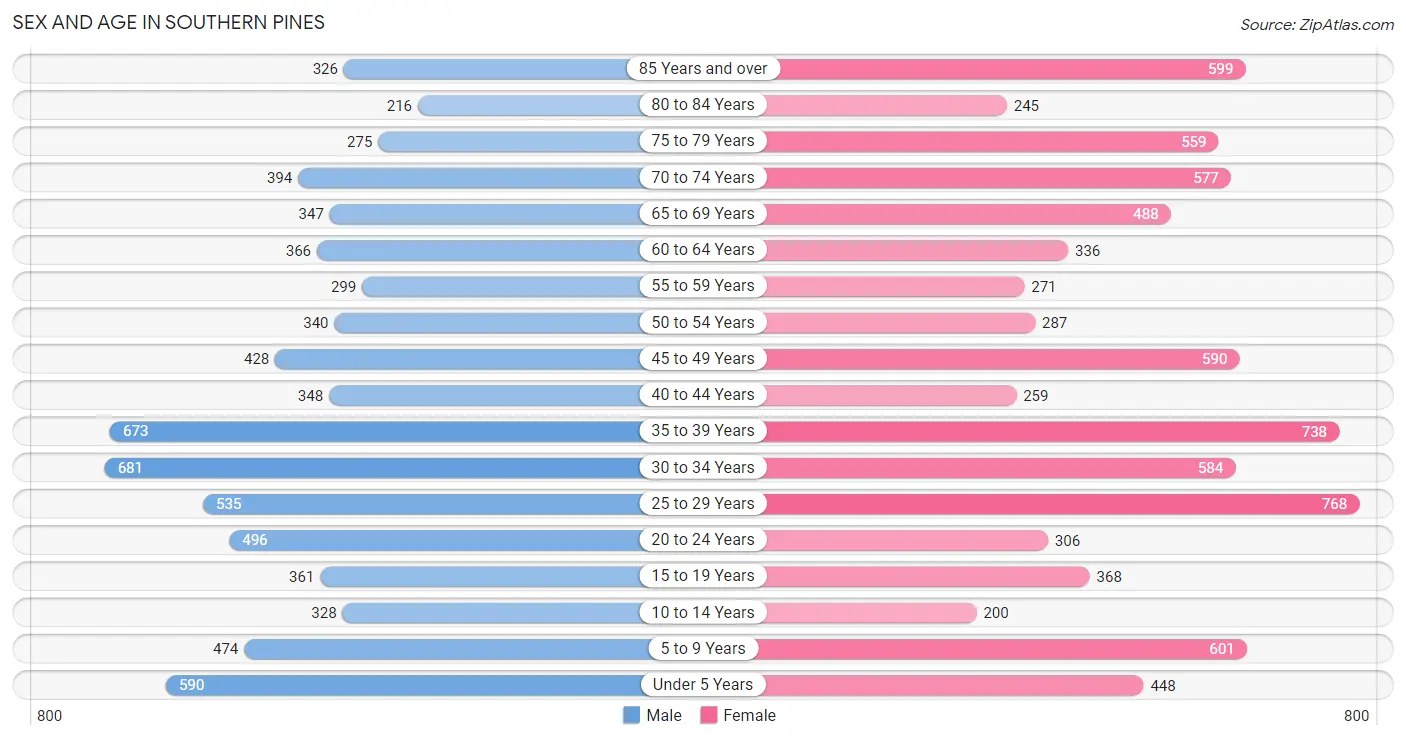
Sex and Age in Southern Pines
Sex and Age in Southern Pines
The most populous age groups in Southern Pines are 30 to 34 Years (681 | 9.1%) for men and 25 to 29 Years (768 | 9.3%) for women.
| Age Bracket | Male | Female |
| Under 5 Years | 590 (7.9%) | 448 (5.4%) |
| 5 to 9 Years | 474 (6.3%) | 601 (7.3%) |
| 10 to 14 Years | 328 (4.4%) | 200 (2.4%) |
| 15 to 19 Years | 361 (4.8%) | 368 (4.5%) |
| 20 to 24 Years | 496 (6.6%) | 306 (3.7%) |
| 25 to 29 Years | 535 (7.2%) | 768 (9.3%) |
| 30 to 34 Years | 681 (9.1%) | 584 (7.1%) |
| 35 to 39 Years | 673 (9.0%) | 738 (9.0%) |
| 40 to 44 Years | 348 (4.6%) | 259 (3.2%) |
| 45 to 49 Years | 428 (5.7%) | 590 (7.2%) |
| 50 to 54 Years | 340 (4.5%) | 287 (3.5%) |
| 55 to 59 Years | 299 (4.0%) | 271 (3.3%) |
| 60 to 64 Years | 366 (4.9%) | 336 (4.1%) |
| 65 to 69 Years | 347 (4.6%) | 488 (5.9%) |
| 70 to 74 Years | 394 (5.3%) | 577 (7.0%) |
| 75 to 79 Years | 275 (3.7%) | 559 (6.8%) |
| 80 to 84 Years | 216 (2.9%) | 245 (3.0%) |
| 85 Years and over | 326 (4.4%) | 599 (7.3%) |
| Total | 7,477 (100.0%) | 8,224 (100.0%) |
Families and Households in Southern Pines
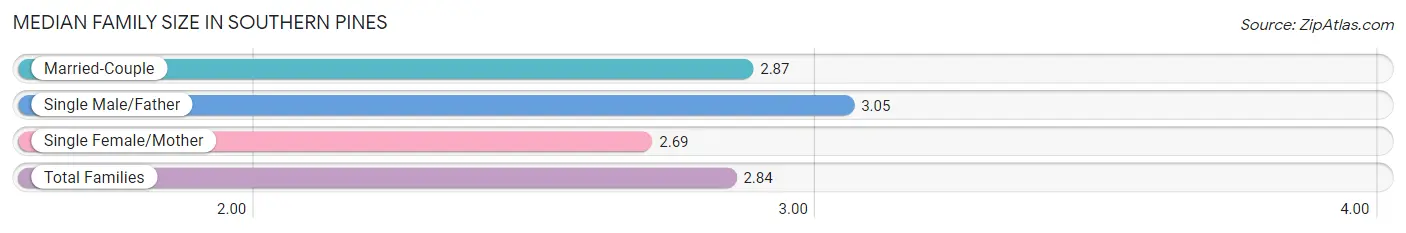
Median Family Size in Southern Pines
The median family size in Southern Pines is 2.84 persons per family, with single male/father families (110 | 2.7%) accounting for the largest median family size of 3.05 persons per family. On the other hand, single female/mother families (690 | 16.9%) represent the smallest median family size with 2.69 persons per family.
| Family Type | # Families | Family Size |
| Married-Couple | 3,275 (80.4%) | 2.87 |
| Single Male/Father | 110 (2.7%) | 3.05 |
| Single Female/Mother | 690 (16.9%) | 2.69 |
| Total Families | 4,075 (100.0%) | 2.84 |
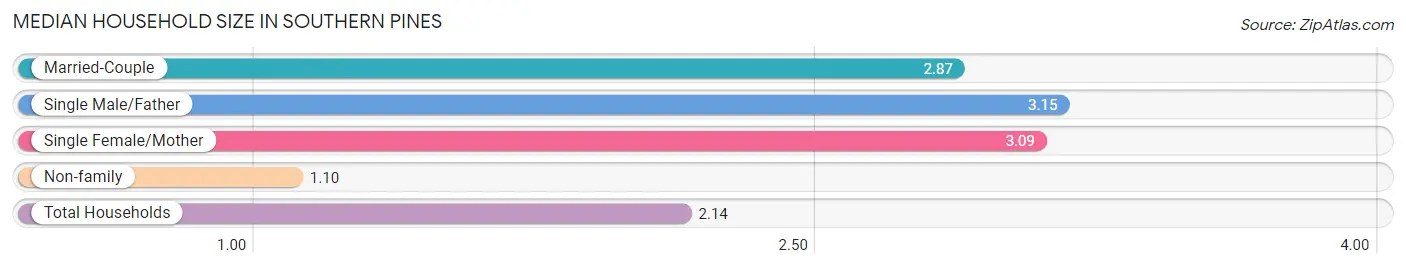
Median Household Size in Southern Pines
The median household size in Southern Pines is 2.14 persons per household, with single male/father households (110 | 1.5%) accounting for the largest median household size of 3.15 persons per household. non-family households (3,005 | 42.4%) represent the smallest median household size with 1.10 persons per household.
| Household Type | # Households | Household Size |
| Married-Couple | 3,275 (46.3%) | 2.87 |
| Single Male/Father | 110 (1.5%) | 3.15 |
| Single Female/Mother | 690 (9.8%) | 3.09 |
| Non-family | 3,005 (42.4%) | 1.10 |
| Total Households | 7,080 (100.0%) | 2.14 |
Household Size by Marriage Status in Southern Pines
Out of a total of 7,080 households in Southern Pines, 4,075 (57.6%) are family households, while 3,005 (42.4%) are nonfamily households. The most numerous type of family households are 2-person households, comprising 2,115, and the most common type of nonfamily households are 1-person households, comprising 2,745.
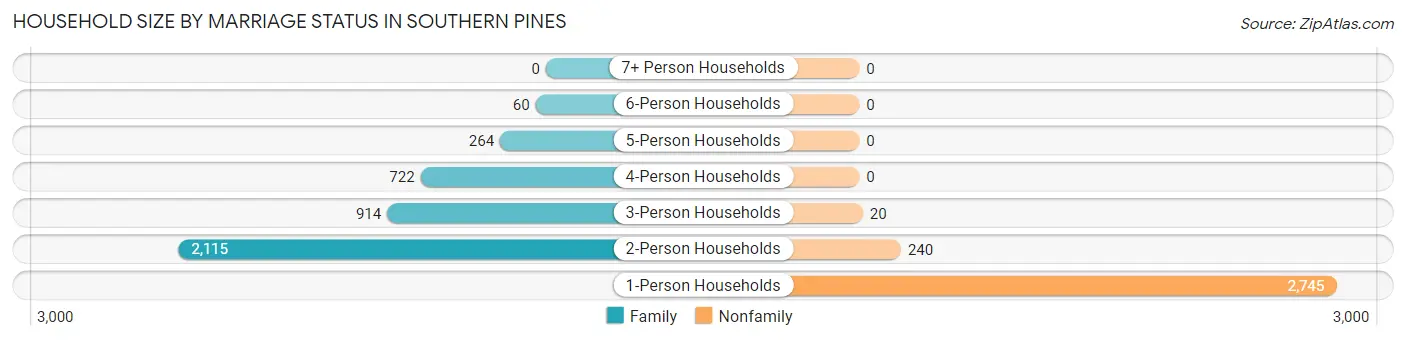
| Household Size | Family Households | Nonfamily Households |
| 1-Person Households | - | 2,745 (38.8%) |
| 2-Person Households | 2,115 (29.9%) | 240 (3.4%) |
| 3-Person Households | 914 (12.9%) | 20 (0.3%) |
| 4-Person Households | 722 (10.2%) | 0 (0.0%) |
| 5-Person Households | 264 (3.7%) | 0 (0.0%) |
| 6-Person Households | 60 (0.9%) | 0 (0.0%) |
| 7+ Person Households | 0 (0.0%) | 0 (0.0%) |
| Total | 4,075 (57.6%) | 3,005 (42.4%) |
Female Fertility in Southern Pines
Fertility by Age in Southern Pines
Average fertility rate in Southern Pines is 40.0 births per 1,000 women. Women in the age bracket of 20 to 34 years have the highest fertility rate with 60.0 births per 1,000 women. Women in the age bracket of 20 to 34 years acount for 69.0% of all women with births.
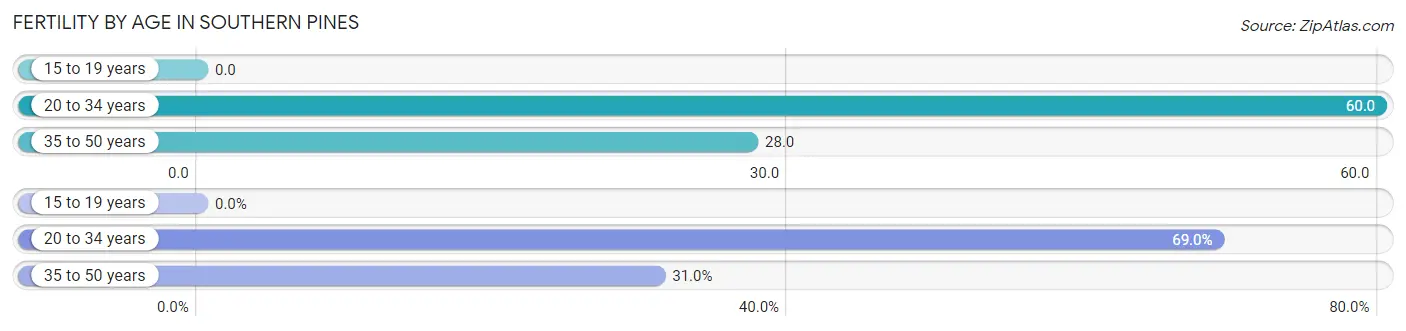
| Age Bracket | Women with Births | Births / 1,000 Women |
| 15 to 19 years | 0 (0.0%) | 0.0 |
| 20 to 34 years | 100 (69.0%) | 60.0 |
| 35 to 50 years | 45 (31.0%) | 28.0 |
| Total | 145 (100.0%) | 40.0 |
Fertility by Age by Marriage Status in Southern Pines
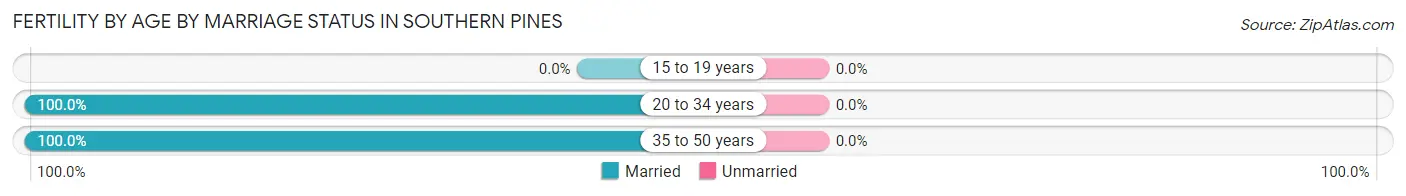
| Age Bracket | Married | Unmarried |
| 15 to 19 years | 0 (0.0%) | 0 (0.0%) |
| 20 to 34 years | 100 (100.0%) | 0 (0.0%) |
| 35 to 50 years | 45 (100.0%) | 0 (0.0%) |
| Total | 145 (100.0%) | 0 (0.0%) |
Fertility by Education in Southern Pines
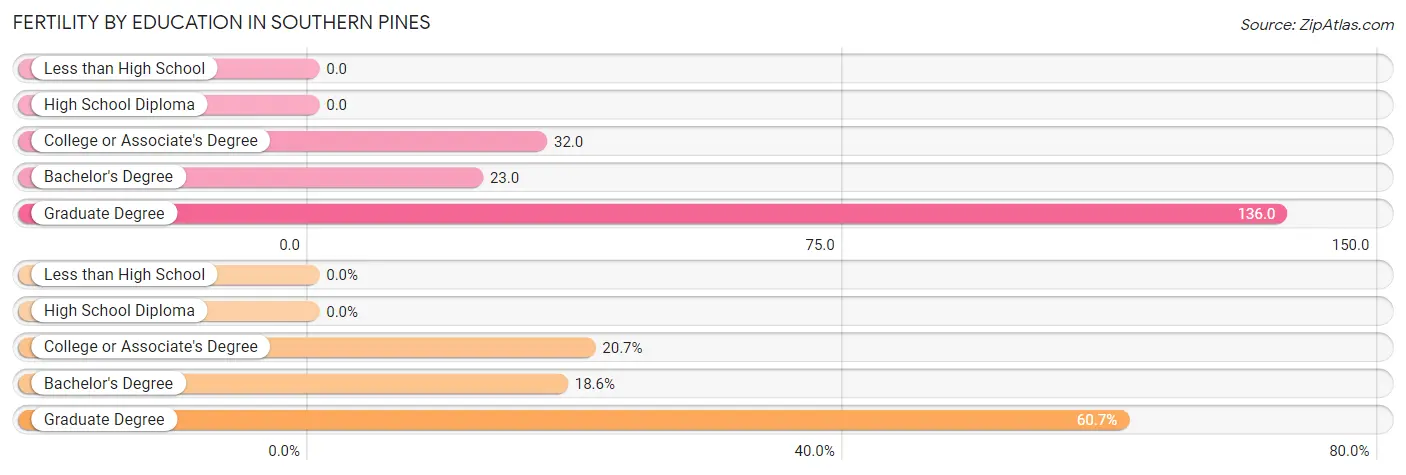
| Educational Attainment | Women with Births | Births / 1,000 Women |
| Less than High School | 0 (0.0%) | 0.0 |
| High School Diploma | 0 (0.0%) | 0.0 |
| College or Associate's Degree | 30 (20.7%) | 32.0 |
| Bachelor's Degree | 27 (18.6%) | 23.0 |
| Graduate Degree | 88 (60.7%) | 136.0 |
| Total | 145 (100.0%) | 40.0 |
Fertility by Education by Marriage Status in Southern Pines
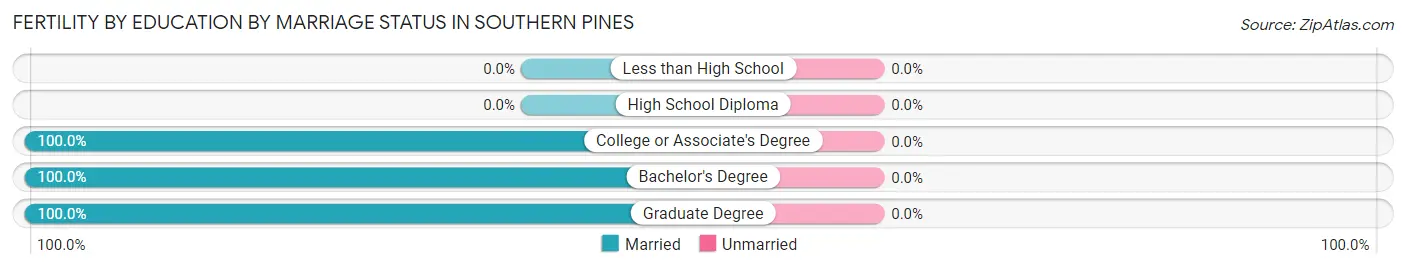
| Educational Attainment | Married | Unmarried |
| Less than High School | 0 (0.0%) | 0 (0.0%) |
| High School Diploma | 0 (0.0%) | 0 (0.0%) |
| College or Associate's Degree | 30 (100.0%) | 0 (0.0%) |
| Bachelor's Degree | 27 (100.0%) | 0 (0.0%) |
| Graduate Degree | 88 (100.0%) | 0 (0.0%) |
| Total | 145 (100.0%) | 0 (0.0%) |
Employment Characteristics in Southern Pines
Employment by Class of Employer in Southern Pines
Among the 7,016 employed individuals in Southern Pines, private company employees (3,870 | 55.2%), federal government employees (1,249 | 17.8%), and not-for-profit organizations (672 | 9.6%) make up the most common classes of employment.
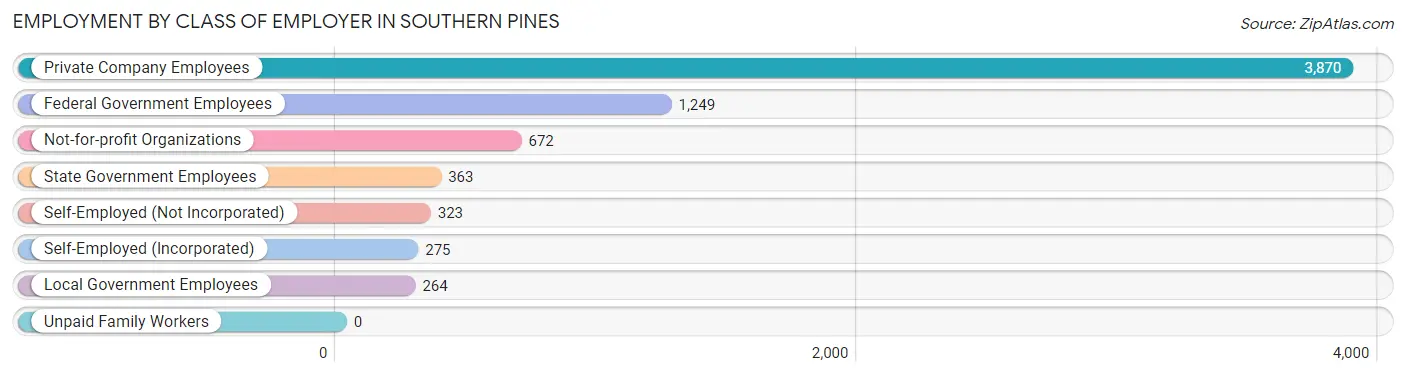
| Employer Class | # Employees | % Employees |
| Private Company Employees | 3,870 | 55.2% |
| Self-Employed (Incorporated) | 275 | 3.9% |
| Self-Employed (Not Incorporated) | 323 | 4.6% |
| Not-for-profit Organizations | 672 | 9.6% |
| Local Government Employees | 264 | 3.8% |
| State Government Employees | 363 | 5.2% |
| Federal Government Employees | 1,249 | 17.8% |
| Unpaid Family Workers | 0 | 0.0% |
| Total | 7,016 | 100.0% |
Employment Status by Age in Southern Pines
According to the labor force statistics for Southern Pines, out of the total population over 16 years of age (12,971), 59.0% or 7,653 individuals are in the labor force, with 6.7% or 513 of them unemployed. The age group with the highest labor force participation rate is 20 to 24 years, with 97.4% or 781 individuals in the labor force. Within the labor force, the 16 to 19 years age range has the highest percentage of unemployed individuals, with 26.0% or 39 of them being unemployed.
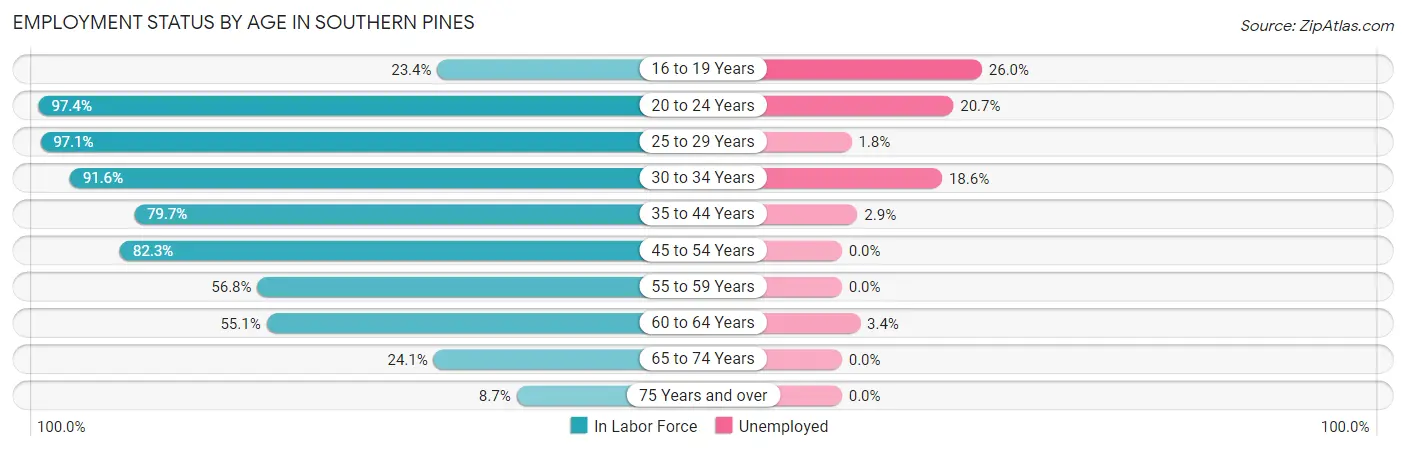
| Age Bracket | In Labor Force | Unemployed |
| 16 to 19 Years | 150 (23.4%) | 39 (26.0%) |
| 20 to 24 Years | 781 (97.4%) | 162 (20.7%) |
| 25 to 29 Years | 1,265 (97.1%) | 23 (1.8%) |
| 30 to 34 Years | 1,159 (91.6%) | 216 (18.6%) |
| 35 to 44 Years | 1,608 (79.7%) | 47 (2.9%) |
| 45 to 54 Years | 1,354 (82.3%) | 0 (0.0%) |
| 55 to 59 Years | 324 (56.8%) | 0 (0.0%) |
| 60 to 64 Years | 387 (55.1%) | 13 (3.4%) |
| 65 to 74 Years | 435 (24.1%) | 0 (0.0%) |
| 75 Years and over | 193 (8.7%) | 0 (0.0%) |
| Total | 7,653 (59.0%) | 513 (6.7%) |
Employment Status by Educational Attainment in Southern Pines
According to labor force statistics for Southern Pines, 81.3% of individuals (6,100) out of the total population between 25 and 64 years of age (7,503) are in the labor force, with 4.8% or 293 of them being unemployed. The group with the highest labor force participation rate are those with the educational attainment of bachelor's degree or higher, with 84.1% or 3,602 individuals in the labor force. Within the labor force, individuals with less than high school education have the highest percentage of unemployment, with 20.1% or 34 of them being unemployed.
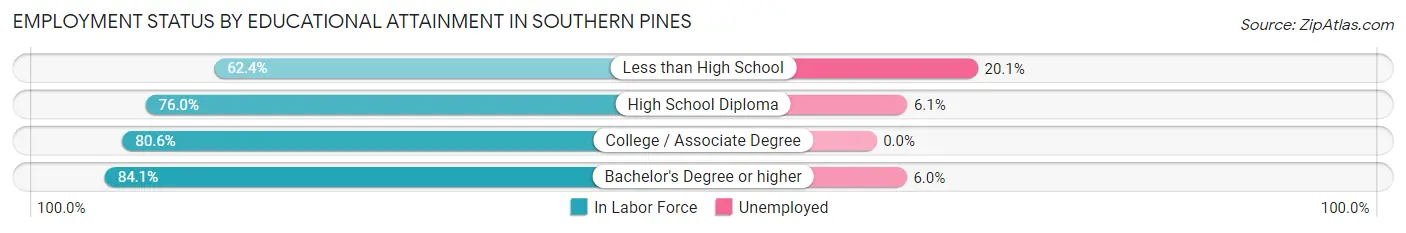
| Educational Attainment | In Labor Force | Unemployed |
| Less than High School | 169 (62.4%) | 54 (20.1%) |
| High School Diploma | 860 (76.0%) | 69 (6.1%) |
| College / Associate Degree | 1,465 (80.6%) | 0 (0.0%) |
| Bachelor's Degree or higher | 3,602 (84.1%) | 257 (6.0%) |
| Total | 6,100 (81.3%) | 360 (4.8%) |
Employment Occupations by Sex in Southern Pines
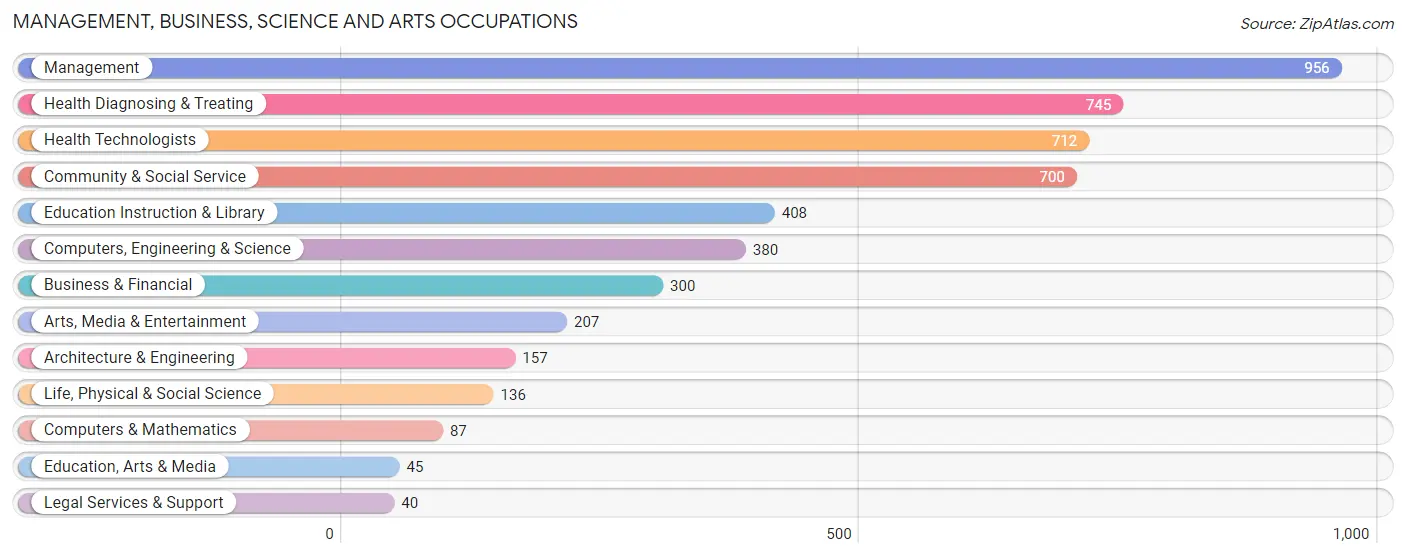
Management, Business, Science and Arts Occupations
The most common Management, Business, Science and Arts occupations in Southern Pines are Management (956 | 15.4%), Health Diagnosing & Treating (745 | 12.0%), Health Technologists (712 | 11.5%), Community & Social Service (700 | 11.3%), and Education Instruction & Library (408 | 6.6%).
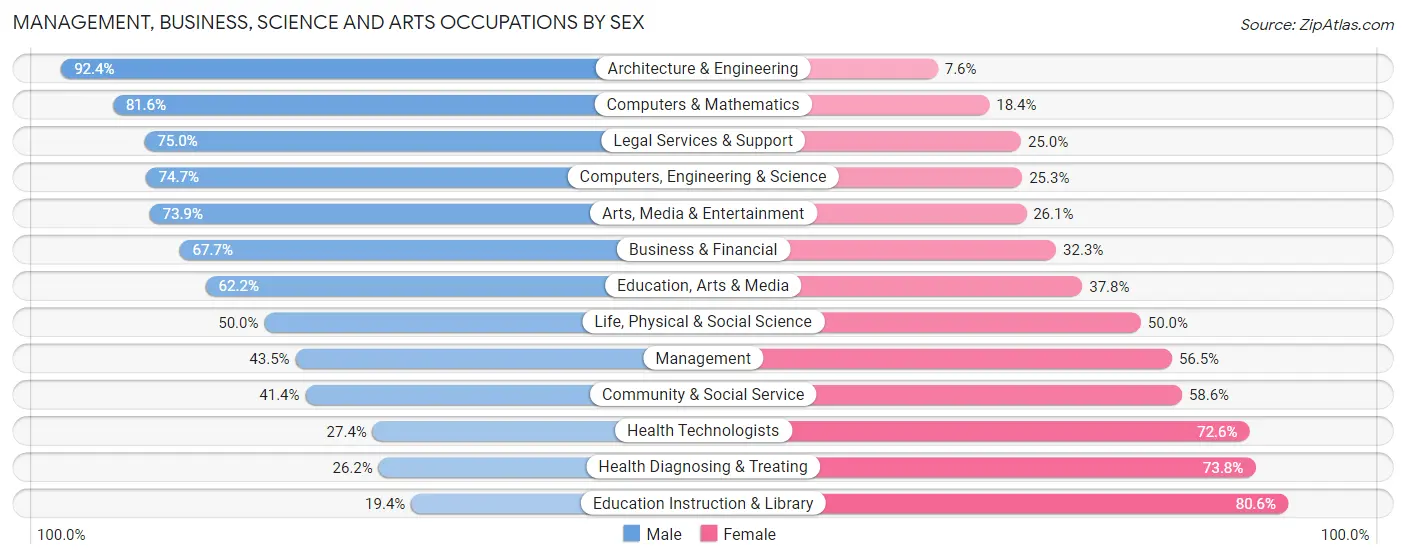
Management, Business, Science and Arts Occupations by Sex
Within the Management, Business, Science and Arts occupations in Southern Pines, the most male-oriented occupations are Architecture & Engineering (92.4%), Computers & Mathematics (81.6%), and Legal Services & Support (75.0%), while the most female-oriented occupations are Education Instruction & Library (80.6%), Health Diagnosing & Treating (73.8%), and Health Technologists (72.6%).
| Occupation | Male | Female |
| Management | 416 (43.5%) | 540 (56.5%) |
| Business & Financial | 203 (67.7%) | 97 (32.3%) |
| Computers, Engineering & Science | 284 (74.7%) | 96 (25.3%) |
| Computers & Mathematics | 71 (81.6%) | 16 (18.4%) |
| Architecture & Engineering | 145 (92.4%) | 12 (7.6%) |
| Life, Physical & Social Science | 68 (50.0%) | 68 (50.0%) |
| Community & Social Service | 290 (41.4%) | 410 (58.6%) |
| Education, Arts & Media | 28 (62.2%) | 17 (37.8%) |
| Legal Services & Support | 30 (75.0%) | 10 (25.0%) |
| Education Instruction & Library | 79 (19.4%) | 329 (80.6%) |
| Arts, Media & Entertainment | 153 (73.9%) | 54 (26.1%) |
| Health Diagnosing & Treating | 195 (26.2%) | 550 (73.8%) |
| Health Technologists | 195 (27.4%) | 517 (72.6%) |
| Total (Category) | 1,388 (45.1%) | 1,693 (54.9%) |
| Total (Overall) | 2,945 (47.4%) | 3,263 (52.6%) |
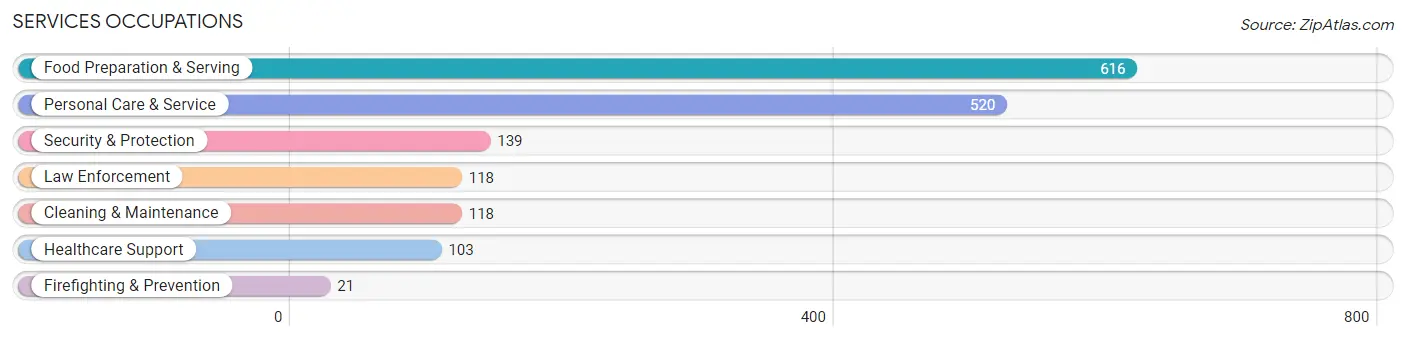
Services Occupations
The most common Services occupations in Southern Pines are Food Preparation & Serving (616 | 9.9%), Personal Care & Service (520 | 8.4%), Security & Protection (139 | 2.2%), Law Enforcement (118 | 1.9%), and Cleaning & Maintenance (118 | 1.9%).
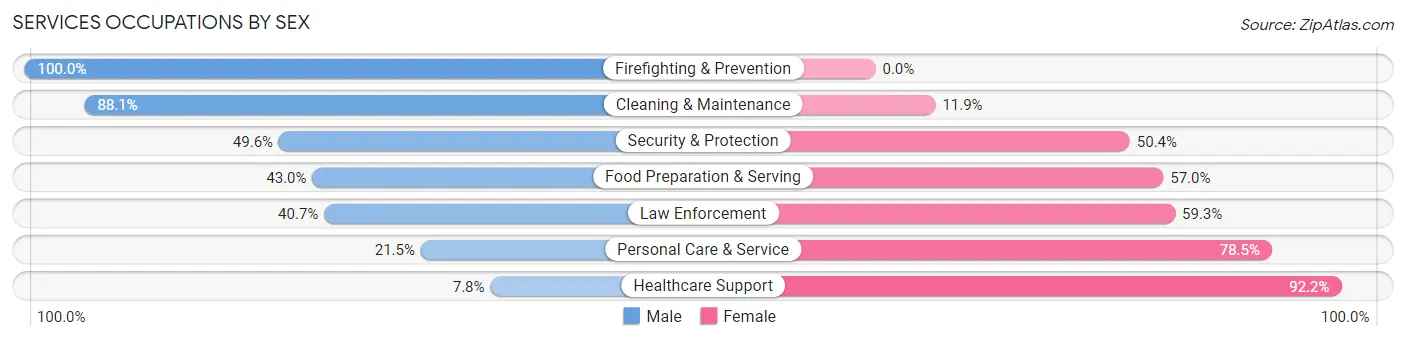
Services Occupations by Sex
Within the Services occupations in Southern Pines, the most male-oriented occupations are Firefighting & Prevention (100.0%), Cleaning & Maintenance (88.1%), and Security & Protection (49.6%), while the most female-oriented occupations are Healthcare Support (92.2%), Personal Care & Service (78.5%), and Law Enforcement (59.3%).
| Occupation | Male | Female |
| Healthcare Support | 8 (7.8%) | 95 (92.2%) |
| Security & Protection | 69 (49.6%) | 70 (50.4%) |
| Firefighting & Prevention | 21 (100.0%) | 0 (0.0%) |
| Law Enforcement | 48 (40.7%) | 70 (59.3%) |
| Food Preparation & Serving | 265 (43.0%) | 351 (57.0%) |
| Cleaning & Maintenance | 104 (88.1%) | 14 (11.9%) |
| Personal Care & Service | 112 (21.5%) | 408 (78.5%) |
| Total (Category) | 558 (37.3%) | 938 (62.7%) |
| Total (Overall) | 2,945 (47.4%) | 3,263 (52.6%) |
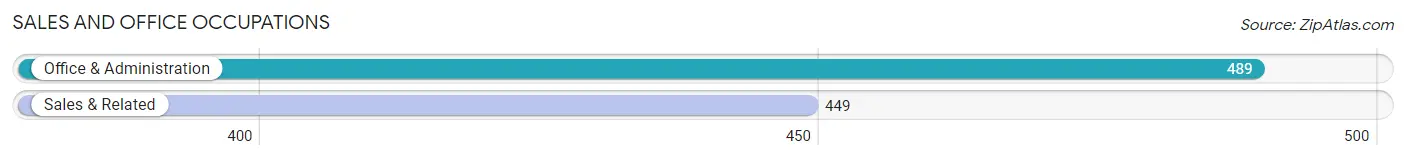
Sales and Office Occupations
The most common Sales and Office occupations in Southern Pines are Office & Administration (489 | 7.9%), and Sales & Related (449 | 7.2%).
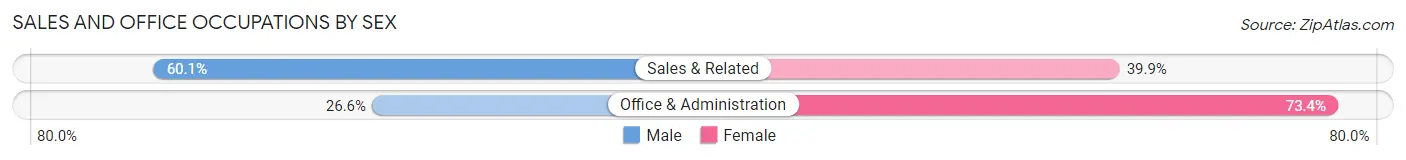
Sales and Office Occupations by Sex
| Occupation | Male | Female |
| Sales & Related | 270 (60.1%) | 179 (39.9%) |
| Office & Administration | 130 (26.6%) | 359 (73.4%) |
| Total (Category) | 400 (42.6%) | 538 (57.4%) |
| Total (Overall) | 2,945 (47.4%) | 3,263 (52.6%) |
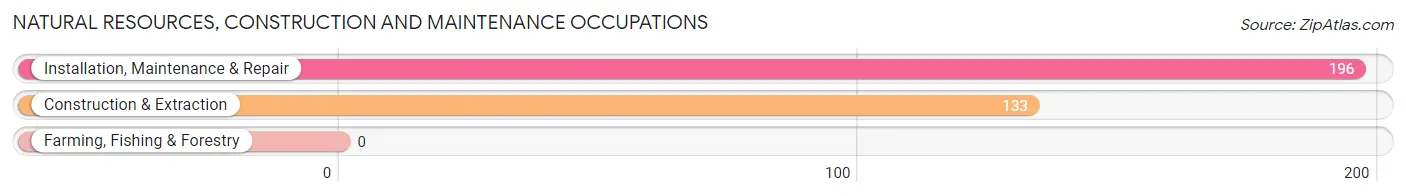
Natural Resources, Construction and Maintenance Occupations
The most common Natural Resources, Construction and Maintenance occupations in Southern Pines are Installation, Maintenance & Repair (196 | 3.2%), and Construction & Extraction (133 | 2.1%).
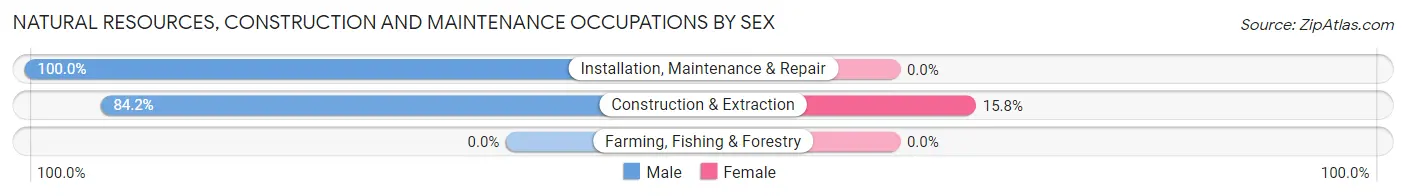
Natural Resources, Construction and Maintenance Occupations by Sex
| Occupation | Male | Female |
| Farming, Fishing & Forestry | 0 (0.0%) | 0 (0.0%) |
| Construction & Extraction | 112 (84.2%) | 21 (15.8%) |
| Installation, Maintenance & Repair | 196 (100.0%) | 0 (0.0%) |
| Total (Category) | 308 (93.6%) | 21 (6.4%) |
| Total (Overall) | 2,945 (47.4%) | 3,263 (52.6%) |
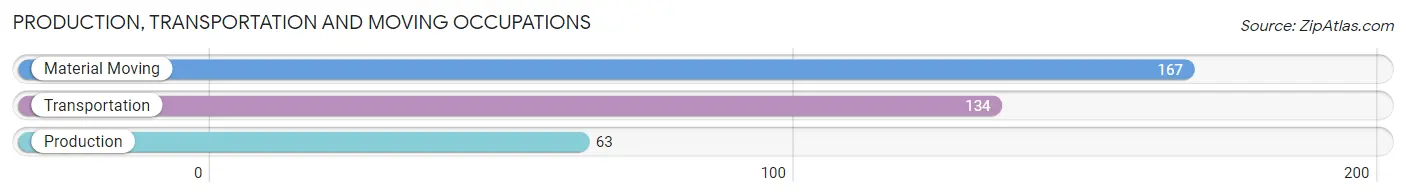
Production, Transportation and Moving Occupations
The most common Production, Transportation and Moving occupations in Southern Pines are Material Moving (167 | 2.7%), Transportation (134 | 2.2%), and Production (63 | 1.0%).
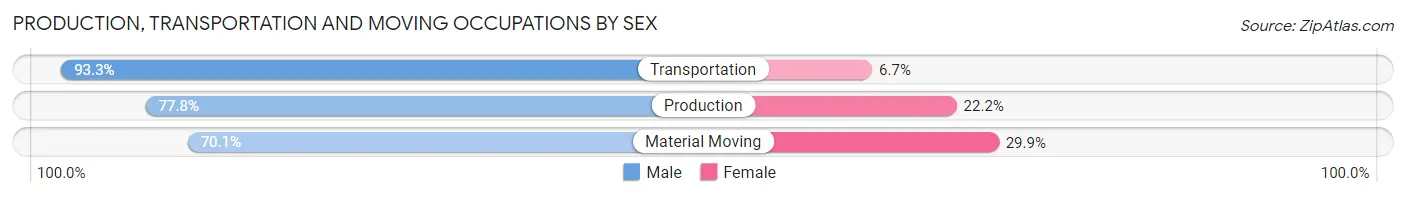
Production, Transportation and Moving Occupations by Sex
| Occupation | Male | Female |
| Production | 49 (77.8%) | 14 (22.2%) |
| Transportation | 125 (93.3%) | 9 (6.7%) |
| Material Moving | 117 (70.1%) | 50 (29.9%) |
| Total (Category) | 291 (79.9%) | 73 (20.1%) |
| Total (Overall) | 2,945 (47.4%) | 3,263 (52.6%) |
Employment Industries by Sex in Southern Pines
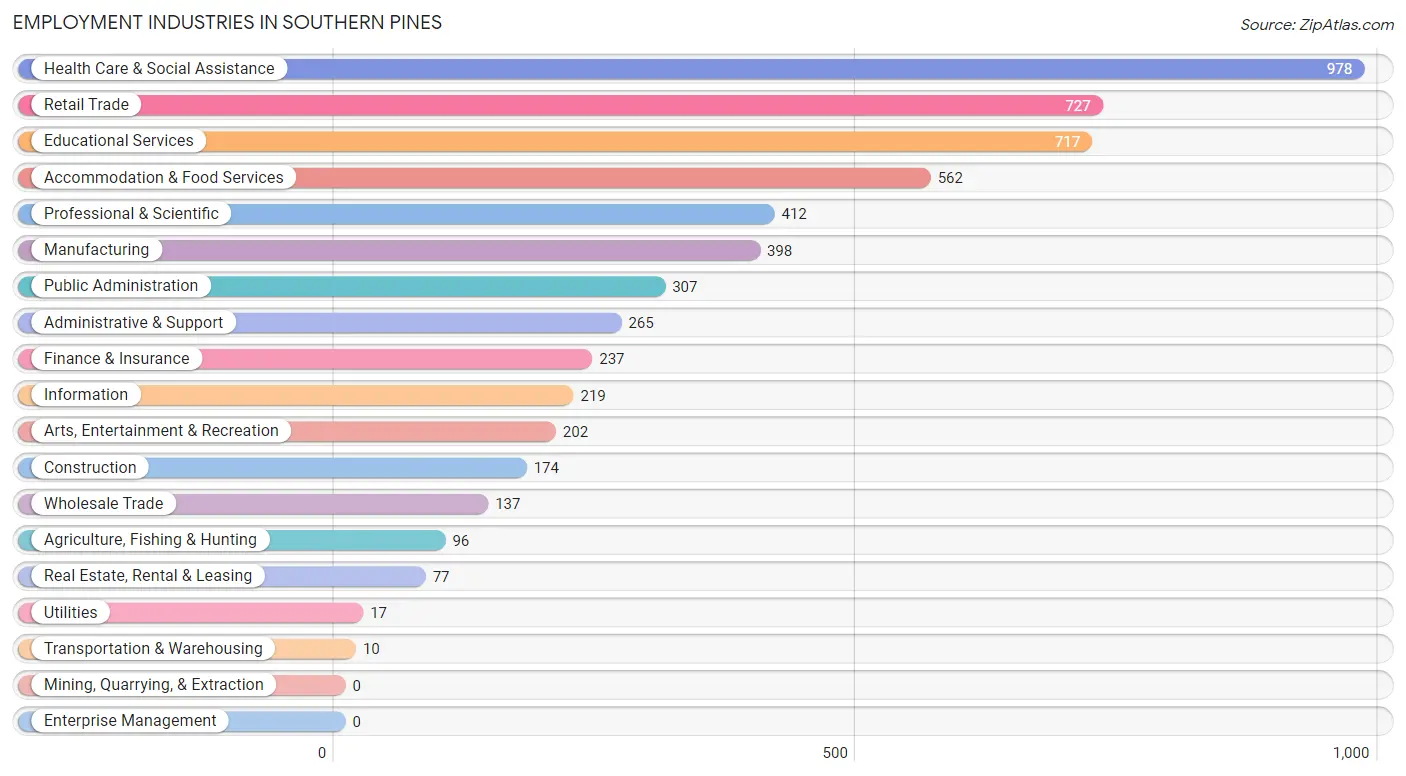
Employment Industries in Southern Pines
The major employment industries in Southern Pines include Health Care & Social Assistance (978 | 15.8%), Retail Trade (727 | 11.7%), Educational Services (717 | 11.6%), Accommodation & Food Services (562 | 9.0%), and Professional & Scientific (412 | 6.6%).
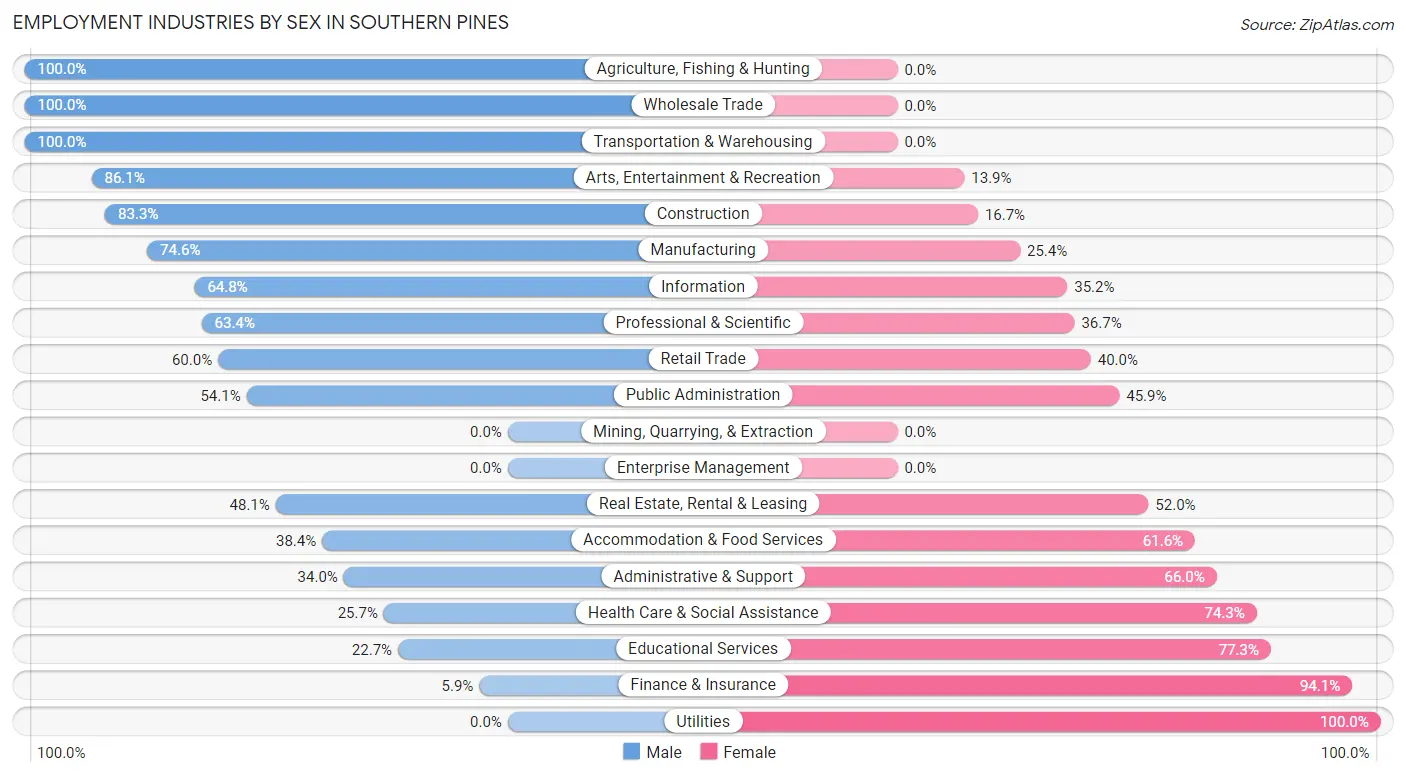
Employment Industries by Sex in Southern Pines
The Southern Pines industries that see more men than women are Agriculture, Fishing & Hunting (100.0%), Wholesale Trade (100.0%), and Transportation & Warehousing (100.0%), whereas the industries that tend to have a higher number of women are Utilities (100.0%), Finance & Insurance (94.1%), and Educational Services (77.3%).
| Industry | Male | Female |
| Agriculture, Fishing & Hunting | 96 (100.0%) | 0 (0.0%) |
| Mining, Quarrying, & Extraction | 0 (0.0%) | 0 (0.0%) |
| Construction | 145 (83.3%) | 29 (16.7%) |
| Manufacturing | 297 (74.6%) | 101 (25.4%) |
| Wholesale Trade | 137 (100.0%) | 0 (0.0%) |
| Retail Trade | 436 (60.0%) | 291 (40.0%) |
| Transportation & Warehousing | 10 (100.0%) | 0 (0.0%) |
| Utilities | 0 (0.0%) | 17 (100.0%) |
| Information | 142 (64.8%) | 77 (35.2%) |
| Finance & Insurance | 14 (5.9%) | 223 (94.1%) |
| Real Estate, Rental & Leasing | 37 (48.0%) | 40 (51.9%) |
| Professional & Scientific | 261 (63.3%) | 151 (36.6%) |
| Enterprise Management | 0 (0.0%) | 0 (0.0%) |
| Administrative & Support | 90 (34.0%) | 175 (66.0%) |
| Educational Services | 163 (22.7%) | 554 (77.3%) |
| Health Care & Social Assistance | 251 (25.7%) | 727 (74.3%) |
| Arts, Entertainment & Recreation | 174 (86.1%) | 28 (13.9%) |
| Accommodation & Food Services | 216 (38.4%) | 346 (61.6%) |
| Public Administration | 166 (54.1%) | 141 (45.9%) |
| Total | 2,945 (47.4%) | 3,263 (52.6%) |
Education in Southern Pines
School Enrollment in Southern Pines
The most common levels of schooling among the 3,145 students in Southern Pines are elementary school (776 | 24.7%), high school (648 | 20.6%), and college / undergraduate (514 | 16.3%).
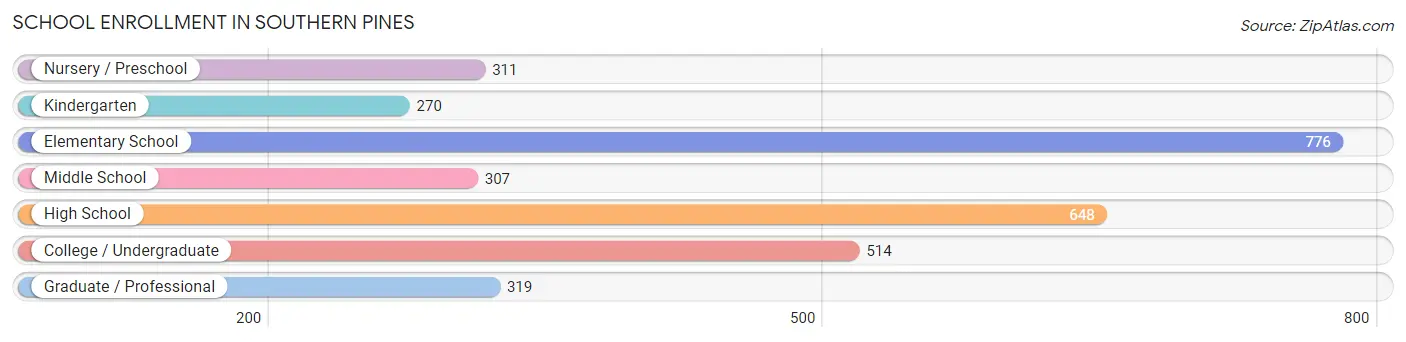
| School Level | # Students | % Students |
| Nursery / Preschool | 311 | 9.9% |
| Kindergarten | 270 | 8.6% |
| Elementary School | 776 | 24.7% |
| Middle School | 307 | 9.8% |
| High School | 648 | 20.6% |
| College / Undergraduate | 514 | 16.3% |
| Graduate / Professional | 319 | 10.1% |
| Total | 3,145 | 100.0% |
School Enrollment by Age by Funding Source in Southern Pines
Out of a total of 3,145 students who are enrolled in schools in Southern Pines, 1,104 (35.1%) attend a private institution, while the remaining 2,041 (64.9%) are enrolled in public schools. The age group of 35 years and over has the highest likelihood of being enrolled in private schools, with 156 (53.1% in the age bracket) enrolled. Conversely, the age group of 25 to 34 year olds has the lowest likelihood of being enrolled in a private school, with 351 (95.1% in the age bracket) attending a public institution.
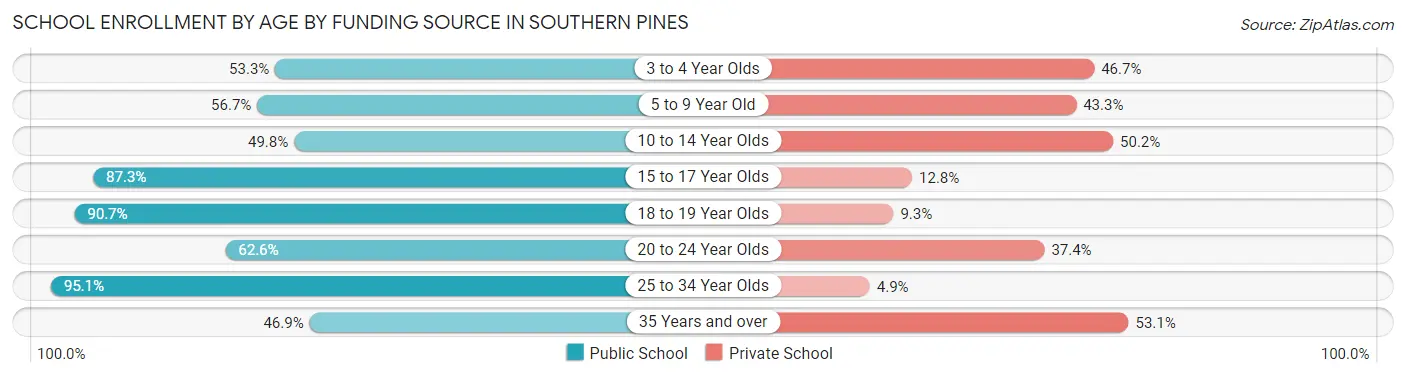
| Age Bracket | Public School | Private School |
| 3 to 4 Year Olds | 144 (53.3%) | 126 (46.7%) |
| 5 to 9 Year Old | 560 (56.7%) | 428 (43.3%) |
| 10 to 14 Year Olds | 263 (49.8%) | 265 (50.2%) |
| 15 to 17 Year Olds | 267 (87.3%) | 39 (12.8%) |
| 18 to 19 Year Olds | 235 (90.7%) | 24 (9.3%) |
| 20 to 24 Year Olds | 82 (62.6%) | 49 (37.4%) |
| 25 to 34 Year Olds | 351 (95.1%) | 18 (4.9%) |
| 35 Years and over | 138 (46.9%) | 156 (53.1%) |
| Total | 2,041 (64.9%) | 1,104 (35.1%) |
Educational Attainment by Field of Study in Southern Pines
Business (981 | 14.8%), social sciences (731 | 11.0%), education (648 | 9.8%), arts & humanities (622 | 9.4%), and bio, nature & agricultural (518 | 7.8%) are the most common fields of study among 6,621 individuals in Southern Pines who have obtained a bachelor's degree or higher.
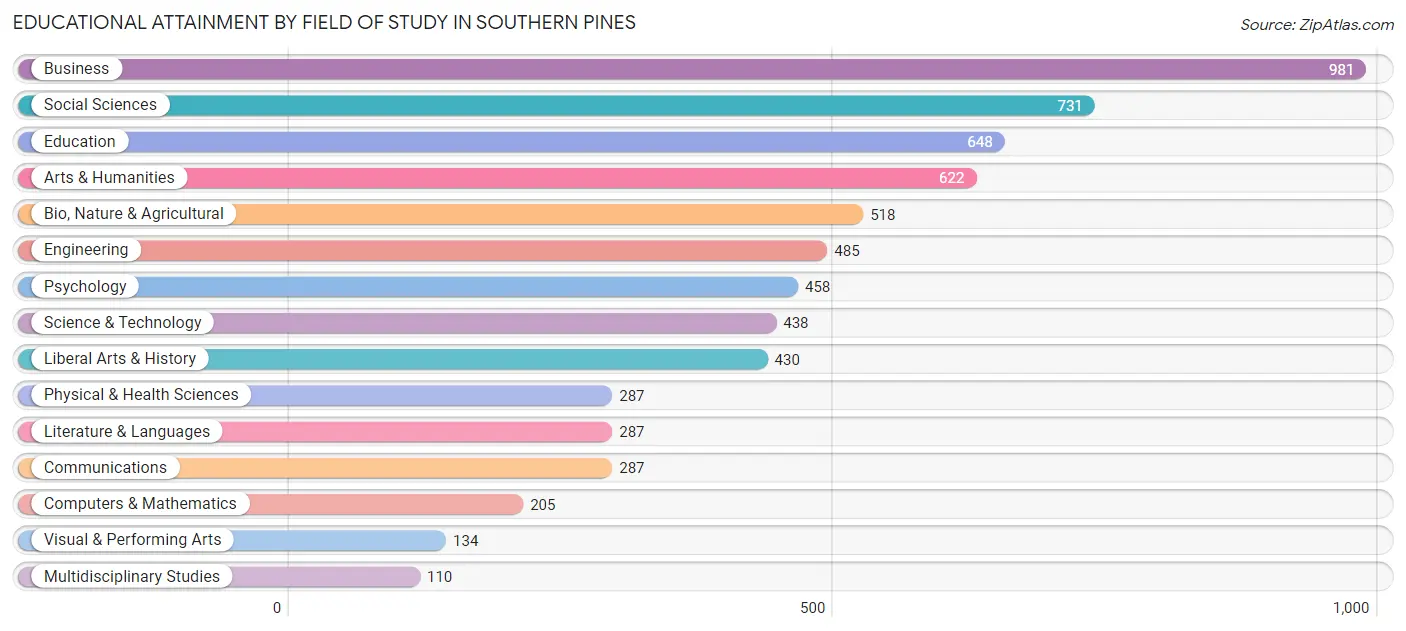
| Field of Study | # Graduates | % Graduates |
| Computers & Mathematics | 205 | 3.1% |
| Bio, Nature & Agricultural | 518 | 7.8% |
| Physical & Health Sciences | 287 | 4.3% |
| Psychology | 458 | 6.9% |
| Social Sciences | 731 | 11.0% |
| Engineering | 485 | 7.3% |
| Multidisciplinary Studies | 110 | 1.7% |
| Science & Technology | 438 | 6.6% |
| Business | 981 | 14.8% |
| Education | 648 | 9.8% |
| Literature & Languages | 287 | 4.3% |
| Liberal Arts & History | 430 | 6.5% |
| Visual & Performing Arts | 134 | 2.0% |
| Communications | 287 | 4.3% |
| Arts & Humanities | 622 | 9.4% |
| Total | 6,621 | 100.0% |
Transportation & Commute in Southern Pines
Vehicle Availability by Sex in Southern Pines
The most prevalent vehicle ownership categories in Southern Pines are males with 2 vehicles (1,894, accounting for 51.9%) and females with 2 vehicles (1,707, making up 56.6%).
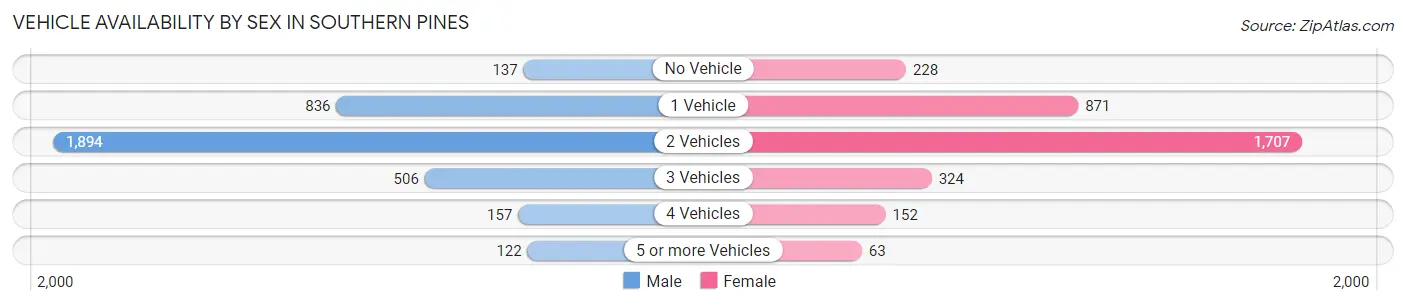
| Vehicles Available | Male | Female |
| No Vehicle | 137 (3.7%) | 228 (6.8%) |
| 1 Vehicle | 836 (22.9%) | 871 (26.0%) |
| 2 Vehicles | 1,894 (51.9%) | 1,707 (51.0%) |
| 3 Vehicles | 506 (13.9%) | 324 (9.7%) |
| 4 Vehicles | 157 (4.3%) | 152 (4.5%) |
| 5 or more Vehicles | 122 (3.3%) | 63 (1.9%) |
| Total | 3,652 (100.0%) | 3,345 (100.0%) |
Commute Time in Southern Pines
The most frequently occuring commute durations in Southern Pines are 10 to 14 minutes (1,326 commuters, 21.7%), 45 to 59 minutes (1,024 commuters, 16.8%), and 15 to 19 minutes (983 commuters, 16.1%).
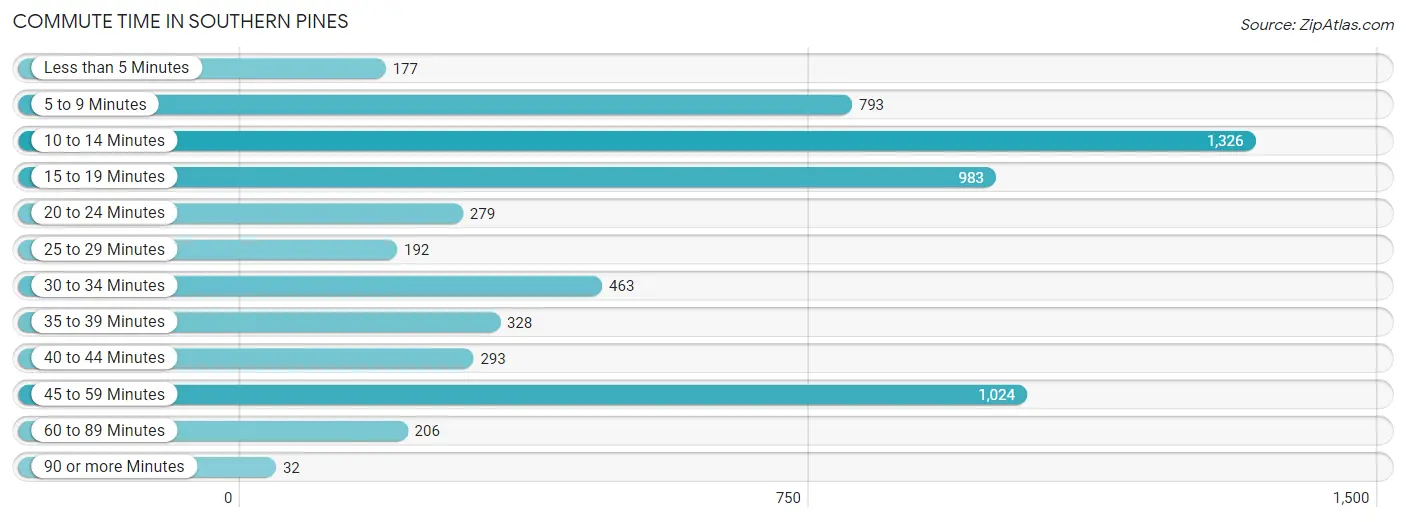
| Commute Time | # Commuters | % Commuters |
| Less than 5 Minutes | 177 | 2.9% |
| 5 to 9 Minutes | 793 | 13.0% |
| 10 to 14 Minutes | 1,326 | 21.7% |
| 15 to 19 Minutes | 983 | 16.1% |
| 20 to 24 Minutes | 279 | 4.6% |
| 25 to 29 Minutes | 192 | 3.2% |
| 30 to 34 Minutes | 463 | 7.6% |
| 35 to 39 Minutes | 328 | 5.4% |
| 40 to 44 Minutes | 293 | 4.8% |
| 45 to 59 Minutes | 1,024 | 16.8% |
| 60 to 89 Minutes | 206 | 3.4% |
| 90 or more Minutes | 32 | 0.5% |
Commute Time by Sex in Southern Pines
The most common commute times in Southern Pines are 45 to 59 minutes (669 commuters, 20.5%) for males and 10 to 14 minutes (720 commuters, 25.4%) for females.
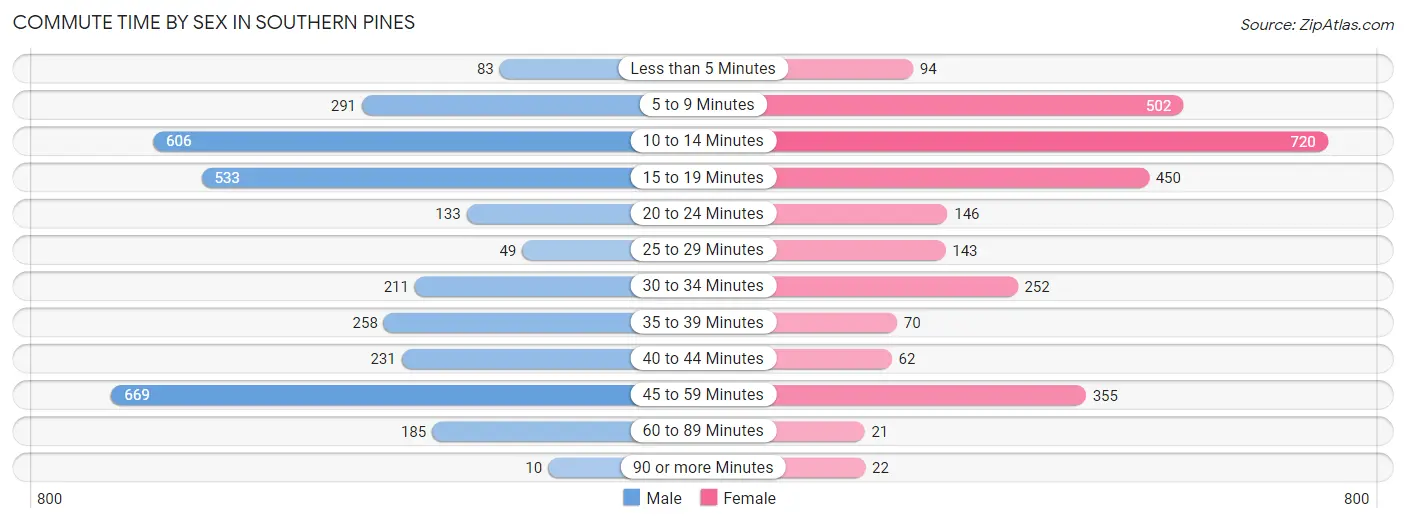
| Commute Time | Male | Female |
| Less than 5 Minutes | 83 (2.5%) | 94 (3.3%) |
| 5 to 9 Minutes | 291 (8.9%) | 502 (17.7%) |
| 10 to 14 Minutes | 606 (18.6%) | 720 (25.4%) |
| 15 to 19 Minutes | 533 (16.4%) | 450 (15.9%) |
| 20 to 24 Minutes | 133 (4.1%) | 146 (5.1%) |
| 25 to 29 Minutes | 49 (1.5%) | 143 (5.0%) |
| 30 to 34 Minutes | 211 (6.5%) | 252 (8.9%) |
| 35 to 39 Minutes | 258 (7.9%) | 70 (2.5%) |
| 40 to 44 Minutes | 231 (7.1%) | 62 (2.2%) |
| 45 to 59 Minutes | 669 (20.5%) | 355 (12.5%) |
| 60 to 89 Minutes | 185 (5.7%) | 21 (0.7%) |
| 90 or more Minutes | 10 (0.3%) | 22 (0.8%) |
Time of Departure to Work by Sex in Southern Pines
The most frequent times of departure to work in Southern Pines are 7:00 AM to 7:29 AM (634, 19.5%) for males and 7:30 AM to 7:59 AM (573, 20.2%) for females.
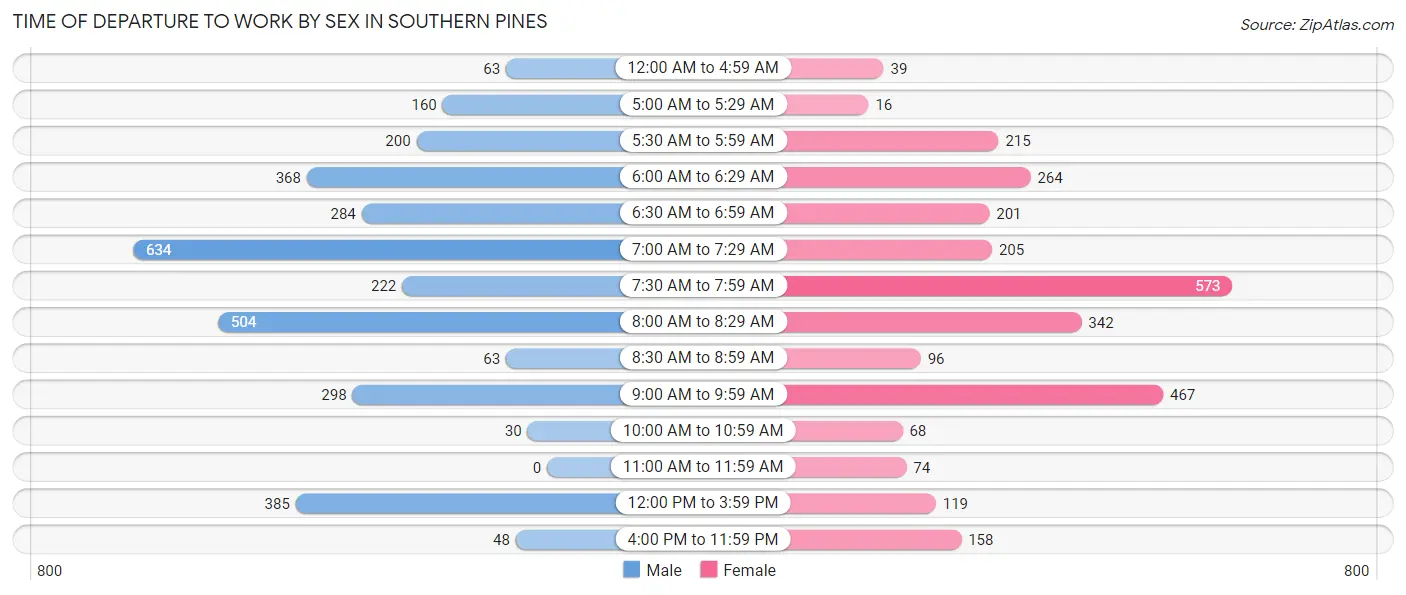
| Time of Departure | Male | Female |
| 12:00 AM to 4:59 AM | 63 (1.9%) | 39 (1.4%) |
| 5:00 AM to 5:29 AM | 160 (4.9%) | 16 (0.6%) |
| 5:30 AM to 5:59 AM | 200 (6.1%) | 215 (7.6%) |
| 6:00 AM to 6:29 AM | 368 (11.3%) | 264 (9.3%) |
| 6:30 AM to 6:59 AM | 284 (8.7%) | 201 (7.1%) |
| 7:00 AM to 7:29 AM | 634 (19.5%) | 205 (7.2%) |
| 7:30 AM to 7:59 AM | 222 (6.8%) | 573 (20.2%) |
| 8:00 AM to 8:29 AM | 504 (15.5%) | 342 (12.0%) |
| 8:30 AM to 8:59 AM | 63 (1.9%) | 96 (3.4%) |
| 9:00 AM to 9:59 AM | 298 (9.1%) | 467 (16.5%) |
| 10:00 AM to 10:59 AM | 30 (0.9%) | 68 (2.4%) |
| 11:00 AM to 11:59 AM | 0 (0.0%) | 74 (2.6%) |
| 12:00 PM to 3:59 PM | 385 (11.8%) | 119 (4.2%) |
| 4:00 PM to 11:59 PM | 48 (1.5%) | 158 (5.6%) |
| Total | 3,259 (100.0%) | 2,837 (100.0%) |
Housing Occupancy in Southern Pines
Occupancy by Ownership in Southern Pines
Of the total 7,080 dwellings in Southern Pines, owner-occupied units account for 4,274 (60.4%), while renter-occupied units make up 2,806 (39.6%).
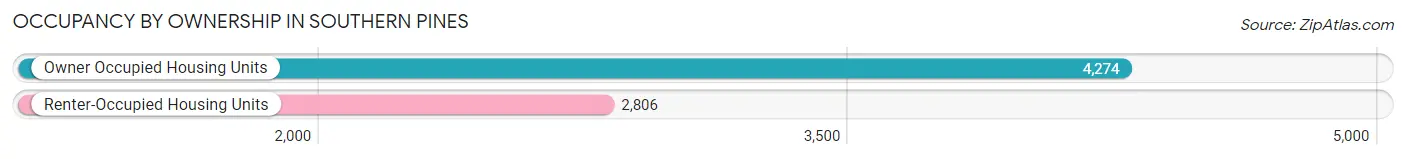
| Occupancy | # Housing Units | % Housing Units |
| Owner Occupied Housing Units | 4,274 | 60.4% |
| Renter-Occupied Housing Units | 2,806 | 39.6% |
| Total Occupied Housing Units | 7,080 | 100.0% |
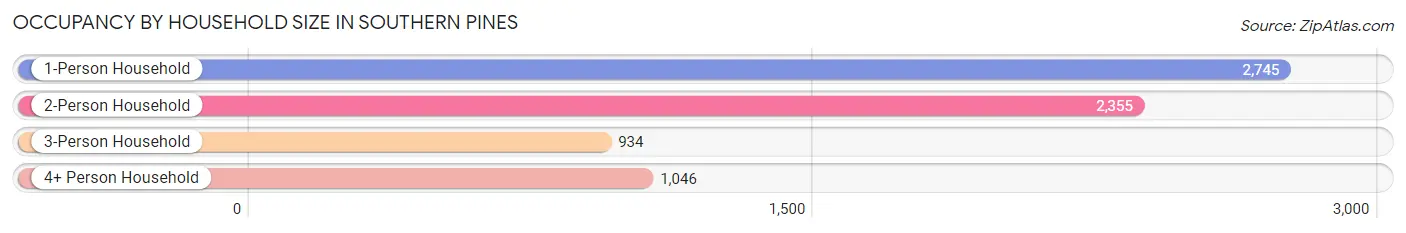
Occupancy by Household Size in Southern Pines
| Household Size | # Housing Units | % Housing Units |
| 1-Person Household | 2,745 | 38.8% |
| 2-Person Household | 2,355 | 33.3% |
| 3-Person Household | 934 | 13.2% |
| 4+ Person Household | 1,046 | 14.8% |
| Total Housing Units | 7,080 | 100.0% |
Occupancy by Ownership by Household Size in Southern Pines
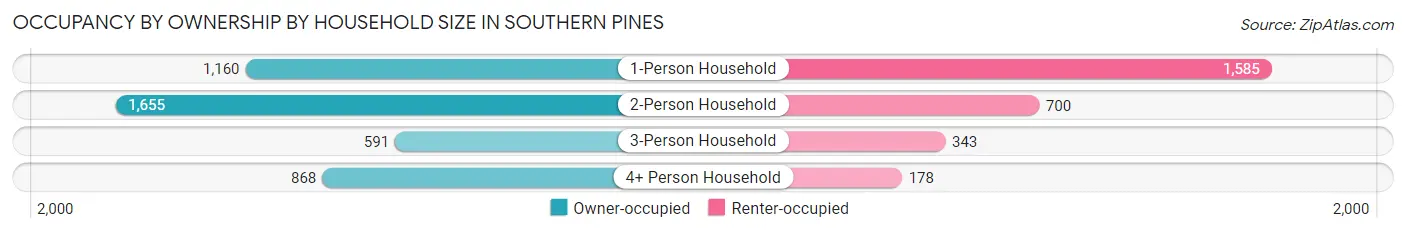
| Household Size | Owner-occupied | Renter-occupied |
| 1-Person Household | 1,160 (42.3%) | 1,585 (57.7%) |
| 2-Person Household | 1,655 (70.3%) | 700 (29.7%) |
| 3-Person Household | 591 (63.3%) | 343 (36.7%) |
| 4+ Person Household | 868 (83.0%) | 178 (17.0%) |
| Total Housing Units | 4,274 (60.4%) | 2,806 (39.6%) |
Occupancy by Educational Attainment in Southern Pines
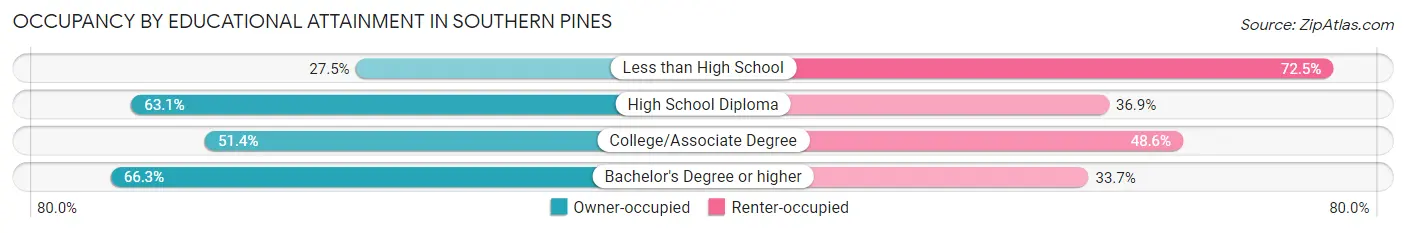
| Household Size | Owner-occupied | Renter-occupied |
| Less than High School | 98 (27.5%) | 258 (72.5%) |
| High School Diploma | 688 (63.1%) | 403 (36.9%) |
| College/Associate Degree | 850 (51.4%) | 805 (48.6%) |
| Bachelor's Degree or higher | 2,638 (66.3%) | 1,340 (33.7%) |
Occupancy by Age of Householder in Southern Pines
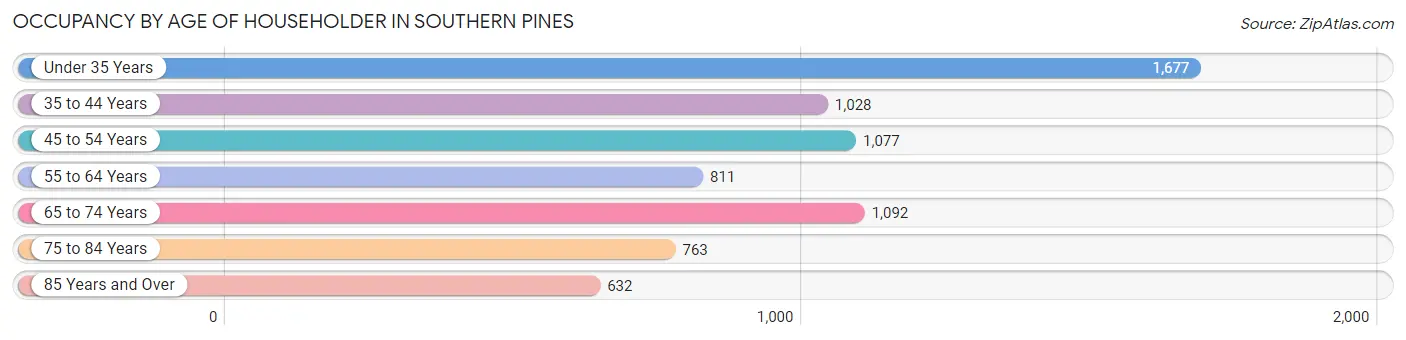
| Age Bracket | # Households | % Households |
| Under 35 Years | 1,677 | 23.7% |
| 35 to 44 Years | 1,028 | 14.5% |
| 45 to 54 Years | 1,077 | 15.2% |
| 55 to 64 Years | 811 | 11.5% |
| 65 to 74 Years | 1,092 | 15.4% |
| 75 to 84 Years | 763 | 10.8% |
| 85 Years and Over | 632 | 8.9% |
| Total | 7,080 | 100.0% |
Housing Finances in Southern Pines
Median Income by Occupancy in Southern Pines
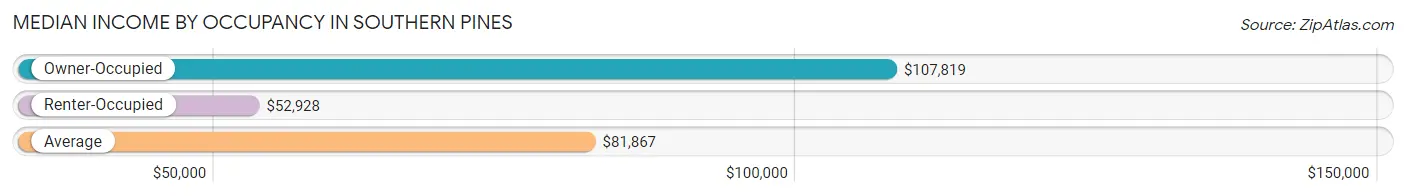
| Occupancy Type | # Households | Median Income |
| Owner-Occupied | 4,274 (60.4%) | $107,819 |
| Renter-Occupied | 2,806 (39.6%) | $52,928 |
| Average | 7,080 (100.0%) | $81,867 |
Occupancy by Householder Income Bracket in Southern Pines
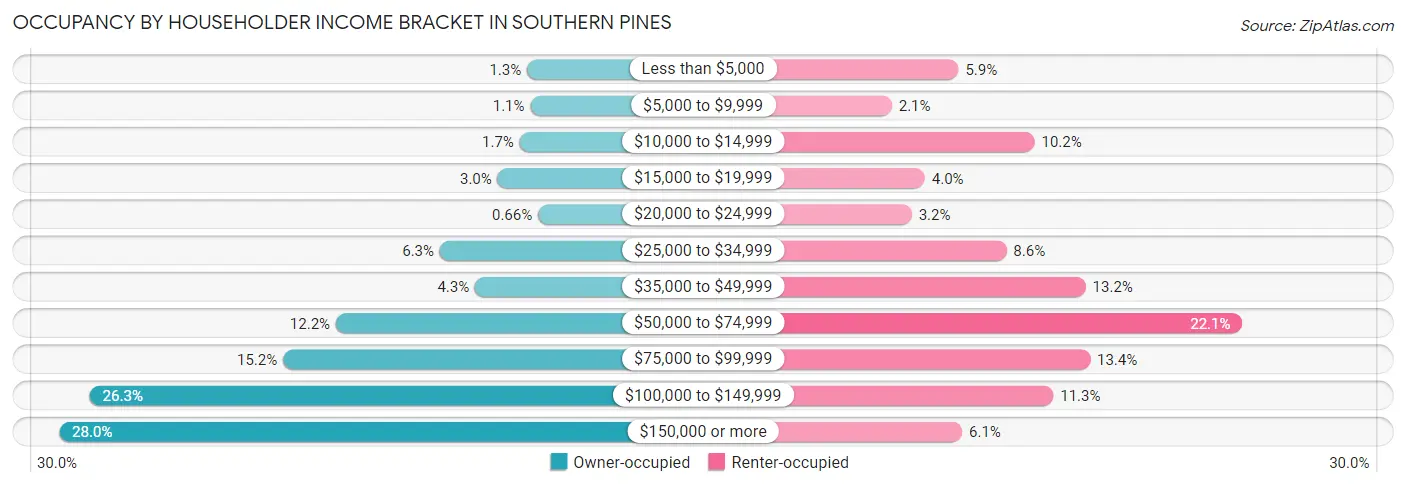
| Income Bracket | Owner-occupied | Renter-occupied |
| Less than $5,000 | 55 (1.3%) | 165 (5.9%) |
| $5,000 to $9,999 | 47 (1.1%) | 58 (2.1%) |
| $10,000 to $14,999 | 73 (1.7%) | 287 (10.2%) |
| $15,000 to $19,999 | 127 (3.0%) | 111 (4.0%) |
| $20,000 to $24,999 | 28 (0.7%) | 90 (3.2%) |
| $25,000 to $34,999 | 268 (6.3%) | 242 (8.6%) |
| $35,000 to $49,999 | 182 (4.3%) | 369 (13.2%) |
| $50,000 to $74,999 | 522 (12.2%) | 620 (22.1%) |
| $75,000 to $99,999 | 651 (15.2%) | 376 (13.4%) |
| $100,000 to $149,999 | 1,123 (26.3%) | 317 (11.3%) |
| $150,000 or more | 1,198 (28.0%) | 171 (6.1%) |
| Total | 4,274 (100.0%) | 2,806 (100.0%) |
Monthly Housing Cost Tiers in Southern Pines
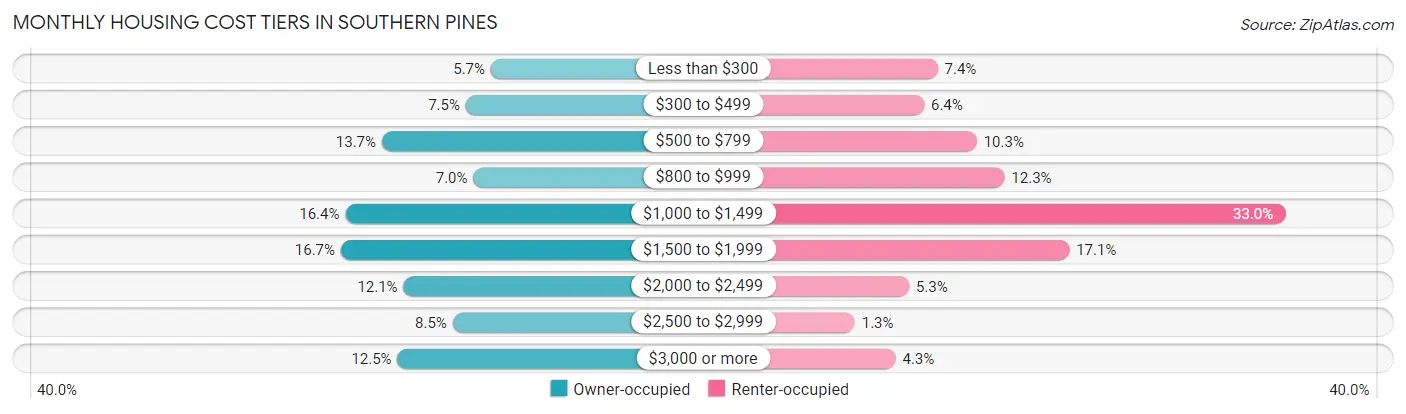
| Monthly Cost | Owner-occupied | Renter-occupied |
| Less than $300 | 242 (5.7%) | 207 (7.4%) |
| $300 to $499 | 321 (7.5%) | 179 (6.4%) |
| $500 to $799 | 585 (13.7%) | 288 (10.3%) |
| $800 to $999 | 297 (7.0%) | 345 (12.3%) |
| $1,000 to $1,499 | 700 (16.4%) | 925 (33.0%) |
| $1,500 to $1,999 | 714 (16.7%) | 479 (17.1%) |
| $2,000 to $2,499 | 517 (12.1%) | 148 (5.3%) |
| $2,500 to $2,999 | 362 (8.5%) | 36 (1.3%) |
| $3,000 or more | 536 (12.5%) | 120 (4.3%) |
| Total | 4,274 (100.0%) | 2,806 (100.0%) |
Physical Housing Characteristics in Southern Pines
Housing Structures in Southern Pines
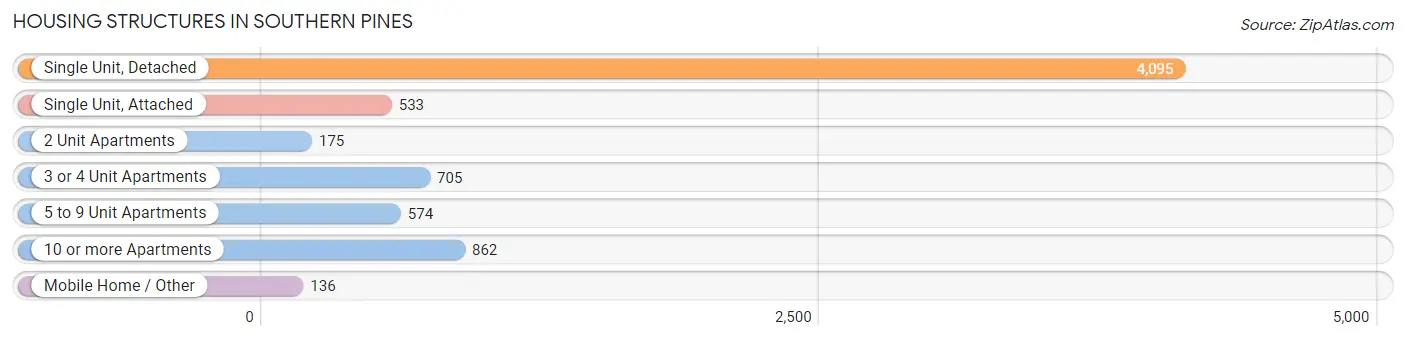
| Structure Type | # Housing Units | % Housing Units |
| Single Unit, Detached | 4,095 | 57.8% |
| Single Unit, Attached | 533 | 7.5% |
| 2 Unit Apartments | 175 | 2.5% |
| 3 or 4 Unit Apartments | 705 | 10.0% |
| 5 to 9 Unit Apartments | 574 | 8.1% |
| 10 or more Apartments | 862 | 12.2% |
| Mobile Home / Other | 136 | 1.9% |
| Total | 7,080 | 100.0% |
Housing Structures by Occupancy in Southern Pines
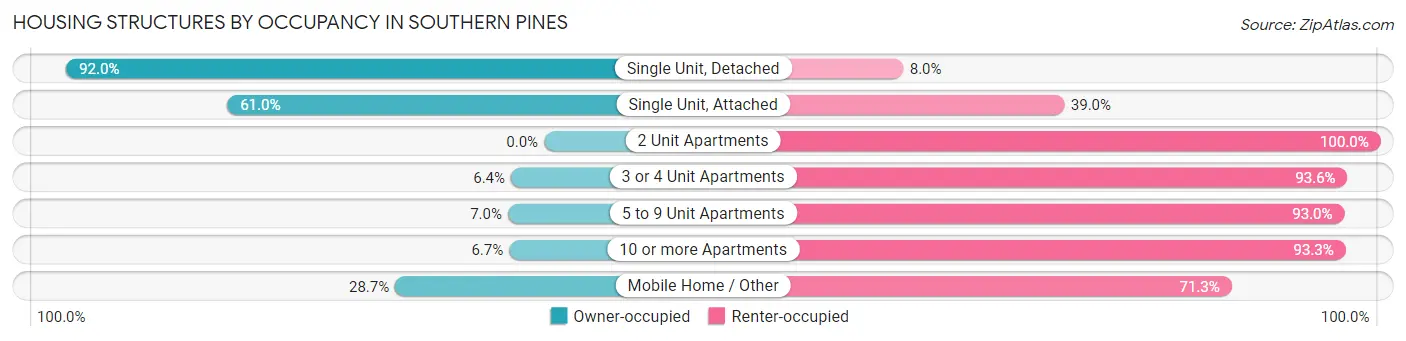
| Structure Type | Owner-occupied | Renter-occupied |
| Single Unit, Detached | 3,767 (92.0%) | 328 (8.0%) |
| Single Unit, Attached | 325 (61.0%) | 208 (39.0%) |
| 2 Unit Apartments | 0 (0.0%) | 175 (100.0%) |
| 3 or 4 Unit Apartments | 45 (6.4%) | 660 (93.6%) |
| 5 to 9 Unit Apartments | 40 (7.0%) | 534 (93.0%) |
| 10 or more Apartments | 58 (6.7%) | 804 (93.3%) |
| Mobile Home / Other | 39 (28.7%) | 97 (71.3%) |
| Total | 4,274 (60.4%) | 2,806 (39.6%) |
Housing Structures by Number of Rooms in Southern Pines
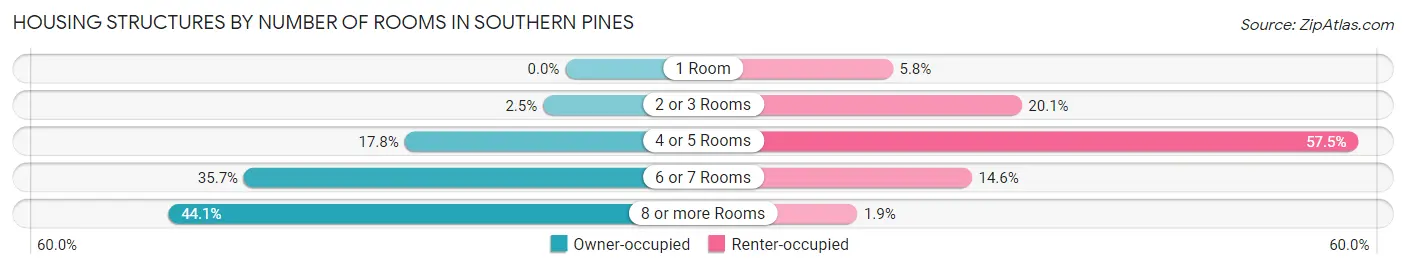
| Number of Rooms | Owner-occupied | Renter-occupied |
| 1 Room | 0 (0.0%) | 164 (5.8%) |
| 2 or 3 Rooms | 105 (2.5%) | 565 (20.1%) |
| 4 or 5 Rooms | 762 (17.8%) | 1,614 (57.5%) |
| 6 or 7 Rooms | 1,524 (35.7%) | 410 (14.6%) |
| 8 or more Rooms | 1,883 (44.1%) | 53 (1.9%) |
| Total | 4,274 (100.0%) | 2,806 (100.0%) |
Housing Structure by Heating Type in Southern Pines
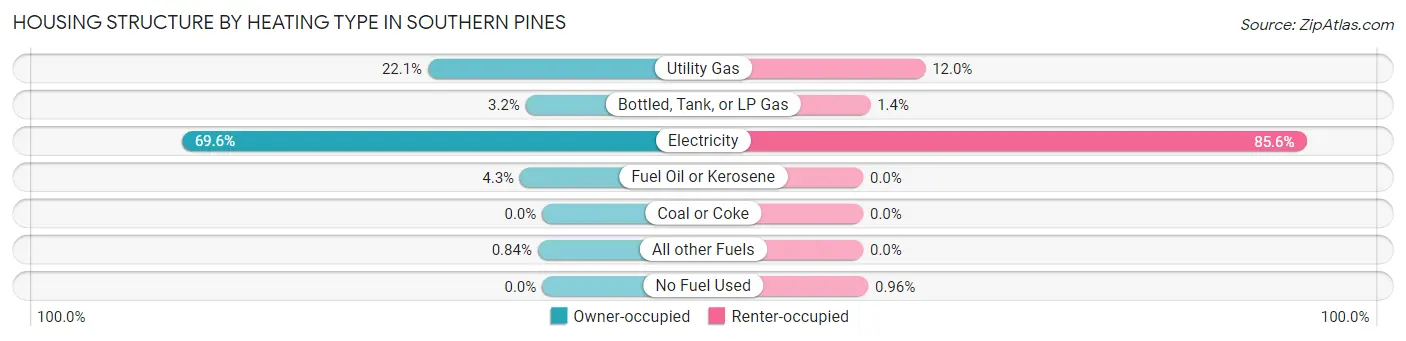
| Heating Type | Owner-occupied | Renter-occupied |
| Utility Gas | 943 (22.1%) | 337 (12.0%) |
| Bottled, Tank, or LP Gas | 136 (3.2%) | 39 (1.4%) |
| Electricity | 2,976 (69.6%) | 2,403 (85.6%) |
| Fuel Oil or Kerosene | 183 (4.3%) | 0 (0.0%) |
| Coal or Coke | 0 (0.0%) | 0 (0.0%) |
| All other Fuels | 36 (0.8%) | 0 (0.0%) |
| No Fuel Used | 0 (0.0%) | 27 (1.0%) |
| Total | 4,274 (100.0%) | 2,806 (100.0%) |
Household Vehicle Usage in Southern Pines
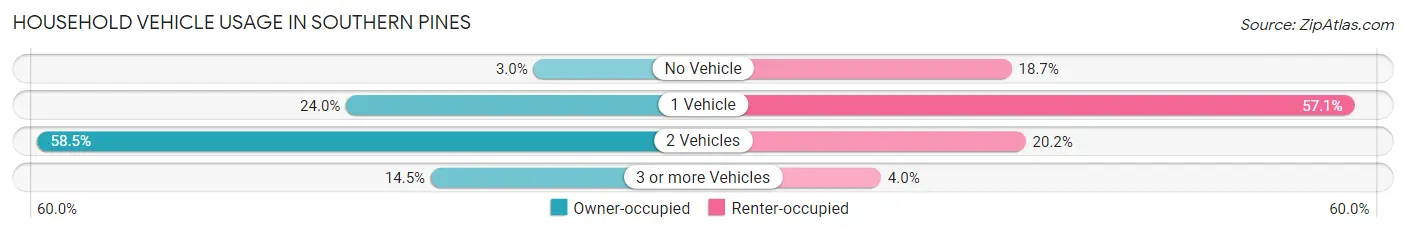
| Vehicles per Household | Owner-occupied | Renter-occupied |
| No Vehicle | 128 (3.0%) | 524 (18.7%) |
| 1 Vehicle | 1,025 (24.0%) | 1,601 (57.1%) |
| 2 Vehicles | 2,502 (58.5%) | 568 (20.2%) |
| 3 or more Vehicles | 619 (14.5%) | 113 (4.0%) |
| Total | 4,274 (100.0%) | 2,806 (100.0%) |
Real Estate & Mortgages in Southern Pines
Real Estate and Mortgage Overview in Southern Pines
| Characteristic | Without Mortgage | With Mortgage |
| Housing Units | 1,602 | 2,672 |
| Median Property Value | $355,500 | $383,800 |
| Median Household Income | $96,818 | $860 |
| Monthly Housing Costs | $626 | $523 |
| Real Estate Taxes | $2,614 | $6 |
Property Value by Mortgage Status in Southern Pines
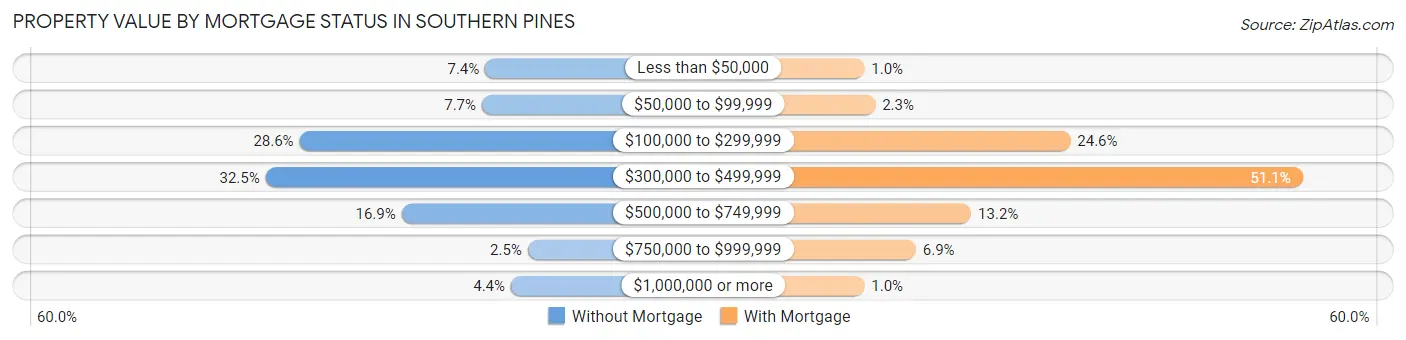
| Property Value | Without Mortgage | With Mortgage |
| Less than $50,000 | 118 (7.4%) | 27 (1.0%) |
| $50,000 to $99,999 | 124 (7.7%) | 60 (2.2%) |
| $100,000 to $299,999 | 458 (28.6%) | 656 (24.5%) |
| $300,000 to $499,999 | 520 (32.5%) | 1,365 (51.1%) |
| $500,000 to $749,999 | 271 (16.9%) | 353 (13.2%) |
| $750,000 to $999,999 | 40 (2.5%) | 184 (6.9%) |
| $1,000,000 or more | 71 (4.4%) | 27 (1.0%) |
| Total | 1,602 (100.0%) | 2,672 (100.0%) |
Household Income by Mortgage Status in Southern Pines
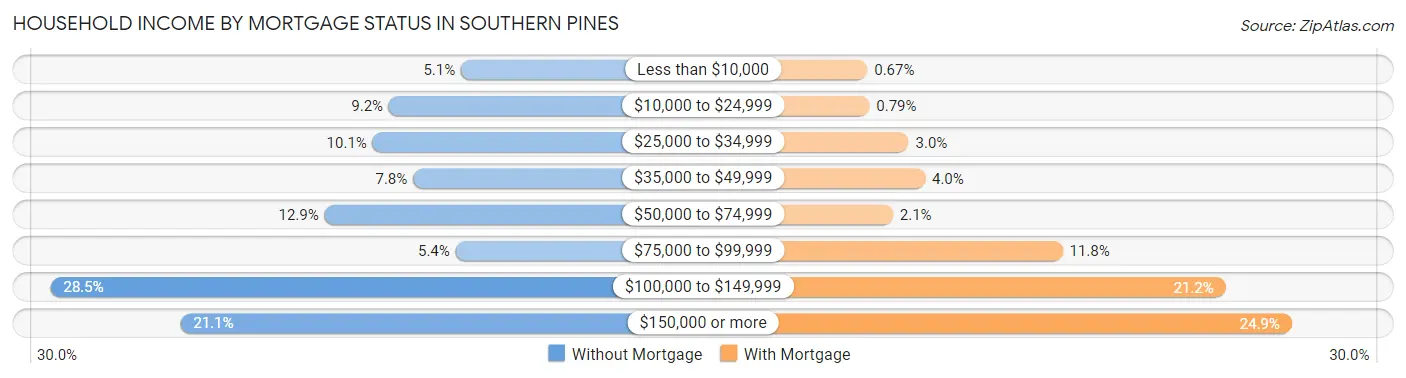
| Household Income | Without Mortgage | With Mortgage |
| Less than $10,000 | 81 (5.1%) | 18 (0.7%) |
| $10,000 to $24,999 | 147 (9.2%) | 21 (0.8%) |
| $25,000 to $34,999 | 162 (10.1%) | 81 (3.0%) |
| $35,000 to $49,999 | 125 (7.8%) | 106 (4.0%) |
| $50,000 to $74,999 | 206 (12.9%) | 57 (2.1%) |
| $75,000 to $99,999 | 86 (5.4%) | 316 (11.8%) |
| $100,000 to $149,999 | 457 (28.5%) | 565 (21.1%) |
| $150,000 or more | 338 (21.1%) | 666 (24.9%) |
| Total | 1,602 (100.0%) | 2,672 (100.0%) |
Property Value to Household Income Ratio in Southern Pines
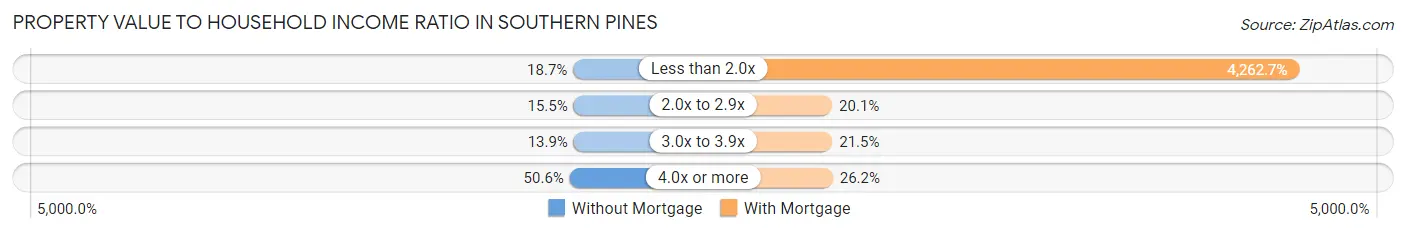
| Value-to-Income Ratio | Without Mortgage | With Mortgage |
| Less than 2.0x | 300 (18.7%) | 113,900 (4,262.7%) |
| 2.0x to 2.9x | 248 (15.5%) | 536 (20.1%) |
| 3.0x to 3.9x | 223 (13.9%) | 574 (21.5%) |
| 4.0x or more | 811 (50.6%) | 699 (26.2%) |
| Total | 1,602 (100.0%) | 2,672 (100.0%) |
Real Estate Taxes by Mortgage Status in Southern Pines
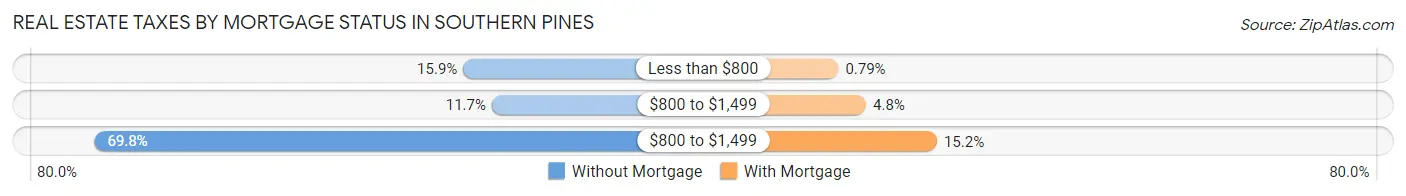
| Property Taxes | Without Mortgage | With Mortgage |
| Less than $800 | 255 (15.9%) | 21 (0.8%) |
| $800 to $1,499 | 188 (11.7%) | 129 (4.8%) |
| $800 to $1,499 | 1,118 (69.8%) | 406 (15.2%) |
| Total | 1,602 (100.0%) | 2,672 (100.0%) |
Health & Disability in Southern Pines
Health Insurance Coverage by Age in Southern Pines
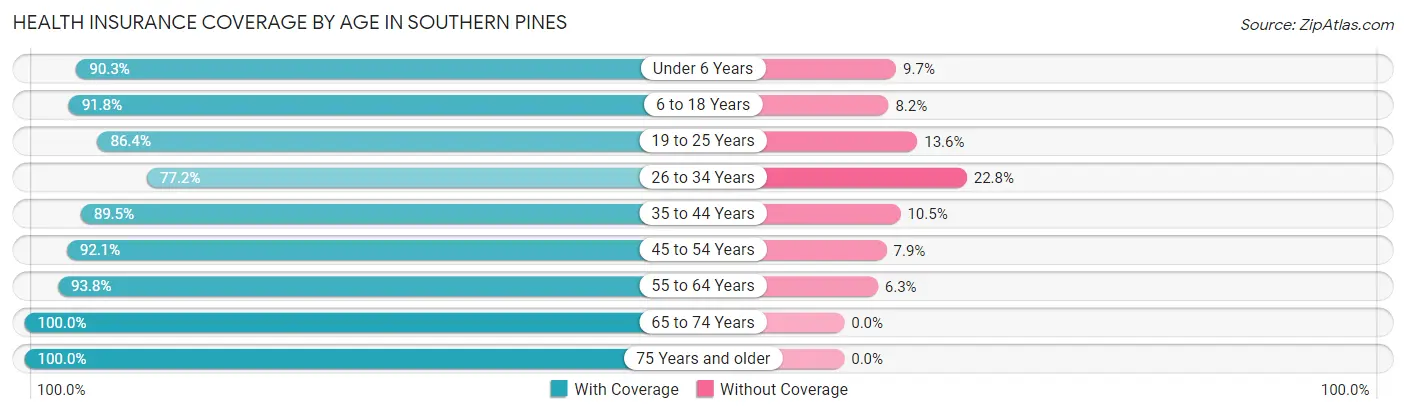
| Age Bracket | With Coverage | Without Coverage |
| Under 6 Years | 1,224 (90.3%) | 131 (9.7%) |
| 6 to 18 Years | 1,714 (91.8%) | 154 (8.2%) |
| 19 to 25 Years | 1,028 (86.4%) | 162 (13.6%) |
| 26 to 34 Years | 1,449 (77.2%) | 429 (22.8%) |
| 35 to 44 Years | 1,315 (89.5%) | 154 (10.5%) |
| 45 to 54 Years | 1,494 (92.1%) | 128 (7.9%) |
| 55 to 64 Years | 1,186 (93.8%) | 79 (6.2%) |
| 65 to 74 Years | 1,680 (100.0%) | 0 (0.0%) |
| 75 Years and older | 1,928 (100.0%) | 0 (0.0%) |
| Total | 13,018 (91.3%) | 1,237 (8.7%) |
Health Insurance Coverage by Citizenship Status in Southern Pines
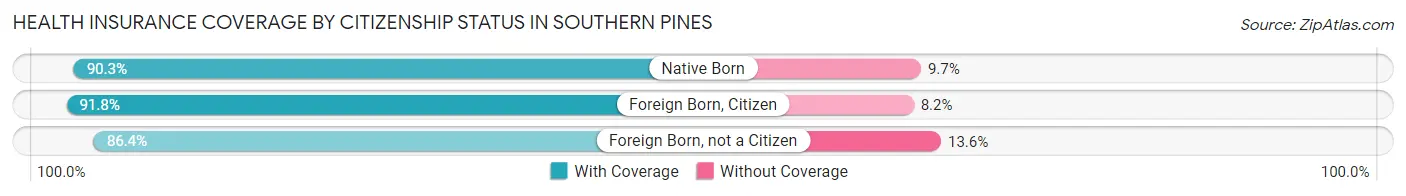
| Citizenship Status | With Coverage | Without Coverage |
| Native Born | 1,224 (90.3%) | 131 (9.7%) |
| Foreign Born, Citizen | 1,714 (91.8%) | 154 (8.2%) |
| Foreign Born, not a Citizen | 1,028 (86.4%) | 162 (13.6%) |
Health Insurance Coverage by Household Income in Southern Pines
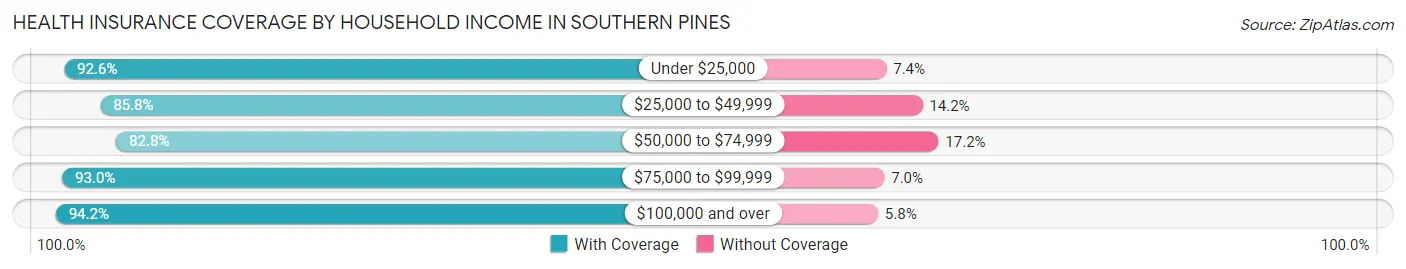
| Household Income | With Coverage | Without Coverage |
| Under $25,000 | 1,376 (92.6%) | 110 (7.4%) |
| $25,000 to $49,999 | 1,454 (85.8%) | 240 (14.2%) |
| $50,000 to $74,999 | 1,526 (82.8%) | 316 (17.2%) |
| $75,000 to $99,999 | 1,854 (93.0%) | 140 (7.0%) |
| $100,000 and over | 6,749 (94.2%) | 418 (5.8%) |
Public vs Private Health Insurance Coverage by Age in Southern Pines
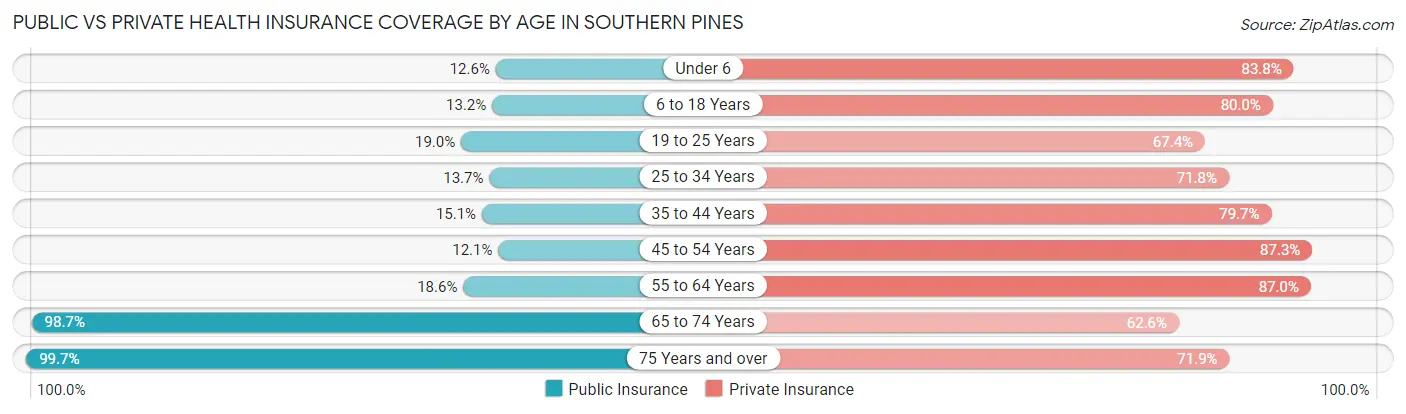
| Age Bracket | Public Insurance | Private Insurance |
| Under 6 | 170 (12.6%) | 1,136 (83.8%) |
| 6 to 18 Years | 247 (13.2%) | 1,494 (80.0%) |
| 19 to 25 Years | 226 (19.0%) | 802 (67.4%) |
| 25 to 34 Years | 258 (13.7%) | 1,349 (71.8%) |
| 35 to 44 Years | 222 (15.1%) | 1,171 (79.7%) |
| 45 to 54 Years | 196 (12.1%) | 1,416 (87.3%) |
| 55 to 64 Years | 235 (18.6%) | 1,101 (87.0%) |
| 65 to 74 Years | 1,658 (98.7%) | 1,051 (62.6%) |
| 75 Years and over | 1,922 (99.7%) | 1,387 (71.9%) |
| Total | 5,134 (36.0%) | 10,907 (76.5%) |
Disability Status by Sex by Age in Southern Pines
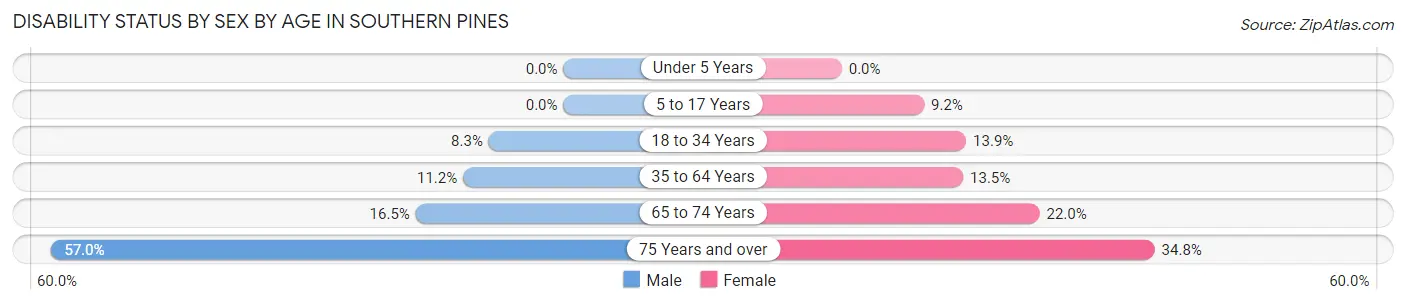
| Age Bracket | Male | Female |
| Under 5 Years | 0 (0.0%) | 0 (0.0%) |
| 5 to 17 Years | 0 (0.0%) | 92 (9.2%) |
| 18 to 34 Years | 131 (8.3%) | 239 (13.9%) |
| 35 to 64 Years | 232 (11.2%) | 308 (13.5%) |
| 65 to 74 Years | 112 (16.5%) | 220 (22.0%) |
| 75 Years and over | 394 (57.0%) | 431 (34.8%) |
Disability Class by Sex by Age in Southern Pines
Disability Class: Hearing Difficulty
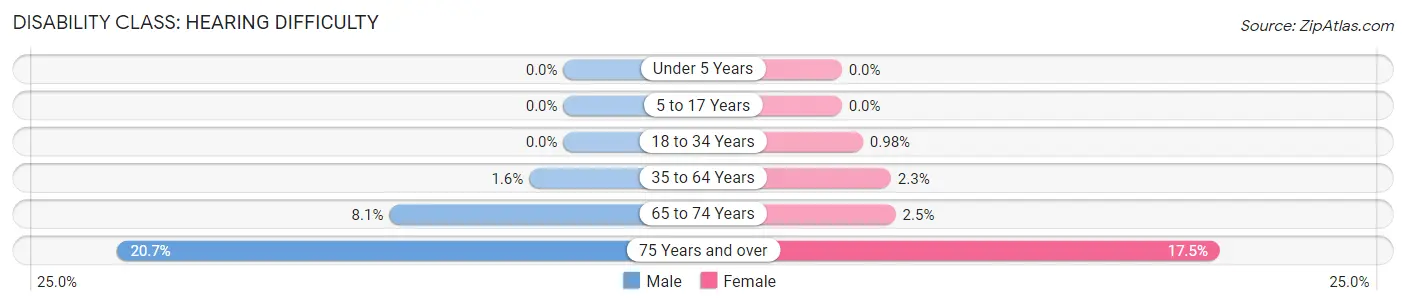
| Age Bracket | Male | Female |
| Under 5 Years | 0 (0.0%) | 0 (0.0%) |
| 5 to 17 Years | 0 (0.0%) | 0 (0.0%) |
| 18 to 34 Years | 0 (0.0%) | 17 (1.0%) |
| 35 to 64 Years | 33 (1.6%) | 52 (2.3%) |
| 65 to 74 Years | 55 (8.1%) | 25 (2.5%) |
| 75 Years and over | 143 (20.7%) | 217 (17.5%) |
Disability Class: Vision Difficulty
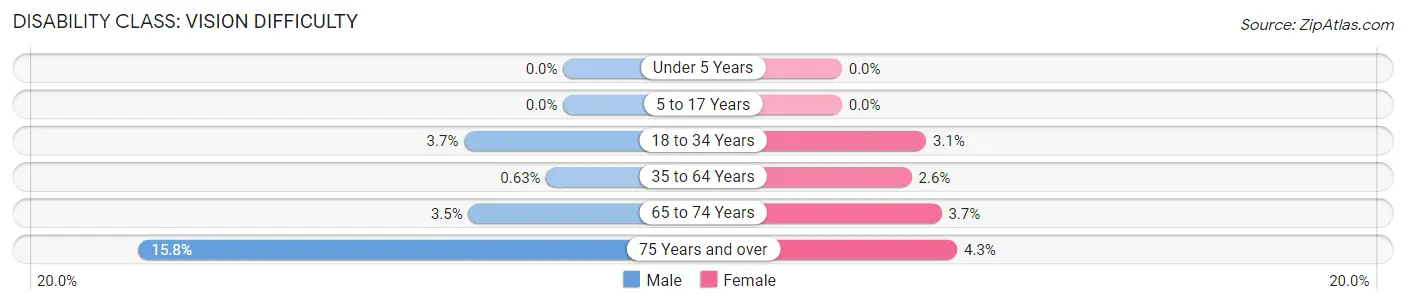
| Age Bracket | Male | Female |
| Under 5 Years | 0 (0.0%) | 0 (0.0%) |
| 5 to 17 Years | 0 (0.0%) | 0 (0.0%) |
| 18 to 34 Years | 58 (3.7%) | 54 (3.1%) |
| 35 to 64 Years | 13 (0.6%) | 59 (2.6%) |
| 65 to 74 Years | 24 (3.5%) | 37 (3.7%) |
| 75 Years and over | 109 (15.8%) | 53 (4.3%) |
Disability Class: Cognitive Difficulty
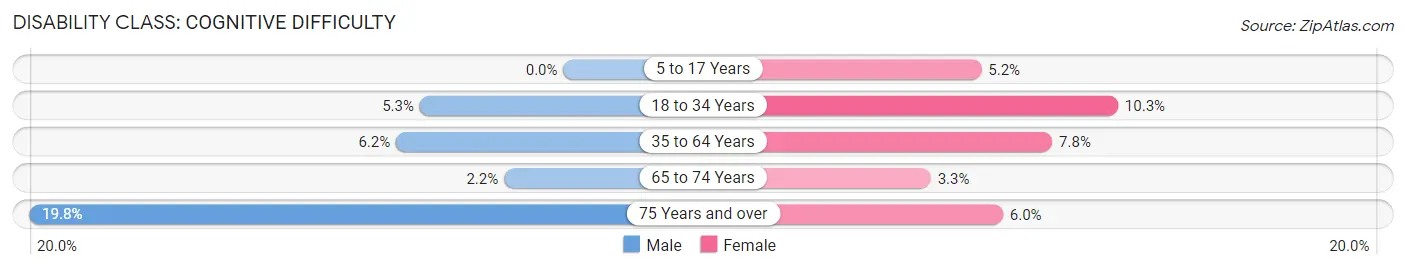
| Age Bracket | Male | Female |
| 5 to 17 Years | 0 (0.0%) | 52 (5.2%) |
| 18 to 34 Years | 84 (5.3%) | 177 (10.2%) |
| 35 to 64 Years | 129 (6.2%) | 178 (7.8%) |
| 65 to 74 Years | 15 (2.2%) | 33 (3.3%) |
| 75 Years and over | 137 (19.8%) | 74 (6.0%) |
Disability Class: Ambulatory Difficulty
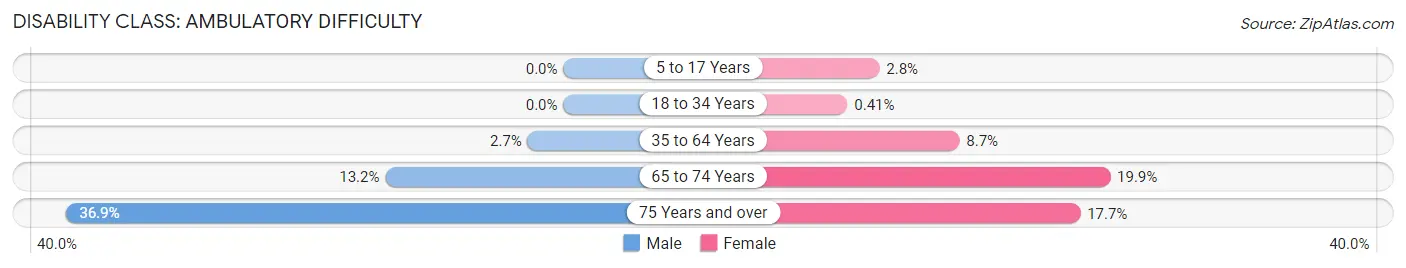
| Age Bracket | Male | Female |
| 5 to 17 Years | 0 (0.0%) | 28 (2.8%) |
| 18 to 34 Years | 0 (0.0%) | 7 (0.4%) |
| 35 to 64 Years | 55 (2.6%) | 199 (8.7%) |
| 65 to 74 Years | 90 (13.2%) | 199 (19.9%) |
| 75 Years and over | 255 (36.9%) | 219 (17.7%) |
Disability Class: Self-Care Difficulty
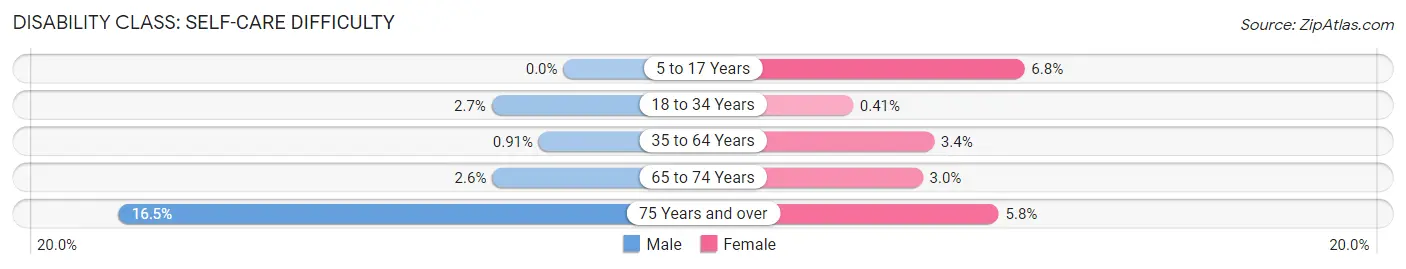
| Age Bracket | Male | Female |
| 5 to 17 Years | 0 (0.0%) | 68 (6.8%) |
| 18 to 34 Years | 42 (2.7%) | 7 (0.4%) |
| 35 to 64 Years | 19 (0.9%) | 78 (3.4%) |
| 65 to 74 Years | 18 (2.6%) | 30 (3.0%) |
| 75 Years and over | 114 (16.5%) | 72 (5.8%) |
Technology Access in Southern Pines
Computing Device Access in Southern Pines
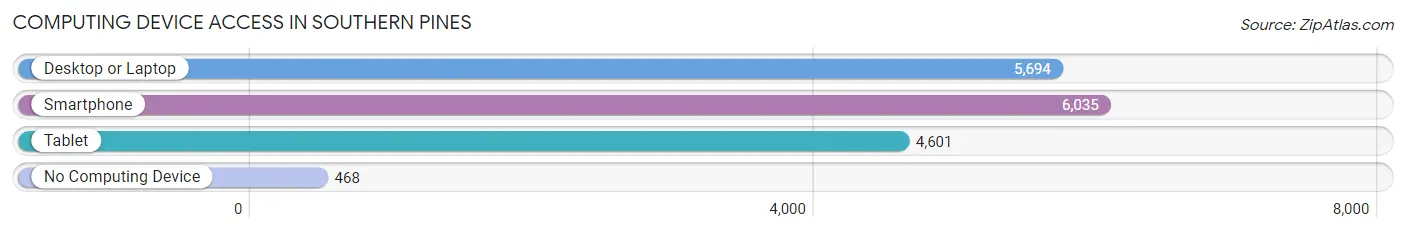
| Device Type | # Households | % Households |
| Desktop or Laptop | 5,694 | 80.4% |
| Smartphone | 6,035 | 85.2% |
| Tablet | 4,601 | 65.0% |
| No Computing Device | 468 | 6.6% |
| Total | 7,080 | 100.0% |
Internet Access in Southern Pines
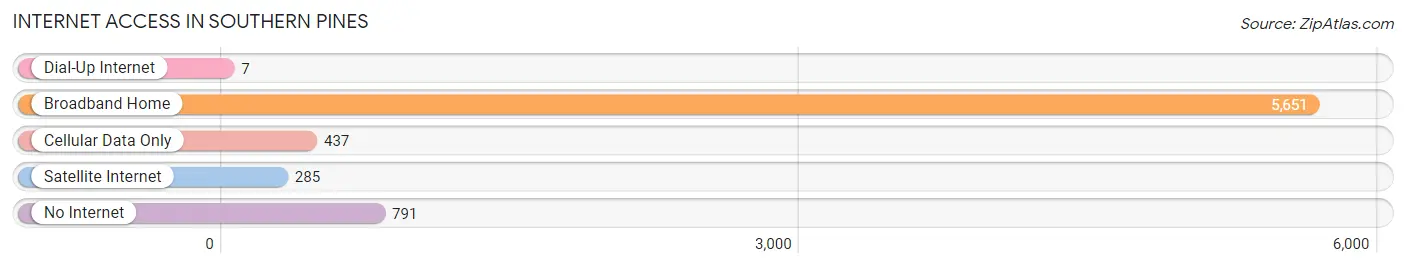
| Internet Type | # Households | % Households |
| Dial-Up Internet | 7 | 0.1% |
| Broadband Home | 5,651 | 79.8% |
| Cellular Data Only | 437 | 6.2% |
| Satellite Internet | 285 | 4.0% |
| No Internet | 791 | 11.2% |
| Total | 7,080 | 100.0% |
Southern Pines Summary
Southern Pines, North Carolina is a small town located in Moore County, in the heart of the Sandhills region of the state. The town is situated between the cities of Pinehurst and Aberdeen, and is home to a population of approximately 12,000 people. The town is known for its historic downtown area, which is home to a variety of shops, restaurants, and other businesses.
History
Southern Pines was founded in 1895 by John Blue, a local entrepreneur who saw the potential of the area. He purchased a large tract of land and began to develop the town, which he named after the longleaf pines that grew in the area. The town quickly grew, and by the early 1900s, it had become a popular destination for tourists and vacationers.
In the early 1900s, Southern Pines was a popular destination for wealthy Northerners who wanted to escape the cold winters of the North. The town was known for its golf courses, which were designed by some of the most famous golf course architects of the time. The town also became a popular destination for horse racing, and the first horse race track in the state was built in Southern Pines in 1909.
In the 1920s, the town began to experience a period of growth and prosperity. The population increased, and the town became a popular destination for wealthy Northerners who wanted to escape the cold winters of the North. The town was also home to a variety of businesses, including a movie theater, a hotel, and a variety of shops and restaurants.
Geography
Southern Pines is located in the Sandhills region of North Carolina, which is characterized by rolling hills and sandy soils. The town is situated between the cities of Pinehurst and Aberdeen, and is home to a population of approximately 12,000 people. The town is located in the Piedmont region of the state, and is surrounded by a variety of natural features, including the Uwharrie National Forest, the Weymouth Woods-Sandhills Nature Preserve, and the Carolina Sandhills National Wildlife Refuge.
Economy
Southern Pines is home to a variety of businesses, including a variety of retail stores, restaurants, and other businesses. The town is also home to a number of golf courses, which attract tourists and vacationers from all over the world. The town is also home to a variety of manufacturing and industrial businesses, including a paper mill, a furniture factory, and a variety of other businesses.
Demographics
As of the 2010 census, the population of Southern Pines was 11,867. The racial makeup of the town was 79.2% White, 15.2% African American, 0.4% Native American, 1.2% Asian, 0.1% Pacific Islander, 1.7% from other races, and 2.2% from two or more races. The median household income in the town was $45,837, and the median family income was $54,837. The per capita income in the town was $25,837.
Common Questions
What is Per Capita Income in Southern Pines?
Per Capita income in Southern Pines is $50,199.
What is the Median Family Income in Southern Pines?
Median Family Income in Southern Pines is $109,495.
What is the Median Household income in Southern Pines?
Median Household Income in Southern Pines is $81,867.
What is Income or Wage Gap in Southern Pines?
Income or Wage Gap in Southern Pines is 43.2%.
Women in Southern Pines earn 56.8 cents for every dollar earned by a man.
What is Inequality or Gini Index in Southern Pines?
Inequality or Gini Index in Southern Pines is 0.48.
What is the Total Population of Southern Pines?
Total Population of Southern Pines is 15,701.
What is the Total Male Population of Southern Pines?
Total Male Population of Southern Pines is 7,477.
What is the Total Female Population of Southern Pines?
Total Female Population of Southern Pines is 8,224.
What is the Ratio of Males per 100 Females in Southern Pines?
There are 90.92 Males per 100 Females in Southern Pines.
What is the Ratio of Females per 100 Males in Southern Pines?
There are 109.99 Females per 100 Males in Southern Pines.
What is the Median Population Age in Southern Pines?
Median Population Age in Southern Pines is 38.4 Years.
What is the Average Family Size in Southern Pines
Average Family Size in Southern Pines is 2.8 People.
What is the Average Household Size in Southern Pines
Average Household Size in Southern Pines is 2.1 People.
How Large is the Labor Force in Southern Pines?
There are 7,653 People in the Labor Forcein in Southern Pines.
What is the Percentage of People in the Labor Force in Southern Pines?
59.0% of People are in the Labor Force in Southern Pines.
What is the Unemployment Rate in Southern Pines?
Unemployment Rate in Southern Pines is 6.7%.