Westfield, NJ Map & Demographics
Westfield Map
Westfield Overview
$96,656
PER CAPITA INCOME
$250,001
AVG FAMILY INCOME
$203,235
AVG HOUSEHOLD INCOME
45.4%
WAGE / INCOME GAP [ % ]
54.6¢/ $1
WAGE / INCOME GAP [ $ ]
0.47
INEQUALITY / GINI INDEX
30,839
TOTAL POPULATION
14,970
MALE POPULATION
15,869
FEMALE POPULATION
94.33
MALES / 100 FEMALES
106.01
FEMALES / 100 MALES
40.4
MEDIAN AGE
3.4
AVG FAMILY SIZE
2.9
AVG HOUSEHOLD SIZE
15,604
LABOR FORCE [ PEOPLE ]
68.1%
PERCENT IN LABOR FORCE
4.0%
UNEMPLOYMENT RATE
Westfield Zip Codes
Westfield Area Codes
Income in Westfield
Income Overview in Westfield
Per Capita Income in Westfield is $96,656, while median incomes of families and households are $250,001 and $203,235 respectively.
| Characteristic | Number | Measure |
| Per Capita Income | 30,839 | $96,656 |
| Median Family Income | 8,223 | $250,001 |
| Mean Family Income | 8,223 | $322,846 |
| Median Household Income | 10,426 | $203,235 |
| Mean Household Income | 10,426 | $281,738 |
| Income Deficit | 8,223 | $0 |
| Wage / Income Gap (%) | 30,839 | 45.36% |
| Wage / Income Gap ($) | 30,839 | 54.64¢ per $1 |
| Gini / Inequality Index | 30,839 | 0.47 |
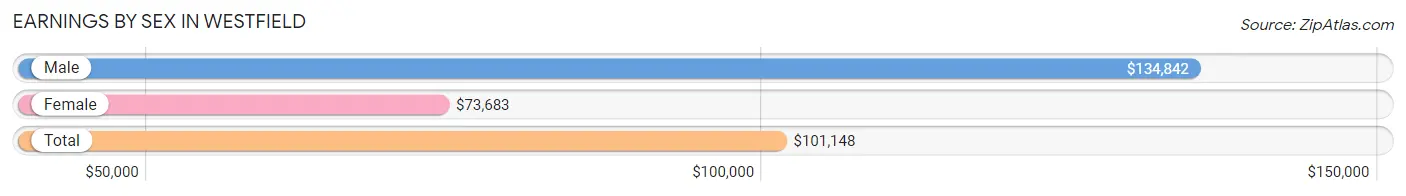
Earnings by Sex in Westfield
Average Earnings in Westfield are $101,148, $134,842 for men and $73,683 for women, a difference of 45.4%.
| Sex | Number | Average Earnings |
| Male | 8,927 (55.8%) | $134,842 |
| Female | 7,084 (44.2%) | $73,683 |
| Total | 16,011 (100.0%) | $101,148 |
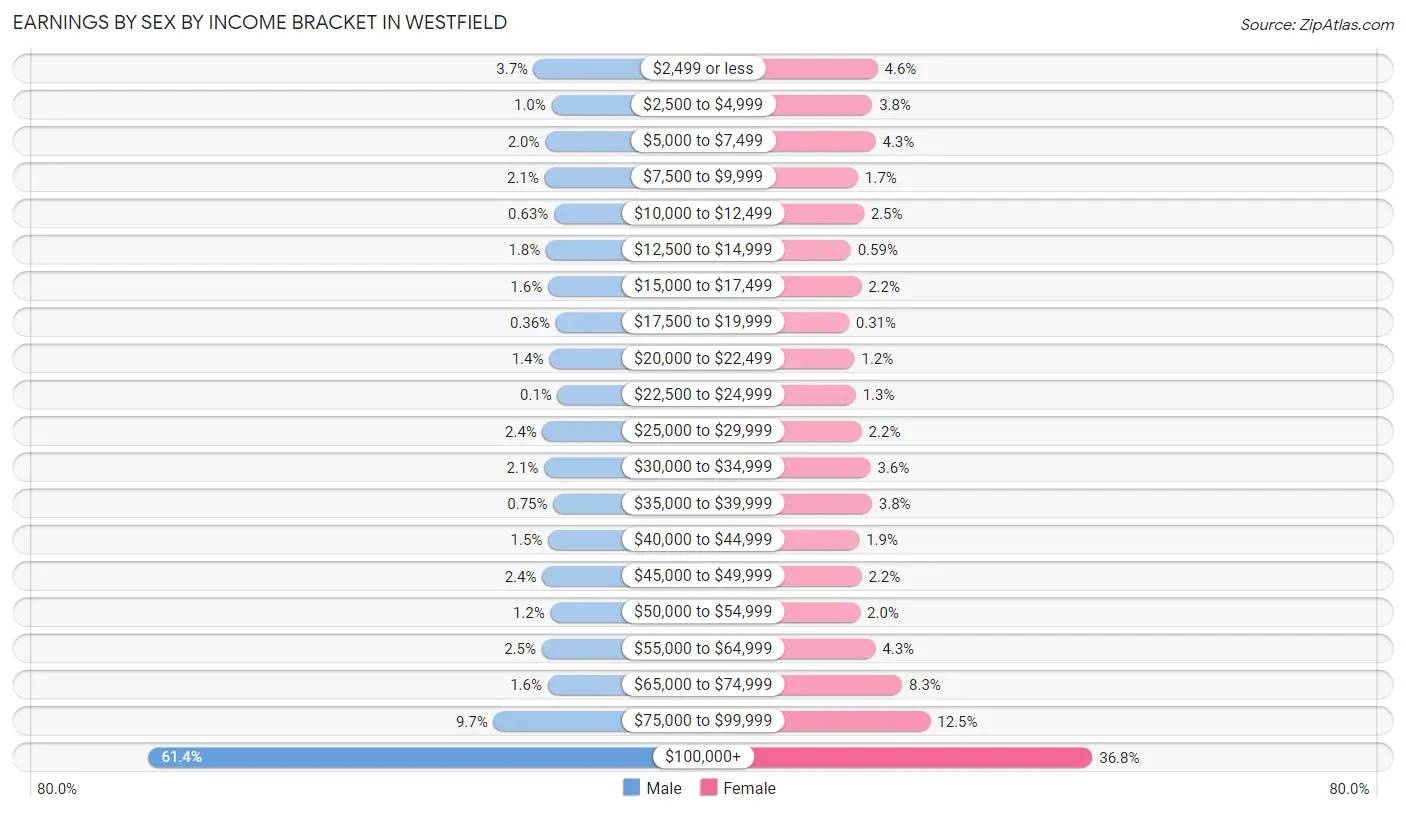
Earnings by Sex by Income Bracket in Westfield
The most common earnings brackets in Westfield are $100,000+ for men (5,483 | 61.4%) and $100,000+ for women (2,607 | 36.8%).
| Income | Male | Female |
| $2,499 or less | 327 (3.7%) | 327 (4.6%) |
| $2,500 to $4,999 | 90 (1.0%) | 270 (3.8%) |
| $5,000 to $7,499 | 174 (1.9%) | 305 (4.3%) |
| $7,500 to $9,999 | 184 (2.1%) | 120 (1.7%) |
| $10,000 to $12,499 | 56 (0.6%) | 180 (2.5%) |
| $12,500 to $14,999 | 163 (1.8%) | 42 (0.6%) |
| $15,000 to $17,499 | 138 (1.5%) | 153 (2.2%) |
| $17,500 to $19,999 | 32 (0.4%) | 22 (0.3%) |
| $20,000 to $22,499 | 121 (1.4%) | 82 (1.2%) |
| $22,500 to $24,999 | 9 (0.1%) | 95 (1.3%) |
| $25,000 to $29,999 | 210 (2.4%) | 158 (2.2%) |
| $30,000 to $34,999 | 189 (2.1%) | 252 (3.6%) |
| $35,000 to $39,999 | 67 (0.7%) | 266 (3.7%) |
| $40,000 to $44,999 | 137 (1.5%) | 132 (1.9%) |
| $45,000 to $49,999 | 214 (2.4%) | 156 (2.2%) |
| $50,000 to $54,999 | 104 (1.2%) | 141 (2.0%) |
| $55,000 to $64,999 | 221 (2.5%) | 303 (4.3%) |
| $65,000 to $74,999 | 141 (1.6%) | 587 (8.3%) |
| $75,000 to $99,999 | 867 (9.7%) | 886 (12.5%) |
| $100,000+ | 5,483 (61.4%) | 2,607 (36.8%) |
| Total | 8,927 (100.0%) | 7,084 (100.0%) |
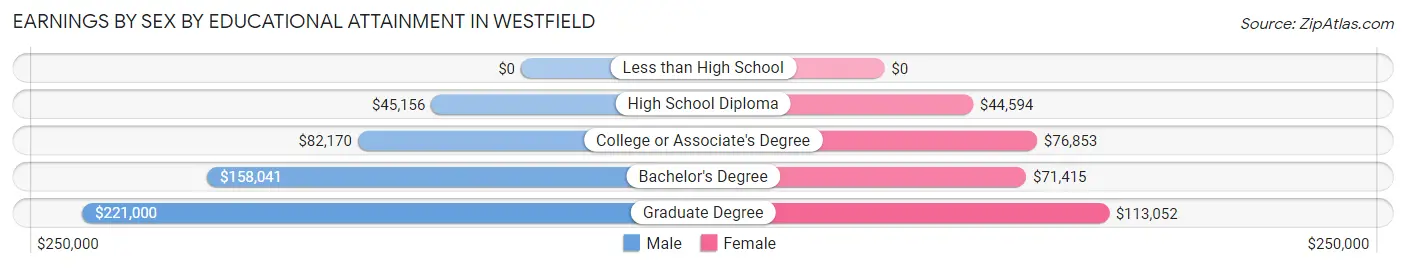
Earnings by Sex by Educational Attainment in Westfield
Average earnings in Westfield are $150,559 for men and $85,597 for women, a difference of 43.1%. Men with an educational attainment of graduate degree enjoy the highest average annual earnings of $221,000, while those with high school diploma education earn the least with $45,156. Women with an educational attainment of graduate degree earn the most with the average annual earnings of $113,052, while those with high school diploma education have the smallest earnings of $44,594.
| Educational Attainment | Male Income | Female Income |
| Less than High School | - | - |
| High School Diploma | $45,156 | $44,594 |
| College or Associate's Degree | $82,170 | $76,853 |
| Bachelor's Degree | $158,041 | $71,415 |
| Graduate Degree | $221,000 | $113,052 |
| Total | $150,559 | $85,597 |
Family Income in Westfield
Family Income Brackets in Westfield
According to the Westfield family income data, there are 5,082 families falling into the $200,000+ income range, which is the most common income bracket and makes up 61.8% of all families.
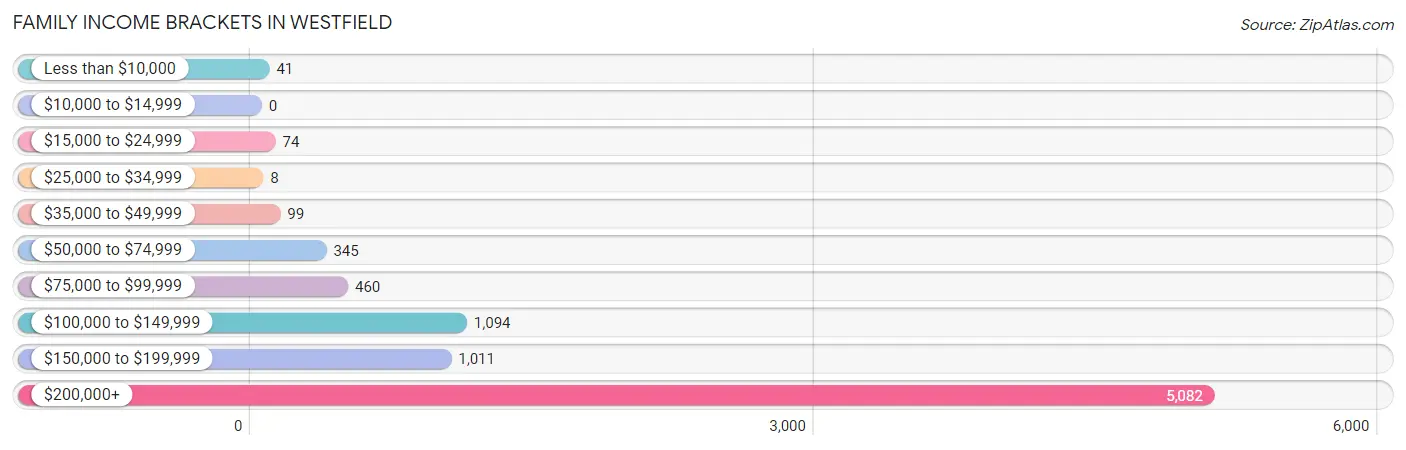
| Income Bracket | # Families | % Families |
| Less than $10,000 | 41 | 0.5% |
| $10,000 to $14,999 | 0 | 0.0% |
| $15,000 to $24,999 | 74 | 0.9% |
| $25,000 to $34,999 | 8 | 0.1% |
| $35,000 to $49,999 | 99 | 1.2% |
| $50,000 to $74,999 | 345 | 4.2% |
| $75,000 to $99,999 | 460 | 5.6% |
| $100,000 to $149,999 | 1,094 | 13.3% |
| $150,000 to $199,999 | 1,011 | 12.3% |
| $200,000+ | 5,082 | 61.8% |
Family Income by Famaliy Size in Westfield
4-person families (2,753 | 33.5%) account for the highest median family income in Westfield with $250,001 per family, while 2-person families (2,745 | 33.4%) have the highest median income of $85,852 per family member.
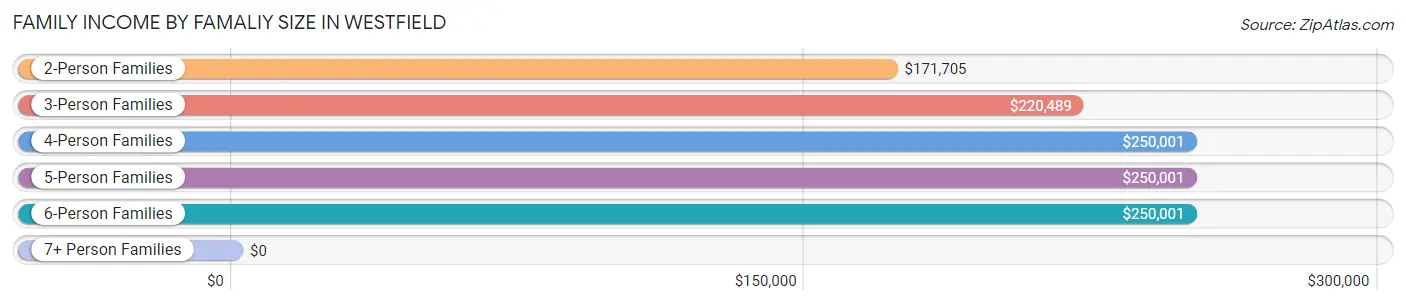
| Income Bracket | # Families | Median Income |
| 2-Person Families | 2,745 (33.4%) | $171,705 |
| 3-Person Families | 1,696 (20.6%) | $220,489 |
| 4-Person Families | 2,753 (33.5%) | $250,001 |
| 5-Person Families | 875 (10.6%) | $250,001 |
| 6-Person Families | 99 (1.2%) | $250,001 |
| 7+ Person Families | 55 (0.7%) | $0 |
| Total | 8,223 (100.0%) | $250,001 |
Family Income by Number of Earners in Westfield
The median family income in Westfield is $250,001, with families comprising 2 earners (4,128) having the highest median family income of $250,001, while families with no earners (573) have the lowest median family income of $97,443, accounting for 50.2% and 7.0% of families, respectively.
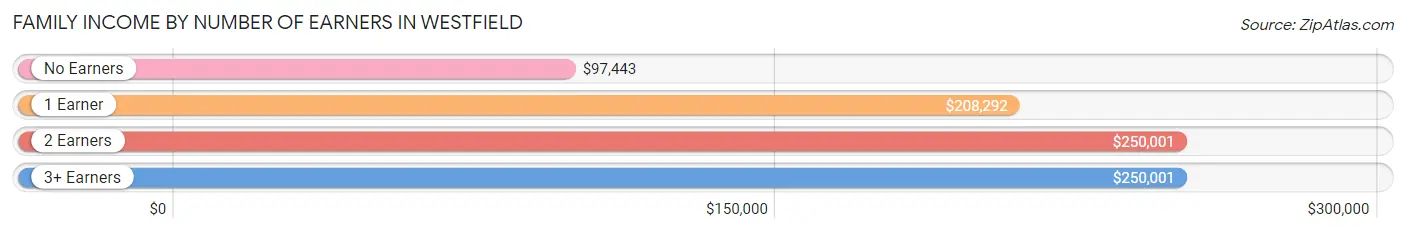
| Number of Earners | # Families | Median Income |
| No Earners | 573 (7.0%) | $97,443 |
| 1 Earner | 2,605 (31.7%) | $208,292 |
| 2 Earners | 4,128 (50.2%) | $250,001 |
| 3+ Earners | 917 (11.2%) | $250,001 |
| Total | 8,223 (100.0%) | $250,001 |
Household Income in Westfield
Household Income Brackets in Westfield
With 5,296 households falling in the category, the $200,000+ income range is the most frequent in Westfield, accounting for 50.8% of all households. In contrast, only 125 households (1.2%) fall into the $10,000 to $14,999 income bracket, making it the least populous group.
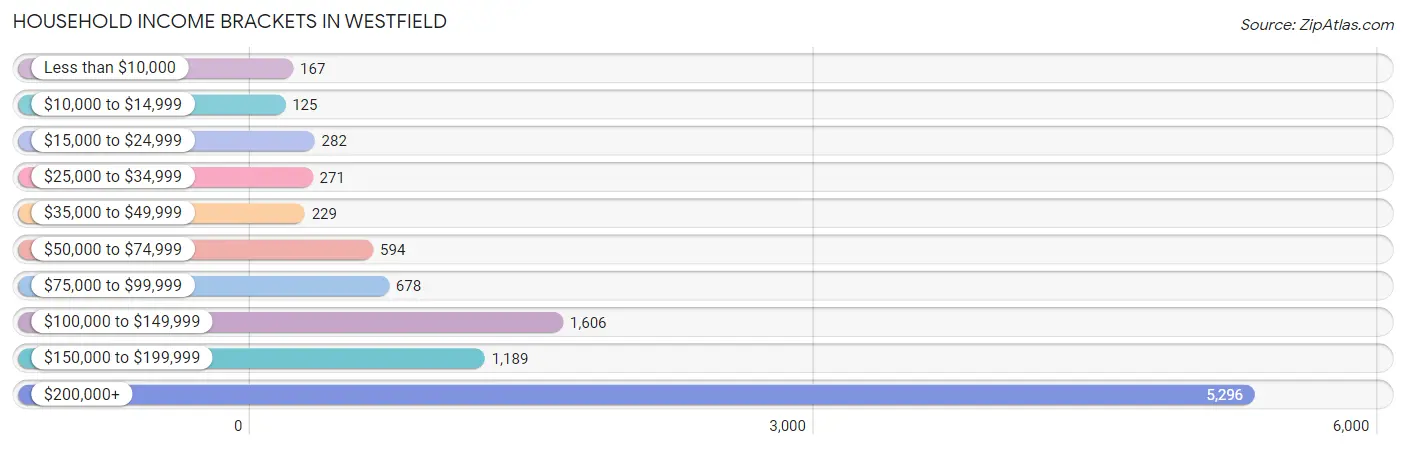
| Income Bracket | # Households | % Households |
| Less than $10,000 | 167 | 1.6% |
| $10,000 to $14,999 | 125 | 1.2% |
| $15,000 to $24,999 | 282 | 2.7% |
| $25,000 to $34,999 | 271 | 2.6% |
| $35,000 to $49,999 | 229 | 2.2% |
| $50,000 to $74,999 | 594 | 5.7% |
| $75,000 to $99,999 | 678 | 6.5% |
| $100,000 to $149,999 | 1,606 | 15.4% |
| $150,000 to $199,999 | 1,189 | 11.4% |
| $200,000+ | 5,296 | 50.8% |
Household Income by Householder Age in Westfield
The median household income in Westfield is $203,235, with the highest median household income of $250,001 found in the 25 to 44 years age bracket for the primary householder. A total of 2,869 households (27.5%) fall into this category. Meanwhile, the 15 to 24 years age bracket for the primary householder has the lowest median household income of $0, with 118 households (1.1%) in this group.
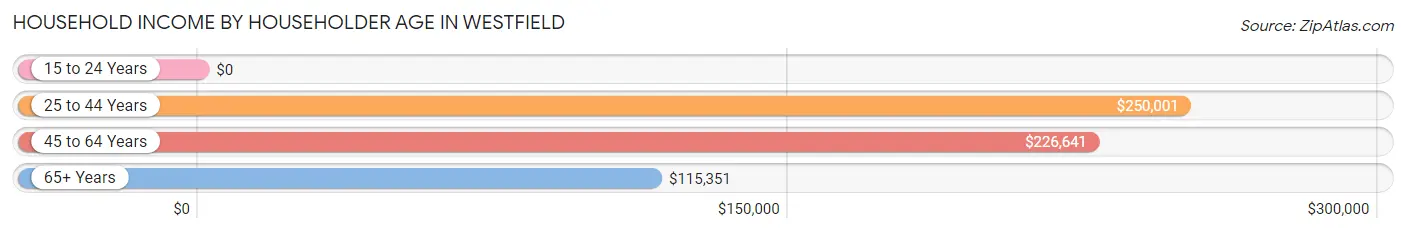
| Income Bracket | # Households | Median Income |
| 15 to 24 Years | 118 (1.1%) | $0 |
| 25 to 44 Years | 2,869 (27.5%) | $250,001 |
| 45 to 64 Years | 4,858 (46.6%) | $226,641 |
| 65+ Years | 2,581 (24.8%) | $115,351 |
| Total | 10,426 (100.0%) | $203,235 |
Poverty in Westfield
Income Below Poverty by Sex and Age in Westfield
With 1.9% poverty level for males and 2.0% for females among the residents of Westfield, 75 year old and over males and 25 to 34 year old females are the most vulnerable to poverty, with 86 males (12.4%) and 96 females (7.8%) in their respective age groups living below the poverty level.
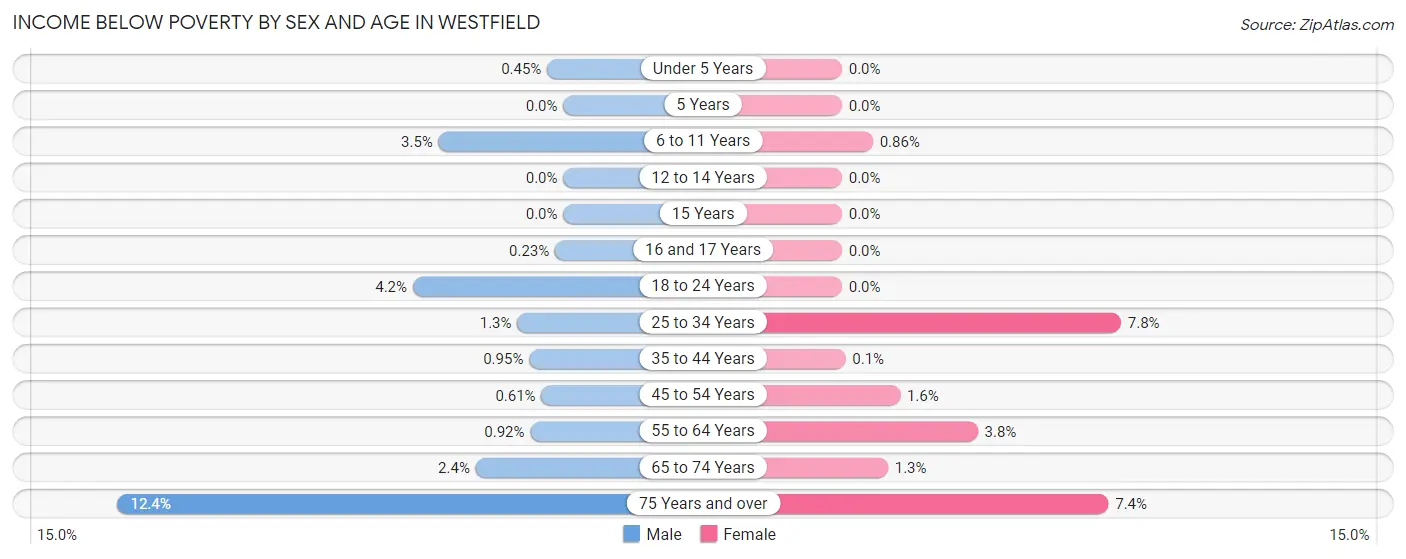
| Age Bracket | Male | Female |
| Under 5 Years | 5 (0.4%) | 0 (0.0%) |
| 5 Years | 0 (0.0%) | 0 (0.0%) |
| 6 to 11 Years | 48 (3.5%) | 15 (0.9%) |
| 12 to 14 Years | 0 (0.0%) | 0 (0.0%) |
| 15 Years | 0 (0.0%) | 0 (0.0%) |
| 16 and 17 Years | 1 (0.2%) | 0 (0.0%) |
| 18 to 24 Years | 47 (4.2%) | 0 (0.0%) |
| 25 to 34 Years | 14 (1.3%) | 96 (7.8%) |
| 35 to 44 Years | 18 (0.9%) | 2 (0.1%) |
| 45 to 54 Years | 16 (0.6%) | 40 (1.6%) |
| 55 to 64 Years | 19 (0.9%) | 76 (3.8%) |
| 65 to 74 Years | 31 (2.4%) | 18 (1.3%) |
| 75 Years and over | 86 (12.4%) | 72 (7.4%) |
| Total | 285 (1.9%) | 319 (2.0%) |
Income Above Poverty by Sex and Age in Westfield
According to the poverty statistics in Westfield, males aged 5 years and females aged under 5 years are the age groups that are most secure financially, with 100.0% of males and 100.0% of females in these age groups living above the poverty line.
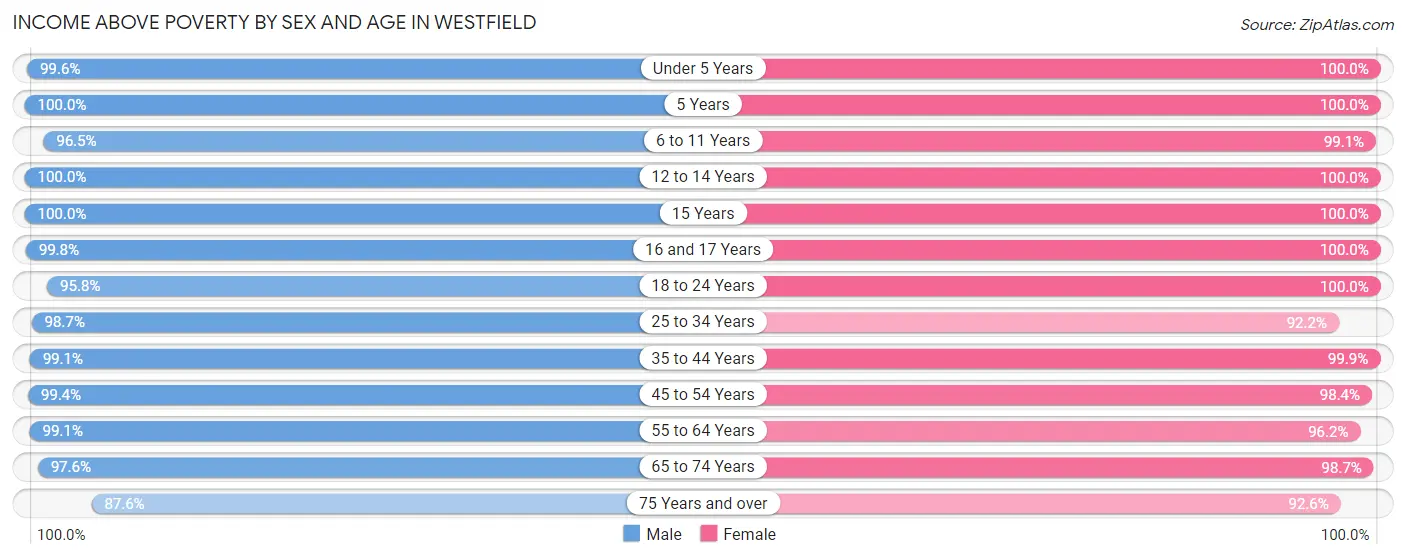
| Age Bracket | Male | Female |
| Under 5 Years | 1,109 (99.6%) | 1,168 (100.0%) |
| 5 Years | 247 (100.0%) | 97 (100.0%) |
| 6 to 11 Years | 1,334 (96.5%) | 1,728 (99.1%) |
| 12 to 14 Years | 707 (100.0%) | 906 (100.0%) |
| 15 Years | 198 (100.0%) | 314 (100.0%) |
| 16 and 17 Years | 433 (99.8%) | 486 (100.0%) |
| 18 to 24 Years | 1,076 (95.8%) | 865 (100.0%) |
| 25 to 34 Years | 1,076 (98.7%) | 1,139 (92.2%) |
| 35 to 44 Years | 1,881 (99.1%) | 2,070 (99.9%) |
| 45 to 54 Years | 2,606 (99.4%) | 2,436 (98.4%) |
| 55 to 64 Years | 2,041 (99.1%) | 1,937 (96.2%) |
| 65 to 74 Years | 1,242 (97.6%) | 1,387 (98.7%) |
| 75 Years and over | 607 (87.6%) | 899 (92.6%) |
| Total | 14,557 (98.1%) | 15,432 (98.0%) |
Income Below Poverty Among Married-Couple Families in Westfield
The poverty statistics for married-couple families in Westfield show that 0.7% or 49 of the total 7,472 families live below the poverty line. Families with no children have the highest poverty rate of 1.0%, comprising of 35 families. On the other hand, families with 3 or 4 children have the lowest poverty rate of 0.0%, which includes 0 families.
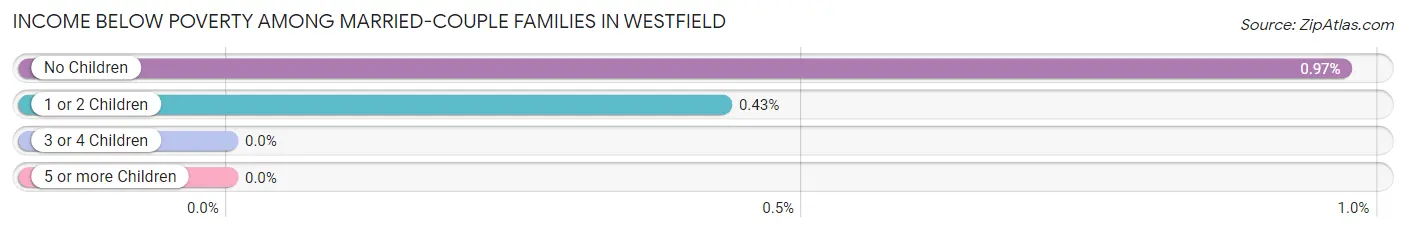
| Children | Above Poverty | Below Poverty |
| No Children | 3,556 (99.0%) | 35 (1.0%) |
| 1 or 2 Children | 3,235 (99.6%) | 14 (0.4%) |
| 3 or 4 Children | 621 (100.0%) | 0 (0.0%) |
| 5 or more Children | 11 (100.0%) | 0 (0.0%) |
| Total | 7,423 (99.3%) | 49 (0.7%) |
Income Below Poverty Among Single-Parent Households in Westfield
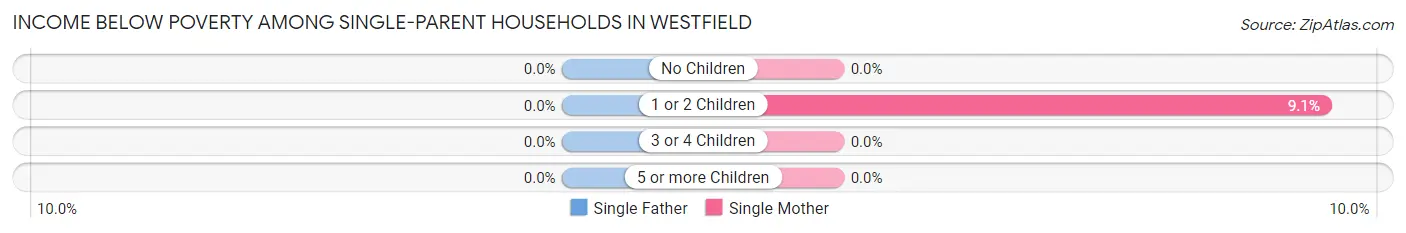
| Children | Single Father | Single Mother |
| No Children | 0 (0.0%) | 0 (0.0%) |
| 1 or 2 Children | 0 (0.0%) | 26 (9.1%) |
| 3 or 4 Children | 0 (0.0%) | 0 (0.0%) |
| 5 or more Children | 0 (0.0%) | 0 (0.0%) |
| Total | 0 (0.0%) | 26 (5.2%) |
Income Below Poverty Among Married-Couple vs Single-Parent Households in Westfield
The poverty data for Westfield shows that 49 of the married-couple family households (0.7%) and 26 of the single-parent households (3.5%) are living below the poverty level. Within the married-couple family households, those with no children have the highest poverty rate, with 35 households (1.0%) falling below the poverty line. Among the single-parent households, those with 1 or 2 children have the highest poverty rate, with 26 household (6.5%) living below poverty.
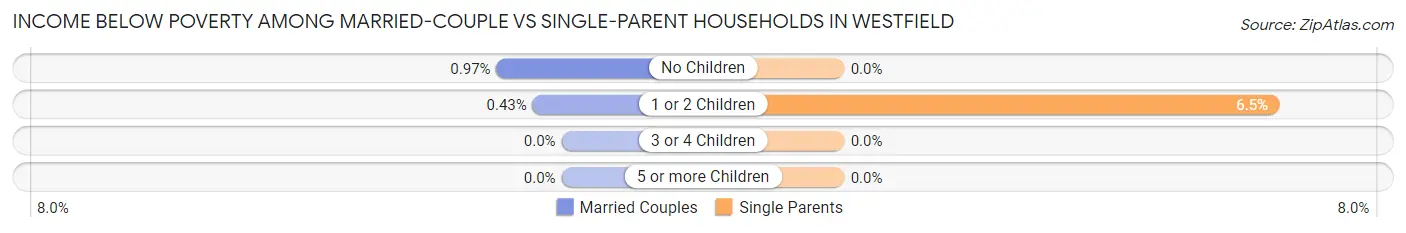
| Children | Married-Couple Families | Single-Parent Households |
| No Children | 35 (1.0%) | 0 (0.0%) |
| 1 or 2 Children | 14 (0.4%) | 26 (6.5%) |
| 3 or 4 Children | 0 (0.0%) | 0 (0.0%) |
| 5 or more Children | 0 (0.0%) | 0 (0.0%) |
| Total | 49 (0.7%) | 26 (3.5%) |
Race in Westfield
The most populous races in Westfield are White / Caucasian (24,403 | 79.1%), Hispanic or Latino (2,580 | 8.4%), and Asian (2,499 | 8.1%).
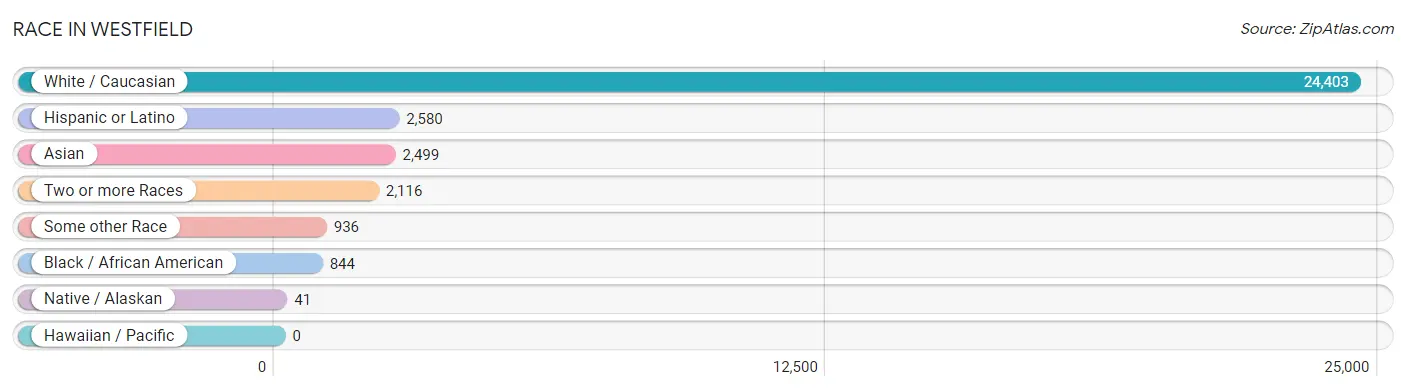
| Race | # Population | % Population |
| Asian | 2,499 | 8.1% |
| Black / African American | 844 | 2.7% |
| Hawaiian / Pacific | 0 | 0.0% |
| Hispanic or Latino | 2,580 | 8.4% |
| Native / Alaskan | 41 | 0.1% |
| White / Caucasian | 24,403 | 79.1% |
| Two or more Races | 2,116 | 6.9% |
| Some other Race | 936 | 3.0% |
| Total | 30,839 | 100.0% |
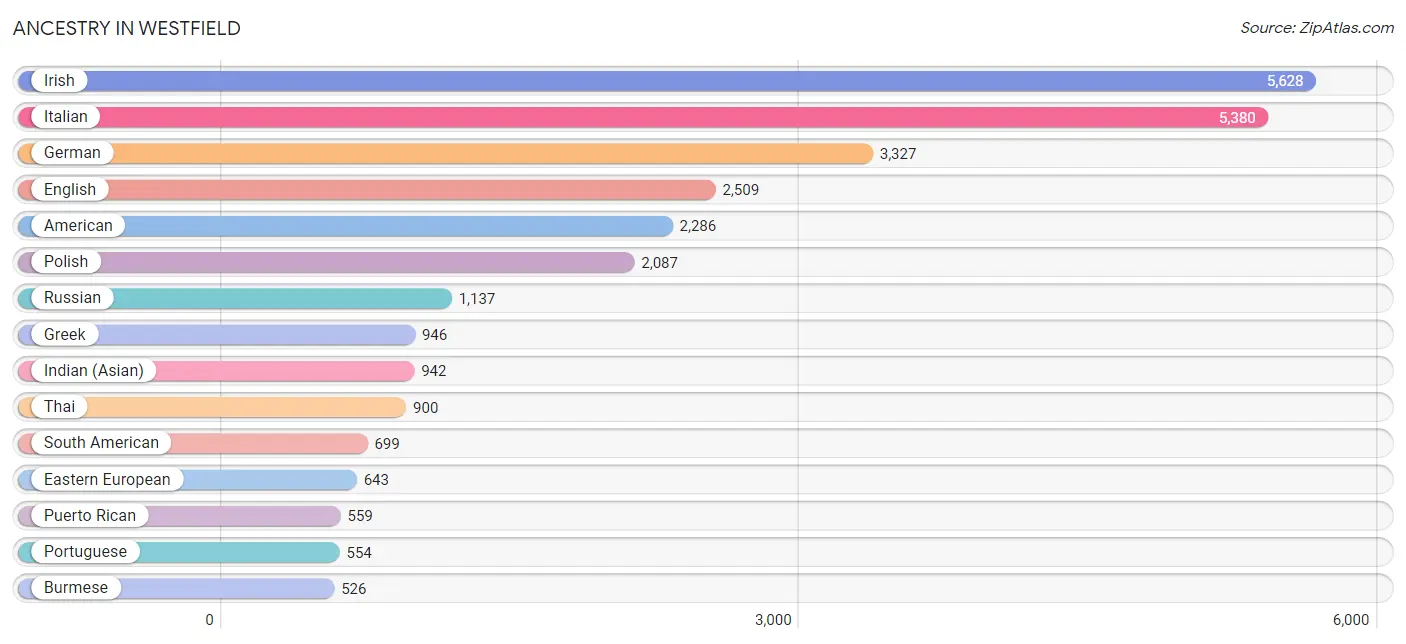
Ancestry in Westfield
The most populous ancestries reported in Westfield are Irish (5,628 | 18.2%), Italian (5,380 | 17.4%), German (3,327 | 10.8%), English (2,509 | 8.1%), and American (2,286 | 7.4%), together accounting for 62.0% of all Westfield residents.
| Ancestry | # Population | % Population |
| Afghan | 57 | 0.2% |
| African | 4 | 0.0% |
| Alaskan Athabascan | 20 | 0.1% |
| American | 2,286 | 7.4% |
| Arab | 218 | 0.7% |
| Armenian | 24 | 0.1% |
| Australian | 120 | 0.4% |
| Austrian | 214 | 0.7% |
| Barbadian | 14 | 0.1% |
| Belgian | 54 | 0.2% |
| Belizean | 57 | 0.2% |
| Bhutanese | 6 | 0.0% |
| Brazilian | 59 | 0.2% |
| British | 66 | 0.2% |
| Burmese | 526 | 1.7% |
| Canadian | 66 | 0.2% |
| Central American | 165 | 0.5% |
| Cherokee | 276 | 0.9% |
| Chilean | 17 | 0.1% |
| Colombian | 148 | 0.5% |
| Croatian | 65 | 0.2% |
| Cuban | 297 | 1.0% |
| Cypriot | 9 | 0.0% |
| Czech | 77 | 0.3% |
| Czechoslovakian | 6 | 0.0% |
| Danish | 31 | 0.1% |
| Dominican | 93 | 0.3% |
| Dutch | 320 | 1.0% |
| Eastern European | 643 | 2.1% |
| Ecuadorian | 449 | 1.5% |
| Egyptian | 40 | 0.1% |
| English | 2,509 | 8.1% |
| Ethiopian | 7 | 0.0% |
| European | 285 | 0.9% |
| Filipino | 46 | 0.2% |
| Finnish | 34 | 0.1% |
| French | 259 | 0.8% |
| French Canadian | 123 | 0.4% |
| German | 3,327 | 10.8% |
| Greek | 946 | 3.1% |
| Guatemalan | 18 | 0.1% |
| Haitian | 116 | 0.4% |
| Honduran | 26 | 0.1% |
| Hungarian | 230 | 0.7% |
| Indian (Asian) | 942 | 3.0% |
| Irish | 5,628 | 18.2% |
| Israeli | 1 | 0.0% |
| Italian | 5,380 | 17.4% |
| Jamaican | 28 | 0.1% |
| Japanese | 309 | 1.0% |
| Kenyan | 10 | 0.0% |
| Korean | 279 | 0.9% |
| Laotian | 16 | 0.1% |
| Latvian | 32 | 0.1% |
| Lebanese | 68 | 0.2% |
| Lithuanian | 182 | 0.6% |
| Luxembourger | 44 | 0.1% |
| Macedonian | 41 | 0.1% |
| Maltese | 15 | 0.1% |
| Mexican | 136 | 0.4% |
| Mexican American Indian | 26 | 0.1% |
| Native Hawaiian | 37 | 0.1% |
| Nicaraguan | 17 | 0.1% |
| Nigerian | 35 | 0.1% |
| Northern European | 72 | 0.2% |
| Norwegian | 240 | 0.8% |
| Palestinian | 51 | 0.2% |
| Panamanian | 28 | 0.1% |
| Pennsylvania German | 20 | 0.1% |
| Peruvian | 67 | 0.2% |
| Polish | 2,087 | 6.8% |
| Portuguese | 554 | 1.8% |
| Puerto Rican | 559 | 1.8% |
| Romanian | 153 | 0.5% |
| Russian | 1,137 | 3.7% |
| Salvadoran | 76 | 0.3% |
| Scandinavian | 41 | 0.1% |
| Scotch-Irish | 373 | 1.2% |
| Scottish | 267 | 0.9% |
| Slovak | 73 | 0.2% |
| South African | 42 | 0.1% |
| South American | 699 | 2.3% |
| South American Indian | 27 | 0.1% |
| Soviet Union | 15 | 0.1% |
| Spaniard | 414 | 1.3% |
| Spanish | 198 | 0.6% |
| Sri Lankan | 153 | 0.5% |
| Subsaharan African | 202 | 0.7% |
| Swedish | 201 | 0.6% |
| Swiss | 119 | 0.4% |
| Syrian | 49 | 0.2% |
| Thai | 900 | 2.9% |
| Turkish | 92 | 0.3% |
| Ukrainian | 462 | 1.5% |
| Uruguayan | 18 | 0.1% |
| Vietnamese | 38 | 0.1% |
| Welsh | 191 | 0.6% | View All 97 Rows |
Immigrants in Westfield
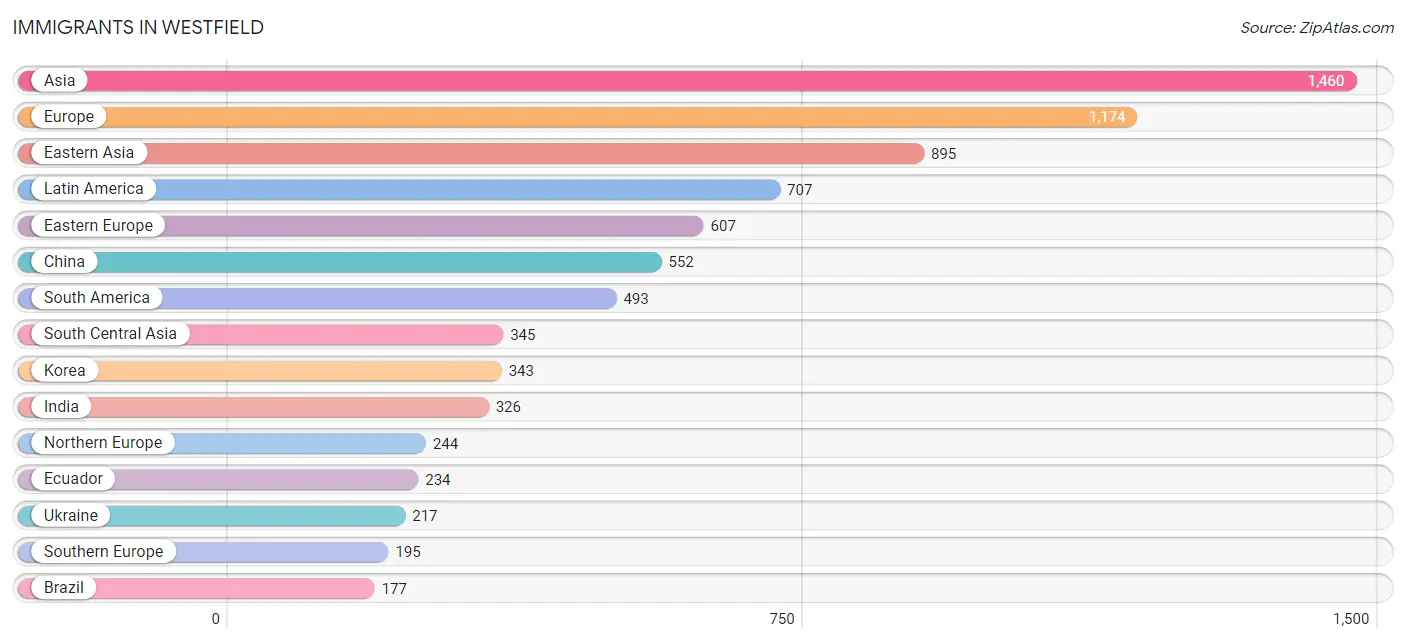
The most numerous immigrant groups reported in Westfield came from Asia (1,460 | 4.7%), Europe (1,174 | 3.8%), Eastern Asia (895 | 2.9%), Latin America (707 | 2.3%), and Eastern Europe (607 | 2.0%), together accounting for 15.7% of all Westfield residents.
| Immigration Origin | # Population | % Population |
| Afghanistan | 19 | 0.1% |
| Africa | 121 | 0.4% |
| Asia | 1,460 | 4.7% |
| Australia | 20 | 0.1% |
| Austria | 7 | 0.0% |
| Belarus | 29 | 0.1% |
| Belgium | 25 | 0.1% |
| Brazil | 177 | 0.6% |
| Canada | 87 | 0.3% |
| Caribbean | 148 | 0.5% |
| Central America | 66 | 0.2% |
| China | 552 | 1.8% |
| Colombia | 35 | 0.1% |
| Costa Rica | 12 | 0.0% |
| Cuba | 33 | 0.1% |
| Czechoslovakia | 18 | 0.1% |
| Dominican Republic | 31 | 0.1% |
| Eastern Africa | 17 | 0.1% |
| Eastern Asia | 895 | 2.9% |
| Eastern Europe | 607 | 2.0% |
| Ecuador | 234 | 0.8% |
| Egypt | 32 | 0.1% |
| El Salvador | 21 | 0.1% |
| England | 28 | 0.1% |
| Ethiopia | 7 | 0.0% |
| Europe | 1,174 | 3.8% |
| France | 42 | 0.1% |
| Germany | 54 | 0.2% |
| Guatemala | 1 | 0.0% |
| Guyana | 19 | 0.1% |
| Haiti | 54 | 0.2% |
| Honduras | 26 | 0.1% |
| Hong Kong | 38 | 0.1% |
| India | 326 | 1.1% |
| Indonesia | 16 | 0.1% |
| Ireland | 61 | 0.2% |
| Italy | 132 | 0.4% |
| Jamaica | 12 | 0.0% |
| Kenya | 10 | 0.0% |
| Korea | 343 | 1.1% |
| Latin America | 707 | 2.3% |
| Lebanon | 10 | 0.0% |
| Lithuania | 7 | 0.0% |
| Malaysia | 6 | 0.0% |
| Mexico | 6 | 0.0% |
| Moldova | 31 | 0.1% |
| Nigeria | 29 | 0.1% |
| Northern Africa | 32 | 0.1% |
| Northern Europe | 244 | 0.8% |
| Oceania | 20 | 0.1% |
| Peru | 10 | 0.0% |
| Philippines | 101 | 0.3% |
| Poland | 66 | 0.2% |
| Portugal | 39 | 0.1% |
| Romania | 57 | 0.2% |
| Russia | 136 | 0.4% |
| South Africa | 42 | 0.1% |
| South America | 493 | 1.6% |
| South Central Asia | 345 | 1.1% |
| South Eastern Asia | 173 | 0.6% |
| Southern Europe | 195 | 0.6% |
| Spain | 24 | 0.1% |
| Taiwan | 141 | 0.5% |
| Trinidad and Tobago | 18 | 0.1% |
| Turkey | 10 | 0.0% |
| Ukraine | 217 | 0.7% |
| Uruguay | 18 | 0.1% |
| Vietnam | 41 | 0.1% |
| Western Africa | 30 | 0.1% |
| Western Asia | 37 | 0.1% |
| Western Europe | 128 | 0.4% | View All 71 Rows |
Sex and Age in Westfield
Sex and Age in Westfield
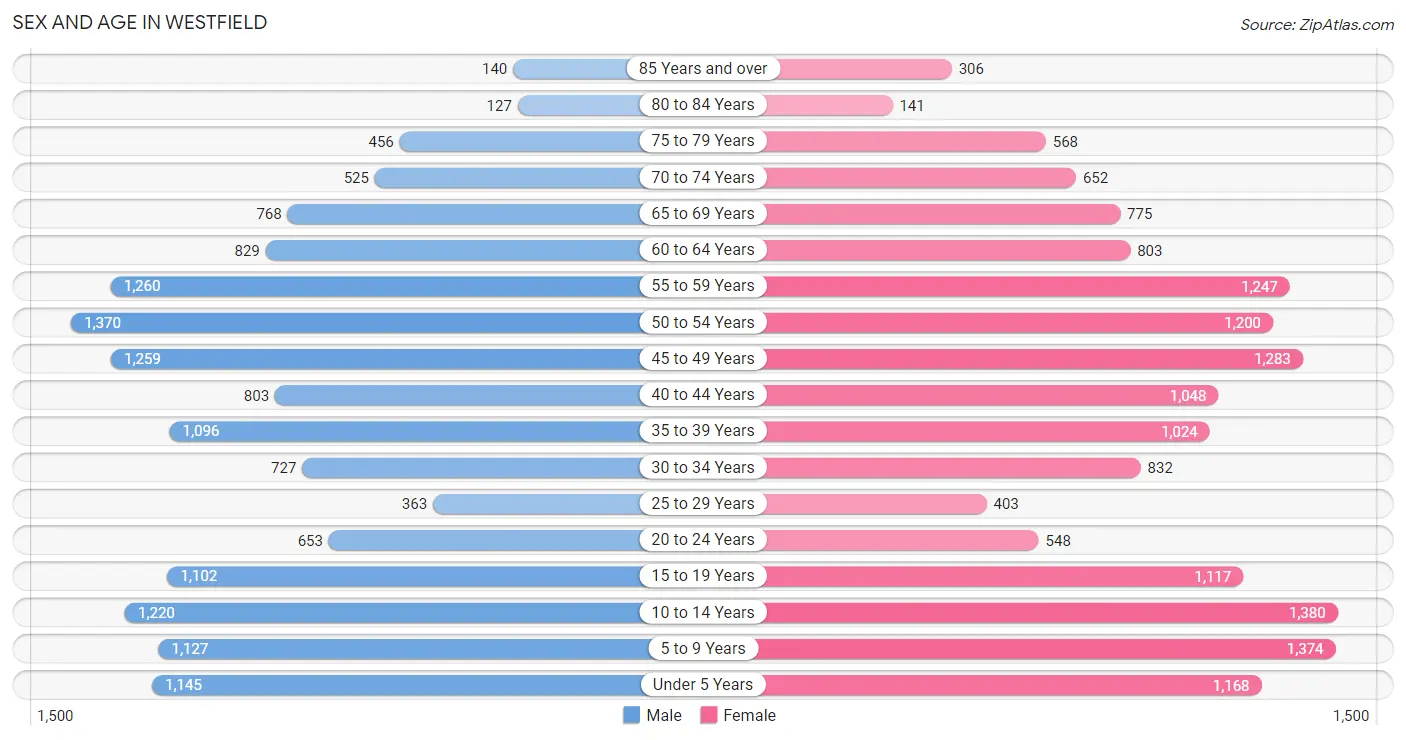
The most populous age groups in Westfield are 50 to 54 Years (1,370 | 9.1%) for men and 10 to 14 Years (1,380 | 8.7%) for women.
| Age Bracket | Male | Female |
| Under 5 Years | 1,145 (7.6%) | 1,168 (7.4%) |
| 5 to 9 Years | 1,127 (7.5%) | 1,374 (8.7%) |
| 10 to 14 Years | 1,220 (8.2%) | 1,380 (8.7%) |
| 15 to 19 Years | 1,102 (7.4%) | 1,117 (7.0%) |
| 20 to 24 Years | 653 (4.4%) | 548 (3.5%) |
| 25 to 29 Years | 363 (2.4%) | 403 (2.5%) |
| 30 to 34 Years | 727 (4.9%) | 832 (5.2%) |
| 35 to 39 Years | 1,096 (7.3%) | 1,024 (6.5%) |
| 40 to 44 Years | 803 (5.4%) | 1,048 (6.6%) |
| 45 to 49 Years | 1,259 (8.4%) | 1,283 (8.1%) |
| 50 to 54 Years | 1,370 (9.1%) | 1,200 (7.6%) |
| 55 to 59 Years | 1,260 (8.4%) | 1,247 (7.9%) |
| 60 to 64 Years | 829 (5.5%) | 803 (5.1%) |
| 65 to 69 Years | 768 (5.1%) | 775 (4.9%) |
| 70 to 74 Years | 525 (3.5%) | 652 (4.1%) |
| 75 to 79 Years | 456 (3.0%) | 568 (3.6%) |
| 80 to 84 Years | 127 (0.9%) | 141 (0.9%) |
| 85 Years and over | 140 (0.9%) | 306 (1.9%) |
| Total | 14,970 (100.0%) | 15,869 (100.0%) |
Families and Households in Westfield
Median Family Size in Westfield
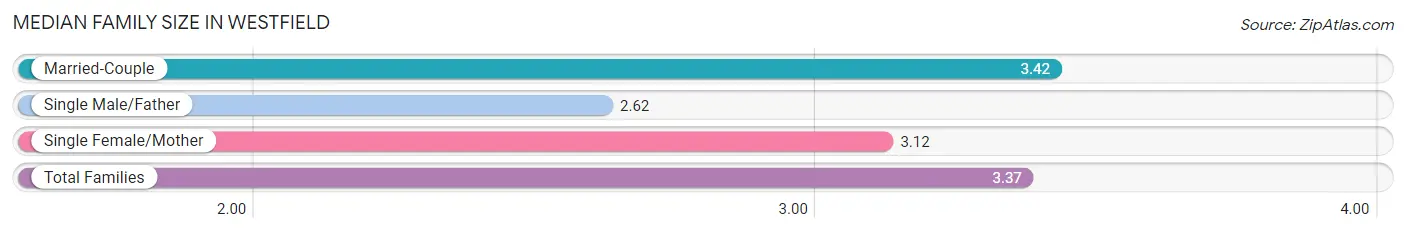
The median family size in Westfield is 3.37 persons per family, with married-couple families (7,472 | 90.9%) accounting for the largest median family size of 3.42 persons per family. On the other hand, single male/father families (248 | 3.0%) represent the smallest median family size with 2.62 persons per family.
| Family Type | # Families | Family Size |
| Married-Couple | 7,472 (90.9%) | 3.42 |
| Single Male/Father | 248 (3.0%) | 2.62 |
| Single Female/Mother | 503 (6.1%) | 3.12 |
| Total Families | 8,223 (100.0%) | 3.37 |
Median Household Size in Westfield
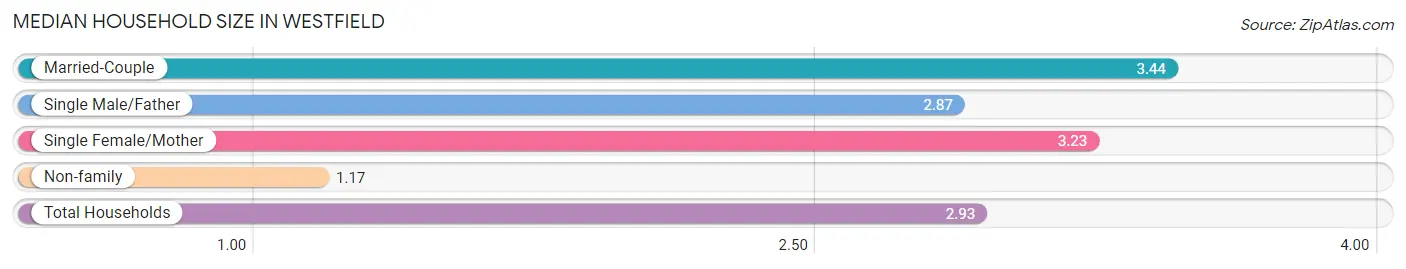
The median household size in Westfield is 2.93 persons per household, with married-couple households (7,472 | 71.7%) accounting for the largest median household size of 3.44 persons per household. non-family households (2,203 | 21.1%) represent the smallest median household size with 1.17 persons per household.
| Household Type | # Households | Household Size |
| Married-Couple | 7,472 (71.7%) | 3.44 |
| Single Male/Father | 248 (2.4%) | 2.87 |
| Single Female/Mother | 503 (4.8%) | 3.23 |
| Non-family | 2,203 (21.1%) | 1.17 |
| Total Households | 10,426 (100.0%) | 2.93 |
Household Size by Marriage Status in Westfield
Out of a total of 10,426 households in Westfield, 8,223 (78.9%) are family households, while 2,203 (21.1%) are nonfamily households. The most numerous type of family households are 2-person households, comprising 2,670, and the most common type of nonfamily households are 1-person households, comprising 1,931.
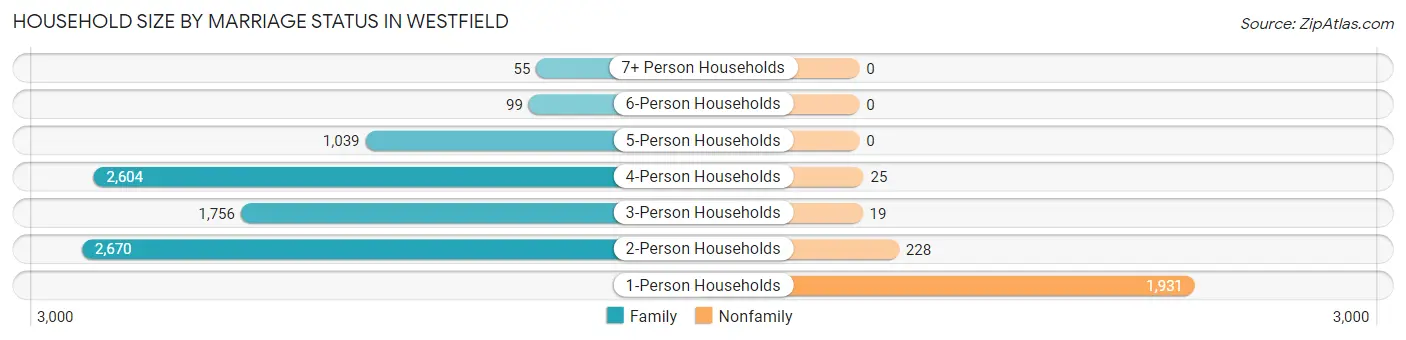
| Household Size | Family Households | Nonfamily Households |
| 1-Person Households | - | 1,931 (18.5%) |
| 2-Person Households | 2,670 (25.6%) | 228 (2.2%) |
| 3-Person Households | 1,756 (16.8%) | 19 (0.2%) |
| 4-Person Households | 2,604 (25.0%) | 25 (0.2%) |
| 5-Person Households | 1,039 (10.0%) | 0 (0.0%) |
| 6-Person Households | 99 (0.9%) | 0 (0.0%) |
| 7+ Person Households | 55 (0.5%) | 0 (0.0%) |
| Total | 8,223 (78.9%) | 2,203 (21.1%) |
Female Fertility in Westfield
Fertility by Age in Westfield
Average fertility rate in Westfield is 59.0 births per 1,000 women. Women in the age bracket of 35 to 50 years have the highest fertility rate with 71.0 births per 1,000 women. Women in the age bracket of 35 to 50 years acount for 68.3% of all women with births.
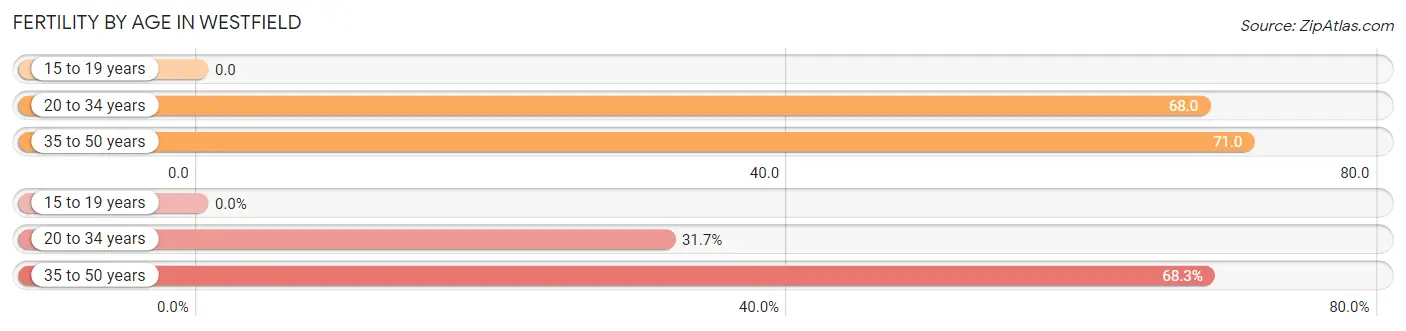
| Age Bracket | Women with Births | Births / 1,000 Women |
| 15 to 19 years | 0 (0.0%) | 0.0 |
| 20 to 34 years | 122 (31.7%) | 68.0 |
| 35 to 50 years | 263 (68.3%) | 71.0 |
| Total | 385 (100.0%) | 59.0 |
Fertility by Age by Marriage Status in Westfield
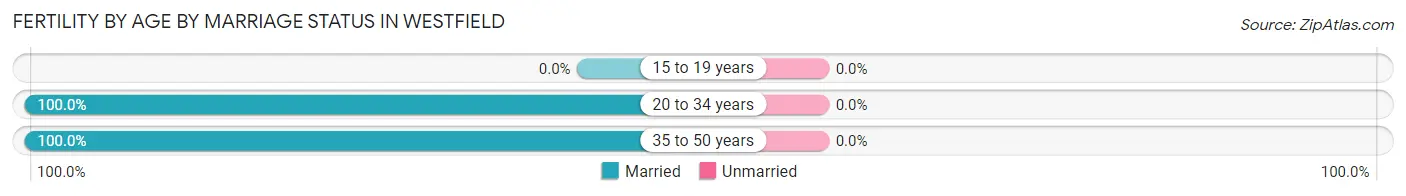
| Age Bracket | Married | Unmarried |
| 15 to 19 years | 0 (0.0%) | 0 (0.0%) |
| 20 to 34 years | 122 (100.0%) | 0 (0.0%) |
| 35 to 50 years | 263 (100.0%) | 0 (0.0%) |
| Total | 385 (100.0%) | 0 (0.0%) |
Fertility by Education in Westfield
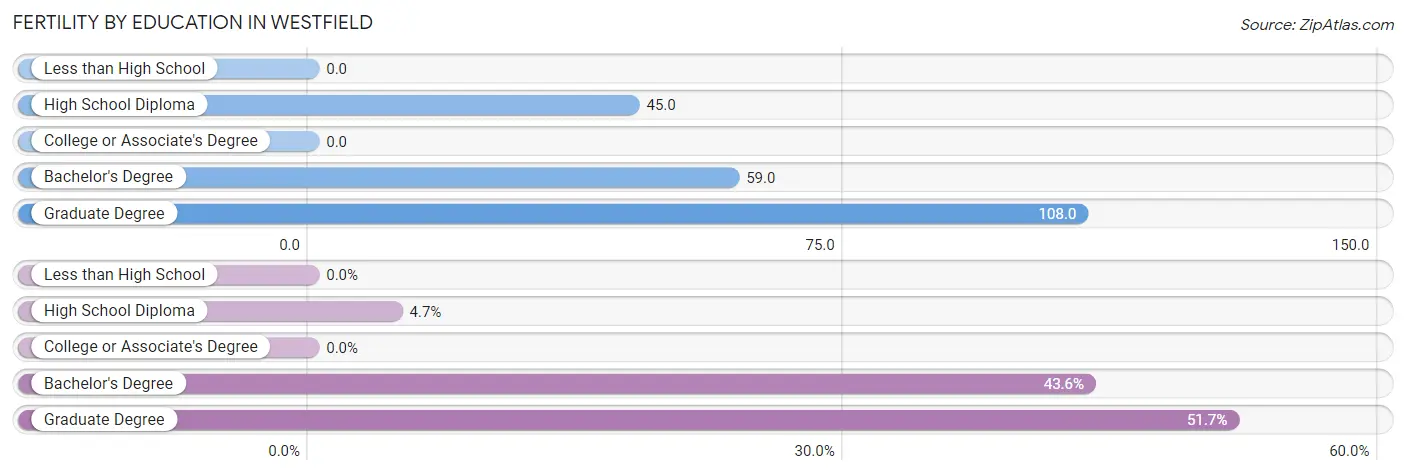
| Educational Attainment | Women with Births | Births / 1,000 Women |
| Less than High School | 0 (0.0%) | 0.0 |
| High School Diploma | 18 (4.7%) | 45.0 |
| College or Associate's Degree | 0 (0.0%) | 0.0 |
| Bachelor's Degree | 168 (43.6%) | 59.0 |
| Graduate Degree | 199 (51.7%) | 108.0 |
| Total | 385 (100.0%) | 59.0 |
Fertility by Education by Marriage Status in Westfield
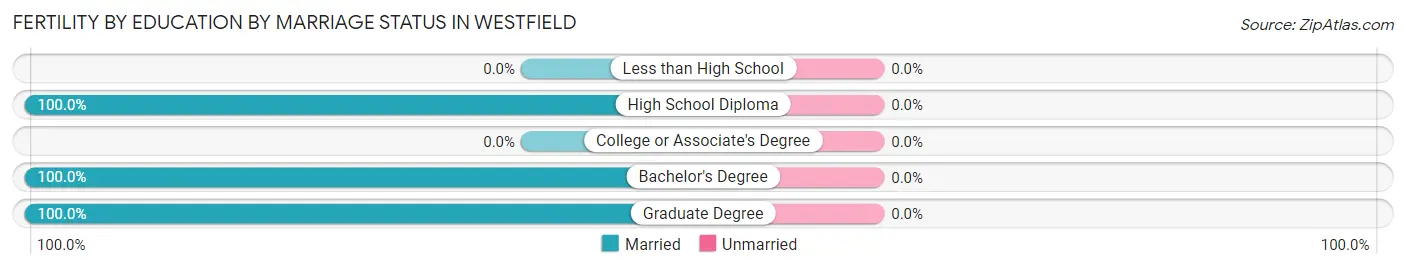
| Educational Attainment | Married | Unmarried |
| Less than High School | 0 (0.0%) | 0 (0.0%) |
| High School Diploma | 18 (100.0%) | 0 (0.0%) |
| College or Associate's Degree | 0 (0.0%) | 0 (0.0%) |
| Bachelor's Degree | 168 (100.0%) | 0 (0.0%) |
| Graduate Degree | 199 (100.0%) | 0 (0.0%) |
| Total | 385 (100.0%) | 0 (0.0%) |
Employment Characteristics in Westfield
Employment by Class of Employer in Westfield
Among the 14,807 employed individuals in Westfield, private company employees (11,075 | 74.8%), not-for-profit organizations (957 | 6.5%), and local government employees (823 | 5.6%) make up the most common classes of employment.
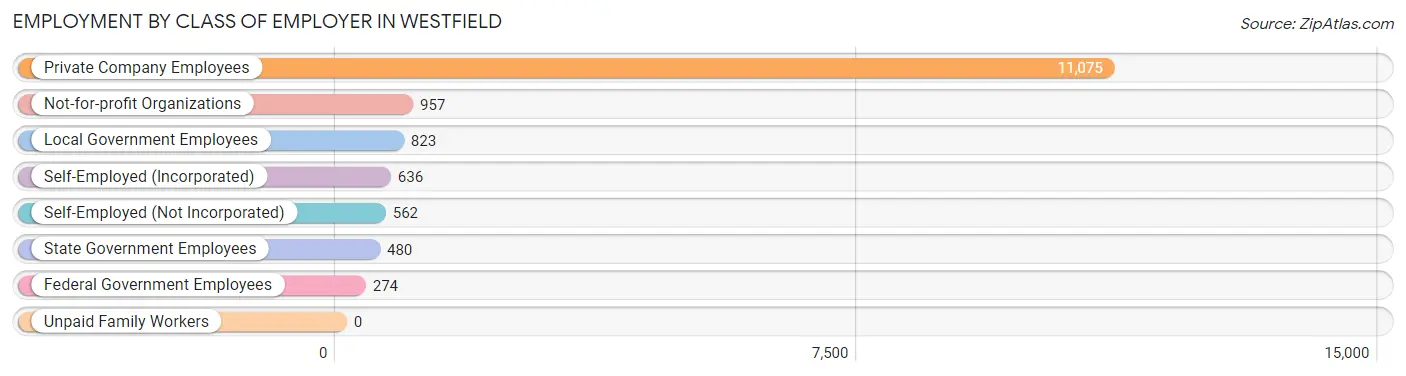
| Employer Class | # Employees | % Employees |
| Private Company Employees | 11,075 | 74.8% |
| Self-Employed (Incorporated) | 636 | 4.3% |
| Self-Employed (Not Incorporated) | 562 | 3.8% |
| Not-for-profit Organizations | 957 | 6.5% |
| Local Government Employees | 823 | 5.6% |
| State Government Employees | 480 | 3.2% |
| Federal Government Employees | 274 | 1.8% |
| Unpaid Family Workers | 0 | 0.0% |
| Total | 14,807 | 100.0% |
Employment Status by Age in Westfield
According to the labor force statistics for Westfield, out of the total population over 16 years of age (22,913), 68.1% or 15,604 individuals are in the labor force, with 4.0% or 624 of them unemployed. The age group with the highest labor force participation rate is 30 to 34 years, with 92.0% or 1,434 individuals in the labor force. Within the labor force, the 25 to 29 years age range has the highest percentage of unemployed individuals, with 17.5% or 123 of them being unemployed.
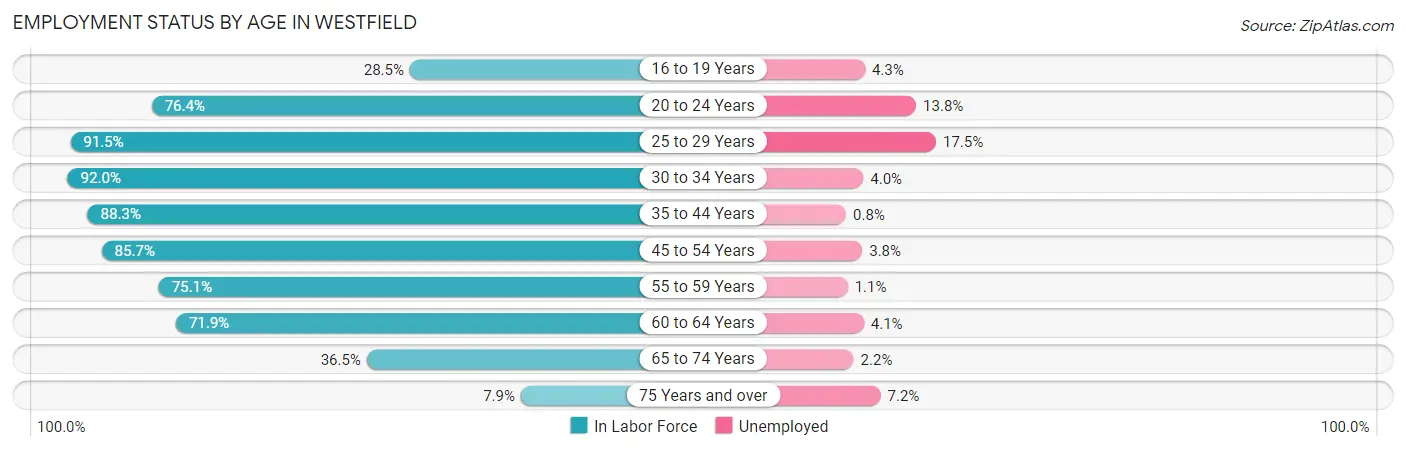
| Age Bracket | In Labor Force | Unemployed |
| 16 to 19 Years | 486 (28.5%) | 21 (4.3%) |
| 20 to 24 Years | 918 (76.4%) | 127 (13.8%) |
| 25 to 29 Years | 701 (91.5%) | 123 (17.5%) |
| 30 to 34 Years | 1,434 (92.0%) | 57 (4.0%) |
| 35 to 44 Years | 3,506 (88.3%) | 28 (0.8%) |
| 45 to 54 Years | 4,381 (85.7%) | 166 (3.8%) |
| 55 to 59 Years | 1,883 (75.1%) | 21 (1.1%) |
| 60 to 64 Years | 1,173 (71.9%) | 48 (4.1%) |
| 65 to 74 Years | 993 (36.5%) | 22 (2.2%) |
| 75 Years and over | 137 (7.9%) | 10 (7.2%) |
| Total | 15,604 (68.1%) | 624 (4.0%) |
Employment Status by Educational Attainment in Westfield
According to labor force statistics for Westfield, 84.1% of individuals (13,075) out of the total population between 25 and 64 years of age (15,547) are in the labor force, with 3.4% or 445 of them being unemployed. The group with the highest labor force participation rate are those with the educational attainment of college / associate degree, with 87.8% or 1,405 individuals in the labor force. Within the labor force, individuals with college / associate degree education have the highest percentage of unemployment, with 9.3% or 131 of them being unemployed.
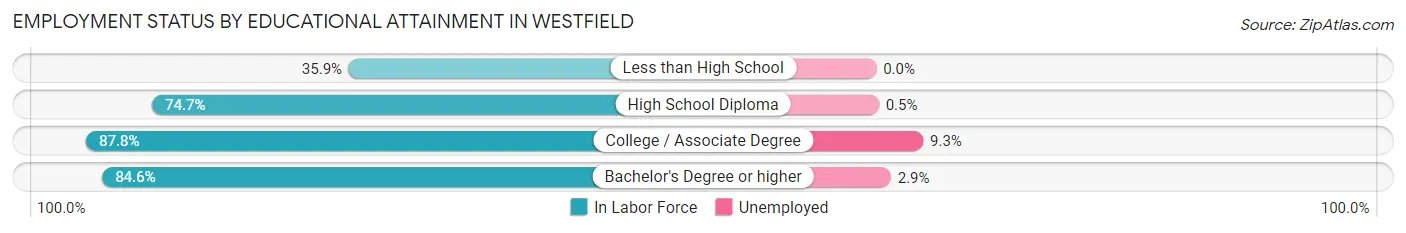
| Educational Attainment | In Labor Force | Unemployed |
| Less than High School | 14 (35.9%) | 0 (0.0%) |
| High School Diploma | 784 (74.7%) | 5 (0.5%) |
| College / Associate Degree | 1,405 (87.8%) | 149 (9.3%) |
| Bachelor's Degree or higher | 10,879 (84.6%) | 373 (2.9%) |
| Total | 13,075 (84.1%) | 529 (3.4%) |
Employment Occupations by Sex in Westfield
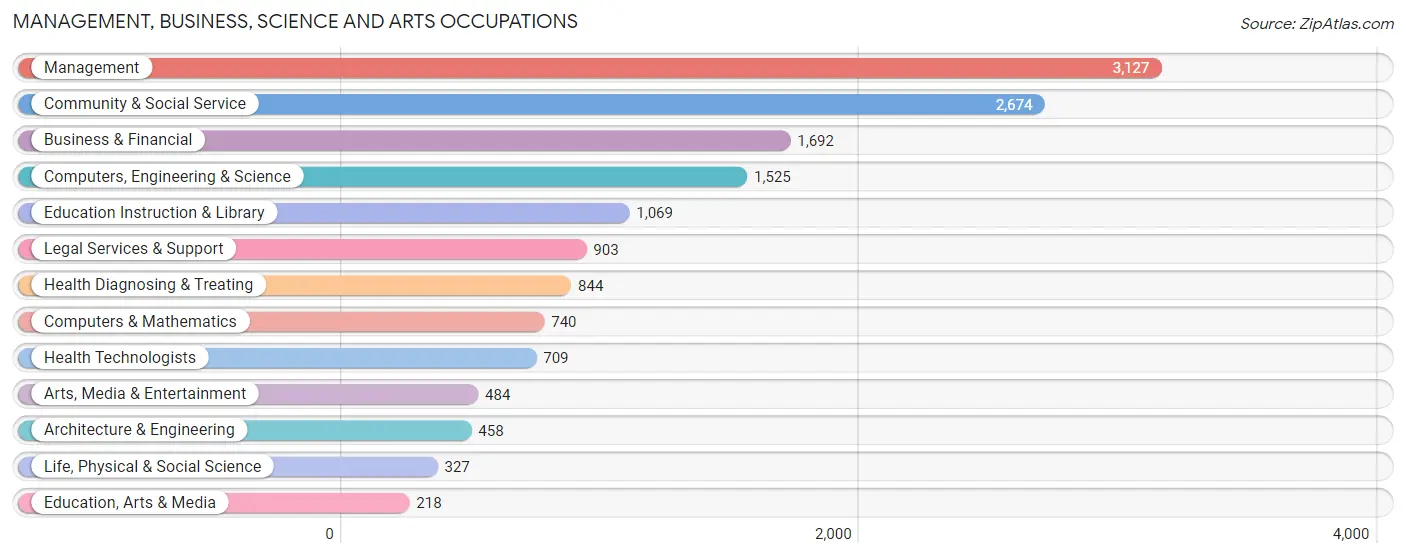
Management, Business, Science and Arts Occupations
The most common Management, Business, Science and Arts occupations in Westfield are Management (3,127 | 20.9%), Community & Social Service (2,674 | 17.8%), Business & Financial (1,692 | 11.3%), Computers, Engineering & Science (1,525 | 10.2%), and Education Instruction & Library (1,069 | 7.1%).
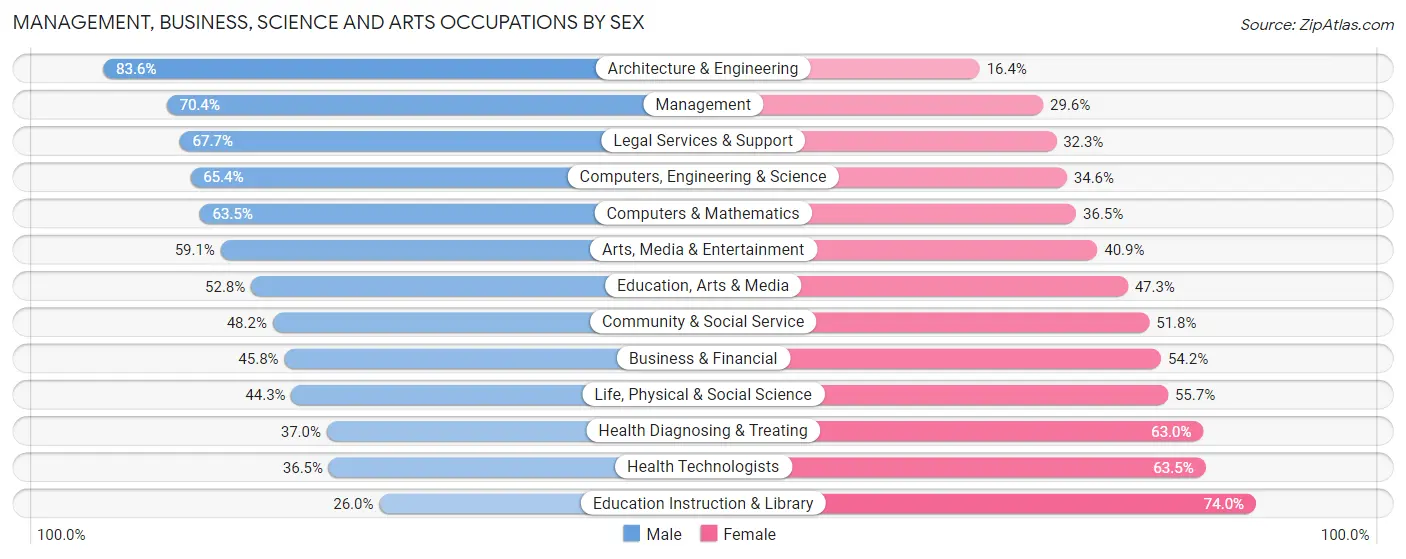
Management, Business, Science and Arts Occupations by Sex
Within the Management, Business, Science and Arts occupations in Westfield, the most male-oriented occupations are Architecture & Engineering (83.6%), Management (70.4%), and Legal Services & Support (67.7%), while the most female-oriented occupations are Education Instruction & Library (74.0%), Health Technologists (63.5%), and Health Diagnosing & Treating (63.0%).
| Occupation | Male | Female |
| Management | 2,201 (70.4%) | 926 (29.6%) |
| Business & Financial | 775 (45.8%) | 917 (54.2%) |
| Computers, Engineering & Science | 998 (65.4%) | 527 (34.6%) |
| Computers & Mathematics | 470 (63.5%) | 270 (36.5%) |
| Architecture & Engineering | 383 (83.6%) | 75 (16.4%) |
| Life, Physical & Social Science | 145 (44.3%) | 182 (55.7%) |
| Community & Social Service | 1,290 (48.2%) | 1,384 (51.8%) |
| Education, Arts & Media | 115 (52.7%) | 103 (47.2%) |
| Legal Services & Support | 611 (67.7%) | 292 (32.3%) |
| Education Instruction & Library | 278 (26.0%) | 791 (74.0%) |
| Arts, Media & Entertainment | 286 (59.1%) | 198 (40.9%) |
| Health Diagnosing & Treating | 312 (37.0%) | 532 (63.0%) |
| Health Technologists | 259 (36.5%) | 450 (63.5%) |
| Total (Category) | 5,576 (56.5%) | 4,286 (43.5%) |
| Total (Overall) | 8,372 (55.8%) | 6,619 (44.2%) |
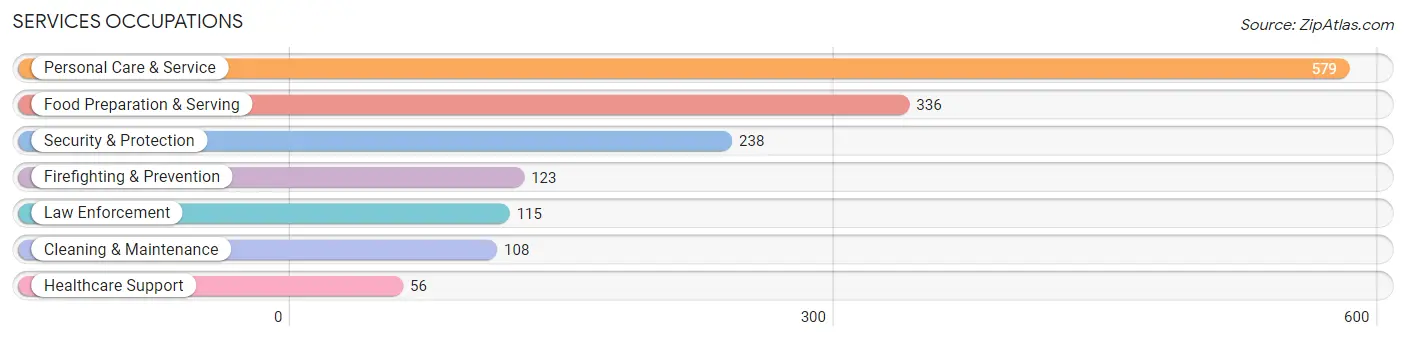
Services Occupations
The most common Services occupations in Westfield are Personal Care & Service (579 | 3.9%), Food Preparation & Serving (336 | 2.2%), Security & Protection (238 | 1.6%), Firefighting & Prevention (123 | 0.8%), and Law Enforcement (115 | 0.8%).
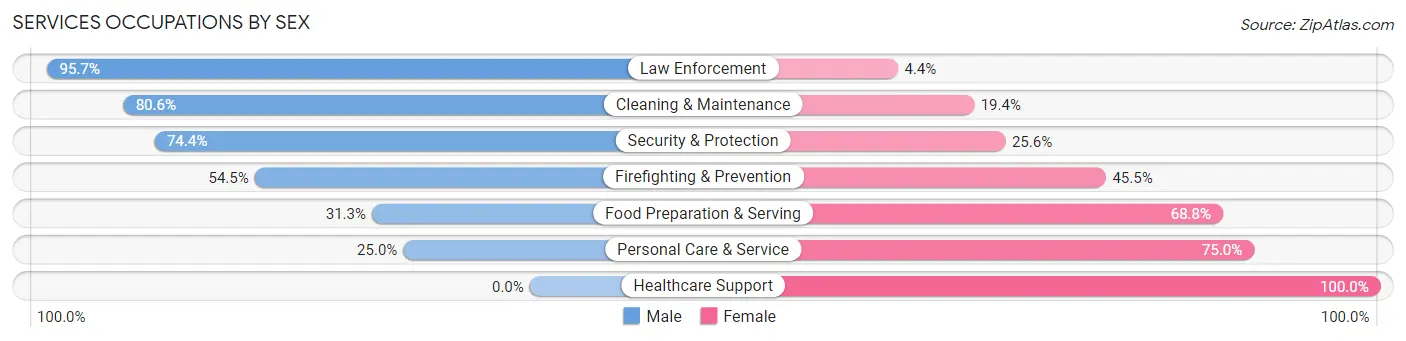
Services Occupations by Sex
Within the Services occupations in Westfield, the most male-oriented occupations are Law Enforcement (95.7%), Cleaning & Maintenance (80.6%), and Security & Protection (74.4%), while the most female-oriented occupations are Healthcare Support (100.0%), Personal Care & Service (75.0%), and Food Preparation & Serving (68.8%).
| Occupation | Male | Female |
| Healthcare Support | 0 (0.0%) | 56 (100.0%) |
| Security & Protection | 177 (74.4%) | 61 (25.6%) |
| Firefighting & Prevention | 67 (54.5%) | 56 (45.5%) |
| Law Enforcement | 110 (95.7%) | 5 (4.3%) |
| Food Preparation & Serving | 105 (31.2%) | 231 (68.8%) |
| Cleaning & Maintenance | 87 (80.6%) | 21 (19.4%) |
| Personal Care & Service | 145 (25.0%) | 434 (75.0%) |
| Total (Category) | 514 (39.0%) | 803 (61.0%) |
| Total (Overall) | 8,372 (55.8%) | 6,619 (44.2%) |
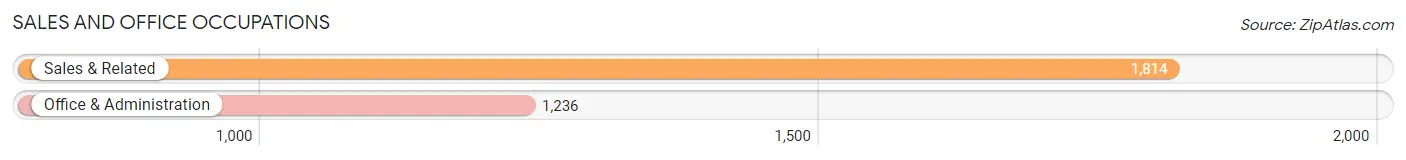
Sales and Office Occupations
The most common Sales and Office occupations in Westfield are Sales & Related (1,814 | 12.1%), and Office & Administration (1,236 | 8.2%).
Sales and Office Occupations by Sex
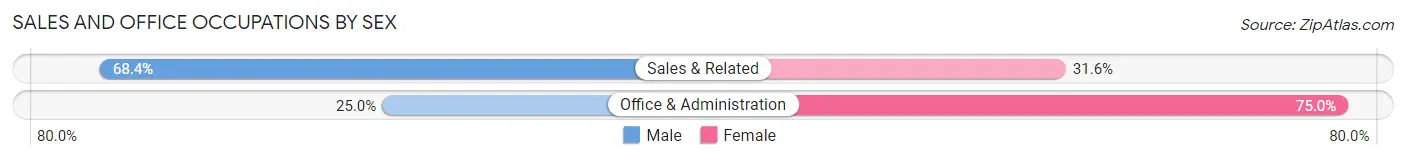
| Occupation | Male | Female |
| Sales & Related | 1,241 (68.4%) | 573 (31.6%) |
| Office & Administration | 309 (25.0%) | 927 (75.0%) |
| Total (Category) | 1,550 (50.8%) | 1,500 (49.2%) |
| Total (Overall) | 8,372 (55.8%) | 6,619 (44.2%) |
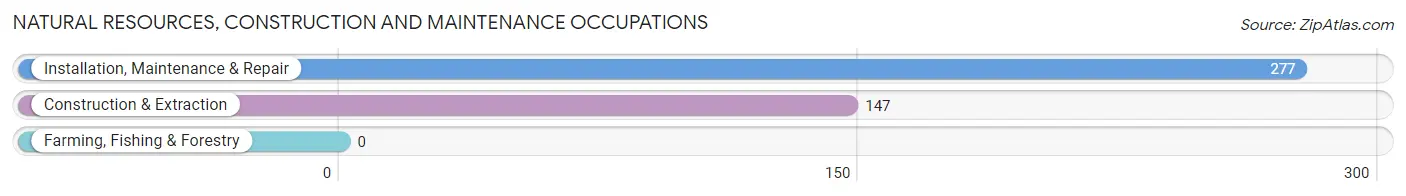
Natural Resources, Construction and Maintenance Occupations
The most common Natural Resources, Construction and Maintenance occupations in Westfield are Installation, Maintenance & Repair (277 | 1.8%), and Construction & Extraction (147 | 1.0%).
Natural Resources, Construction and Maintenance Occupations by Sex
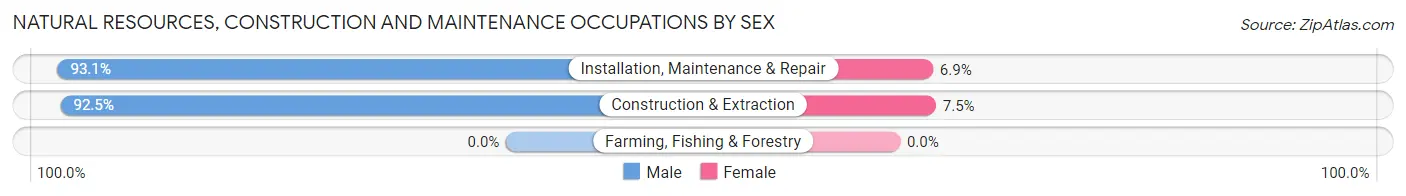
| Occupation | Male | Female |
| Farming, Fishing & Forestry | 0 (0.0%) | 0 (0.0%) |
| Construction & Extraction | 136 (92.5%) | 11 (7.5%) |
| Installation, Maintenance & Repair | 258 (93.1%) | 19 (6.9%) |
| Total (Category) | 394 (92.9%) | 30 (7.1%) |
| Total (Overall) | 8,372 (55.8%) | 6,619 (44.2%) |
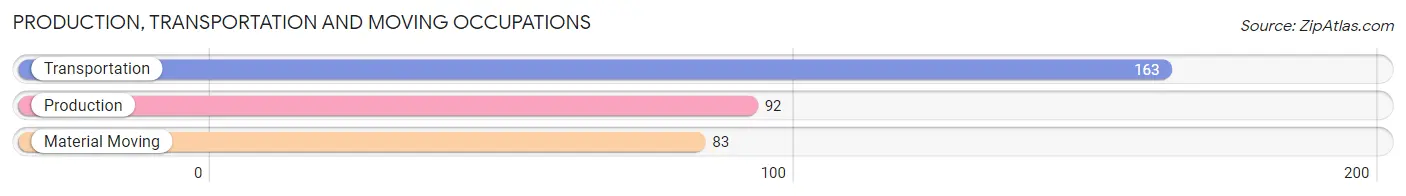
Production, Transportation and Moving Occupations
The most common Production, Transportation and Moving occupations in Westfield are Transportation (163 | 1.1%), Production (92 | 0.6%), and Material Moving (83 | 0.5%).
Production, Transportation and Moving Occupations by Sex
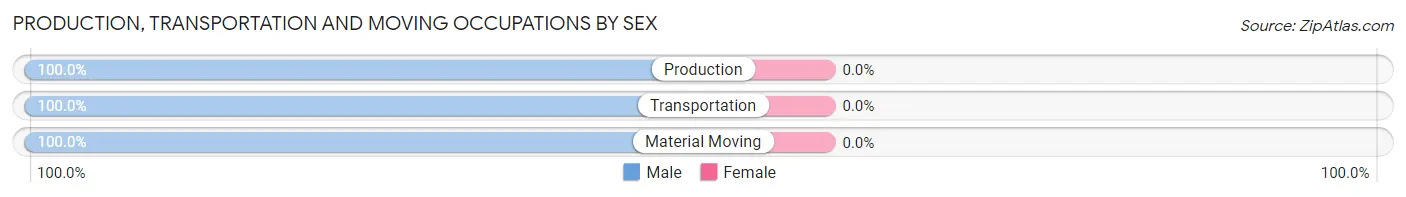
| Occupation | Male | Female |
| Production | 92 (100.0%) | 0 (0.0%) |
| Transportation | 163 (100.0%) | 0 (0.0%) |
| Material Moving | 83 (100.0%) | 0 (0.0%) |
| Total (Category) | 338 (100.0%) | 0 (0.0%) |
| Total (Overall) | 8,372 (55.8%) | 6,619 (44.2%) |
Employment Industries by Sex in Westfield
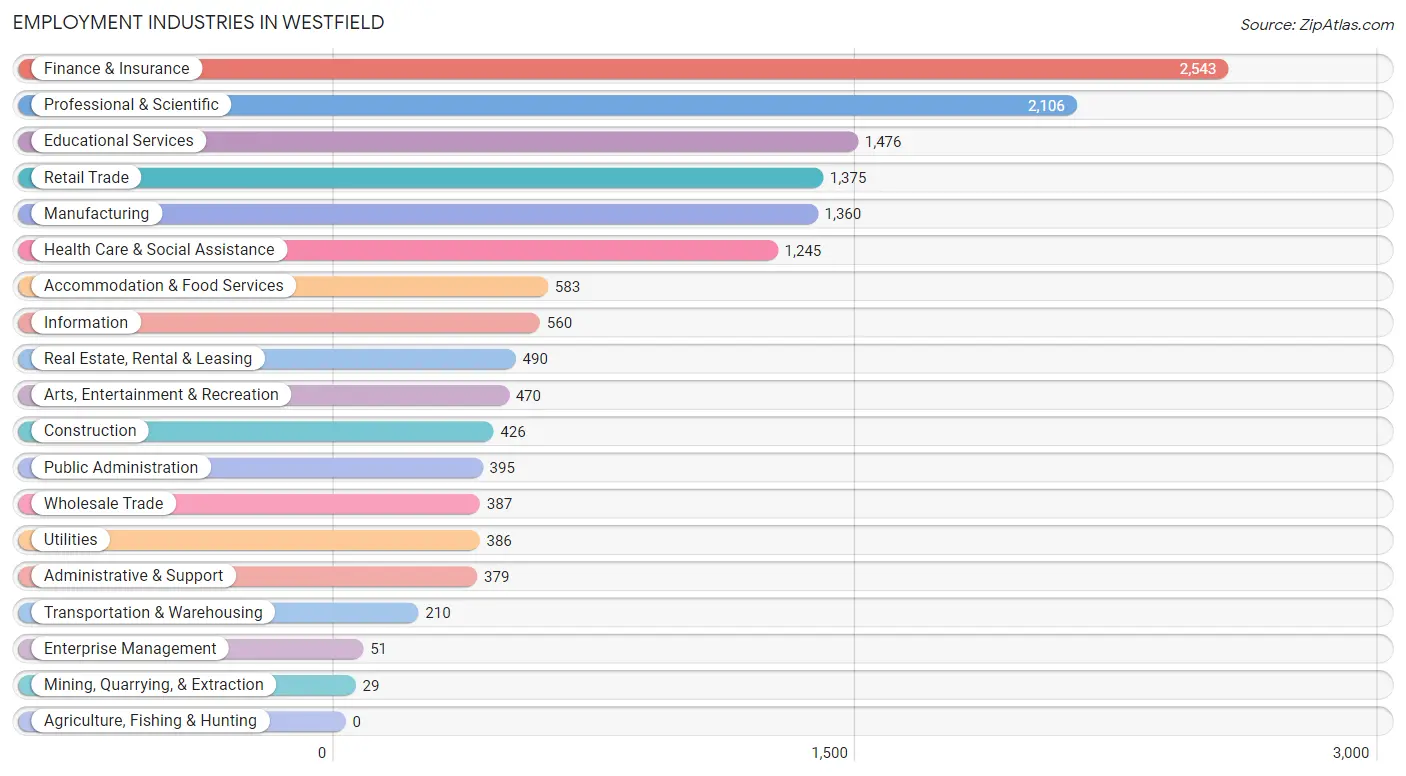
Employment Industries in Westfield
The major employment industries in Westfield include Finance & Insurance (2,543 | 17.0%), Professional & Scientific (2,106 | 14.1%), Educational Services (1,476 | 9.9%), Retail Trade (1,375 | 9.2%), and Manufacturing (1,360 | 9.1%).
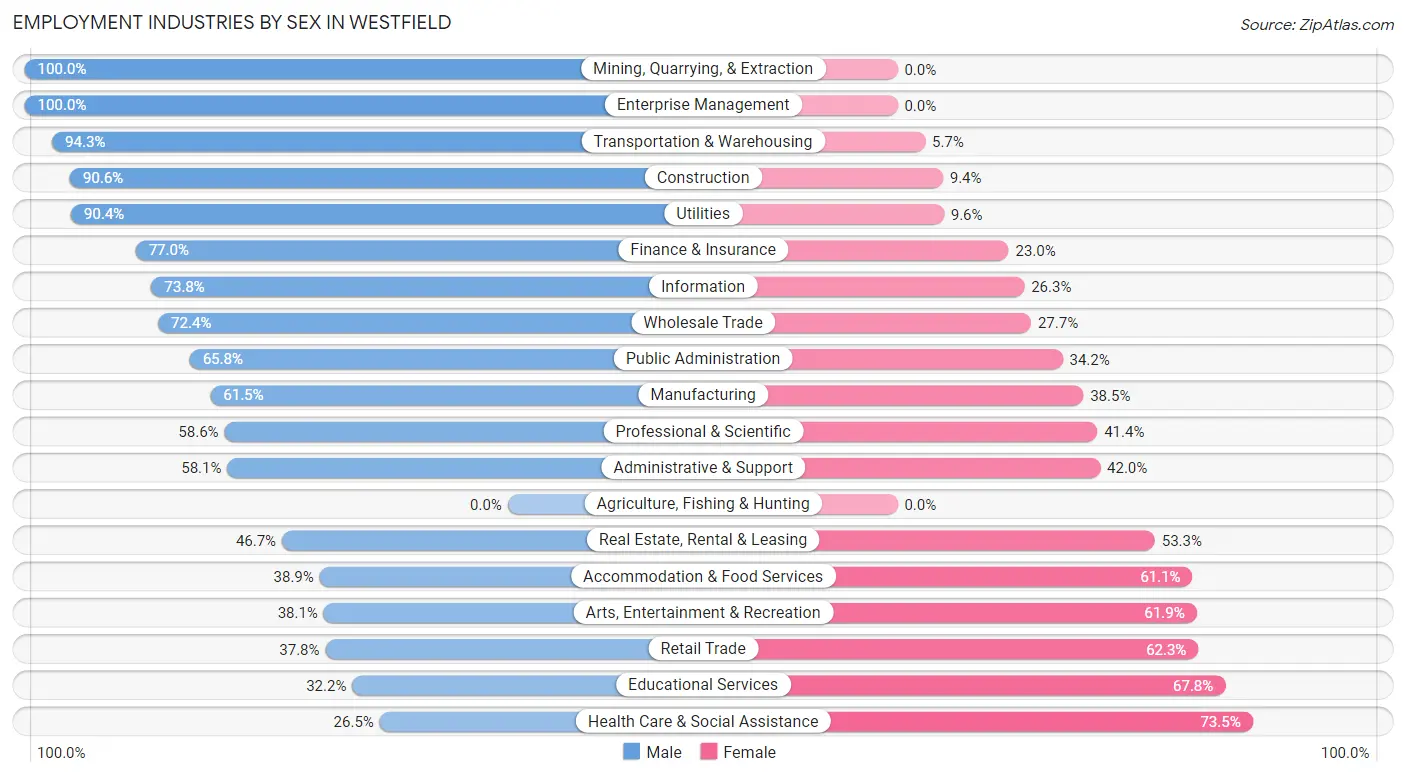
Employment Industries by Sex in Westfield
The Westfield industries that see more men than women are Mining, Quarrying, & Extraction (100.0%), Enterprise Management (100.0%), and Transportation & Warehousing (94.3%), whereas the industries that tend to have a higher number of women are Health Care & Social Assistance (73.5%), Educational Services (67.8%), and Retail Trade (62.3%).
| Industry | Male | Female |
| Agriculture, Fishing & Hunting | 0 (0.0%) | 0 (0.0%) |
| Mining, Quarrying, & Extraction | 29 (100.0%) | 0 (0.0%) |
| Construction | 386 (90.6%) | 40 (9.4%) |
| Manufacturing | 837 (61.5%) | 523 (38.5%) |
| Wholesale Trade | 280 (72.4%) | 107 (27.7%) |
| Retail Trade | 519 (37.8%) | 856 (62.3%) |
| Transportation & Warehousing | 198 (94.3%) | 12 (5.7%) |
| Utilities | 349 (90.4%) | 37 (9.6%) |
| Information | 413 (73.8%) | 147 (26.3%) |
| Finance & Insurance | 1,958 (77.0%) | 585 (23.0%) |
| Real Estate, Rental & Leasing | 229 (46.7%) | 261 (53.3%) |
| Professional & Scientific | 1,235 (58.6%) | 871 (41.4%) |
| Enterprise Management | 51 (100.0%) | 0 (0.0%) |
| Administrative & Support | 220 (58.1%) | 159 (41.9%) |
| Educational Services | 475 (32.2%) | 1,001 (67.8%) |
| Health Care & Social Assistance | 330 (26.5%) | 915 (73.5%) |
| Arts, Entertainment & Recreation | 179 (38.1%) | 291 (61.9%) |
| Accommodation & Food Services | 227 (38.9%) | 356 (61.1%) |
| Public Administration | 260 (65.8%) | 135 (34.2%) |
| Total | 8,372 (55.8%) | 6,619 (44.2%) |
Education in Westfield
School Enrollment in Westfield
The most common levels of schooling among the 9,202 students in Westfield are high school (2,107 | 22.9%), elementary school (2,054 | 22.3%), and middle school (2,007 | 21.8%).
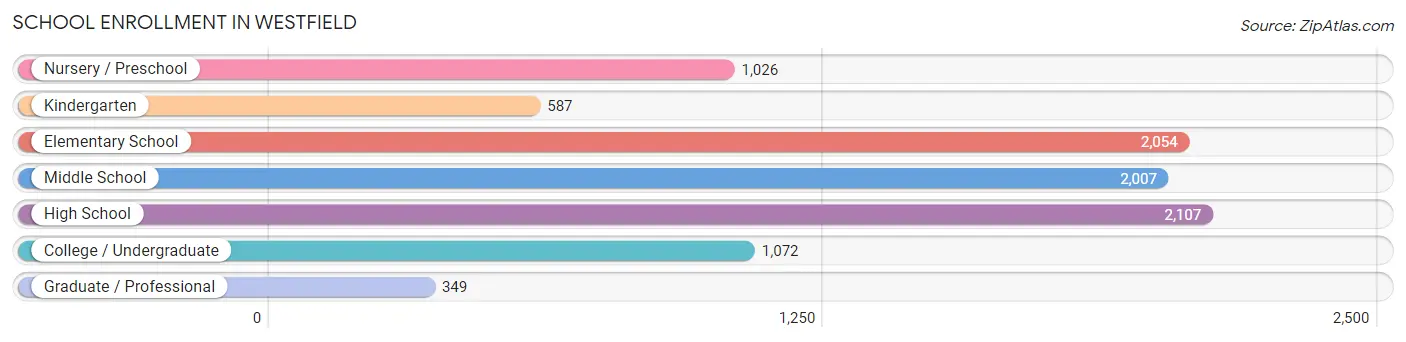
| School Level | # Students | % Students |
| Nursery / Preschool | 1,026 | 11.2% |
| Kindergarten | 587 | 6.4% |
| Elementary School | 2,054 | 22.3% |
| Middle School | 2,007 | 21.8% |
| High School | 2,107 | 22.9% |
| College / Undergraduate | 1,072 | 11.7% |
| Graduate / Professional | 349 | 3.8% |
| Total | 9,202 | 100.0% |
School Enrollment by Age by Funding Source in Westfield
Out of a total of 9,202 students who are enrolled in schools in Westfield, 2,107 (22.9%) attend a private institution, while the remaining 7,095 (77.1%) are enrolled in public schools. The age group of 3 to 4 year olds has the highest likelihood of being enrolled in private schools, with 669 (74.3% in the age bracket) enrolled. Conversely, the age group of 10 to 14 year olds has the lowest likelihood of being enrolled in a private school, with 2,542 (97.8% in the age bracket) attending a public institution.
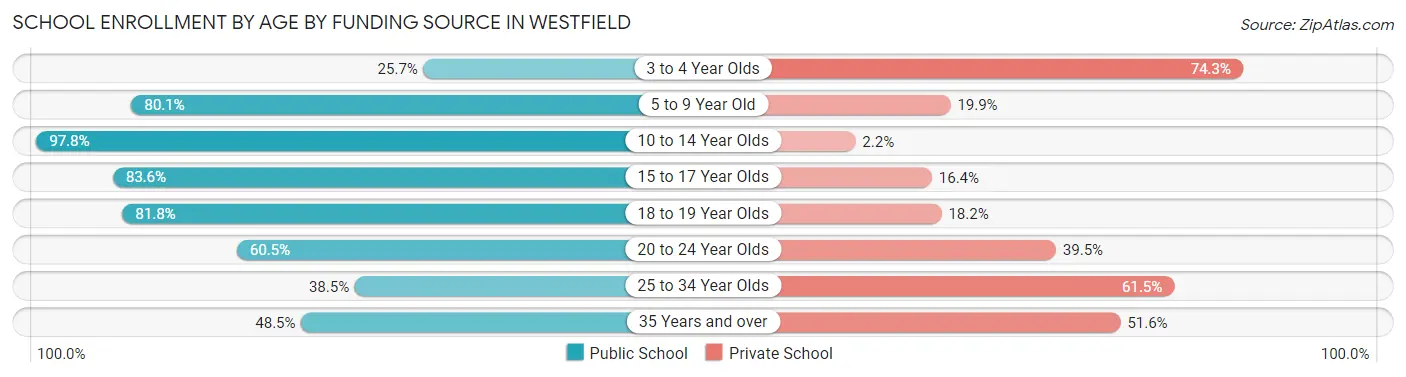
| Age Bracket | Public School | Private School |
| 3 to 4 Year Olds | 231 (25.7%) | 669 (74.3%) |
| 5 to 9 Year Old | 1,986 (80.1%) | 493 (19.9%) |
| 10 to 14 Year Olds | 2,542 (97.8%) | 57 (2.2%) |
| 15 to 17 Year Olds | 1,190 (83.6%) | 234 (16.4%) |
| 18 to 19 Year Olds | 570 (81.8%) | 127 (18.2%) |
| 20 to 24 Year Olds | 361 (60.5%) | 236 (39.5%) |
| 25 to 34 Year Olds | 120 (38.5%) | 192 (61.5%) |
| 35 Years and over | 94 (48.4%) | 100 (51.5%) |
| Total | 7,095 (77.1%) | 2,107 (22.9%) |
Educational Attainment by Field of Study in Westfield
Business (4,040 | 24.1%), social sciences (2,424 | 14.5%), education (1,621 | 9.7%), computers & mathematics (1,161 | 6.9%), and bio, nature & agricultural (1,010 | 6.0%) are the most common fields of study among 16,766 individuals in Westfield who have obtained a bachelor's degree or higher.
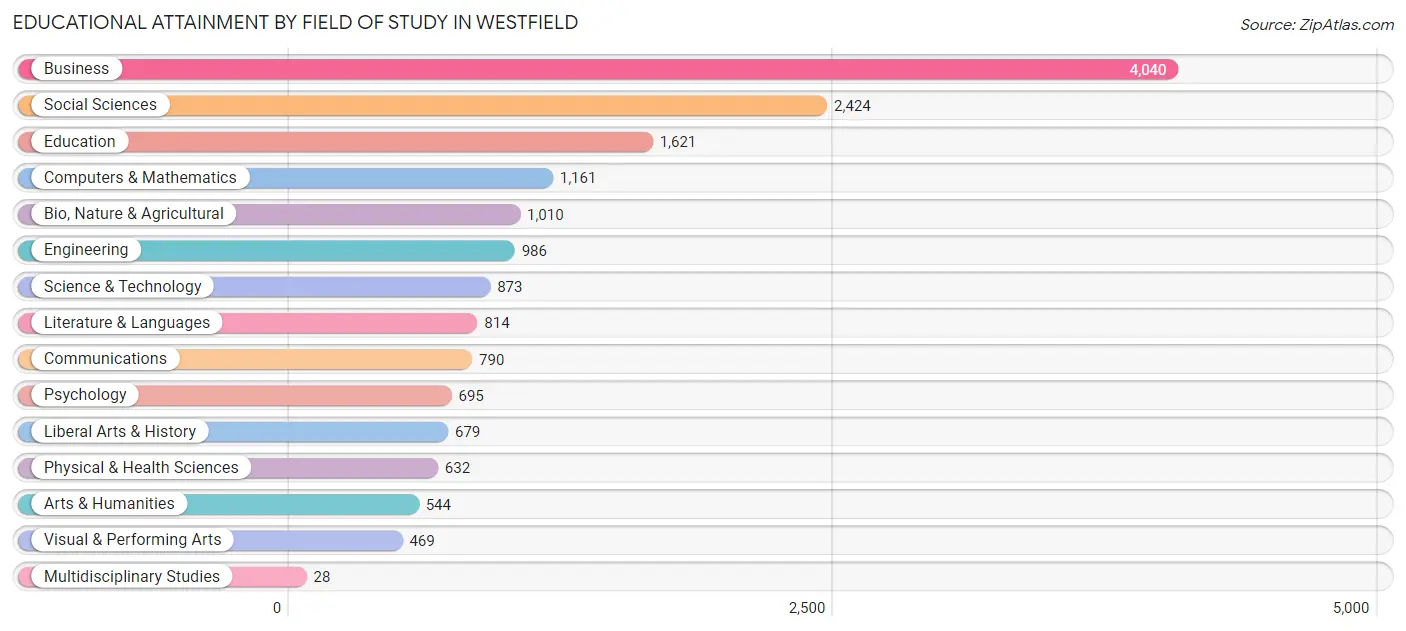
| Field of Study | # Graduates | % Graduates |
| Computers & Mathematics | 1,161 | 6.9% |
| Bio, Nature & Agricultural | 1,010 | 6.0% |
| Physical & Health Sciences | 632 | 3.8% |
| Psychology | 695 | 4.2% |
| Social Sciences | 2,424 | 14.5% |
| Engineering | 986 | 5.9% |
| Multidisciplinary Studies | 28 | 0.2% |
| Science & Technology | 873 | 5.2% |
| Business | 4,040 | 24.1% |
| Education | 1,621 | 9.7% |
| Literature & Languages | 814 | 4.9% |
| Liberal Arts & History | 679 | 4.1% |
| Visual & Performing Arts | 469 | 2.8% |
| Communications | 790 | 4.7% |
| Arts & Humanities | 544 | 3.2% |
| Total | 16,766 | 100.0% |
Transportation & Commute in Westfield
Vehicle Availability by Sex in Westfield
The most prevalent vehicle ownership categories in Westfield are males with 2 vehicles (4,369, accounting for 52.6%) and females with 2 vehicles (3,131, making up 67.3%).
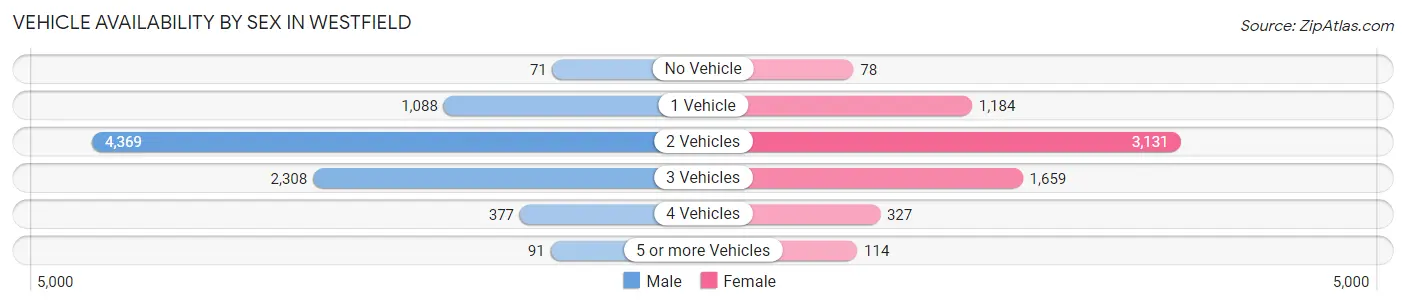
| Vehicles Available | Male | Female |
| No Vehicle | 71 (0.9%) | 78 (1.2%) |
| 1 Vehicle | 1,088 (13.1%) | 1,184 (18.2%) |
| 2 Vehicles | 4,369 (52.6%) | 3,131 (48.2%) |
| 3 Vehicles | 2,308 (27.8%) | 1,659 (25.6%) |
| 4 Vehicles | 377 (4.5%) | 327 (5.0%) |
| 5 or more Vehicles | 91 (1.1%) | 114 (1.8%) |
| Total | 8,304 (100.0%) | 6,493 (100.0%) |
Commute Time in Westfield
The most frequently occuring commute durations in Westfield are 60 to 89 minutes (1,531 commuters, 14.6%), 15 to 19 minutes (1,339 commuters, 12.8%), and 30 to 34 minutes (1,237 commuters, 11.8%).
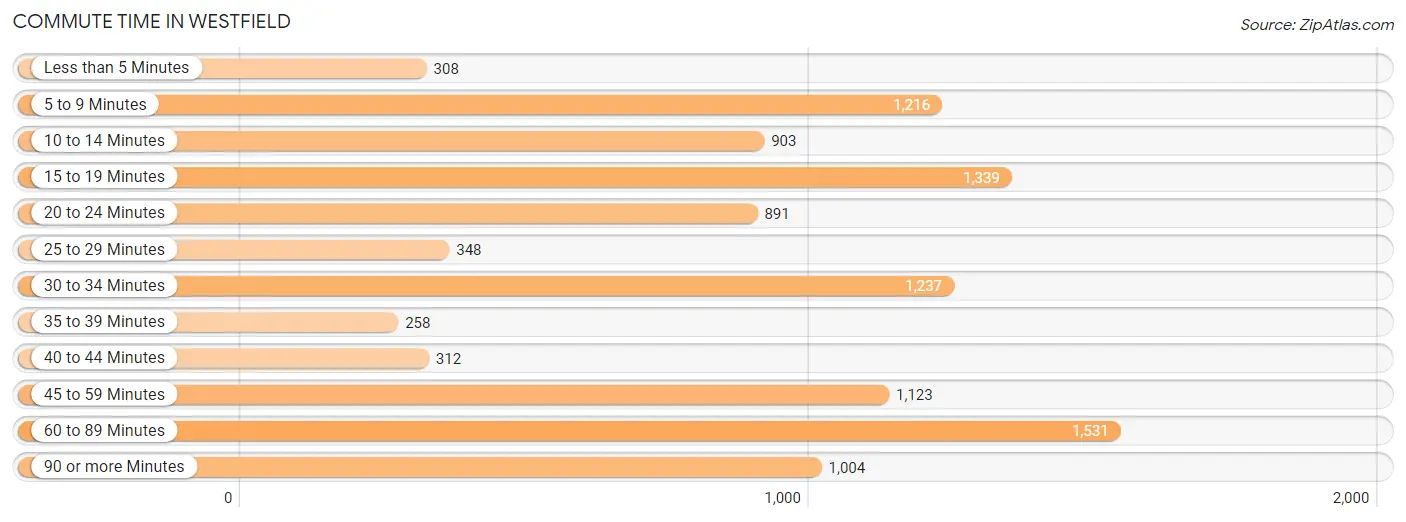
| Commute Time | # Commuters | % Commuters |
| Less than 5 Minutes | 308 | 2.9% |
| 5 to 9 Minutes | 1,216 | 11.6% |
| 10 to 14 Minutes | 903 | 8.6% |
| 15 to 19 Minutes | 1,339 | 12.8% |
| 20 to 24 Minutes | 891 | 8.5% |
| 25 to 29 Minutes | 348 | 3.3% |
| 30 to 34 Minutes | 1,237 | 11.8% |
| 35 to 39 Minutes | 258 | 2.5% |
| 40 to 44 Minutes | 312 | 3.0% |
| 45 to 59 Minutes | 1,123 | 10.7% |
| 60 to 89 Minutes | 1,531 | 14.6% |
| 90 or more Minutes | 1,004 | 9.6% |
Commute Time by Sex in Westfield
The most common commute times in Westfield are 60 to 89 minutes (1,202 commuters, 20.0%) for males and 5 to 9 minutes (734 commuters, 16.5%) for females.
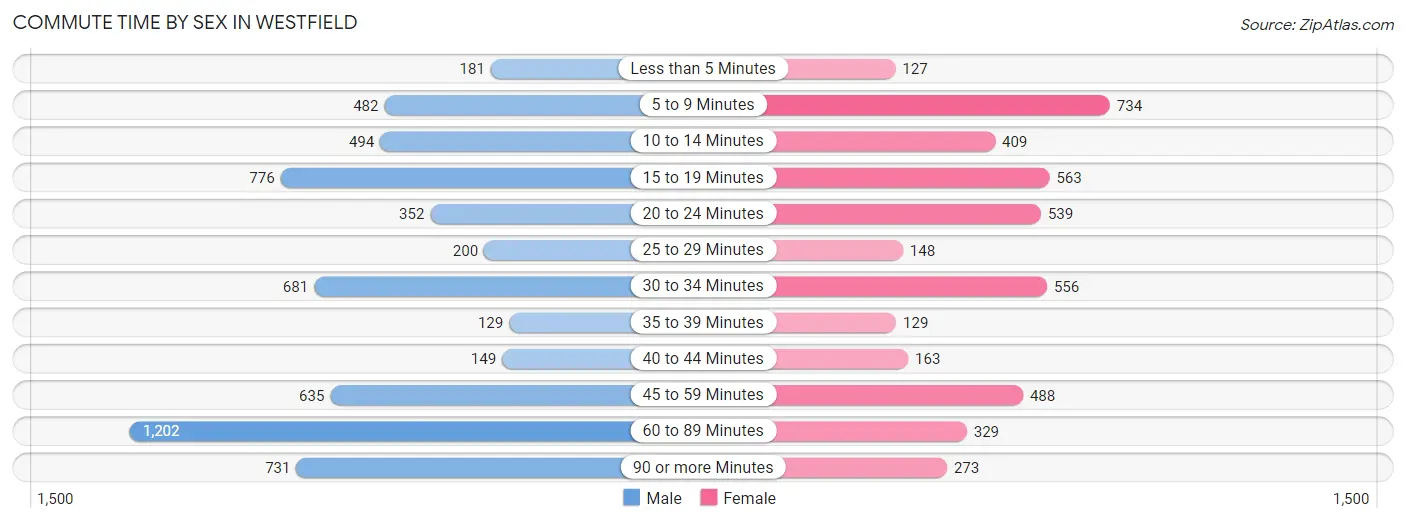
| Commute Time | Male | Female |
| Less than 5 Minutes | 181 (3.0%) | 127 (2.9%) |
| 5 to 9 Minutes | 482 (8.0%) | 734 (16.5%) |
| 10 to 14 Minutes | 494 (8.2%) | 409 (9.2%) |
| 15 to 19 Minutes | 776 (12.9%) | 563 (12.6%) |
| 20 to 24 Minutes | 352 (5.9%) | 539 (12.1%) |
| 25 to 29 Minutes | 200 (3.3%) | 148 (3.3%) |
| 30 to 34 Minutes | 681 (11.3%) | 556 (12.5%) |
| 35 to 39 Minutes | 129 (2.1%) | 129 (2.9%) |
| 40 to 44 Minutes | 149 (2.5%) | 163 (3.7%) |
| 45 to 59 Minutes | 635 (10.6%) | 488 (11.0%) |
| 60 to 89 Minutes | 1,202 (20.0%) | 329 (7.4%) |
| 90 or more Minutes | 731 (12.2%) | 273 (6.1%) |
Time of Departure to Work by Sex in Westfield
The most frequent times of departure to work in Westfield are 7:00 AM to 7:29 AM (1,154, 19.2%) for males and 8:00 AM to 8:29 AM (979, 22.0%) for females.
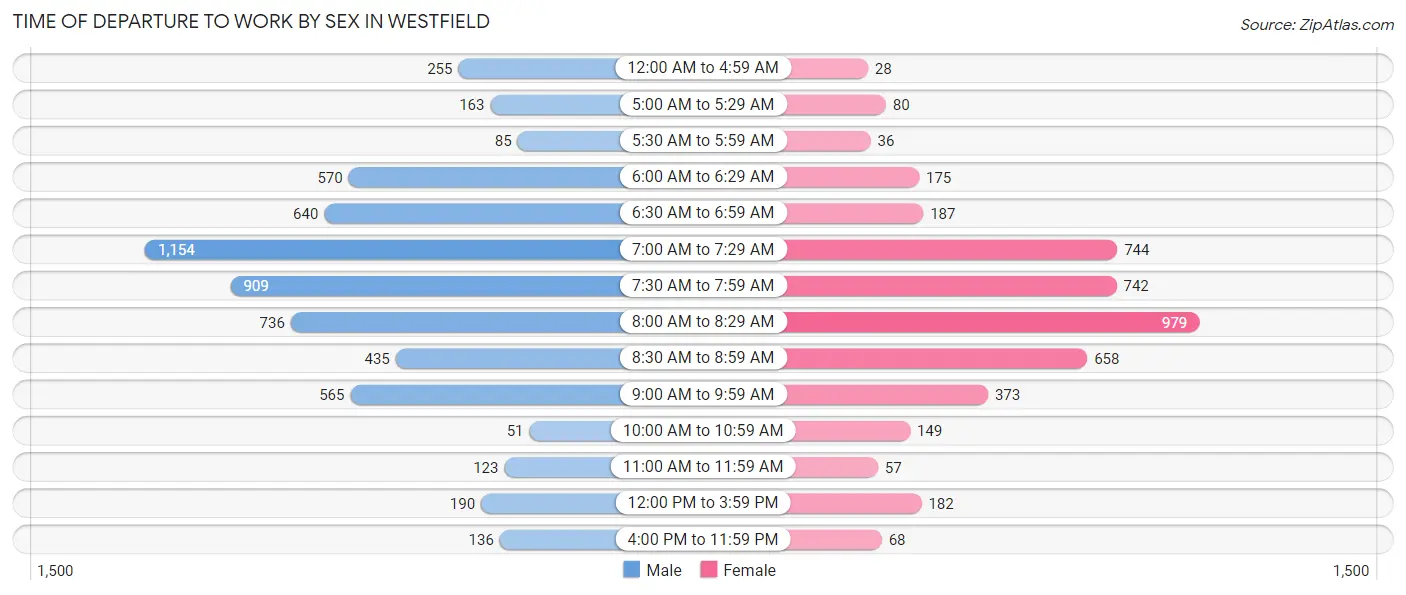
| Time of Departure | Male | Female |
| 12:00 AM to 4:59 AM | 255 (4.2%) | 28 (0.6%) |
| 5:00 AM to 5:29 AM | 163 (2.7%) | 80 (1.8%) |
| 5:30 AM to 5:59 AM | 85 (1.4%) | 36 (0.8%) |
| 6:00 AM to 6:29 AM | 570 (9.5%) | 175 (3.9%) |
| 6:30 AM to 6:59 AM | 640 (10.6%) | 187 (4.2%) |
| 7:00 AM to 7:29 AM | 1,154 (19.2%) | 744 (16.7%) |
| 7:30 AM to 7:59 AM | 909 (15.1%) | 742 (16.6%) |
| 8:00 AM to 8:29 AM | 736 (12.2%) | 979 (22.0%) |
| 8:30 AM to 8:59 AM | 435 (7.2%) | 658 (14.8%) |
| 9:00 AM to 9:59 AM | 565 (9.4%) | 373 (8.4%) |
| 10:00 AM to 10:59 AM | 51 (0.9%) | 149 (3.3%) |
| 11:00 AM to 11:59 AM | 123 (2.1%) | 57 (1.3%) |
| 12:00 PM to 3:59 PM | 190 (3.2%) | 182 (4.1%) |
| 4:00 PM to 11:59 PM | 136 (2.3%) | 68 (1.5%) |
| Total | 6,012 (100.0%) | 4,458 (100.0%) |
Housing Occupancy in Westfield
Occupancy by Ownership in Westfield
Of the total 10,426 dwellings in Westfield, owner-occupied units account for 8,318 (79.8%), while renter-occupied units make up 2,108 (20.2%).
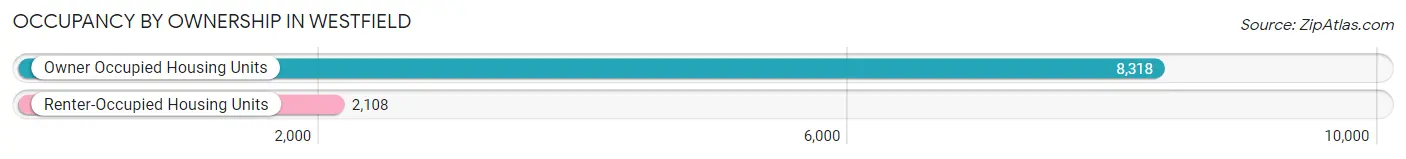
| Occupancy | # Housing Units | % Housing Units |
| Owner Occupied Housing Units | 8,318 | 79.8% |
| Renter-Occupied Housing Units | 2,108 | 20.2% |
| Total Occupied Housing Units | 10,426 | 100.0% |
Occupancy by Household Size in Westfield
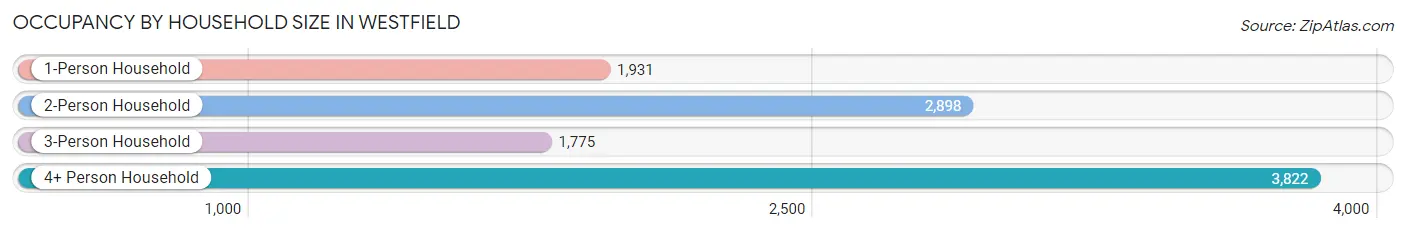
| Household Size | # Housing Units | % Housing Units |
| 1-Person Household | 1,931 | 18.5% |
| 2-Person Household | 2,898 | 27.8% |
| 3-Person Household | 1,775 | 17.0% |
| 4+ Person Household | 3,822 | 36.7% |
| Total Housing Units | 10,426 | 100.0% |
Occupancy by Ownership by Household Size in Westfield
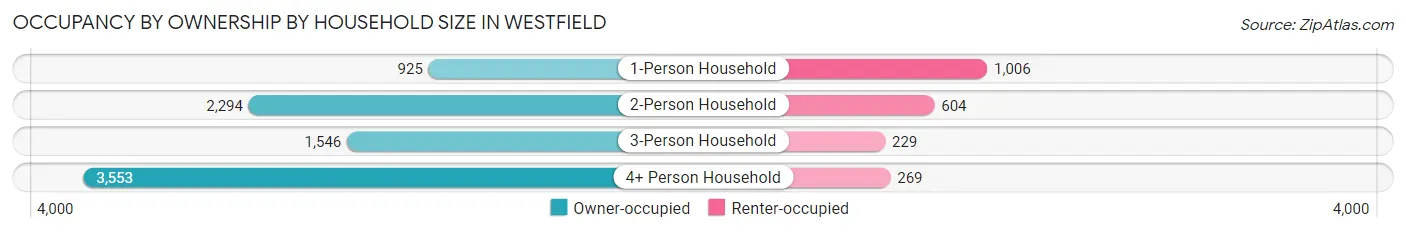
| Household Size | Owner-occupied | Renter-occupied |
| 1-Person Household | 925 (47.9%) | 1,006 (52.1%) |
| 2-Person Household | 2,294 (79.2%) | 604 (20.8%) |
| 3-Person Household | 1,546 (87.1%) | 229 (12.9%) |
| 4+ Person Household | 3,553 (93.0%) | 269 (7.0%) |
| Total Housing Units | 8,318 (79.8%) | 2,108 (20.2%) |
Occupancy by Educational Attainment in Westfield
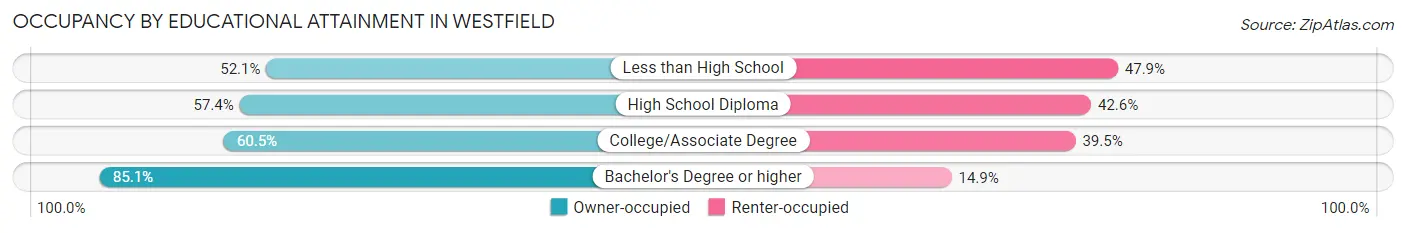
| Household Size | Owner-occupied | Renter-occupied |
| Less than High School | 75 (52.1%) | 69 (47.9%) |
| High School Diploma | 466 (57.4%) | 346 (42.6%) |
| College/Associate Degree | 684 (60.5%) | 447 (39.5%) |
| Bachelor's Degree or higher | 7,093 (85.1%) | 1,246 (14.9%) |
Occupancy by Age of Householder in Westfield
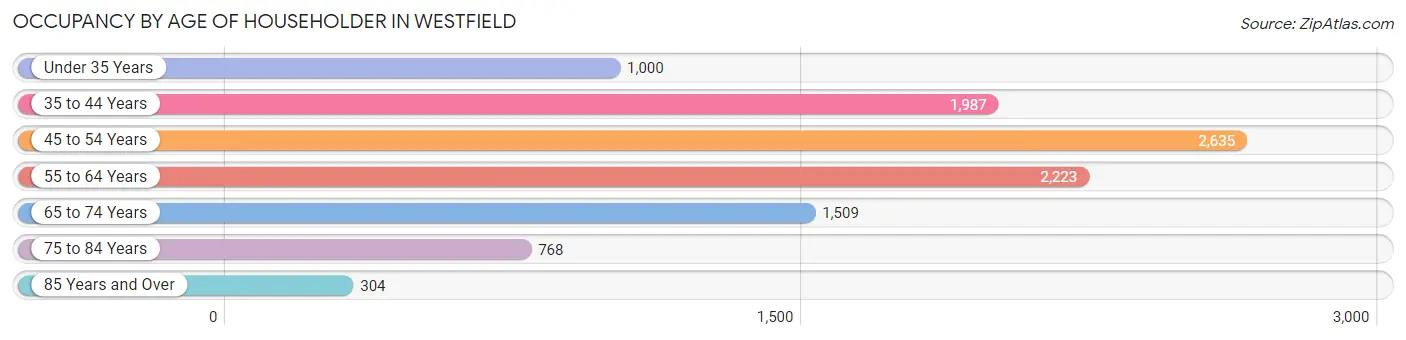
| Age Bracket | # Households | % Households |
| Under 35 Years | 1,000 | 9.6% |
| 35 to 44 Years | 1,987 | 19.1% |
| 45 to 54 Years | 2,635 | 25.3% |
| 55 to 64 Years | 2,223 | 21.3% |
| 65 to 74 Years | 1,509 | 14.5% |
| 75 to 84 Years | 768 | 7.4% |
| 85 Years and Over | 304 | 2.9% |
| Total | 10,426 | 100.0% |
Housing Finances in Westfield
Median Income by Occupancy in Westfield
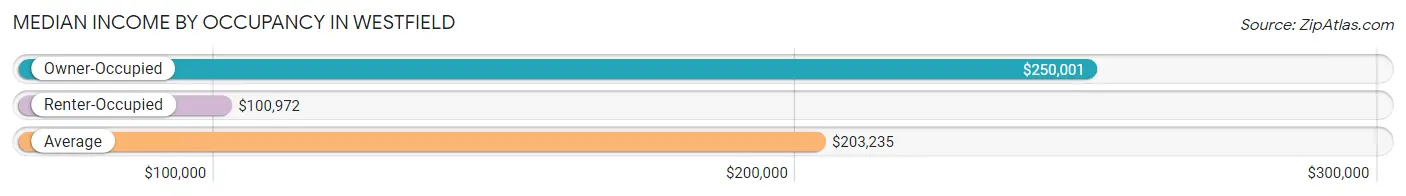
| Occupancy Type | # Households | Median Income |
| Owner-Occupied | 8,318 (79.8%) | $250,001 |
| Renter-Occupied | 2,108 (20.2%) | $100,972 |
| Average | 10,426 (100.0%) | $203,235 |
Occupancy by Householder Income Bracket in Westfield
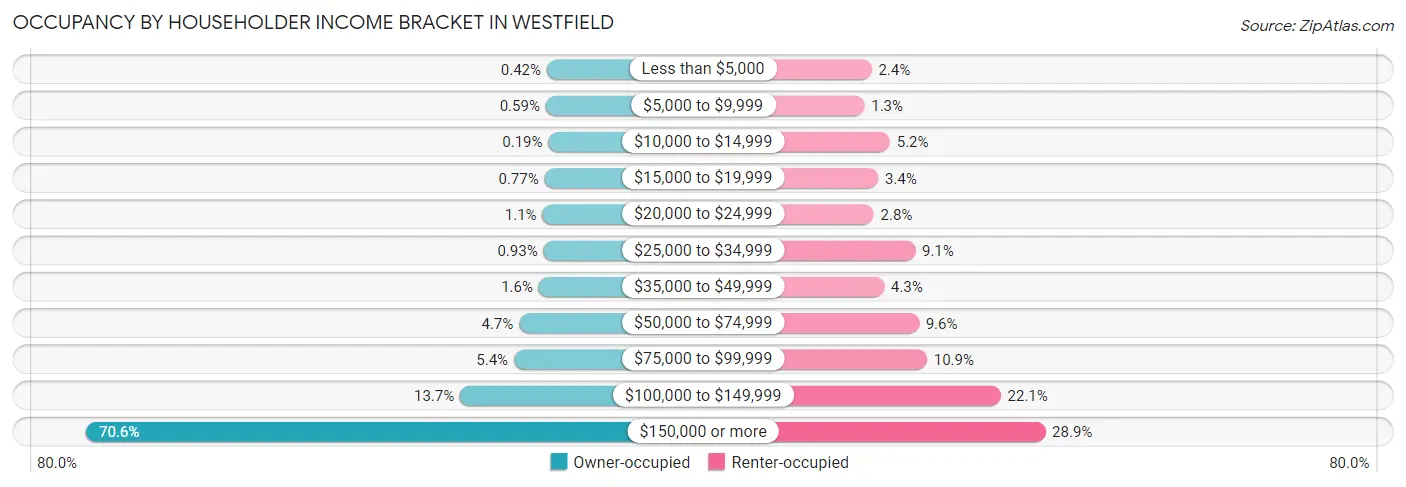
| Income Bracket | Owner-occupied | Renter-occupied |
| Less than $5,000 | 35 (0.4%) | 51 (2.4%) |
| $5,000 to $9,999 | 49 (0.6%) | 28 (1.3%) |
| $10,000 to $14,999 | 16 (0.2%) | 110 (5.2%) |
| $15,000 to $19,999 | 64 (0.8%) | 72 (3.4%) |
| $20,000 to $24,999 | 91 (1.1%) | 58 (2.8%) |
| $25,000 to $34,999 | 77 (0.9%) | 191 (9.1%) |
| $35,000 to $49,999 | 136 (1.6%) | 91 (4.3%) |
| $50,000 to $74,999 | 388 (4.7%) | 203 (9.6%) |
| $75,000 to $99,999 | 452 (5.4%) | 229 (10.9%) |
| $100,000 to $149,999 | 1,135 (13.7%) | 466 (22.1%) |
| $150,000 or more | 5,875 (70.6%) | 609 (28.9%) |
| Total | 8,318 (100.0%) | 2,108 (100.0%) |
Monthly Housing Cost Tiers in Westfield
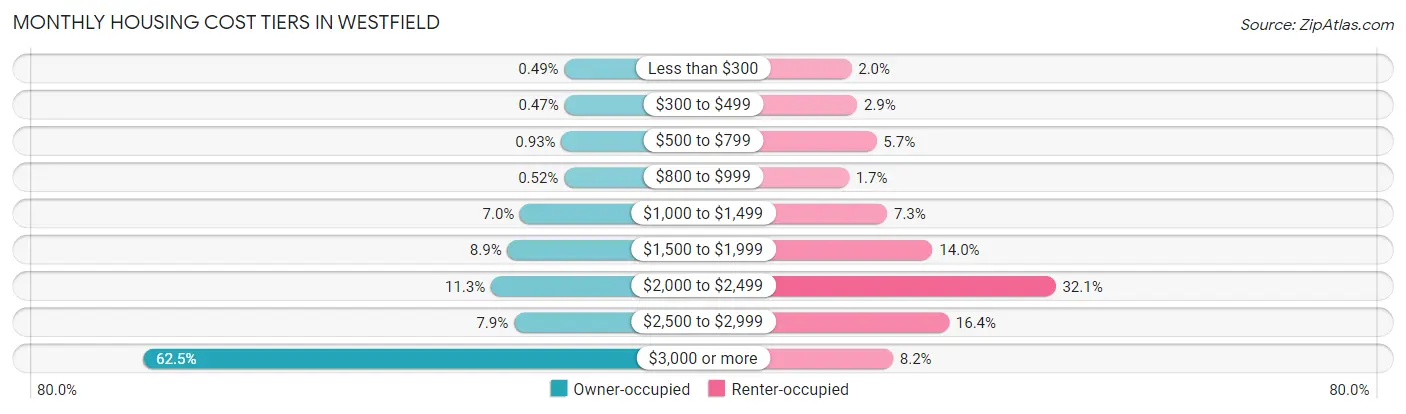
| Monthly Cost | Owner-occupied | Renter-occupied |
| Less than $300 | 41 (0.5%) | 43 (2.0%) |
| $300 to $499 | 39 (0.5%) | 61 (2.9%) |
| $500 to $799 | 77 (0.9%) | 121 (5.7%) |
| $800 to $999 | 43 (0.5%) | 35 (1.7%) |
| $1,000 to $1,499 | 582 (7.0%) | 154 (7.3%) |
| $1,500 to $1,999 | 738 (8.9%) | 295 (14.0%) |
| $2,000 to $2,499 | 939 (11.3%) | 677 (32.1%) |
| $2,500 to $2,999 | 657 (7.9%) | 346 (16.4%) |
| $3,000 or more | 5,202 (62.5%) | 172 (8.2%) |
| Total | 8,318 (100.0%) | 2,108 (100.0%) |
Physical Housing Characteristics in Westfield
Housing Structures in Westfield
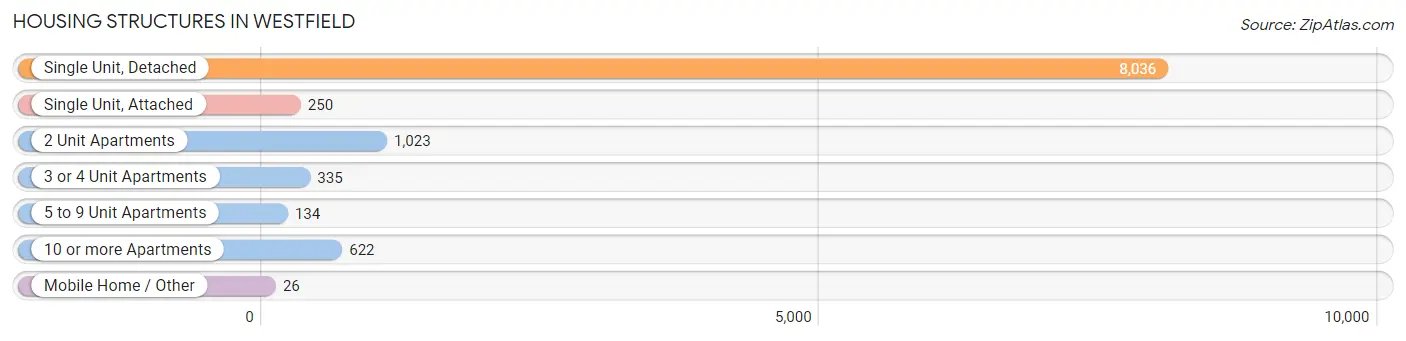
| Structure Type | # Housing Units | % Housing Units |
| Single Unit, Detached | 8,036 | 77.1% |
| Single Unit, Attached | 250 | 2.4% |
| 2 Unit Apartments | 1,023 | 9.8% |
| 3 or 4 Unit Apartments | 335 | 3.2% |
| 5 to 9 Unit Apartments | 134 | 1.3% |
| 10 or more Apartments | 622 | 6.0% |
| Mobile Home / Other | 26 | 0.3% |
| Total | 10,426 | 100.0% |
Housing Structures by Occupancy in Westfield
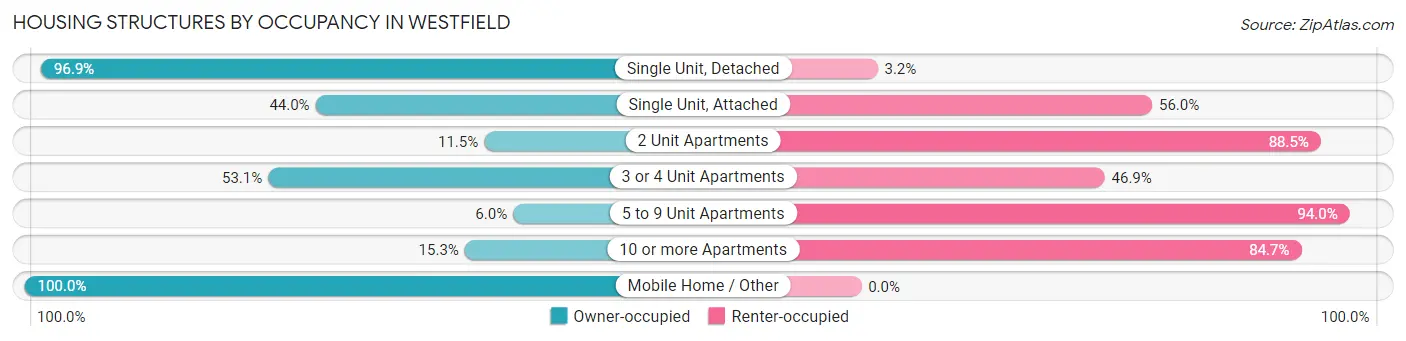
| Structure Type | Owner-occupied | Renter-occupied |
| Single Unit, Detached | 7,783 (96.9%) | 253 (3.2%) |
| Single Unit, Attached | 110 (44.0%) | 140 (56.0%) |
| 2 Unit Apartments | 118 (11.5%) | 905 (88.5%) |
| 3 or 4 Unit Apartments | 178 (53.1%) | 157 (46.9%) |
| 5 to 9 Unit Apartments | 8 (6.0%) | 126 (94.0%) |
| 10 or more Apartments | 95 (15.3%) | 527 (84.7%) |
| Mobile Home / Other | 26 (100.0%) | 0 (0.0%) |
| Total | 8,318 (79.8%) | 2,108 (20.2%) |
Housing Structures by Number of Rooms in Westfield
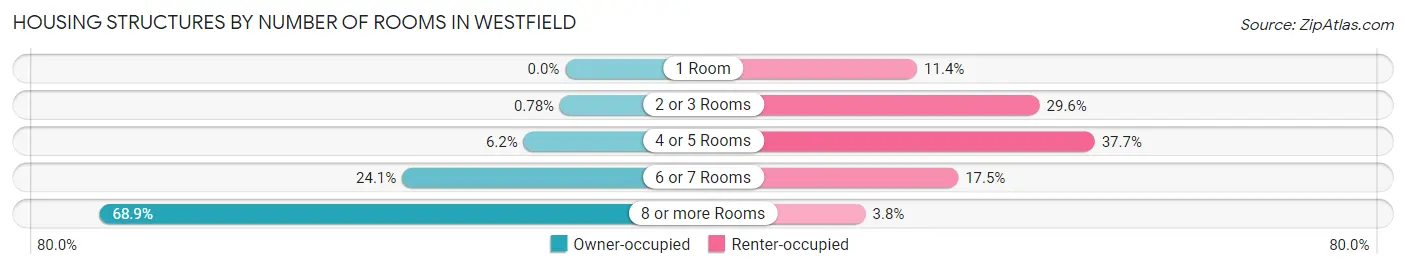
| Number of Rooms | Owner-occupied | Renter-occupied |
| 1 Room | 0 (0.0%) | 241 (11.4%) |
| 2 or 3 Rooms | 65 (0.8%) | 623 (29.5%) |
| 4 or 5 Rooms | 513 (6.2%) | 795 (37.7%) |
| 6 or 7 Rooms | 2,008 (24.1%) | 369 (17.5%) |
| 8 or more Rooms | 5,732 (68.9%) | 80 (3.8%) |
| Total | 8,318 (100.0%) | 2,108 (100.0%) |
Housing Structure by Heating Type in Westfield
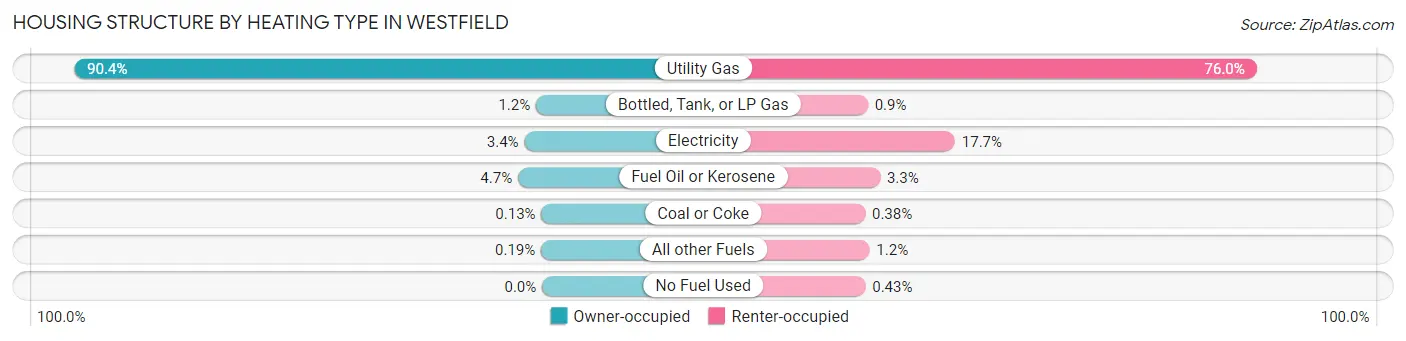
| Heating Type | Owner-occupied | Renter-occupied |
| Utility Gas | 7,522 (90.4%) | 1,603 (76.0%) |
| Bottled, Tank, or LP Gas | 97 (1.2%) | 19 (0.9%) |
| Electricity | 284 (3.4%) | 374 (17.7%) |
| Fuel Oil or Kerosene | 388 (4.7%) | 69 (3.3%) |
| Coal or Coke | 11 (0.1%) | 8 (0.4%) |
| All other Fuels | 16 (0.2%) | 26 (1.2%) |
| No Fuel Used | 0 (0.0%) | 9 (0.4%) |
| Total | 8,318 (100.0%) | 2,108 (100.0%) |
Household Vehicle Usage in Westfield
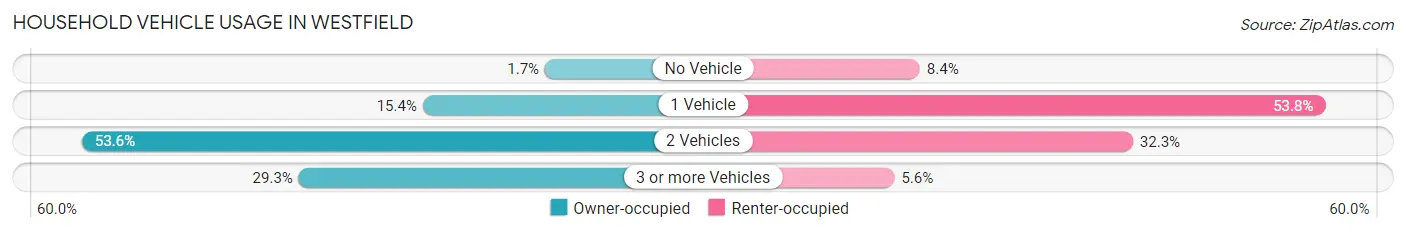
| Vehicles per Household | Owner-occupied | Renter-occupied |
| No Vehicle | 142 (1.7%) | 177 (8.4%) |
| 1 Vehicle | 1,281 (15.4%) | 1,134 (53.8%) |
| 2 Vehicles | 4,458 (53.6%) | 680 (32.3%) |
| 3 or more Vehicles | 2,437 (29.3%) | 117 (5.6%) |
| Total | 8,318 (100.0%) | 2,108 (100.0%) |
Real Estate & Mortgages in Westfield
Real Estate and Mortgage Overview in Westfield
| Characteristic | Without Mortgage | With Mortgage |
| Housing Units | 2,515 | 5,803 |
| Median Property Value | $796,700 | $935,100 |
| Median Household Income | $173,958 | $4,501 |
| Monthly Housing Costs | $1,501 | $4,938 |
| Real Estate Taxes | $10,001 | $92 |
Property Value by Mortgage Status in Westfield
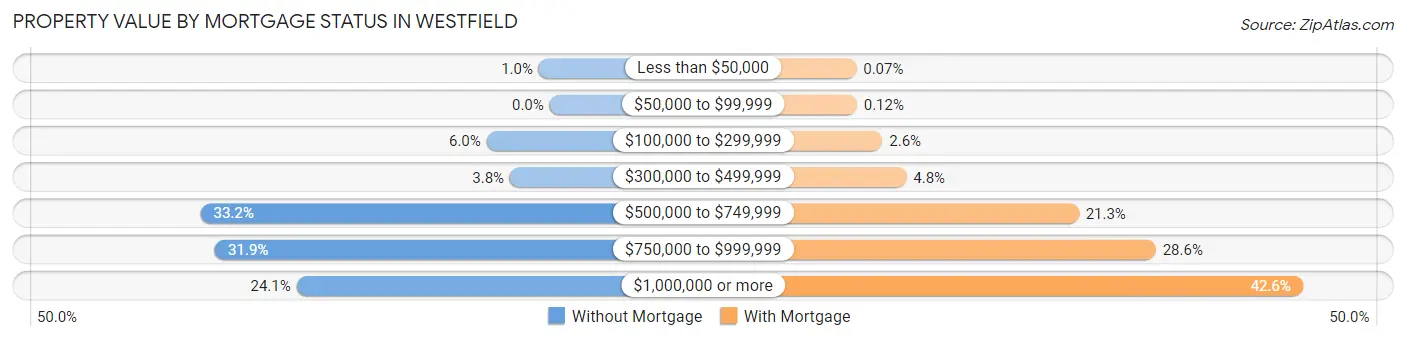
| Property Value | Without Mortgage | With Mortgage |
| Less than $50,000 | 26 (1.0%) | 4 (0.1%) |
| $50,000 to $99,999 | 0 (0.0%) | 7 (0.1%) |
| $100,000 to $299,999 | 151 (6.0%) | 148 (2.5%) |
| $300,000 to $499,999 | 95 (3.8%) | 281 (4.8%) |
| $500,000 to $749,999 | 836 (33.2%) | 1,233 (21.2%) |
| $750,000 to $999,999 | 801 (31.9%) | 1,659 (28.6%) |
| $1,000,000 or more | 606 (24.1%) | 2,471 (42.6%) |
| Total | 2,515 (100.0%) | 5,803 (100.0%) |
Household Income by Mortgage Status in Westfield
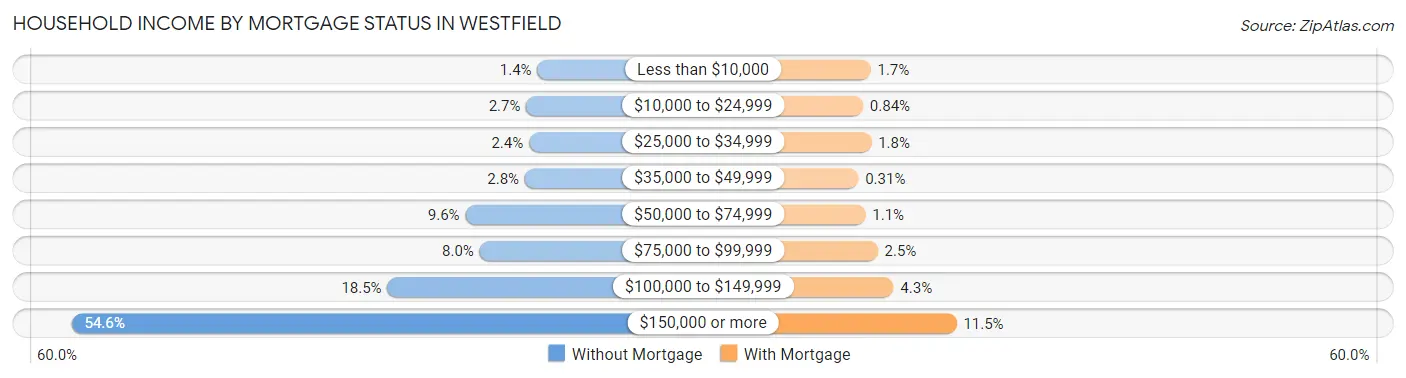
| Household Income | Without Mortgage | With Mortgage |
| Less than $10,000 | 35 (1.4%) | 99 (1.7%) |
| $10,000 to $24,999 | 67 (2.7%) | 49 (0.8%) |
| $25,000 to $34,999 | 59 (2.4%) | 104 (1.8%) |
| $35,000 to $49,999 | 71 (2.8%) | 18 (0.3%) |
| $50,000 to $74,999 | 242 (9.6%) | 65 (1.1%) |
| $75,000 to $99,999 | 201 (8.0%) | 146 (2.5%) |
| $100,000 to $149,999 | 466 (18.5%) | 251 (4.3%) |
| $150,000 or more | 1,374 (54.6%) | 669 (11.5%) |
| Total | 2,515 (100.0%) | 5,803 (100.0%) |
Property Value to Household Income Ratio in Westfield
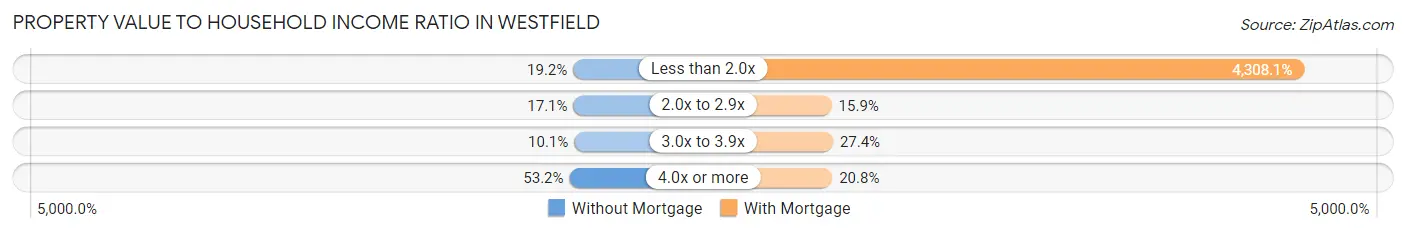
| Value-to-Income Ratio | Without Mortgage | With Mortgage |
| Less than 2.0x | 483 (19.2%) | 250,001 (4,308.1%) |
| 2.0x to 2.9x | 429 (17.1%) | 922 (15.9%) |
| 3.0x to 3.9x | 255 (10.1%) | 1,588 (27.4%) |
| 4.0x or more | 1,337 (53.2%) | 1,206 (20.8%) |
| Total | 2,515 (100.0%) | 5,803 (100.0%) |
Real Estate Taxes by Mortgage Status in Westfield
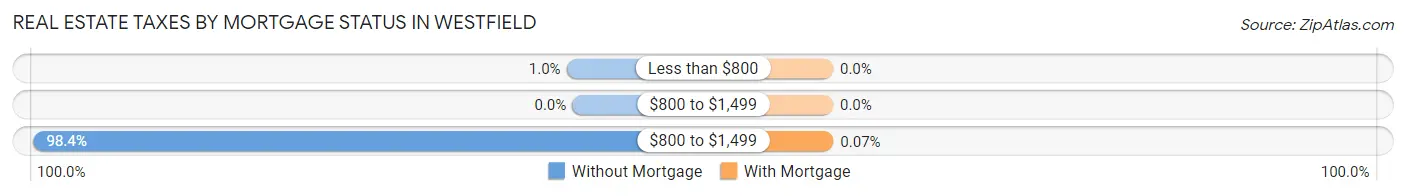
| Property Taxes | Without Mortgage | With Mortgage |
| Less than $800 | 26 (1.0%) | 0 (0.0%) |
| $800 to $1,499 | 0 (0.0%) | 0 (0.0%) |
| $800 to $1,499 | 2,474 (98.4%) | 4 (0.1%) |
| Total | 2,515 (100.0%) | 5,803 (100.0%) |
Health & Disability in Westfield
Health Insurance Coverage by Age in Westfield
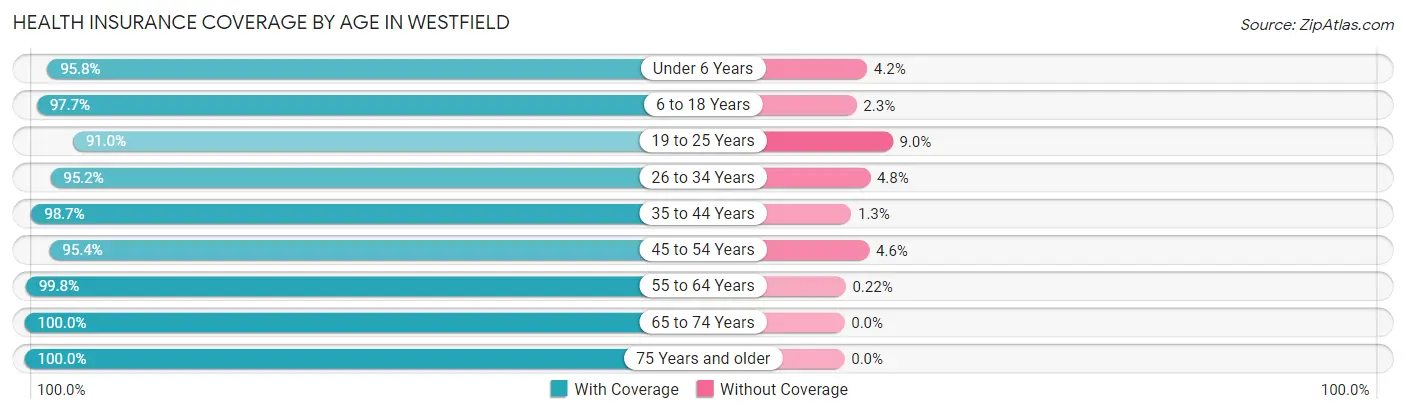
| Age Bracket | With Coverage | Without Coverage |
| Under 6 Years | 2,545 (95.8%) | 112 (4.2%) |
| 6 to 18 Years | 6,499 (97.7%) | 150 (2.3%) |
| 19 to 25 Years | 1,510 (91.0%) | 149 (9.0%) |
| 26 to 34 Years | 2,089 (95.2%) | 105 (4.8%) |
| 35 to 44 Years | 3,921 (98.7%) | 50 (1.3%) |
| 45 to 54 Years | 4,862 (95.4%) | 236 (4.6%) |
| 55 to 64 Years | 4,064 (99.8%) | 9 (0.2%) |
| 65 to 74 Years | 2,678 (100.0%) | 0 (0.0%) |
| 75 Years and older | 1,664 (100.0%) | 0 (0.0%) |
| Total | 29,832 (97.4%) | 811 (2.6%) |
Health Insurance Coverage by Citizenship Status in Westfield
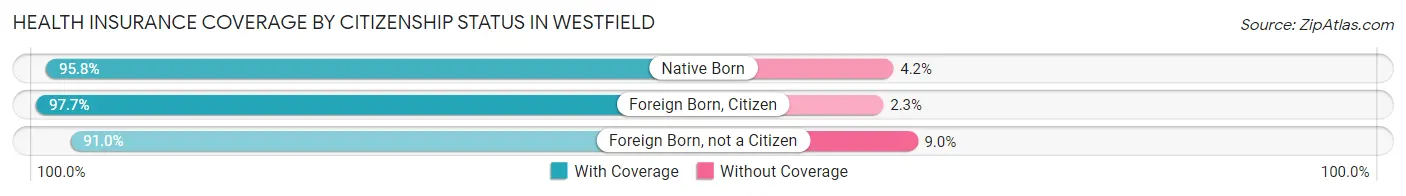
| Citizenship Status | With Coverage | Without Coverage |
| Native Born | 2,545 (95.8%) | 112 (4.2%) |
| Foreign Born, Citizen | 6,499 (97.7%) | 150 (2.3%) |
| Foreign Born, not a Citizen | 1,510 (91.0%) | 149 (9.0%) |
Health Insurance Coverage by Household Income in Westfield
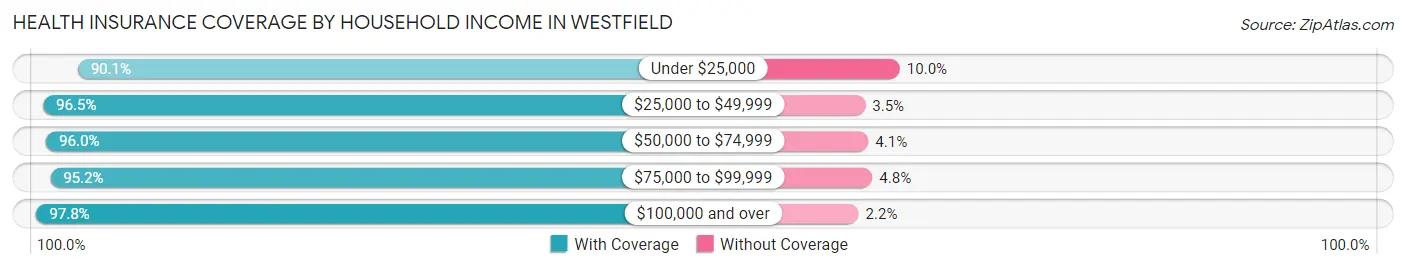
| Household Income | With Coverage | Without Coverage |
| Under $25,000 | 688 (90.0%) | 76 (10.0%) |
| $25,000 to $49,999 | 639 (96.5%) | 23 (3.5%) |
| $50,000 to $74,999 | 1,162 (96.0%) | 49 (4.1%) |
| $75,000 to $99,999 | 1,488 (95.2%) | 75 (4.8%) |
| $100,000 and over | 25,795 (97.8%) | 585 (2.2%) |
Public vs Private Health Insurance Coverage by Age in Westfield
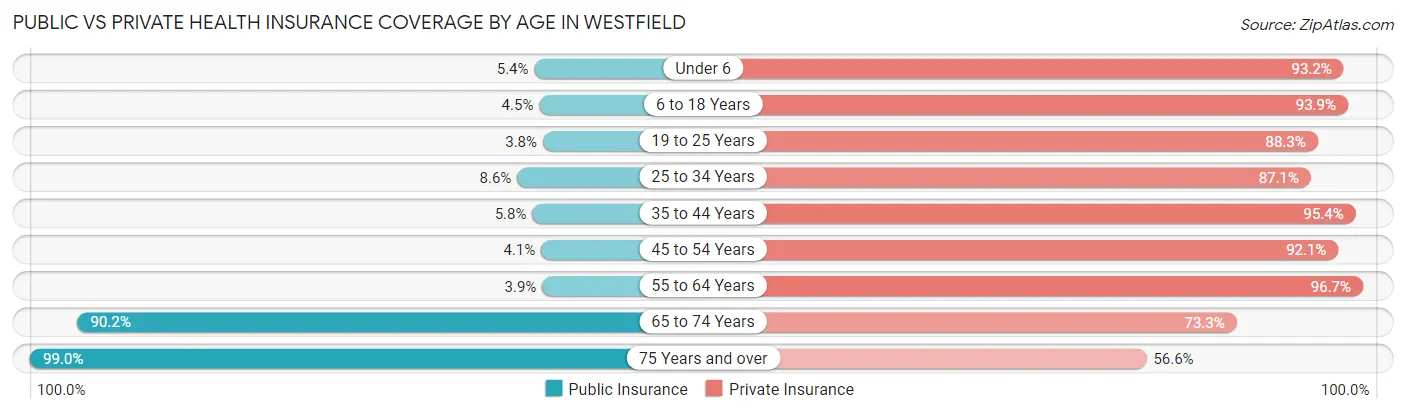
| Age Bracket | Public Insurance | Private Insurance |
| Under 6 | 143 (5.4%) | 2,475 (93.1%) |
| 6 to 18 Years | 298 (4.5%) | 6,245 (93.9%) |
| 19 to 25 Years | 63 (3.8%) | 1,465 (88.3%) |
| 25 to 34 Years | 188 (8.6%) | 1,910 (87.1%) |
| 35 to 44 Years | 229 (5.8%) | 3,787 (95.4%) |
| 45 to 54 Years | 211 (4.1%) | 4,697 (92.1%) |
| 55 to 64 Years | 160 (3.9%) | 3,939 (96.7%) |
| 65 to 74 Years | 2,415 (90.2%) | 1,962 (73.3%) |
| 75 Years and over | 1,647 (99.0%) | 941 (56.6%) |
| Total | 5,354 (17.5%) | 27,421 (89.5%) |
Disability Status by Sex by Age in Westfield
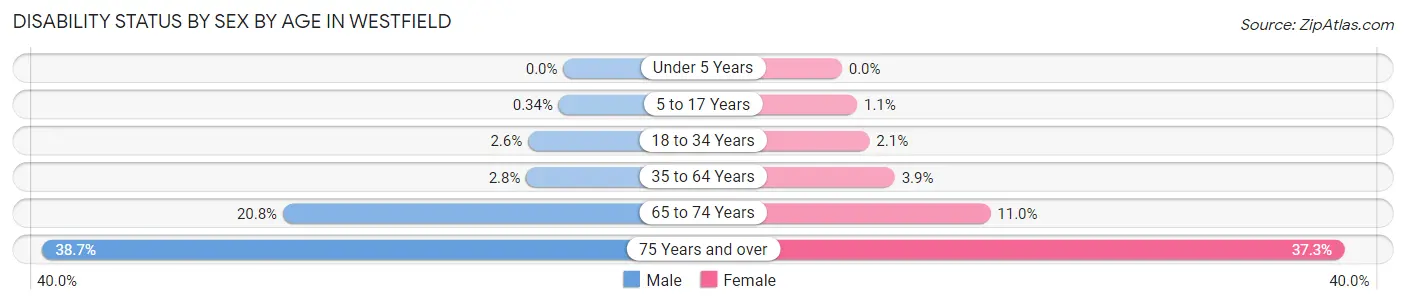
| Age Bracket | Male | Female |
| Under 5 Years | 0 (0.0%) | 0 (0.0%) |
| 5 to 17 Years | 10 (0.3%) | 40 (1.1%) |
| 18 to 34 Years | 58 (2.6%) | 43 (2.1%) |
| 35 to 64 Years | 181 (2.8%) | 258 (3.9%) |
| 65 to 74 Years | 265 (20.8%) | 155 (11.0%) |
| 75 Years and over | 268 (38.7%) | 362 (37.3%) |
Disability Class by Sex by Age in Westfield
Disability Class: Hearing Difficulty
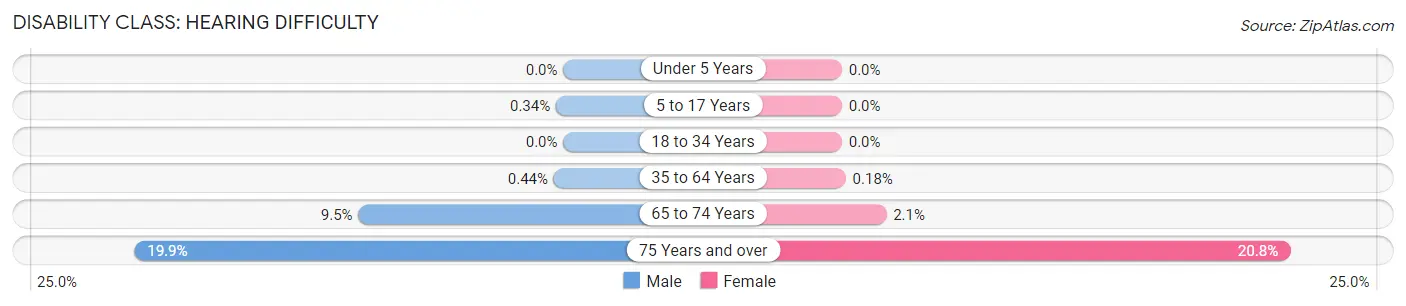
| Age Bracket | Male | Female |
| Under 5 Years | 0 (0.0%) | 0 (0.0%) |
| 5 to 17 Years | 10 (0.3%) | 0 (0.0%) |
| 18 to 34 Years | 0 (0.0%) | 0 (0.0%) |
| 35 to 64 Years | 29 (0.4%) | 12 (0.2%) |
| 65 to 74 Years | 121 (9.5%) | 29 (2.1%) |
| 75 Years and over | 138 (19.9%) | 202 (20.8%) |
Disability Class: Vision Difficulty
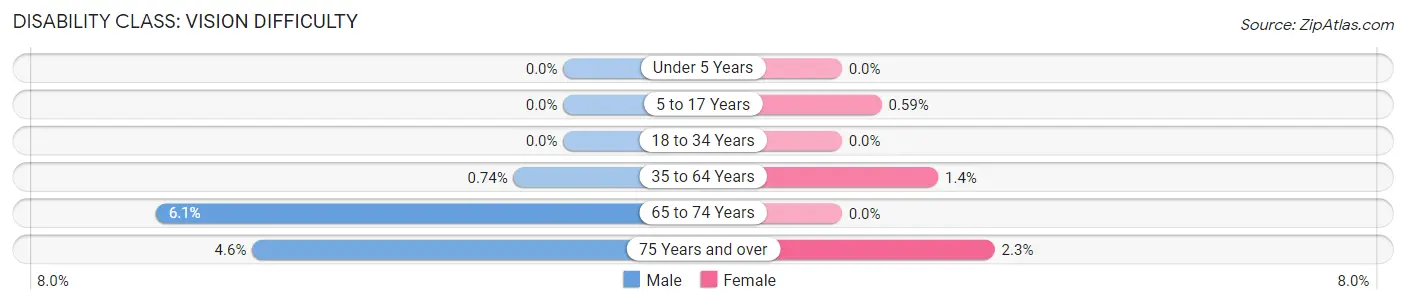
| Age Bracket | Male | Female |
| Under 5 Years | 0 (0.0%) | 0 (0.0%) |
| 5 to 17 Years | 0 (0.0%) | 21 (0.6%) |
| 18 to 34 Years | 0 (0.0%) | 0 (0.0%) |
| 35 to 64 Years | 49 (0.7%) | 94 (1.4%) |
| 65 to 74 Years | 77 (6.0%) | 0 (0.0%) |
| 75 Years and over | 32 (4.6%) | 22 (2.3%) |
Disability Class: Cognitive Difficulty
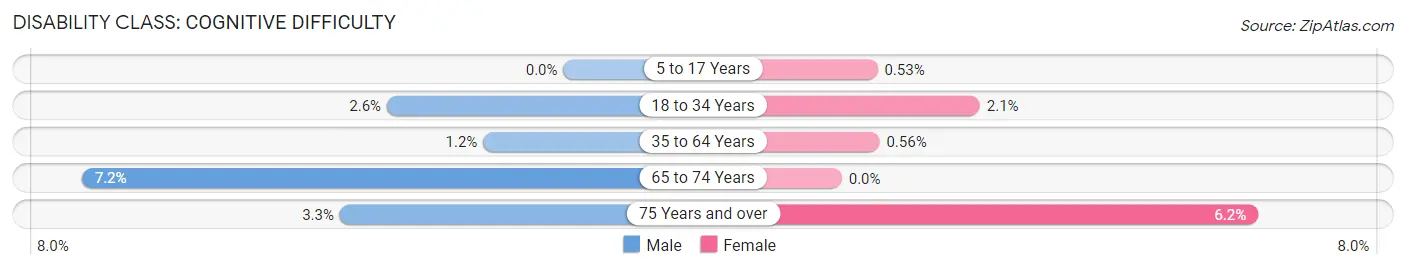
| Age Bracket | Male | Female |
| 5 to 17 Years | 0 (0.0%) | 19 (0.5%) |
| 18 to 34 Years | 58 (2.6%) | 43 (2.1%) |
| 35 to 64 Years | 78 (1.2%) | 37 (0.6%) |
| 65 to 74 Years | 91 (7.1%) | 0 (0.0%) |
| 75 Years and over | 23 (3.3%) | 60 (6.2%) |
Disability Class: Ambulatory Difficulty
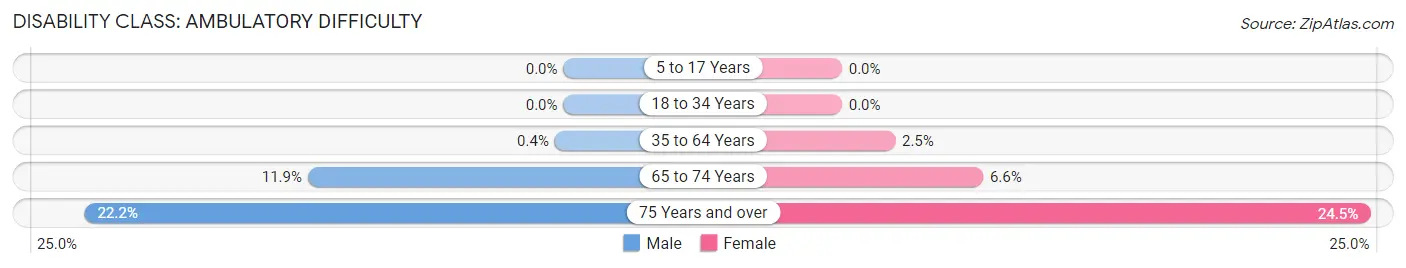
| Age Bracket | Male | Female |
| 5 to 17 Years | 0 (0.0%) | 0 (0.0%) |
| 18 to 34 Years | 0 (0.0%) | 0 (0.0%) |
| 35 to 64 Years | 26 (0.4%) | 162 (2.5%) |
| 65 to 74 Years | 151 (11.9%) | 92 (6.6%) |
| 75 Years and over | 154 (22.2%) | 238 (24.5%) |
Disability Class: Self-Care Difficulty
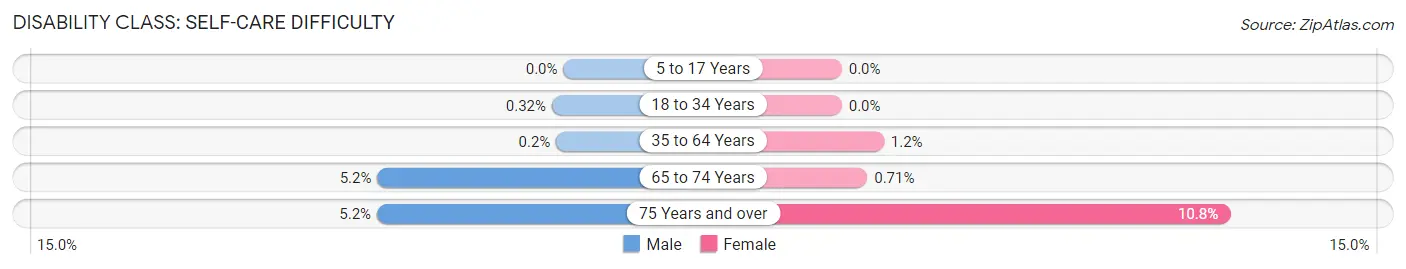
| Age Bracket | Male | Female |
| 5 to 17 Years | 0 (0.0%) | 0 (0.0%) |
| 18 to 34 Years | 7 (0.3%) | 0 (0.0%) |
| 35 to 64 Years | 13 (0.2%) | 77 (1.2%) |
| 65 to 74 Years | 66 (5.2%) | 10 (0.7%) |
| 75 Years and over | 36 (5.2%) | 105 (10.8%) |
Technology Access in Westfield
Computing Device Access in Westfield
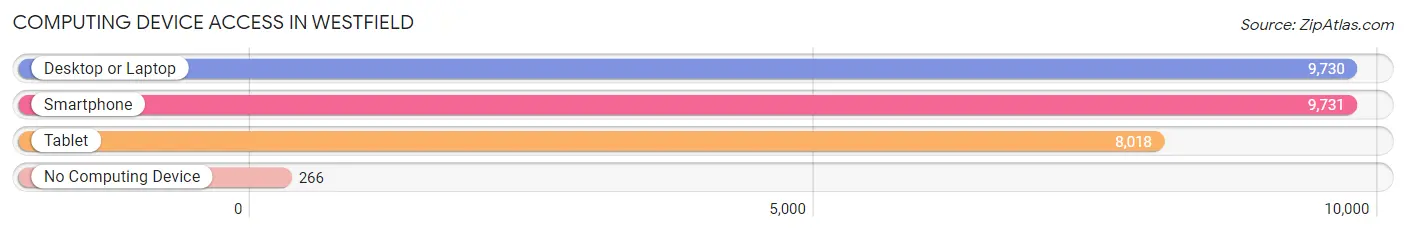
| Device Type | # Households | % Households |
| Desktop or Laptop | 9,730 | 93.3% |
| Smartphone | 9,731 | 93.3% |
| Tablet | 8,018 | 76.9% |
| No Computing Device | 266 | 2.5% |
| Total | 10,426 | 100.0% |
Internet Access in Westfield
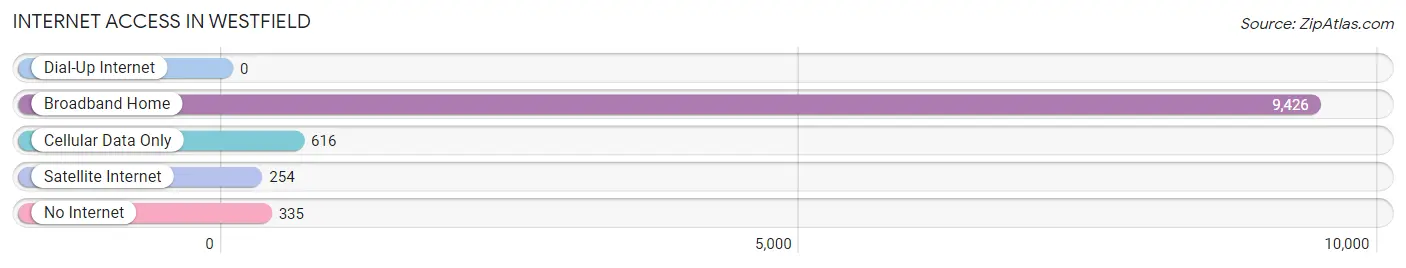
| Internet Type | # Households | % Households |
| Dial-Up Internet | 0 | 0.0% |
| Broadband Home | 9,426 | 90.4% |
| Cellular Data Only | 616 | 5.9% |
| Satellite Internet | 254 | 2.4% |
| No Internet | 335 | 3.2% |
| Total | 10,426 | 100.0% |
Westfield Summary
Westfield, NJ is a town located in Union County, New Jersey. It is situated approximately 25 miles southwest of New York City and is part of the New York metropolitan area. As of the 2010 United States Census, the town had a total population of 30,316.
History
Westfield was first settled in 1664 by a group of English settlers led by John Fenwick. The town was originally known as West Fields, and was part of Elizabethtown. In 1794, Westfield was incorporated as a separate town.
During the American Revolution, Westfield was the site of a major battle between the Continental Army and the British Army. The Battle of Connecticut Farms, which took place on June 7, 1780, was the last major battle of the war in New Jersey.
Geography
Westfield is located at 40°39'45" North, 74°20'54" West (40.6625, -74.3483). According to the United States Census Bureau, the town has a total area of 6.2 square miles, all of which is land.
Westfield is bordered by Mountainside to the north, Scotch Plains to the east, Cranford to the south, and Garwood to the west.
Economy
Westfield is a primarily residential community, with a few commercial areas. The town is home to several large corporations, including Merck & Co., Inc., Prudential Financial, and PSE&G.
Westfield is also home to several shopping centers, including The Plaza at Westfield, which is anchored by a Macy's department store. The town also has a vibrant downtown area, which is home to a variety of shops, restaurants, and other businesses.
Demographics
As of the 2010 United States Census, there were 30,316 people, 11,817 households, and 8,068 families residing in the town. The population density was 4,867.3 people per square mile. There were 12,541 housing units at an average density of 2,019.2 per square mile.
The racial makeup of the town was 87.2% White, 4.2% African American, 0.1% Native American, 6.3% Asian, 0.0% Pacific Islander, 0.7% from other races, and 1.5% from two or more races. Hispanic or Latino of any race were 4.7% of the population.
The median income for a household in the town was $103,914, and the median income for a family was $125,917. Males had a median income of $87,945 versus $54,945 for females. The per capita income for the town was $50,945. About 2.2% of families and 3.3% of the population were below the poverty line, including 3.7% of those under age 18 and 4.2% of those age 65 or over.
Common Questions
What is Per Capita Income in Westfield?
Per Capita income in Westfield is $96,656.
What is the Median Family Income in Westfield?
Median Family Income in Westfield is $250,001.
What is the Median Household income in Westfield?
Median Household Income in Westfield is $203,235.
What is Income or Wage Gap in Westfield?
Income or Wage Gap in Westfield is 45.4%.
Women in Westfield earn 54.6 cents for every dollar earned by a man.
What is Inequality or Gini Index in Westfield?
Inequality or Gini Index in Westfield is 0.47.
What is the Total Population of Westfield?
Total Population of Westfield is 30,839.
What is the Total Male Population of Westfield?
Total Male Population of Westfield is 14,970.
What is the Total Female Population of Westfield?
Total Female Population of Westfield is 15,869.
What is the Ratio of Males per 100 Females in Westfield?
There are 94.33 Males per 100 Females in Westfield.
What is the Ratio of Females per 100 Males in Westfield?
There are 106.01 Females per 100 Males in Westfield.
What is the Median Population Age in Westfield?
Median Population Age in Westfield is 40.4 Years.
What is the Average Family Size in Westfield
Average Family Size in Westfield is 3.4 People.
What is the Average Household Size in Westfield
Average Household Size in Westfield is 2.9 People.
How Large is the Labor Force in Westfield?
There are 15,604 People in the Labor Forcein in Westfield.
What is the Percentage of People in the Labor Force in Westfield?
68.1% of People are in the Labor Force in Westfield.
What is the Unemployment Rate in Westfield?
Unemployment Rate in Westfield is 4.0%.