Cities with the Lowest Poverty Level Among Children Under the Age of 5 in Kentucky
RELATED REPORTS & OPTIONS
Lowest Poverty | Child 0-5
Kentucky
Compare Cities
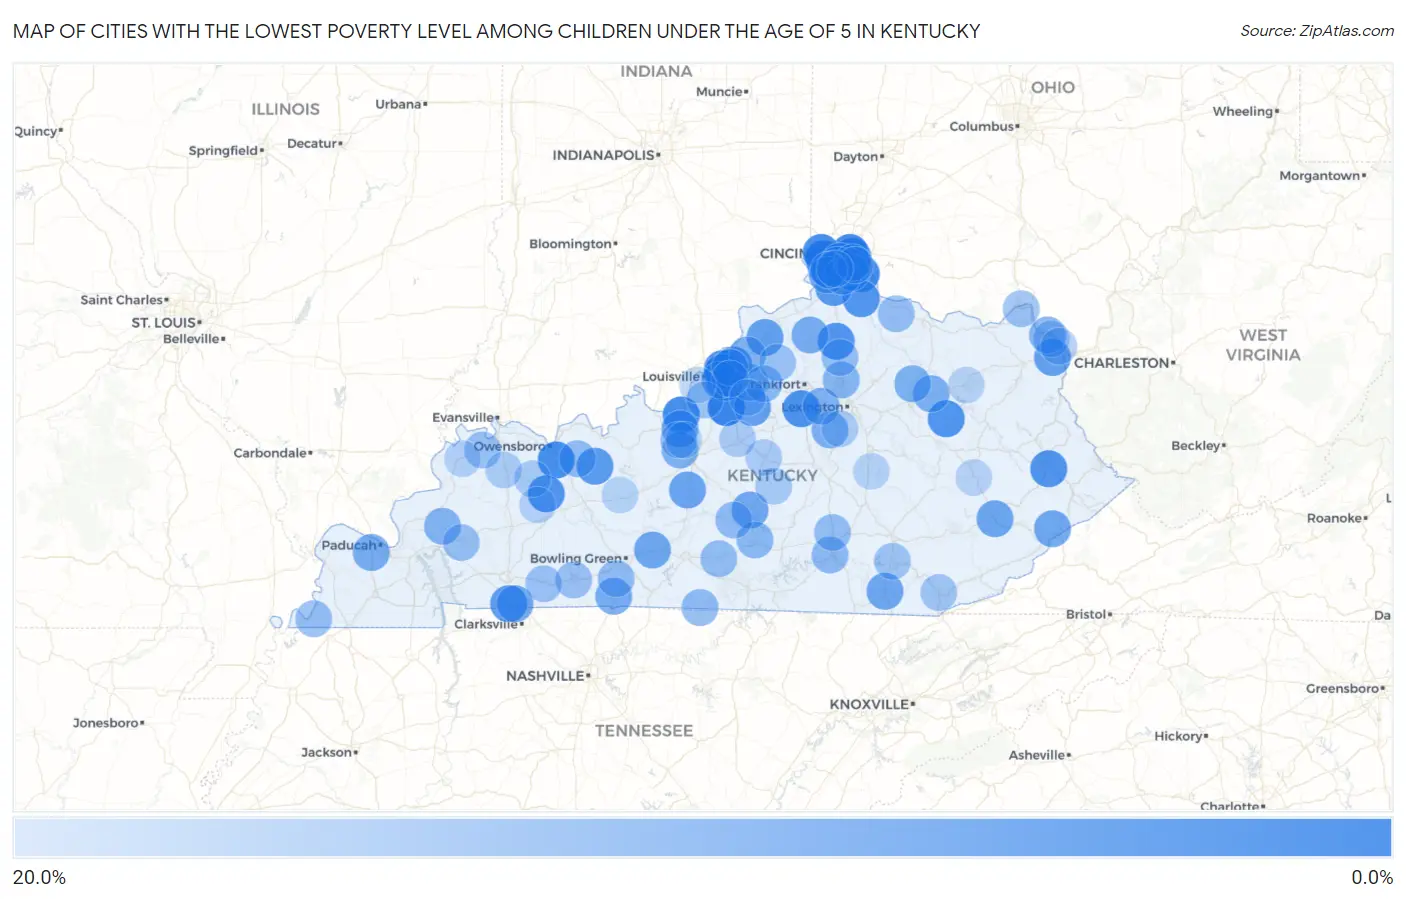
Map of Cities with the Lowest Poverty Level Among Children Under the Age of 5 in Kentucky
20.0%
0.0%
Cities with the Lowest Poverty Level Among Children Under the Age of 5 in Kentucky
| City | Child Poverty | vs State | vs National | |
| 1. | Oakbrook | 2.0% | 23.3%(-21.4)#1 | 18.1%(-16.1)#331 |
| 2. | Mount Washington | 2.0% | 23.3%(-21.3)#2 | 18.1%(-16.0)#362 |
| 3. | Hebron | 2.2% | 23.3%(-21.1)#3 | 18.1%(-15.9)#409 |
| 4. | Fort Thomas | 2.5% | 23.3%(-20.8)#4 | 18.1%(-15.5)#514 |
| 5. | West Point | 3.4% | 23.3%(-19.9)#5 | 18.1%(-14.7)#866 |
| 6. | Alexandria | 3.4% | 23.3%(-19.9)#6 | 18.1%(-14.6)#886 |
| 7. | Masonville | 3.5% | 23.3%(-19.8)#7 | 18.1%(-14.6)#909 |
| 8. | Bellevue | 3.5% | 23.3%(-19.8)#8 | 18.1%(-14.5)#929 |
| 9. | Langdon Place | 3.8% | 23.3%(-19.5)#9 | 18.1%(-14.2)#1,058 |
| 10. | Brownsboro Farm | 3.8% | 23.3%(-19.5)#10 | 18.1%(-14.2)#1,062 |
| 11. | Francisville | 3.9% | 23.3%(-19.4)#11 | 18.1%(-14.2)#1,090 |
| 12. | Lawrenceburg | 4.7% | 23.3%(-18.7)#12 | 18.1%(-13.4)#1,411 |
| 13. | Island | 5.1% | 23.3%(-18.2)#13 | 18.1%(-12.9)#1,631 |
| 14. | Allen | 5.1% | 23.3%(-18.2)#14 | 18.1%(-12.9)#1,632 |
| 15. | Frenchburg | 5.3% | 23.3%(-18.1)#15 | 18.1%(-12.8)#1,689 |
| 16. | Corinth | 5.3% | 23.3%(-18.1)#16 | 18.1%(-12.8)#1,699 |
| 17. | Butler | 5.6% | 23.3%(-17.8)#17 | 18.1%(-12.5)#1,811 |
| 18. | Edgewood | 5.7% | 23.3%(-17.6)#18 | 18.1%(-12.3)#1,896 |
| 19. | Walton | 6.2% | 23.3%(-17.1)#19 | 18.1%(-11.9)#2,066 |
| 20. | Jeffersontown | 6.2% | 23.3%(-17.1)#20 | 18.1%(-11.8)#2,075 |
| 21. | Crestwood | 6.3% | 23.3%(-17.0)#21 | 18.1%(-11.8)#2,124 |
| 22. | Fort Campbell North | 6.4% | 23.3%(-16.9)#22 | 18.1%(-11.7)#2,154 |
| 23. | Fordsville | 6.5% | 23.3%(-16.9)#23 | 18.1%(-11.6)#2,171 |
| 24. | Taylor Mill | 6.6% | 23.3%(-16.7)#24 | 18.1%(-11.4)#2,243 |
| 25. | Fort Mitchell | 7.0% | 23.3%(-16.3)#25 | 18.1%(-11.0)#2,432 |
| 26. | Campbellsburg | 7.4% | 23.3%(-15.9)#26 | 18.1%(-10.6)#2,613 |
| 27. | Briarwood | 7.7% | 23.3%(-15.6)#27 | 18.1%(-10.4)#2,725 |
| 28. | Taylorsville | 7.8% | 23.3%(-15.5)#28 | 18.1%(-10.3)#2,768 |
| 29. | Erlanger | 8.0% | 23.3%(-15.3)#29 | 18.1%(-10.1)#2,822 |
| 30. | Cannonsburg | 8.2% | 23.3%(-15.2)#30 | 18.1%(-9.90)#2,895 |
| 31. | Upton | 8.7% | 23.3%(-14.6)#31 | 18.1%(-9.37)#3,132 |
| 32. | Hazard | 8.9% | 23.3%(-14.4)#32 | 18.1%(-9.15)#3,214 |
| 33. | Fort Knox | 8.9% | 23.3%(-14.4)#33 | 18.1%(-9.15)#3,215 |
| 34. | Smiths Grove | 9.1% | 23.3%(-14.2)#34 | 18.1%(-8.97)#3,289 |
| 35. | Williamsburg | 9.1% | 23.3%(-14.2)#35 | 18.1%(-8.93)#3,325 |
| 36. | Fleming Neon | 9.2% | 23.3%(-14.1)#36 | 18.1%(-8.87)#3,352 |
| 37. | Oak Grove | 9.3% | 23.3%(-14.0)#37 | 18.1%(-8.79)#3,384 |
| 38. | Campbellsville | 9.4% | 23.3%(-13.9)#38 | 18.1%(-8.64)#3,431 |
| 39. | Franklin | 10.3% | 23.3%(-13.0)#39 | 18.1%(-7.76)#3,775 |
| 40. | Owenton | 10.4% | 23.3%(-12.9)#40 | 18.1%(-7.69)#3,802 |
| 41. | Union | 10.4% | 23.3%(-12.9)#41 | 18.1%(-7.66)#3,809 |
| 42. | Massac | 10.4% | 23.3%(-12.9)#42 | 18.1%(-7.62)#3,825 |
| 43. | Owingsville | 10.9% | 23.3%(-12.4)#43 | 18.1%(-7.11)#4,024 |
| 44. | St Regis Park | 11.1% | 23.3%(-12.2)#44 | 18.1%(-6.95)#4,075 |
| 45. | Ryland Heights | 11.1% | 23.3%(-12.2)#45 | 18.1%(-6.95)#4,088 |
| 46. | Sharpsburg | 11.1% | 23.3%(-12.2)#46 | 18.1%(-6.95)#4,114 |
| 47. | Wilmore | 11.4% | 23.3%(-12.0)#47 | 18.1%(-6.69)#4,215 |
| 48. | Rineyville | 11.5% | 23.3%(-11.8)#48 | 18.1%(-6.52)#4,272 |
| 49. | Versailles | 11.6% | 23.3%(-11.8)#49 | 18.1%(-6.49)#4,292 |
| 50. | Simpsonville | 11.7% | 23.3%(-11.6)#50 | 18.1%(-6.39)#4,330 |
| 51. | Raceland | 11.8% | 23.3%(-11.6)#51 | 18.1%(-6.30)#4,353 |
| 52. | Fredonia | 11.8% | 23.3%(-11.6)#52 | 18.1%(-6.30)#4,367 |
| 53. | La Grange | 11.8% | 23.3%(-11.5)#53 | 18.1%(-6.23)#4,397 |
| 54. | Coldstream | 12.1% | 23.3%(-11.2)#54 | 18.1%(-5.94)#4,494 |
| 55. | Georgetown | 12.3% | 23.3%(-11.0)#55 | 18.1%(-5.71)#4,565 |
| 56. | Shelbyville | 12.8% | 23.3%(-10.6)#56 | 18.1%(-5.31)#4,735 |
| 57. | Independence | 12.9% | 23.3%(-10.4)#57 | 18.1%(-5.17)#4,795 |
| 58. | Columbia | 12.9% | 23.3%(-10.4)#58 | 18.1%(-5.16)#4,799 |
| 59. | Middletown | 13.1% | 23.3%(-10.2)#59 | 18.1%(-4.95)#4,876 |
| 60. | Highland Heights | 13.3% | 23.3%(-9.99)#60 | 18.1%(-4.73)#4,939 |
| 61. | Gamaliel | 13.3% | 23.3%(-9.99)#61 | 18.1%(-4.73)#4,969 |
| 62. | Cold Spring | 13.4% | 23.3%(-9.88)#62 | 18.1%(-4.62)#4,994 |
| 63. | Burnside | 13.5% | 23.3%(-9.81)#63 | 18.1%(-4.55)#5,025 |
| 64. | Whitesville | 13.6% | 23.3%(-9.69)#64 | 18.1%(-4.43)#5,071 |
| 65. | Greensburg | 13.7% | 23.3%(-9.62)#65 | 18.1%(-4.36)#5,101 |
| 66. | Woodburn | 13.8% | 23.3%(-9.53)#66 | 18.1%(-4.27)#5,135 |
| 67. | Science Hill | 13.9% | 23.3%(-9.40)#67 | 18.1%(-4.14)#5,184 |
| 68. | Edmonton | 14.0% | 23.3%(-9.32)#68 | 18.1%(-4.06)#5,215 |
| 69. | Brooksville | 14.1% | 23.3%(-9.19)#69 | 18.1%(-3.93)#5,256 |
| 70. | Hickman | 14.3% | 23.3%(-9.04)#70 | 18.1%(-3.78)#5,307 |
| 71. | Sadieville | 14.3% | 23.3%(-9.04)#71 | 18.1%(-3.78)#5,348 |
| 72. | Florence | 14.3% | 23.3%(-8.98)#72 | 18.1%(-3.72)#5,380 |
| 73. | Princeton | 14.5% | 23.3%(-8.82)#73 | 18.1%(-3.56)#5,414 |
| 74. | Russellville | 14.7% | 23.3%(-8.64)#74 | 18.1%(-3.38)#5,477 |
| 75. | Vine Grove | 14.8% | 23.3%(-8.56)#75 | 18.1%(-3.30)#5,497 |
| 76. | Elkton | 14.8% | 23.3%(-8.55)#76 | 18.1%(-3.29)#5,500 |
| 77. | Elsmere | 14.8% | 23.3%(-8.51)#77 | 18.1%(-3.25)#5,516 |
| 78. | South Shore | 14.9% | 23.3%(-8.43)#78 | 18.1%(-3.17)#5,545 |
| 79. | Corydon | 14.9% | 23.3%(-8.43)#79 | 18.1%(-3.17)#5,547 |
| 80. | Pleasureville | 15.2% | 23.3%(-8.17)#80 | 18.1%(-2.91)#5,641 |
| 81. | Hollyvilla | 15.4% | 23.3%(-7.94)#81 | 18.1%(-2.68)#5,743 |
| 82. | Pineville | 15.6% | 23.3%(-7.77)#82 | 18.1%(-2.51)#5,787 |
| 83. | North Corbin | 15.7% | 23.3%(-7.65)#83 | 18.1%(-2.39)#5,829 |
| 84. | Russell | 16.4% | 23.3%(-6.93)#84 | 18.1%(-1.67)#6,055 |
| 85. | Calhoun | 16.7% | 23.3%(-6.66)#85 | 18.1%(-1.40)#6,154 |
| 86. | Bradfordsville | 16.7% | 23.3%(-6.66)#86 | 18.1%(-1.40)#6,173 |
| 87. | Ashland | 16.9% | 23.3%(-6.38)#87 | 18.1%(-1.12)#6,269 |
| 88. | Springfield | 16.9% | 23.3%(-6.38)#88 | 18.1%(-1.12)#6,270 |
| 89. | Bardstown | 17.1% | 23.3%(-6.22)#89 | 18.1%(-0.963)#6,311 |
| 90. | Sebree | 17.4% | 23.3%(-5.89)#90 | 18.1%(-0.632)#6,423 |
| 91. | Nicholasville | 17.4% | 23.3%(-5.88)#91 | 18.1%(-0.623)#6,425 |
| 92. | Elk Creek | 18.0% | 23.3%(-5.36)#92 | 18.1%(-0.099)#6,606 |
| 93. | Bremen | 18.2% | 23.3%(-5.14)#93 | 18.1%(+0.119)#6,678 |
| 94. | Morganfield | 18.2% | 23.3%(-5.08)#94 | 18.1%(+0.180)#6,705 |
| 95. | Caneyville | 18.4% | 23.3%(-4.95)#95 | 18.1%(+0.305)#6,737 |
| 96. | Berea | 18.5% | 23.3%(-4.79)#96 | 18.1%(+0.469)#6,786 |
| 97. | Shively | 18.6% | 23.3%(-4.75)#97 | 18.1%(+0.514)#6,803 |
| 98. | Radcliff | 18.6% | 23.3%(-4.72)#98 | 18.1%(+0.534)#6,811 |
| 99. | Jackson | 18.7% | 23.3%(-4.63)#99 | 18.1%(+0.629)#6,845 |
| 100. | Morehead | 18.7% | 23.3%(-4.62)#100 | 18.1%(+0.642)#6,851 |
Common Questions
What are the Top 10 Cities with the Lowest Poverty Level Among Children Under the Age of 5 in Kentucky?
Top 10 Cities with the Lowest Poverty Level Among Children Under the Age of 5 in Kentucky are:
#1
2.0%
#2
2.0%
#3
2.2%
#4
2.5%
#5
3.4%
#6
3.4%
#7
3.5%
#8
3.5%
#9
3.8%
#10
3.8%
What city has the Lowest Poverty Level Among Children Under the Age of 5 in Kentucky?
Oakbrook has the Lowest Poverty Level Among Children Under the Age of 5 in Kentucky with 2.0%.
What is the Poverty Level Among Children Under the Age of 5 in the State of Kentucky?
Poverty Level Among Children Under the Age of 5 in Kentucky is 23.3%.
What is the Poverty Level Among Children Under the Age of 5 in the United States?
Poverty Level Among Children Under the Age of 5 in the United States is 18.1%.