Pleasant View, TN Map & Demographics
Pleasant View Map
Pleasant View Overview
$44,027
PER CAPITA INCOME
$102,071
AVG FAMILY INCOME
$93,333
AVG HOUSEHOLD INCOME
31.0%
WAGE / INCOME GAP [ % ]
69.0¢/ $1
WAGE / INCOME GAP [ $ ]
0.38
INEQUALITY / GINI INDEX
4,945
TOTAL POPULATION
2,525
MALE POPULATION
2,420
FEMALE POPULATION
104.34
MALES / 100 FEMALES
95.84
FEMALES / 100 MALES
38.7
MEDIAN AGE
3.0
AVG FAMILY SIZE
2.5
AVG HOUSEHOLD SIZE
2,713
LABOR FORCE [ PEOPLE ]
66.9%
PERCENT IN LABOR FORCE
3.8%
UNEMPLOYMENT RATE
Pleasant View Zip Codes
Pleasant View Area Codes
Income in Pleasant View
Income Overview in Pleasant View
Per Capita Income in Pleasant View is $44,027, while median incomes of families and households are $102,071 and $93,333 respectively.
| Characteristic | Number | Measure |
| Per Capita Income | 4,945 | $44,027 |
| Median Family Income | 1,392 | $102,071 |
| Mean Family Income | 1,392 | $122,269 |
| Median Household Income | 1,950 | $93,333 |
| Mean Household Income | 1,950 | $105,408 |
| Income Deficit | 1,392 | $0 |
| Wage / Income Gap (%) | 4,945 | 30.97% |
| Wage / Income Gap ($) | 4,945 | 69.03¢ per $1 |
| Gini / Inequality Index | 4,945 | 0.38 |
Earnings by Sex in Pleasant View
Average Earnings in Pleasant View are $54,000, $62,875 for men and $43,401 for women, a difference of 31.0%.
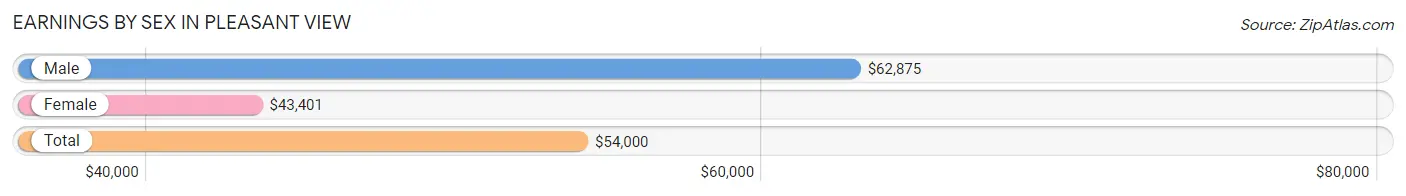
| Sex | Number | Average Earnings |
| Male | 1,627 (57.5%) | $62,875 |
| Female | 1,203 (42.5%) | $43,401 |
| Total | 2,830 (100.0%) | $54,000 |
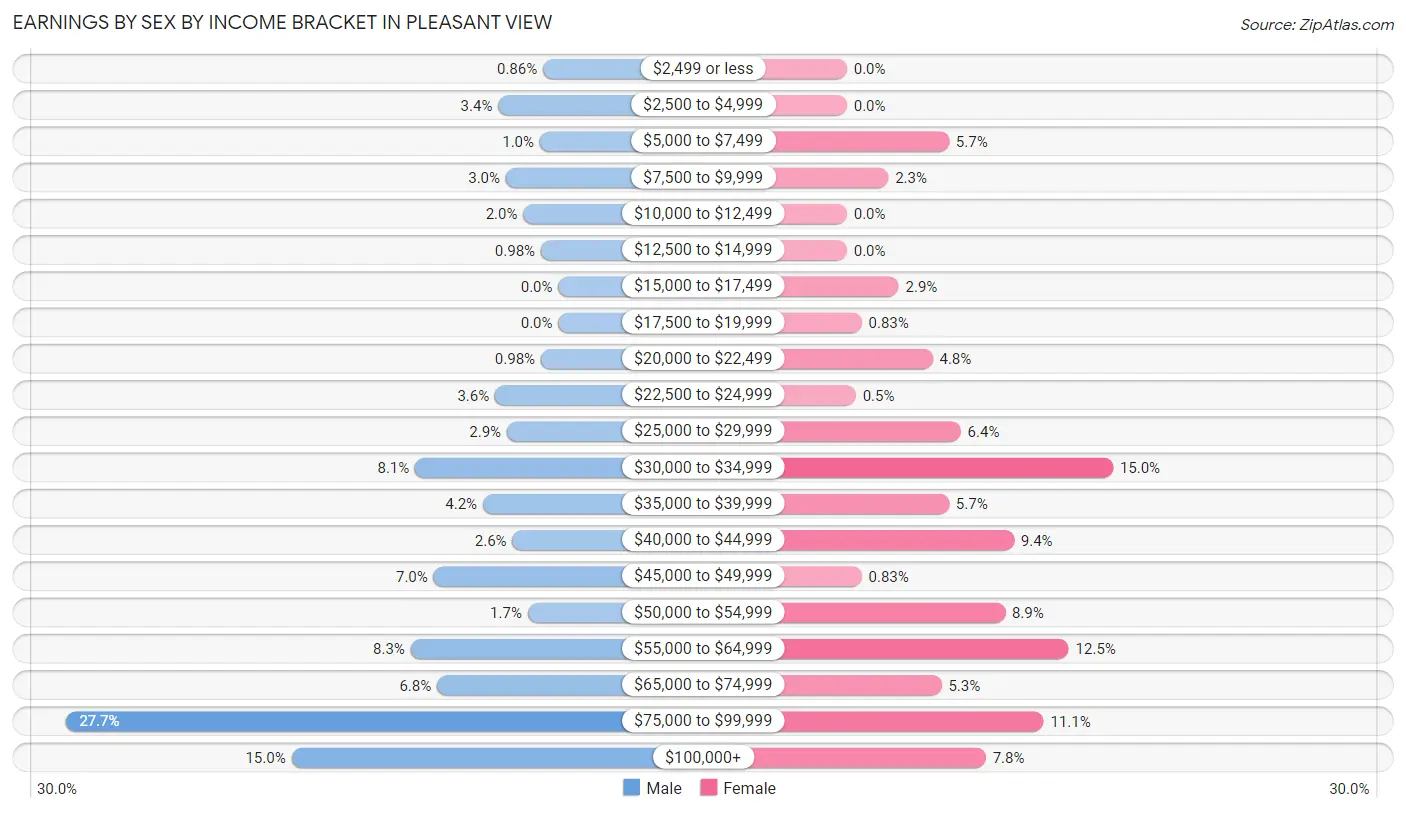
Earnings by Sex by Income Bracket in Pleasant View
The most common earnings brackets in Pleasant View are $75,000 to $99,999 for men (450 | 27.7%) and $30,000 to $34,999 for women (180 | 15.0%).
| Income | Male | Female |
| $2,499 or less | 14 (0.9%) | 0 (0.0%) |
| $2,500 to $4,999 | 55 (3.4%) | 0 (0.0%) |
| $5,000 to $7,499 | 17 (1.0%) | 69 (5.7%) |
| $7,500 to $9,999 | 48 (2.9%) | 28 (2.3%) |
| $10,000 to $12,499 | 32 (2.0%) | 0 (0.0%) |
| $12,500 to $14,999 | 16 (1.0%) | 0 (0.0%) |
| $15,000 to $17,499 | 0 (0.0%) | 35 (2.9%) |
| $17,500 to $19,999 | 0 (0.0%) | 10 (0.8%) |
| $20,000 to $22,499 | 16 (1.0%) | 58 (4.8%) |
| $22,500 to $24,999 | 58 (3.6%) | 6 (0.5%) |
| $25,000 to $29,999 | 47 (2.9%) | 77 (6.4%) |
| $30,000 to $34,999 | 131 (8.1%) | 180 (15.0%) |
| $35,000 to $39,999 | 69 (4.2%) | 69 (5.7%) |
| $40,000 to $44,999 | 42 (2.6%) | 113 (9.4%) |
| $45,000 to $49,999 | 114 (7.0%) | 10 (0.8%) |
| $50,000 to $54,999 | 28 (1.7%) | 107 (8.9%) |
| $55,000 to $64,999 | 135 (8.3%) | 150 (12.5%) |
| $65,000 to $74,999 | 111 (6.8%) | 64 (5.3%) |
| $75,000 to $99,999 | 450 (27.7%) | 133 (11.1%) |
| $100,000+ | 244 (15.0%) | 94 (7.8%) |
| Total | 1,627 (100.0%) | 1,203 (100.0%) |
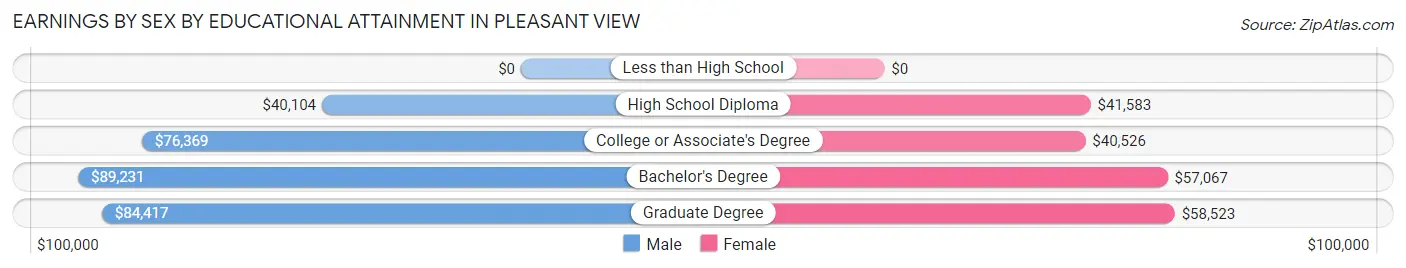
Earnings by Sex by Educational Attainment in Pleasant View
Average earnings in Pleasant View are $69,444 for men and $43,732 for women, a difference of 37.0%. Men with an educational attainment of bachelor's degree enjoy the highest average annual earnings of $89,231, while those with high school diploma education earn the least with $40,104. Women with an educational attainment of graduate degree earn the most with the average annual earnings of $58,523, while those with college or associate's degree education have the smallest earnings of $40,526.
| Educational Attainment | Male Income | Female Income |
| Less than High School | - | - |
| High School Diploma | $40,104 | $41,583 |
| College or Associate's Degree | $76,369 | $40,526 |
| Bachelor's Degree | $89,231 | $57,067 |
| Graduate Degree | $84,417 | $58,523 |
| Total | $69,444 | $43,732 |
Family Income in Pleasant View
Family Income Brackets in Pleasant View
According to the Pleasant View family income data, there are 458 families falling into the $100,000 to $149,999 income range, which is the most common income bracket and makes up 32.9% of all families.

| Income Bracket | # Families | % Families |
| Less than $10,000 | 53 | 3.8% |
| $10,000 to $14,999 | 0 | 0.0% |
| $15,000 to $24,999 | 29 | 2.1% |
| $25,000 to $34,999 | 31 | 2.2% |
| $35,000 to $49,999 | 39 | 2.8% |
| $50,000 to $74,999 | 182 | 13.1% |
| $75,000 to $99,999 | 278 | 20.0% |
| $100,000 to $149,999 | 458 | 32.9% |
| $150,000 to $199,999 | 184 | 13.2% |
| $200,000+ | 136 | 9.8% |
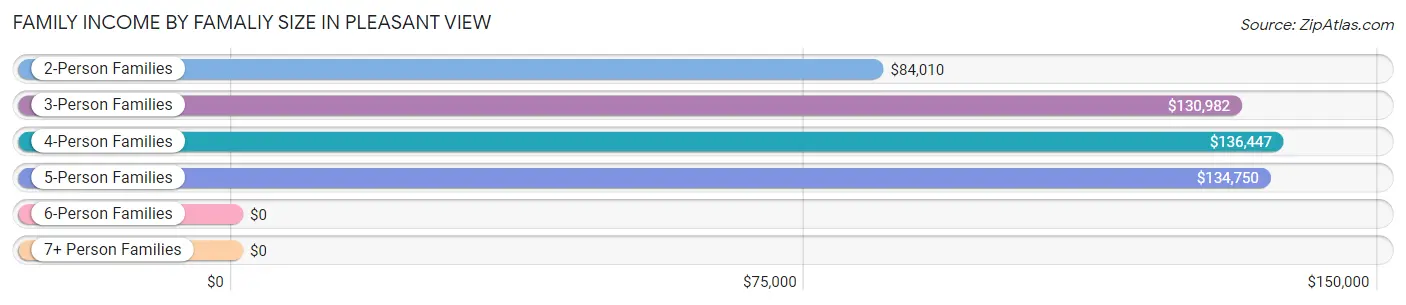
Family Income by Famaliy Size in Pleasant View
4-person families (272 | 19.5%) account for the highest median family income in Pleasant View with $136,447 per family, while 3-person families (259 | 18.6%) have the highest median income of $43,661 per family member.
| Income Bracket | # Families | Median Income |
| 2-Person Families | 705 (50.6%) | $84,010 |
| 3-Person Families | 259 (18.6%) | $130,982 |
| 4-Person Families | 272 (19.5%) | $136,447 |
| 5-Person Families | 130 (9.3%) | $134,750 |
| 6-Person Families | 26 (1.9%) | $0 |
| 7+ Person Families | 0 (0.0%) | $0 |
| Total | 1,392 (100.0%) | $102,071 |
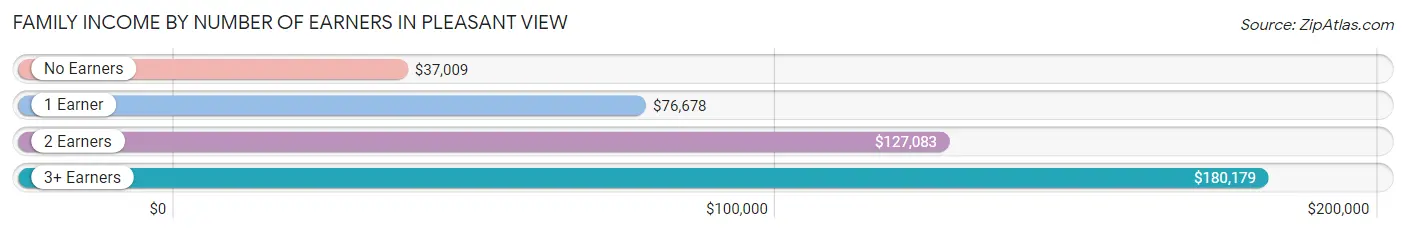
Family Income by Number of Earners in Pleasant View
The median family income in Pleasant View is $102,071, with families comprising 3+ earners (152) having the highest median family income of $180,179, while families with no earners (157) have the lowest median family income of $37,009, accounting for 10.9% and 11.3% of families, respectively.
| Number of Earners | # Families | Median Income |
| No Earners | 157 (11.3%) | $37,009 |
| 1 Earner | 419 (30.1%) | $76,678 |
| 2 Earners | 664 (47.7%) | $127,083 |
| 3+ Earners | 152 (10.9%) | $180,179 |
| Total | 1,392 (100.0%) | $102,071 |
Household Income in Pleasant View
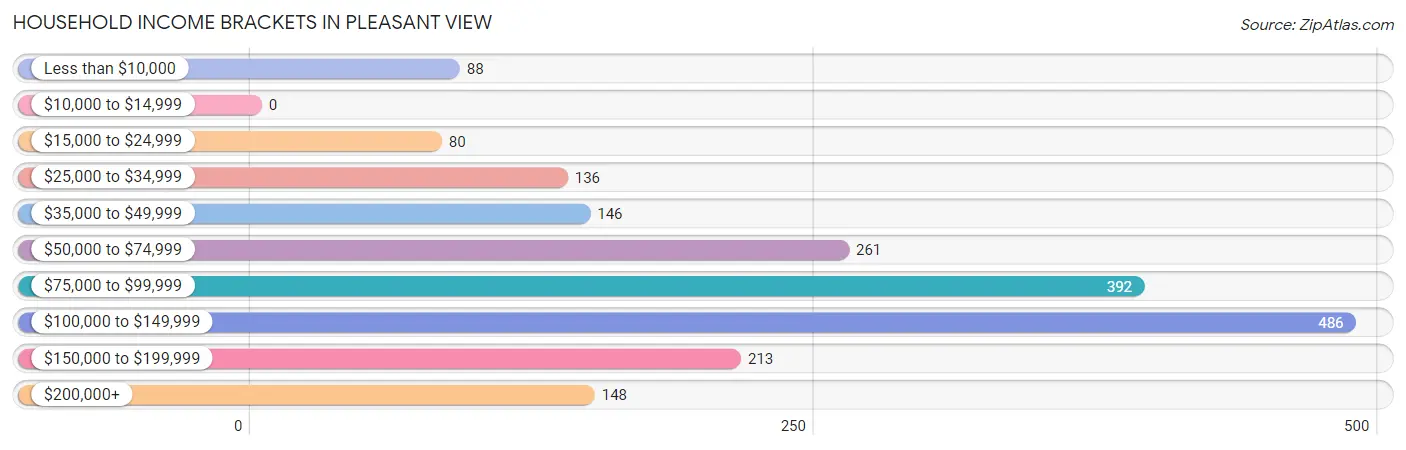
Household Income Brackets in Pleasant View
With 486 households falling in the category, the $100,000 to $149,999 income range is the most frequent in Pleasant View, accounting for 24.9% of all households.
| Income Bracket | # Households | % Households |
| Less than $10,000 | 88 | 4.5% |
| $10,000 to $14,999 | 0 | 0.0% |
| $15,000 to $24,999 | 80 | 4.1% |
| $25,000 to $34,999 | 136 | 7.0% |
| $35,000 to $49,999 | 146 | 7.5% |
| $50,000 to $74,999 | 261 | 13.4% |
| $75,000 to $99,999 | 392 | 20.1% |
| $100,000 to $149,999 | 486 | 24.9% |
| $150,000 to $199,999 | 213 | 10.9% |
| $200,000+ | 148 | 7.6% |
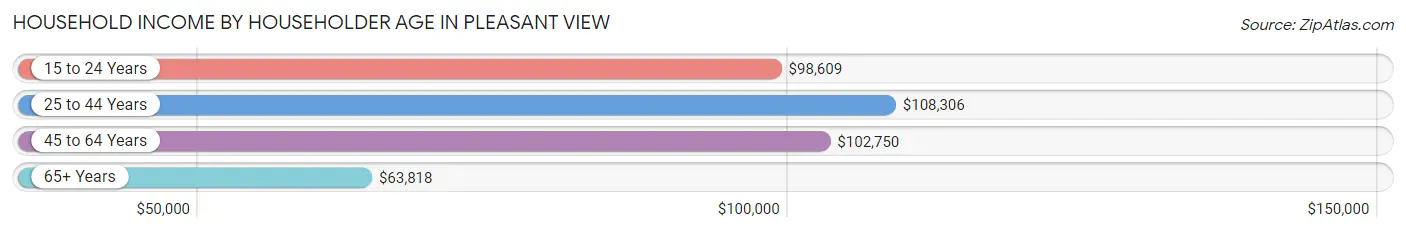
Household Income by Householder Age in Pleasant View
The median household income in Pleasant View is $93,333, with the highest median household income of $108,306 found in the 25 to 44 years age bracket for the primary householder. A total of 688 households (35.3%) fall into this category. Meanwhile, the 65+ years age bracket for the primary householder has the lowest median household income of $63,818, with 553 households (28.4%) in this group.
| Income Bracket | # Households | Median Income |
| 15 to 24 Years | 79 (4.1%) | $98,609 |
| 25 to 44 Years | 688 (35.3%) | $108,306 |
| 45 to 64 Years | 630 (32.3%) | $102,750 |
| 65+ Years | 553 (28.4%) | $63,818 |
| Total | 1,950 (100.0%) | $93,333 |
Poverty in Pleasant View
Income Below Poverty by Sex and Age in Pleasant View
With 2.2% poverty level for males and 11.0% for females among the residents of Pleasant View, 65 to 74 year old males and 75 year old and over females are the most vulnerable to poverty, with 29 males (8.7%) and 29 females (28.4%) in their respective age groups living below the poverty level.
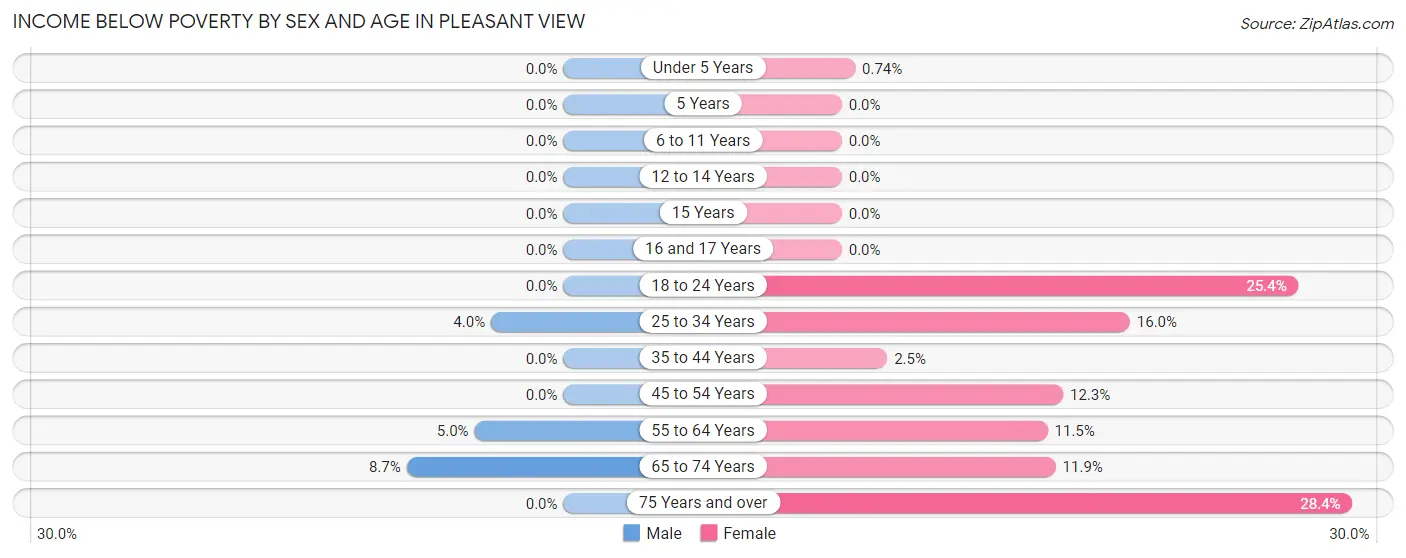
| Age Bracket | Male | Female |
| Under 5 Years | 0 (0.0%) | 1 (0.7%) |
| 5 Years | 0 (0.0%) | 0 (0.0%) |
| 6 to 11 Years | 0 (0.0%) | 0 (0.0%) |
| 12 to 14 Years | 0 (0.0%) | 0 (0.0%) |
| 15 Years | 0 (0.0%) | 0 (0.0%) |
| 16 and 17 Years | 0 (0.0%) | 0 (0.0%) |
| 18 to 24 Years | 0 (0.0%) | 59 (25.4%) |
| 25 to 34 Years | 16 (4.0%) | 51 (16.0%) |
| 35 to 44 Years | 0 (0.0%) | 8 (2.5%) |
| 45 to 54 Years | 0 (0.0%) | 35 (12.3%) |
| 55 to 64 Years | 11 (5.0%) | 40 (11.5%) |
| 65 to 74 Years | 29 (8.7%) | 43 (11.9%) |
| 75 Years and over | 0 (0.0%) | 29 (28.4%) |
| Total | 56 (2.2%) | 266 (11.0%) |
Income Above Poverty by Sex and Age in Pleasant View
According to the poverty statistics in Pleasant View, males aged under 5 years and females aged 5 years are the age groups that are most secure financially, with 100.0% of males and 100.0% of females in these age groups living above the poverty line.
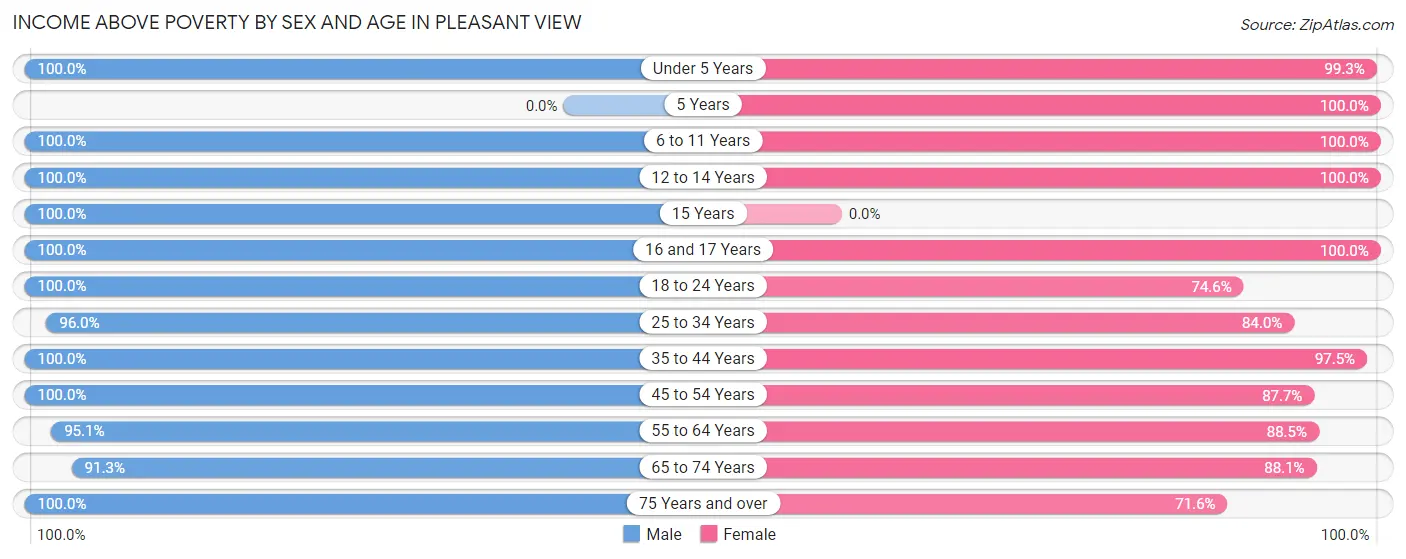
| Age Bracket | Male | Female |
| Under 5 Years | 92 (100.0%) | 135 (99.3%) |
| 5 Years | 0 (0.0%) | 31 (100.0%) |
| 6 to 11 Years | 211 (100.0%) | 125 (100.0%) |
| 12 to 14 Years | 122 (100.0%) | 107 (100.0%) |
| 15 Years | 65 (100.0%) | 0 (0.0%) |
| 16 and 17 Years | 79 (100.0%) | 59 (100.0%) |
| 18 to 24 Years | 205 (100.0%) | 173 (74.6%) |
| 25 to 34 Years | 381 (96.0%) | 267 (84.0%) |
| 35 to 44 Years | 340 (100.0%) | 308 (97.5%) |
| 45 to 54 Years | 441 (100.0%) | 249 (87.7%) |
| 55 to 64 Years | 211 (95.1%) | 309 (88.5%) |
| 65 to 74 Years | 303 (91.3%) | 318 (88.1%) |
| 75 Years and over | 19 (100.0%) | 73 (71.6%) |
| Total | 2,469 (97.8%) | 2,154 (89.0%) |
Income Below Poverty Among Married-Couple Families in Pleasant View
The poverty statistics for married-couple families in Pleasant View show that 3.5% or 39 of the total 1,125 families live below the poverty line. Families with no children have the highest poverty rate of 6.6%, comprising of 39 families. On the other hand, families with 1 or 2 children have the lowest poverty rate of 0.0%, which includes 0 families.
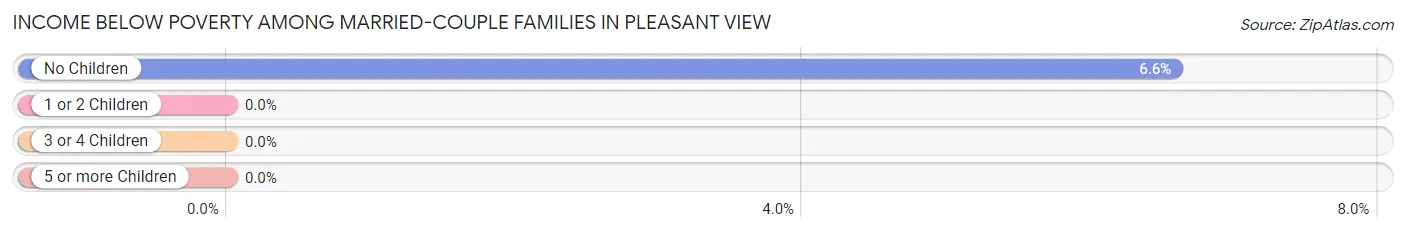
| Children | Above Poverty | Below Poverty |
| No Children | 554 (93.4%) | 39 (6.6%) |
| 1 or 2 Children | 473 (100.0%) | 0 (0.0%) |
| 3 or 4 Children | 59 (100.0%) | 0 (0.0%) |
| 5 or more Children | 0 (0.0%) | 0 (0.0%) |
| Total | 1,086 (96.5%) | 39 (3.5%) |
Income Below Poverty Among Single-Parent Households in Pleasant View
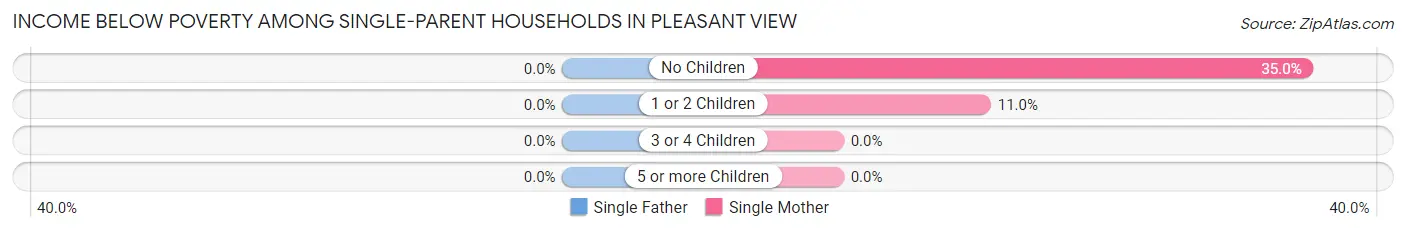
| Children | Single Father | Single Mother |
| No Children | 0 (0.0%) | 35 (35.0%) |
| 1 or 2 Children | 0 (0.0%) | 8 (11.0%) |
| 3 or 4 Children | 0 (0.0%) | 0 (0.0%) |
| 5 or more Children | 0 (0.0%) | 0 (0.0%) |
| Total | 0 (0.0%) | 43 (24.9%) |
Income Below Poverty Among Married-Couple vs Single-Parent Households in Pleasant View
The poverty data for Pleasant View shows that 39 of the married-couple family households (3.5%) and 43 of the single-parent households (16.1%) are living below the poverty level. Within the married-couple family households, those with no children have the highest poverty rate, with 39 households (6.6%) falling below the poverty line. Among the single-parent households, those with no children have the highest poverty rate, with 35 household (27.3%) living below poverty.
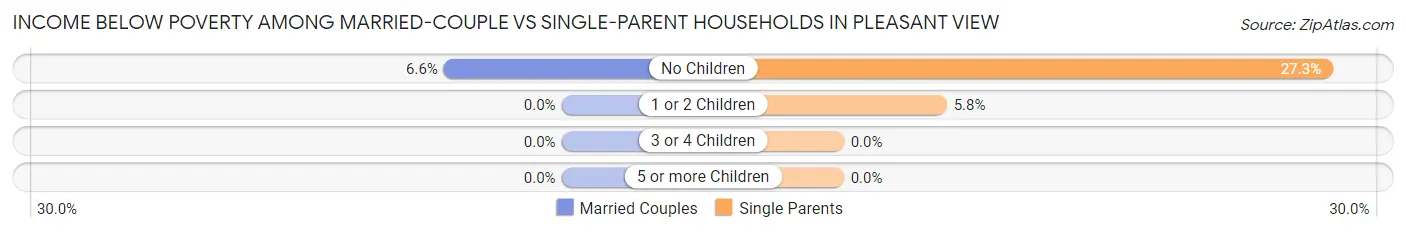
| Children | Married-Couple Families | Single-Parent Households |
| No Children | 39 (6.6%) | 35 (27.3%) |
| 1 or 2 Children | 0 (0.0%) | 8 (5.8%) |
| 3 or 4 Children | 0 (0.0%) | 0 (0.0%) |
| 5 or more Children | 0 (0.0%) | 0 (0.0%) |
| Total | 39 (3.5%) | 43 (16.1%) |
Race in Pleasant View
The most populous races in Pleasant View are White / Caucasian (4,608 | 93.2%), Two or more Races (176 | 3.6%), and Hispanic or Latino (153 | 3.1%).
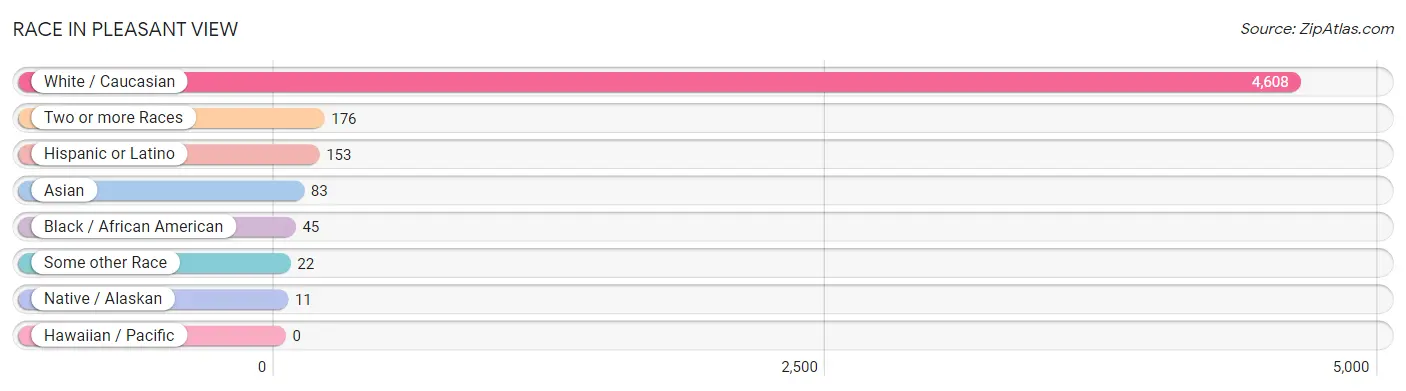
| Race | # Population | % Population |
| Asian | 83 | 1.7% |
| Black / African American | 45 | 0.9% |
| Hawaiian / Pacific | 0 | 0.0% |
| Hispanic or Latino | 153 | 3.1% |
| Native / Alaskan | 11 | 0.2% |
| White / Caucasian | 4,608 | 93.2% |
| Two or more Races | 176 | 3.6% |
| Some other Race | 22 | 0.4% |
| Total | 4,945 | 100.0% |
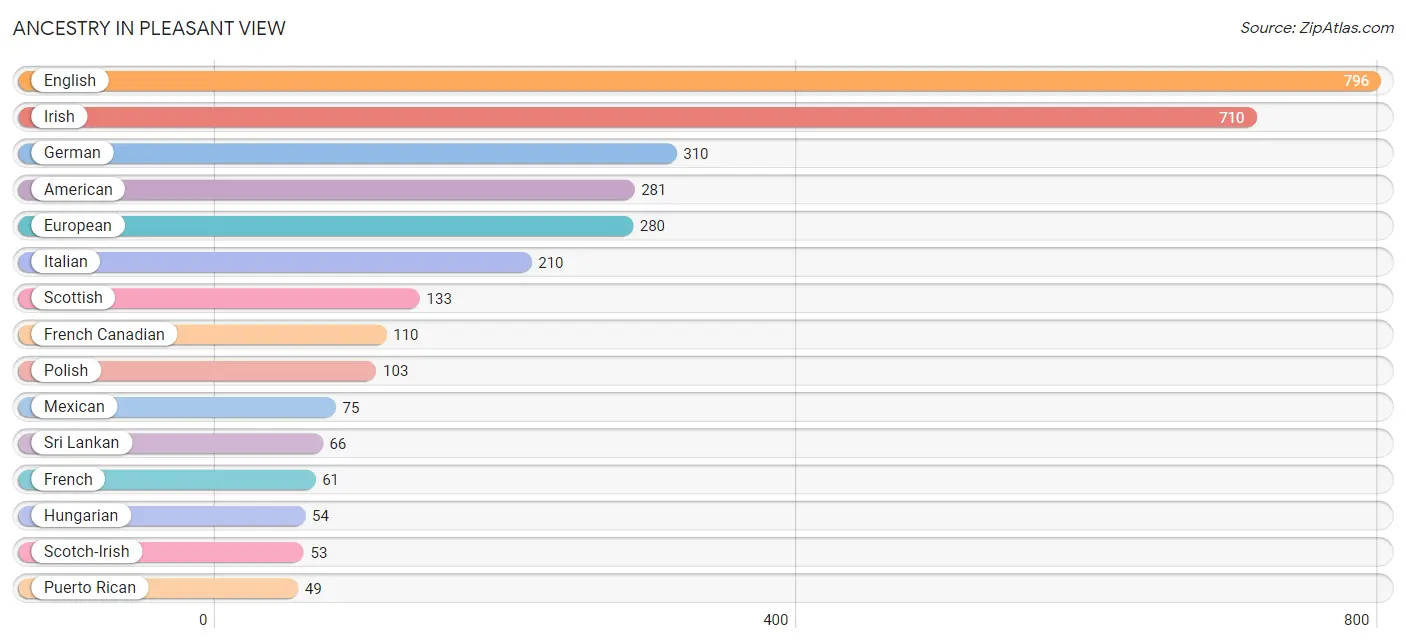
Ancestry in Pleasant View
The most populous ancestries reported in Pleasant View are English (796 | 16.1%), Irish (710 | 14.4%), German (310 | 6.3%), American (281 | 5.7%), and European (280 | 5.7%), together accounting for 48.1% of all Pleasant View residents.
| Ancestry | # Population | % Population |
| Alaskan Athabascan | 13 | 0.3% |
| American | 281 | 5.7% |
| Belgian | 24 | 0.5% |
| British | 9 | 0.2% |
| Burmese | 17 | 0.3% |
| Canadian | 29 | 0.6% |
| Central American | 27 | 0.5% |
| Cherokee | 16 | 0.3% |
| Cuban | 1 | 0.0% |
| Danish | 11 | 0.2% |
| Dutch | 10 | 0.2% |
| Eastern European | 26 | 0.5% |
| English | 796 | 16.1% |
| European | 280 | 5.7% |
| French | 61 | 1.2% |
| French Canadian | 110 | 2.2% |
| German | 310 | 6.3% |
| Honduran | 27 | 0.5% |
| Hungarian | 54 | 1.1% |
| Irish | 710 | 14.4% |
| Italian | 210 | 4.3% |
| Mexican | 75 | 1.5% |
| Polish | 103 | 2.1% |
| Puerto Rican | 49 | 1.0% |
| Russian | 37 | 0.7% |
| Scotch-Irish | 53 | 1.1% |
| Scottish | 133 | 2.7% |
| Sri Lankan | 66 | 1.3% |
| Welsh | 12 | 0.2% | View All 29 Rows |
Immigrants in Pleasant View
The most numerous immigrant groups reported in Pleasant View came from Asia (59 | 1.2%), South Eastern Asia (42 | 0.9%), Vietnam (42 | 0.9%), Eastern Asia (17 | 0.3%), and Korea (17 | 0.3%), together accounting for 3.6% of all Pleasant View residents.
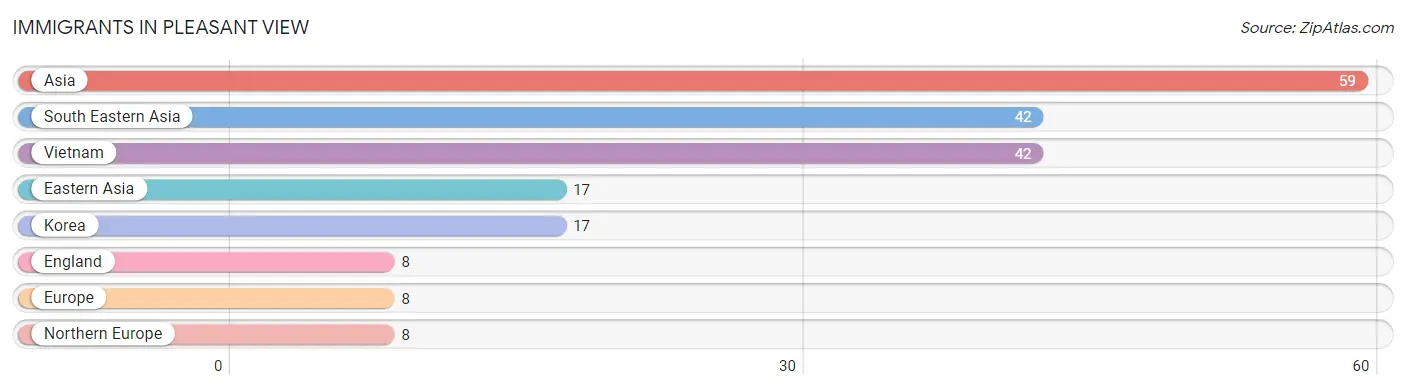
| Immigration Origin | # Population | % Population |
| Asia | 59 | 1.2% |
| Eastern Asia | 17 | 0.3% |
| England | 8 | 0.2% |
| Europe | 8 | 0.2% |
| Korea | 17 | 0.3% |
| Northern Europe | 8 | 0.2% |
| South Eastern Asia | 42 | 0.9% |
| Vietnam | 42 | 0.9% | View All 8 Rows |
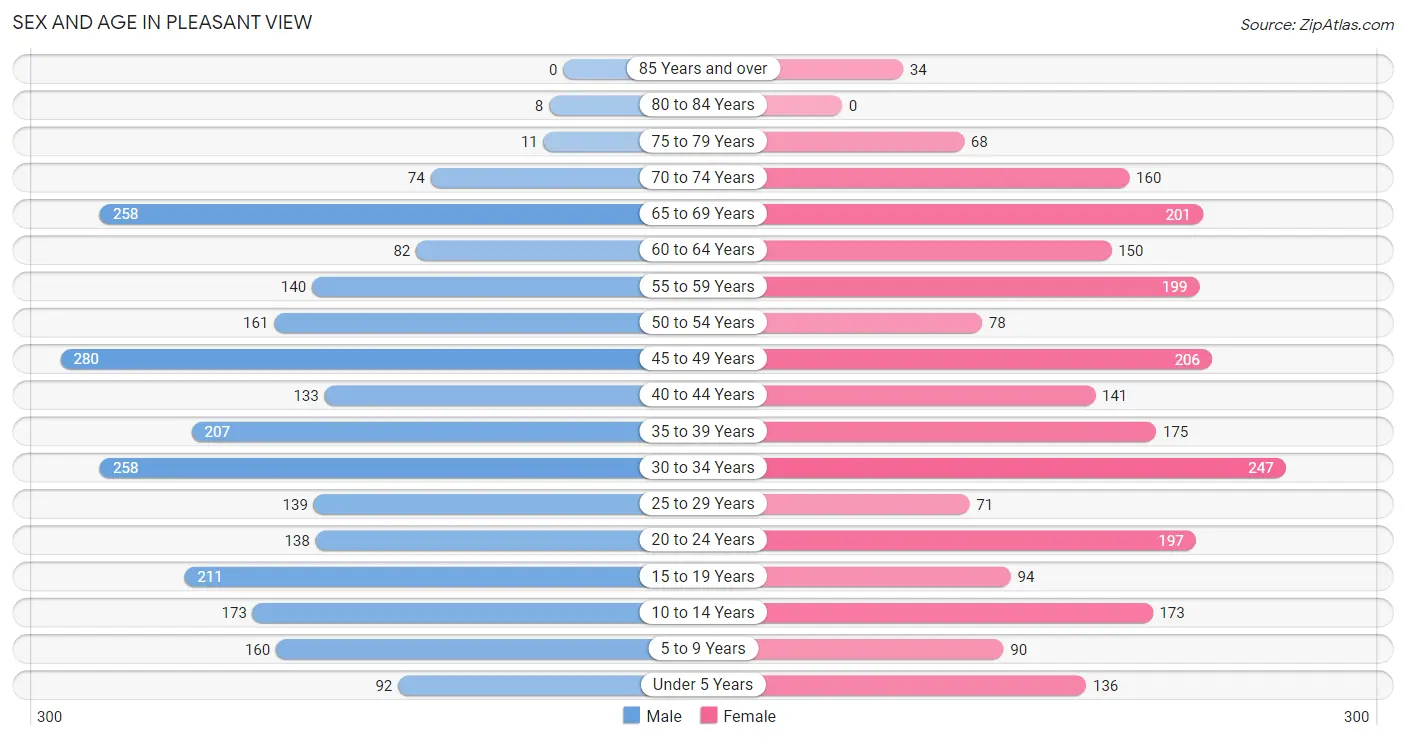
Sex and Age in Pleasant View
Sex and Age in Pleasant View
The most populous age groups in Pleasant View are 45 to 49 Years (280 | 11.1%) for men and 30 to 34 Years (247 | 10.2%) for women.
| Age Bracket | Male | Female |
| Under 5 Years | 92 (3.6%) | 136 (5.6%) |
| 5 to 9 Years | 160 (6.3%) | 90 (3.7%) |
| 10 to 14 Years | 173 (6.9%) | 173 (7.1%) |
| 15 to 19 Years | 211 (8.4%) | 94 (3.9%) |
| 20 to 24 Years | 138 (5.5%) | 197 (8.1%) |
| 25 to 29 Years | 139 (5.5%) | 71 (2.9%) |
| 30 to 34 Years | 258 (10.2%) | 247 (10.2%) |
| 35 to 39 Years | 207 (8.2%) | 175 (7.2%) |
| 40 to 44 Years | 133 (5.3%) | 141 (5.8%) |
| 45 to 49 Years | 280 (11.1%) | 206 (8.5%) |
| 50 to 54 Years | 161 (6.4%) | 78 (3.2%) |
| 55 to 59 Years | 140 (5.5%) | 199 (8.2%) |
| 60 to 64 Years | 82 (3.3%) | 150 (6.2%) |
| 65 to 69 Years | 258 (10.2%) | 201 (8.3%) |
| 70 to 74 Years | 74 (2.9%) | 160 (6.6%) |
| 75 to 79 Years | 11 (0.4%) | 68 (2.8%) |
| 80 to 84 Years | 8 (0.3%) | 0 (0.0%) |
| 85 Years and over | 0 (0.0%) | 34 (1.4%) |
| Total | 2,525 (100.0%) | 2,420 (100.0%) |
Families and Households in Pleasant View
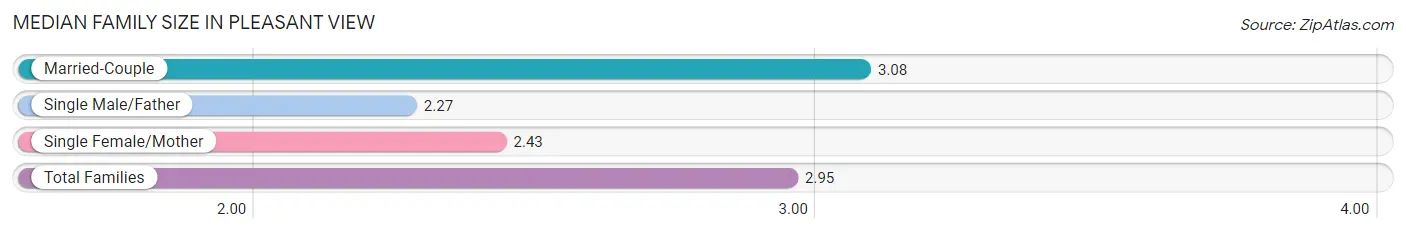
Median Family Size in Pleasant View
The median family size in Pleasant View is 2.95 persons per family, with married-couple families (1,125 | 80.8%) accounting for the largest median family size of 3.08 persons per family. On the other hand, single male/father families (94 | 6.8%) represent the smallest median family size with 2.27 persons per family.
| Family Type | # Families | Family Size |
| Married-Couple | 1,125 (80.8%) | 3.08 |
| Single Male/Father | 94 (6.8%) | 2.27 |
| Single Female/Mother | 173 (12.4%) | 2.43 |
| Total Families | 1,392 (100.0%) | 2.95 |
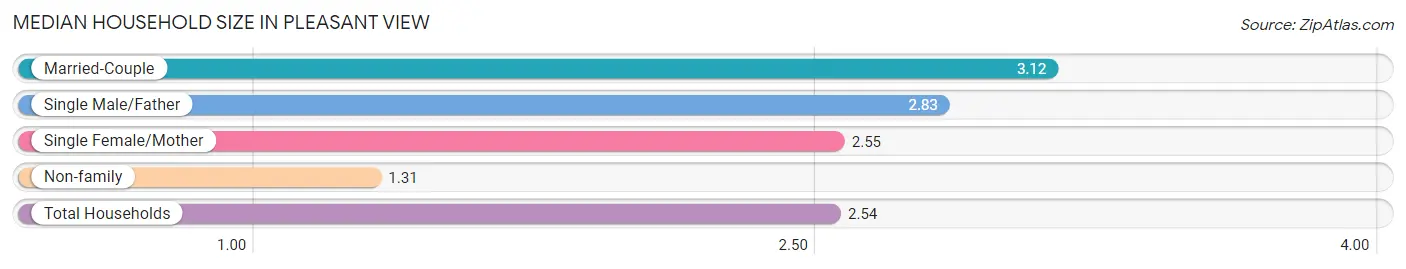
Median Household Size in Pleasant View
The median household size in Pleasant View is 2.54 persons per household, with married-couple households (1,125 | 57.7%) accounting for the largest median household size of 3.12 persons per household. non-family households (558 | 28.6%) represent the smallest median household size with 1.31 persons per household.
| Household Type | # Households | Household Size |
| Married-Couple | 1,125 (57.7%) | 3.12 |
| Single Male/Father | 94 (4.8%) | 2.83 |
| Single Female/Mother | 173 (8.9%) | 2.55 |
| Non-family | 558 (28.6%) | 1.31 |
| Total Households | 1,950 (100.0%) | 2.54 |
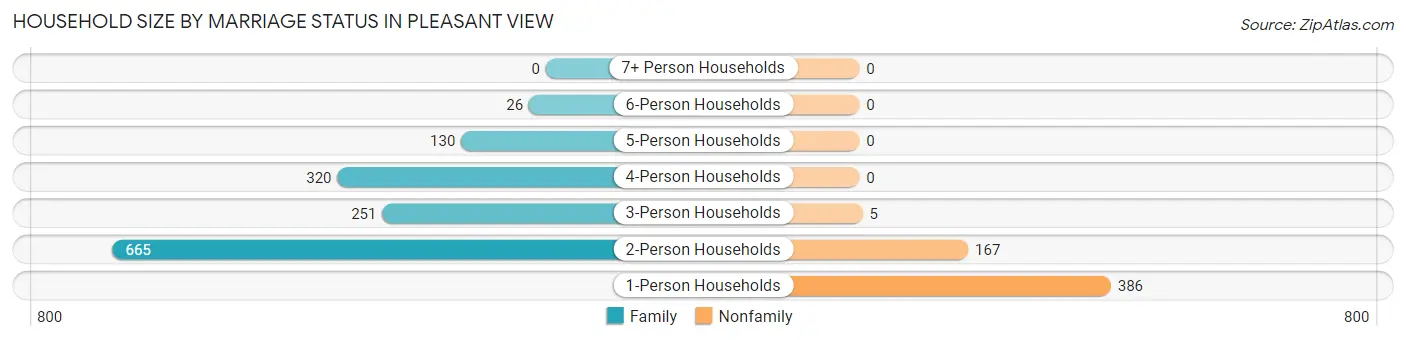
Household Size by Marriage Status in Pleasant View
Out of a total of 1,950 households in Pleasant View, 1,392 (71.4%) are family households, while 558 (28.6%) are nonfamily households. The most numerous type of family households are 2-person households, comprising 665, and the most common type of nonfamily households are 1-person households, comprising 386.
| Household Size | Family Households | Nonfamily Households |
| 1-Person Households | - | 386 (19.8%) |
| 2-Person Households | 665 (34.1%) | 167 (8.6%) |
| 3-Person Households | 251 (12.9%) | 5 (0.3%) |
| 4-Person Households | 320 (16.4%) | 0 (0.0%) |
| 5-Person Households | 130 (6.7%) | 0 (0.0%) |
| 6-Person Households | 26 (1.3%) | 0 (0.0%) |
| 7+ Person Households | 0 (0.0%) | 0 (0.0%) |
| Total | 1,392 (71.4%) | 558 (28.6%) |
Female Fertility in Pleasant View
Fertility by Age in Pleasant View
Average fertility rate in Pleasant View is 67.0 births per 1,000 women. Women in the age bracket of 20 to 34 years have the highest fertility rate with 76.0 births per 1,000 women. Women in the age bracket of 20 to 34 years acount for 50.0% of all women with births.
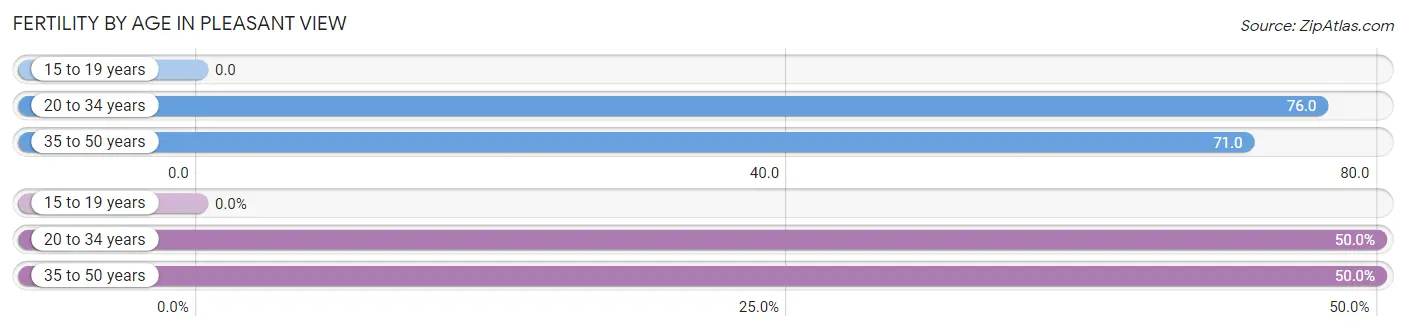
| Age Bracket | Women with Births | Births / 1,000 Women |
| 15 to 19 years | 0 (0.0%) | 0.0 |
| 20 to 34 years | 39 (50.0%) | 76.0 |
| 35 to 50 years | 39 (50.0%) | 71.0 |
| Total | 78 (100.0%) | 67.0 |
Fertility by Age by Marriage Status in Pleasant View
83.3% of women with births (78) in Pleasant View are married. The highest percentage of unmarried women with births falls into 20 to 34 years age bracket with 33.3% of them unmarried at the time of birth, while the lowest percentage of unmarried women with births belong to 35 to 50 years age bracket with 0.0% of them unmarried.
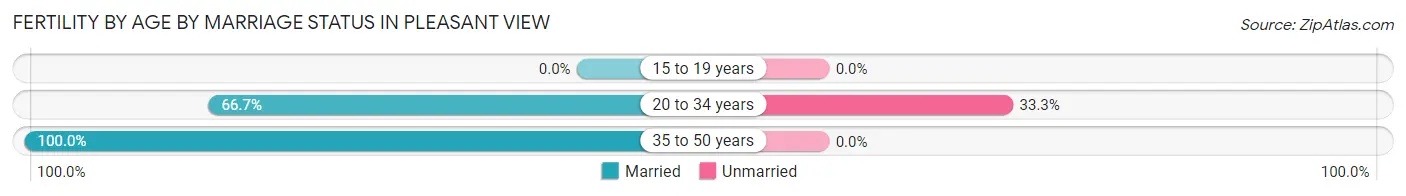
| Age Bracket | Married | Unmarried |
| 15 to 19 years | 0 (0.0%) | 0 (0.0%) |
| 20 to 34 years | 26 (66.7%) | 13 (33.3%) |
| 35 to 50 years | 39 (100.0%) | 0 (0.0%) |
| Total | 65 (83.3%) | 13 (16.7%) |
Fertility by Education in Pleasant View
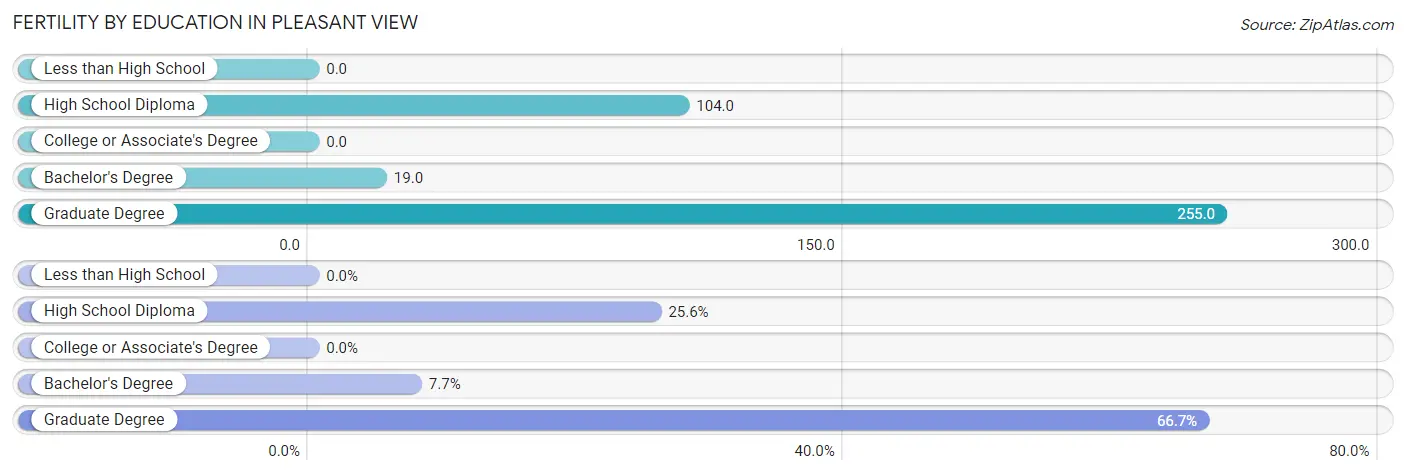
| Educational Attainment | Women with Births | Births / 1,000 Women |
| Less than High School | 0 (0.0%) | 0.0 |
| High School Diploma | 20 (25.6%) | 104.0 |
| College or Associate's Degree | 0 (0.0%) | 0.0 |
| Bachelor's Degree | 6 (7.7%) | 19.0 |
| Graduate Degree | 52 (66.7%) | 255.0 |
| Total | 78 (100.0%) | 67.0 |
Fertility by Education by Marriage Status in Pleasant View
16.7% of women with births in Pleasant View are unmarried. Women with the educational attainment of high school diploma are most likely to be married with 100.0% of them married at childbirth, while women with the educational attainment of graduate degree are least likely to be married with 25.0% of them unmarried at childbirth.
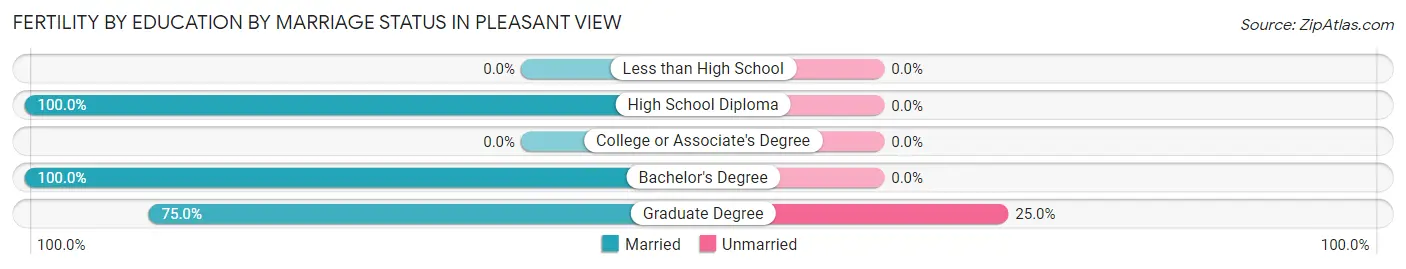
| Educational Attainment | Married | Unmarried |
| Less than High School | 0 (0.0%) | 0 (0.0%) |
| High School Diploma | 20 (100.0%) | 0 (0.0%) |
| College or Associate's Degree | 0 (0.0%) | 0 (0.0%) |
| Bachelor's Degree | 6 (100.0%) | 0 (0.0%) |
| Graduate Degree | 39 (75.0%) | 13 (25.0%) |
| Total | 65 (83.3%) | 13 (16.7%) |
Employment Characteristics in Pleasant View
Employment by Class of Employer in Pleasant View
Among the 2,570 employed individuals in Pleasant View, private company employees (1,731 | 67.3%), local government employees (334 | 13.0%), and self-employed (not incorporated) (170 | 6.6%) make up the most common classes of employment.
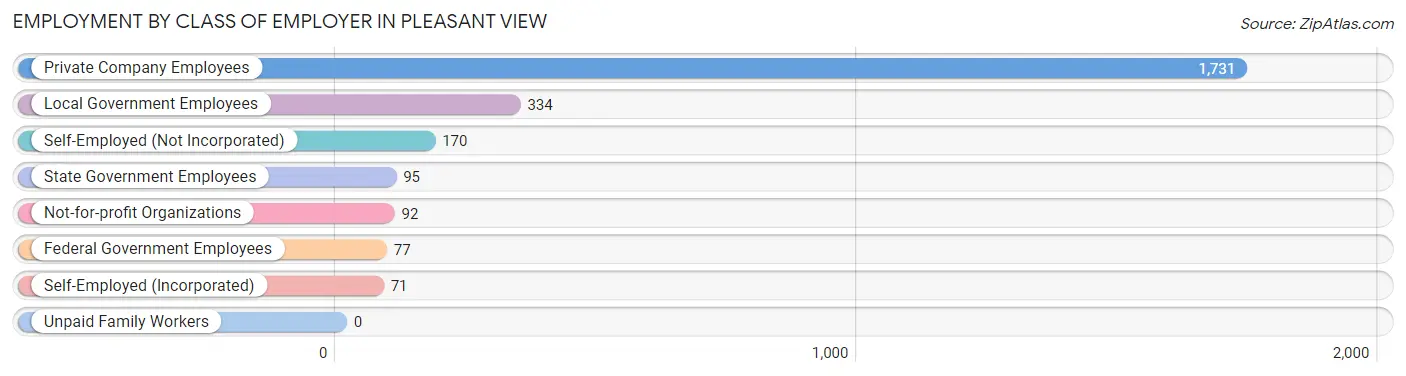
| Employer Class | # Employees | % Employees |
| Private Company Employees | 1,731 | 67.3% |
| Self-Employed (Incorporated) | 71 | 2.8% |
| Self-Employed (Not Incorporated) | 170 | 6.6% |
| Not-for-profit Organizations | 92 | 3.6% |
| Local Government Employees | 334 | 13.0% |
| State Government Employees | 95 | 3.7% |
| Federal Government Employees | 77 | 3.0% |
| Unpaid Family Workers | 0 | 0.0% |
| Total | 2,570 | 100.0% |
Employment Status by Age in Pleasant View
According to the labor force statistics for Pleasant View, out of the total population over 16 years of age (4,056), 66.9% or 2,713 individuals are in the labor force, with 3.8% or 103 of them unemployed. The age group with the highest labor force participation rate is 25 to 29 years, with 100.0% or 210 individuals in the labor force. Within the labor force, the 25 to 29 years age range has the highest percentage of unemployed individuals, with 15.2% or 32 of them being unemployed.
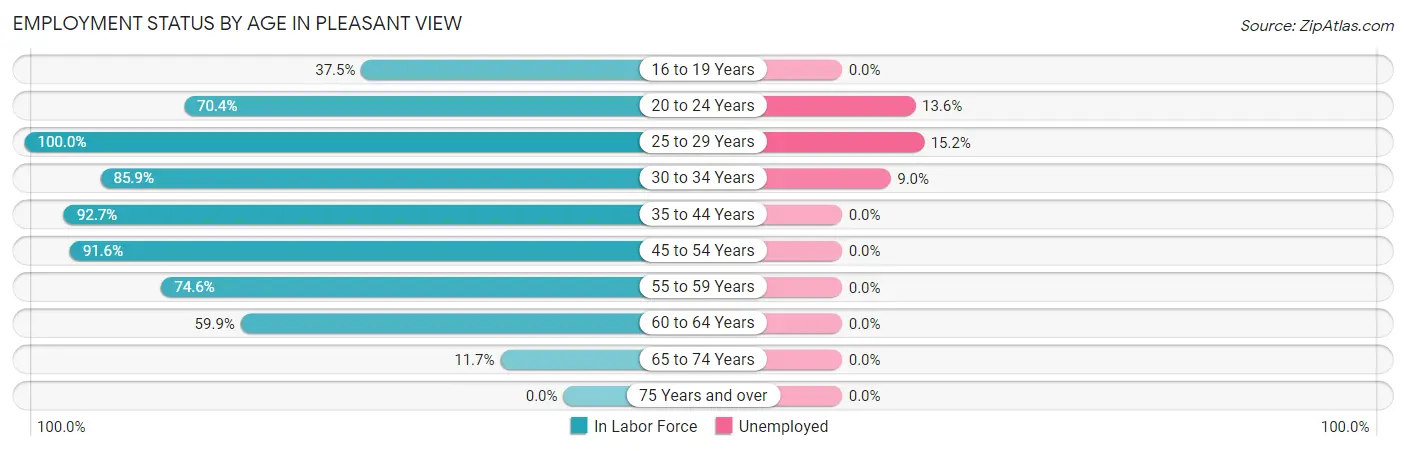
| Age Bracket | In Labor Force | Unemployed |
| 16 to 19 Years | 90 (37.5%) | 0 (0.0%) |
| 20 to 24 Years | 236 (70.4%) | 32 (13.6%) |
| 25 to 29 Years | 210 (100.0%) | 32 (15.2%) |
| 30 to 34 Years | 434 (85.9%) | 39 (9.0%) |
| 35 to 44 Years | 608 (92.7%) | 0 (0.0%) |
| 45 to 54 Years | 664 (91.6%) | 0 (0.0%) |
| 55 to 59 Years | 253 (74.6%) | 0 (0.0%) |
| 60 to 64 Years | 139 (59.9%) | 0 (0.0%) |
| 65 to 74 Years | 81 (11.7%) | 0 (0.0%) |
| 75 Years and over | 0 (0.0%) | 0 (0.0%) |
| Total | 2,713 (66.9%) | 103 (3.8%) |
Employment Status by Educational Attainment in Pleasant View
According to labor force statistics for Pleasant View, 86.5% of individuals (2,307) out of the total population between 25 and 64 years of age (2,667) are in the labor force, with 3.1% or 72 of them being unemployed. The group with the highest labor force participation rate are those with the educational attainment of less than high school, with 92.0% or 138 individuals in the labor force. Within the labor force, individuals with less than high school education have the highest percentage of unemployment, with 11.6% or 16 of them being unemployed.
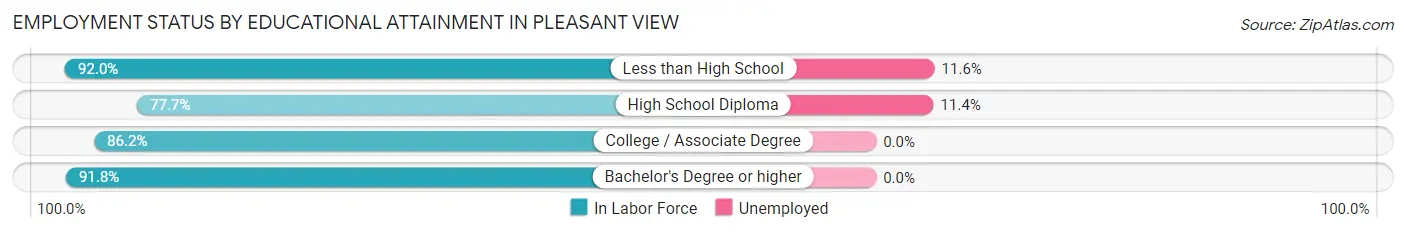
| Educational Attainment | In Labor Force | Unemployed |
| Less than High School | 138 (92.0%) | 17 (11.6%) |
| High School Diploma | 483 (77.7%) | 71 (11.4%) |
| College / Associate Degree | 806 (86.2%) | 0 (0.0%) |
| Bachelor's Degree or higher | 881 (91.8%) | 0 (0.0%) |
| Total | 2,307 (86.5%) | 83 (3.1%) |
Employment Occupations by Sex in Pleasant View
Management, Business, Science and Arts Occupations
The most common Management, Business, Science and Arts occupations in Pleasant View are Management (342 | 13.1%), Community & Social Service (326 | 12.5%), Education Instruction & Library (232 | 8.9%), Computers, Engineering & Science (204 | 7.8%), and Health Diagnosing & Treating (174 | 6.7%).
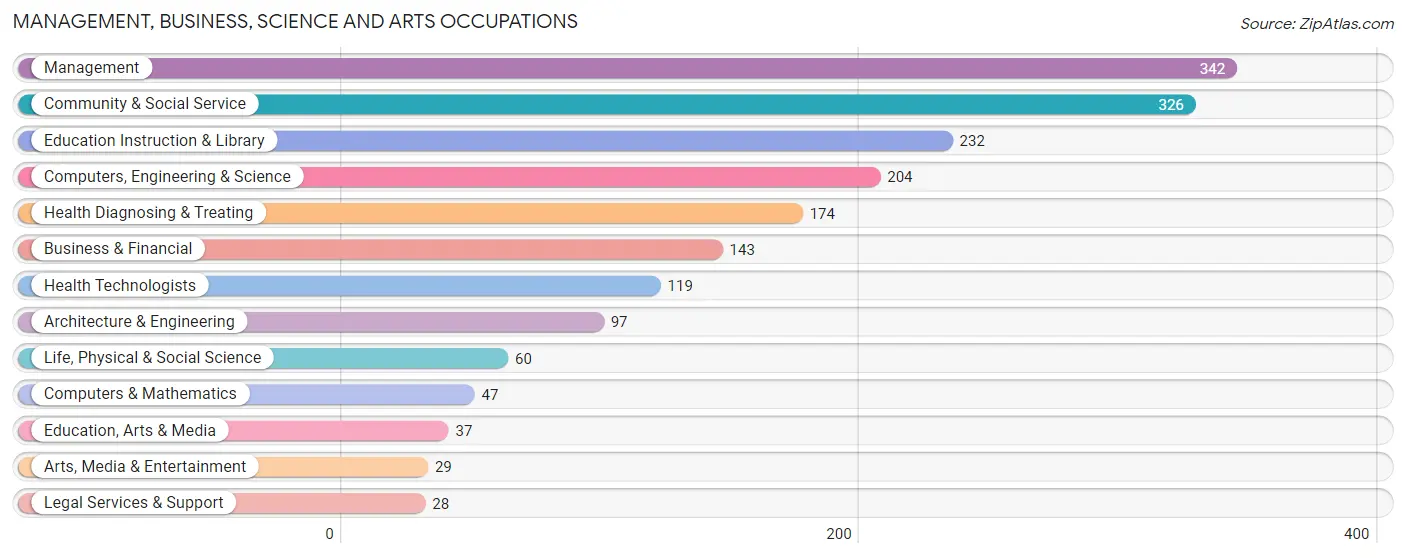
Management, Business, Science and Arts Occupations by Sex
Within the Management, Business, Science and Arts occupations in Pleasant View, the most male-oriented occupations are Arts, Media & Entertainment (100.0%), Management (78.4%), and Computers & Mathematics (76.6%), while the most female-oriented occupations are Life, Physical & Social Science (100.0%), Education, Arts & Media (100.0%), and Education Instruction & Library (81.5%).
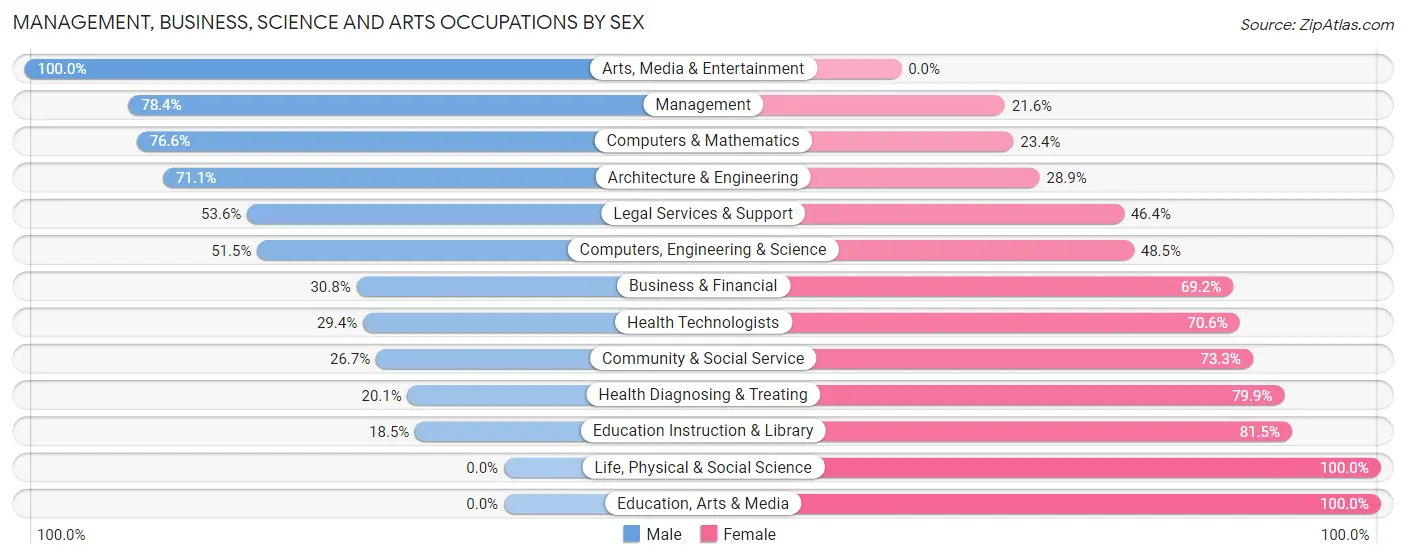
| Occupation | Male | Female |
| Management | 268 (78.4%) | 74 (21.6%) |
| Business & Financial | 44 (30.8%) | 99 (69.2%) |
| Computers, Engineering & Science | 105 (51.5%) | 99 (48.5%) |
| Computers & Mathematics | 36 (76.6%) | 11 (23.4%) |
| Architecture & Engineering | 69 (71.1%) | 28 (28.9%) |
| Life, Physical & Social Science | 0 (0.0%) | 60 (100.0%) |
| Community & Social Service | 87 (26.7%) | 239 (73.3%) |
| Education, Arts & Media | 0 (0.0%) | 37 (100.0%) |
| Legal Services & Support | 15 (53.6%) | 13 (46.4%) |
| Education Instruction & Library | 43 (18.5%) | 189 (81.5%) |
| Arts, Media & Entertainment | 29 (100.0%) | 0 (0.0%) |
| Health Diagnosing & Treating | 35 (20.1%) | 139 (79.9%) |
| Health Technologists | 35 (29.4%) | 84 (70.6%) |
| Total (Category) | 539 (45.3%) | 650 (54.7%) |
| Total (Overall) | 1,428 (54.7%) | 1,184 (45.3%) |
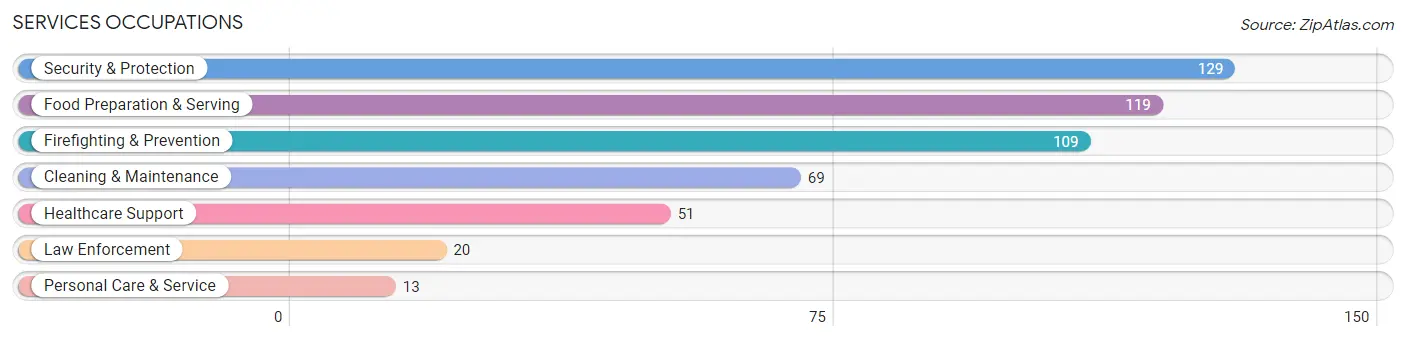
Services Occupations
The most common Services occupations in Pleasant View are Security & Protection (129 | 4.9%), Food Preparation & Serving (119 | 4.6%), Firefighting & Prevention (109 | 4.2%), Cleaning & Maintenance (69 | 2.6%), and Healthcare Support (51 | 1.9%).
Services Occupations by Sex
Within the Services occupations in Pleasant View, the most male-oriented occupations are Law Enforcement (100.0%), Cleaning & Maintenance (78.3%), and Security & Protection (66.7%), while the most female-oriented occupations are Healthcare Support (100.0%), Personal Care & Service (100.0%), and Food Preparation & Serving (64.7%).
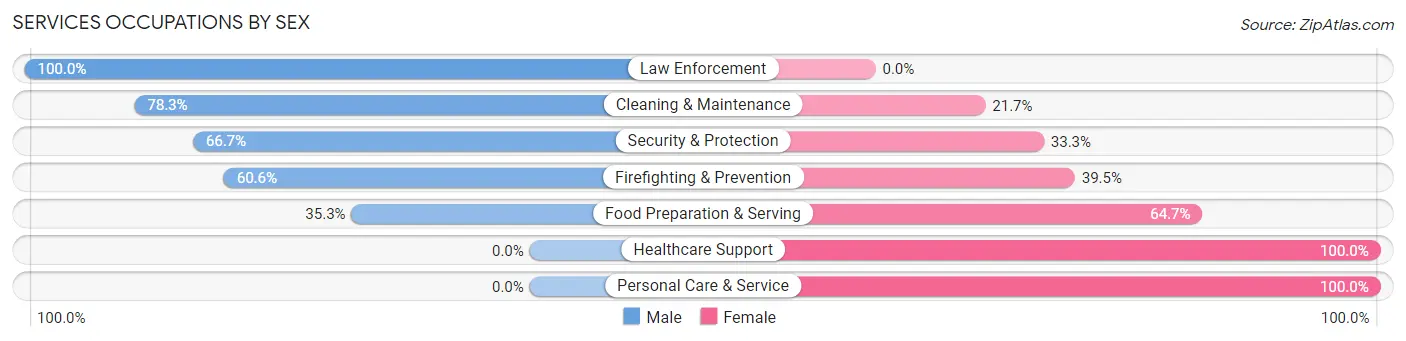
| Occupation | Male | Female |
| Healthcare Support | 0 (0.0%) | 51 (100.0%) |
| Security & Protection | 86 (66.7%) | 43 (33.3%) |
| Firefighting & Prevention | 66 (60.6%) | 43 (39.5%) |
| Law Enforcement | 20 (100.0%) | 0 (0.0%) |
| Food Preparation & Serving | 42 (35.3%) | 77 (64.7%) |
| Cleaning & Maintenance | 54 (78.3%) | 15 (21.7%) |
| Personal Care & Service | 0 (0.0%) | 13 (100.0%) |
| Total (Category) | 182 (47.8%) | 199 (52.2%) |
| Total (Overall) | 1,428 (54.7%) | 1,184 (45.3%) |
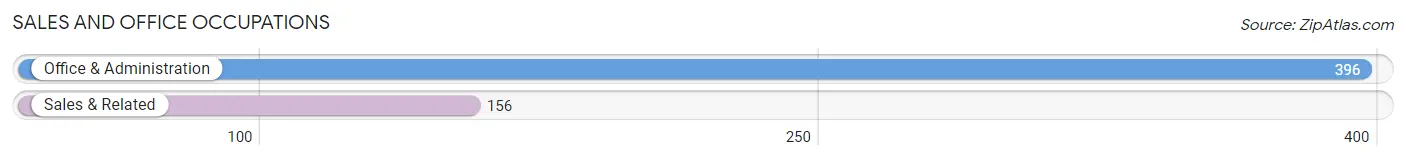
Sales and Office Occupations
The most common Sales and Office occupations in Pleasant View are Office & Administration (396 | 15.2%), and Sales & Related (156 | 6.0%).
Sales and Office Occupations by Sex
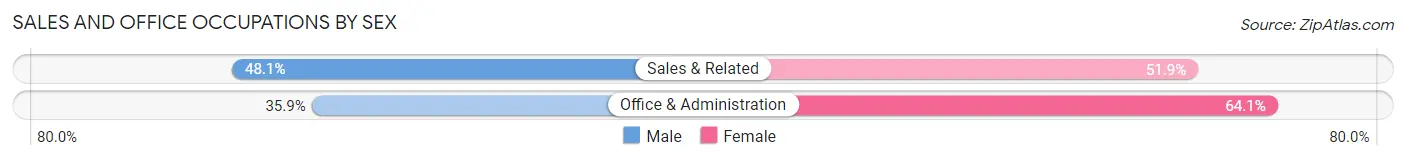
| Occupation | Male | Female |
| Sales & Related | 75 (48.1%) | 81 (51.9%) |
| Office & Administration | 142 (35.9%) | 254 (64.1%) |
| Total (Category) | 217 (39.3%) | 335 (60.7%) |
| Total (Overall) | 1,428 (54.7%) | 1,184 (45.3%) |
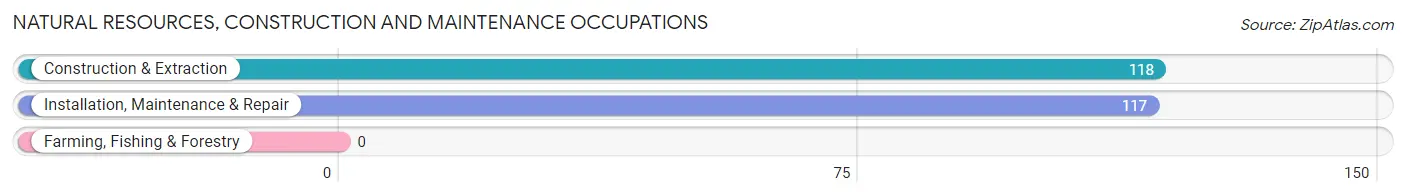
Natural Resources, Construction and Maintenance Occupations
The most common Natural Resources, Construction and Maintenance occupations in Pleasant View are Construction & Extraction (118 | 4.5%), and Installation, Maintenance & Repair (117 | 4.5%).
Natural Resources, Construction and Maintenance Occupations by Sex
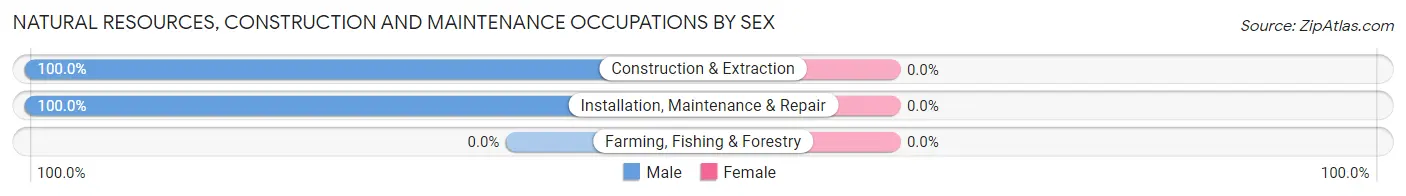
| Occupation | Male | Female |
| Farming, Fishing & Forestry | 0 (0.0%) | 0 (0.0%) |
| Construction & Extraction | 118 (100.0%) | 0 (0.0%) |
| Installation, Maintenance & Repair | 117 (100.0%) | 0 (0.0%) |
| Total (Category) | 235 (100.0%) | 0 (0.0%) |
| Total (Overall) | 1,428 (54.7%) | 1,184 (45.3%) |
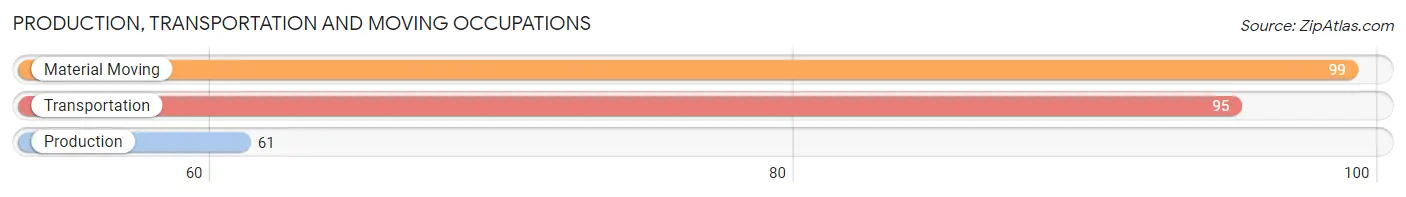
Production, Transportation and Moving Occupations
The most common Production, Transportation and Moving occupations in Pleasant View are Material Moving (99 | 3.8%), Transportation (95 | 3.6%), and Production (61 | 2.3%).
Production, Transportation and Moving Occupations by Sex
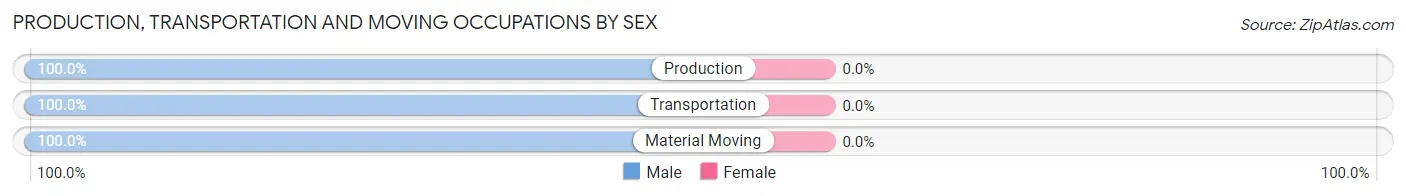
| Occupation | Male | Female |
| Production | 61 (100.0%) | 0 (0.0%) |
| Transportation | 95 (100.0%) | 0 (0.0%) |
| Material Moving | 99 (100.0%) | 0 (0.0%) |
| Total (Category) | 255 (100.0%) | 0 (0.0%) |
| Total (Overall) | 1,428 (54.7%) | 1,184 (45.3%) |
Employment Industries by Sex in Pleasant View
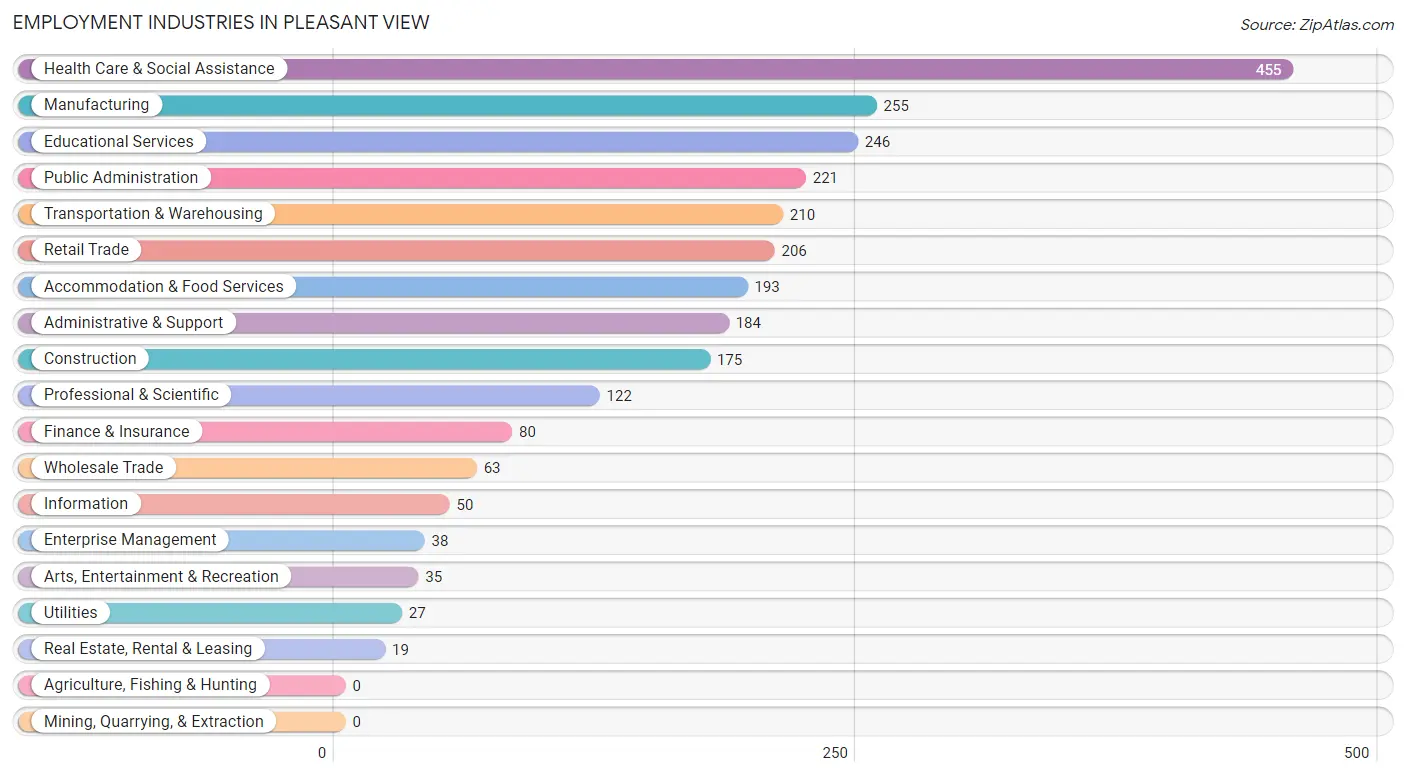
Employment Industries in Pleasant View
The major employment industries in Pleasant View include Health Care & Social Assistance (455 | 17.4%), Manufacturing (255 | 9.8%), Educational Services (246 | 9.4%), Public Administration (221 | 8.5%), and Transportation & Warehousing (210 | 8.0%).
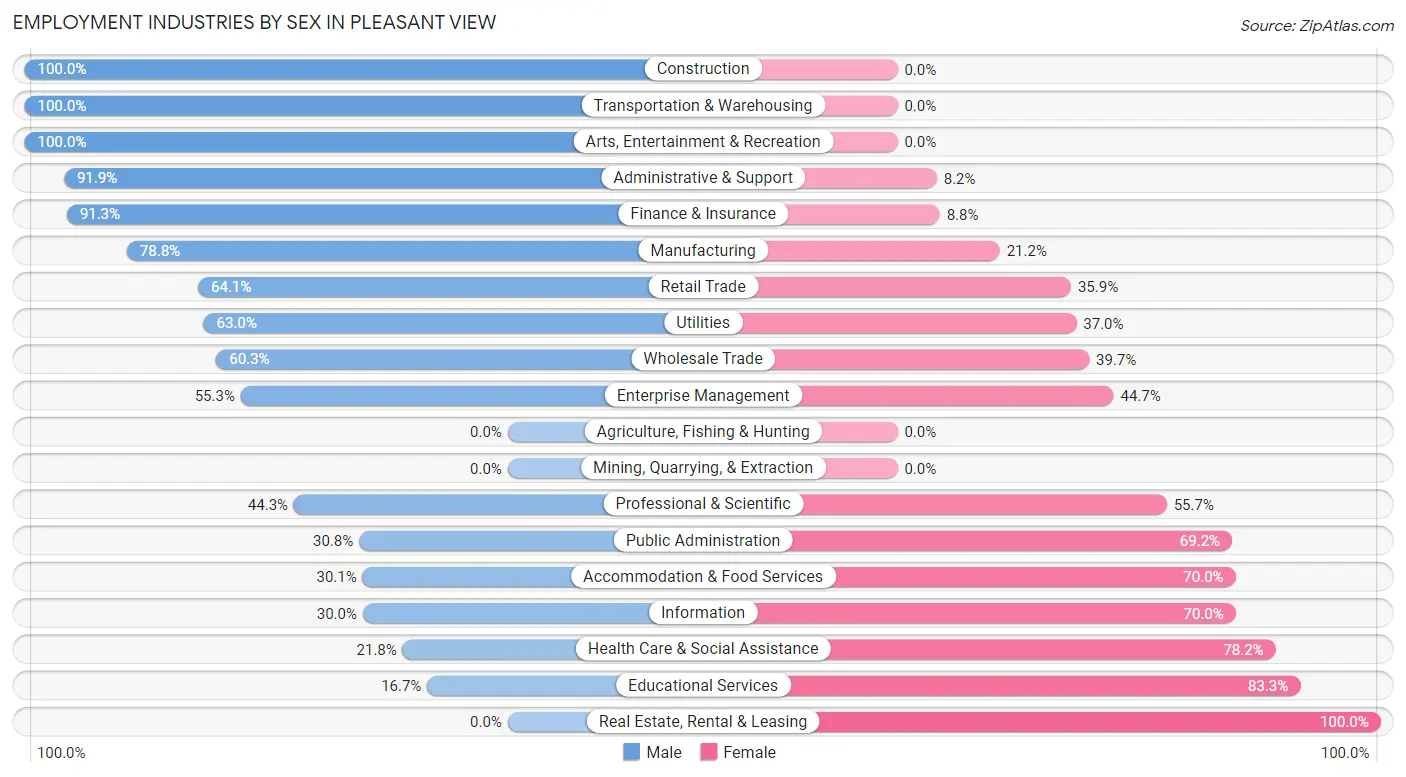
Employment Industries by Sex in Pleasant View
The Pleasant View industries that see more men than women are Construction (100.0%), Transportation & Warehousing (100.0%), and Arts, Entertainment & Recreation (100.0%), whereas the industries that tend to have a higher number of women are Real Estate, Rental & Leasing (100.0%), Educational Services (83.3%), and Health Care & Social Assistance (78.2%).
| Industry | Male | Female |
| Agriculture, Fishing & Hunting | 0 (0.0%) | 0 (0.0%) |
| Mining, Quarrying, & Extraction | 0 (0.0%) | 0 (0.0%) |
| Construction | 175 (100.0%) | 0 (0.0%) |
| Manufacturing | 201 (78.8%) | 54 (21.2%) |
| Wholesale Trade | 38 (60.3%) | 25 (39.7%) |
| Retail Trade | 132 (64.1%) | 74 (35.9%) |
| Transportation & Warehousing | 210 (100.0%) | 0 (0.0%) |
| Utilities | 17 (63.0%) | 10 (37.0%) |
| Information | 15 (30.0%) | 35 (70.0%) |
| Finance & Insurance | 73 (91.2%) | 7 (8.7%) |
| Real Estate, Rental & Leasing | 0 (0.0%) | 19 (100.0%) |
| Professional & Scientific | 54 (44.3%) | 68 (55.7%) |
| Enterprise Management | 21 (55.3%) | 17 (44.7%) |
| Administrative & Support | 169 (91.8%) | 15 (8.2%) |
| Educational Services | 41 (16.7%) | 205 (83.3%) |
| Health Care & Social Assistance | 99 (21.8%) | 356 (78.2%) |
| Arts, Entertainment & Recreation | 35 (100.0%) | 0 (0.0%) |
| Accommodation & Food Services | 58 (30.0%) | 135 (70.0%) |
| Public Administration | 68 (30.8%) | 153 (69.2%) |
| Total | 1,428 (54.7%) | 1,184 (45.3%) |
Education in Pleasant View
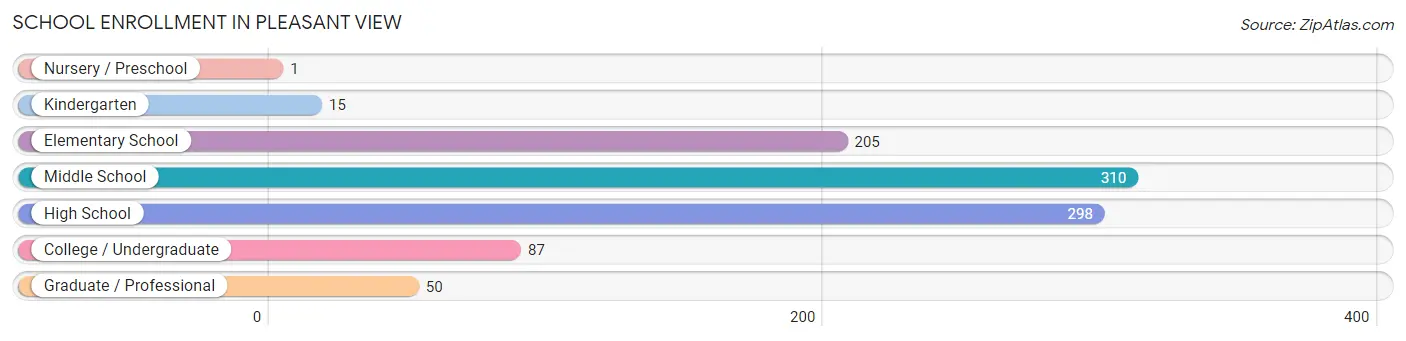
School Enrollment in Pleasant View
The most common levels of schooling among the 966 students in Pleasant View are middle school (310 | 32.1%), high school (298 | 30.8%), and elementary school (205 | 21.2%).
| School Level | # Students | % Students |
| Nursery / Preschool | 1 | 0.1% |
| Kindergarten | 15 | 1.5% |
| Elementary School | 205 | 21.2% |
| Middle School | 310 | 32.1% |
| High School | 298 | 30.8% |
| College / Undergraduate | 87 | 9.0% |
| Graduate / Professional | 50 | 5.2% |
| Total | 966 | 100.0% |
School Enrollment by Age by Funding Source in Pleasant View
Out of a total of 966 students who are enrolled in schools in Pleasant View, 299 (31.0%) attend a private institution, while the remaining 667 (69.0%) are enrolled in public schools. The age group of 3 to 4 year olds has the highest likelihood of being enrolled in private schools, with 1 (100.0% in the age bracket) enrolled. Conversely, the age group of 18 to 19 year olds has the lowest likelihood of being enrolled in a private school, with 82 (100.0% in the age bracket) attending a public institution.
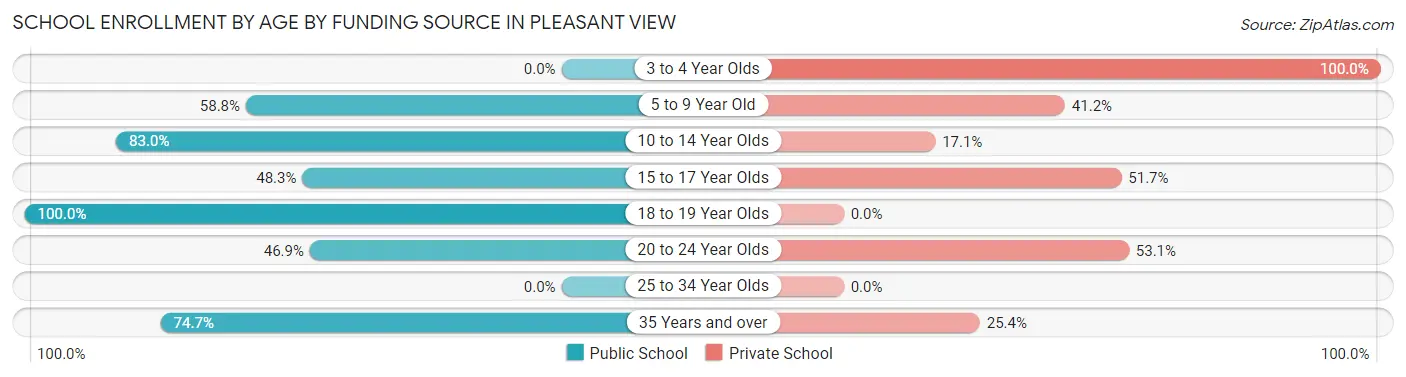
| Age Bracket | Public School | Private School |
| 3 to 4 Year Olds | 0 (0.0%) | 1 (100.0%) |
| 5 to 9 Year Old | 117 (58.8%) | 82 (41.2%) |
| 10 to 14 Year Olds | 287 (83.0%) | 59 (17.1%) |
| 15 to 17 Year Olds | 98 (48.3%) | 105 (51.7%) |
| 18 to 19 Year Olds | 82 (100.0%) | 0 (0.0%) |
| 20 to 24 Year Olds | 30 (46.9%) | 34 (53.1%) |
| 25 to 34 Year Olds | 0 (0.0%) | 0 (0.0%) |
| 35 Years and over | 53 (74.7%) | 18 (25.4%) |
| Total | 667 (69.0%) | 299 (31.0%) |
Educational Attainment by Field of Study in Pleasant View
Education (206 | 18.6%), business (168 | 15.2%), science & technology (158 | 14.3%), engineering (124 | 11.2%), and psychology (109 | 9.9%) are the most common fields of study among 1,105 individuals in Pleasant View who have obtained a bachelor's degree or higher.
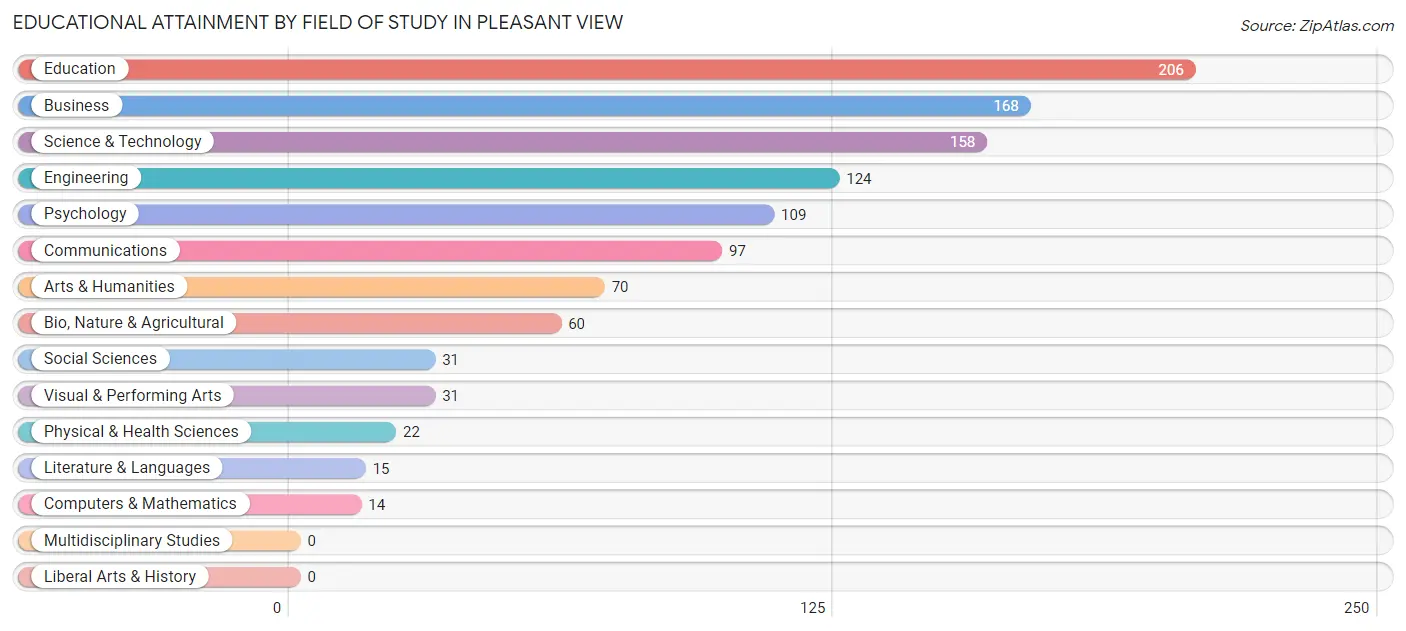
| Field of Study | # Graduates | % Graduates |
| Computers & Mathematics | 14 | 1.3% |
| Bio, Nature & Agricultural | 60 | 5.4% |
| Physical & Health Sciences | 22 | 2.0% |
| Psychology | 109 | 9.9% |
| Social Sciences | 31 | 2.8% |
| Engineering | 124 | 11.2% |
| Multidisciplinary Studies | 0 | 0.0% |
| Science & Technology | 158 | 14.3% |
| Business | 168 | 15.2% |
| Education | 206 | 18.6% |
| Literature & Languages | 15 | 1.4% |
| Liberal Arts & History | 0 | 0.0% |
| Visual & Performing Arts | 31 | 2.8% |
| Communications | 97 | 8.8% |
| Arts & Humanities | 70 | 6.3% |
| Total | 1,105 | 100.0% |
Transportation & Commute in Pleasant View
Vehicle Availability by Sex in Pleasant View
The most prevalent vehicle ownership categories in Pleasant View are males with 3 vehicles (509, accounting for 36.6%) and females with 3 vehicles (310, making up 43.2%).
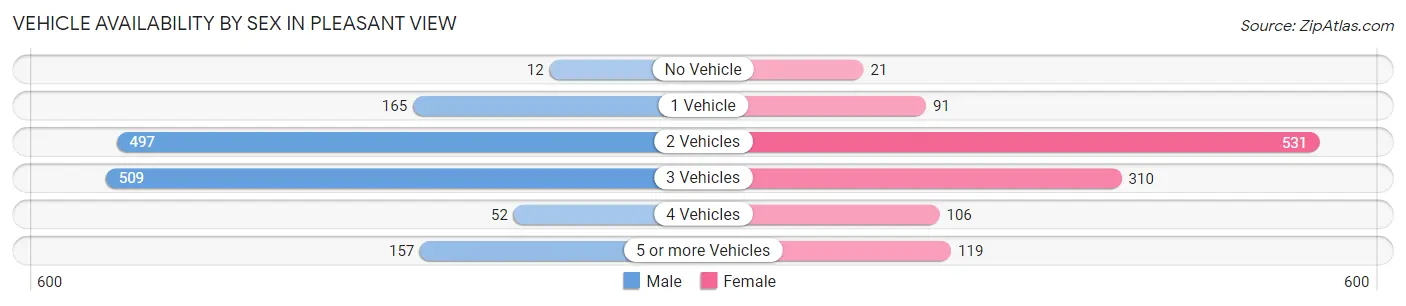
| Vehicles Available | Male | Female |
| No Vehicle | 12 (0.9%) | 21 (1.8%) |
| 1 Vehicle | 165 (11.8%) | 91 (7.7%) |
| 2 Vehicles | 497 (35.7%) | 531 (45.1%) |
| 3 Vehicles | 509 (36.6%) | 310 (26.3%) |
| 4 Vehicles | 52 (3.7%) | 106 (9.0%) |
| 5 or more Vehicles | 157 (11.3%) | 119 (10.1%) |
| Total | 1,392 (100.0%) | 1,178 (100.0%) |
Commute Time in Pleasant View
The most frequently occuring commute durations in Pleasant View are 45 to 59 minutes (577 commuters, 24.9%), 30 to 34 minutes (474 commuters, 20.5%), and 20 to 24 minutes (256 commuters, 11.1%).
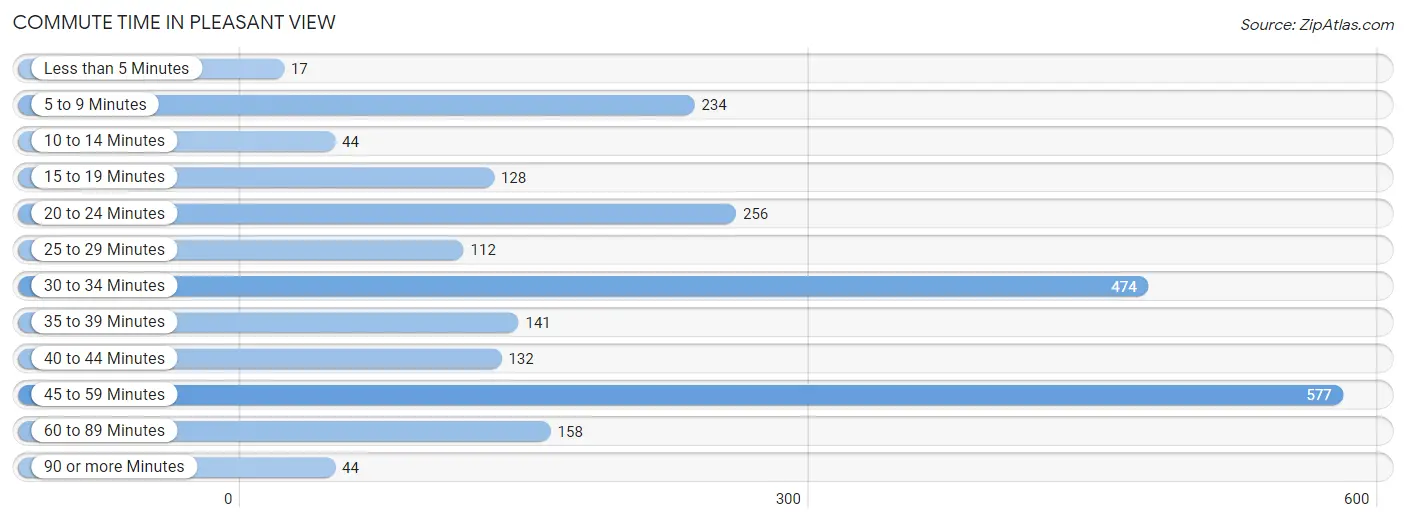
| Commute Time | # Commuters | % Commuters |
| Less than 5 Minutes | 17 | 0.7% |
| 5 to 9 Minutes | 234 | 10.1% |
| 10 to 14 Minutes | 44 | 1.9% |
| 15 to 19 Minutes | 128 | 5.5% |
| 20 to 24 Minutes | 256 | 11.1% |
| 25 to 29 Minutes | 112 | 4.8% |
| 30 to 34 Minutes | 474 | 20.5% |
| 35 to 39 Minutes | 141 | 6.1% |
| 40 to 44 Minutes | 132 | 5.7% |
| 45 to 59 Minutes | 577 | 24.9% |
| 60 to 89 Minutes | 158 | 6.8% |
| 90 or more Minutes | 44 | 1.9% |
Commute Time by Sex in Pleasant View
The most common commute times in Pleasant View are 45 to 59 minutes (373 commuters, 29.6%) for males and 5 to 9 minutes (204 commuters, 19.3%) for females.
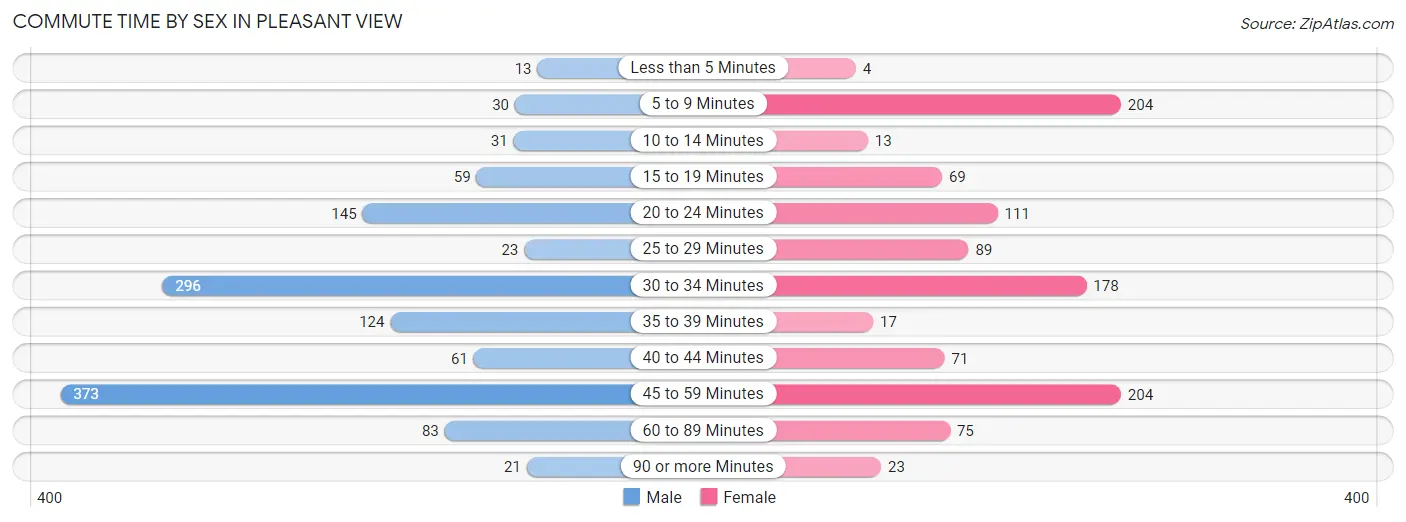
| Commute Time | Male | Female |
| Less than 5 Minutes | 13 (1.0%) | 4 (0.4%) |
| 5 to 9 Minutes | 30 (2.4%) | 204 (19.3%) |
| 10 to 14 Minutes | 31 (2.5%) | 13 (1.2%) |
| 15 to 19 Minutes | 59 (4.7%) | 69 (6.5%) |
| 20 to 24 Minutes | 145 (11.5%) | 111 (10.5%) |
| 25 to 29 Minutes | 23 (1.8%) | 89 (8.4%) |
| 30 to 34 Minutes | 296 (23.5%) | 178 (16.8%) |
| 35 to 39 Minutes | 124 (9.9%) | 17 (1.6%) |
| 40 to 44 Minutes | 61 (4.9%) | 71 (6.7%) |
| 45 to 59 Minutes | 373 (29.6%) | 204 (19.3%) |
| 60 to 89 Minutes | 83 (6.6%) | 75 (7.1%) |
| 90 or more Minutes | 21 (1.7%) | 23 (2.2%) |
Time of Departure to Work by Sex in Pleasant View
The most frequent times of departure to work in Pleasant View are 6:00 AM to 6:29 AM (335, 26.6%) for males and 6:30 AM to 6:59 AM (283, 26.8%) for females.
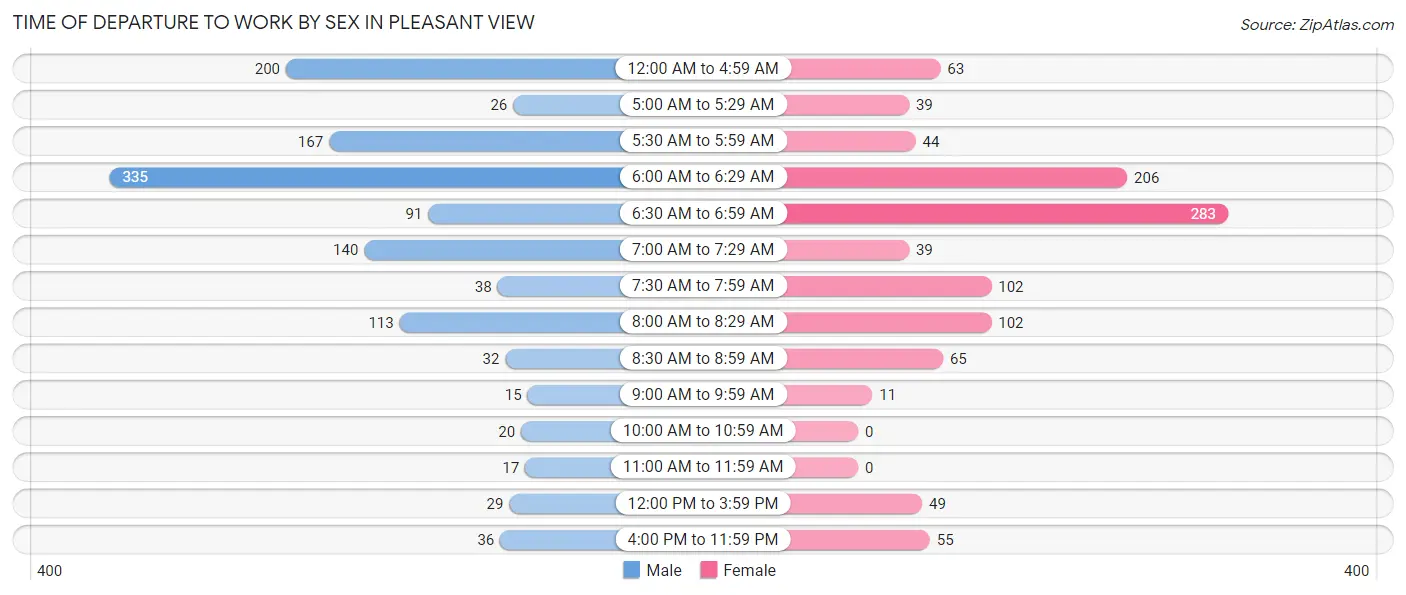
| Time of Departure | Male | Female |
| 12:00 AM to 4:59 AM | 200 (15.9%) | 63 (5.9%) |
| 5:00 AM to 5:29 AM | 26 (2.1%) | 39 (3.7%) |
| 5:30 AM to 5:59 AM | 167 (13.3%) | 44 (4.2%) |
| 6:00 AM to 6:29 AM | 335 (26.6%) | 206 (19.5%) |
| 6:30 AM to 6:59 AM | 91 (7.2%) | 283 (26.8%) |
| 7:00 AM to 7:29 AM | 140 (11.1%) | 39 (3.7%) |
| 7:30 AM to 7:59 AM | 38 (3.0%) | 102 (9.6%) |
| 8:00 AM to 8:29 AM | 113 (9.0%) | 102 (9.6%) |
| 8:30 AM to 8:59 AM | 32 (2.5%) | 65 (6.1%) |
| 9:00 AM to 9:59 AM | 15 (1.2%) | 11 (1.0%) |
| 10:00 AM to 10:59 AM | 20 (1.6%) | 0 (0.0%) |
| 11:00 AM to 11:59 AM | 17 (1.3%) | 0 (0.0%) |
| 12:00 PM to 3:59 PM | 29 (2.3%) | 49 (4.6%) |
| 4:00 PM to 11:59 PM | 36 (2.9%) | 55 (5.2%) |
| Total | 1,259 (100.0%) | 1,058 (100.0%) |
Housing Occupancy in Pleasant View
Occupancy by Ownership in Pleasant View
Of the total 1,950 dwellings in Pleasant View, owner-occupied units account for 1,597 (81.9%), while renter-occupied units make up 353 (18.1%).
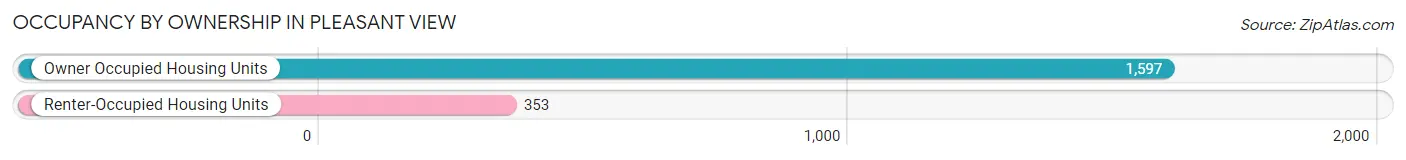
| Occupancy | # Housing Units | % Housing Units |
| Owner Occupied Housing Units | 1,597 | 81.9% |
| Renter-Occupied Housing Units | 353 | 18.1% |
| Total Occupied Housing Units | 1,950 | 100.0% |
Occupancy by Household Size in Pleasant View
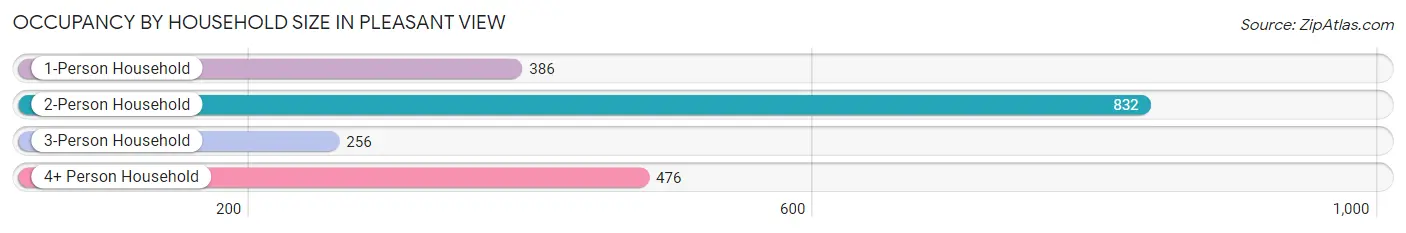
| Household Size | # Housing Units | % Housing Units |
| 1-Person Household | 386 | 19.8% |
| 2-Person Household | 832 | 42.7% |
| 3-Person Household | 256 | 13.1% |
| 4+ Person Household | 476 | 24.4% |
| Total Housing Units | 1,950 | 100.0% |
Occupancy by Ownership by Household Size in Pleasant View
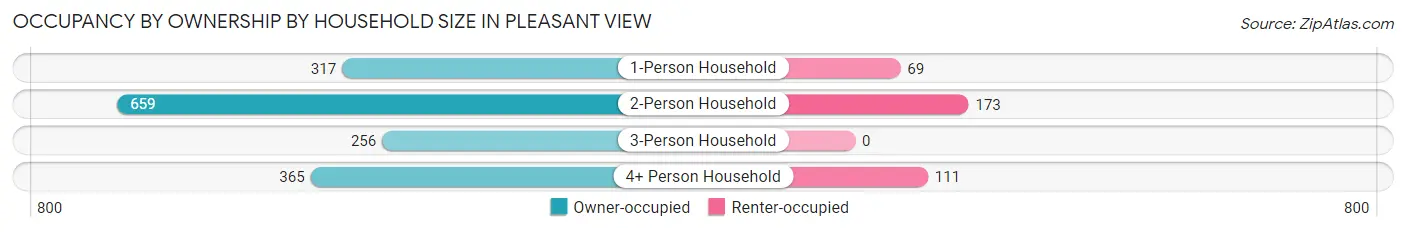
| Household Size | Owner-occupied | Renter-occupied |
| 1-Person Household | 317 (82.1%) | 69 (17.9%) |
| 2-Person Household | 659 (79.2%) | 173 (20.8%) |
| 3-Person Household | 256 (100.0%) | 0 (0.0%) |
| 4+ Person Household | 365 (76.7%) | 111 (23.3%) |
| Total Housing Units | 1,597 (81.9%) | 353 (18.1%) |
Occupancy by Educational Attainment in Pleasant View
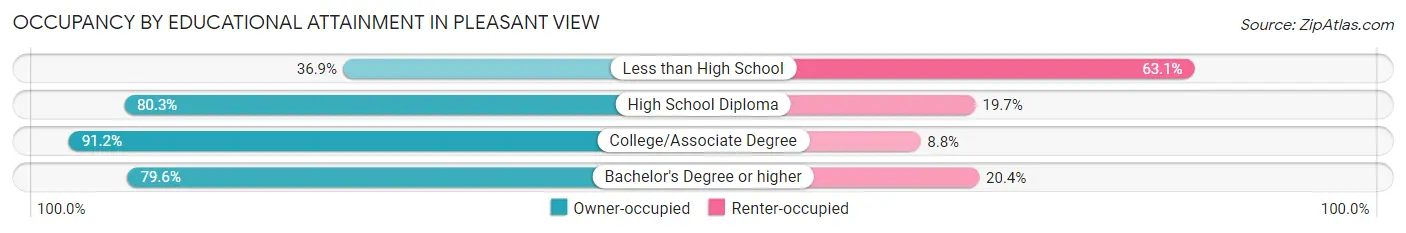
| Household Size | Owner-occupied | Renter-occupied |
| Less than High School | 31 (36.9%) | 53 (63.1%) |
| High School Diploma | 424 (80.3%) | 104 (19.7%) |
| College/Associate Degree | 604 (91.2%) | 58 (8.8%) |
| Bachelor's Degree or higher | 538 (79.6%) | 138 (20.4%) |
Occupancy by Age of Householder in Pleasant View
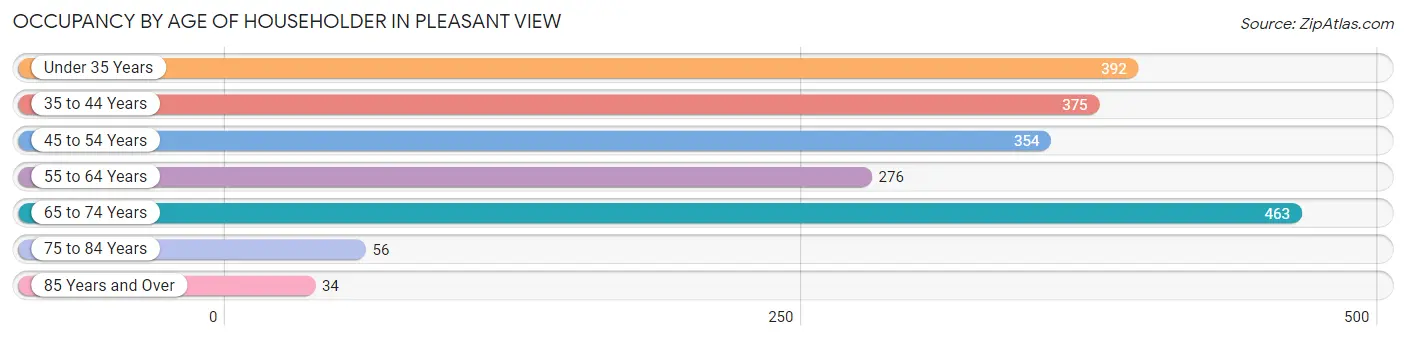
| Age Bracket | # Households | % Households |
| Under 35 Years | 392 | 20.1% |
| 35 to 44 Years | 375 | 19.2% |
| 45 to 54 Years | 354 | 18.1% |
| 55 to 64 Years | 276 | 14.1% |
| 65 to 74 Years | 463 | 23.7% |
| 75 to 84 Years | 56 | 2.9% |
| 85 Years and Over | 34 | 1.7% |
| Total | 1,950 | 100.0% |
Housing Finances in Pleasant View
Median Income by Occupancy in Pleasant View
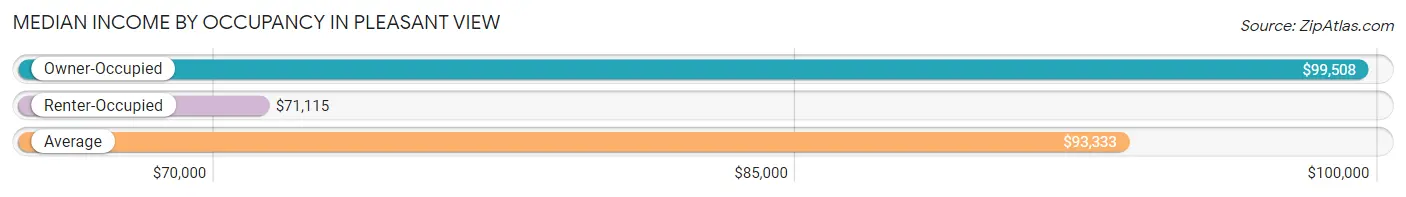
| Occupancy Type | # Households | Median Income |
| Owner-Occupied | 1,597 (81.9%) | $99,508 |
| Renter-Occupied | 353 (18.1%) | $71,115 |
| Average | 1,950 (100.0%) | $93,333 |
Occupancy by Householder Income Bracket in Pleasant View
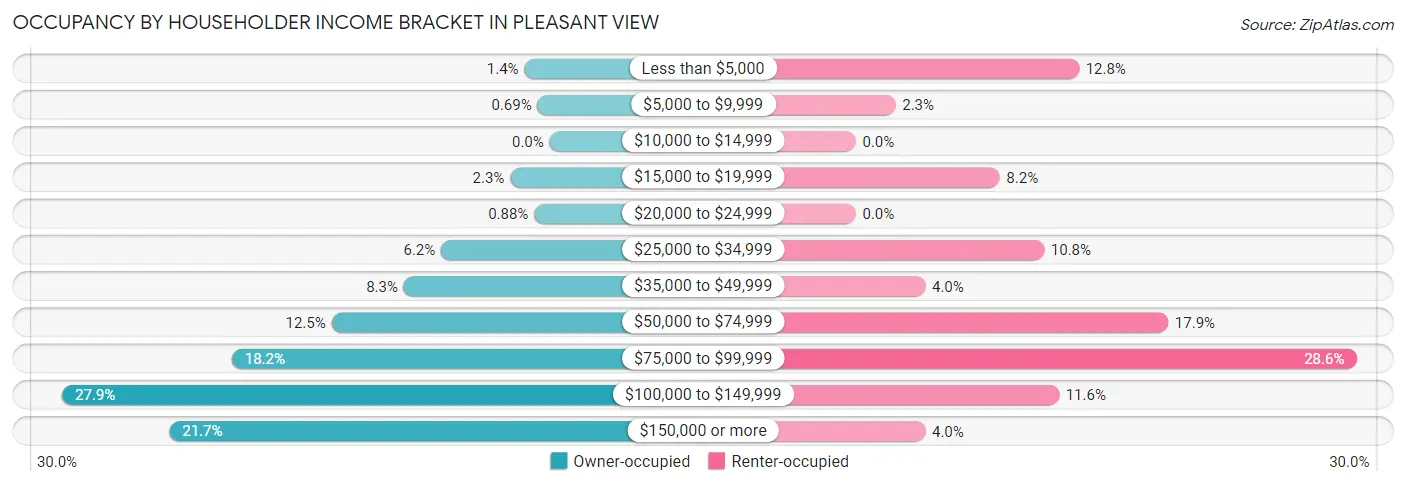
| Income Bracket | Owner-occupied | Renter-occupied |
| Less than $5,000 | 23 (1.4%) | 45 (12.8%) |
| $5,000 to $9,999 | 11 (0.7%) | 8 (2.3%) |
| $10,000 to $14,999 | 0 (0.0%) | 0 (0.0%) |
| $15,000 to $19,999 | 36 (2.2%) | 29 (8.2%) |
| $20,000 to $24,999 | 14 (0.9%) | 0 (0.0%) |
| $25,000 to $34,999 | 99 (6.2%) | 38 (10.8%) |
| $35,000 to $49,999 | 133 (8.3%) | 14 (4.0%) |
| $50,000 to $74,999 | 199 (12.5%) | 63 (17.8%) |
| $75,000 to $99,999 | 290 (18.2%) | 101 (28.6%) |
| $100,000 to $149,999 | 445 (27.9%) | 41 (11.6%) |
| $150,000 or more | 347 (21.7%) | 14 (4.0%) |
| Total | 1,597 (100.0%) | 353 (100.0%) |
Monthly Housing Cost Tiers in Pleasant View
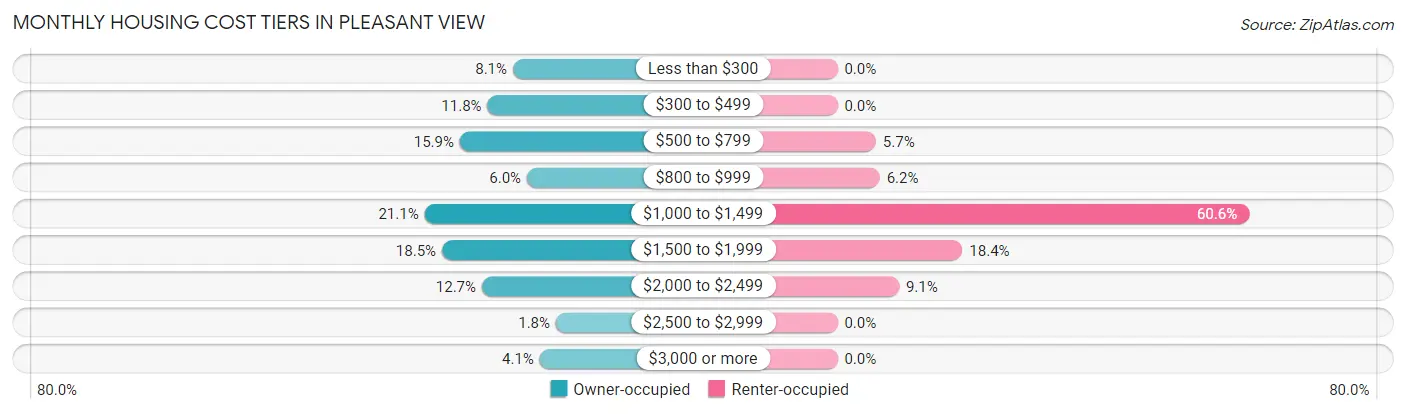
| Monthly Cost | Owner-occupied | Renter-occupied |
| Less than $300 | 129 (8.1%) | 0 (0.0%) |
| $300 to $499 | 189 (11.8%) | 0 (0.0%) |
| $500 to $799 | 254 (15.9%) | 20 (5.7%) |
| $800 to $999 | 96 (6.0%) | 22 (6.2%) |
| $1,000 to $1,499 | 337 (21.1%) | 214 (60.6%) |
| $1,500 to $1,999 | 296 (18.5%) | 65 (18.4%) |
| $2,000 to $2,499 | 202 (12.7%) | 32 (9.1%) |
| $2,500 to $2,999 | 28 (1.8%) | 0 (0.0%) |
| $3,000 or more | 66 (4.1%) | 0 (0.0%) |
| Total | 1,597 (100.0%) | 353 (100.0%) |
Physical Housing Characteristics in Pleasant View
Housing Structures in Pleasant View
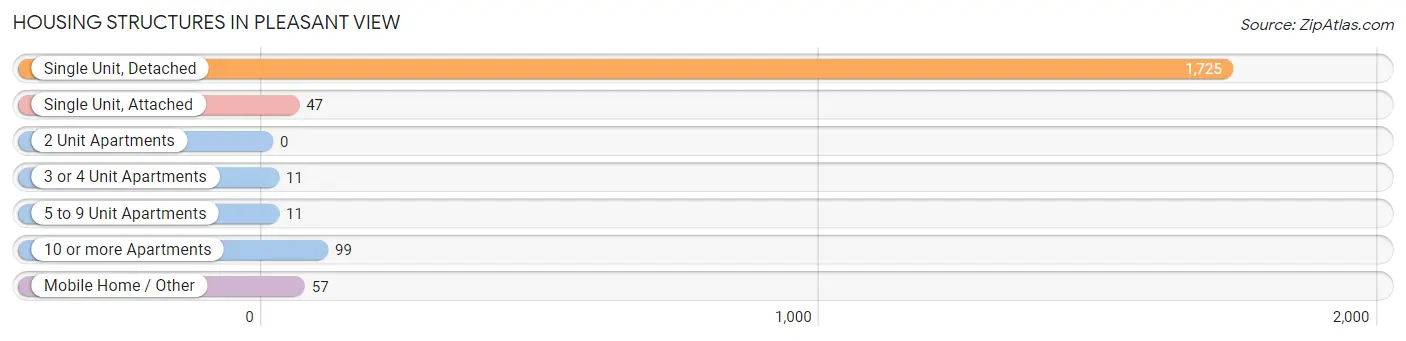
| Structure Type | # Housing Units | % Housing Units |
| Single Unit, Detached | 1,725 | 88.5% |
| Single Unit, Attached | 47 | 2.4% |
| 2 Unit Apartments | 0 | 0.0% |
| 3 or 4 Unit Apartments | 11 | 0.6% |
| 5 to 9 Unit Apartments | 11 | 0.6% |
| 10 or more Apartments | 99 | 5.1% |
| Mobile Home / Other | 57 | 2.9% |
| Total | 1,950 | 100.0% |
Housing Structures by Occupancy in Pleasant View
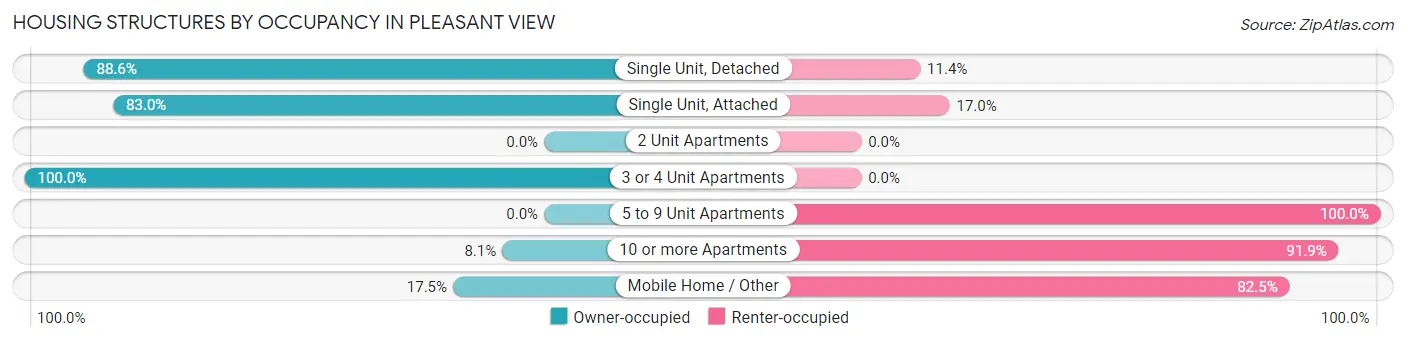
| Structure Type | Owner-occupied | Renter-occupied |
| Single Unit, Detached | 1,529 (88.6%) | 196 (11.4%) |
| Single Unit, Attached | 39 (83.0%) | 8 (17.0%) |
| 2 Unit Apartments | 0 (0.0%) | 0 (0.0%) |
| 3 or 4 Unit Apartments | 11 (100.0%) | 0 (0.0%) |
| 5 to 9 Unit Apartments | 0 (0.0%) | 11 (100.0%) |
| 10 or more Apartments | 8 (8.1%) | 91 (91.9%) |
| Mobile Home / Other | 10 (17.5%) | 47 (82.5%) |
| Total | 1,597 (81.9%) | 353 (18.1%) |
Housing Structures by Number of Rooms in Pleasant View
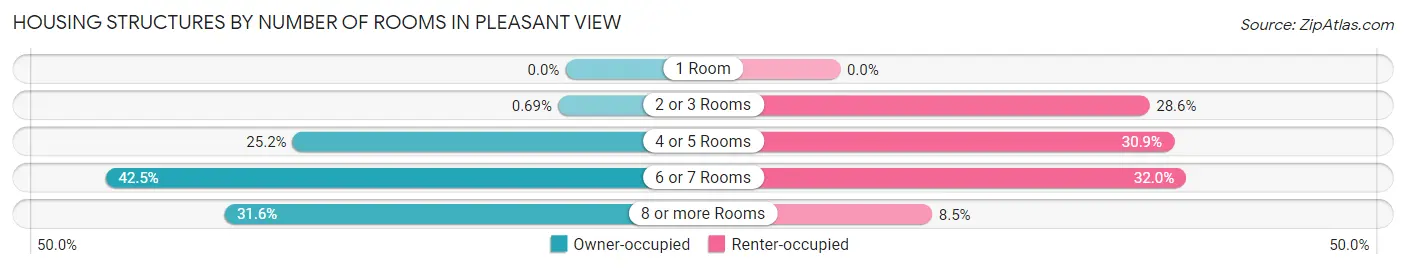
| Number of Rooms | Owner-occupied | Renter-occupied |
| 1 Room | 0 (0.0%) | 0 (0.0%) |
| 2 or 3 Rooms | 11 (0.7%) | 101 (28.6%) |
| 4 or 5 Rooms | 403 (25.2%) | 109 (30.9%) |
| 6 or 7 Rooms | 679 (42.5%) | 113 (32.0%) |
| 8 or more Rooms | 504 (31.6%) | 30 (8.5%) |
| Total | 1,597 (100.0%) | 353 (100.0%) |
Housing Structure by Heating Type in Pleasant View
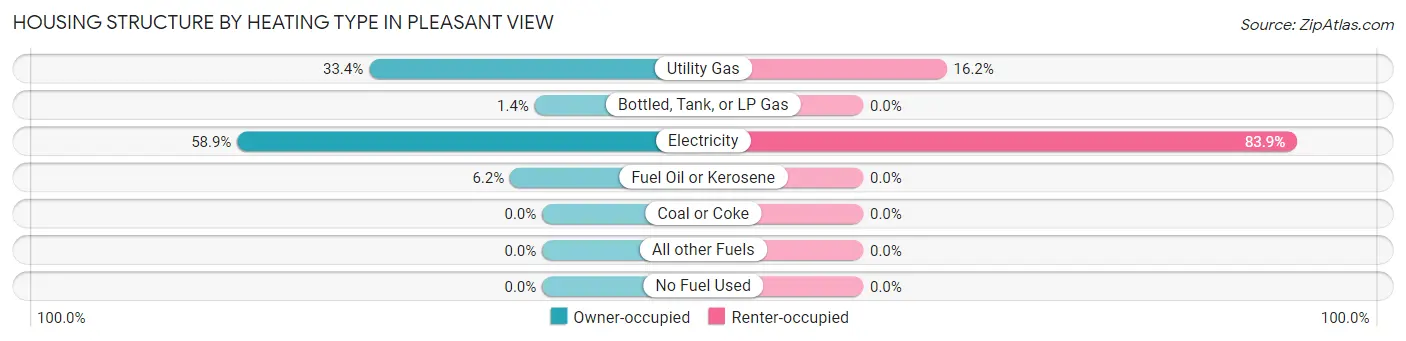
| Heating Type | Owner-occupied | Renter-occupied |
| Utility Gas | 534 (33.4%) | 57 (16.2%) |
| Bottled, Tank, or LP Gas | 23 (1.4%) | 0 (0.0%) |
| Electricity | 941 (58.9%) | 296 (83.9%) |
| Fuel Oil or Kerosene | 99 (6.2%) | 0 (0.0%) |
| Coal or Coke | 0 (0.0%) | 0 (0.0%) |
| All other Fuels | 0 (0.0%) | 0 (0.0%) |
| No Fuel Used | 0 (0.0%) | 0 (0.0%) |
| Total | 1,597 (100.0%) | 353 (100.0%) |
Household Vehicle Usage in Pleasant View
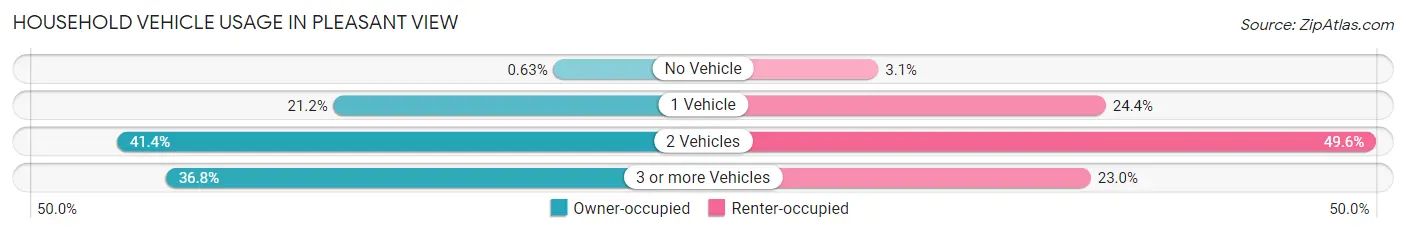
| Vehicles per Household | Owner-occupied | Renter-occupied |
| No Vehicle | 10 (0.6%) | 11 (3.1%) |
| 1 Vehicle | 338 (21.2%) | 86 (24.4%) |
| 2 Vehicles | 661 (41.4%) | 175 (49.6%) |
| 3 or more Vehicles | 588 (36.8%) | 81 (23.0%) |
| Total | 1,597 (100.0%) | 353 (100.0%) |
Real Estate & Mortgages in Pleasant View
Real Estate and Mortgage Overview in Pleasant View
| Characteristic | Without Mortgage | With Mortgage |
| Housing Units | 552 | 1,045 |
| Median Property Value | $335,100 | $311,100 |
| Median Household Income | $80,385 | $262 |
| Monthly Housing Costs | $468 | $66 |
| Real Estate Taxes | $1,536 | $25 |
Property Value by Mortgage Status in Pleasant View
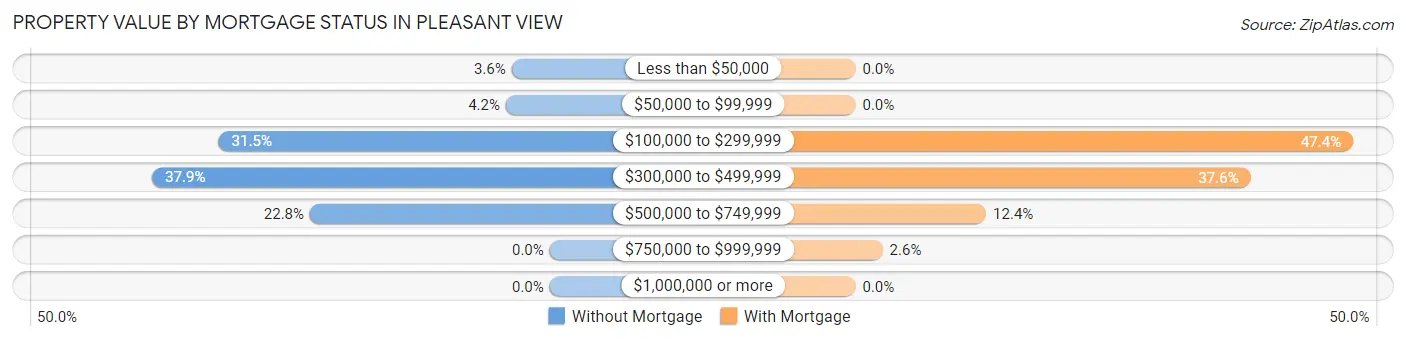
| Property Value | Without Mortgage | With Mortgage |
| Less than $50,000 | 20 (3.6%) | 0 (0.0%) |
| $50,000 to $99,999 | 23 (4.2%) | 0 (0.0%) |
| $100,000 to $299,999 | 174 (31.5%) | 495 (47.4%) |
| $300,000 to $499,999 | 209 (37.9%) | 393 (37.6%) |
| $500,000 to $749,999 | 126 (22.8%) | 130 (12.4%) |
| $750,000 to $999,999 | 0 (0.0%) | 27 (2.6%) |
| $1,000,000 or more | 0 (0.0%) | 0 (0.0%) |
| Total | 552 (100.0%) | 1,045 (100.0%) |
Household Income by Mortgage Status in Pleasant View
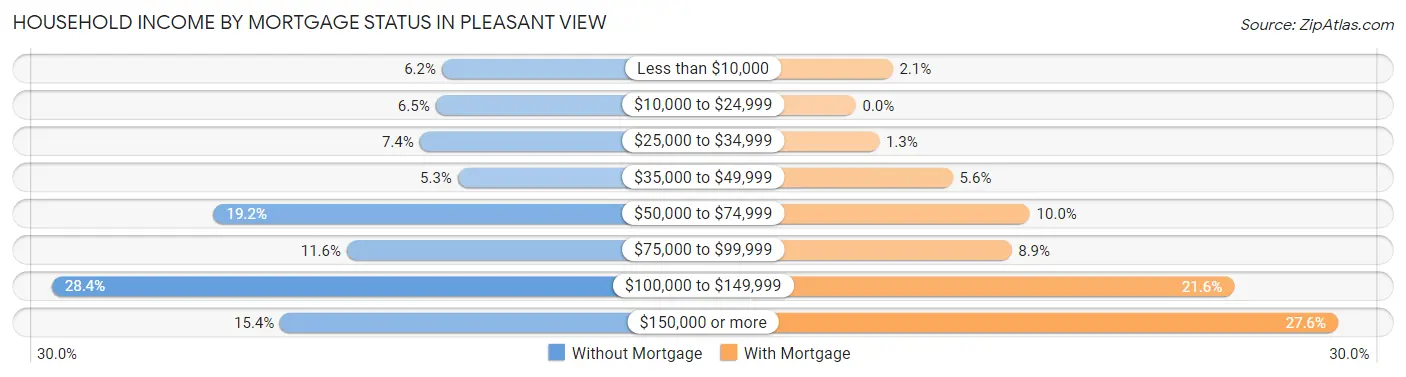
| Household Income | Without Mortgage | With Mortgage |
| Less than $10,000 | 34 (6.2%) | 22 (2.1%) |
| $10,000 to $24,999 | 36 (6.5%) | 0 (0.0%) |
| $25,000 to $34,999 | 41 (7.4%) | 14 (1.3%) |
| $35,000 to $49,999 | 29 (5.2%) | 58 (5.6%) |
| $50,000 to $74,999 | 106 (19.2%) | 104 (10.0%) |
| $75,000 to $99,999 | 64 (11.6%) | 93 (8.9%) |
| $100,000 to $149,999 | 157 (28.4%) | 226 (21.6%) |
| $150,000 or more | 85 (15.4%) | 288 (27.6%) |
| Total | 552 (100.0%) | 1,045 (100.0%) |
Property Value to Household Income Ratio in Pleasant View
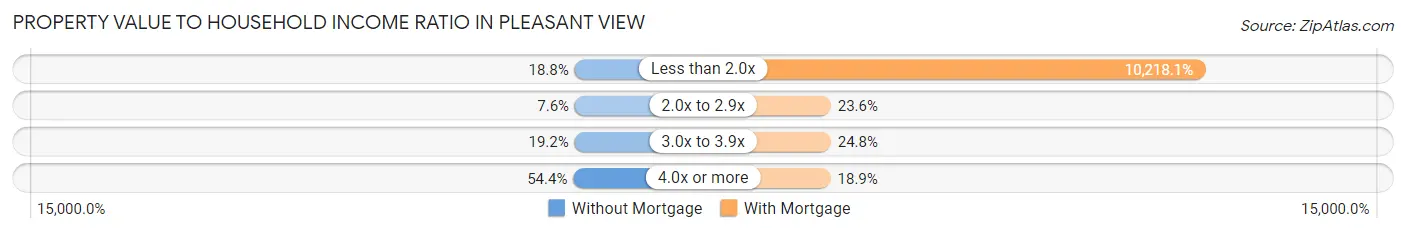
| Value-to-Income Ratio | Without Mortgage | With Mortgage |
| Less than 2.0x | 104 (18.8%) | 106,779 (10,218.1%) |
| 2.0x to 2.9x | 42 (7.6%) | 247 (23.6%) |
| 3.0x to 3.9x | 106 (19.2%) | 259 (24.8%) |
| 4.0x or more | 300 (54.3%) | 197 (18.9%) |
| Total | 552 (100.0%) | 1,045 (100.0%) |
Real Estate Taxes by Mortgage Status in Pleasant View
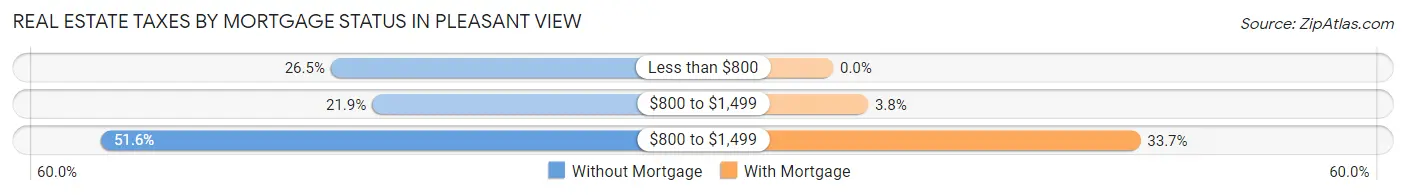
| Property Taxes | Without Mortgage | With Mortgage |
| Less than $800 | 146 (26.5%) | 0 (0.0%) |
| $800 to $1,499 | 121 (21.9%) | 40 (3.8%) |
| $800 to $1,499 | 285 (51.6%) | 352 (33.7%) |
| Total | 552 (100.0%) | 1,045 (100.0%) |
Health & Disability in Pleasant View
Health Insurance Coverage by Age in Pleasant View
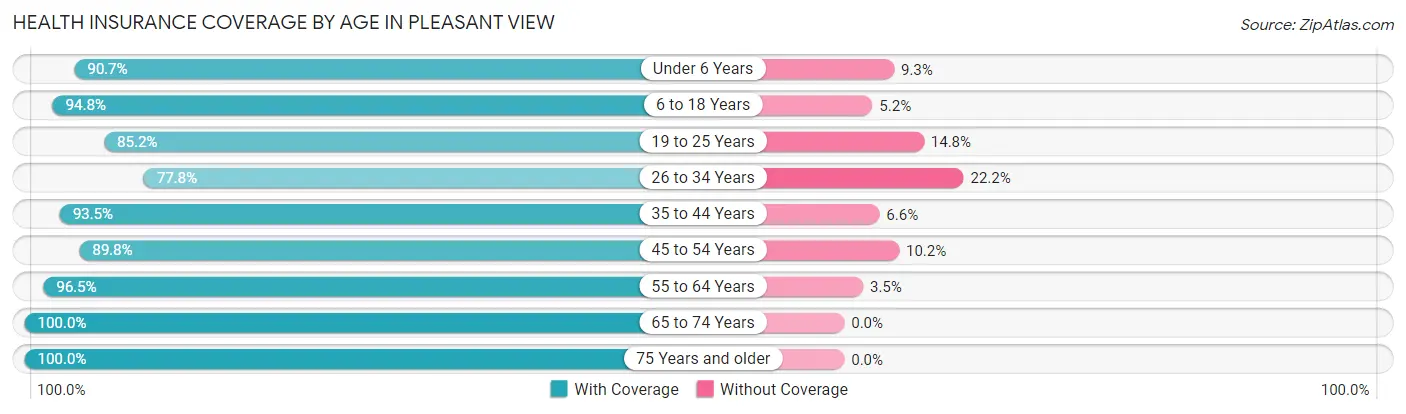
| Age Bracket | With Coverage | Without Coverage |
| Under 6 Years | 235 (90.7%) | 24 (9.3%) |
| 6 to 18 Years | 778 (94.8%) | 43 (5.2%) |
| 19 to 25 Years | 327 (85.2%) | 57 (14.8%) |
| 26 to 34 Years | 556 (77.8%) | 159 (22.2%) |
| 35 to 44 Years | 613 (93.4%) | 43 (6.6%) |
| 45 to 54 Years | 651 (89.8%) | 74 (10.2%) |
| 55 to 64 Years | 551 (96.5%) | 20 (3.5%) |
| 65 to 74 Years | 693 (100.0%) | 0 (0.0%) |
| 75 Years and older | 121 (100.0%) | 0 (0.0%) |
| Total | 4,525 (91.5%) | 420 (8.5%) |
Health Insurance Coverage by Citizenship Status in Pleasant View
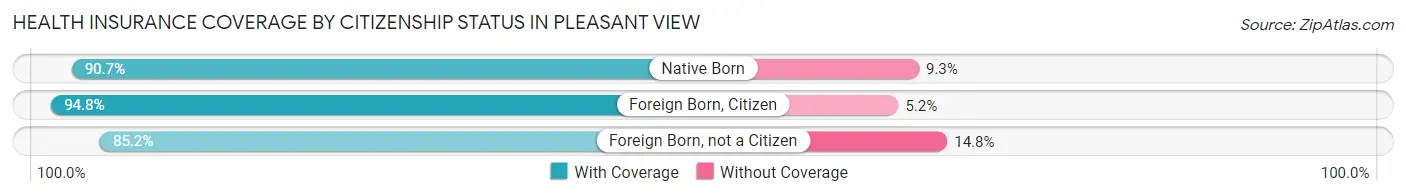
| Citizenship Status | With Coverage | Without Coverage |
| Native Born | 235 (90.7%) | 24 (9.3%) |
| Foreign Born, Citizen | 778 (94.8%) | 43 (5.2%) |
| Foreign Born, not a Citizen | 327 (85.2%) | 57 (14.8%) |
Health Insurance Coverage by Household Income in Pleasant View
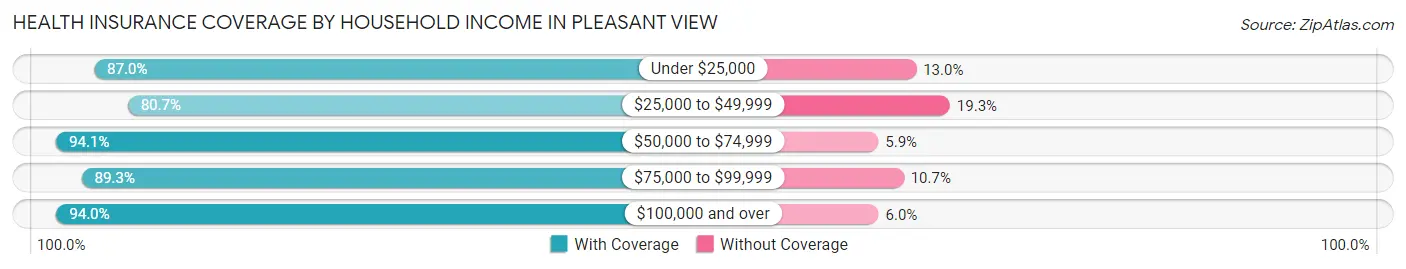
| Household Income | With Coverage | Without Coverage |
| Under $25,000 | 234 (87.0%) | 35 (13.0%) |
| $25,000 to $49,999 | 355 (80.7%) | 85 (19.3%) |
| $50,000 to $74,999 | 509 (94.1%) | 32 (5.9%) |
| $75,000 to $99,999 | 904 (89.3%) | 108 (10.7%) |
| $100,000 and over | 2,523 (94.0%) | 160 (6.0%) |
Public vs Private Health Insurance Coverage by Age in Pleasant View
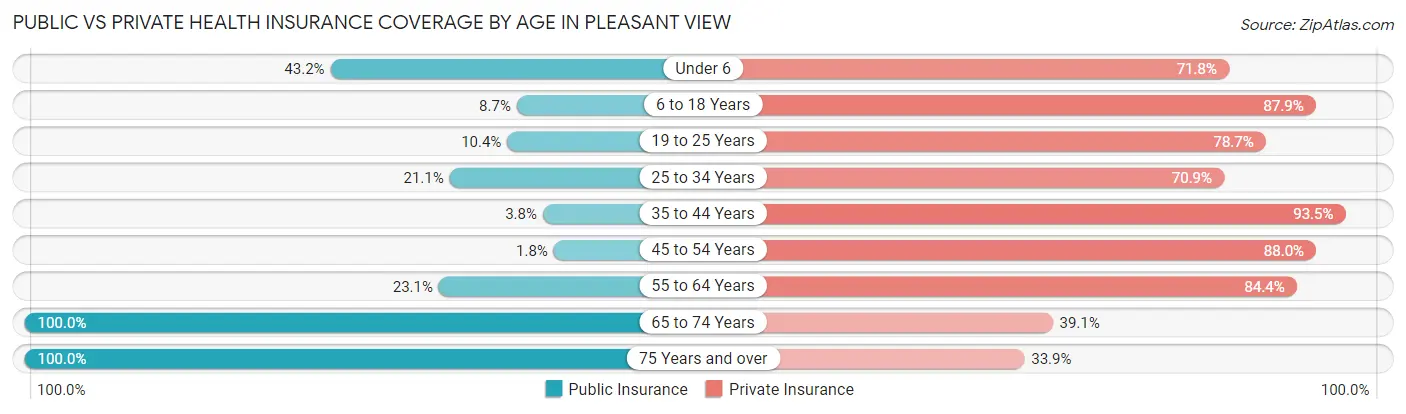
| Age Bracket | Public Insurance | Private Insurance |
| Under 6 | 112 (43.2%) | 186 (71.8%) |
| 6 to 18 Years | 71 (8.6%) | 722 (87.9%) |
| 19 to 25 Years | 40 (10.4%) | 302 (78.6%) |
| 25 to 34 Years | 151 (21.1%) | 507 (70.9%) |
| 35 to 44 Years | 25 (3.8%) | 613 (93.4%) |
| 45 to 54 Years | 13 (1.8%) | 638 (88.0%) |
| 55 to 64 Years | 132 (23.1%) | 482 (84.4%) |
| 65 to 74 Years | 693 (100.0%) | 271 (39.1%) |
| 75 Years and over | 121 (100.0%) | 41 (33.9%) |
| Total | 1,358 (27.5%) | 3,762 (76.1%) |
Disability Status by Sex by Age in Pleasant View
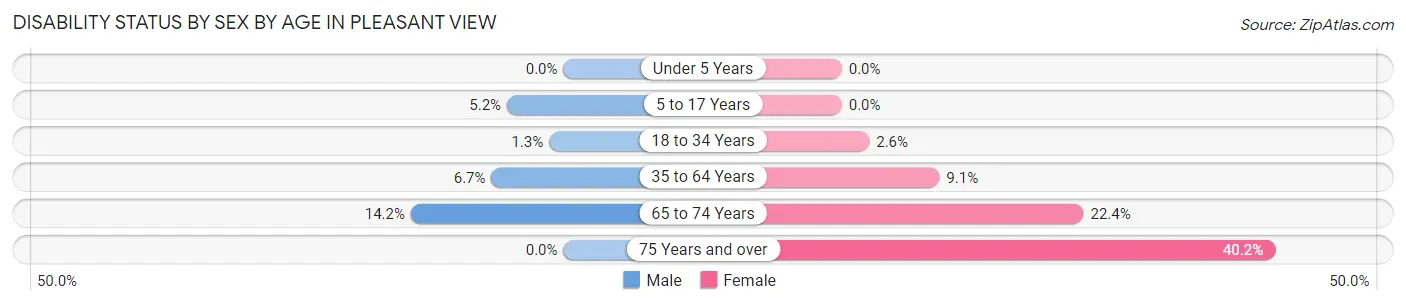
| Age Bracket | Male | Female |
| Under 5 Years | 0 (0.0%) | 0 (0.0%) |
| 5 to 17 Years | 25 (5.2%) | 0 (0.0%) |
| 18 to 34 Years | 8 (1.3%) | 14 (2.5%) |
| 35 to 64 Years | 67 (6.7%) | 86 (9.1%) |
| 65 to 74 Years | 47 (14.2%) | 81 (22.4%) |
| 75 Years and over | 0 (0.0%) | 41 (40.2%) |
Disability Class by Sex by Age in Pleasant View
Disability Class: Hearing Difficulty
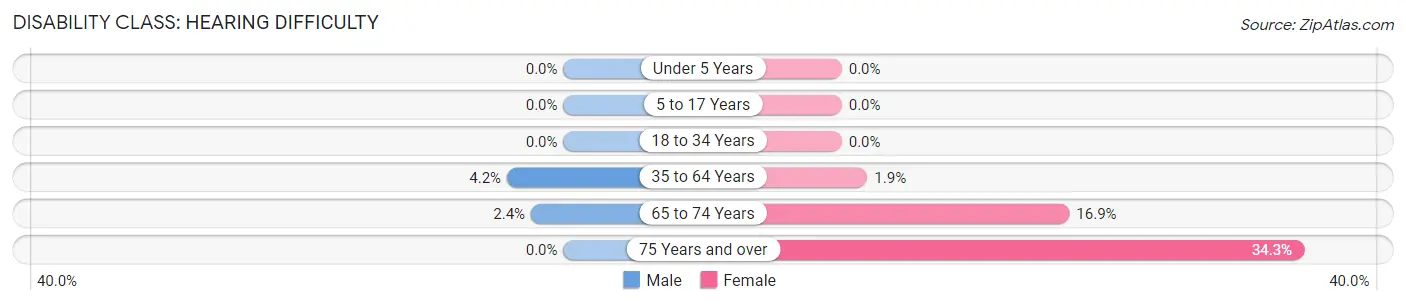
| Age Bracket | Male | Female |
| Under 5 Years | 0 (0.0%) | 0 (0.0%) |
| 5 to 17 Years | 0 (0.0%) | 0 (0.0%) |
| 18 to 34 Years | 0 (0.0%) | 0 (0.0%) |
| 35 to 64 Years | 42 (4.2%) | 18 (1.9%) |
| 65 to 74 Years | 8 (2.4%) | 61 (16.9%) |
| 75 Years and over | 0 (0.0%) | 35 (34.3%) |
Disability Class: Vision Difficulty
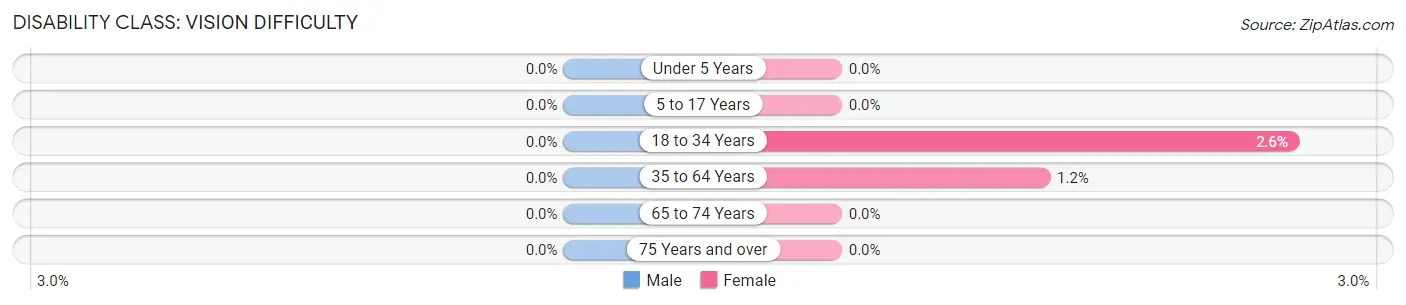
| Age Bracket | Male | Female |
| Under 5 Years | 0 (0.0%) | 0 (0.0%) |
| 5 to 17 Years | 0 (0.0%) | 0 (0.0%) |
| 18 to 34 Years | 0 (0.0%) | 14 (2.5%) |
| 35 to 64 Years | 0 (0.0%) | 11 (1.2%) |
| 65 to 74 Years | 0 (0.0%) | 0 (0.0%) |
| 75 Years and over | 0 (0.0%) | 0 (0.0%) |
Disability Class: Cognitive Difficulty
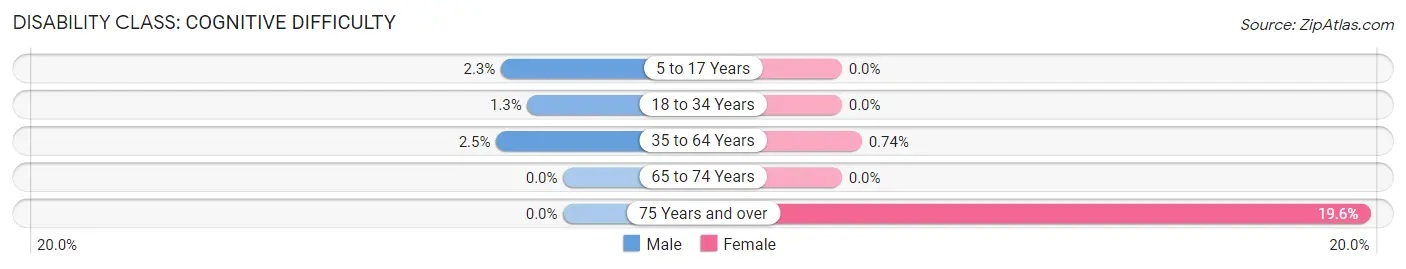
| Age Bracket | Male | Female |
| 5 to 17 Years | 11 (2.3%) | 0 (0.0%) |
| 18 to 34 Years | 8 (1.3%) | 0 (0.0%) |
| 35 to 64 Years | 25 (2.5%) | 7 (0.7%) |
| 65 to 74 Years | 0 (0.0%) | 0 (0.0%) |
| 75 Years and over | 0 (0.0%) | 20 (19.6%) |
Disability Class: Ambulatory Difficulty
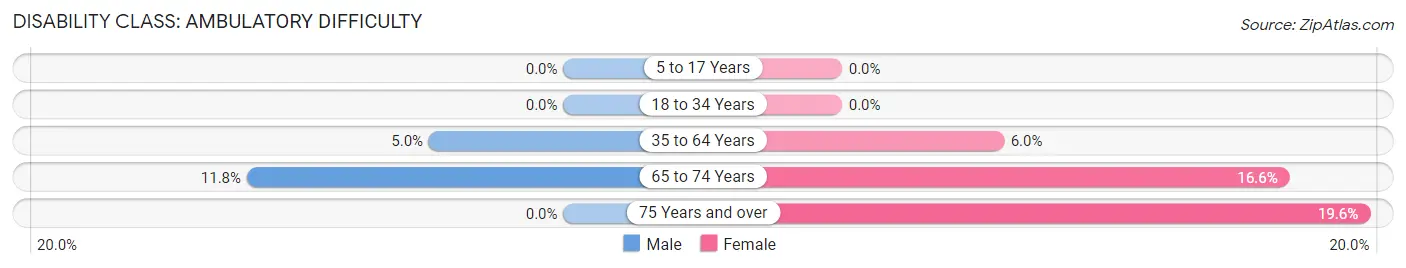
| Age Bracket | Male | Female |
| 5 to 17 Years | 0 (0.0%) | 0 (0.0%) |
| 18 to 34 Years | 0 (0.0%) | 0 (0.0%) |
| 35 to 64 Years | 50 (5.0%) | 57 (6.0%) |
| 65 to 74 Years | 39 (11.7%) | 60 (16.6%) |
| 75 Years and over | 0 (0.0%) | 20 (19.6%) |
Disability Class: Self-Care Difficulty
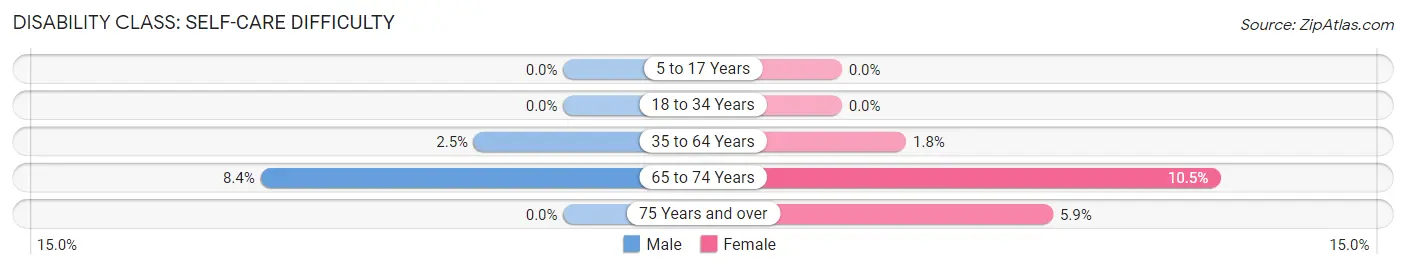
| Age Bracket | Male | Female |
| 5 to 17 Years | 0 (0.0%) | 0 (0.0%) |
| 18 to 34 Years | 0 (0.0%) | 0 (0.0%) |
| 35 to 64 Years | 25 (2.5%) | 17 (1.8%) |
| 65 to 74 Years | 28 (8.4%) | 38 (10.5%) |
| 75 Years and over | 0 (0.0%) | 6 (5.9%) |
Technology Access in Pleasant View
Computing Device Access in Pleasant View
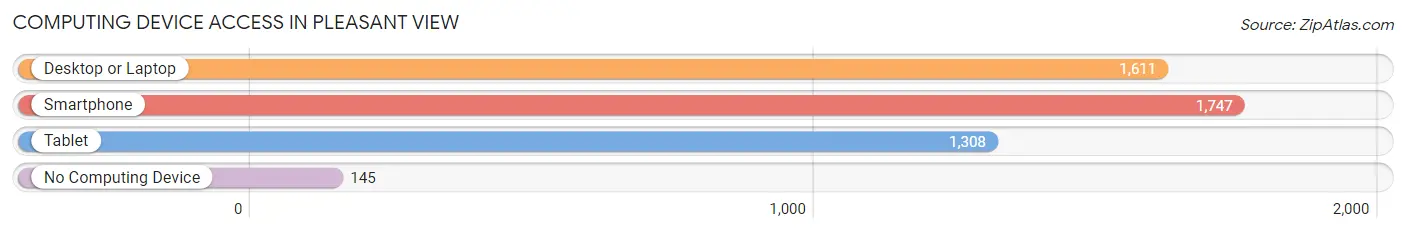
| Device Type | # Households | % Households |
| Desktop or Laptop | 1,611 | 82.6% |
| Smartphone | 1,747 | 89.6% |
| Tablet | 1,308 | 67.1% |
| No Computing Device | 145 | 7.4% |
| Total | 1,950 | 100.0% |
Internet Access in Pleasant View
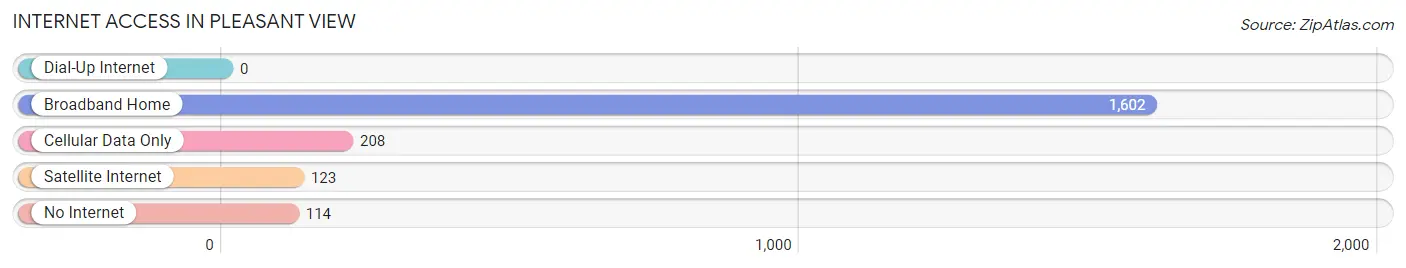
| Internet Type | # Households | % Households |
| Dial-Up Internet | 0 | 0.0% |
| Broadband Home | 1,602 | 82.2% |
| Cellular Data Only | 208 | 10.7% |
| Satellite Internet | 123 | 6.3% |
| No Internet | 114 | 5.9% |
| Total | 1,950 | 100.0% |
Pleasant View Summary
Pleasant View is a small town located in Cheatham County, Tennessee. It is situated along the Cumberland River, approximately 25 miles northwest of Nashville. The town has a population of approximately 5,000 people and is part of the Nashville metropolitan area.
History
Pleasant View was founded in 1820 by a group of settlers from North Carolina. The town was originally known as “Pleasant Hill” and was later changed to “Pleasant View” in 1836. The town was named after the view of the Cumberland River from the hilltop.
The town was an important stop on the stagecoach route between Nashville and Clarksville. The stagecoach route was used to transport goods and passengers between the two cities.
In the late 1800s, Pleasant View was a thriving agricultural community. The town was known for its production of tobacco, corn, and cotton. The town also had a number of small businesses, including a general store, a blacksmith shop, and a grist mill.
In the early 1900s, the town began to decline as the railroad bypassed the town. The decline continued until the 1950s when the town began to experience a resurgence. The town was revitalized by the construction of a new highway, which connected the town to Nashville.
Geography
Pleasant View is located in Cheatham County, Tennessee. The town is situated along the Cumberland River, approximately 25 miles northwest of Nashville. The town is located in a rural area and is surrounded by rolling hills and farmland.
The town has a total area of 4.2 square miles, all of which is land. The town has a humid subtropical climate, with hot summers and mild winters. The average annual temperature is around 60 degrees Fahrenheit.
Economy
Pleasant View’s economy is largely based on agriculture and tourism. The town is home to a number of farms, which produce a variety of crops, including corn, soybeans, and tobacco. The town also has a number of small businesses, including restaurants, retail stores, and service providers.
The town is also a popular tourist destination. The town is home to a number of attractions, including the Pleasant View Museum, the Pleasant View Golf Course, and the Pleasant View Winery. The town also hosts a number of festivals and events throughout the year, including the Pleasant View Music Festival and the Pleasant View Harvest Festival.
Demographics
As of the 2010 census, the population of Pleasant View was 5,000. The town has a diverse population, with a mix of races and ethnicities. The town is predominantly white (90.2%), followed by African American (5.2%), Hispanic (2.2%), and Asian (1.2%).
The median household income in Pleasant View is $45,000, and the median home value is $150,000. The town has a low unemployment rate of 4.2%. The town also has a high rate of homeownership, with 73.2% of residents owning their own homes.
Conclusion
Pleasant View is a small town located in Cheatham County, Tennessee. The town has a population of approximately 5,000 people and is part of the Nashville metropolitan area. The town has a diverse population and a strong economy based on agriculture and tourism. The town is home to a number of attractions, including the Pleasant View Museum, the Pleasant View Golf Course, and the Pleasant View Winery. The town also hosts a number of festivals and events throughout the year.
Common Questions
What is Per Capita Income in Pleasant View?
Per Capita income in Pleasant View is $44,027.
What is the Median Family Income in Pleasant View?
Median Family Income in Pleasant View is $102,071.
What is the Median Household income in Pleasant View?
Median Household Income in Pleasant View is $93,333.
What is Income or Wage Gap in Pleasant View?
Income or Wage Gap in Pleasant View is 31.0%.
Women in Pleasant View earn 69.0 cents for every dollar earned by a man.
What is Inequality or Gini Index in Pleasant View?
Inequality or Gini Index in Pleasant View is 0.38.
What is the Total Population of Pleasant View?
Total Population of Pleasant View is 4,945.
What is the Total Male Population of Pleasant View?
Total Male Population of Pleasant View is 2,525.
What is the Total Female Population of Pleasant View?
Total Female Population of Pleasant View is 2,420.
What is the Ratio of Males per 100 Females in Pleasant View?
There are 104.34 Males per 100 Females in Pleasant View.
What is the Ratio of Females per 100 Males in Pleasant View?
There are 95.84 Females per 100 Males in Pleasant View.
What is the Median Population Age in Pleasant View?
Median Population Age in Pleasant View is 38.7 Years.
What is the Average Family Size in Pleasant View
Average Family Size in Pleasant View is 3.0 People.
What is the Average Household Size in Pleasant View
Average Household Size in Pleasant View is 2.5 People.
How Large is the Labor Force in Pleasant View?
There are 2,713 People in the Labor Forcein in Pleasant View.
What is the Percentage of People in the Labor Force in Pleasant View?
66.9% of People are in the Labor Force in Pleasant View.
What is the Unemployment Rate in Pleasant View?
Unemployment Rate in Pleasant View is 3.8%.