Reinholds, PA Map & Demographics
Reinholds Map
Reinholds Overview
$31,126
PER CAPITA INCOME
$90,052
AVG FAMILY INCOME
$87,603
AVG HOUSEHOLD INCOME
41.0%
WAGE / INCOME GAP [ % ]
59.0¢/ $1
WAGE / INCOME GAP [ $ ]
0.25
INEQUALITY / GINI INDEX
2,341
TOTAL POPULATION
1,102
MALE POPULATION
1,239
FEMALE POPULATION
88.94
MALES / 100 FEMALES
112.43
FEMALES / 100 MALES
37.5
MEDIAN AGE
3.5
AVG FAMILY SIZE
3.1
AVG HOUSEHOLD SIZE
1,152
LABOR FORCE [ PEOPLE ]
68.8%
PERCENT IN LABOR FORCE
Reinholds Zip Codes
Reinholds Area Codes
Income in Reinholds
Income Overview in Reinholds
Per Capita Income in Reinholds is $31,126, while median incomes of families and households are $90,052 and $87,603 respectively.
| Characteristic | Number | Measure |
| Per Capita Income | 2,341 | $31,126 |
| Median Family Income | 598 | $90,052 |
| Mean Family Income | 598 | $103,533 |
| Median Household Income | 746 | $87,603 |
| Mean Household Income | 746 | $96,344 |
| Income Deficit | 598 | $0 |
| Wage / Income Gap (%) | 2,341 | 40.95% |
| Wage / Income Gap ($) | 2,341 | 59.05¢ per $1 |
| Gini / Inequality Index | 2,341 | 0.25 |
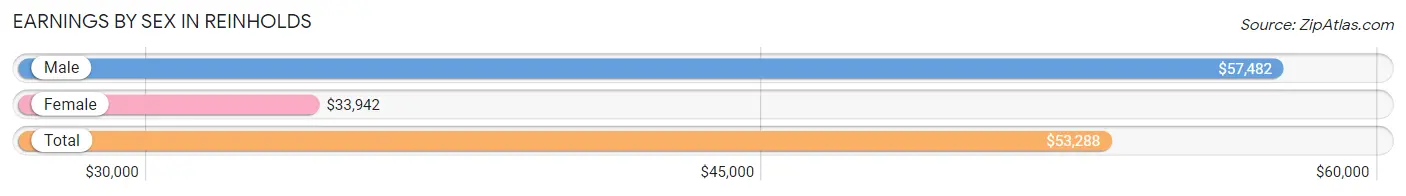
Earnings by Sex in Reinholds
Average Earnings in Reinholds are $53,288, $57,482 for men and $33,942 for women, a difference of 40.9%.
| Sex | Number | Average Earnings |
| Male | 757 (61.0%) | $57,482 |
| Female | 484 (39.0%) | $33,942 |
| Total | 1,241 (100.0%) | $53,288 |
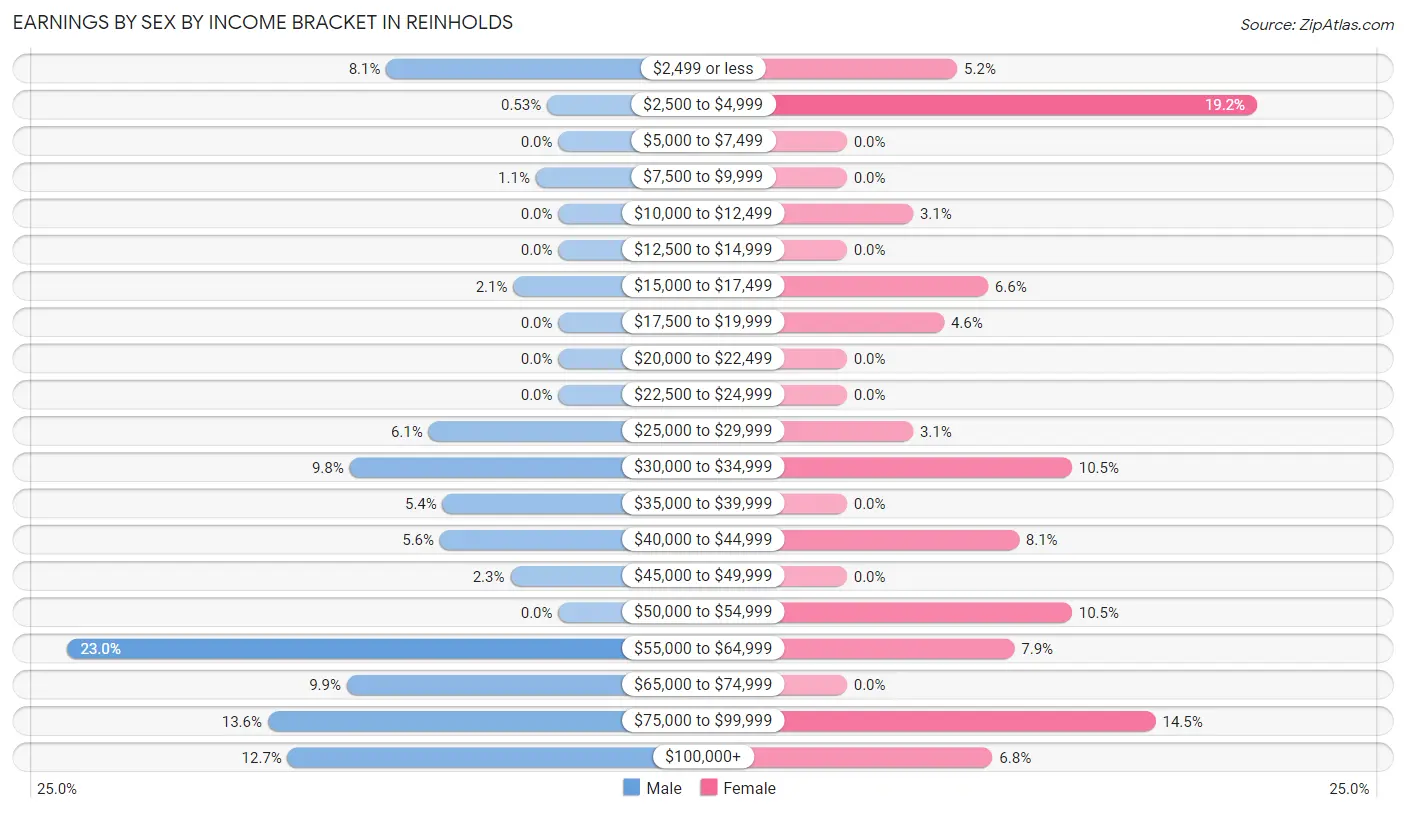
Earnings by Sex by Income Bracket in Reinholds
The most common earnings brackets in Reinholds are $55,000 to $64,999 for men (174 | 23.0%) and $2,500 to $4,999 for women (93 | 19.2%).
| Income | Male | Female |
| $2,499 or less | 61 (8.1%) | 25 (5.2%) |
| $2,500 to $4,999 | 4 (0.5%) | 93 (19.2%) |
| $5,000 to $7,499 | 0 (0.0%) | 0 (0.0%) |
| $7,500 to $9,999 | 8 (1.1%) | 0 (0.0%) |
| $10,000 to $12,499 | 0 (0.0%) | 15 (3.1%) |
| $12,500 to $14,999 | 0 (0.0%) | 0 (0.0%) |
| $15,000 to $17,499 | 16 (2.1%) | 32 (6.6%) |
| $17,500 to $19,999 | 0 (0.0%) | 22 (4.5%) |
| $20,000 to $22,499 | 0 (0.0%) | 0 (0.0%) |
| $22,500 to $24,999 | 0 (0.0%) | 0 (0.0%) |
| $25,000 to $29,999 | 46 (6.1%) | 15 (3.1%) |
| $30,000 to $34,999 | 74 (9.8%) | 51 (10.5%) |
| $35,000 to $39,999 | 41 (5.4%) | 0 (0.0%) |
| $40,000 to $44,999 | 42 (5.6%) | 39 (8.1%) |
| $45,000 to $49,999 | 17 (2.2%) | 0 (0.0%) |
| $50,000 to $54,999 | 0 (0.0%) | 51 (10.5%) |
| $55,000 to $64,999 | 174 (23.0%) | 38 (7.9%) |
| $65,000 to $74,999 | 75 (9.9%) | 0 (0.0%) |
| $75,000 to $99,999 | 103 (13.6%) | 70 (14.5%) |
| $100,000+ | 96 (12.7%) | 33 (6.8%) |
| Total | 757 (100.0%) | 484 (100.0%) |
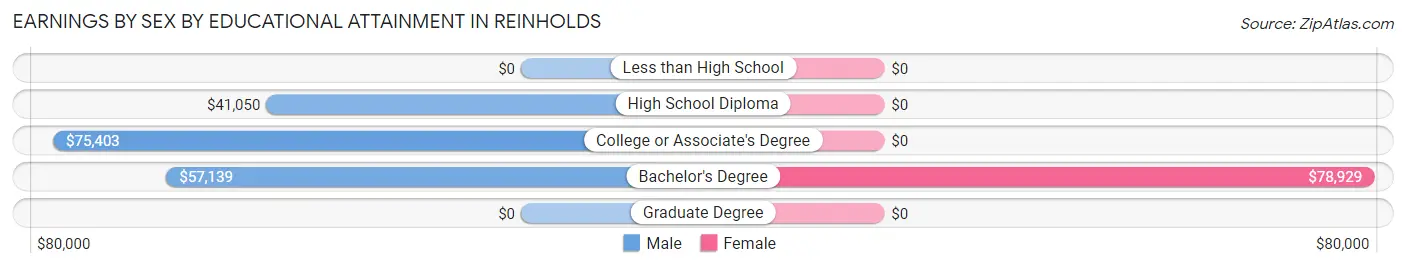
Earnings by Sex by Educational Attainment in Reinholds
Average earnings in Reinholds are $57,798 for men and $42,340 for women, a difference of 26.7%. Men with an educational attainment of college or associate's degree enjoy the highest average annual earnings of $75,403, while those with high school diploma education earn the least with $41,050. Women with an educational attainment of bachelor's degree earn the most with the average annual earnings of $78,929, while those with bachelor's degree education have the smallest earnings of $78,929.
| Educational Attainment | Male Income | Female Income |
| Less than High School | - | - |
| High School Diploma | $41,050 | $0 |
| College or Associate's Degree | $75,403 | $0 |
| Bachelor's Degree | $57,139 | $78,929 |
| Graduate Degree | - | - |
| Total | $57,798 | $42,340 |
Family Income in Reinholds
Family Income Brackets in Reinholds
According to the Reinholds family income data, there are 182 families falling into the $100,000 to $149,999 income range, which is the most common income bracket and makes up 30.4% of all families.
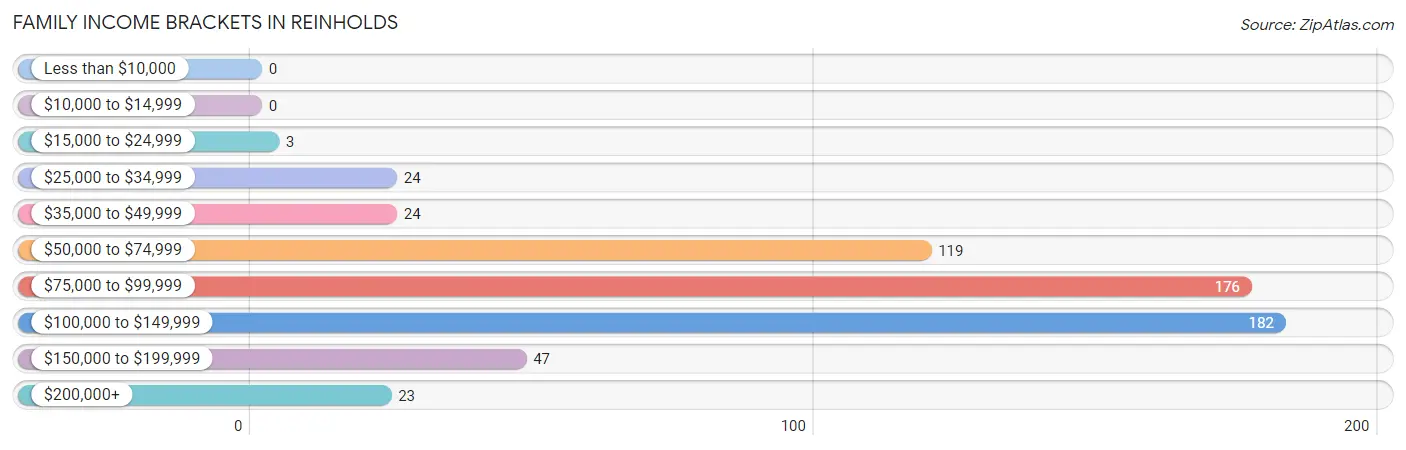
| Income Bracket | # Families | % Families |
| Less than $10,000 | 0 | 0.0% |
| $10,000 to $14,999 | 0 | 0.0% |
| $15,000 to $24,999 | 3 | 0.5% |
| $25,000 to $34,999 | 24 | 4.0% |
| $35,000 to $49,999 | 24 | 4.0% |
| $50,000 to $74,999 | 119 | 19.9% |
| $75,000 to $99,999 | 176 | 29.4% |
| $100,000 to $149,999 | 182 | 30.4% |
| $150,000 to $199,999 | 47 | 7.9% |
| $200,000+ | 23 | 3.8% |
Family Income by Famaliy Size in Reinholds
3-person families (80 | 13.4%) account for the highest median family income in Reinholds with $128,026 per family, while 3-person families (80 | 13.4%) have the highest median income of $42,675 per family member.
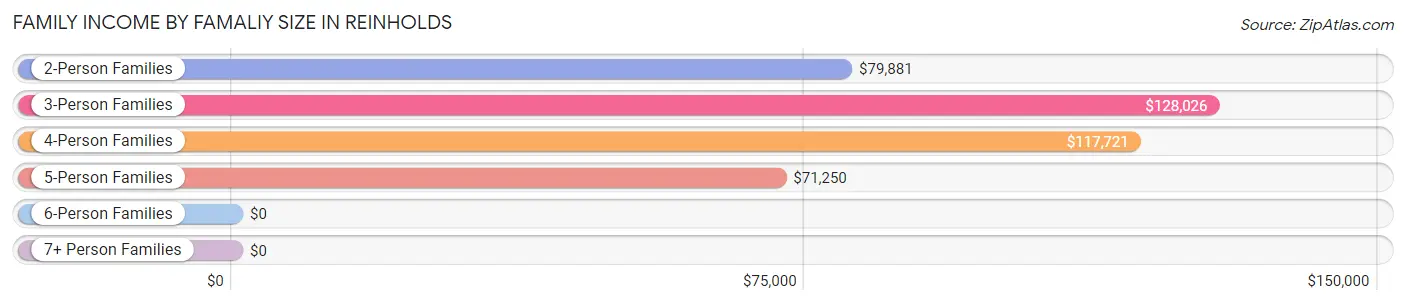
| Income Bracket | # Families | Median Income |
| 2-Person Families | 172 (28.8%) | $79,881 |
| 3-Person Families | 80 (13.4%) | $128,026 |
| 4-Person Families | 259 (43.3%) | $117,721 |
| 5-Person Families | 87 (14.5%) | $71,250 |
| 6-Person Families | 0 (0.0%) | $0 |
| 7+ Person Families | 0 (0.0%) | $0 |
| Total | 598 (100.0%) | $90,052 |
Family Income by Number of Earners in Reinholds
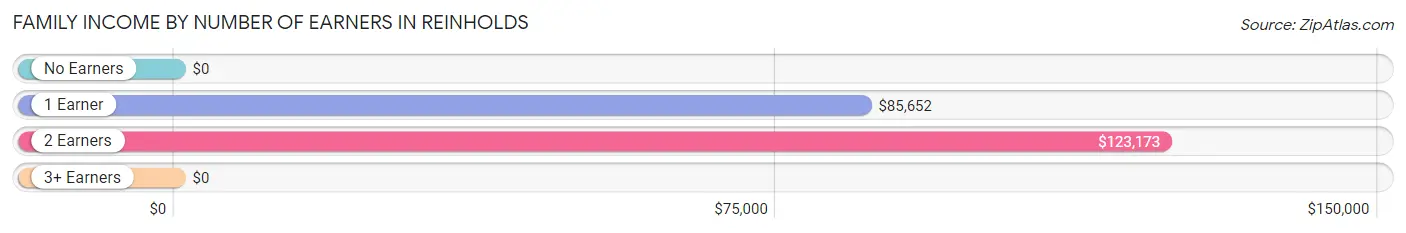
| Number of Earners | # Families | Median Income |
| No Earners | 24 (4.0%) | $0 |
| 1 Earner | 222 (37.1%) | $85,652 |
| 2 Earners | 233 (39.0%) | $123,173 |
| 3+ Earners | 119 (19.9%) | $0 |
| Total | 598 (100.0%) | $90,052 |
Household Income in Reinholds
Household Income Brackets in Reinholds
With 232 households falling in the category, the $75,000 to $99,999 income range is the most frequent in Reinholds, accounting for 31.1% of all households.
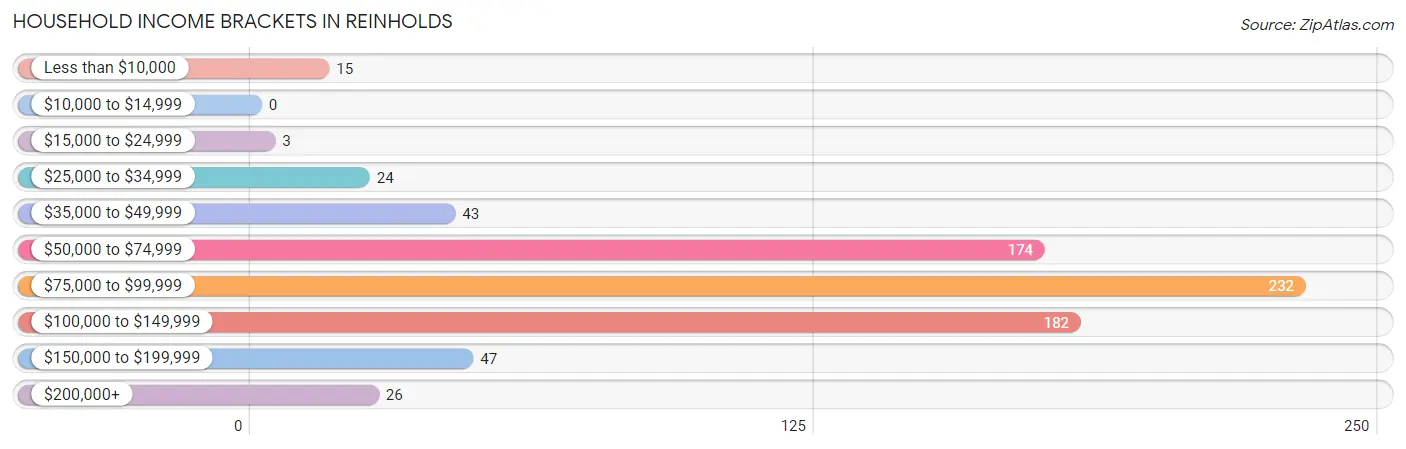
| Income Bracket | # Households | % Households |
| Less than $10,000 | 15 | 2.0% |
| $10,000 to $14,999 | 0 | 0.0% |
| $15,000 to $24,999 | 3 | 0.4% |
| $25,000 to $34,999 | 24 | 3.2% |
| $35,000 to $49,999 | 43 | 5.8% |
| $50,000 to $74,999 | 174 | 23.3% |
| $75,000 to $99,999 | 232 | 31.1% |
| $100,000 to $149,999 | 182 | 24.4% |
| $150,000 to $199,999 | 47 | 6.3% |
| $200,000+ | 26 | 3.5% |
Household Income by Householder Age in Reinholds
The median household income in Reinholds is $87,603, with the highest median household income of $107,222 found in the 25 to 44 years age bracket for the primary householder. A total of 242 households (32.4%) fall into this category.
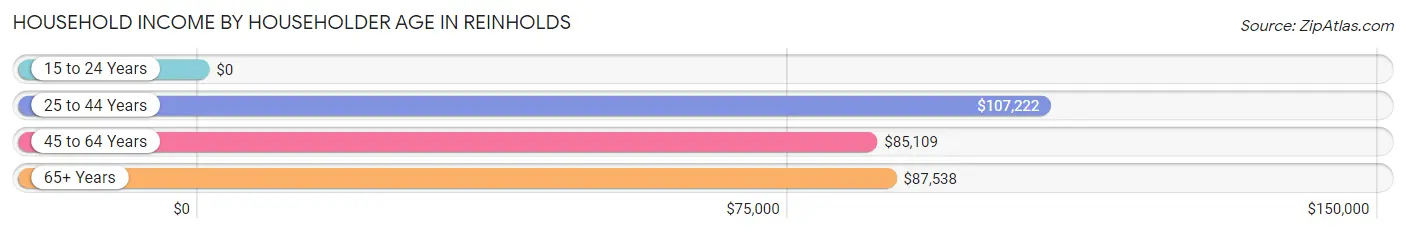
| Income Bracket | # Households | Median Income |
| 15 to 24 Years | 0 (0.0%) | $0 |
| 25 to 44 Years | 242 (32.4%) | $107,222 |
| 45 to 64 Years | 374 (50.1%) | $85,109 |
| 65+ Years | 130 (17.4%) | $87,538 |
| Total | 746 (100.0%) | $87,603 |
Poverty in Reinholds
Income Below Poverty by Sex and Age in Reinholds
With 1.8% poverty level for males and 6.5% for females among the residents of Reinholds, 75 year old and over males and 18 to 24 year old females are the most vulnerable to poverty, with 15 males (39.5%) and 30 females (32.6%) in their respective age groups living below the poverty level.
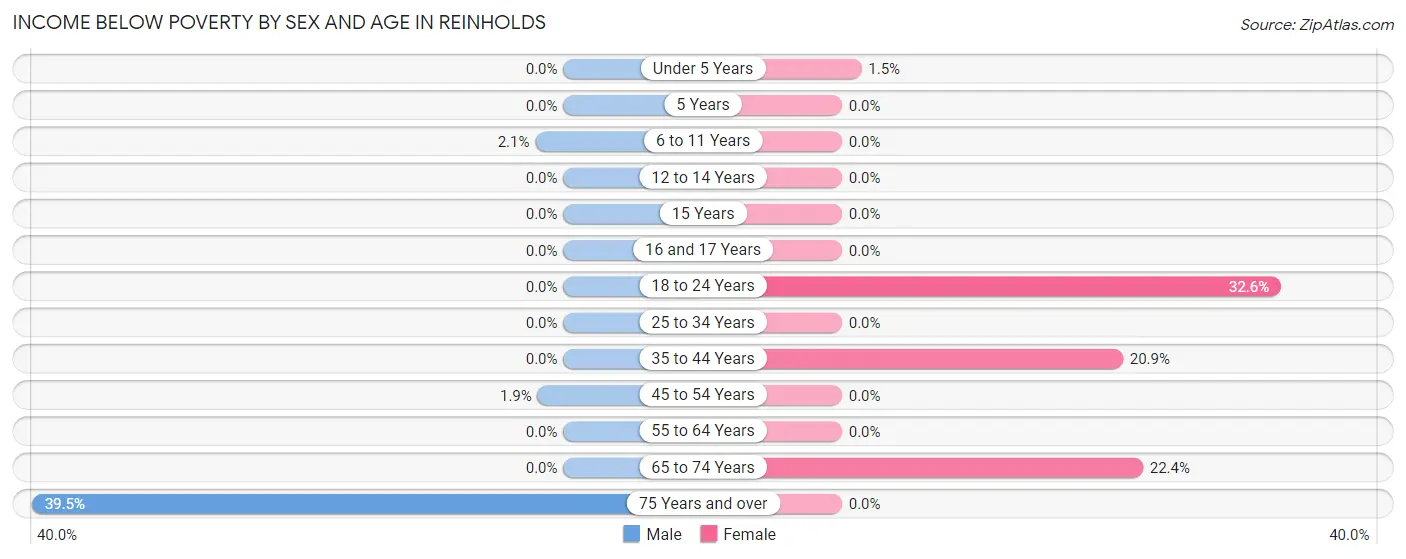
| Age Bracket | Male | Female |
| Under 5 Years | 0 (0.0%) | 2 (1.5%) |
| 5 Years | 0 (0.0%) | 0 (0.0%) |
| 6 to 11 Years | 2 (2.1%) | 0 (0.0%) |
| 12 to 14 Years | 0 (0.0%) | 0 (0.0%) |
| 15 Years | 0 (0.0%) | 0 (0.0%) |
| 16 and 17 Years | 0 (0.0%) | 0 (0.0%) |
| 18 to 24 Years | 0 (0.0%) | 30 (32.6%) |
| 25 to 34 Years | 0 (0.0%) | 0 (0.0%) |
| 35 to 44 Years | 0 (0.0%) | 29 (20.9%) |
| 45 to 54 Years | 3 (1.9%) | 0 (0.0%) |
| 55 to 64 Years | 0 (0.0%) | 0 (0.0%) |
| 65 to 74 Years | 0 (0.0%) | 19 (22.4%) |
| 75 Years and over | 15 (39.5%) | 0 (0.0%) |
| Total | 20 (1.8%) | 80 (6.5%) |
Income Above Poverty by Sex and Age in Reinholds
According to the poverty statistics in Reinholds, males aged under 5 years and females aged 6 to 11 years are the age groups that are most secure financially, with 100.0% of males and 100.0% of females in these age groups living above the poverty line.
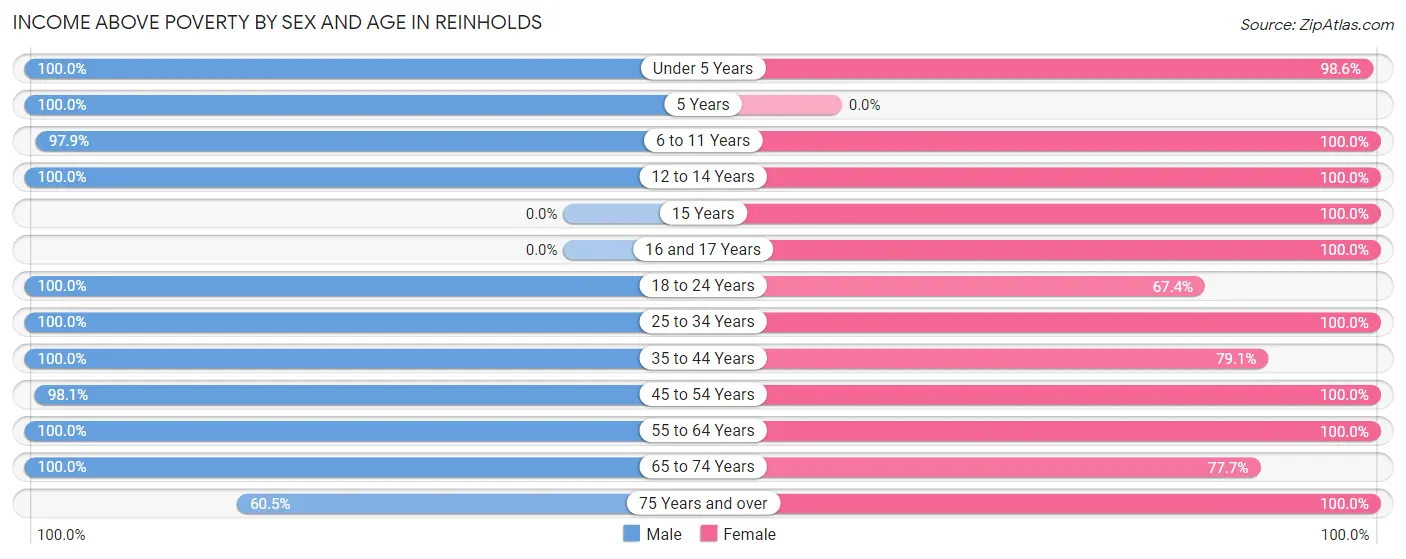
| Age Bracket | Male | Female |
| Under 5 Years | 121 (100.0%) | 136 (98.6%) |
| 5 Years | 12 (100.0%) | 0 (0.0%) |
| 6 to 11 Years | 94 (97.9%) | 229 (100.0%) |
| 12 to 14 Years | 39 (100.0%) | 15 (100.0%) |
| 15 Years | 0 (0.0%) | 16 (100.0%) |
| 16 and 17 Years | 0 (0.0%) | 29 (100.0%) |
| 18 to 24 Years | 16 (100.0%) | 62 (67.4%) |
| 25 to 34 Years | 146 (100.0%) | 123 (100.0%) |
| 35 to 44 Years | 182 (100.0%) | 110 (79.1%) |
| 45 to 54 Years | 154 (98.1%) | 226 (100.0%) |
| 55 to 64 Years | 205 (100.0%) | 102 (100.0%) |
| 65 to 74 Years | 90 (100.0%) | 66 (77.6%) |
| 75 Years and over | 23 (60.5%) | 45 (100.0%) |
| Total | 1,082 (98.2%) | 1,159 (93.5%) |
Income Below Poverty Among Married-Couple Families in Reinholds
The poverty statistics for married-couple families in Reinholds show that 0.5% or 3 of the total 567 families live below the poverty line. Families with 1 or 2 children have the highest poverty rate of 1.1%, comprising of 3 families. On the other hand, families with no children have the lowest poverty rate of 0.0%, which includes 0 families.
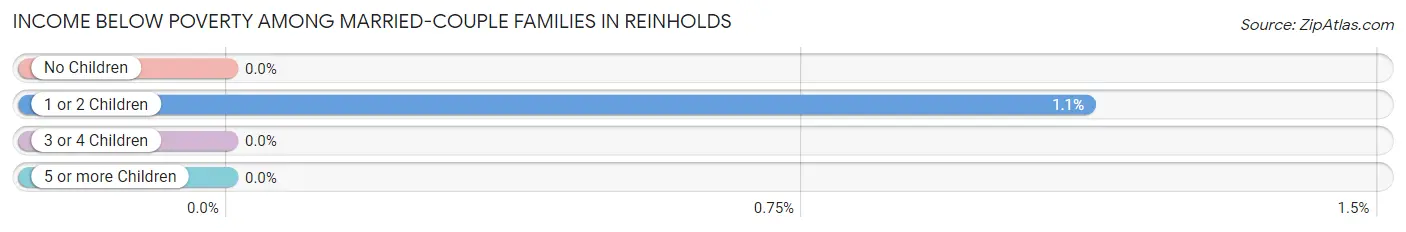
| Children | Above Poverty | Below Poverty |
| No Children | 240 (100.0%) | 0 (0.0%) |
| 1 or 2 Children | 265 (98.9%) | 3 (1.1%) |
| 3 or 4 Children | 59 (100.0%) | 0 (0.0%) |
| 5 or more Children | 0 (0.0%) | 0 (0.0%) |
| Total | 564 (99.5%) | 3 (0.5%) |
Income Below Poverty Among Single-Parent Households in Reinholds
| Children | Single Father | Single Mother |
| No Children | 0 (0.0%) | 0 (0.0%) |
| 1 or 2 Children | 0 (0.0%) | 0 (0.0%) |
| 3 or 4 Children | 0 (0.0%) | 0 (0.0%) |
| 5 or more Children | 0 (0.0%) | 0 (0.0%) |
| Total | 0 (0.0%) | 0 (0.0%) |
Income Below Poverty Among Married-Couple vs Single-Parent Households in Reinholds
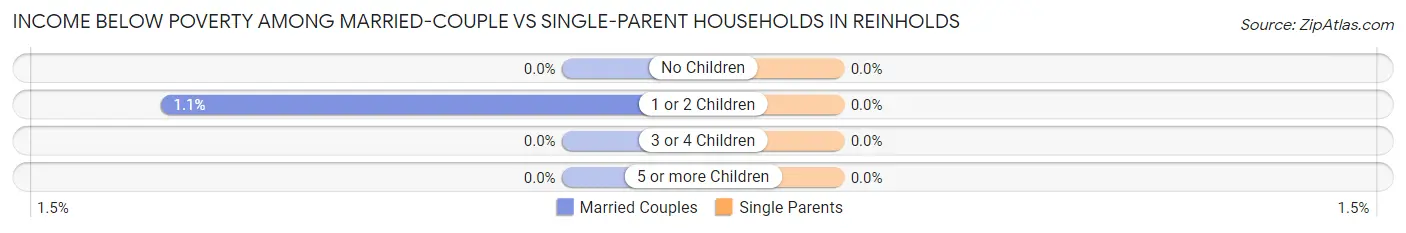
| Children | Married-Couple Families | Single-Parent Households |
| No Children | 0 (0.0%) | 0 (0.0%) |
| 1 or 2 Children | 3 (1.1%) | 0 (0.0%) |
| 3 or 4 Children | 0 (0.0%) | 0 (0.0%) |
| 5 or more Children | 0 (0.0%) | 0 (0.0%) |
| Total | 3 (0.5%) | 0 (0.0%) |
Race in Reinholds
The most populous races in Reinholds are White / Caucasian (2,268 | 96.9%), Hispanic or Latino (214 | 9.1%), and Black / African American (61 | 2.6%).
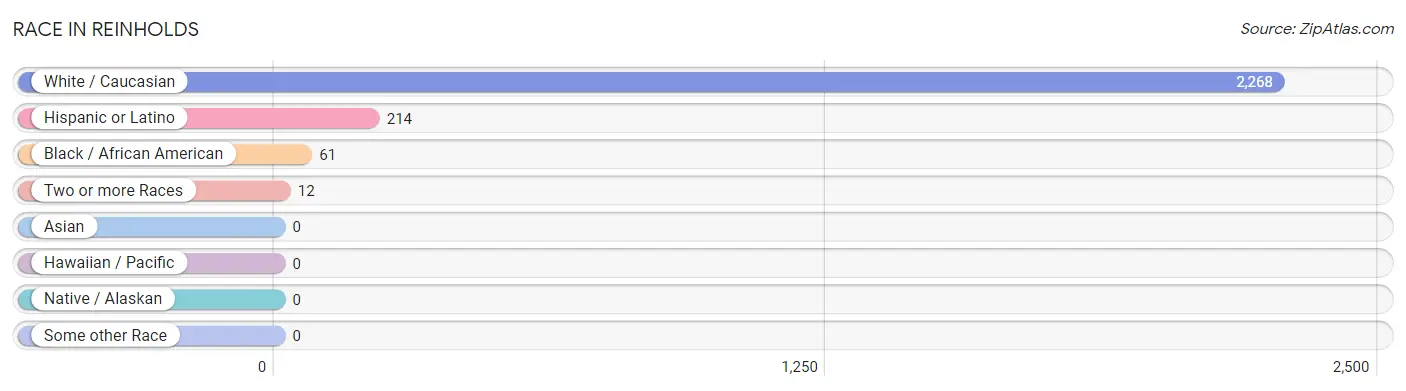
| Race | # Population | % Population |
| Asian | 0 | 0.0% |
| Black / African American | 61 | 2.6% |
| Hawaiian / Pacific | 0 | 0.0% |
| Hispanic or Latino | 214 | 9.1% |
| Native / Alaskan | 0 | 0.0% |
| White / Caucasian | 2,268 | 96.9% |
| Two or more Races | 12 | 0.5% |
| Some other Race | 0 | 0.0% |
| Total | 2,341 | 100.0% |
Ancestry in Reinholds
The most populous ancestries reported in Reinholds are German (776 | 33.2%), Irish (296 | 12.6%), Puerto Rican (214 | 9.1%), Italian (171 | 7.3%), and American (151 | 6.5%), together accounting for 68.7% of all Reinholds residents.
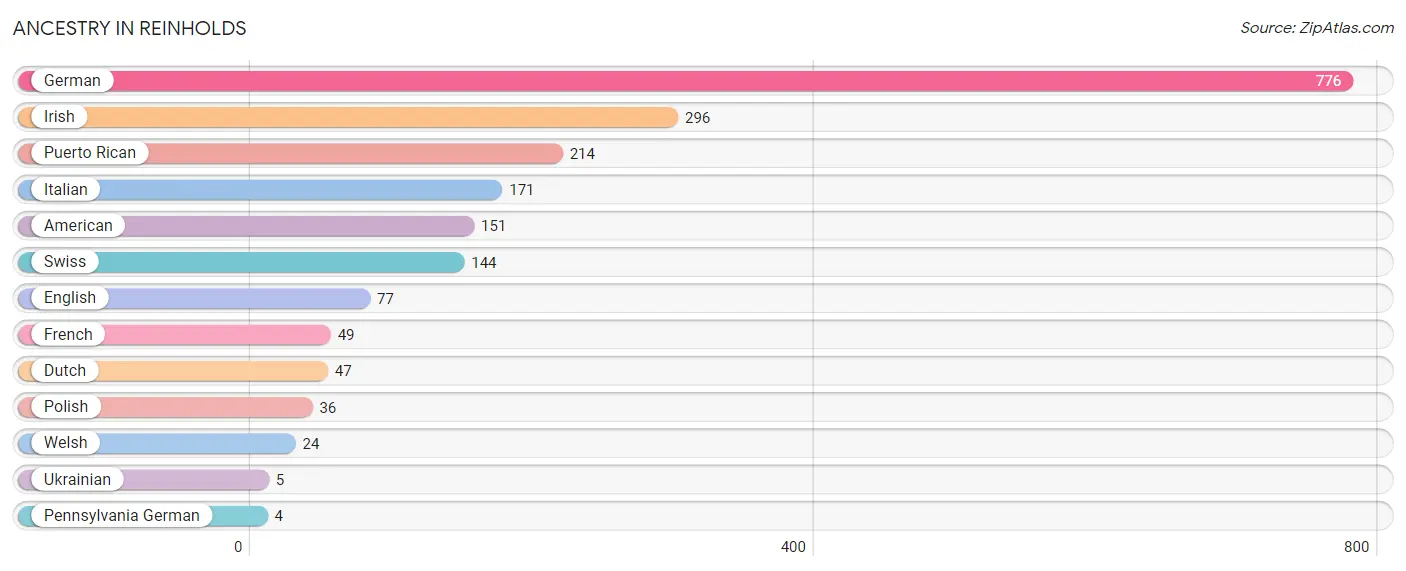
| Ancestry | # Population | % Population |
| American | 151 | 6.5% |
| Dutch | 47 | 2.0% |
| English | 77 | 3.3% |
| French | 49 | 2.1% |
| German | 776 | 33.2% |
| Irish | 296 | 12.6% |
| Italian | 171 | 7.3% |
| Pennsylvania German | 4 | 0.2% |
| Polish | 36 | 1.5% |
| Puerto Rican | 214 | 9.1% |
| Swiss | 144 | 6.1% |
| Ukrainian | 5 | 0.2% |
| Welsh | 24 | 1.0% | View All 13 Rows |
Immigrants in Reinholds

| Immigration Origin | # Population | % Population | View All 0 Rows |
Sex and Age in Reinholds
Sex and Age in Reinholds
The most populous age groups in Reinholds are 55 to 59 Years (141 | 12.8%) for men and 50 to 54 Years (157 | 12.7%) for women.
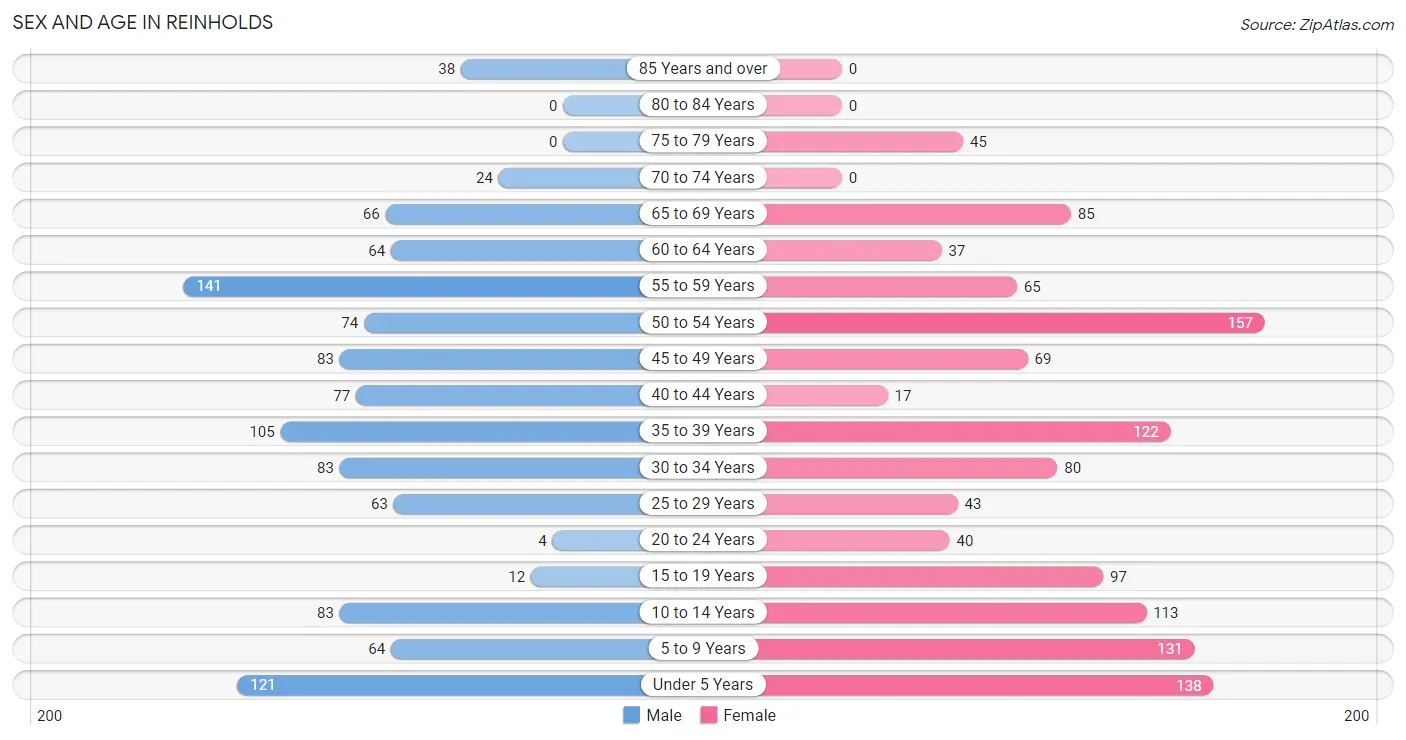
| Age Bracket | Male | Female |
| Under 5 Years | 121 (11.0%) | 138 (11.1%) |
| 5 to 9 Years | 64 (5.8%) | 131 (10.6%) |
| 10 to 14 Years | 83 (7.5%) | 113 (9.1%) |
| 15 to 19 Years | 12 (1.1%) | 97 (7.8%) |
| 20 to 24 Years | 4 (0.4%) | 40 (3.2%) |
| 25 to 29 Years | 63 (5.7%) | 43 (3.5%) |
| 30 to 34 Years | 83 (7.5%) | 80 (6.5%) |
| 35 to 39 Years | 105 (9.5%) | 122 (9.9%) |
| 40 to 44 Years | 77 (7.0%) | 17 (1.4%) |
| 45 to 49 Years | 83 (7.5%) | 69 (5.6%) |
| 50 to 54 Years | 74 (6.7%) | 157 (12.7%) |
| 55 to 59 Years | 141 (12.8%) | 65 (5.2%) |
| 60 to 64 Years | 64 (5.8%) | 37 (3.0%) |
| 65 to 69 Years | 66 (6.0%) | 85 (6.9%) |
| 70 to 74 Years | 24 (2.2%) | 0 (0.0%) |
| 75 to 79 Years | 0 (0.0%) | 45 (3.6%) |
| 80 to 84 Years | 0 (0.0%) | 0 (0.0%) |
| 85 Years and over | 38 (3.5%) | 0 (0.0%) |
| Total | 1,102 (100.0%) | 1,239 (100.0%) |
Families and Households in Reinholds
Median Family Size in Reinholds
The median family size in Reinholds is 3.49 persons per family, with single male/father families (28 | 4.7%) accounting for the largest median family size of 5.68 persons per family. On the other hand, single female/mother families (3 | 0.5%) represent the smallest median family size with 2.33 persons per family.
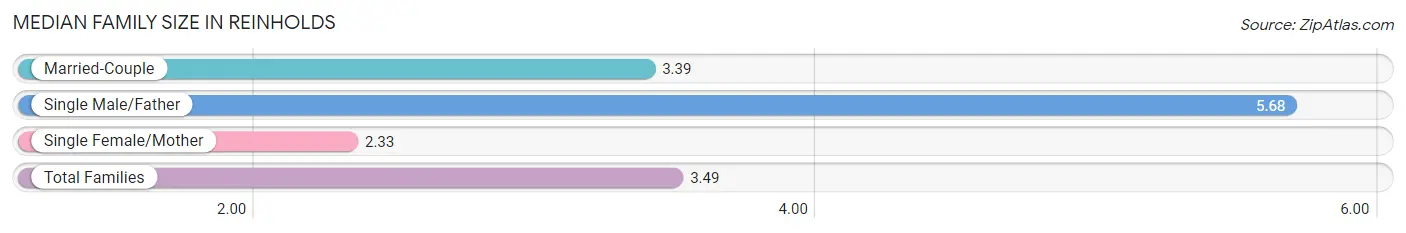
| Family Type | # Families | Family Size |
| Married-Couple | 567 (94.8%) | 3.39 |
| Single Male/Father | 28 (4.7%) | 5.68 |
| Single Female/Mother | 3 (0.5%) | 2.33 |
| Total Families | 598 (100.0%) | 3.49 |
Median Household Size in Reinholds
The median household size in Reinholds is 3.14 persons per household, with single male/father households (28 | 3.7%) accounting for the largest median household size of 7.82 persons per household. non-family households (148 | 19.8%) represent the smallest median household size with 1.29 persons per household.
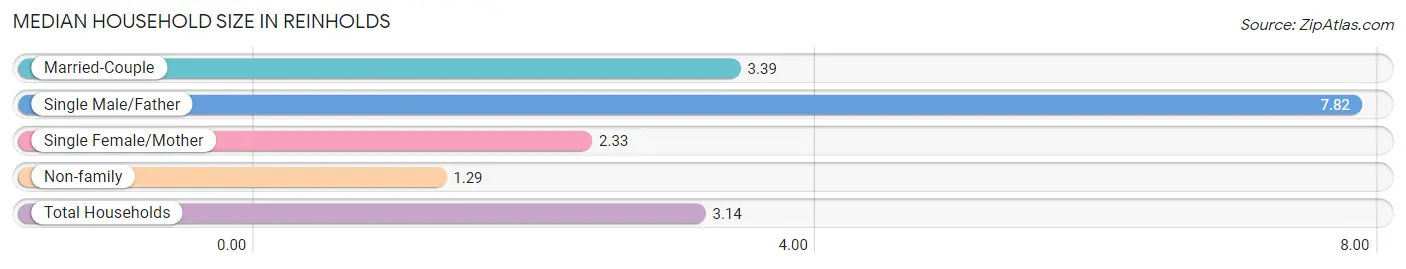
| Household Type | # Households | Household Size |
| Married-Couple | 567 (76.0%) | 3.39 |
| Single Male/Father | 28 (3.7%) | 7.82 |
| Single Female/Mother | 3 (0.4%) | 2.33 |
| Non-family | 148 (19.8%) | 1.29 |
| Total Households | 746 (100.0%) | 3.14 |
Household Size by Marriage Status in Reinholds
Out of a total of 746 households in Reinholds, 598 (80.2%) are family households, while 148 (19.8%) are nonfamily households. The most numerous type of family households are 4-person households, comprising 259, and the most common type of nonfamily households are 1-person households, comprising 105.
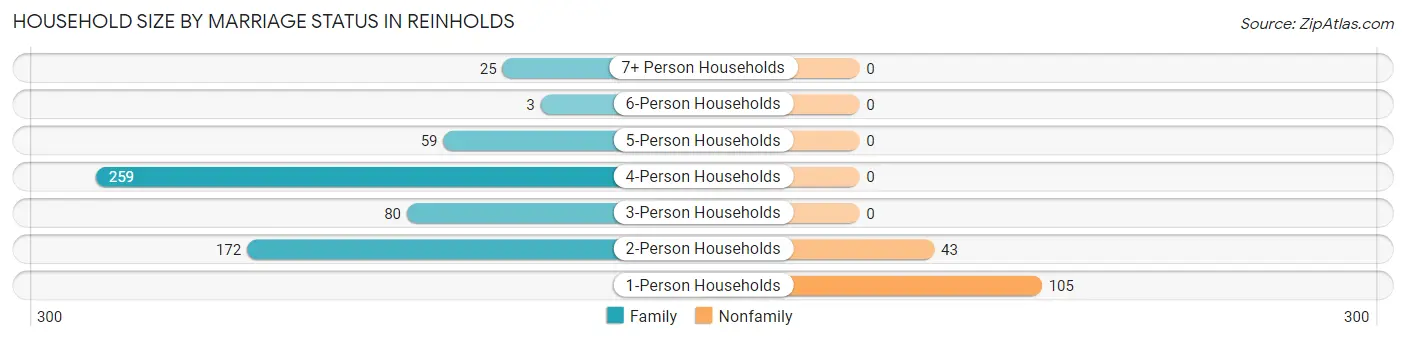
| Household Size | Family Households | Nonfamily Households |
| 1-Person Households | - | 105 (14.1%) |
| 2-Person Households | 172 (23.1%) | 43 (5.8%) |
| 3-Person Households | 80 (10.7%) | 0 (0.0%) |
| 4-Person Households | 259 (34.7%) | 0 (0.0%) |
| 5-Person Households | 59 (7.9%) | 0 (0.0%) |
| 6-Person Households | 3 (0.4%) | 0 (0.0%) |
| 7+ Person Households | 25 (3.4%) | 0 (0.0%) |
| Total | 598 (80.2%) | 148 (19.8%) |
Female Fertility in Reinholds
Fertility by Age in Reinholds
Average fertility rate in Reinholds is 110.0 births per 1,000 women. Women in the age bracket of 20 to 34 years have the highest fertility rate with 331.0 births per 1,000 women. Women in the age bracket of 20 to 34 years acount for 100.0% of all women with births.
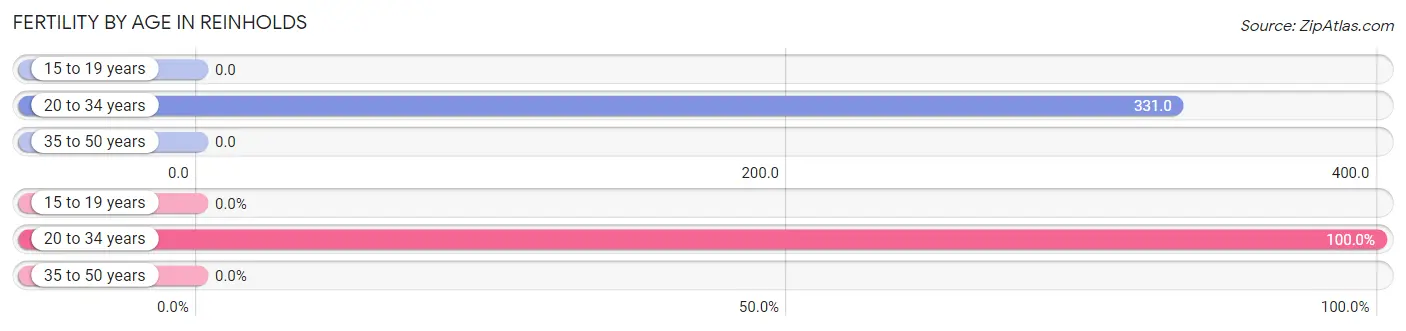
| Age Bracket | Women with Births | Births / 1,000 Women |
| 15 to 19 years | 0 (0.0%) | 0.0 |
| 20 to 34 years | 54 (100.0%) | 331.0 |
| 35 to 50 years | 0 (0.0%) | 0.0 |
| Total | 54 (100.0%) | 110.0 |
Fertility by Age by Marriage Status in Reinholds
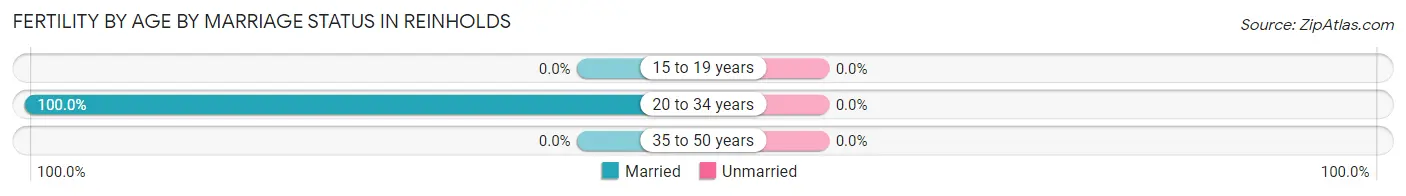
| Age Bracket | Married | Unmarried |
| 15 to 19 years | 0 (0.0%) | 0 (0.0%) |
| 20 to 34 years | 54 (100.0%) | 0 (0.0%) |
| 35 to 50 years | 0 (0.0%) | 0 (0.0%) |
| Total | 54 (100.0%) | 0 (0.0%) |
Fertility by Education in Reinholds
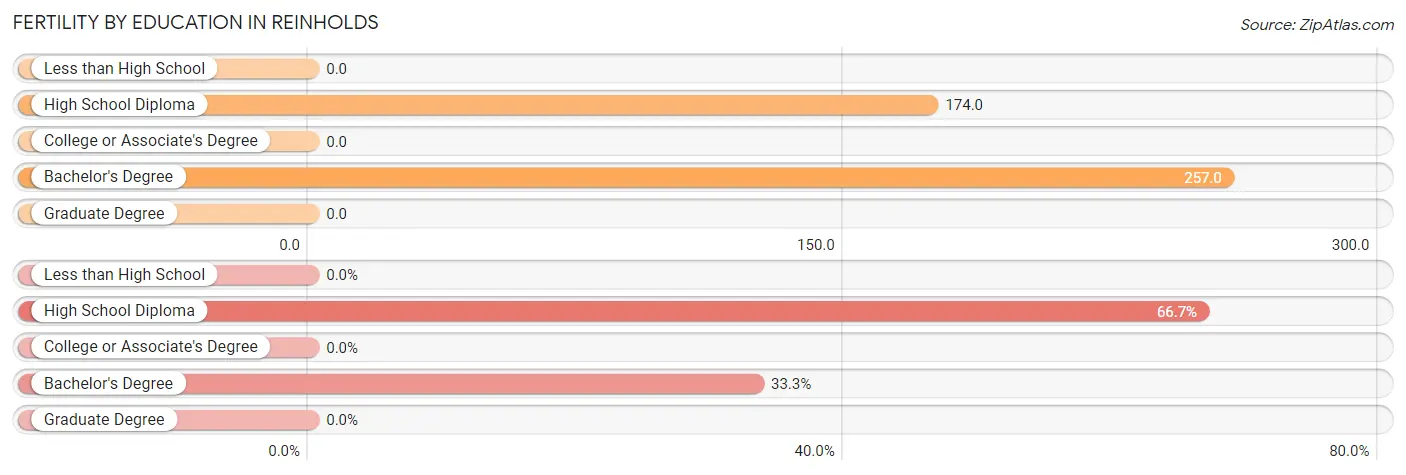
| Educational Attainment | Women with Births | Births / 1,000 Women |
| Less than High School | 0 (0.0%) | 0.0 |
| High School Diploma | 36 (66.7%) | 174.0 |
| College or Associate's Degree | 0 (0.0%) | 0.0 |
| Bachelor's Degree | 18 (33.3%) | 257.0 |
| Graduate Degree | 0 (0.0%) | 0.0 |
| Total | 54 (100.0%) | 110.0 |
Fertility by Education by Marriage Status in Reinholds
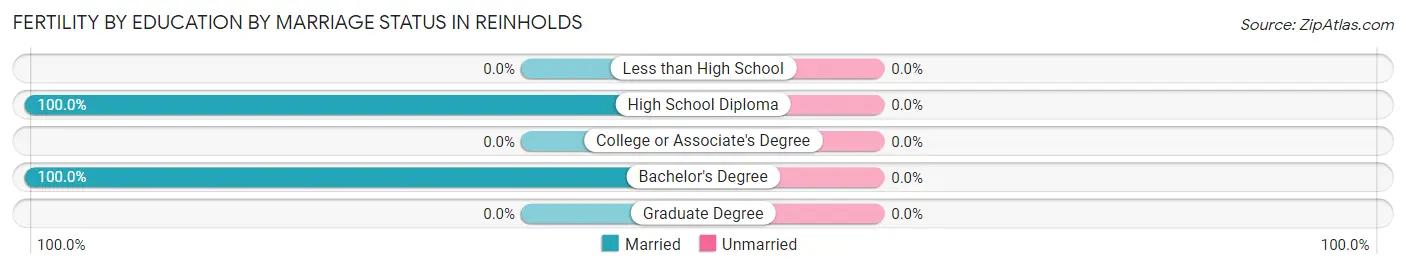
| Educational Attainment | Married | Unmarried |
| Less than High School | 0 (0.0%) | 0 (0.0%) |
| High School Diploma | 36 (100.0%) | 0 (0.0%) |
| College or Associate's Degree | 0 (0.0%) | 0 (0.0%) |
| Bachelor's Degree | 18 (100.0%) | 0 (0.0%) |
| Graduate Degree | 0 (0.0%) | 0 (0.0%) |
| Total | 54 (100.0%) | 0 (0.0%) |
Employment Characteristics in Reinholds
Employment by Class of Employer in Reinholds
Among the 1,153 employed individuals in Reinholds, private company employees (864 | 74.9%), local government employees (175 | 15.2%), and not-for-profit organizations (76 | 6.6%) make up the most common classes of employment.
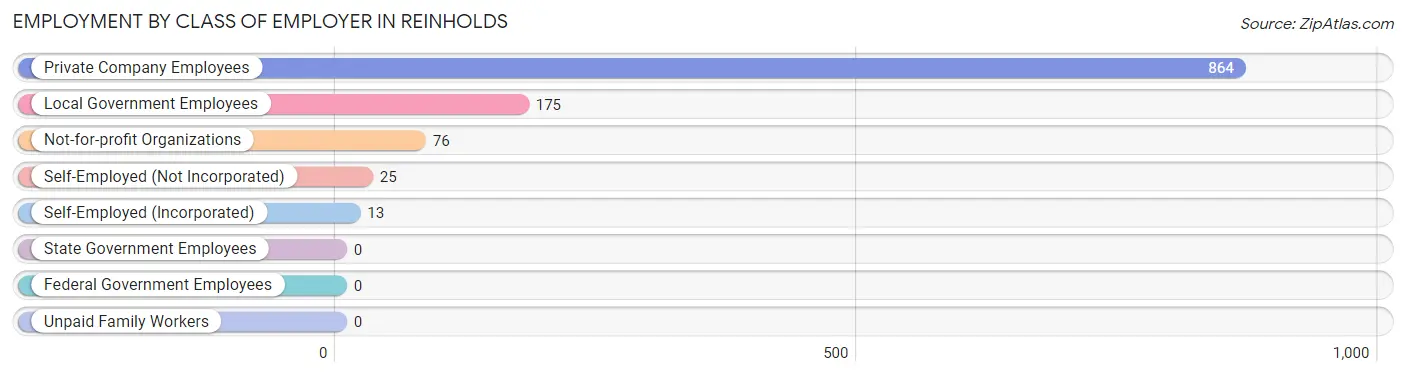
| Employer Class | # Employees | % Employees |
| Private Company Employees | 864 | 74.9% |
| Self-Employed (Incorporated) | 13 | 1.1% |
| Self-Employed (Not Incorporated) | 25 | 2.2% |
| Not-for-profit Organizations | 76 | 6.6% |
| Local Government Employees | 175 | 15.2% |
| State Government Employees | 0 | 0.0% |
| Federal Government Employees | 0 | 0.0% |
| Unpaid Family Workers | 0 | 0.0% |
| Total | 1,153 | 100.0% |
Employment Status by Age in Reinholds
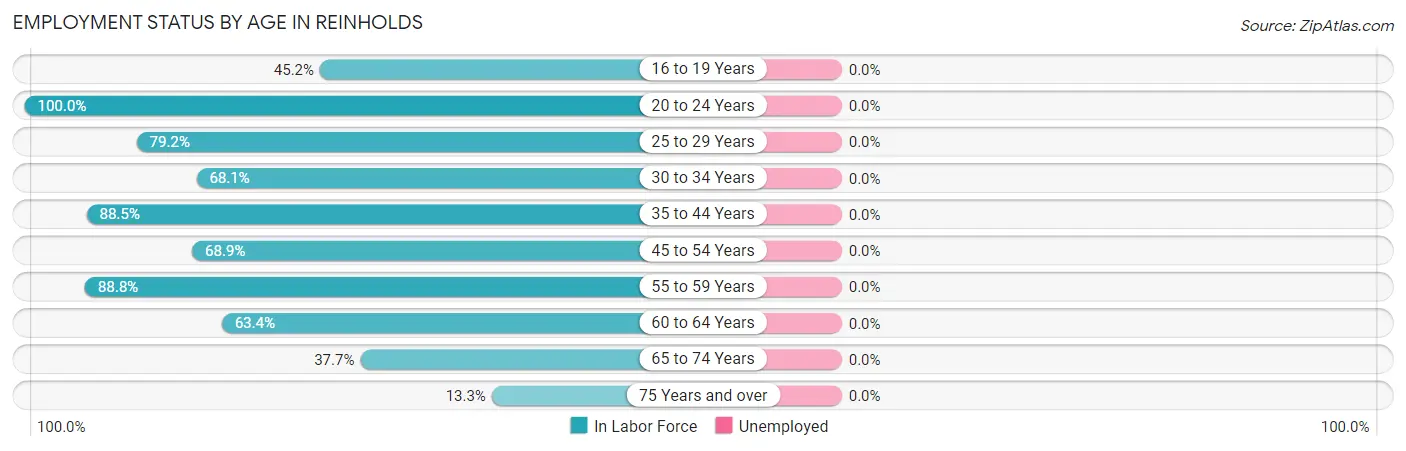
| Age Bracket | In Labor Force | Unemployed |
| 16 to 19 Years | 42 (45.2%) | 0 (0.0%) |
| 20 to 24 Years | 44 (100.0%) | 0 (0.0%) |
| 25 to 29 Years | 84 (79.2%) | 0 (0.0%) |
| 30 to 34 Years | 111 (68.1%) | 0 (0.0%) |
| 35 to 44 Years | 284 (88.5%) | 0 (0.0%) |
| 45 to 54 Years | 264 (68.9%) | 0 (0.0%) |
| 55 to 59 Years | 183 (88.8%) | 0 (0.0%) |
| 60 to 64 Years | 64 (63.4%) | 0 (0.0%) |
| 65 to 74 Years | 66 (37.7%) | 0 (0.0%) |
| 75 Years and over | 11 (13.3%) | 0 (0.0%) |
| Total | 1,152 (68.8%) | 0 (0.0%) |
Employment Status by Educational Attainment in Reinholds
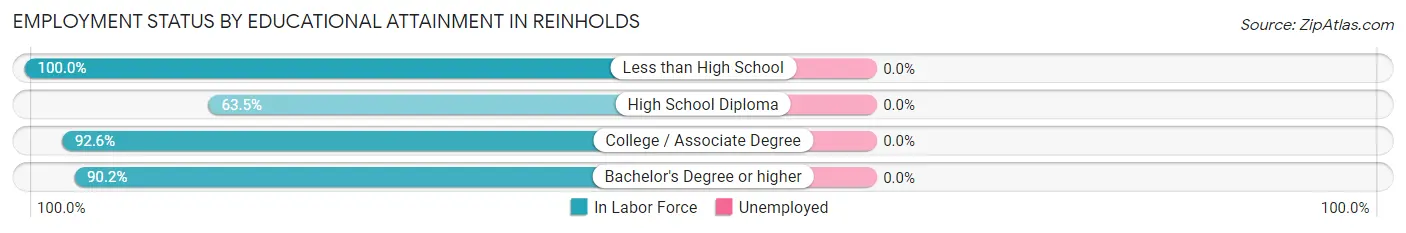
| Educational Attainment | In Labor Force | Unemployed |
| Less than High School | 54 (100.0%) | 0 (0.0%) |
| High School Diploma | 417 (63.5%) | 0 (0.0%) |
| College / Associate Degree | 225 (92.6%) | 0 (0.0%) |
| Bachelor's Degree or higher | 294 (90.2%) | 0 (0.0%) |
| Total | 989 (77.3%) | 0 (0.0%) |
Employment Occupations by Sex in Reinholds
Management, Business, Science and Arts Occupations
The most common Management, Business, Science and Arts occupations in Reinholds are Management (109 | 9.5%), Community & Social Service (108 | 9.4%), Computers, Engineering & Science (89 | 7.7%), Architecture & Engineering (74 | 6.4%), and Education Instruction & Library (55 | 4.8%).
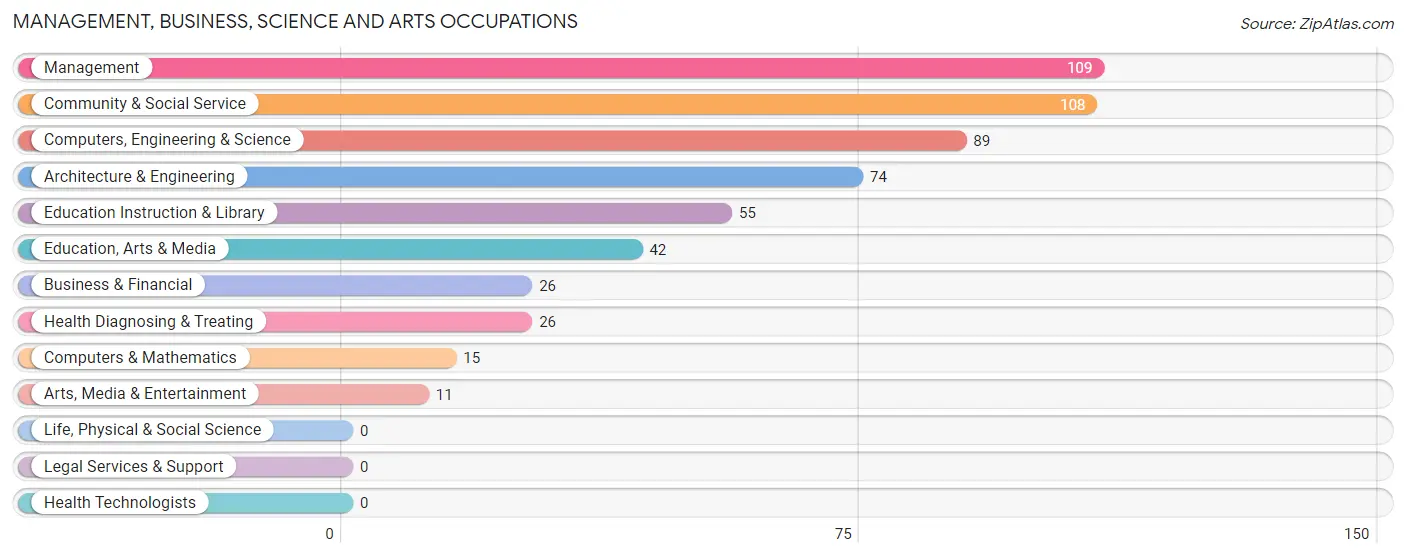
Management, Business, Science and Arts Occupations by Sex
Within the Management, Business, Science and Arts occupations in Reinholds, the most male-oriented occupations are Computers & Mathematics (100.0%), Education Instruction & Library (100.0%), and Computers, Engineering & Science (73.0%), while the most female-oriented occupations are Business & Financial (100.0%), Education, Arts & Media (100.0%), and Arts, Media & Entertainment (100.0%).
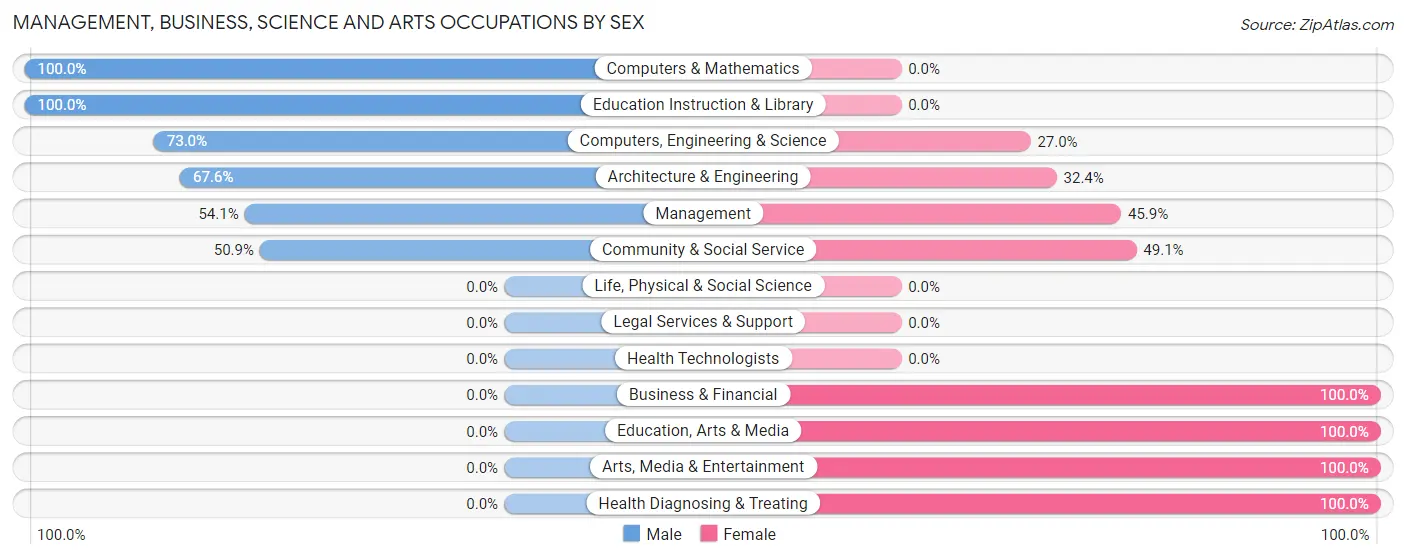
| Occupation | Male | Female |
| Management | 59 (54.1%) | 50 (45.9%) |
| Business & Financial | 0 (0.0%) | 26 (100.0%) |
| Computers, Engineering & Science | 65 (73.0%) | 24 (27.0%) |
| Computers & Mathematics | 15 (100.0%) | 0 (0.0%) |
| Architecture & Engineering | 50 (67.6%) | 24 (32.4%) |
| Life, Physical & Social Science | 0 (0.0%) | 0 (0.0%) |
| Community & Social Service | 55 (50.9%) | 53 (49.1%) |
| Education, Arts & Media | 0 (0.0%) | 42 (100.0%) |
| Legal Services & Support | 0 (0.0%) | 0 (0.0%) |
| Education Instruction & Library | 55 (100.0%) | 0 (0.0%) |
| Arts, Media & Entertainment | 0 (0.0%) | 11 (100.0%) |
| Health Diagnosing & Treating | 0 (0.0%) | 26 (100.0%) |
| Health Technologists | 0 (0.0%) | 0 (0.0%) |
| Total (Category) | 179 (50.0%) | 179 (50.0%) |
| Total (Overall) | 757 (65.6%) | 396 (34.4%) |
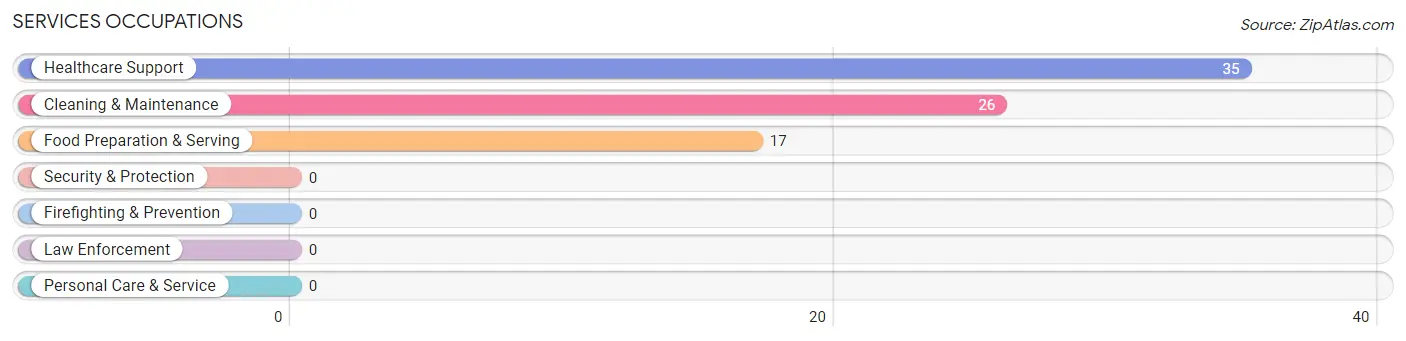
Services Occupations
The most common Services occupations in Reinholds are Healthcare Support (35 | 3.0%), Cleaning & Maintenance (26 | 2.2%), and Food Preparation & Serving (17 | 1.5%).
Services Occupations by Sex
Within the Services occupations in Reinholds, the most male-oriented occupations are Food Preparation & Serving (100.0%), and Cleaning & Maintenance (46.2%), while the most female-oriented occupations are Healthcare Support (100.0%), and Cleaning & Maintenance (53.8%).
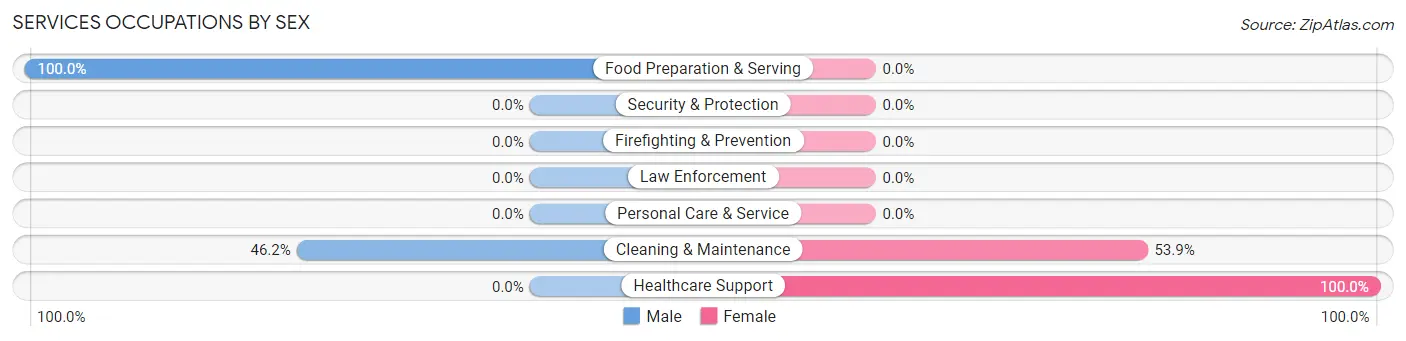
| Occupation | Male | Female |
| Healthcare Support | 0 (0.0%) | 35 (100.0%) |
| Security & Protection | 0 (0.0%) | 0 (0.0%) |
| Firefighting & Prevention | 0 (0.0%) | 0 (0.0%) |
| Law Enforcement | 0 (0.0%) | 0 (0.0%) |
| Food Preparation & Serving | 17 (100.0%) | 0 (0.0%) |
| Cleaning & Maintenance | 12 (46.2%) | 14 (53.8%) |
| Personal Care & Service | 0 (0.0%) | 0 (0.0%) |
| Total (Category) | 29 (37.2%) | 49 (62.8%) |
| Total (Overall) | 757 (65.6%) | 396 (34.4%) |
Sales and Office Occupations
The most common Sales and Office occupations in Reinholds are Office & Administration (137 | 11.9%), and Sales & Related (67 | 5.8%).
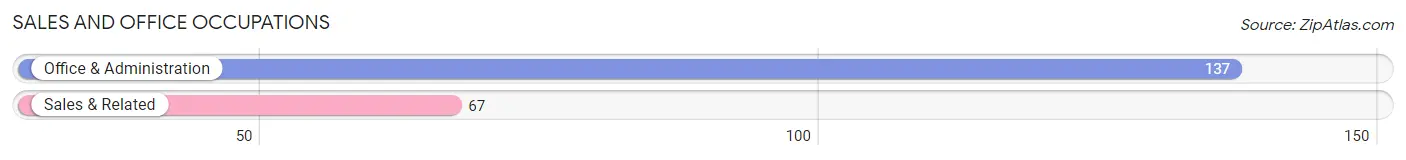
Sales and Office Occupations by Sex
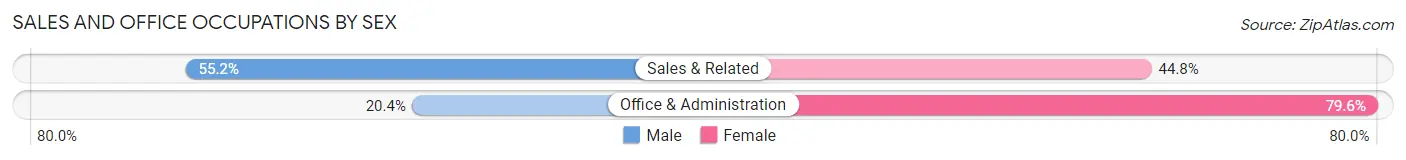
| Occupation | Male | Female |
| Sales & Related | 37 (55.2%) | 30 (44.8%) |
| Office & Administration | 28 (20.4%) | 109 (79.6%) |
| Total (Category) | 65 (31.9%) | 139 (68.1%) |
| Total (Overall) | 757 (65.6%) | 396 (34.4%) |
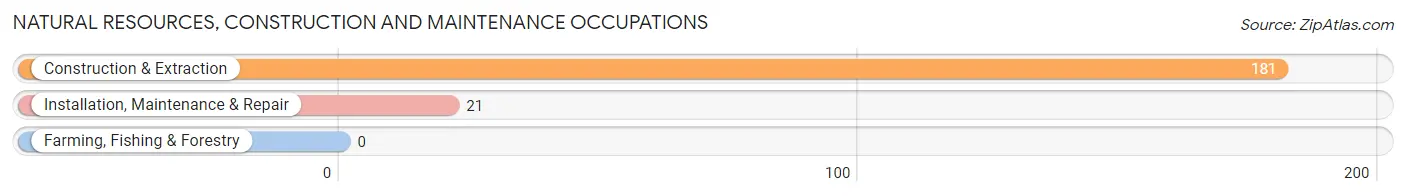
Natural Resources, Construction and Maintenance Occupations
The most common Natural Resources, Construction and Maintenance occupations in Reinholds are Construction & Extraction (181 | 15.7%), and Installation, Maintenance & Repair (21 | 1.8%).
Natural Resources, Construction and Maintenance Occupations by Sex
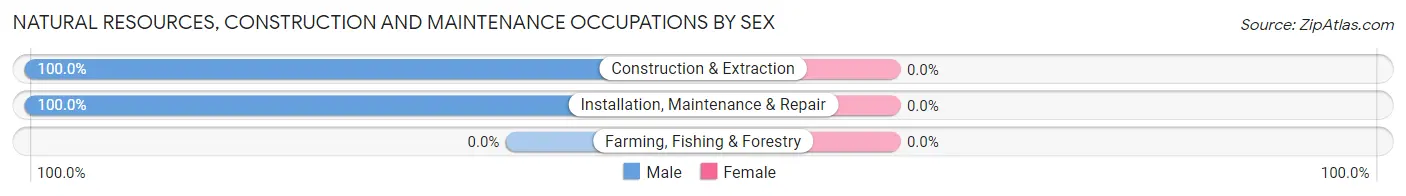
| Occupation | Male | Female |
| Farming, Fishing & Forestry | 0 (0.0%) | 0 (0.0%) |
| Construction & Extraction | 181 (100.0%) | 0 (0.0%) |
| Installation, Maintenance & Repair | 21 (100.0%) | 0 (0.0%) |
| Total (Category) | 202 (100.0%) | 0 (0.0%) |
| Total (Overall) | 757 (65.6%) | 396 (34.4%) |
Production, Transportation and Moving Occupations
The most common Production, Transportation and Moving occupations in Reinholds are Production (126 | 10.9%), Transportation (93 | 8.1%), and Material Moving (92 | 8.0%).
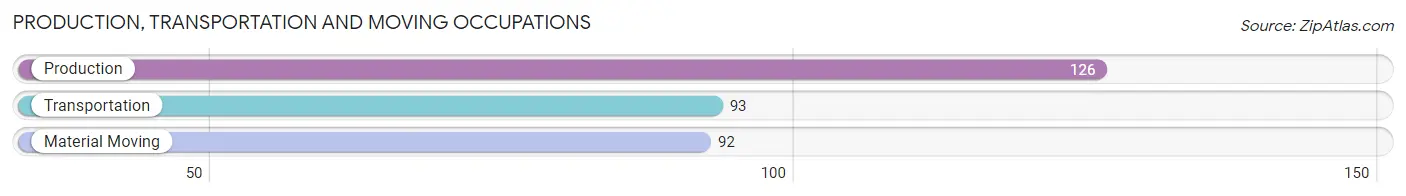
Production, Transportation and Moving Occupations by Sex
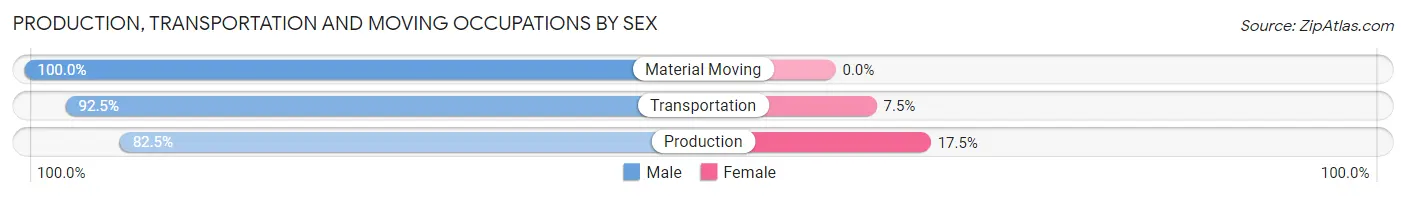
| Occupation | Male | Female |
| Production | 104 (82.5%) | 22 (17.5%) |
| Transportation | 86 (92.5%) | 7 (7.5%) |
| Material Moving | 92 (100.0%) | 0 (0.0%) |
| Total (Category) | 282 (90.7%) | 29 (9.3%) |
| Total (Overall) | 757 (65.6%) | 396 (34.4%) |
Employment Industries by Sex in Reinholds
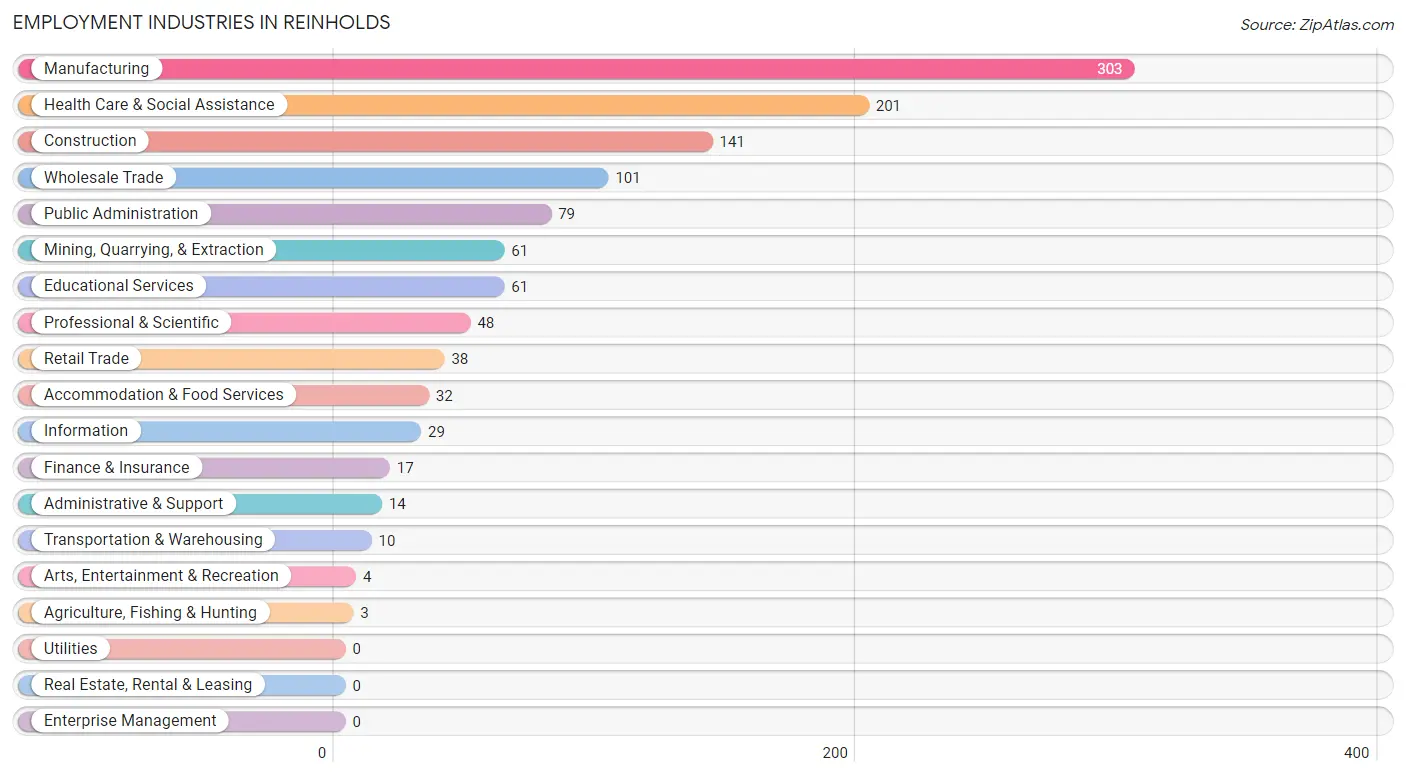
Employment Industries in Reinholds
The major employment industries in Reinholds include Manufacturing (303 | 26.3%), Health Care & Social Assistance (201 | 17.4%), Construction (141 | 12.2%), Wholesale Trade (101 | 8.8%), and Public Administration (79 | 6.9%).
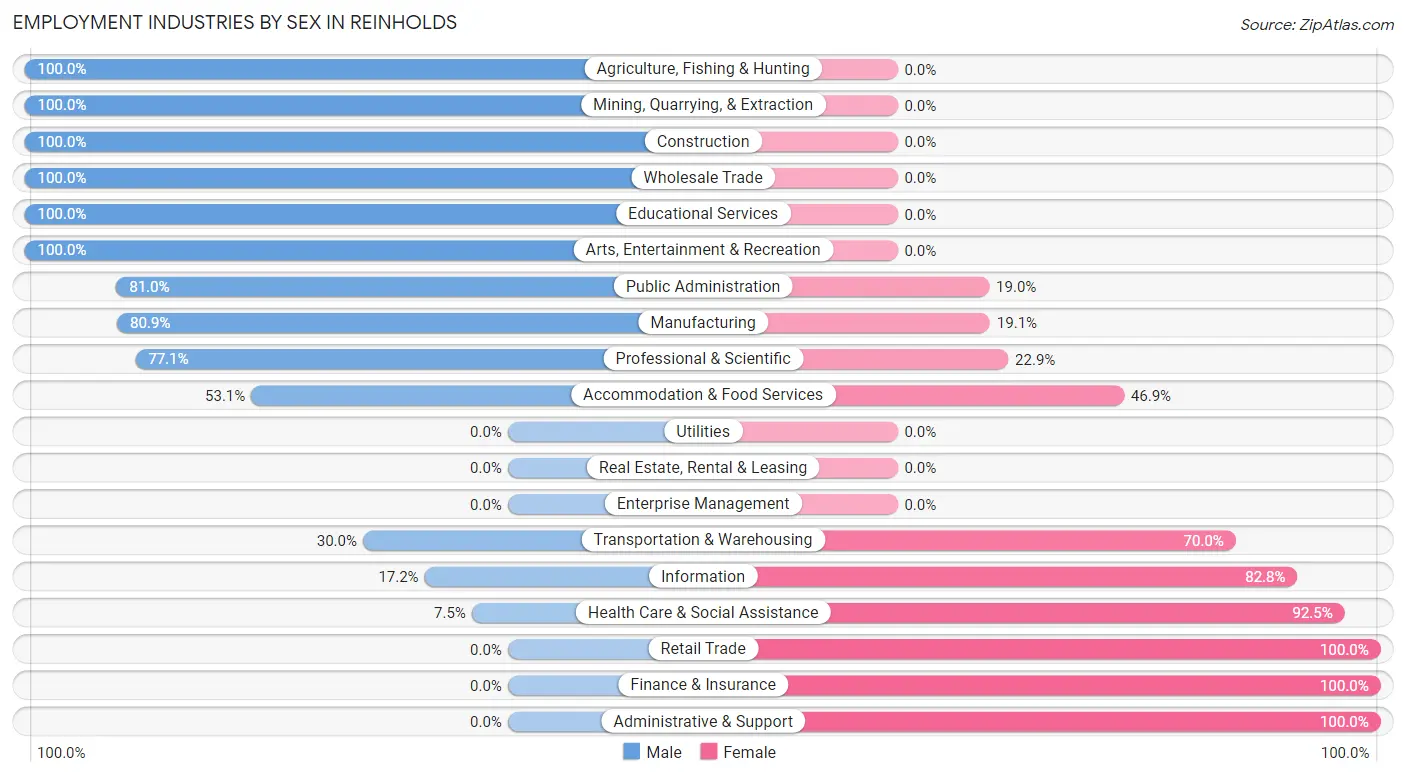
Employment Industries by Sex in Reinholds
The Reinholds industries that see more men than women are Agriculture, Fishing & Hunting (100.0%), Mining, Quarrying, & Extraction (100.0%), and Construction (100.0%), whereas the industries that tend to have a higher number of women are Retail Trade (100.0%), Finance & Insurance (100.0%), and Administrative & Support (100.0%).
| Industry | Male | Female |
| Agriculture, Fishing & Hunting | 3 (100.0%) | 0 (0.0%) |
| Mining, Quarrying, & Extraction | 61 (100.0%) | 0 (0.0%) |
| Construction | 141 (100.0%) | 0 (0.0%) |
| Manufacturing | 245 (80.9%) | 58 (19.1%) |
| Wholesale Trade | 101 (100.0%) | 0 (0.0%) |
| Retail Trade | 0 (0.0%) | 38 (100.0%) |
| Transportation & Warehousing | 3 (30.0%) | 7 (70.0%) |
| Utilities | 0 (0.0%) | 0 (0.0%) |
| Information | 5 (17.2%) | 24 (82.8%) |
| Finance & Insurance | 0 (0.0%) | 17 (100.0%) |
| Real Estate, Rental & Leasing | 0 (0.0%) | 0 (0.0%) |
| Professional & Scientific | 37 (77.1%) | 11 (22.9%) |
| Enterprise Management | 0 (0.0%) | 0 (0.0%) |
| Administrative & Support | 0 (0.0%) | 14 (100.0%) |
| Educational Services | 61 (100.0%) | 0 (0.0%) |
| Health Care & Social Assistance | 15 (7.5%) | 186 (92.5%) |
| Arts, Entertainment & Recreation | 4 (100.0%) | 0 (0.0%) |
| Accommodation & Food Services | 17 (53.1%) | 15 (46.9%) |
| Public Administration | 64 (81.0%) | 15 (19.0%) |
| Total | 757 (65.6%) | 396 (34.4%) |
Education in Reinholds
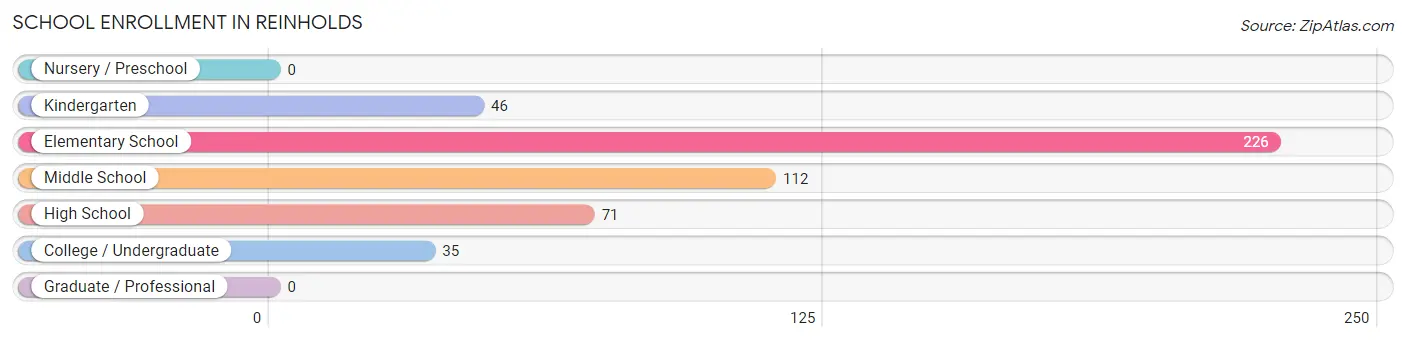
School Enrollment in Reinholds
The most common levels of schooling among the 490 students in Reinholds are elementary school (226 | 46.1%), middle school (112 | 22.9%), and high school (71 | 14.5%).
| School Level | # Students | % Students |
| Nursery / Preschool | 0 | 0.0% |
| Kindergarten | 46 | 9.4% |
| Elementary School | 226 | 46.1% |
| Middle School | 112 | 22.9% |
| High School | 71 | 14.5% |
| College / Undergraduate | 35 | 7.1% |
| Graduate / Professional | 0 | 0.0% |
| Total | 490 | 100.0% |
School Enrollment by Age by Funding Source in Reinholds
Out of a total of 490 students who are enrolled in schools in Reinholds, 102 (20.8%) attend a private institution, while the remaining 388 (79.2%) are enrolled in public schools. The age group of 15 to 17 year olds has the highest likelihood of being enrolled in private schools, with 16 (35.6% in the age bracket) enrolled. Conversely, the age group of 18 to 19 year olds has the lowest likelihood of being enrolled in a private school, with 26 (100.0% in the age bracket) attending a public institution.
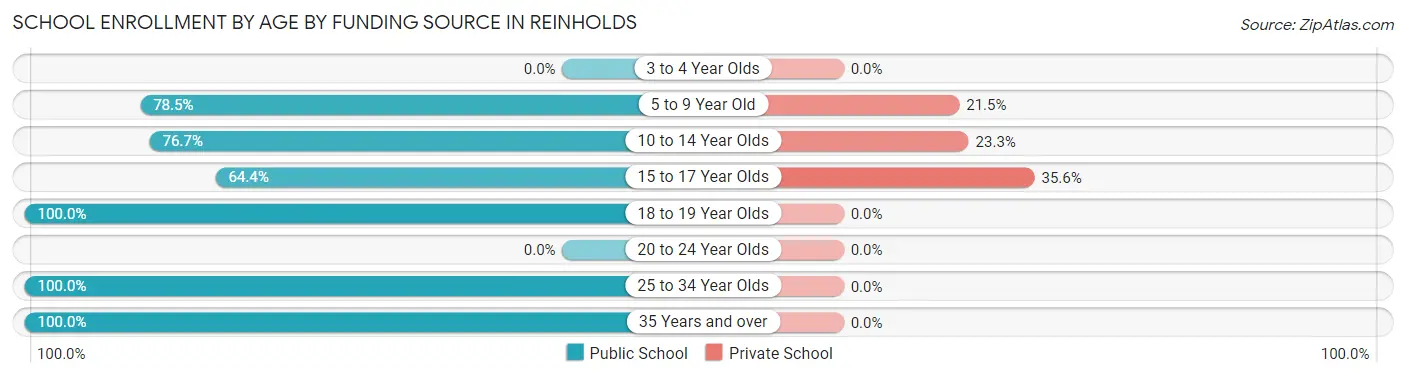
| Age Bracket | Public School | Private School |
| 3 to 4 Year Olds | 0 (0.0%) | 0 (0.0%) |
| 5 to 9 Year Old | 153 (78.5%) | 42 (21.5%) |
| 10 to 14 Year Olds | 145 (76.7%) | 44 (23.3%) |
| 15 to 17 Year Olds | 29 (64.4%) | 16 (35.6%) |
| 18 to 19 Year Olds | 26 (100.0%) | 0 (0.0%) |
| 20 to 24 Year Olds | 0 (0.0%) | 0 (0.0%) |
| 25 to 34 Year Olds | 10 (100.0%) | 0 (0.0%) |
| 35 Years and over | 25 (100.0%) | 0 (0.0%) |
| Total | 388 (79.2%) | 102 (20.8%) |
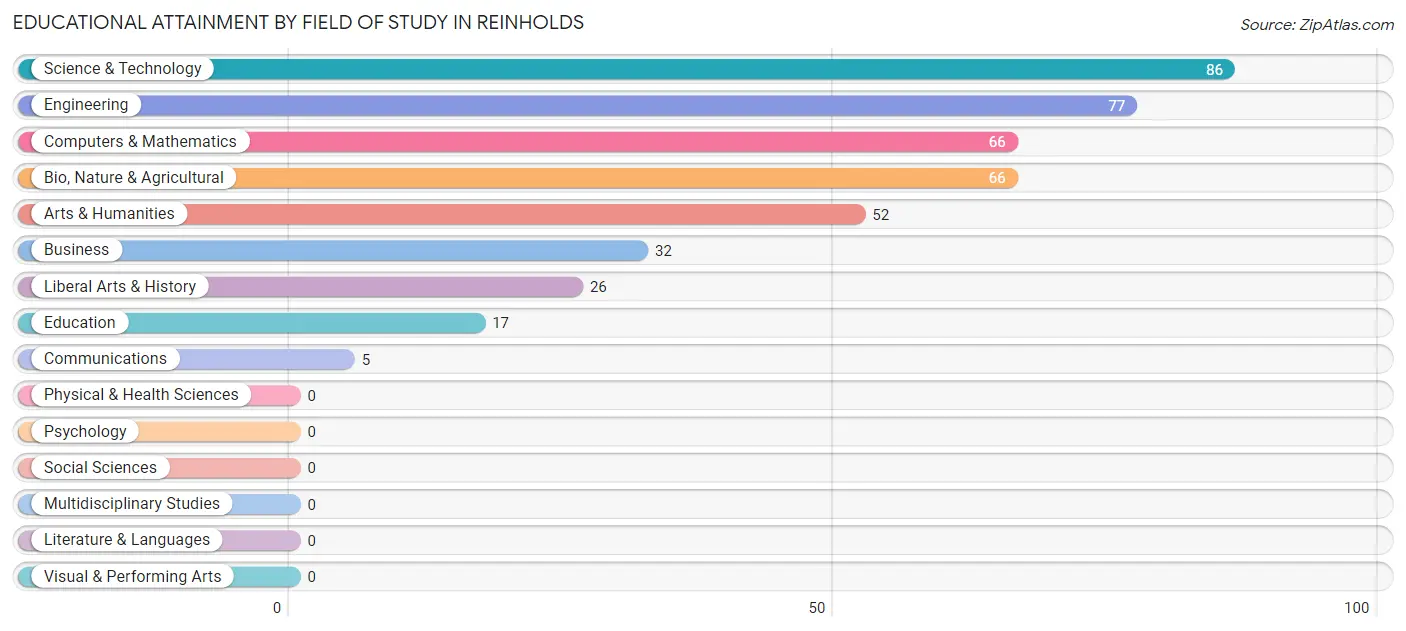
Educational Attainment by Field of Study in Reinholds
Science & technology (86 | 20.1%), engineering (77 | 18.0%), computers & mathematics (66 | 15.5%), bio, nature & agricultural (66 | 15.5%), and arts & humanities (52 | 12.2%) are the most common fields of study among 427 individuals in Reinholds who have obtained a bachelor's degree or higher.
| Field of Study | # Graduates | % Graduates |
| Computers & Mathematics | 66 | 15.5% |
| Bio, Nature & Agricultural | 66 | 15.5% |
| Physical & Health Sciences | 0 | 0.0% |
| Psychology | 0 | 0.0% |
| Social Sciences | 0 | 0.0% |
| Engineering | 77 | 18.0% |
| Multidisciplinary Studies | 0 | 0.0% |
| Science & Technology | 86 | 20.1% |
| Business | 32 | 7.5% |
| Education | 17 | 4.0% |
| Literature & Languages | 0 | 0.0% |
| Liberal Arts & History | 26 | 6.1% |
| Visual & Performing Arts | 0 | 0.0% |
| Communications | 5 | 1.2% |
| Arts & Humanities | 52 | 12.2% |
| Total | 427 | 100.0% |
Transportation & Commute in Reinholds
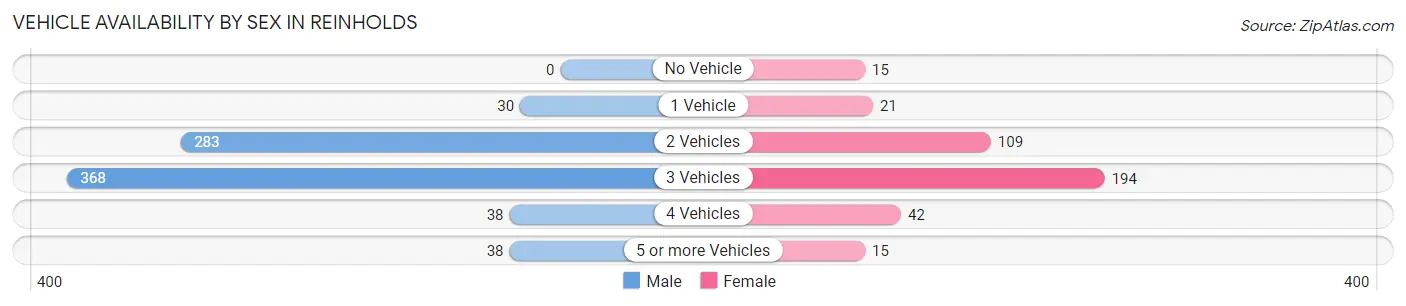
Vehicle Availability by Sex in Reinholds
The most prevalent vehicle ownership categories in Reinholds are males with 3 vehicles (368, accounting for 48.6%) and females with 3 vehicles (194, making up 92.9%).
| Vehicles Available | Male | Female |
| No Vehicle | 0 (0.0%) | 15 (3.8%) |
| 1 Vehicle | 30 (4.0%) | 21 (5.3%) |
| 2 Vehicles | 283 (37.4%) | 109 (27.5%) |
| 3 Vehicles | 368 (48.6%) | 194 (49.0%) |
| 4 Vehicles | 38 (5.0%) | 42 (10.6%) |
| 5 or more Vehicles | 38 (5.0%) | 15 (3.8%) |
| Total | 757 (100.0%) | 396 (100.0%) |
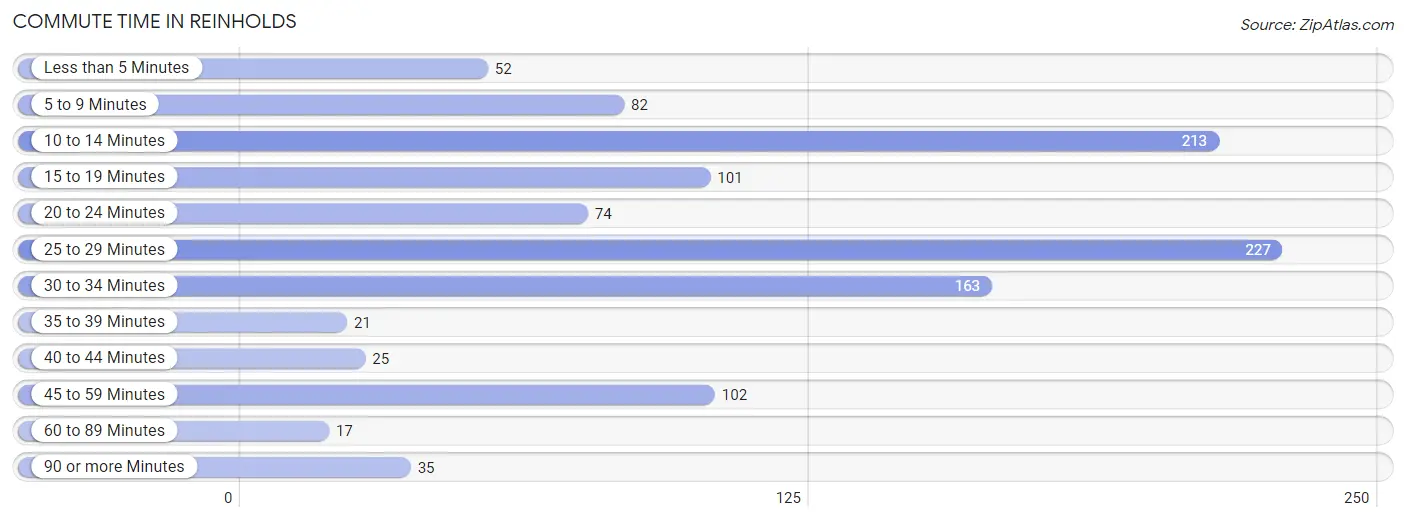
Commute Time in Reinholds
The most frequently occuring commute durations in Reinholds are 25 to 29 minutes (227 commuters, 20.4%), 10 to 14 minutes (213 commuters, 19.2%), and 30 to 34 minutes (163 commuters, 14.7%).
| Commute Time | # Commuters | % Commuters |
| Less than 5 Minutes | 52 | 4.7% |
| 5 to 9 Minutes | 82 | 7.4% |
| 10 to 14 Minutes | 213 | 19.2% |
| 15 to 19 Minutes | 101 | 9.1% |
| 20 to 24 Minutes | 74 | 6.7% |
| 25 to 29 Minutes | 227 | 20.4% |
| 30 to 34 Minutes | 163 | 14.7% |
| 35 to 39 Minutes | 21 | 1.9% |
| 40 to 44 Minutes | 25 | 2.2% |
| 45 to 59 Minutes | 102 | 9.2% |
| 60 to 89 Minutes | 17 | 1.5% |
| 90 or more Minutes | 35 | 3.2% |
Commute Time by Sex in Reinholds
The most common commute times in Reinholds are 10 to 14 minutes (147 commuters, 19.4%) for males and 25 to 29 minutes (82 commuters, 23.1%) for females.
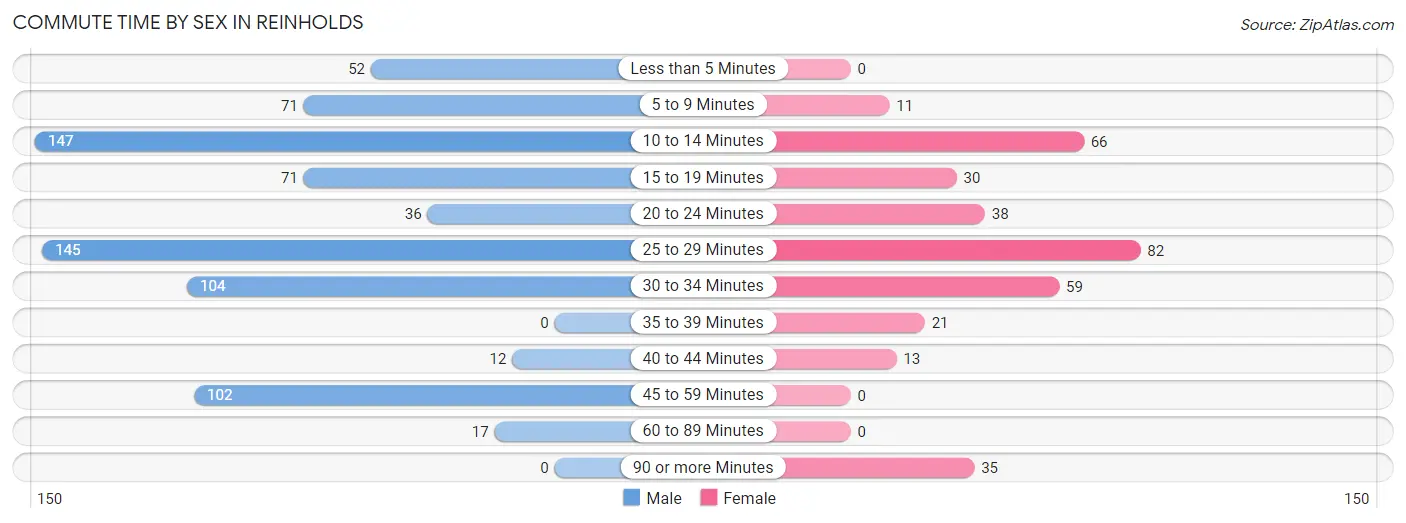
| Commute Time | Male | Female |
| Less than 5 Minutes | 52 (6.9%) | 0 (0.0%) |
| 5 to 9 Minutes | 71 (9.4%) | 11 (3.1%) |
| 10 to 14 Minutes | 147 (19.4%) | 66 (18.6%) |
| 15 to 19 Minutes | 71 (9.4%) | 30 (8.5%) |
| 20 to 24 Minutes | 36 (4.8%) | 38 (10.7%) |
| 25 to 29 Minutes | 145 (19.2%) | 82 (23.1%) |
| 30 to 34 Minutes | 104 (13.7%) | 59 (16.6%) |
| 35 to 39 Minutes | 0 (0.0%) | 21 (5.9%) |
| 40 to 44 Minutes | 12 (1.6%) | 13 (3.7%) |
| 45 to 59 Minutes | 102 (13.5%) | 0 (0.0%) |
| 60 to 89 Minutes | 17 (2.2%) | 0 (0.0%) |
| 90 or more Minutes | 0 (0.0%) | 35 (9.9%) |
Time of Departure to Work by Sex in Reinholds
The most frequent times of departure to work in Reinholds are 12:00 AM to 4:59 AM (181, 23.9%) for males and 6:00 AM to 6:29 AM (98, 27.6%) for females.
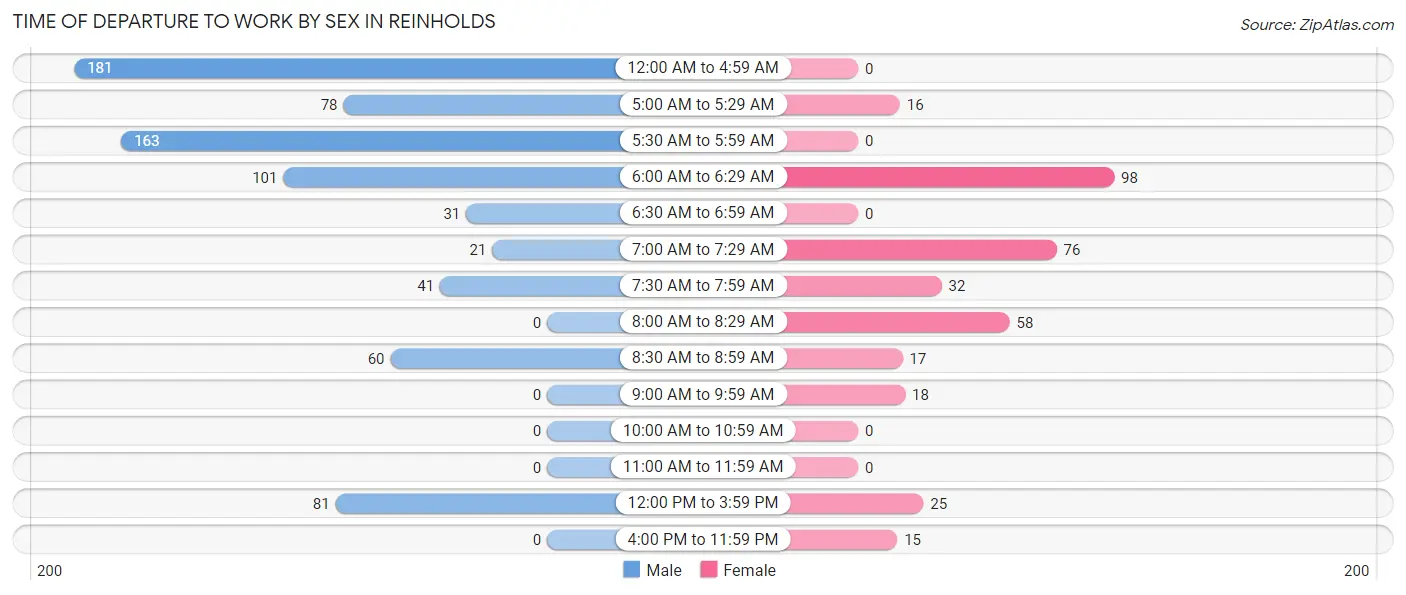
| Time of Departure | Male | Female |
| 12:00 AM to 4:59 AM | 181 (23.9%) | 0 (0.0%) |
| 5:00 AM to 5:29 AM | 78 (10.3%) | 16 (4.5%) |
| 5:30 AM to 5:59 AM | 163 (21.5%) | 0 (0.0%) |
| 6:00 AM to 6:29 AM | 101 (13.3%) | 98 (27.6%) |
| 6:30 AM to 6:59 AM | 31 (4.1%) | 0 (0.0%) |
| 7:00 AM to 7:29 AM | 21 (2.8%) | 76 (21.4%) |
| 7:30 AM to 7:59 AM | 41 (5.4%) | 32 (9.0%) |
| 8:00 AM to 8:29 AM | 0 (0.0%) | 58 (16.3%) |
| 8:30 AM to 8:59 AM | 60 (7.9%) | 17 (4.8%) |
| 9:00 AM to 9:59 AM | 0 (0.0%) | 18 (5.1%) |
| 10:00 AM to 10:59 AM | 0 (0.0%) | 0 (0.0%) |
| 11:00 AM to 11:59 AM | 0 (0.0%) | 0 (0.0%) |
| 12:00 PM to 3:59 PM | 81 (10.7%) | 25 (7.0%) |
| 4:00 PM to 11:59 PM | 0 (0.0%) | 15 (4.2%) |
| Total | 757 (100.0%) | 355 (100.0%) |
Housing Occupancy in Reinholds
Occupancy by Ownership in Reinholds
Of the total 746 dwellings in Reinholds, owner-occupied units account for 663 (88.9%), while renter-occupied units make up 83 (11.1%).
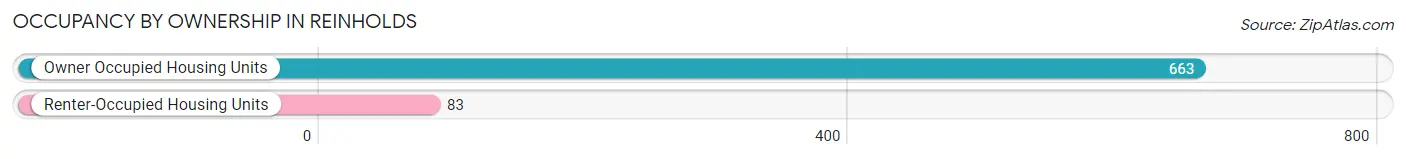
| Occupancy | # Housing Units | % Housing Units |
| Owner Occupied Housing Units | 663 | 88.9% |
| Renter-Occupied Housing Units | 83 | 11.1% |
| Total Occupied Housing Units | 746 | 100.0% |
Occupancy by Household Size in Reinholds
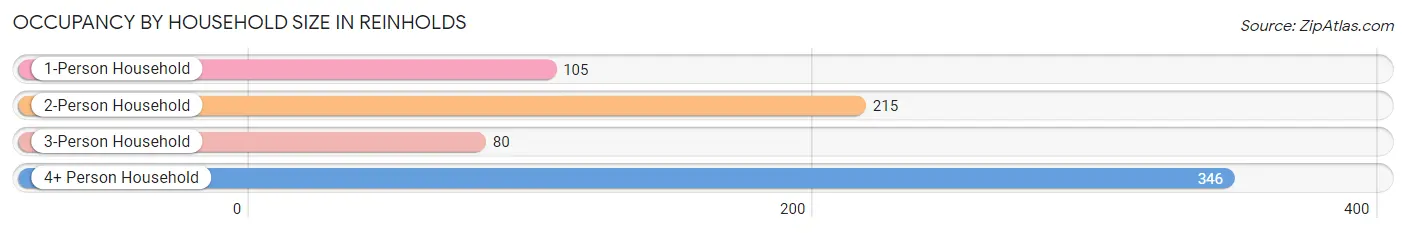
| Household Size | # Housing Units | % Housing Units |
| 1-Person Household | 105 | 14.1% |
| 2-Person Household | 215 | 28.8% |
| 3-Person Household | 80 | 10.7% |
| 4+ Person Household | 346 | 46.4% |
| Total Housing Units | 746 | 100.0% |
Occupancy by Ownership by Household Size in Reinholds
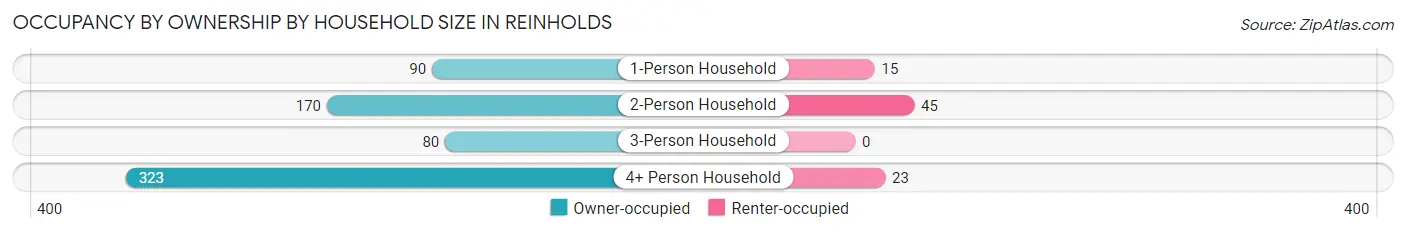
| Household Size | Owner-occupied | Renter-occupied |
| 1-Person Household | 90 (85.7%) | 15 (14.3%) |
| 2-Person Household | 170 (79.1%) | 45 (20.9%) |
| 3-Person Household | 80 (100.0%) | 0 (0.0%) |
| 4+ Person Household | 323 (93.3%) | 23 (6.7%) |
| Total Housing Units | 663 (88.9%) | 83 (11.1%) |
Occupancy by Educational Attainment in Reinholds
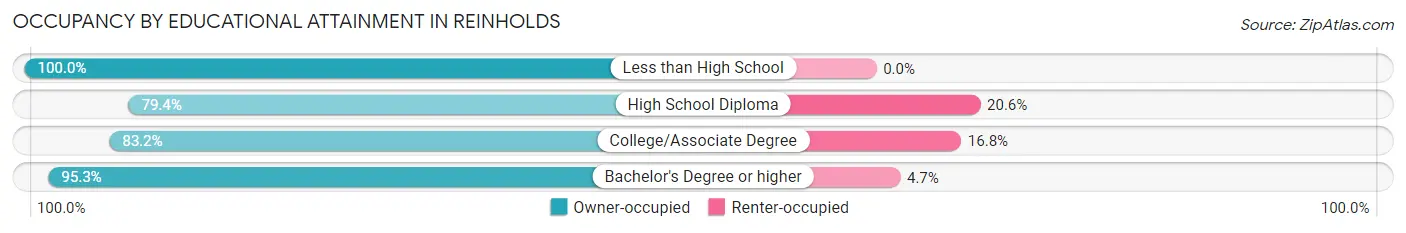
| Household Size | Owner-occupied | Renter-occupied |
| Less than High School | 76 (100.0%) | 0 (0.0%) |
| High School Diploma | 181 (79.4%) | 47 (20.6%) |
| College/Associate Degree | 104 (83.2%) | 21 (16.8%) |
| Bachelor's Degree or higher | 302 (95.3%) | 15 (4.7%) |
Occupancy by Age of Householder in Reinholds
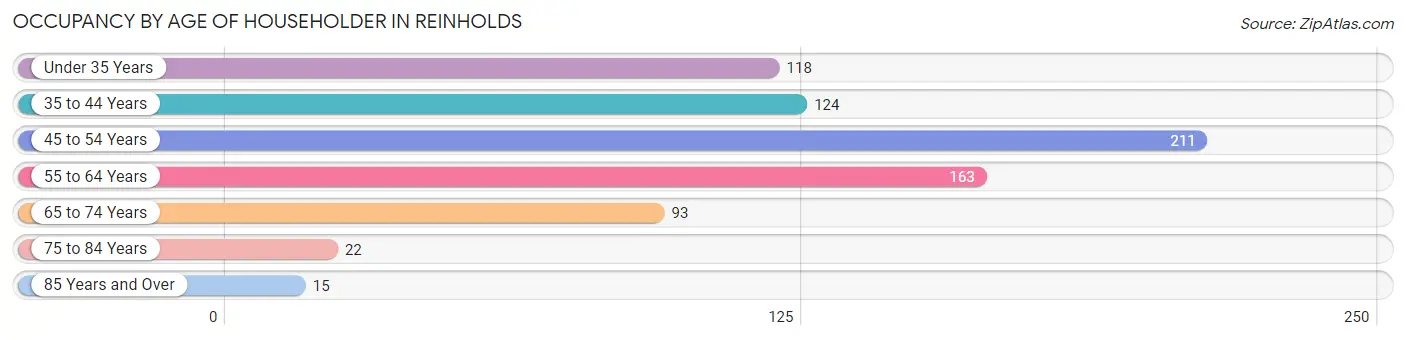
| Age Bracket | # Households | % Households |
| Under 35 Years | 118 | 15.8% |
| 35 to 44 Years | 124 | 16.6% |
| 45 to 54 Years | 211 | 28.3% |
| 55 to 64 Years | 163 | 21.8% |
| 65 to 74 Years | 93 | 12.5% |
| 75 to 84 Years | 22 | 2.9% |
| 85 Years and Over | 15 | 2.0% |
| Total | 746 | 100.0% |
Housing Finances in Reinholds
Median Income by Occupancy in Reinholds
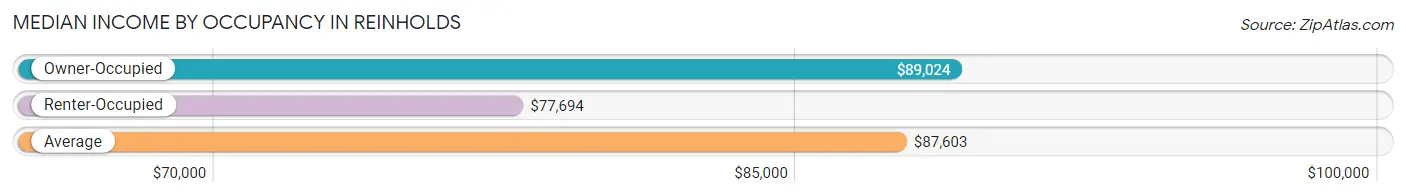
| Occupancy Type | # Households | Median Income |
| Owner-Occupied | 663 (88.9%) | $89,024 |
| Renter-Occupied | 83 (11.1%) | $77,694 |
| Average | 746 (100.0%) | $87,603 |
Occupancy by Householder Income Bracket in Reinholds
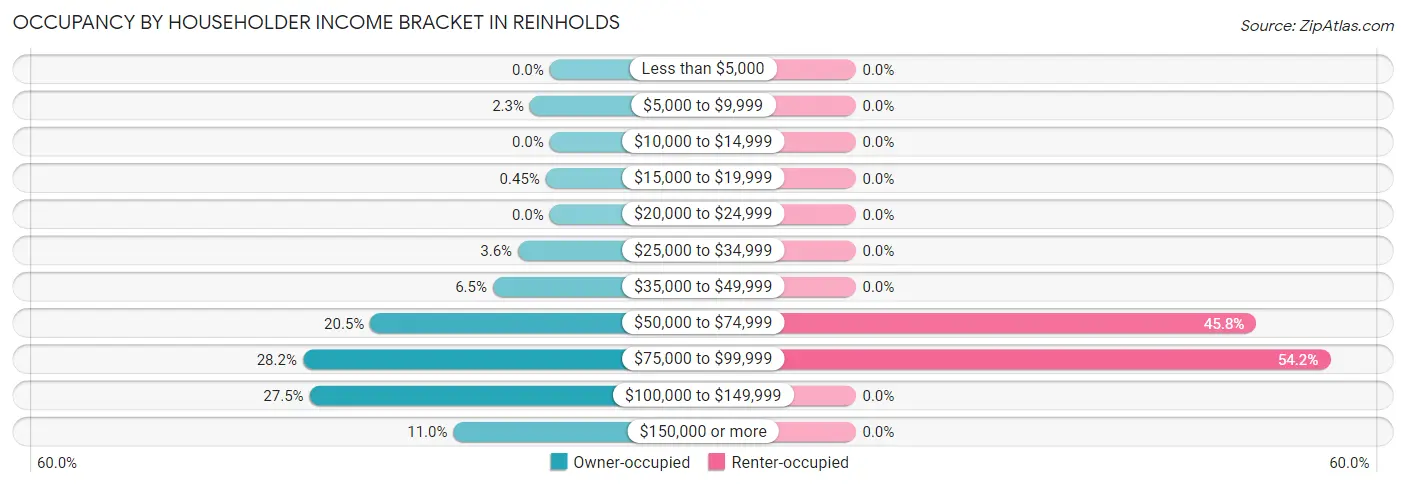
| Income Bracket | Owner-occupied | Renter-occupied |
| Less than $5,000 | 0 (0.0%) | 0 (0.0%) |
| $5,000 to $9,999 | 15 (2.3%) | 0 (0.0%) |
| $10,000 to $14,999 | 0 (0.0%) | 0 (0.0%) |
| $15,000 to $19,999 | 3 (0.4%) | 0 (0.0%) |
| $20,000 to $24,999 | 0 (0.0%) | 0 (0.0%) |
| $25,000 to $34,999 | 24 (3.6%) | 0 (0.0%) |
| $35,000 to $49,999 | 43 (6.5%) | 0 (0.0%) |
| $50,000 to $74,999 | 136 (20.5%) | 38 (45.8%) |
| $75,000 to $99,999 | 187 (28.2%) | 45 (54.2%) |
| $100,000 to $149,999 | 182 (27.5%) | 0 (0.0%) |
| $150,000 or more | 73 (11.0%) | 0 (0.0%) |
| Total | 663 (100.0%) | 83 (100.0%) |
Monthly Housing Cost Tiers in Reinholds
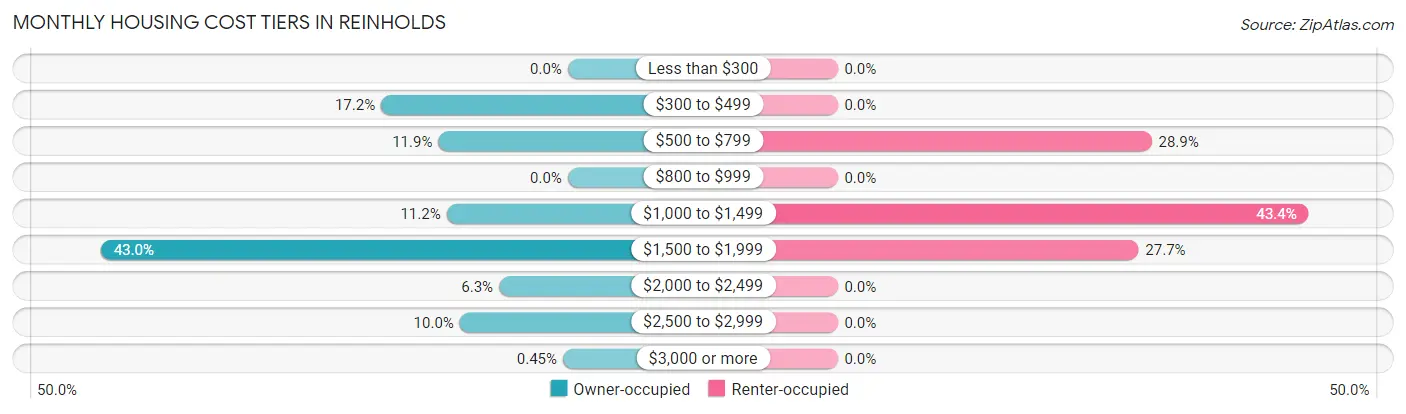
| Monthly Cost | Owner-occupied | Renter-occupied |
| Less than $300 | 0 (0.0%) | 0 (0.0%) |
| $300 to $499 | 114 (17.2%) | 0 (0.0%) |
| $500 to $799 | 79 (11.9%) | 24 (28.9%) |
| $800 to $999 | 0 (0.0%) | 0 (0.0%) |
| $1,000 to $1,499 | 74 (11.2%) | 36 (43.4%) |
| $1,500 to $1,999 | 285 (43.0%) | 23 (27.7%) |
| $2,000 to $2,499 | 42 (6.3%) | 0 (0.0%) |
| $2,500 to $2,999 | 66 (10.0%) | 0 (0.0%) |
| $3,000 or more | 3 (0.4%) | 0 (0.0%) |
| Total | 663 (100.0%) | 83 (100.0%) |
Physical Housing Characteristics in Reinholds
Housing Structures in Reinholds
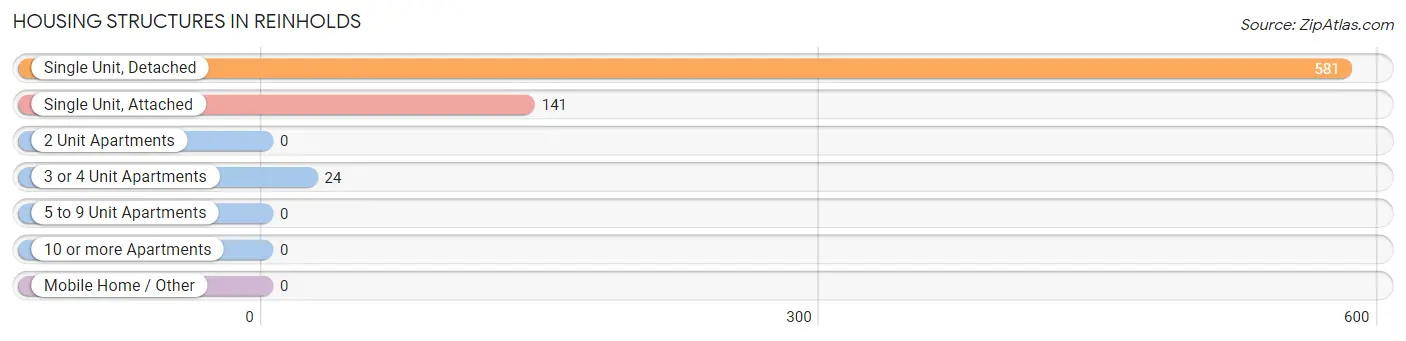
| Structure Type | # Housing Units | % Housing Units |
| Single Unit, Detached | 581 | 77.9% |
| Single Unit, Attached | 141 | 18.9% |
| 2 Unit Apartments | 0 | 0.0% |
| 3 or 4 Unit Apartments | 24 | 3.2% |
| 5 to 9 Unit Apartments | 0 | 0.0% |
| 10 or more Apartments | 0 | 0.0% |
| Mobile Home / Other | 0 | 0.0% |
| Total | 746 | 100.0% |
Housing Structures by Occupancy in Reinholds
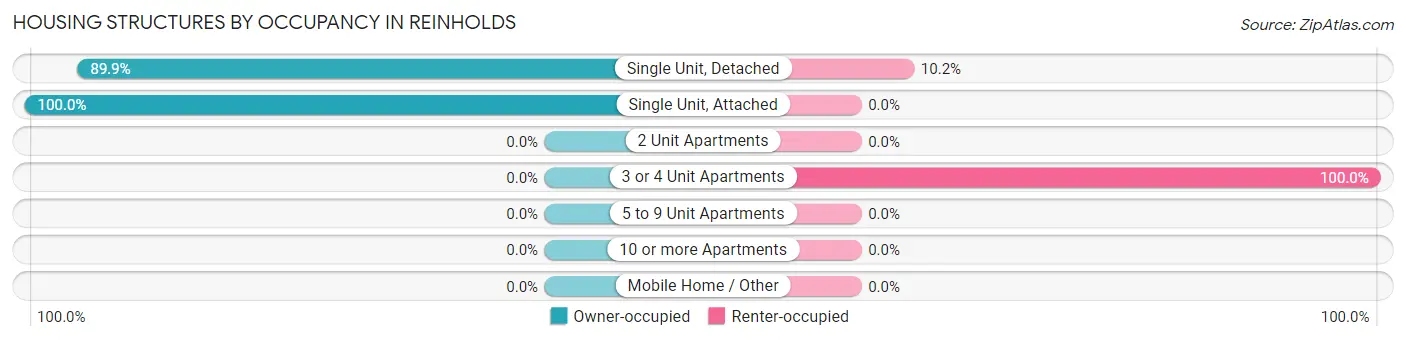
| Structure Type | Owner-occupied | Renter-occupied |
| Single Unit, Detached | 522 (89.8%) | 59 (10.2%) |
| Single Unit, Attached | 141 (100.0%) | 0 (0.0%) |
| 2 Unit Apartments | 0 (0.0%) | 0 (0.0%) |
| 3 or 4 Unit Apartments | 0 (0.0%) | 24 (100.0%) |
| 5 to 9 Unit Apartments | 0 (0.0%) | 0 (0.0%) |
| 10 or more Apartments | 0 (0.0%) | 0 (0.0%) |
| Mobile Home / Other | 0 (0.0%) | 0 (0.0%) |
| Total | 663 (88.9%) | 83 (11.1%) |
Housing Structures by Number of Rooms in Reinholds
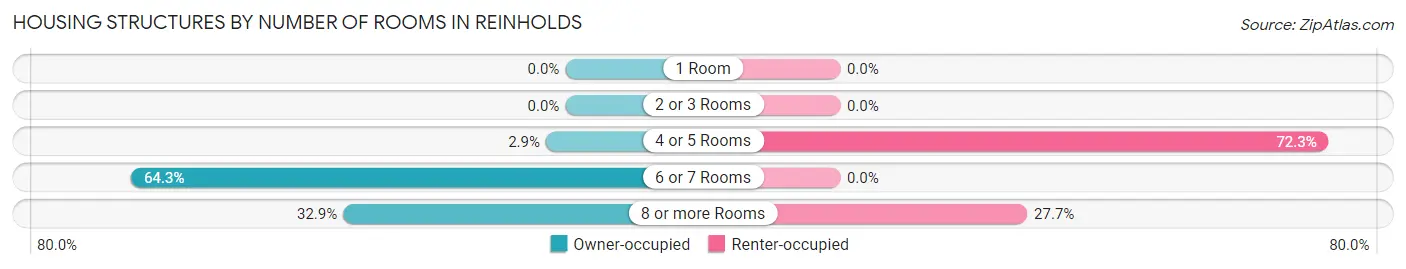
| Number of Rooms | Owner-occupied | Renter-occupied |
| 1 Room | 0 (0.0%) | 0 (0.0%) |
| 2 or 3 Rooms | 0 (0.0%) | 0 (0.0%) |
| 4 or 5 Rooms | 19 (2.9%) | 60 (72.3%) |
| 6 or 7 Rooms | 426 (64.2%) | 0 (0.0%) |
| 8 or more Rooms | 218 (32.9%) | 23 (27.7%) |
| Total | 663 (100.0%) | 83 (100.0%) |
Housing Structure by Heating Type in Reinholds
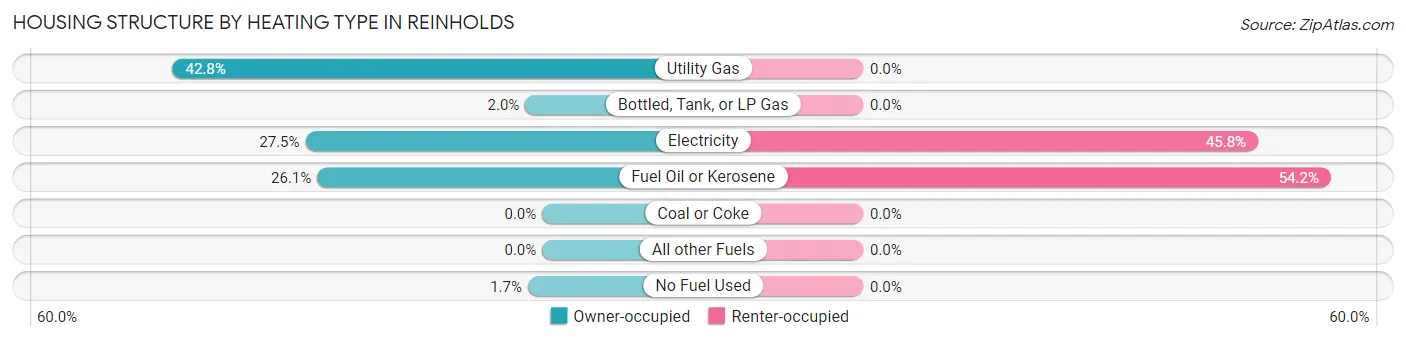
| Heating Type | Owner-occupied | Renter-occupied |
| Utility Gas | 284 (42.8%) | 0 (0.0%) |
| Bottled, Tank, or LP Gas | 13 (2.0%) | 0 (0.0%) |
| Electricity | 182 (27.5%) | 38 (45.8%) |
| Fuel Oil or Kerosene | 173 (26.1%) | 45 (54.2%) |
| Coal or Coke | 0 (0.0%) | 0 (0.0%) |
| All other Fuels | 0 (0.0%) | 0 (0.0%) |
| No Fuel Used | 11 (1.7%) | 0 (0.0%) |
| Total | 663 (100.0%) | 83 (100.0%) |
Household Vehicle Usage in Reinholds
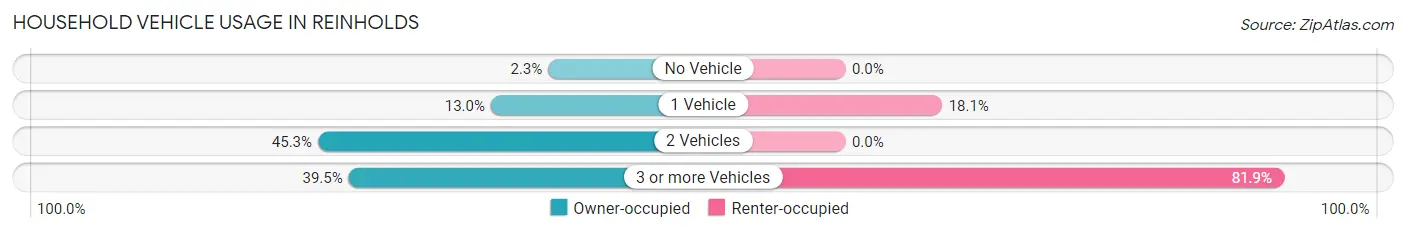
| Vehicles per Household | Owner-occupied | Renter-occupied |
| No Vehicle | 15 (2.3%) | 0 (0.0%) |
| 1 Vehicle | 86 (13.0%) | 15 (18.1%) |
| 2 Vehicles | 300 (45.3%) | 0 (0.0%) |
| 3 or more Vehicles | 262 (39.5%) | 68 (81.9%) |
| Total | 663 (100.0%) | 83 (100.0%) |
Real Estate & Mortgages in Reinholds
Real Estate and Mortgage Overview in Reinholds
| Characteristic | Without Mortgage | With Mortgage |
| Housing Units | 196 | 467 |
| Median Property Value | $190,300 | $251,300 |
| Median Household Income | $90,573 | $73 |
| Monthly Housing Costs | $476 | $3 |
| Real Estate Taxes | $4,080 | $0 |
Property Value by Mortgage Status in Reinholds
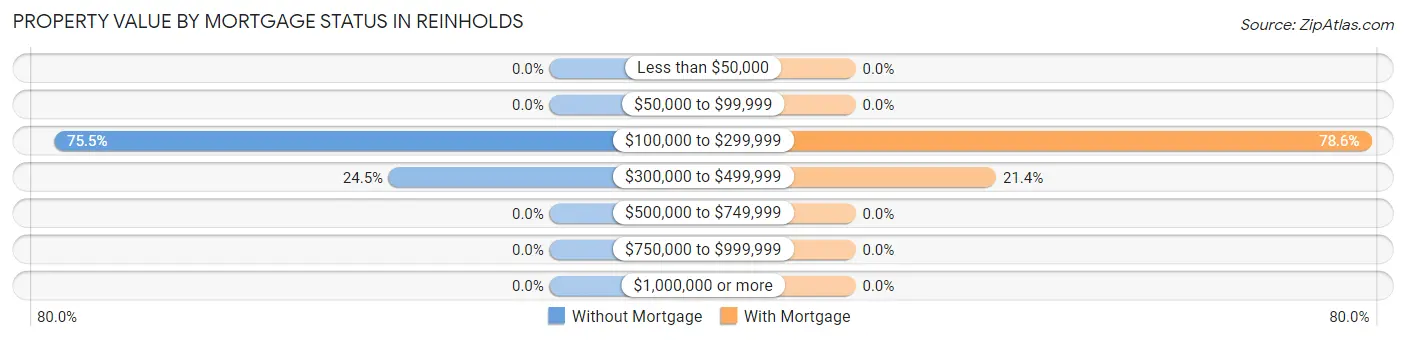
| Property Value | Without Mortgage | With Mortgage |
| Less than $50,000 | 0 (0.0%) | 0 (0.0%) |
| $50,000 to $99,999 | 0 (0.0%) | 0 (0.0%) |
| $100,000 to $299,999 | 148 (75.5%) | 367 (78.6%) |
| $300,000 to $499,999 | 48 (24.5%) | 100 (21.4%) |
| $500,000 to $749,999 | 0 (0.0%) | 0 (0.0%) |
| $750,000 to $999,999 | 0 (0.0%) | 0 (0.0%) |
| $1,000,000 or more | 0 (0.0%) | 0 (0.0%) |
| Total | 196 (100.0%) | 467 (100.0%) |
Household Income by Mortgage Status in Reinholds
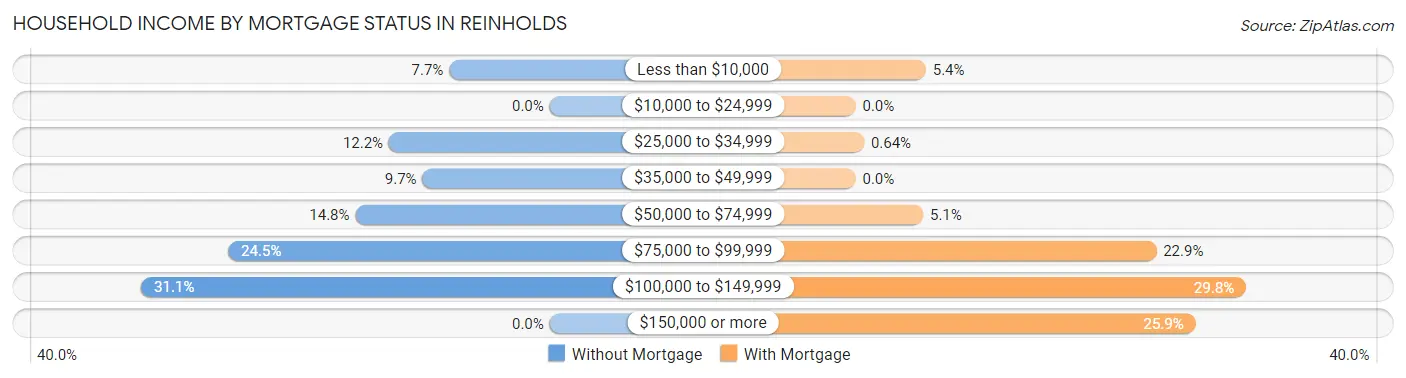
| Household Income | Without Mortgage | With Mortgage |
| Less than $10,000 | 15 (7.6%) | 25 (5.3%) |
| $10,000 to $24,999 | 0 (0.0%) | 0 (0.0%) |
| $25,000 to $34,999 | 24 (12.2%) | 3 (0.6%) |
| $35,000 to $49,999 | 19 (9.7%) | 0 (0.0%) |
| $50,000 to $74,999 | 29 (14.8%) | 24 (5.1%) |
| $75,000 to $99,999 | 48 (24.5%) | 107 (22.9%) |
| $100,000 to $149,999 | 61 (31.1%) | 139 (29.8%) |
| $150,000 or more | 0 (0.0%) | 121 (25.9%) |
| Total | 196 (100.0%) | 467 (100.0%) |
Property Value to Household Income Ratio in Reinholds
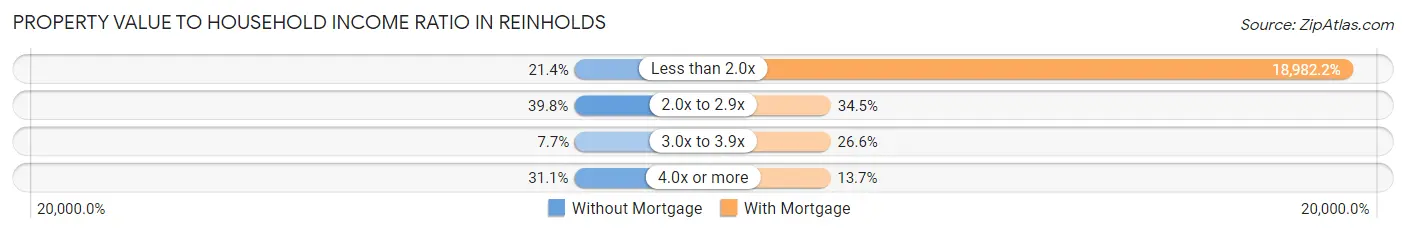
| Value-to-Income Ratio | Without Mortgage | With Mortgage |
| Less than 2.0x | 42 (21.4%) | 88,647 (18,982.2%) |
| 2.0x to 2.9x | 78 (39.8%) | 161 (34.5%) |
| 3.0x to 3.9x | 15 (7.6%) | 124 (26.6%) |
| 4.0x or more | 61 (31.1%) | 64 (13.7%) |
| Total | 196 (100.0%) | 467 (100.0%) |
Real Estate Taxes by Mortgage Status in Reinholds
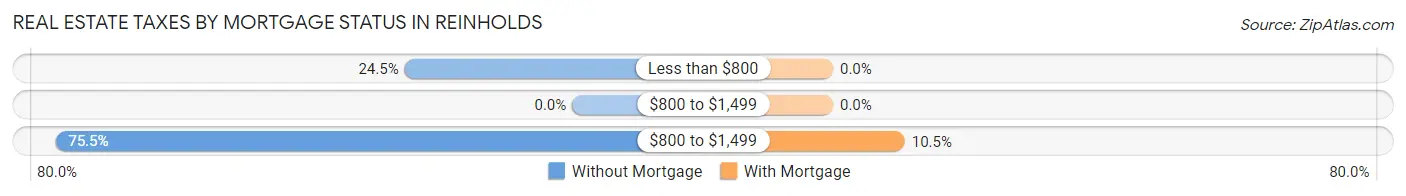
| Property Taxes | Without Mortgage | With Mortgage |
| Less than $800 | 48 (24.5%) | 0 (0.0%) |
| $800 to $1,499 | 0 (0.0%) | 0 (0.0%) |
| $800 to $1,499 | 148 (75.5%) | 49 (10.5%) |
| Total | 196 (100.0%) | 467 (100.0%) |
Health & Disability in Reinholds
Health Insurance Coverage by Age in Reinholds
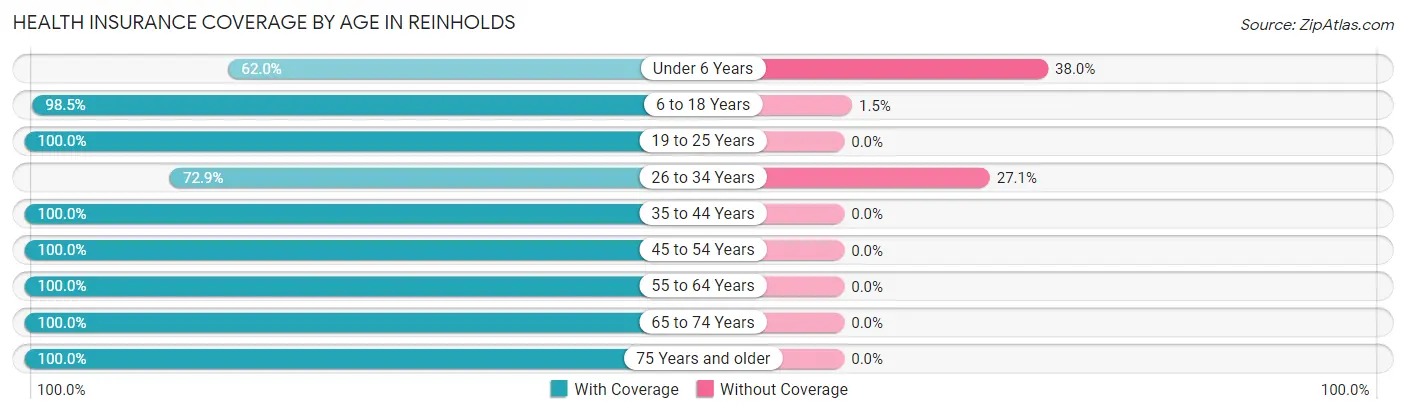
| Age Bracket | With Coverage | Without Coverage |
| Under 6 Years | 168 (62.0%) | 103 (38.0%) |
| 6 to 18 Years | 473 (98.5%) | 7 (1.5%) |
| 19 to 25 Years | 52 (100.0%) | 0 (0.0%) |
| 26 to 34 Years | 196 (72.9%) | 73 (27.1%) |
| 35 to 44 Years | 321 (100.0%) | 0 (0.0%) |
| 45 to 54 Years | 383 (100.0%) | 0 (0.0%) |
| 55 to 64 Years | 307 (100.0%) | 0 (0.0%) |
| 65 to 74 Years | 175 (100.0%) | 0 (0.0%) |
| 75 Years and older | 83 (100.0%) | 0 (0.0%) |
| Total | 2,158 (92.2%) | 183 (7.8%) |
Health Insurance Coverage by Citizenship Status in Reinholds
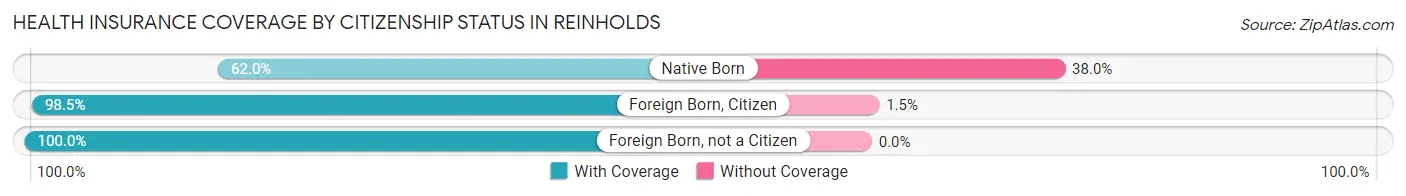
| Citizenship Status | With Coverage | Without Coverage |
| Native Born | 168 (62.0%) | 103 (38.0%) |
| Foreign Born, Citizen | 473 (98.5%) | 7 (1.5%) |
| Foreign Born, not a Citizen | 52 (100.0%) | 0 (0.0%) |
Health Insurance Coverage by Household Income in Reinholds
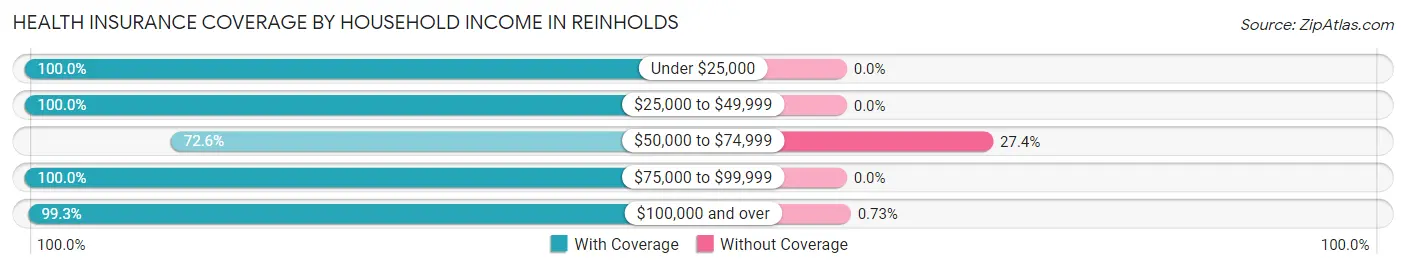
| Household Income | With Coverage | Without Coverage |
| Under $25,000 | 24 (100.0%) | 0 (0.0%) |
| $25,000 to $49,999 | 115 (100.0%) | 0 (0.0%) |
| $50,000 to $74,999 | 466 (72.6%) | 176 (27.4%) |
| $75,000 to $99,999 | 602 (100.0%) | 0 (0.0%) |
| $100,000 and over | 951 (99.3%) | 7 (0.7%) |
Public vs Private Health Insurance Coverage by Age in Reinholds
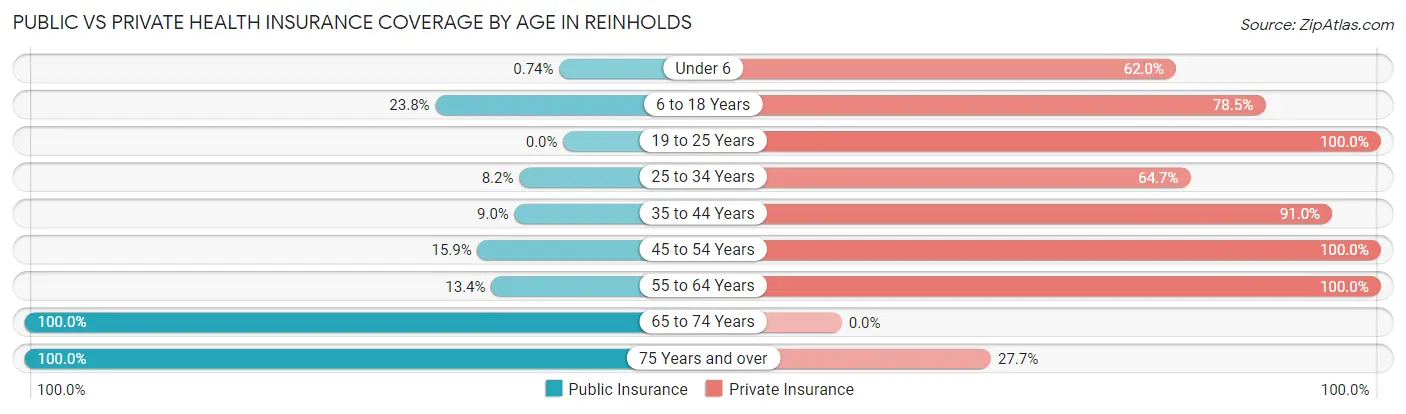
| Age Bracket | Public Insurance | Private Insurance |
| Under 6 | 2 (0.7%) | 168 (62.0%) |
| 6 to 18 Years | 114 (23.7%) | 377 (78.5%) |
| 19 to 25 Years | 0 (0.0%) | 52 (100.0%) |
| 25 to 34 Years | 22 (8.2%) | 174 (64.7%) |
| 35 to 44 Years | 29 (9.0%) | 292 (91.0%) |
| 45 to 54 Years | 61 (15.9%) | 383 (100.0%) |
| 55 to 64 Years | 41 (13.4%) | 307 (100.0%) |
| 65 to 74 Years | 175 (100.0%) | 0 (0.0%) |
| 75 Years and over | 83 (100.0%) | 23 (27.7%) |
| Total | 527 (22.5%) | 1,776 (75.9%) |
Disability Status by Sex by Age in Reinholds
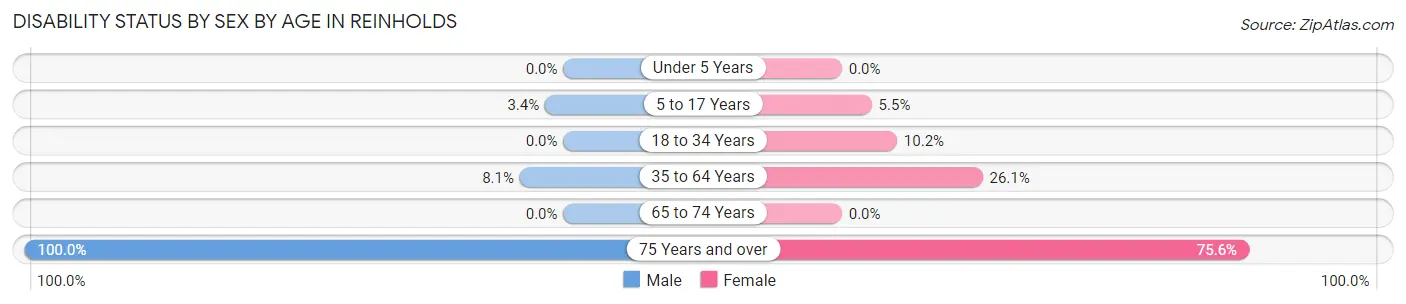
| Age Bracket | Male | Female |
| Under 5 Years | 0 (0.0%) | 0 (0.0%) |
| 5 to 17 Years | 5 (3.4%) | 16 (5.5%) |
| 18 to 34 Years | 0 (0.0%) | 22 (10.2%) |
| 35 to 64 Years | 44 (8.1%) | 122 (26.1%) |
| 65 to 74 Years | 0 (0.0%) | 0 (0.0%) |
| 75 Years and over | 38 (100.0%) | 34 (75.6%) |
Disability Class by Sex by Age in Reinholds
Disability Class: Hearing Difficulty
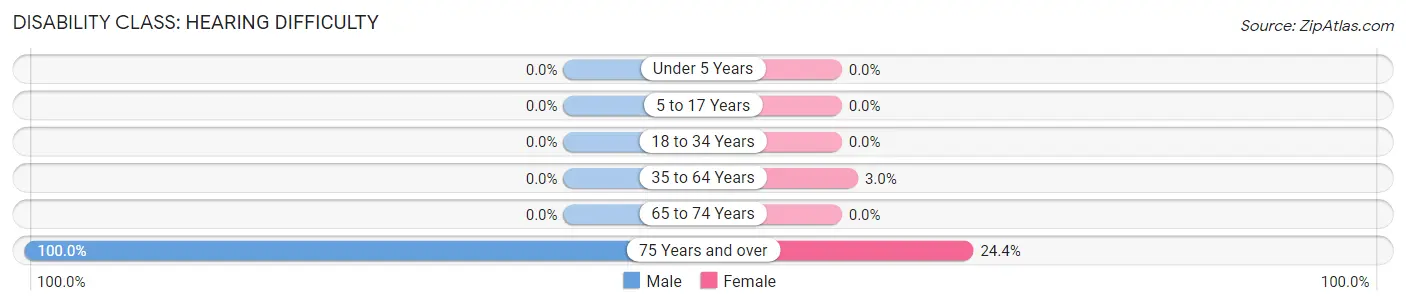
| Age Bracket | Male | Female |
| Under 5 Years | 0 (0.0%) | 0 (0.0%) |
| 5 to 17 Years | 0 (0.0%) | 0 (0.0%) |
| 18 to 34 Years | 0 (0.0%) | 0 (0.0%) |
| 35 to 64 Years | 0 (0.0%) | 14 (3.0%) |
| 65 to 74 Years | 0 (0.0%) | 0 (0.0%) |
| 75 Years and over | 38 (100.0%) | 11 (24.4%) |
Disability Class: Vision Difficulty
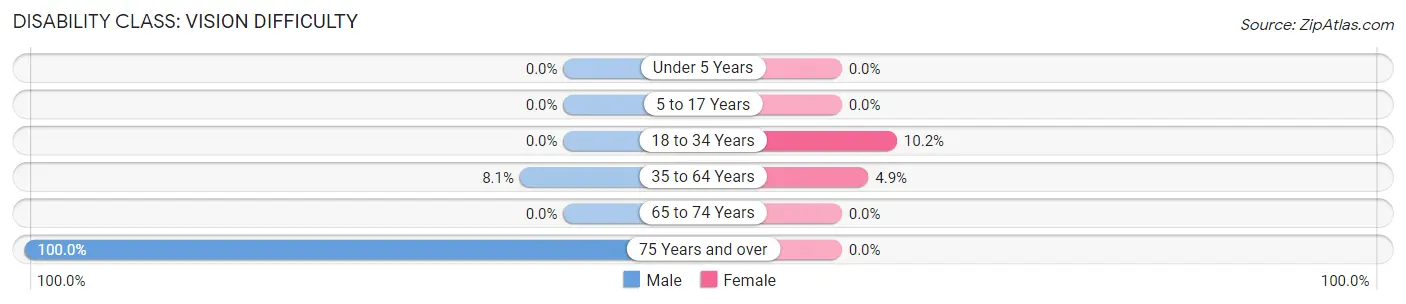
| Age Bracket | Male | Female |
| Under 5 Years | 0 (0.0%) | 0 (0.0%) |
| 5 to 17 Years | 0 (0.0%) | 0 (0.0%) |
| 18 to 34 Years | 0 (0.0%) | 22 (10.2%) |
| 35 to 64 Years | 44 (8.1%) | 23 (4.9%) |
| 65 to 74 Years | 0 (0.0%) | 0 (0.0%) |
| 75 Years and over | 38 (100.0%) | 0 (0.0%) |
Disability Class: Cognitive Difficulty
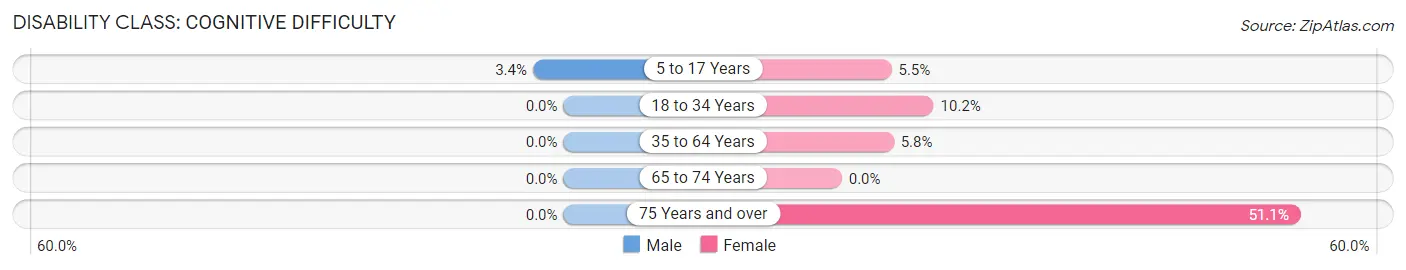
| Age Bracket | Male | Female |
| 5 to 17 Years | 5 (3.4%) | 16 (5.5%) |
| 18 to 34 Years | 0 (0.0%) | 22 (10.2%) |
| 35 to 64 Years | 0 (0.0%) | 27 (5.8%) |
| 65 to 74 Years | 0 (0.0%) | 0 (0.0%) |
| 75 Years and over | 0 (0.0%) | 23 (51.1%) |
Disability Class: Ambulatory Difficulty
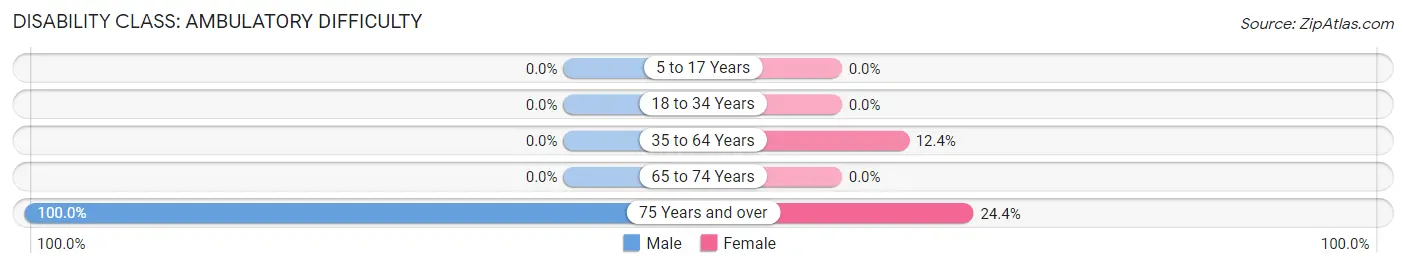
| Age Bracket | Male | Female |
| 5 to 17 Years | 0 (0.0%) | 0 (0.0%) |
| 18 to 34 Years | 0 (0.0%) | 0 (0.0%) |
| 35 to 64 Years | 0 (0.0%) | 58 (12.4%) |
| 65 to 74 Years | 0 (0.0%) | 0 (0.0%) |
| 75 Years and over | 38 (100.0%) | 11 (24.4%) |
Disability Class: Self-Care Difficulty
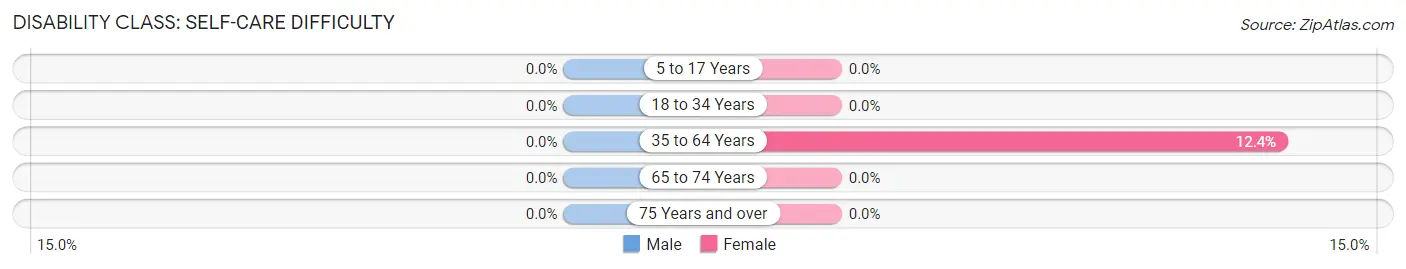
| Age Bracket | Male | Female |
| 5 to 17 Years | 0 (0.0%) | 0 (0.0%) |
| 18 to 34 Years | 0 (0.0%) | 0 (0.0%) |
| 35 to 64 Years | 0 (0.0%) | 58 (12.4%) |
| 65 to 74 Years | 0 (0.0%) | 0 (0.0%) |
| 75 Years and over | 0 (0.0%) | 0 (0.0%) |
Technology Access in Reinholds
Computing Device Access in Reinholds
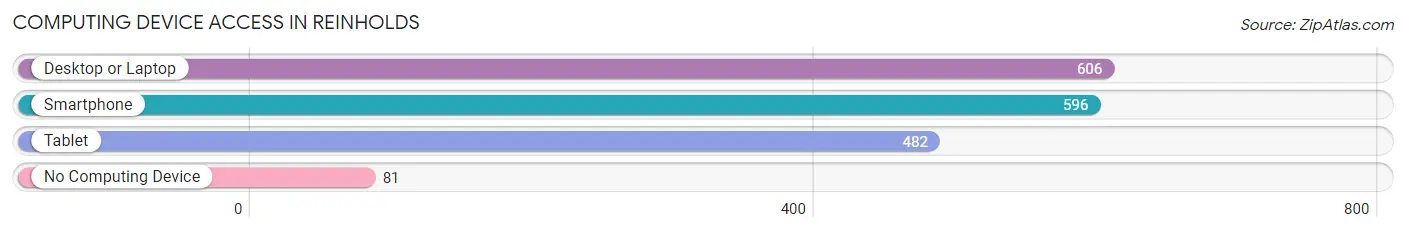
| Device Type | # Households | % Households |
| Desktop or Laptop | 606 | 81.2% |
| Smartphone | 596 | 79.9% |
| Tablet | 482 | 64.6% |
| No Computing Device | 81 | 10.9% |
| Total | 746 | 100.0% |
Internet Access in Reinholds
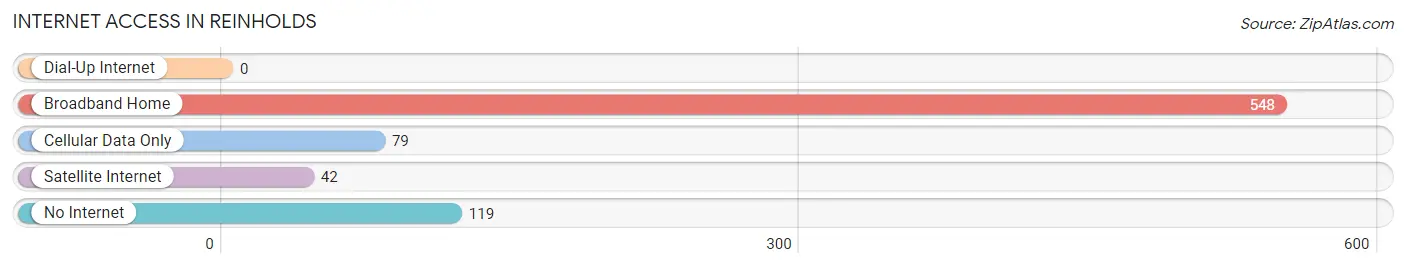
| Internet Type | # Households | % Households |
| Dial-Up Internet | 0 | 0.0% |
| Broadband Home | 548 | 73.5% |
| Cellular Data Only | 79 | 10.6% |
| Satellite Internet | 42 | 5.6% |
| No Internet | 119 | 16.0% |
| Total | 746 | 100.0% |
Reinholds Summary
Reinholds is a small borough located in Lancaster County, Pennsylvania. It is situated in the southeastern part of the county, about 10 miles east of the city of Lancaster. The population of Reinholds was 1,845 at the 2010 census.
History
Reinholds was founded in 1737 by a group of Mennonites from Germany. The town was named after a Mennonite leader, Reinhold Beissel. The town was originally part of Cocalico Township, but was incorporated as a borough in 1851.
Reinholds was an agricultural community for much of its history. The town was known for its production of flax, which was used to make linen. The town also had a number of mills, including a grist mill, a saw mill, and a paper mill.
Geography
Reinholds is located at 40°10'17" North, 76°10'45" West (40.1714, -76.1792). The borough has a total area of 0.7 square miles, all of which is land.
Reinholds is located in the southeastern part of Lancaster County, about 10 miles east of the city of Lancaster. The borough is bordered by Cocalico Township to the north, East Cocalico Township to the east, and West Cocalico Township to the south and west.
Economy
Reinholds is a primarily residential community, with most of its residents commuting to nearby cities for work. The town does have a few small businesses, including a few restaurants, a grocery store, and a few retail stores.
The town is also home to a number of small manufacturing companies, including a furniture manufacturer, a metal fabricator, and a plastics manufacturer.
Demographics
As of the 2010 census, there were 1,845 people, 745 households, and 517 families living in Reinholds. The population density was 2,621.4 people per square mile. The racial makeup of the borough was 97.2% White, 0.7% African American, 0.2% Native American, 0.4% Asian, 0.1% from other races, and 1.4% from two or more races. Hispanic or Latino of any race were 1.2% of the population.
The median age in Reinholds was 41.2 years. 22.2% of residents were under the age of 18; 6.7% were between the ages of 18 and 24; 25.2% were from 25 to 44; 28.2% were from 45 to 64; and 17.7% were 65 years of age or older. The gender makeup of the borough was 48.7% male and 51.3% female.
The median income for a household in Reinholds was $50,938, and the median income for a family was $60,000. The per capita income for the borough was $24,945. About 4.2% of families and 5.7% of the population were below the poverty line, including 6.3% of those under age 18 and 4.2% of those age 65 or over.
Common Questions
What is Per Capita Income in Reinholds?
Per Capita income in Reinholds is $31,126.
What is the Median Family Income in Reinholds?
Median Family Income in Reinholds is $90,052.
What is the Median Household income in Reinholds?
Median Household Income in Reinholds is $87,603.
What is Income or Wage Gap in Reinholds?
Income or Wage Gap in Reinholds is 41.0%.
Women in Reinholds earn 59.0 cents for every dollar earned by a man.
What is Inequality or Gini Index in Reinholds?
Inequality or Gini Index in Reinholds is 0.25.
What is the Total Population of Reinholds?
Total Population of Reinholds is 2,341.
What is the Total Male Population of Reinholds?
Total Male Population of Reinholds is 1,102.
What is the Total Female Population of Reinholds?
Total Female Population of Reinholds is 1,239.
What is the Ratio of Males per 100 Females in Reinholds?
There are 88.94 Males per 100 Females in Reinholds.
What is the Ratio of Females per 100 Males in Reinholds?
There are 112.43 Females per 100 Males in Reinholds.
What is the Median Population Age in Reinholds?
Median Population Age in Reinholds is 37.5 Years.
What is the Average Family Size in Reinholds
Average Family Size in Reinholds is 3.5 People.
What is the Average Household Size in Reinholds
Average Household Size in Reinholds is 3.1 People.
How Large is the Labor Force in Reinholds?
There are 1,152 People in the Labor Forcein in Reinholds.
What is the Percentage of People in the Labor Force in Reinholds?
68.8% of People are in the Labor Force in Reinholds.