Steamboat Springs, CO Map & Demographics
Steamboat Springs Map
Steamboat Springs Overview
$62,223
PER CAPITA INCOME
$128,601
AVG FAMILY INCOME
$93,280
AVG HOUSEHOLD INCOME
34.7%
WAGE / INCOME GAP [ % ]
65.3¢/ $1
WAGE / INCOME GAP [ $ ]
0.48
INEQUALITY / GINI INDEX
13,251
TOTAL POPULATION
6,782
MALE POPULATION
6,469
FEMALE POPULATION
104.84
MALES / 100 FEMALES
95.38
FEMALES / 100 MALES
41.3
MEDIAN AGE
2.7
AVG FAMILY SIZE
2.3
AVG HOUSEHOLD SIZE
7,682
LABOR FORCE [ PEOPLE ]
67.1%
PERCENT IN LABOR FORCE
3.6%
UNEMPLOYMENT RATE
Steamboat Springs Zip Codes
Steamboat Springs Area Codes
Income in Steamboat Springs
Income Overview in Steamboat Springs
Per Capita Income in Steamboat Springs is $62,223, while median incomes of families and households are $128,601 and $93,280 respectively.
| Characteristic | Number | Measure |
| Per Capita Income | 13,251 | $62,223 |
| Median Family Income | 3,383 | $128,601 |
| Mean Family Income | 3,383 | $172,623 |
| Median Household Income | 5,738 | $93,280 |
| Mean Household Income | 5,738 | $136,337 |
| Income Deficit | 3,383 | $0 |
| Wage / Income Gap (%) | 13,251 | 34.68% |
| Wage / Income Gap ($) | 13,251 | 65.32¢ per $1 |
| Gini / Inequality Index | 13,251 | 0.48 |
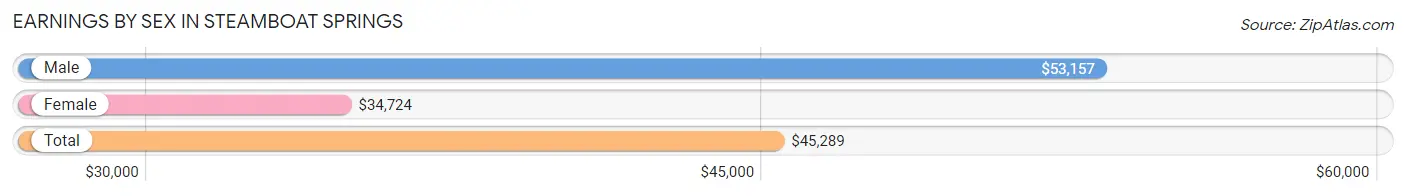
Earnings by Sex in Steamboat Springs
Average Earnings in Steamboat Springs are $45,289, $53,157 for men and $34,724 for women, a difference of 34.7%.
| Sex | Number | Average Earnings |
| Male | 4,750 (56.1%) | $53,157 |
| Female | 3,720 (43.9%) | $34,724 |
| Total | 8,470 (100.0%) | $45,289 |
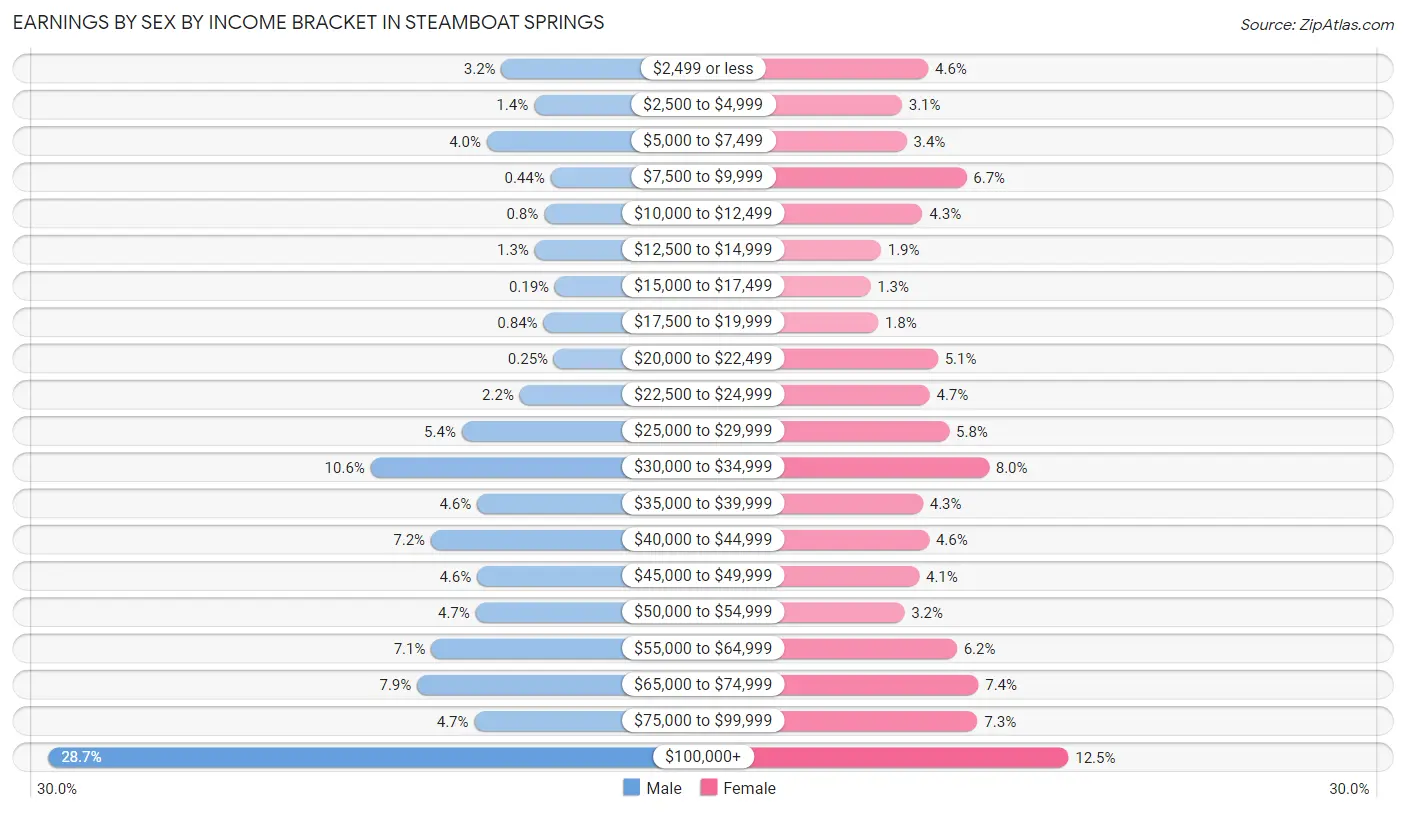
Earnings by Sex by Income Bracket in Steamboat Springs
The most common earnings brackets in Steamboat Springs are $100,000+ for men (1,362 | 28.7%) and $100,000+ for women (463 | 12.4%).
| Income | Male | Female |
| $2,499 or less | 152 (3.2%) | 170 (4.6%) |
| $2,500 to $4,999 | 65 (1.4%) | 115 (3.1%) |
| $5,000 to $7,499 | 191 (4.0%) | 125 (3.4%) |
| $7,500 to $9,999 | 21 (0.4%) | 250 (6.7%) |
| $10,000 to $12,499 | 38 (0.8%) | 158 (4.3%) |
| $12,500 to $14,999 | 63 (1.3%) | 71 (1.9%) |
| $15,000 to $17,499 | 9 (0.2%) | 49 (1.3%) |
| $17,500 to $19,999 | 40 (0.8%) | 65 (1.8%) |
| $20,000 to $22,499 | 12 (0.3%) | 190 (5.1%) |
| $22,500 to $24,999 | 103 (2.2%) | 173 (4.6%) |
| $25,000 to $29,999 | 258 (5.4%) | 214 (5.8%) |
| $30,000 to $34,999 | 501 (10.5%) | 297 (8.0%) |
| $35,000 to $39,999 | 217 (4.6%) | 159 (4.3%) |
| $40,000 to $44,999 | 340 (7.2%) | 172 (4.6%) |
| $45,000 to $49,999 | 217 (4.6%) | 151 (4.1%) |
| $50,000 to $54,999 | 221 (4.6%) | 120 (3.2%) |
| $55,000 to $64,999 | 339 (7.1%) | 230 (6.2%) |
| $65,000 to $74,999 | 377 (7.9%) | 275 (7.4%) |
| $75,000 to $99,999 | 224 (4.7%) | 273 (7.3%) |
| $100,000+ | 1,362 (28.7%) | 463 (12.4%) |
| Total | 4,750 (100.0%) | 3,720 (100.0%) |
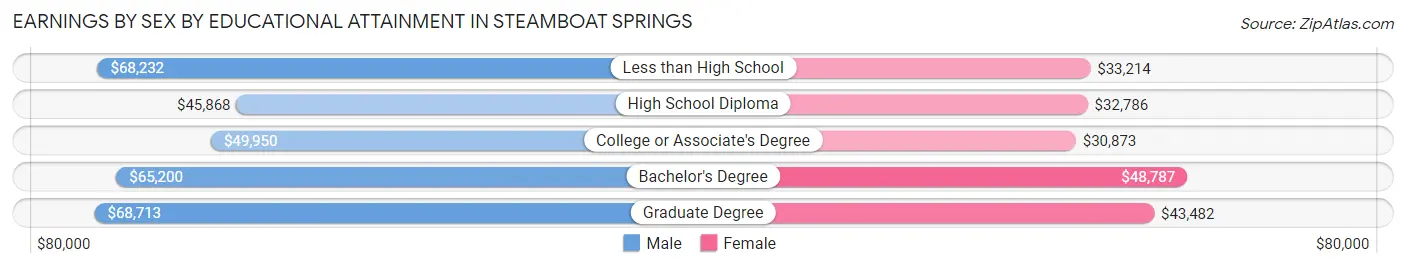
Earnings by Sex by Educational Attainment in Steamboat Springs
Average earnings in Steamboat Springs are $59,100 for men and $38,893 for women, a difference of 34.2%. Men with an educational attainment of graduate degree enjoy the highest average annual earnings of $68,713, while those with high school diploma education earn the least with $45,868. Women with an educational attainment of bachelor's degree earn the most with the average annual earnings of $48,787, while those with college or associate's degree education have the smallest earnings of $30,873.
| Educational Attainment | Male Income | Female Income |
| Less than High School | $68,232 | $33,214 |
| High School Diploma | $45,868 | $32,786 |
| College or Associate's Degree | $49,950 | $30,873 |
| Bachelor's Degree | $65,200 | $48,787 |
| Graduate Degree | $68,713 | $43,482 |
| Total | $59,100 | $38,893 |
Family Income in Steamboat Springs
Family Income Brackets in Steamboat Springs
According to the Steamboat Springs family income data, there are 930 families falling into the $200,000+ income range, which is the most common income bracket and makes up 27.5% of all families. Conversely, the $15,000 to $24,999 income bracket is the least frequent group with only 7 families (0.2%) belonging to this category.
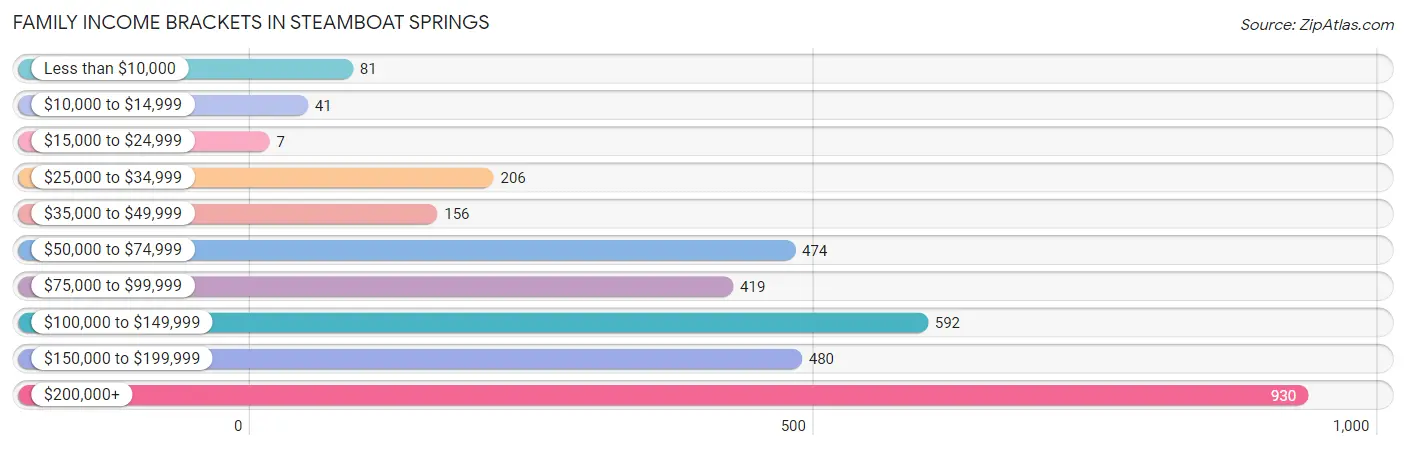
| Income Bracket | # Families | % Families |
| Less than $10,000 | 81 | 2.4% |
| $10,000 to $14,999 | 41 | 1.2% |
| $15,000 to $24,999 | 7 | 0.2% |
| $25,000 to $34,999 | 206 | 6.1% |
| $35,000 to $49,999 | 156 | 4.6% |
| $50,000 to $74,999 | 474 | 14.0% |
| $75,000 to $99,999 | 419 | 12.4% |
| $100,000 to $149,999 | 592 | 17.5% |
| $150,000 to $199,999 | 480 | 14.2% |
| $200,000+ | 930 | 27.5% |
Family Income by Famaliy Size in Steamboat Springs
5-person families (125 | 3.7%) account for the highest median family income in Steamboat Springs with $226,314 per family, while 2-person families (2,082 | 61.5%) have the highest median income of $64,375 per family member.
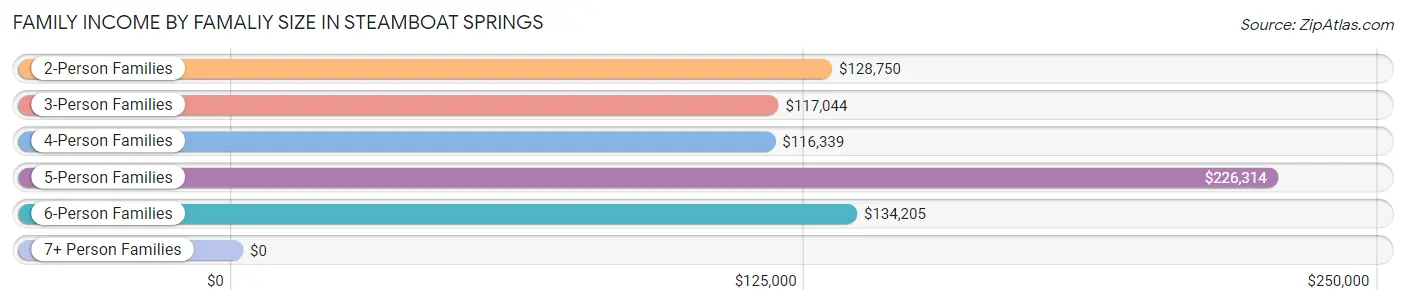
| Income Bracket | # Families | Median Income |
| 2-Person Families | 2,082 (61.5%) | $128,750 |
| 3-Person Families | 649 (19.2%) | $117,044 |
| 4-Person Families | 497 (14.7%) | $116,339 |
| 5-Person Families | 125 (3.7%) | $226,314 |
| 6-Person Families | 30 (0.9%) | $134,205 |
| 7+ Person Families | 0 (0.0%) | $0 |
| Total | 3,383 (100.0%) | $128,601 |
Family Income by Number of Earners in Steamboat Springs
The median family income in Steamboat Springs is $128,601, with families comprising 2 earners (1,831) having the highest median family income of $149,215, while families with no earners (533) have the lowest median family income of $63,750, accounting for 54.1% and 15.8% of families, respectively.
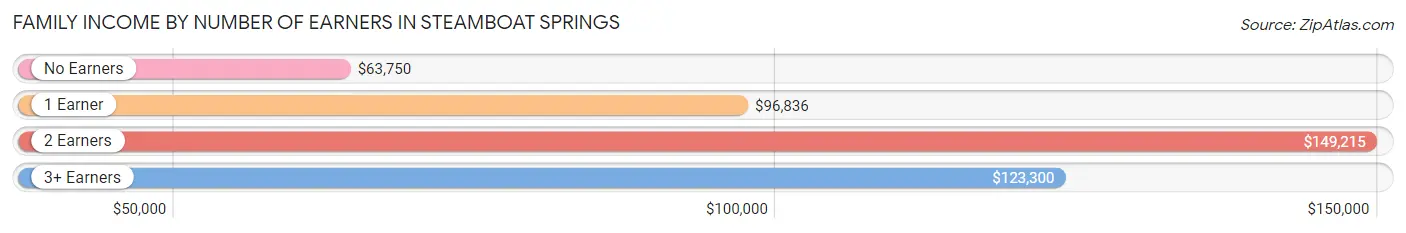
| Number of Earners | # Families | Median Income |
| No Earners | 533 (15.8%) | $63,750 |
| 1 Earner | 787 (23.3%) | $96,836 |
| 2 Earners | 1,831 (54.1%) | $149,215 |
| 3+ Earners | 232 (6.9%) | $123,300 |
| Total | 3,383 (100.0%) | $128,601 |
Household Income in Steamboat Springs
Household Income Brackets in Steamboat Springs
With 1,205 households falling in the category, the $200,000+ income range is the most frequent in Steamboat Springs, accounting for 21.0% of all households. In contrast, only 109 households (1.9%) fall into the $15,000 to $24,999 income bracket, making it the least populous group.
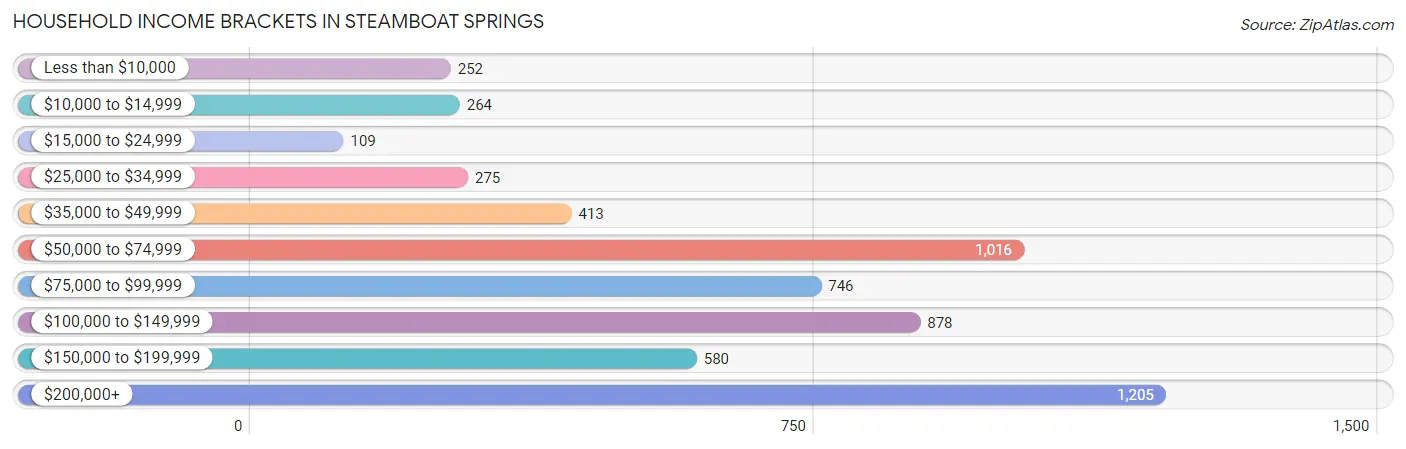
| Income Bracket | # Households | % Households |
| Less than $10,000 | 252 | 4.4% |
| $10,000 to $14,999 | 264 | 4.6% |
| $15,000 to $24,999 | 109 | 1.9% |
| $25,000 to $34,999 | 275 | 4.8% |
| $35,000 to $49,999 | 413 | 7.2% |
| $50,000 to $74,999 | 1,016 | 17.7% |
| $75,000 to $99,999 | 746 | 13.0% |
| $100,000 to $149,999 | 878 | 15.3% |
| $150,000 to $199,999 | 580 | 10.1% |
| $200,000+ | 1,205 | 21.0% |
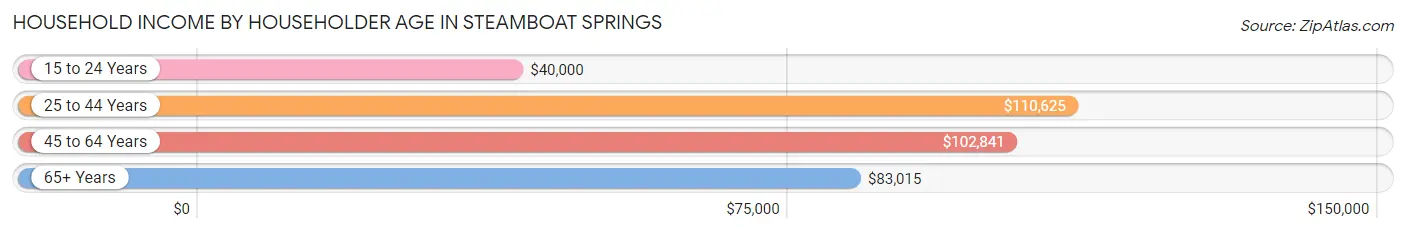
Household Income by Householder Age in Steamboat Springs
The median household income in Steamboat Springs is $93,280, with the highest median household income of $110,625 found in the 25 to 44 years age bracket for the primary householder. A total of 1,920 households (33.5%) fall into this category. Meanwhile, the 15 to 24 years age bracket for the primary householder has the lowest median household income of $40,000, with 152 households (2.6%) in this group.
| Income Bracket | # Households | Median Income |
| 15 to 24 Years | 152 (2.6%) | $40,000 |
| 25 to 44 Years | 1,920 (33.5%) | $110,625 |
| 45 to 64 Years | 2,202 (38.4%) | $102,841 |
| 65+ Years | 1,464 (25.5%) | $83,015 |
| Total | 5,738 (100.0%) | $93,280 |
Poverty in Steamboat Springs
Income Below Poverty by Sex and Age in Steamboat Springs
With 4.6% poverty level for males and 11.8% for females among the residents of Steamboat Springs, 5 year old males and 18 to 24 year old females are the most vulnerable to poverty, with 3 males (30.0%) and 196 females (44.8%) in their respective age groups living below the poverty level.
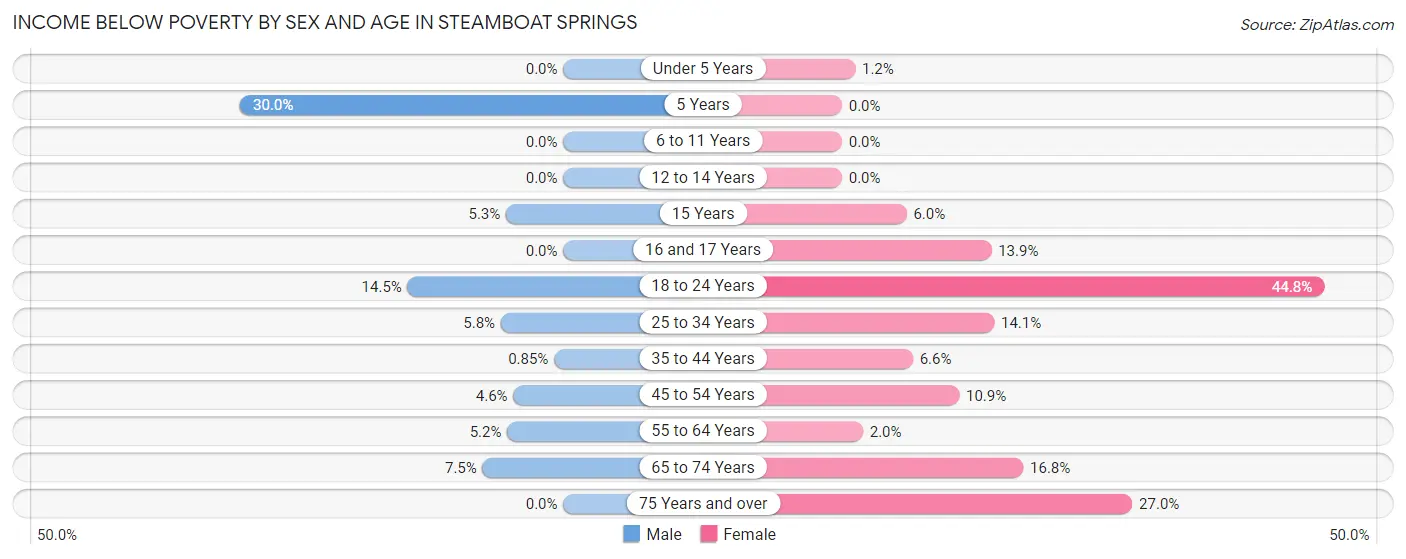
| Age Bracket | Male | Female |
| Under 5 Years | 0 (0.0%) | 3 (1.2%) |
| 5 Years | 3 (30.0%) | 0 (0.0%) |
| 6 to 11 Years | 0 (0.0%) | 0 (0.0%) |
| 12 to 14 Years | 0 (0.0%) | 0 (0.0%) |
| 15 Years | 6 (5.3%) | 3 (6.0%) |
| 16 and 17 Years | 0 (0.0%) | 19 (13.9%) |
| 18 to 24 Years | 76 (14.4%) | 196 (44.8%) |
| 25 to 34 Years | 63 (5.8%) | 118 (14.1%) |
| 35 to 44 Years | 9 (0.9%) | 64 (6.6%) |
| 45 to 54 Years | 41 (4.6%) | 100 (10.9%) |
| 55 to 64 Years | 51 (5.2%) | 19 (1.9%) |
| 65 to 74 Years | 60 (7.5%) | 118 (16.8%) |
| 75 Years and over | 0 (0.0%) | 107 (27.0%) |
| Total | 309 (4.6%) | 747 (11.8%) |
Income Above Poverty by Sex and Age in Steamboat Springs
According to the poverty statistics in Steamboat Springs, males aged under 5 years and females aged 5 years are the age groups that are most secure financially, with 100.0% of males and 100.0% of females in these age groups living above the poverty line.
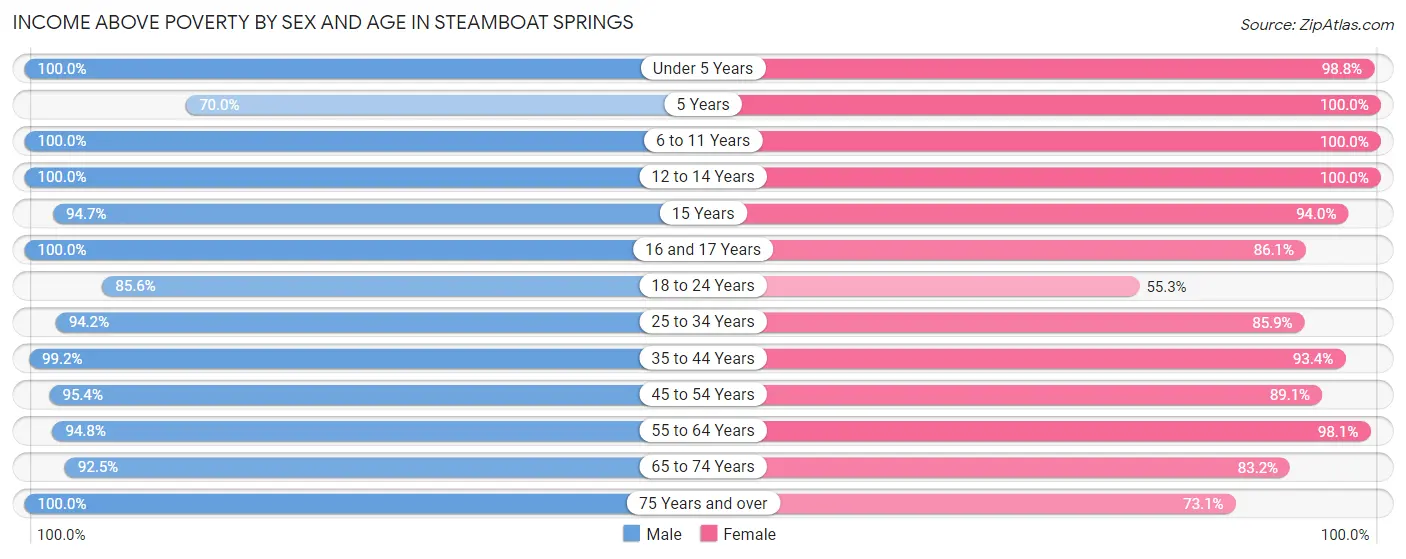
| Age Bracket | Male | Female |
| Under 5 Years | 200 (100.0%) | 240 (98.8%) |
| 5 Years | 7 (70.0%) | 105 (100.0%) |
| 6 to 11 Years | 279 (100.0%) | 396 (100.0%) |
| 12 to 14 Years | 257 (100.0%) | 145 (100.0%) |
| 15 Years | 107 (94.7%) | 47 (94.0%) |
| 16 and 17 Years | 145 (100.0%) | 118 (86.1%) |
| 18 to 24 Years | 450 (85.6%) | 242 (55.2%) |
| 25 to 34 Years | 1,025 (94.2%) | 717 (85.9%) |
| 35 to 44 Years | 1,054 (99.2%) | 908 (93.4%) |
| 45 to 54 Years | 845 (95.4%) | 819 (89.1%) |
| 55 to 64 Years | 930 (94.8%) | 956 (98.1%) |
| 65 to 74 Years | 741 (92.5%) | 583 (83.2%) |
| 75 Years and over | 317 (100.0%) | 290 (73.1%) |
| Total | 6,357 (95.4%) | 5,566 (88.2%) |
Income Below Poverty Among Married-Couple Families in Steamboat Springs
The poverty statistics for married-couple families in Steamboat Springs show that 3.9% or 111 of the total 2,830 families live below the poverty line. Families with no children have the highest poverty rate of 5.6%, comprising of 103 families. On the other hand, families with 3 or 4 children have the lowest poverty rate of 0.0%, which includes 0 families.
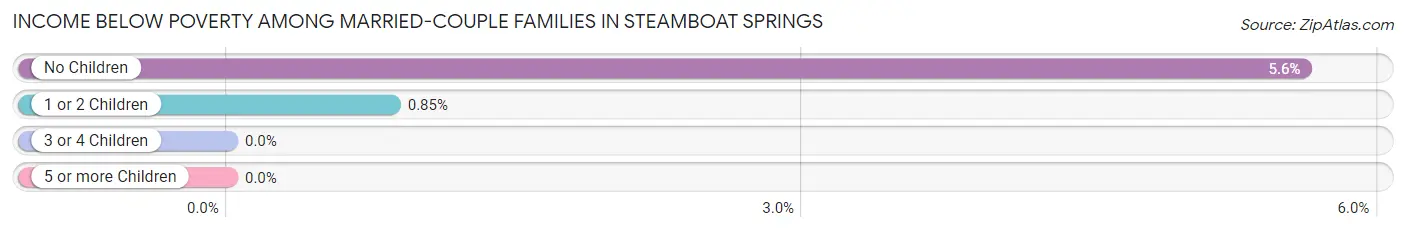
| Children | Above Poverty | Below Poverty |
| No Children | 1,732 (94.4%) | 103 (5.6%) |
| 1 or 2 Children | 928 (99.2%) | 8 (0.9%) |
| 3 or 4 Children | 59 (100.0%) | 0 (0.0%) |
| 5 or more Children | 0 (0.0%) | 0 (0.0%) |
| Total | 2,719 (96.1%) | 111 (3.9%) |
Income Below Poverty Among Single-Parent Households in Steamboat Springs
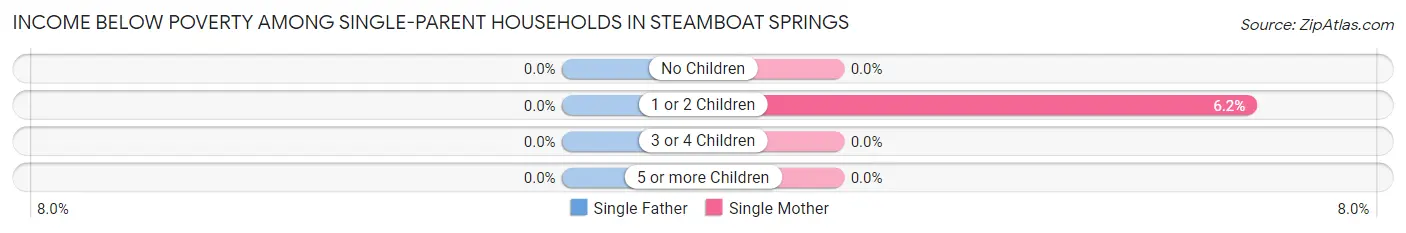
| Children | Single Father | Single Mother |
| No Children | 0 (0.0%) | 0 (0.0%) |
| 1 or 2 Children | 0 (0.0%) | 17 (6.2%) |
| 3 or 4 Children | 0 (0.0%) | 0 (0.0%) |
| 5 or more Children | 0 (0.0%) | 0 (0.0%) |
| Total | 0 (0.0%) | 17 (4.3%) |
Income Below Poverty Among Married-Couple vs Single-Parent Households in Steamboat Springs
The poverty data for Steamboat Springs shows that 111 of the married-couple family households (3.9%) and 17 of the single-parent households (3.1%) are living below the poverty level. Within the married-couple family households, those with no children have the highest poverty rate, with 103 households (5.6%) falling below the poverty line. Among the single-parent households, those with 1 or 2 children have the highest poverty rate, with 17 household (4.7%) living below poverty.
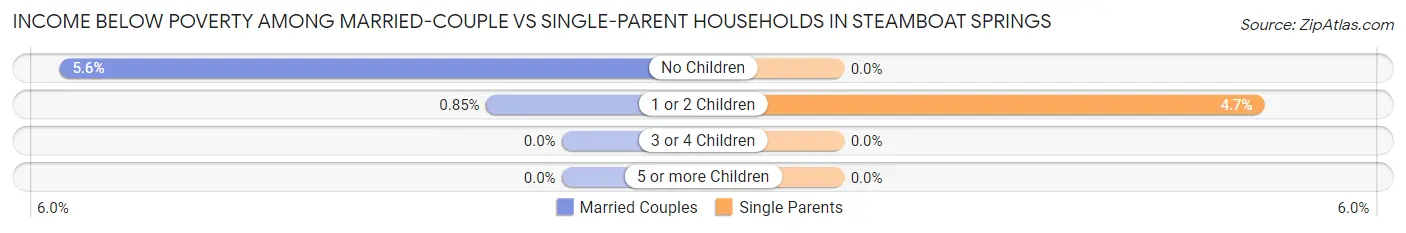
| Children | Married-Couple Families | Single-Parent Households |
| No Children | 103 (5.6%) | 0 (0.0%) |
| 1 or 2 Children | 8 (0.9%) | 17 (4.7%) |
| 3 or 4 Children | 0 (0.0%) | 0 (0.0%) |
| 5 or more Children | 0 (0.0%) | 0 (0.0%) |
| Total | 111 (3.9%) | 17 (3.1%) |
Race in Steamboat Springs
The most populous races in Steamboat Springs are White / Caucasian (11,285 | 85.2%), Two or more Races (1,457 | 11.0%), and Hispanic or Latino (1,180 | 8.9%).
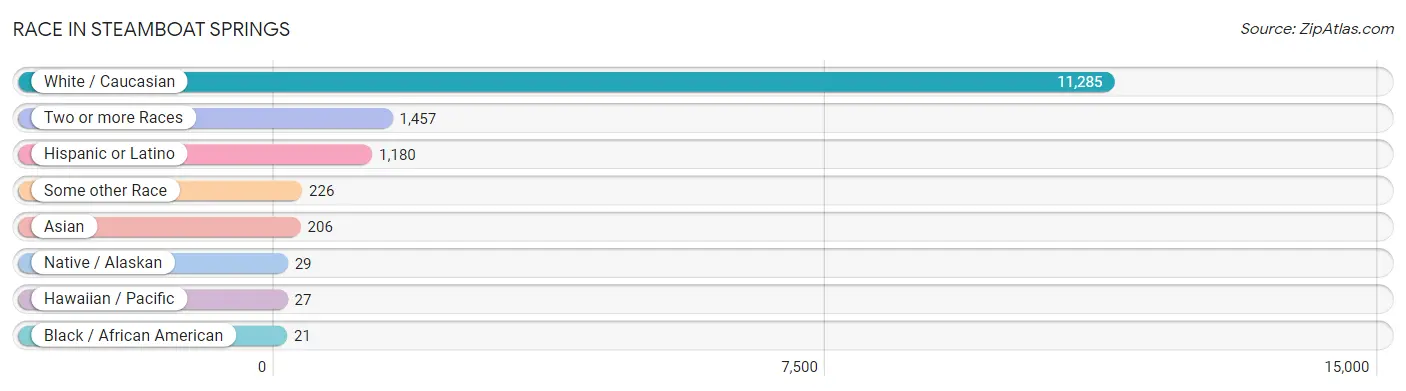
| Race | # Population | % Population |
| Asian | 206 | 1.5% |
| Black / African American | 21 | 0.2% |
| Hawaiian / Pacific | 27 | 0.2% |
| Hispanic or Latino | 1,180 | 8.9% |
| Native / Alaskan | 29 | 0.2% |
| White / Caucasian | 11,285 | 85.2% |
| Two or more Races | 1,457 | 11.0% |
| Some other Race | 226 | 1.7% |
| Total | 13,251 | 100.0% |
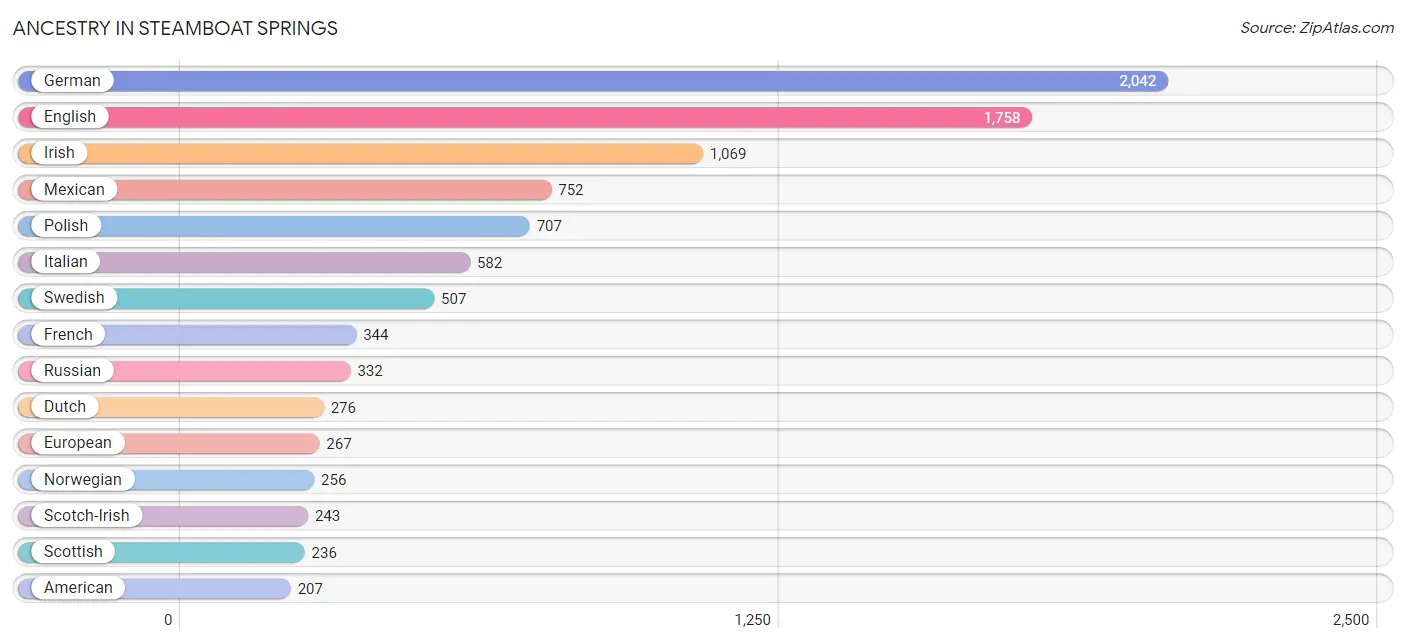
Ancestry in Steamboat Springs
The most populous ancestries reported in Steamboat Springs are German (2,042 | 15.4%), English (1,758 | 13.3%), Irish (1,069 | 8.1%), Mexican (752 | 5.7%), and Polish (707 | 5.3%), together accounting for 47.8% of all Steamboat Springs residents.
| Ancestry | # Population | % Population |
| African | 1 | 0.0% |
| American | 207 | 1.6% |
| Arab | 12 | 0.1% |
| Argentinean | 10 | 0.1% |
| Armenian | 13 | 0.1% |
| Australian | 4 | 0.0% |
| Austrian | 59 | 0.4% |
| Bhutanese | 1 | 0.0% |
| Blackfeet | 1 | 0.0% |
| Bolivian | 23 | 0.2% |
| British | 75 | 0.6% |
| Burmese | 29 | 0.2% |
| Canadian | 37 | 0.3% |
| Central American | 113 | 0.9% |
| Cherokee | 49 | 0.4% |
| Choctaw | 49 | 0.4% |
| Croatian | 57 | 0.4% |
| Cuban | 41 | 0.3% |
| Czech | 39 | 0.3% |
| Czechoslovakian | 4 | 0.0% |
| Danish | 75 | 0.6% |
| Dutch | 276 | 2.1% |
| Eastern European | 79 | 0.6% |
| Egyptian | 3 | 0.0% |
| English | 1,758 | 13.3% |
| Estonian | 8 | 0.1% |
| Ethiopian | 19 | 0.1% |
| European | 267 | 2.0% |
| Finnish | 37 | 0.3% |
| French | 344 | 2.6% |
| French Canadian | 6 | 0.1% |
| German | 2,042 | 15.4% |
| Greek | 8 | 0.1% |
| Guamanian / Chamorro | 1 | 0.0% |
| Honduran | 101 | 0.8% |
| Hungarian | 175 | 1.3% |
| Indian (Asian) | 72 | 0.5% |
| Iranian | 4 | 0.0% |
| Irish | 1,069 | 8.1% |
| Israeli | 18 | 0.1% |
| Italian | 582 | 4.4% |
| Korean | 115 | 0.9% |
| Laotian | 7 | 0.1% |
| Lebanese | 9 | 0.1% |
| Lithuanian | 13 | 0.1% |
| Mexican | 752 | 5.7% |
| Native Hawaiian | 89 | 0.7% |
| New Zealander | 13 | 0.1% |
| Northern European | 30 | 0.2% |
| Norwegian | 256 | 1.9% |
| Polish | 707 | 5.3% |
| Portuguese | 43 | 0.3% |
| Pueblo | 22 | 0.2% |
| Puerto Rican | 130 | 1.0% |
| Romanian | 6 | 0.1% |
| Russian | 332 | 2.5% |
| Salvadoran | 12 | 0.1% |
| Scandinavian | 142 | 1.1% |
| Scotch-Irish | 243 | 1.8% |
| Scottish | 236 | 1.8% |
| Serbian | 10 | 0.1% |
| Sioux | 29 | 0.2% |
| Slavic | 5 | 0.0% |
| Slovak | 14 | 0.1% |
| Slovene | 6 | 0.1% |
| South American | 45 | 0.3% |
| Spaniard | 55 | 0.4% |
| Spanish | 31 | 0.2% |
| Sri Lankan | 62 | 0.5% |
| Subsaharan African | 20 | 0.2% |
| Swedish | 507 | 3.8% |
| Swiss | 28 | 0.2% |
| Thai | 14 | 0.1% |
| Ukrainian | 35 | 0.3% |
| Venezuelan | 12 | 0.1% |
| Welsh | 161 | 1.2% |
| Yugoslavian | 9 | 0.1% | View All 77 Rows |
Immigrants in Steamboat Springs
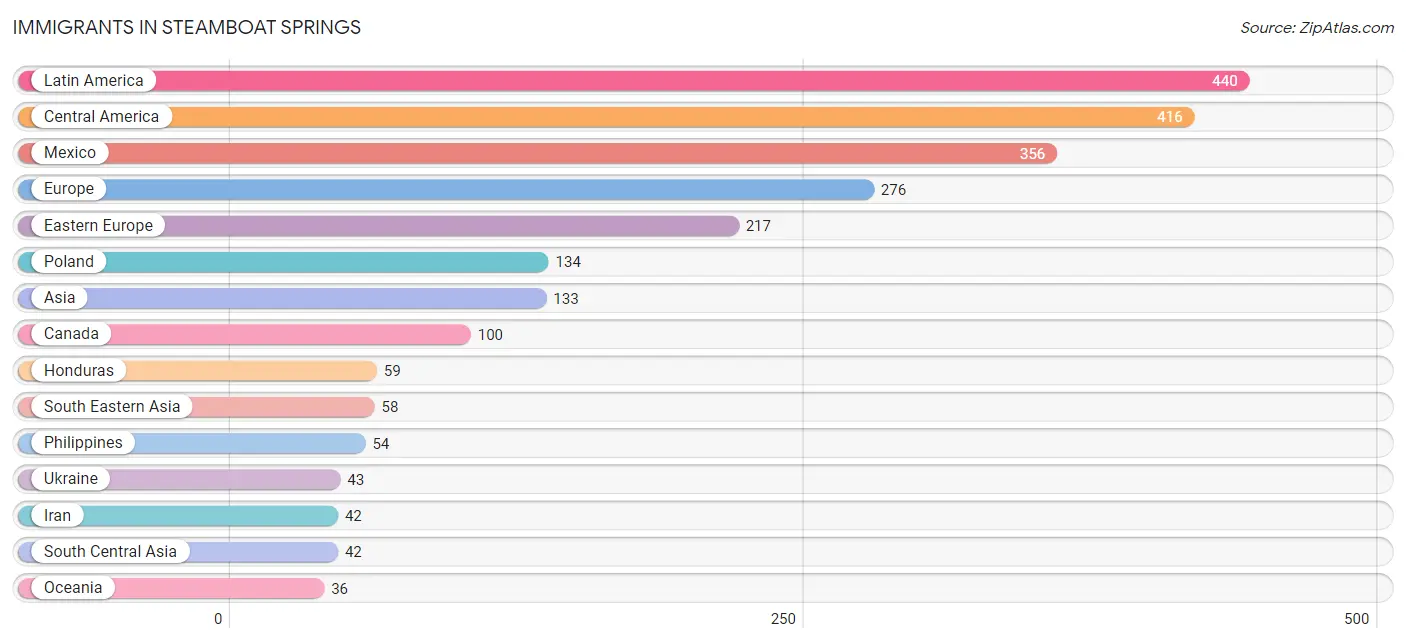
The most numerous immigrant groups reported in Steamboat Springs came from Latin America (440 | 3.3%), Central America (416 | 3.1%), Mexico (356 | 2.7%), Europe (276 | 2.1%), and Eastern Europe (217 | 1.6%), together accounting for 12.9% of all Steamboat Springs residents.
| Immigration Origin | # Population | % Population |
| Africa | 19 | 0.1% |
| Asia | 133 | 1.0% |
| Australia | 23 | 0.2% |
| Bulgaria | 17 | 0.1% |
| Canada | 100 | 0.7% |
| Caribbean | 15 | 0.1% |
| Central America | 416 | 3.1% |
| China | 7 | 0.1% |
| Cuba | 15 | 0.1% |
| Czechoslovakia | 5 | 0.0% |
| Denmark | 12 | 0.1% |
| Eastern Africa | 19 | 0.1% |
| Eastern Asia | 33 | 0.3% |
| Eastern Europe | 217 | 1.6% |
| Ethiopia | 19 | 0.1% |
| Europe | 276 | 2.1% |
| Germany | 8 | 0.1% |
| Honduras | 59 | 0.4% |
| Hungary | 12 | 0.1% |
| Iran | 42 | 0.3% |
| Ireland | 14 | 0.1% |
| Japan | 10 | 0.1% |
| Korea | 16 | 0.1% |
| Latin America | 440 | 3.3% |
| Mexico | 356 | 2.7% |
| Moldova | 6 | 0.1% |
| Netherlands | 6 | 0.1% |
| Northern Europe | 32 | 0.2% |
| Oceania | 36 | 0.3% |
| Philippines | 54 | 0.4% |
| Poland | 134 | 1.0% |
| Portugal | 13 | 0.1% |
| South America | 9 | 0.1% |
| South Central Asia | 42 | 0.3% |
| South Eastern Asia | 58 | 0.4% |
| Southern Europe | 13 | 0.1% |
| Ukraine | 43 | 0.3% |
| Venezuela | 9 | 0.1% |
| Vietnam | 4 | 0.0% |
| Western Europe | 14 | 0.1% | View All 40 Rows |
Sex and Age in Steamboat Springs
Sex and Age in Steamboat Springs
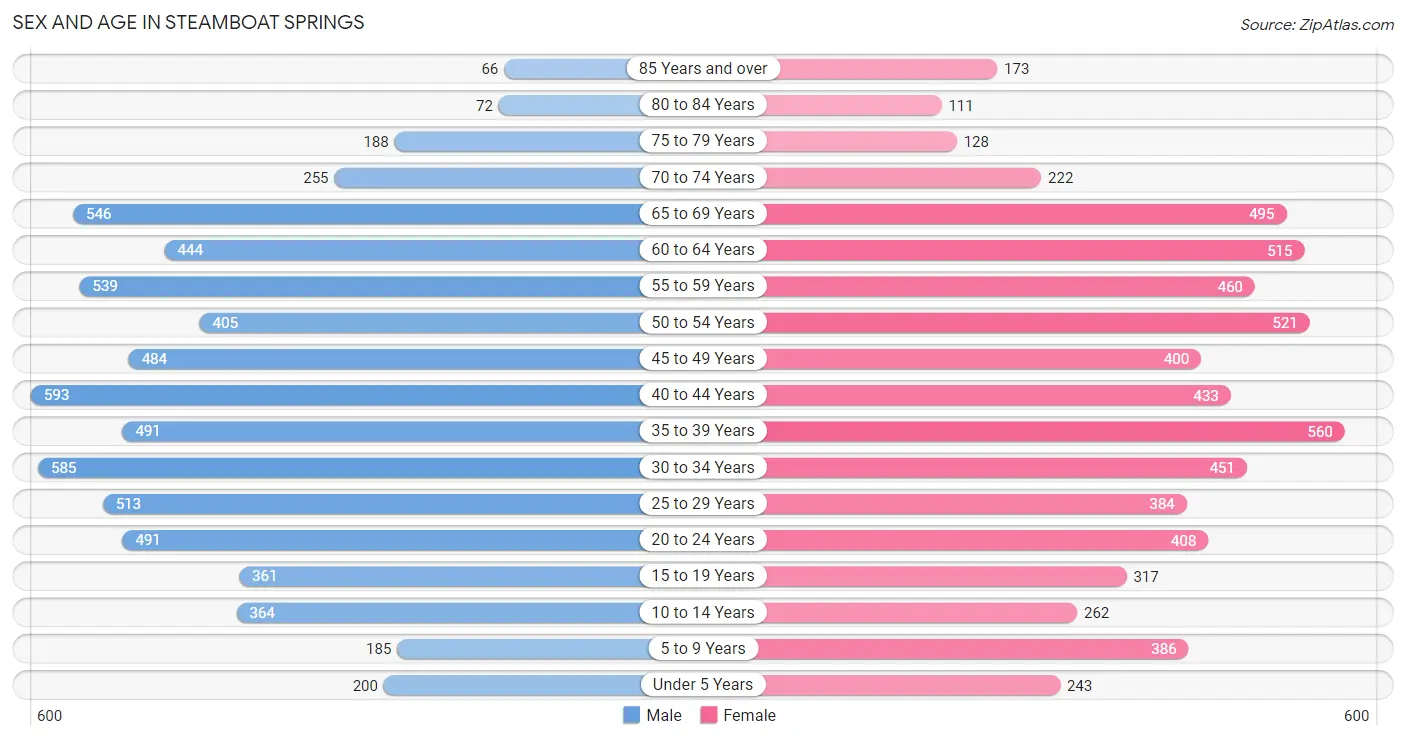
The most populous age groups in Steamboat Springs are 40 to 44 Years (593 | 8.7%) for men and 35 to 39 Years (560 | 8.7%) for women.
| Age Bracket | Male | Female |
| Under 5 Years | 200 (2.9%) | 243 (3.8%) |
| 5 to 9 Years | 185 (2.7%) | 386 (6.0%) |
| 10 to 14 Years | 364 (5.4%) | 262 (4.1%) |
| 15 to 19 Years | 361 (5.3%) | 317 (4.9%) |
| 20 to 24 Years | 491 (7.2%) | 408 (6.3%) |
| 25 to 29 Years | 513 (7.6%) | 384 (5.9%) |
| 30 to 34 Years | 585 (8.6%) | 451 (7.0%) |
| 35 to 39 Years | 491 (7.2%) | 560 (8.7%) |
| 40 to 44 Years | 593 (8.7%) | 433 (6.7%) |
| 45 to 49 Years | 484 (7.1%) | 400 (6.2%) |
| 50 to 54 Years | 405 (6.0%) | 521 (8.1%) |
| 55 to 59 Years | 539 (8.0%) | 460 (7.1%) |
| 60 to 64 Years | 444 (6.6%) | 515 (8.0%) |
| 65 to 69 Years | 546 (8.1%) | 495 (7.6%) |
| 70 to 74 Years | 255 (3.8%) | 222 (3.4%) |
| 75 to 79 Years | 188 (2.8%) | 128 (2.0%) |
| 80 to 84 Years | 72 (1.1%) | 111 (1.7%) |
| 85 Years and over | 66 (1.0%) | 173 (2.7%) |
| Total | 6,782 (100.0%) | 6,469 (100.0%) |
Families and Households in Steamboat Springs
Median Family Size in Steamboat Springs
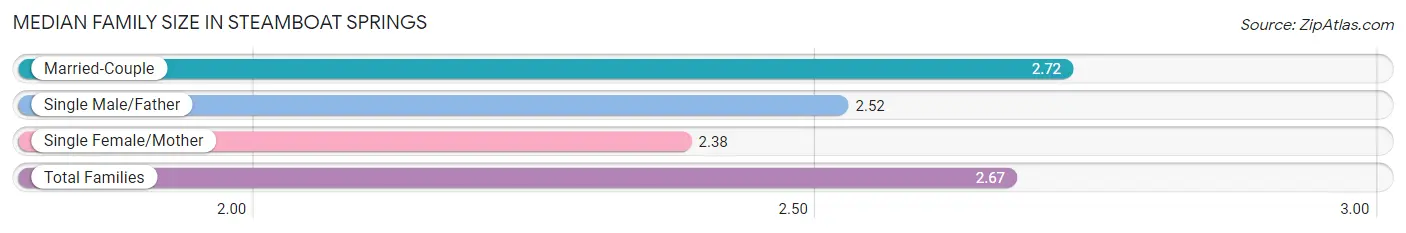
The median family size in Steamboat Springs is 2.67 persons per family, with married-couple families (2,830 | 83.7%) accounting for the largest median family size of 2.72 persons per family. On the other hand, single female/mother families (398 | 11.8%) represent the smallest median family size with 2.38 persons per family.
| Family Type | # Families | Family Size |
| Married-Couple | 2,830 (83.7%) | 2.72 |
| Single Male/Father | 155 (4.6%) | 2.52 |
| Single Female/Mother | 398 (11.8%) | 2.38 |
| Total Families | 3,383 (100.0%) | 2.67 |
Median Household Size in Steamboat Springs
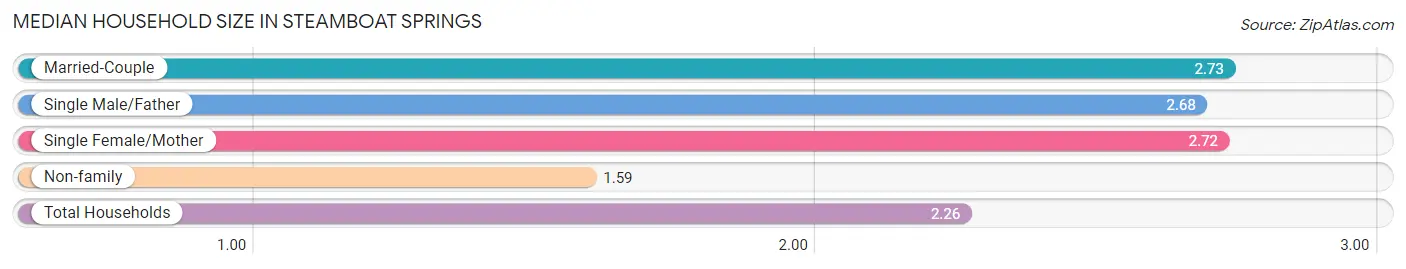
The median household size in Steamboat Springs is 2.26 persons per household, with married-couple households (2,830 | 49.3%) accounting for the largest median household size of 2.73 persons per household. non-family households (2,355 | 41.0%) represent the smallest median household size with 1.59 persons per household.
| Household Type | # Households | Household Size |
| Married-Couple | 2,830 (49.3%) | 2.73 |
| Single Male/Father | 155 (2.7%) | 2.68 |
| Single Female/Mother | 398 (6.9%) | 2.72 |
| Non-family | 2,355 (41.0%) | 1.59 |
| Total Households | 5,738 (100.0%) | 2.26 |
Household Size by Marriage Status in Steamboat Springs
Out of a total of 5,738 households in Steamboat Springs, 3,383 (59.0%) are family households, while 2,355 (41.0%) are nonfamily households. The most numerous type of family households are 2-person households, comprising 1,973, and the most common type of nonfamily households are 1-person households, comprising 1,558.
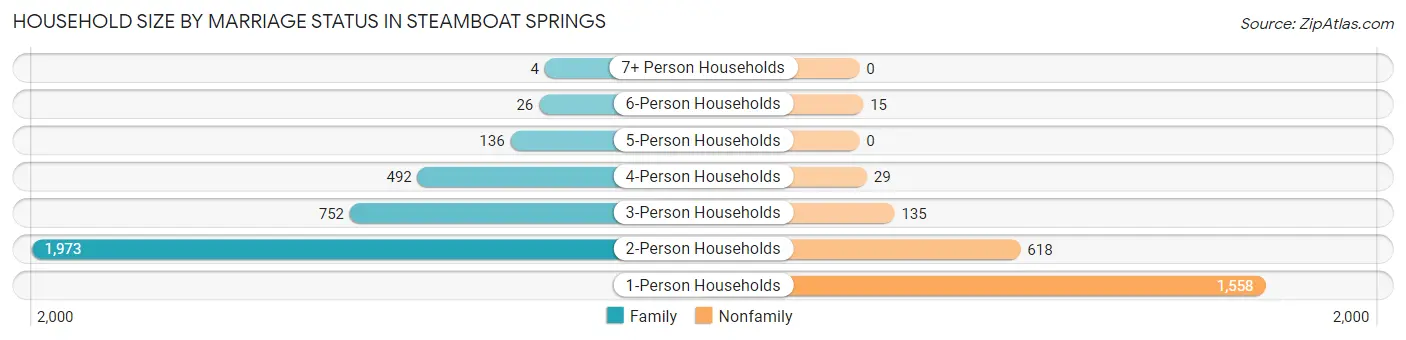
| Household Size | Family Households | Nonfamily Households |
| 1-Person Households | - | 1,558 (27.2%) |
| 2-Person Households | 1,973 (34.4%) | 618 (10.8%) |
| 3-Person Households | 752 (13.1%) | 135 (2.4%) |
| 4-Person Households | 492 (8.6%) | 29 (0.5%) |
| 5-Person Households | 136 (2.4%) | 0 (0.0%) |
| 6-Person Households | 26 (0.4%) | 15 (0.3%) |
| 7+ Person Households | 4 (0.1%) | 0 (0.0%) |
| Total | 3,383 (59.0%) | 2,355 (41.0%) |
Female Fertility in Steamboat Springs
Fertility by Age in Steamboat Springs
Average fertility rate in Steamboat Springs is 36.0 births per 1,000 women. Women in the age bracket of 20 to 34 years have the highest fertility rate with 42.0 births per 1,000 women. Women in the age bracket of 35 to 50 years acount for 52.3% of all women with births.
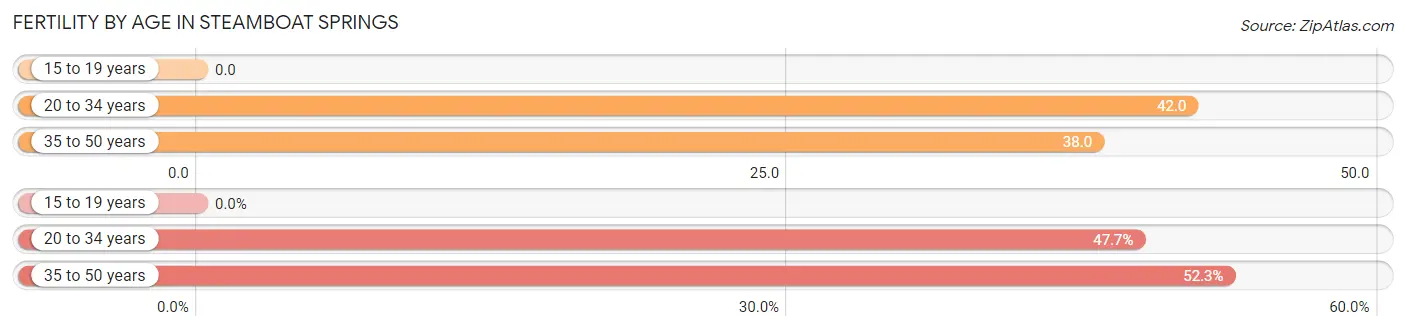
| Age Bracket | Women with Births | Births / 1,000 Women |
| 15 to 19 years | 0 (0.0%) | 0.0 |
| 20 to 34 years | 52 (47.7%) | 42.0 |
| 35 to 50 years | 57 (52.3%) | 38.0 |
| Total | 109 (100.0%) | 36.0 |
Fertility by Age by Marriage Status in Steamboat Springs
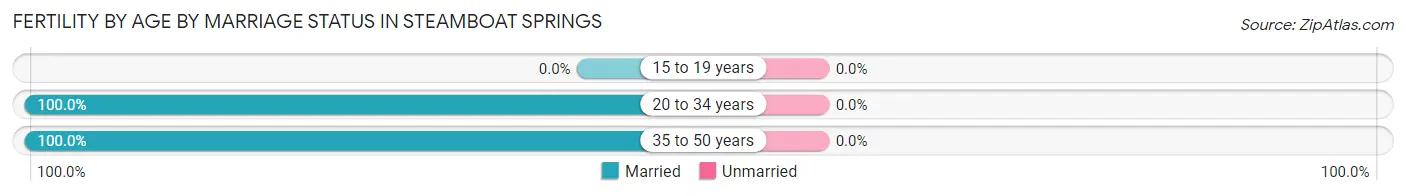
| Age Bracket | Married | Unmarried |
| 15 to 19 years | 0 (0.0%) | 0 (0.0%) |
| 20 to 34 years | 52 (100.0%) | 0 (0.0%) |
| 35 to 50 years | 57 (100.0%) | 0 (0.0%) |
| Total | 109 (100.0%) | 0 (0.0%) |
Fertility by Education in Steamboat Springs
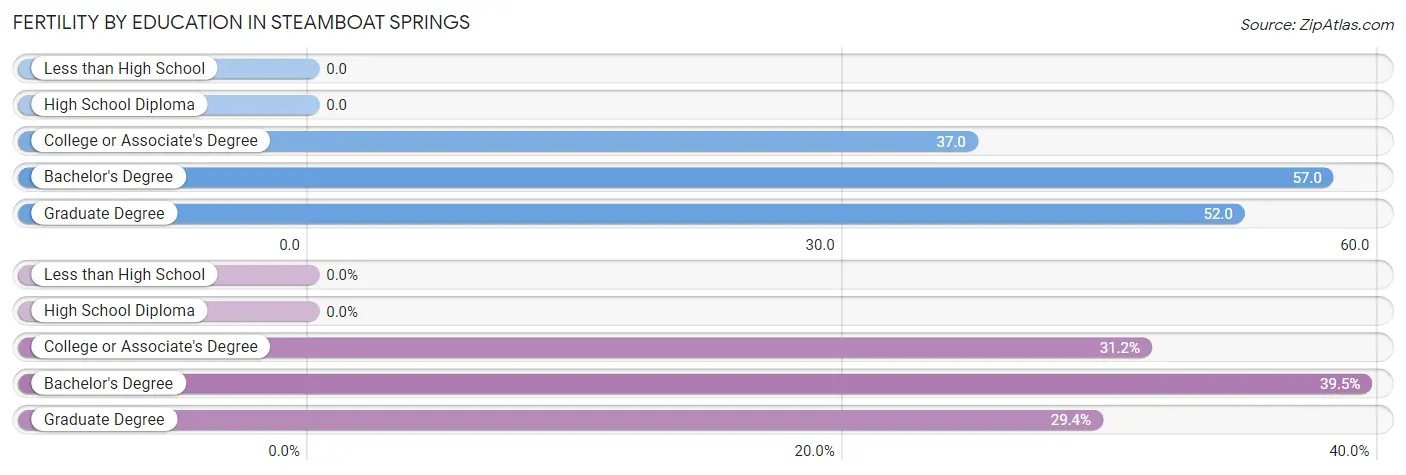
| Educational Attainment | Women with Births | Births / 1,000 Women |
| Less than High School | 0 (0.0%) | 0.0 |
| High School Diploma | 0 (0.0%) | 0.0 |
| College or Associate's Degree | 34 (31.2%) | 37.0 |
| Bachelor's Degree | 43 (39.5%) | 57.0 |
| Graduate Degree | 32 (29.4%) | 52.0 |
| Total | 109 (100.0%) | 36.0 |
Fertility by Education by Marriage Status in Steamboat Springs
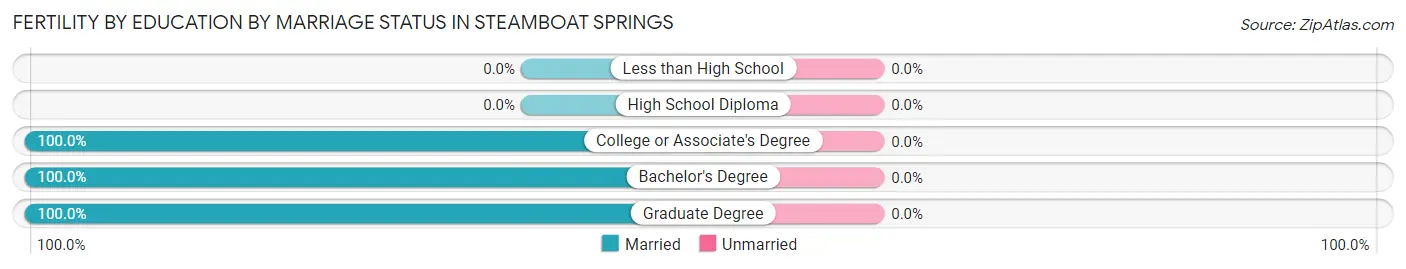
| Educational Attainment | Married | Unmarried |
| Less than High School | 0 (0.0%) | 0 (0.0%) |
| High School Diploma | 0 (0.0%) | 0 (0.0%) |
| College or Associate's Degree | 34 (100.0%) | 0 (0.0%) |
| Bachelor's Degree | 43 (100.0%) | 0 (0.0%) |
| Graduate Degree | 32 (100.0%) | 0 (0.0%) |
| Total | 109 (100.0%) | 0 (0.0%) |
Employment Characteristics in Steamboat Springs
Employment by Class of Employer in Steamboat Springs
Among the 7,361 employed individuals in Steamboat Springs, private company employees (5,197 | 70.6%), local government employees (520 | 7.1%), and self-employed (incorporated) (504 | 6.9%) make up the most common classes of employment.
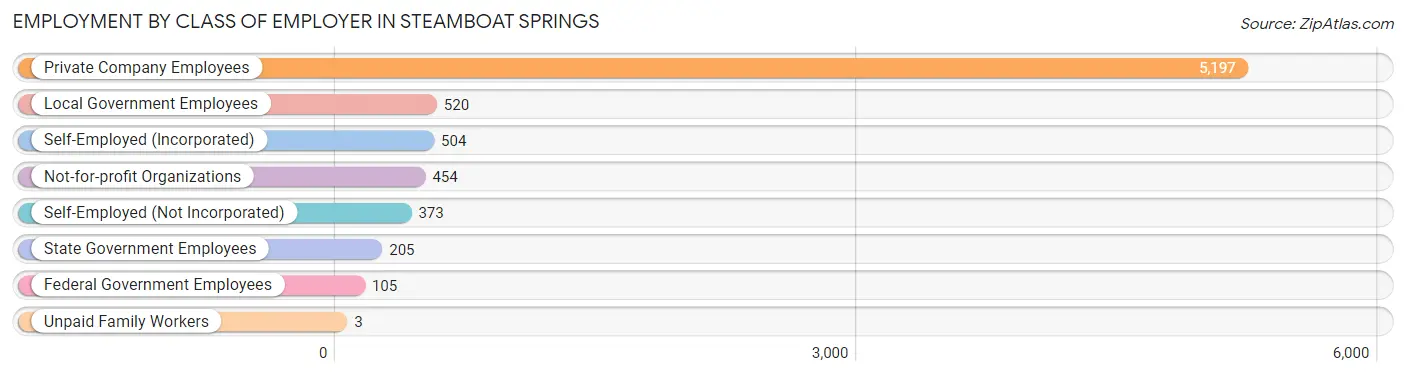
| Employer Class | # Employees | % Employees |
| Private Company Employees | 5,197 | 70.6% |
| Self-Employed (Incorporated) | 504 | 6.9% |
| Self-Employed (Not Incorporated) | 373 | 5.1% |
| Not-for-profit Organizations | 454 | 6.2% |
| Local Government Employees | 520 | 7.1% |
| State Government Employees | 205 | 2.8% |
| Federal Government Employees | 105 | 1.4% |
| Unpaid Family Workers | 3 | 0.0% |
| Total | 7,361 | 100.0% |
Employment Status by Age in Steamboat Springs
According to the labor force statistics for Steamboat Springs, out of the total population over 16 years of age (11,448), 67.1% or 7,682 individuals are in the labor force, with 3.6% or 277 of them unemployed. The age group with the highest labor force participation rate is 25 to 29 years, with 92.5% or 830 individuals in the labor force. Within the labor force, the 16 to 19 years age range has the highest percentage of unemployed individuals, with 22.4% or 38 of them being unemployed.
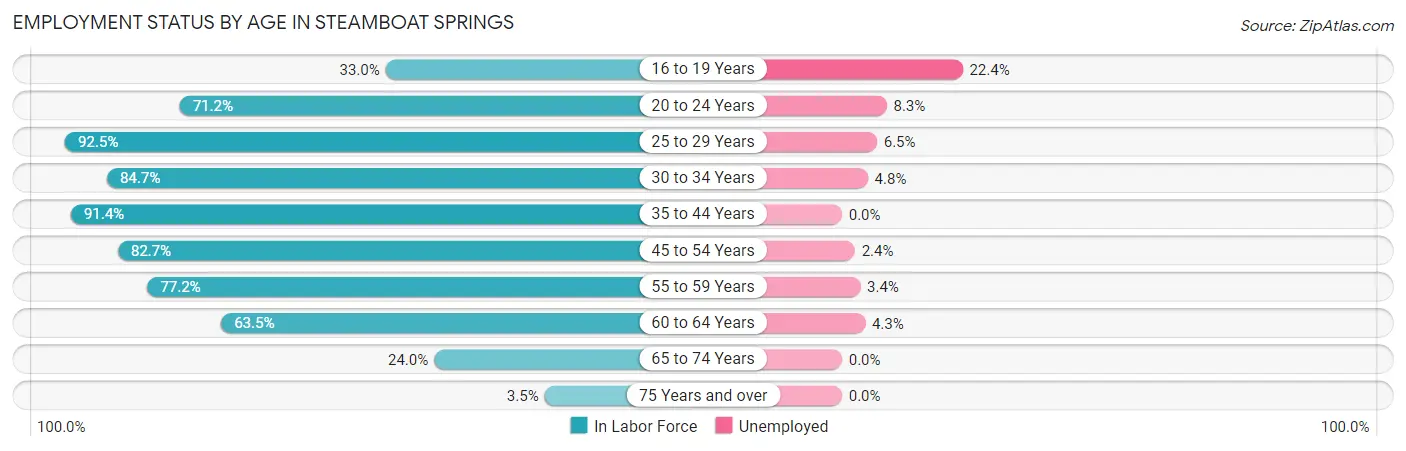
| Age Bracket | In Labor Force | Unemployed |
| 16 to 19 Years | 170 (33.0%) | 38 (22.4%) |
| 20 to 24 Years | 640 (71.2%) | 53 (8.3%) |
| 25 to 29 Years | 830 (92.5%) | 54 (6.5%) |
| 30 to 34 Years | 877 (84.7%) | 42 (4.8%) |
| 35 to 44 Years | 1,898 (91.4%) | 0 (0.0%) |
| 45 to 54 Years | 1,497 (82.7%) | 36 (2.4%) |
| 55 to 59 Years | 771 (77.2%) | 26 (3.4%) |
| 60 to 64 Years | 609 (63.5%) | 26 (4.3%) |
| 65 to 74 Years | 364 (24.0%) | 0 (0.0%) |
| 75 Years and over | 26 (3.5%) | 0 (0.0%) |
| Total | 7,682 (67.1%) | 277 (3.6%) |
Employment Status by Educational Attainment in Steamboat Springs
According to labor force statistics for Steamboat Springs, 83.3% of individuals (6,479) out of the total population between 25 and 64 years of age (7,778) are in the labor force, with 2.8% or 181 of them being unemployed. The group with the highest labor force participation rate are those with the educational attainment of college / associate degree, with 84.9% or 1,850 individuals in the labor force. Within the labor force, individuals with high school diploma education have the highest percentage of unemployment, with 14.9% or 147 of them being unemployed.
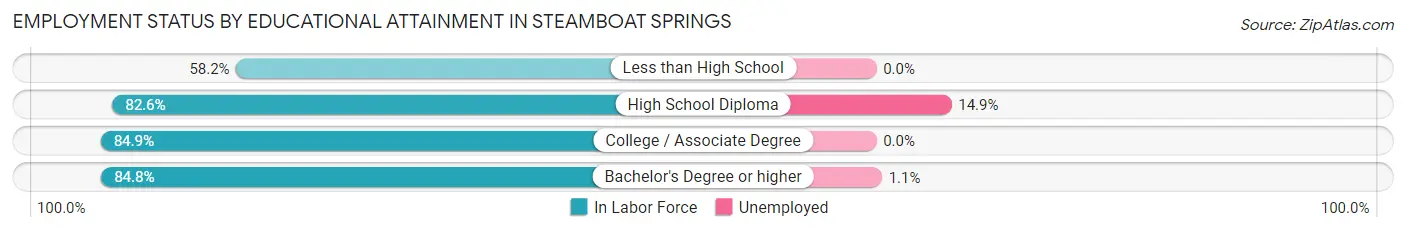
| Educational Attainment | In Labor Force | Unemployed |
| Less than High School | 195 (58.2%) | 0 (0.0%) |
| High School Diploma | 985 (82.6%) | 178 (14.9%) |
| College / Associate Degree | 1,850 (84.9%) | 0 (0.0%) |
| Bachelor's Degree or higher | 3,452 (84.8%) | 45 (1.1%) |
| Total | 6,479 (83.3%) | 218 (2.8%) |
Employment Occupations by Sex in Steamboat Springs
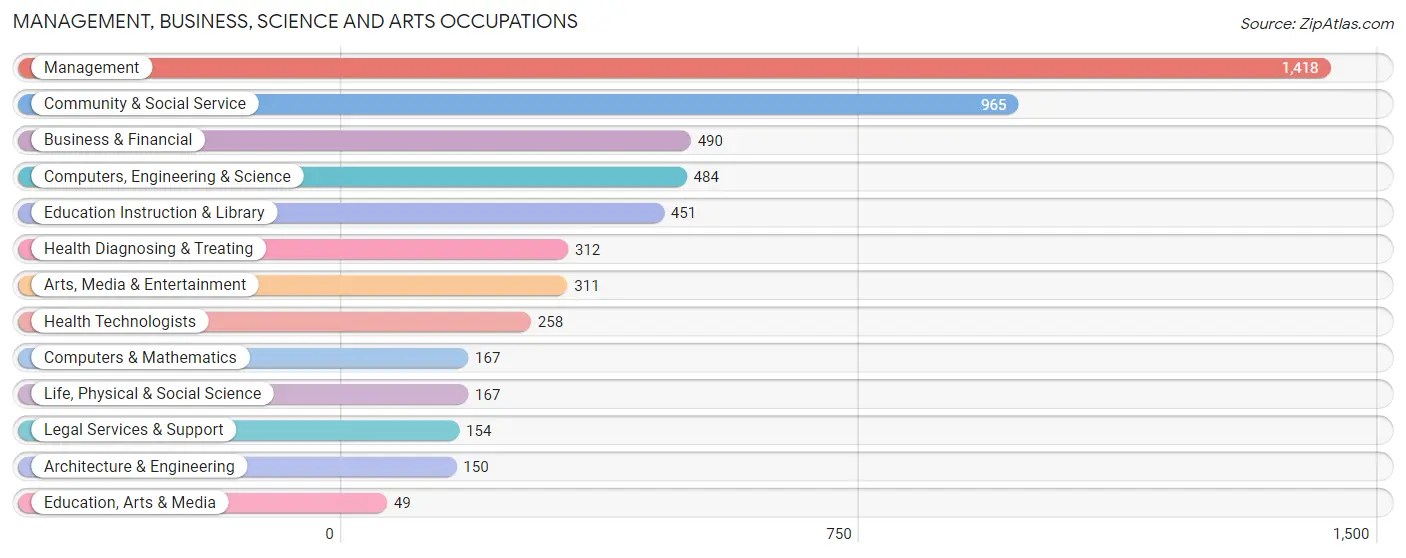
Management, Business, Science and Arts Occupations
The most common Management, Business, Science and Arts occupations in Steamboat Springs are Management (1,418 | 19.1%), Community & Social Service (965 | 13.0%), Business & Financial (490 | 6.6%), Computers, Engineering & Science (484 | 6.5%), and Education Instruction & Library (451 | 6.1%).
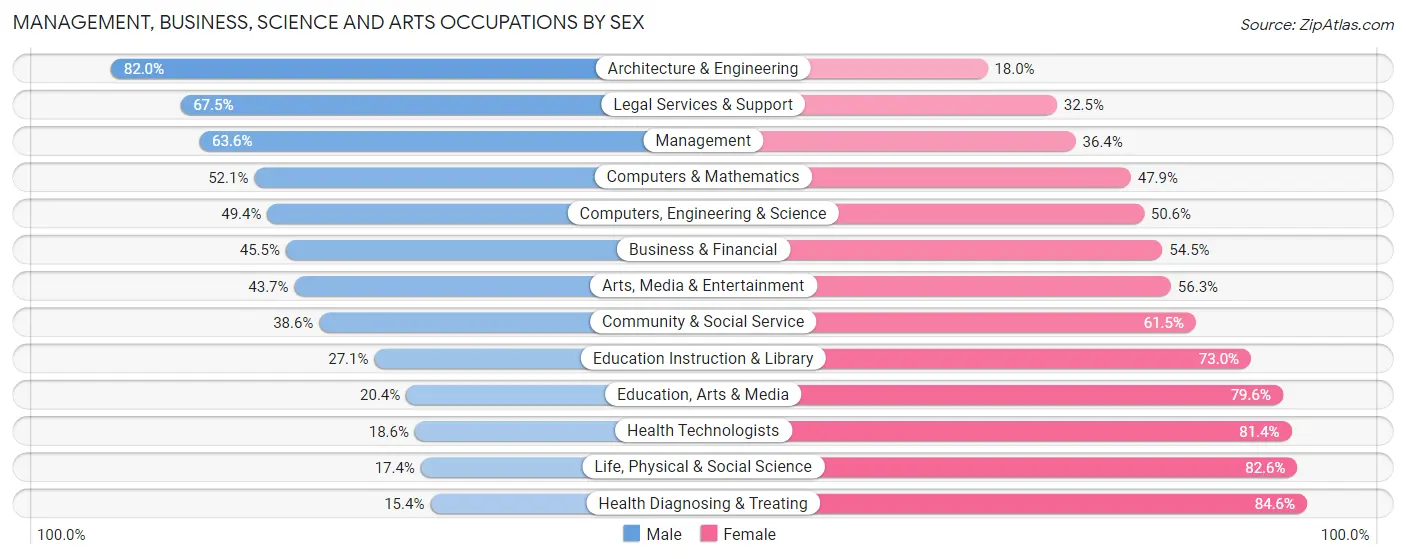
Management, Business, Science and Arts Occupations by Sex
Within the Management, Business, Science and Arts occupations in Steamboat Springs, the most male-oriented occupations are Architecture & Engineering (82.0%), Legal Services & Support (67.5%), and Management (63.6%), while the most female-oriented occupations are Health Diagnosing & Treating (84.6%), Life, Physical & Social Science (82.6%), and Health Technologists (81.4%).
| Occupation | Male | Female |
| Management | 902 (63.6%) | 516 (36.4%) |
| Business & Financial | 223 (45.5%) | 267 (54.5%) |
| Computers, Engineering & Science | 239 (49.4%) | 245 (50.6%) |
| Computers & Mathematics | 87 (52.1%) | 80 (47.9%) |
| Architecture & Engineering | 123 (82.0%) | 27 (18.0%) |
| Life, Physical & Social Science | 29 (17.4%) | 138 (82.6%) |
| Community & Social Service | 372 (38.6%) | 593 (61.5%) |
| Education, Arts & Media | 10 (20.4%) | 39 (79.6%) |
| Legal Services & Support | 104 (67.5%) | 50 (32.5%) |
| Education Instruction & Library | 122 (27.1%) | 329 (73.0%) |
| Arts, Media & Entertainment | 136 (43.7%) | 175 (56.3%) |
| Health Diagnosing & Treating | 48 (15.4%) | 264 (84.6%) |
| Health Technologists | 48 (18.6%) | 210 (81.4%) |
| Total (Category) | 1,784 (48.6%) | 1,885 (51.4%) |
| Total (Overall) | 4,056 (54.8%) | 3,351 (45.2%) |
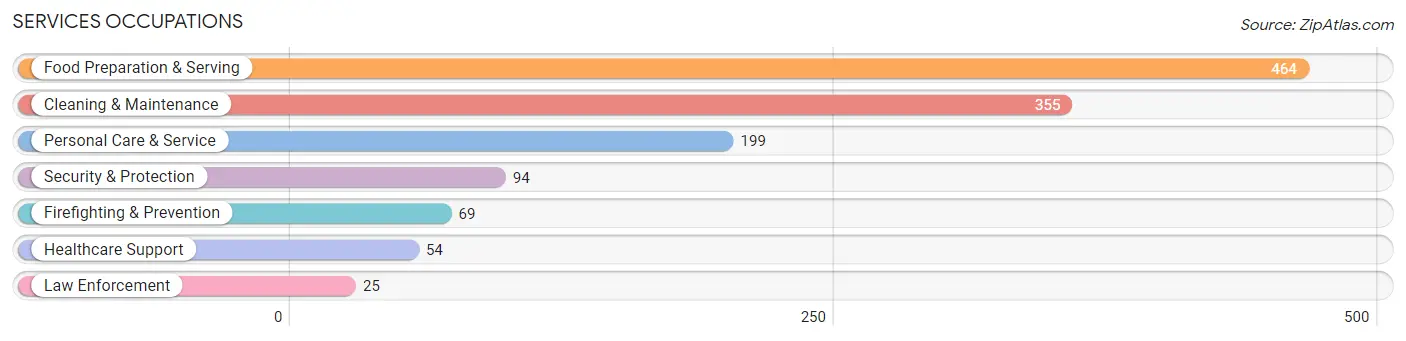
Services Occupations
The most common Services occupations in Steamboat Springs are Food Preparation & Serving (464 | 6.3%), Cleaning & Maintenance (355 | 4.8%), Personal Care & Service (199 | 2.7%), Security & Protection (94 | 1.3%), and Firefighting & Prevention (69 | 0.9%).
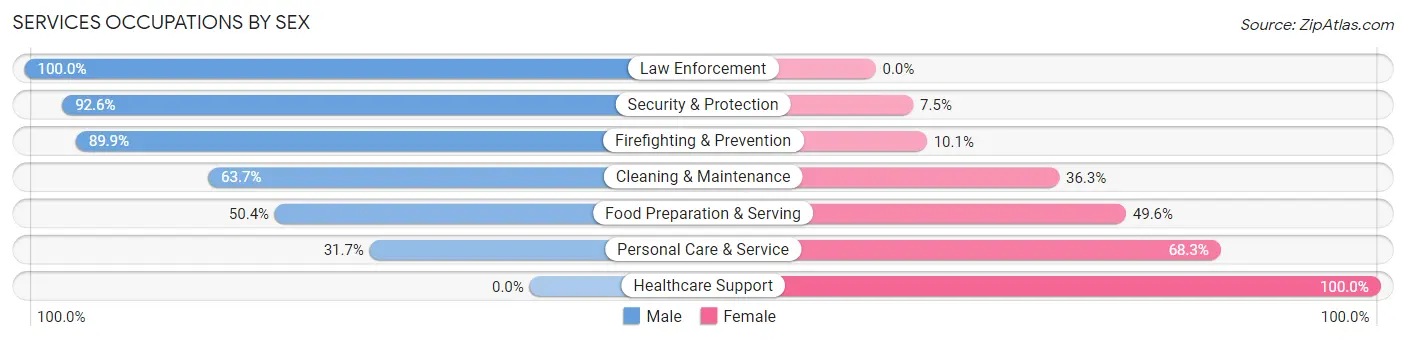
Services Occupations by Sex
Within the Services occupations in Steamboat Springs, the most male-oriented occupations are Law Enforcement (100.0%), Security & Protection (92.5%), and Firefighting & Prevention (89.9%), while the most female-oriented occupations are Healthcare Support (100.0%), Personal Care & Service (68.3%), and Food Preparation & Serving (49.6%).
| Occupation | Male | Female |
| Healthcare Support | 0 (0.0%) | 54 (100.0%) |
| Security & Protection | 87 (92.5%) | 7 (7.4%) |
| Firefighting & Prevention | 62 (89.9%) | 7 (10.1%) |
| Law Enforcement | 25 (100.0%) | 0 (0.0%) |
| Food Preparation & Serving | 234 (50.4%) | 230 (49.6%) |
| Cleaning & Maintenance | 226 (63.7%) | 129 (36.3%) |
| Personal Care & Service | 63 (31.7%) | 136 (68.3%) |
| Total (Category) | 610 (52.3%) | 556 (47.7%) |
| Total (Overall) | 4,056 (54.8%) | 3,351 (45.2%) |
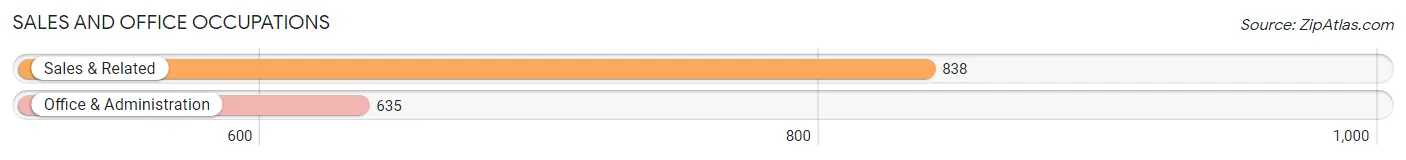
Sales and Office Occupations
The most common Sales and Office occupations in Steamboat Springs are Sales & Related (838 | 11.3%), and Office & Administration (635 | 8.6%).
Sales and Office Occupations by Sex
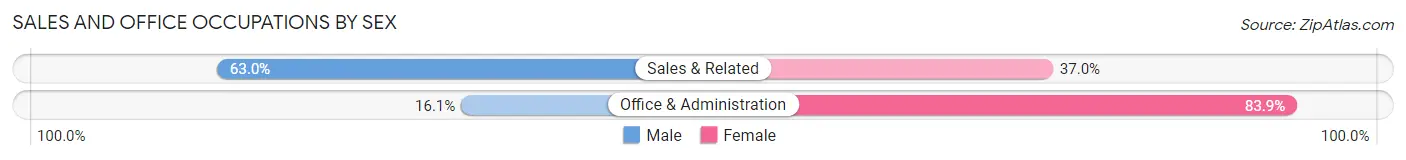
| Occupation | Male | Female |
| Sales & Related | 528 (63.0%) | 310 (37.0%) |
| Office & Administration | 102 (16.1%) | 533 (83.9%) |
| Total (Category) | 630 (42.8%) | 843 (57.2%) |
| Total (Overall) | 4,056 (54.8%) | 3,351 (45.2%) |
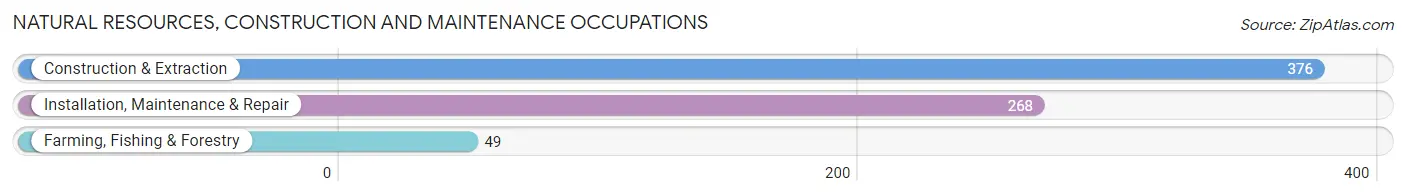
Natural Resources, Construction and Maintenance Occupations
The most common Natural Resources, Construction and Maintenance occupations in Steamboat Springs are Construction & Extraction (376 | 5.1%), Installation, Maintenance & Repair (268 | 3.6%), and Farming, Fishing & Forestry (49 | 0.7%).
Natural Resources, Construction and Maintenance Occupations by Sex
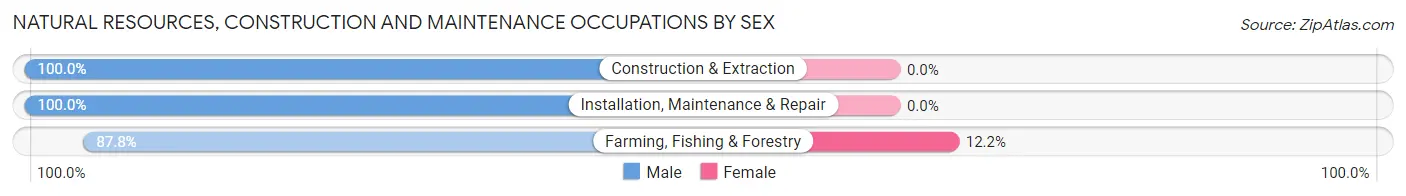
| Occupation | Male | Female |
| Farming, Fishing & Forestry | 43 (87.8%) | 6 (12.2%) |
| Construction & Extraction | 376 (100.0%) | 0 (0.0%) |
| Installation, Maintenance & Repair | 268 (100.0%) | 0 (0.0%) |
| Total (Category) | 687 (99.1%) | 6 (0.9%) |
| Total (Overall) | 4,056 (54.8%) | 3,351 (45.2%) |
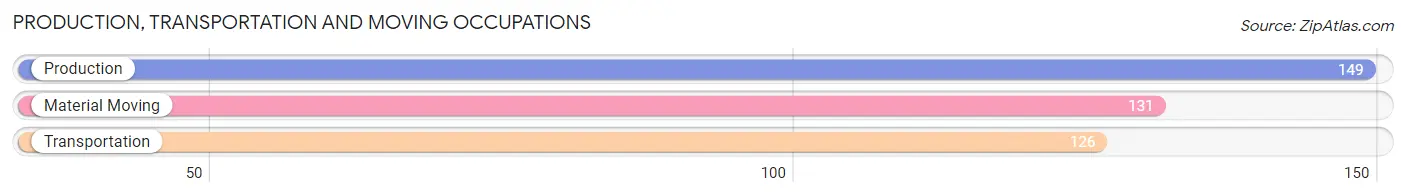
Production, Transportation and Moving Occupations
The most common Production, Transportation and Moving occupations in Steamboat Springs are Production (149 | 2.0%), Material Moving (131 | 1.8%), and Transportation (126 | 1.7%).
Production, Transportation and Moving Occupations by Sex
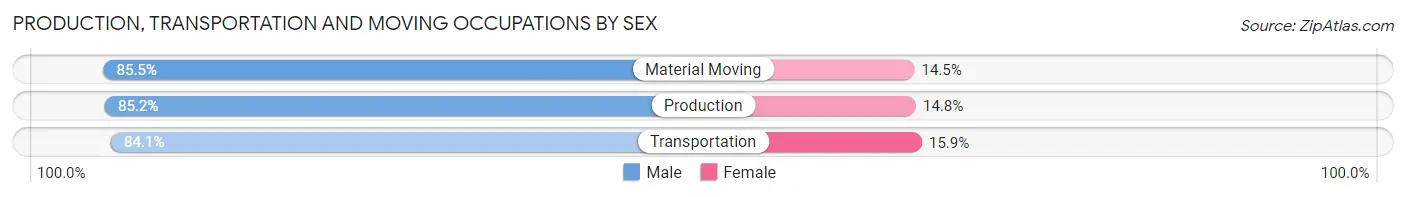
| Occupation | Male | Female |
| Production | 127 (85.2%) | 22 (14.8%) |
| Transportation | 106 (84.1%) | 20 (15.9%) |
| Material Moving | 112 (85.5%) | 19 (14.5%) |
| Total (Category) | 345 (85.0%) | 61 (15.0%) |
| Total (Overall) | 4,056 (54.8%) | 3,351 (45.2%) |
Employment Industries by Sex in Steamboat Springs
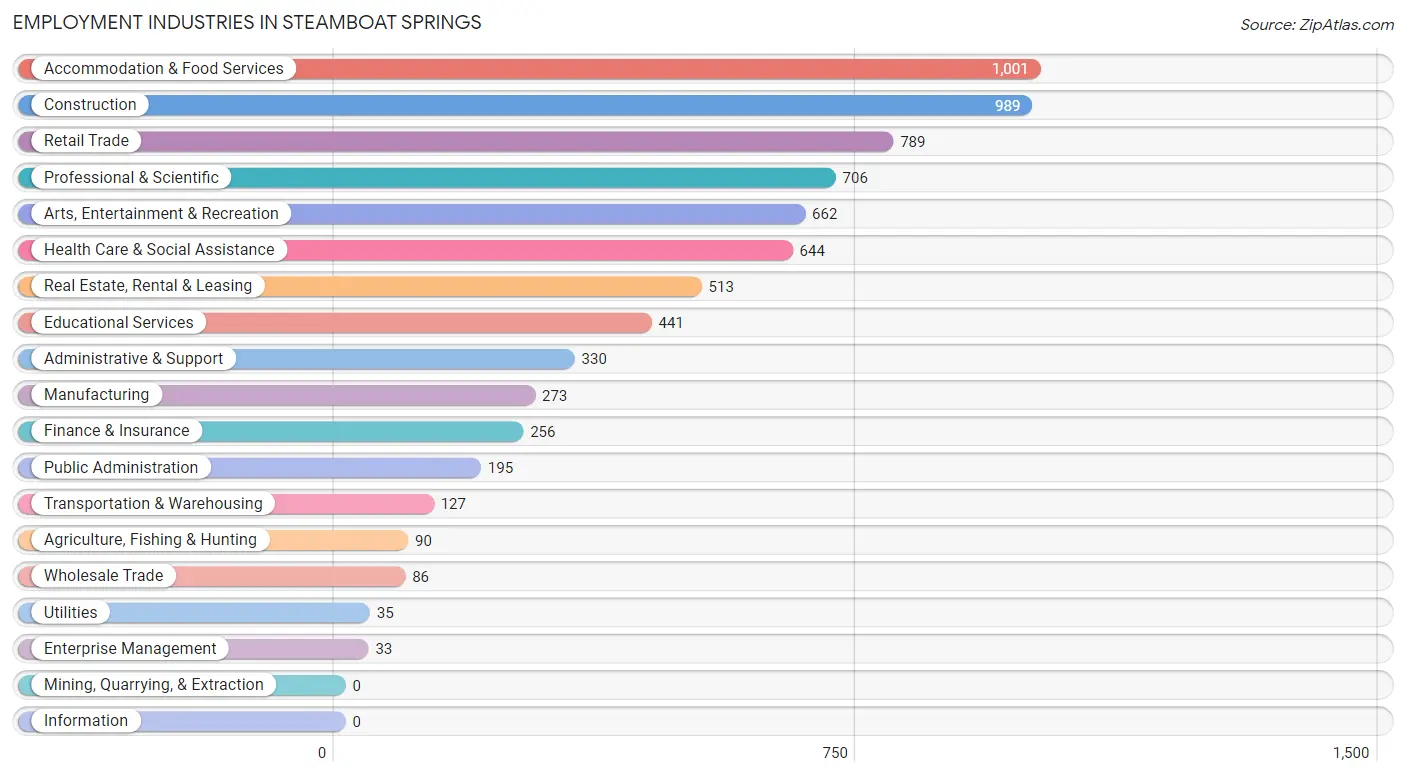
Employment Industries in Steamboat Springs
The major employment industries in Steamboat Springs include Accommodation & Food Services (1,001 | 13.5%), Construction (989 | 13.4%), Retail Trade (789 | 10.6%), Professional & Scientific (706 | 9.5%), and Arts, Entertainment & Recreation (662 | 8.9%).
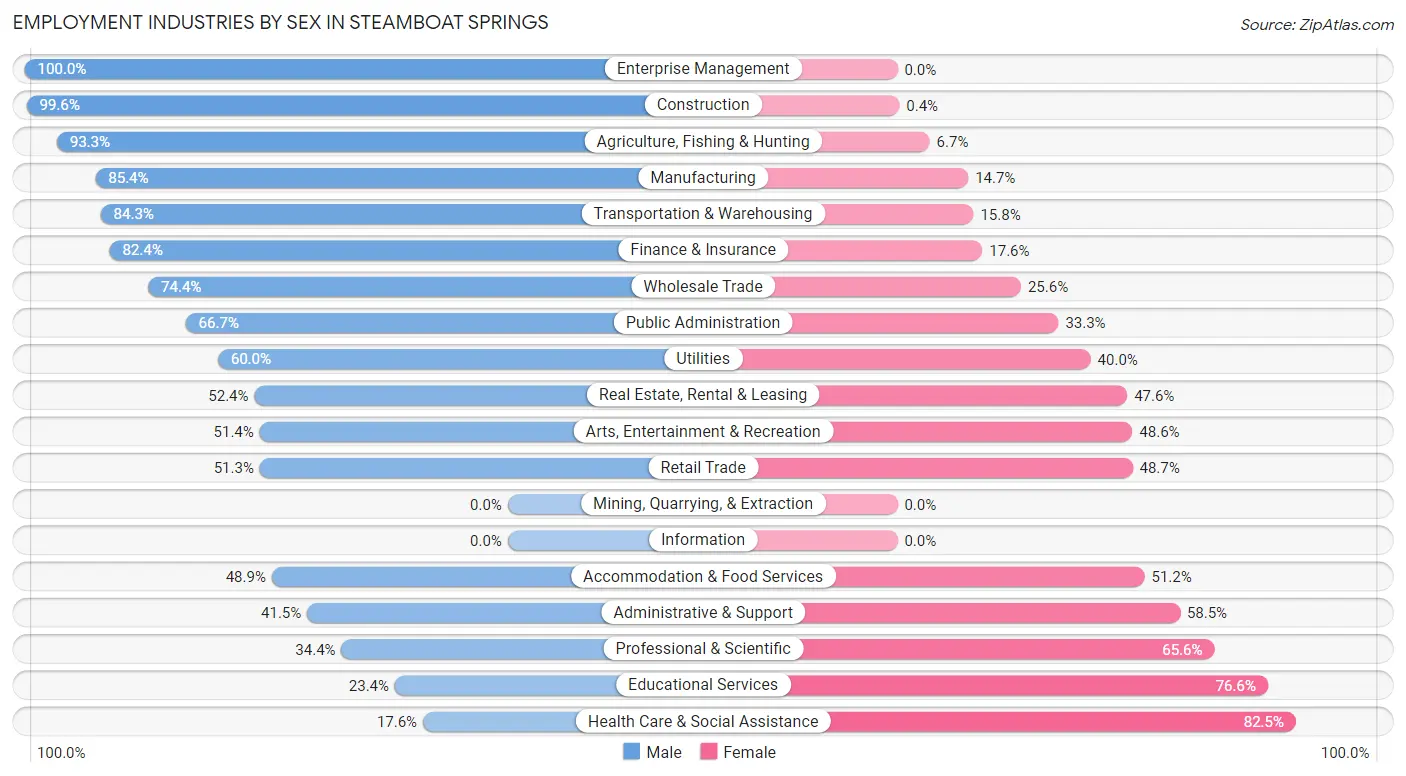
Employment Industries by Sex in Steamboat Springs
The Steamboat Springs industries that see more men than women are Enterprise Management (100.0%), Construction (99.6%), and Agriculture, Fishing & Hunting (93.3%), whereas the industries that tend to have a higher number of women are Health Care & Social Assistance (82.5%), Educational Services (76.6%), and Professional & Scientific (65.6%).
| Industry | Male | Female |
| Agriculture, Fishing & Hunting | 84 (93.3%) | 6 (6.7%) |
| Mining, Quarrying, & Extraction | 0 (0.0%) | 0 (0.0%) |
| Construction | 985 (99.6%) | 4 (0.4%) |
| Manufacturing | 233 (85.4%) | 40 (14.6%) |
| Wholesale Trade | 64 (74.4%) | 22 (25.6%) |
| Retail Trade | 405 (51.3%) | 384 (48.7%) |
| Transportation & Warehousing | 107 (84.3%) | 20 (15.8%) |
| Utilities | 21 (60.0%) | 14 (40.0%) |
| Information | 0 (0.0%) | 0 (0.0%) |
| Finance & Insurance | 211 (82.4%) | 45 (17.6%) |
| Real Estate, Rental & Leasing | 269 (52.4%) | 244 (47.6%) |
| Professional & Scientific | 243 (34.4%) | 463 (65.6%) |
| Enterprise Management | 33 (100.0%) | 0 (0.0%) |
| Administrative & Support | 137 (41.5%) | 193 (58.5%) |
| Educational Services | 103 (23.4%) | 338 (76.6%) |
| Health Care & Social Assistance | 113 (17.5%) | 531 (82.5%) |
| Arts, Entertainment & Recreation | 340 (51.4%) | 322 (48.6%) |
| Accommodation & Food Services | 489 (48.8%) | 512 (51.1%) |
| Public Administration | 130 (66.7%) | 65 (33.3%) |
| Total | 4,056 (54.8%) | 3,351 (45.2%) |
Education in Steamboat Springs
School Enrollment in Steamboat Springs
The most common levels of schooling among the 2,487 students in Steamboat Springs are college / undergraduate (566 | 22.8%), high school (545 | 21.9%), and elementary school (535 | 21.5%).
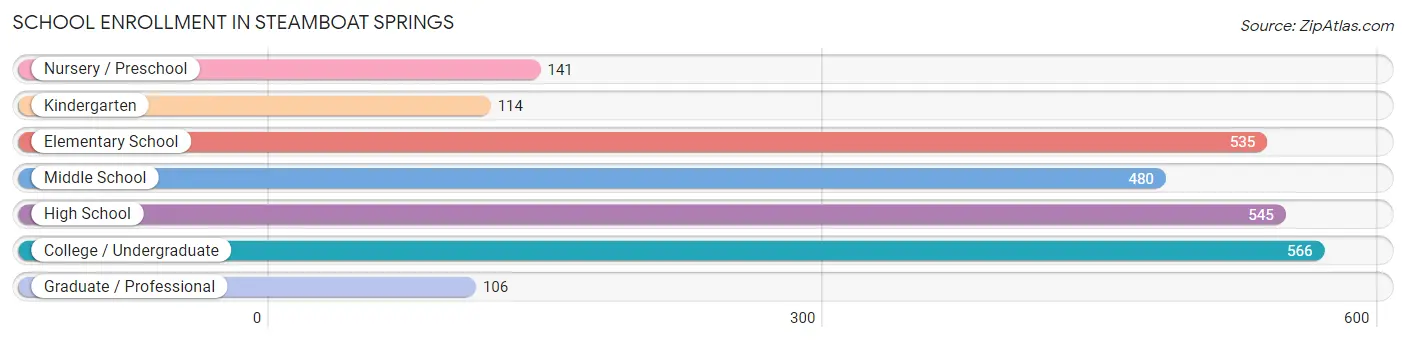
| School Level | # Students | % Students |
| Nursery / Preschool | 141 | 5.7% |
| Kindergarten | 114 | 4.6% |
| Elementary School | 535 | 21.5% |
| Middle School | 480 | 19.3% |
| High School | 545 | 21.9% |
| College / Undergraduate | 566 | 22.8% |
| Graduate / Professional | 106 | 4.3% |
| Total | 2,487 | 100.0% |
School Enrollment by Age by Funding Source in Steamboat Springs
Out of a total of 2,487 students who are enrolled in schools in Steamboat Springs, 169 (6.8%) attend a private institution, while the remaining 2,318 (93.2%) are enrolled in public schools. The age group of 3 to 4 year olds has the highest likelihood of being enrolled in private schools, with 59 (49.2% in the age bracket) enrolled. Conversely, the age group of 20 to 24 year olds has the lowest likelihood of being enrolled in a private school, with 254 (100.0% in the age bracket) attending a public institution.
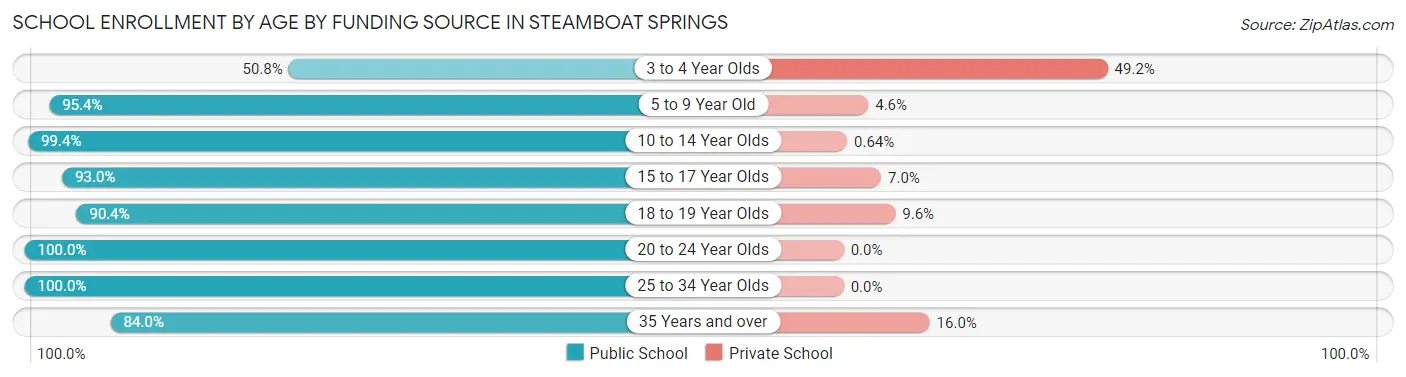
| Age Bracket | Public School | Private School |
| 3 to 4 Year Olds | 61 (50.8%) | 59 (49.2%) |
| 5 to 9 Year Old | 541 (95.4%) | 26 (4.6%) |
| 10 to 14 Year Olds | 622 (99.4%) | 4 (0.6%) |
| 15 to 17 Year Olds | 414 (93.0%) | 31 (7.0%) |
| 18 to 19 Year Olds | 197 (90.4%) | 21 (9.6%) |
| 20 to 24 Year Olds | 254 (100.0%) | 0 (0.0%) |
| 25 to 34 Year Olds | 76 (100.0%) | 0 (0.0%) |
| 35 Years and over | 152 (84.0%) | 29 (16.0%) |
| Total | 2,318 (93.2%) | 169 (6.8%) |
Educational Attainment by Field of Study in Steamboat Springs
Business (1,204 | 19.7%), science & technology (779 | 12.8%), bio, nature & agricultural (522 | 8.6%), social sciences (520 | 8.5%), and physical & health sciences (488 | 8.0%) are the most common fields of study among 6,098 individuals in Steamboat Springs who have obtained a bachelor's degree or higher.
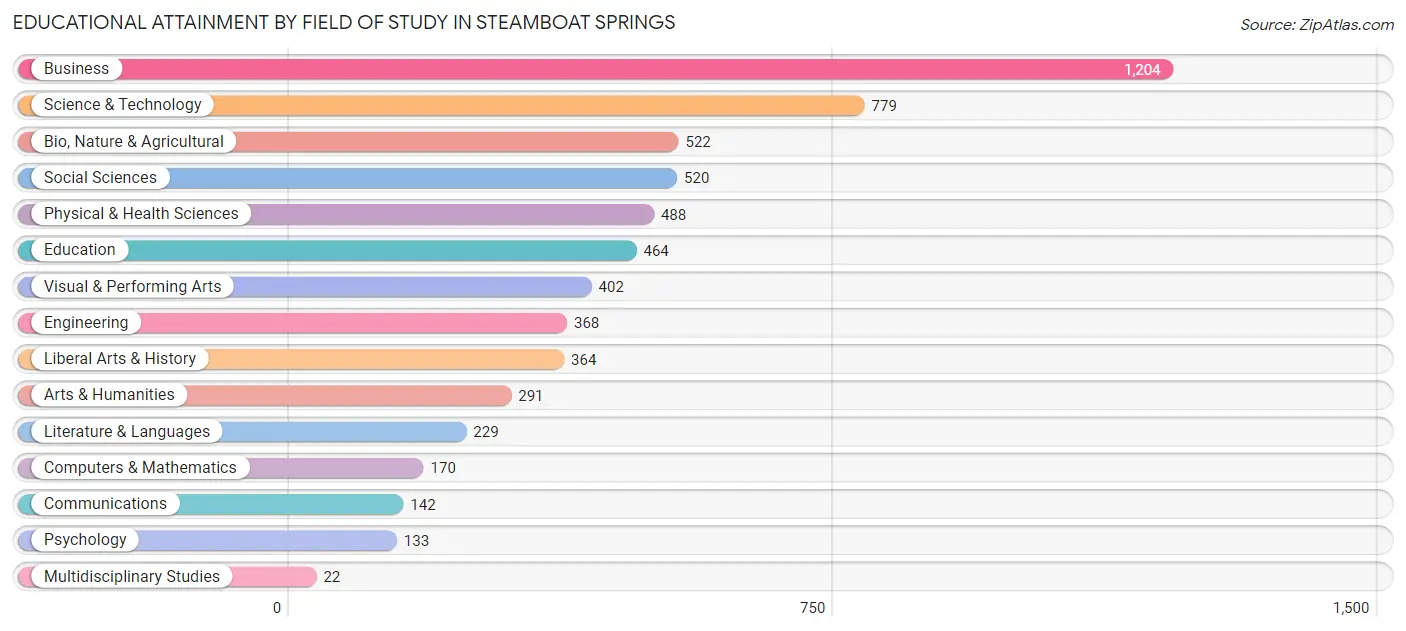
| Field of Study | # Graduates | % Graduates |
| Computers & Mathematics | 170 | 2.8% |
| Bio, Nature & Agricultural | 522 | 8.6% |
| Physical & Health Sciences | 488 | 8.0% |
| Psychology | 133 | 2.2% |
| Social Sciences | 520 | 8.5% |
| Engineering | 368 | 6.0% |
| Multidisciplinary Studies | 22 | 0.4% |
| Science & Technology | 779 | 12.8% |
| Business | 1,204 | 19.7% |
| Education | 464 | 7.6% |
| Literature & Languages | 229 | 3.8% |
| Liberal Arts & History | 364 | 6.0% |
| Visual & Performing Arts | 402 | 6.6% |
| Communications | 142 | 2.3% |
| Arts & Humanities | 291 | 4.8% |
| Total | 6,098 | 100.0% |
Transportation & Commute in Steamboat Springs
Vehicle Availability by Sex in Steamboat Springs
The most prevalent vehicle ownership categories in Steamboat Springs are males with 2 vehicles (1,684, accounting for 41.9%) and females with 2 vehicles (1,359, making up 50.9%).
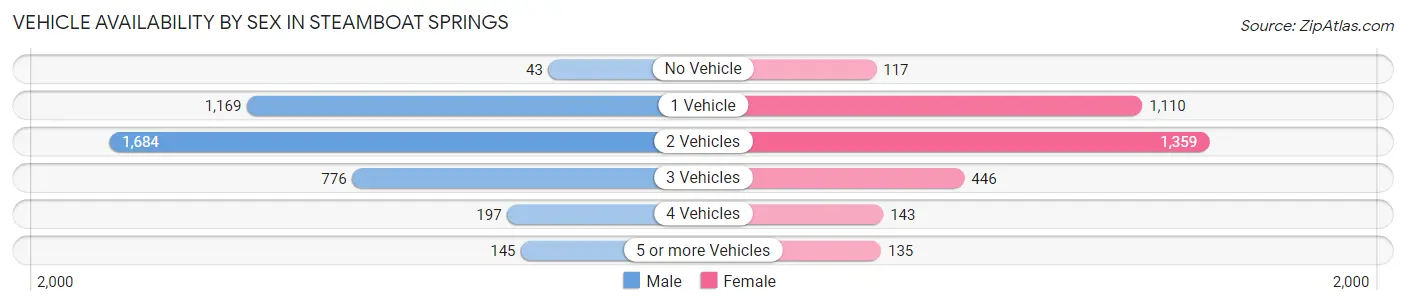
| Vehicles Available | Male | Female |
| No Vehicle | 43 (1.1%) | 117 (3.5%) |
| 1 Vehicle | 1,169 (29.1%) | 1,110 (33.5%) |
| 2 Vehicles | 1,684 (41.9%) | 1,359 (41.1%) |
| 3 Vehicles | 776 (19.3%) | 446 (13.5%) |
| 4 Vehicles | 197 (4.9%) | 143 (4.3%) |
| 5 or more Vehicles | 145 (3.6%) | 135 (4.1%) |
| Total | 4,014 (100.0%) | 3,310 (100.0%) |
Commute Time in Steamboat Springs
The most frequently occuring commute durations in Steamboat Springs are 5 to 9 minutes (2,055 commuters, 33.1%), 10 to 14 minutes (1,467 commuters, 23.6%), and 15 to 19 minutes (840 commuters, 13.5%).
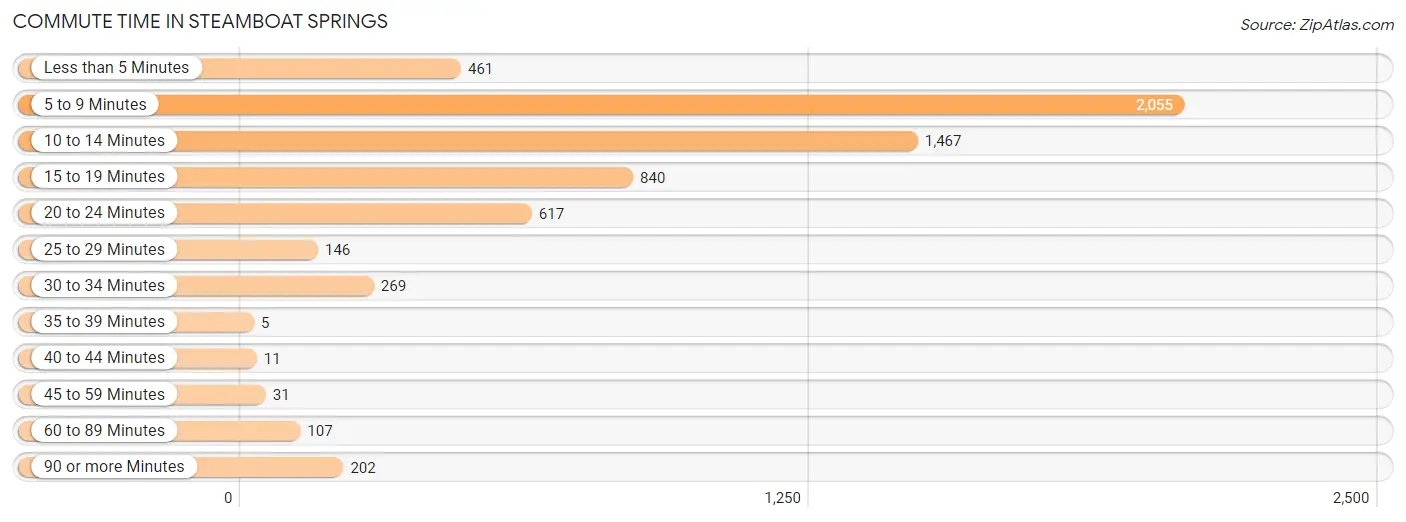
| Commute Time | # Commuters | % Commuters |
| Less than 5 Minutes | 461 | 7.4% |
| 5 to 9 Minutes | 2,055 | 33.1% |
| 10 to 14 Minutes | 1,467 | 23.6% |
| 15 to 19 Minutes | 840 | 13.5% |
| 20 to 24 Minutes | 617 | 9.9% |
| 25 to 29 Minutes | 146 | 2.4% |
| 30 to 34 Minutes | 269 | 4.3% |
| 35 to 39 Minutes | 5 | 0.1% |
| 40 to 44 Minutes | 11 | 0.2% |
| 45 to 59 Minutes | 31 | 0.5% |
| 60 to 89 Minutes | 107 | 1.7% |
| 90 or more Minutes | 202 | 3.3% |
Commute Time by Sex in Steamboat Springs
The most common commute times in Steamboat Springs are 5 to 9 minutes (1,251 commuters, 38.4%) for males and 5 to 9 minutes (804 commuters, 27.3%) for females.
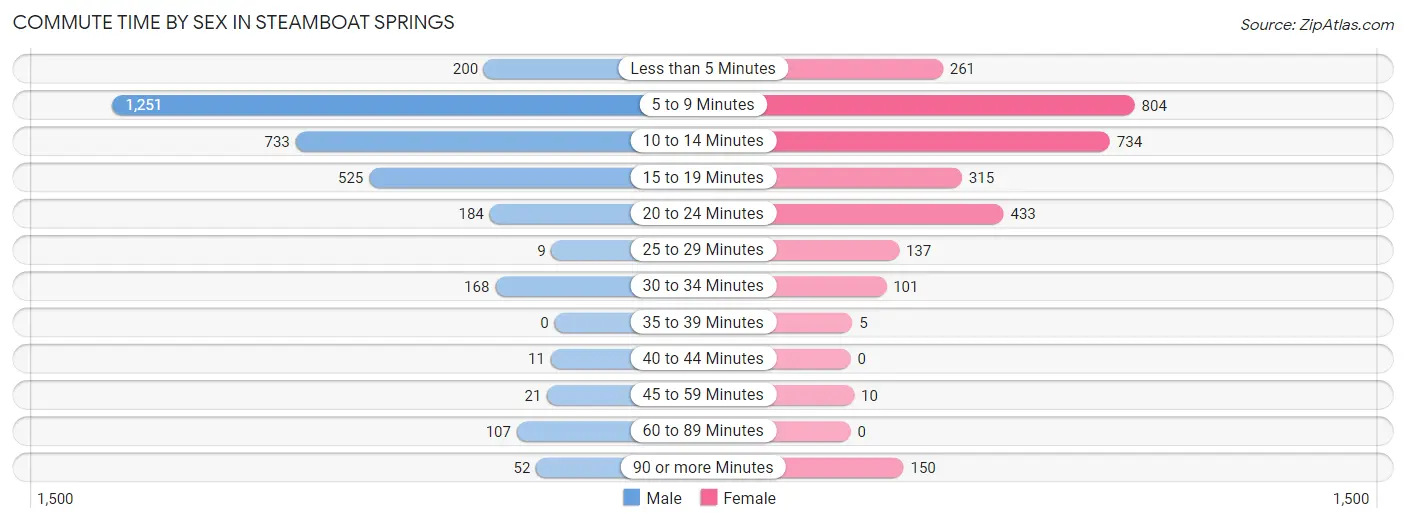
| Commute Time | Male | Female |
| Less than 5 Minutes | 200 (6.1%) | 261 (8.8%) |
| 5 to 9 Minutes | 1,251 (38.4%) | 804 (27.3%) |
| 10 to 14 Minutes | 733 (22.5%) | 734 (24.9%) |
| 15 to 19 Minutes | 525 (16.1%) | 315 (10.7%) |
| 20 to 24 Minutes | 184 (5.6%) | 433 (14.7%) |
| 25 to 29 Minutes | 9 (0.3%) | 137 (4.6%) |
| 30 to 34 Minutes | 168 (5.1%) | 101 (3.4%) |
| 35 to 39 Minutes | 0 (0.0%) | 5 (0.2%) |
| 40 to 44 Minutes | 11 (0.3%) | 0 (0.0%) |
| 45 to 59 Minutes | 21 (0.6%) | 10 (0.3%) |
| 60 to 89 Minutes | 107 (3.3%) | 0 (0.0%) |
| 90 or more Minutes | 52 (1.6%) | 150 (5.1%) |
Time of Departure to Work by Sex in Steamboat Springs
The most frequent times of departure to work in Steamboat Springs are 7:30 AM to 7:59 AM (773, 23.7%) for males and 7:30 AM to 7:59 AM (788, 26.7%) for females.
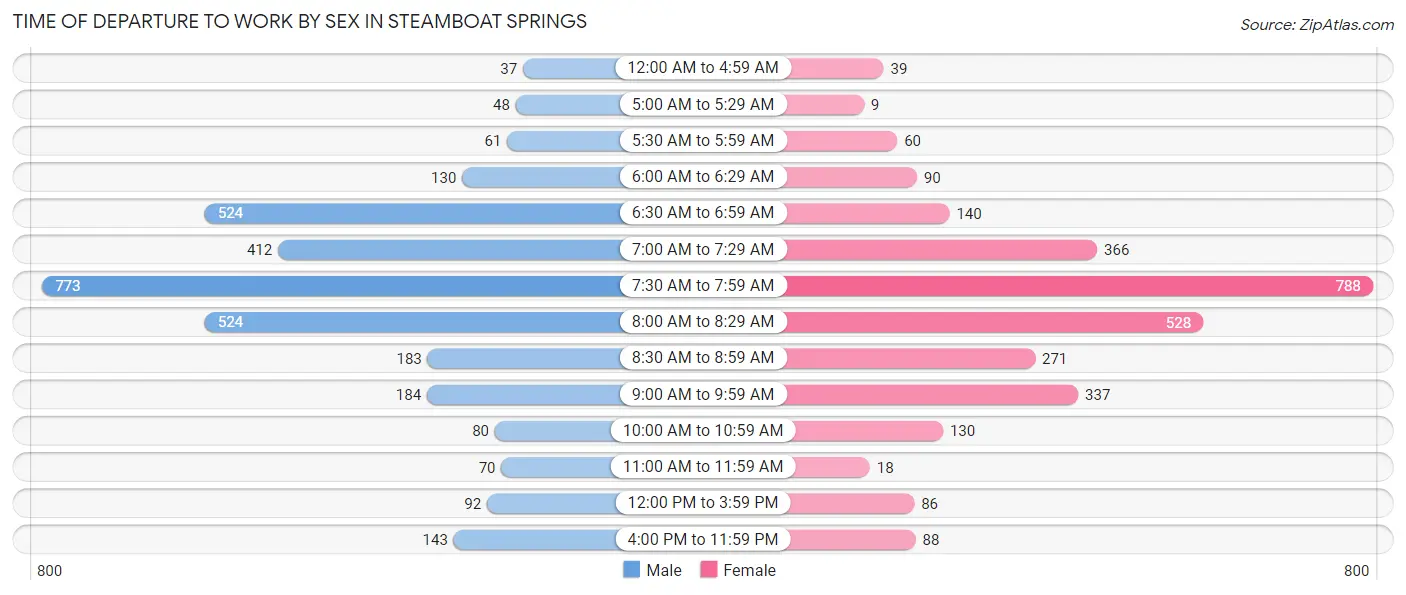
| Time of Departure | Male | Female |
| 12:00 AM to 4:59 AM | 37 (1.1%) | 39 (1.3%) |
| 5:00 AM to 5:29 AM | 48 (1.5%) | 9 (0.3%) |
| 5:30 AM to 5:59 AM | 61 (1.9%) | 60 (2.0%) |
| 6:00 AM to 6:29 AM | 130 (4.0%) | 90 (3.0%) |
| 6:30 AM to 6:59 AM | 524 (16.1%) | 140 (4.8%) |
| 7:00 AM to 7:29 AM | 412 (12.6%) | 366 (12.4%) |
| 7:30 AM to 7:59 AM | 773 (23.7%) | 788 (26.7%) |
| 8:00 AM to 8:29 AM | 524 (16.1%) | 528 (17.9%) |
| 8:30 AM to 8:59 AM | 183 (5.6%) | 271 (9.2%) |
| 9:00 AM to 9:59 AM | 184 (5.6%) | 337 (11.4%) |
| 10:00 AM to 10:59 AM | 80 (2.5%) | 130 (4.4%) |
| 11:00 AM to 11:59 AM | 70 (2.1%) | 18 (0.6%) |
| 12:00 PM to 3:59 PM | 92 (2.8%) | 86 (2.9%) |
| 4:00 PM to 11:59 PM | 143 (4.4%) | 88 (3.0%) |
| Total | 3,261 (100.0%) | 2,950 (100.0%) |
Housing Occupancy in Steamboat Springs
Occupancy by Ownership in Steamboat Springs
Of the total 5,738 dwellings in Steamboat Springs, owner-occupied units account for 4,057 (70.7%), while renter-occupied units make up 1,681 (29.3%).
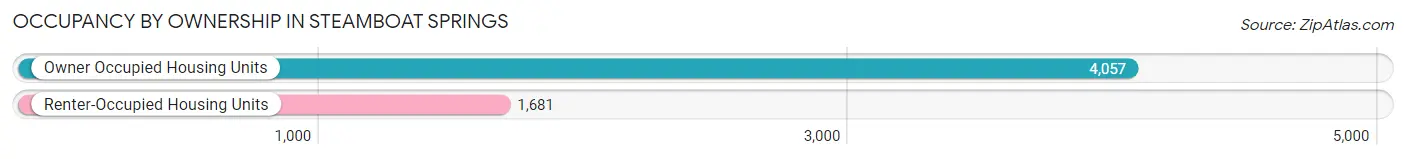
| Occupancy | # Housing Units | % Housing Units |
| Owner Occupied Housing Units | 4,057 | 70.7% |
| Renter-Occupied Housing Units | 1,681 | 29.3% |
| Total Occupied Housing Units | 5,738 | 100.0% |
Occupancy by Household Size in Steamboat Springs
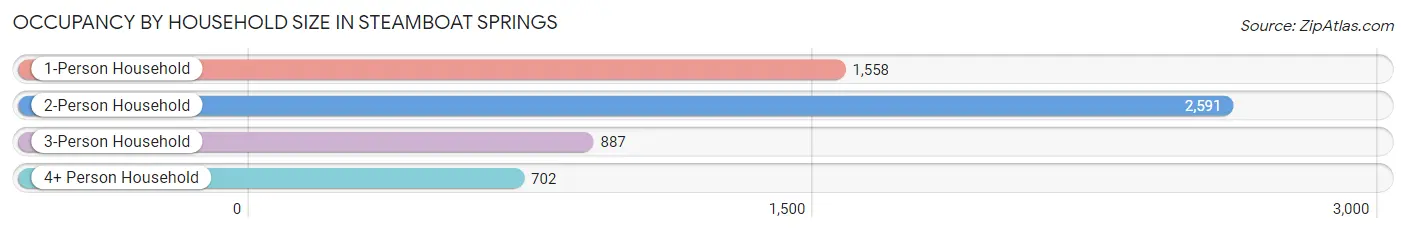
| Household Size | # Housing Units | % Housing Units |
| 1-Person Household | 1,558 | 27.2% |
| 2-Person Household | 2,591 | 45.2% |
| 3-Person Household | 887 | 15.5% |
| 4+ Person Household | 702 | 12.2% |
| Total Housing Units | 5,738 | 100.0% |
Occupancy by Ownership by Household Size in Steamboat Springs
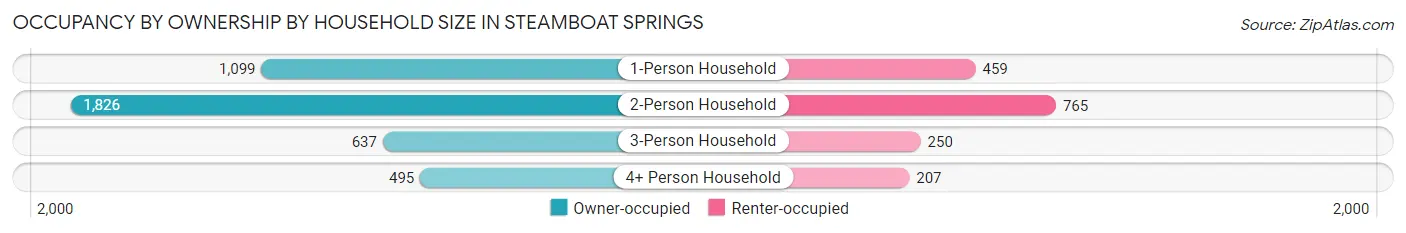
| Household Size | Owner-occupied | Renter-occupied |
| 1-Person Household | 1,099 (70.5%) | 459 (29.5%) |
| 2-Person Household | 1,826 (70.5%) | 765 (29.5%) |
| 3-Person Household | 637 (71.8%) | 250 (28.2%) |
| 4+ Person Household | 495 (70.5%) | 207 (29.5%) |
| Total Housing Units | 4,057 (70.7%) | 1,681 (29.3%) |
Occupancy by Educational Attainment in Steamboat Springs
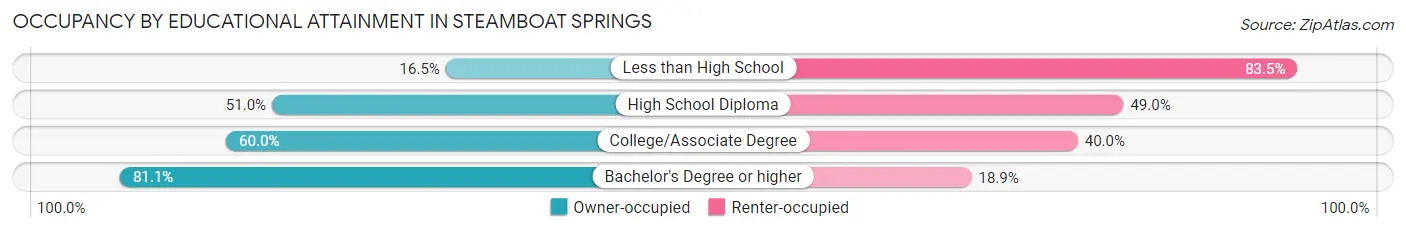
| Household Size | Owner-occupied | Renter-occupied |
| Less than High School | 19 (16.5%) | 96 (83.5%) |
| High School Diploma | 314 (51.0%) | 302 (49.0%) |
| College/Associate Degree | 958 (60.0%) | 638 (40.0%) |
| Bachelor's Degree or higher | 2,766 (81.1%) | 645 (18.9%) |
Occupancy by Age of Householder in Steamboat Springs
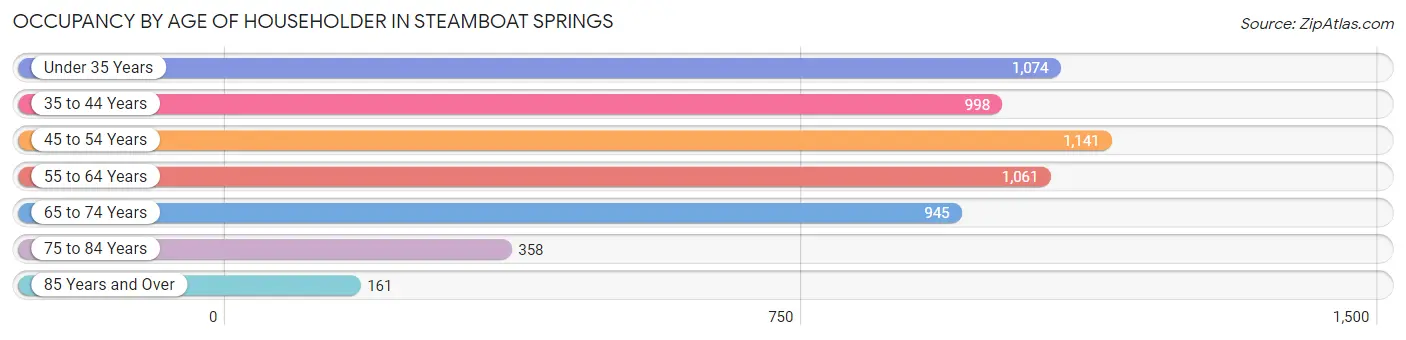
| Age Bracket | # Households | % Households |
| Under 35 Years | 1,074 | 18.7% |
| 35 to 44 Years | 998 | 17.4% |
| 45 to 54 Years | 1,141 | 19.9% |
| 55 to 64 Years | 1,061 | 18.5% |
| 65 to 74 Years | 945 | 16.5% |
| 75 to 84 Years | 358 | 6.2% |
| 85 Years and Over | 161 | 2.8% |
| Total | 5,738 | 100.0% |
Housing Finances in Steamboat Springs
Median Income by Occupancy in Steamboat Springs
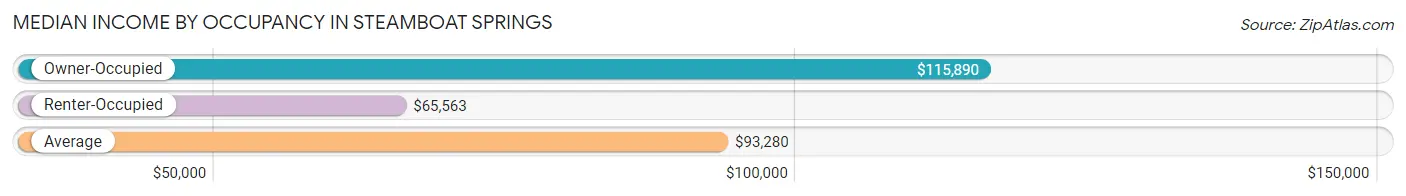
| Occupancy Type | # Households | Median Income |
| Owner-Occupied | 4,057 (70.7%) | $115,890 |
| Renter-Occupied | 1,681 (29.3%) | $65,563 |
| Average | 5,738 (100.0%) | $93,280 |
Occupancy by Householder Income Bracket in Steamboat Springs
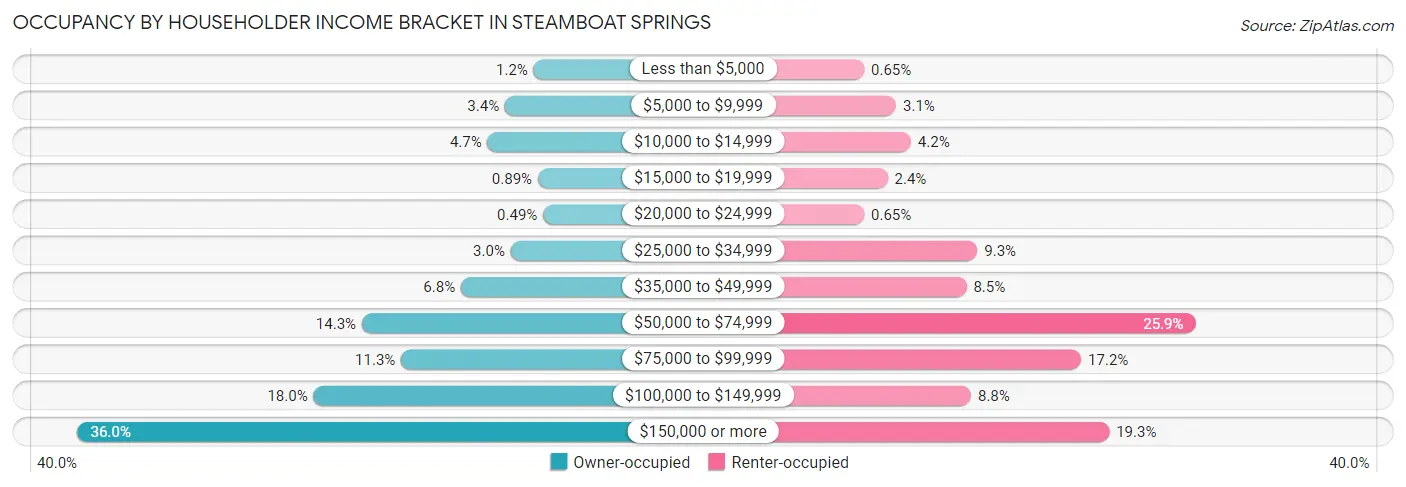
| Income Bracket | Owner-occupied | Renter-occupied |
| Less than $5,000 | 49 (1.2%) | 11 (0.6%) |
| $5,000 to $9,999 | 138 (3.4%) | 52 (3.1%) |
| $10,000 to $14,999 | 192 (4.7%) | 71 (4.2%) |
| $15,000 to $19,999 | 36 (0.9%) | 41 (2.4%) |
| $20,000 to $24,999 | 20 (0.5%) | 11 (0.6%) |
| $25,000 to $34,999 | 120 (3.0%) | 156 (9.3%) |
| $35,000 to $49,999 | 274 (6.8%) | 142 (8.5%) |
| $50,000 to $74,999 | 580 (14.3%) | 435 (25.9%) |
| $75,000 to $99,999 | 459 (11.3%) | 289 (17.2%) |
| $100,000 to $149,999 | 730 (18.0%) | 148 (8.8%) |
| $150,000 or more | 1,459 (36.0%) | 325 (19.3%) |
| Total | 4,057 (100.0%) | 1,681 (100.0%) |
Monthly Housing Cost Tiers in Steamboat Springs
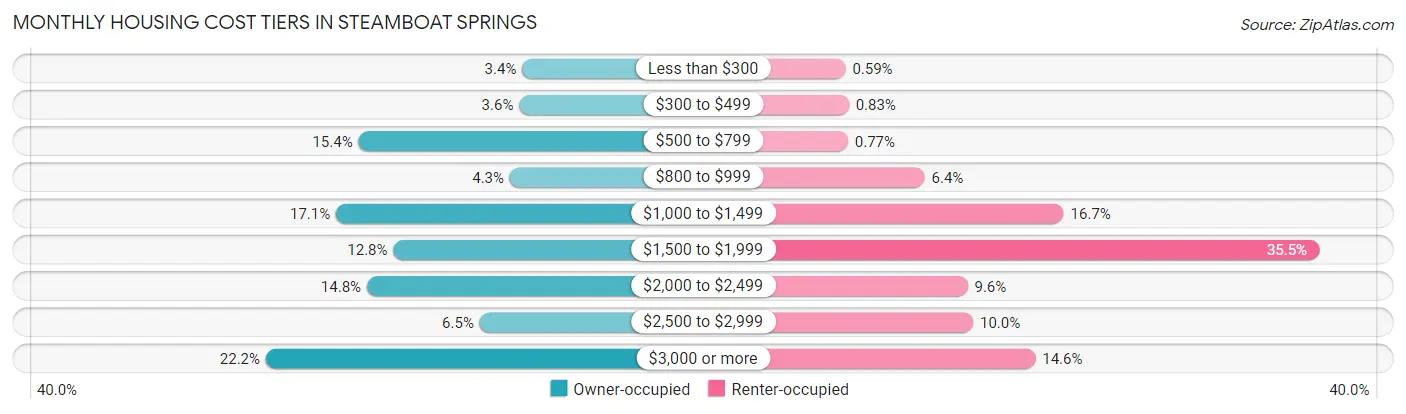
| Monthly Cost | Owner-occupied | Renter-occupied |
| Less than $300 | 136 (3.4%) | 10 (0.6%) |
| $300 to $499 | 145 (3.6%) | 14 (0.8%) |
| $500 to $799 | 625 (15.4%) | 13 (0.8%) |
| $800 to $999 | 173 (4.3%) | 108 (6.4%) |
| $1,000 to $1,499 | 692 (17.1%) | 280 (16.7%) |
| $1,500 to $1,999 | 521 (12.8%) | 596 (35.5%) |
| $2,000 to $2,499 | 600 (14.8%) | 161 (9.6%) |
| $2,500 to $2,999 | 263 (6.5%) | 168 (10.0%) |
| $3,000 or more | 902 (22.2%) | 245 (14.6%) |
| Total | 4,057 (100.0%) | 1,681 (100.0%) |
Physical Housing Characteristics in Steamboat Springs
Housing Structures in Steamboat Springs
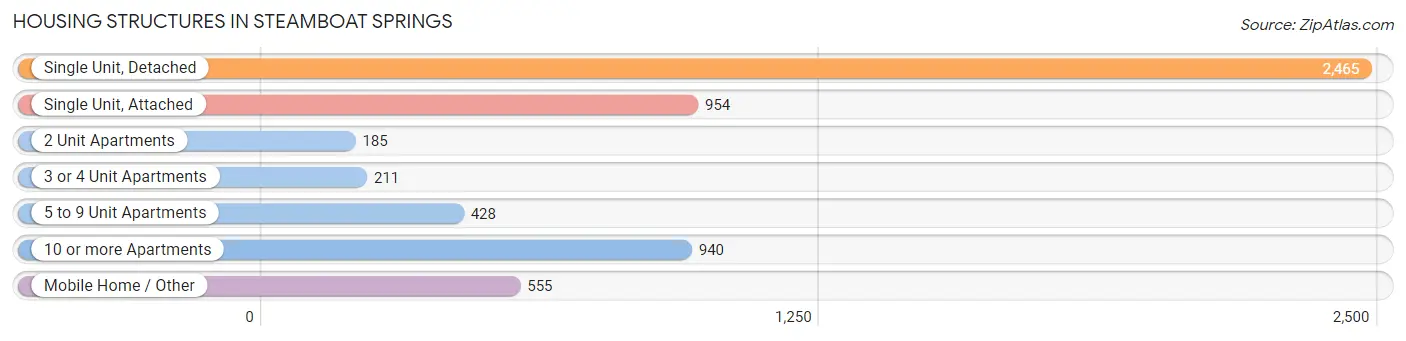
| Structure Type | # Housing Units | % Housing Units |
| Single Unit, Detached | 2,465 | 43.0% |
| Single Unit, Attached | 954 | 16.6% |
| 2 Unit Apartments | 185 | 3.2% |
| 3 or 4 Unit Apartments | 211 | 3.7% |
| 5 to 9 Unit Apartments | 428 | 7.5% |
| 10 or more Apartments | 940 | 16.4% |
| Mobile Home / Other | 555 | 9.7% |
| Total | 5,738 | 100.0% |
Housing Structures by Occupancy in Steamboat Springs
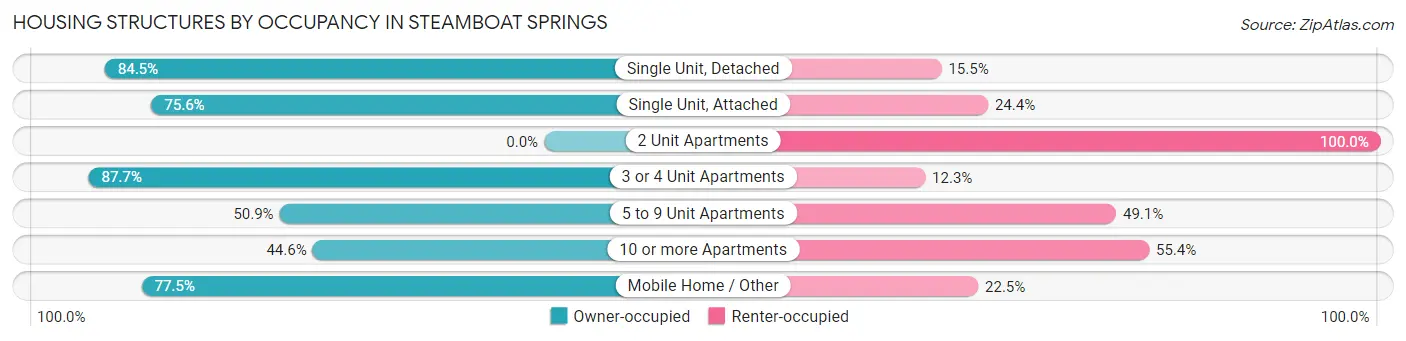
| Structure Type | Owner-occupied | Renter-occupied |
| Single Unit, Detached | 2,084 (84.5%) | 381 (15.5%) |
| Single Unit, Attached | 721 (75.6%) | 233 (24.4%) |
| 2 Unit Apartments | 0 (0.0%) | 185 (100.0%) |
| 3 or 4 Unit Apartments | 185 (87.7%) | 26 (12.3%) |
| 5 to 9 Unit Apartments | 218 (50.9%) | 210 (49.1%) |
| 10 or more Apartments | 419 (44.6%) | 521 (55.4%) |
| Mobile Home / Other | 430 (77.5%) | 125 (22.5%) |
| Total | 4,057 (70.7%) | 1,681 (29.3%) |
Housing Structures by Number of Rooms in Steamboat Springs
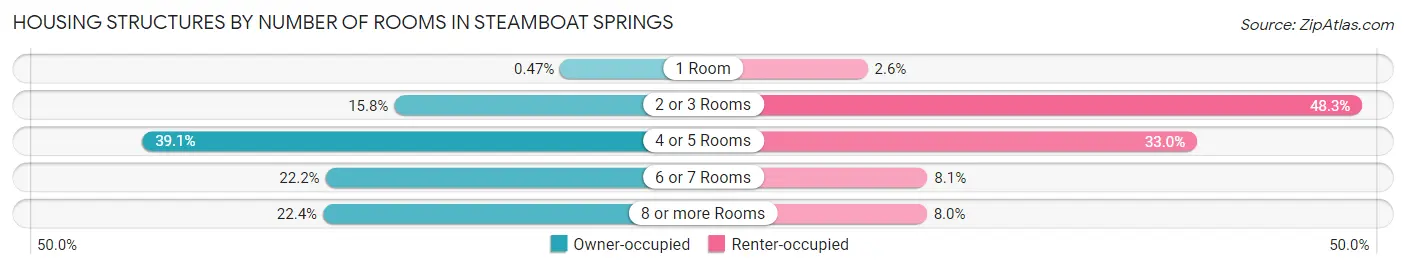
| Number of Rooms | Owner-occupied | Renter-occupied |
| 1 Room | 19 (0.5%) | 43 (2.6%) |
| 2 or 3 Rooms | 642 (15.8%) | 812 (48.3%) |
| 4 or 5 Rooms | 1,587 (39.1%) | 555 (33.0%) |
| 6 or 7 Rooms | 900 (22.2%) | 136 (8.1%) |
| 8 or more Rooms | 909 (22.4%) | 135 (8.0%) |
| Total | 4,057 (100.0%) | 1,681 (100.0%) |
Housing Structure by Heating Type in Steamboat Springs
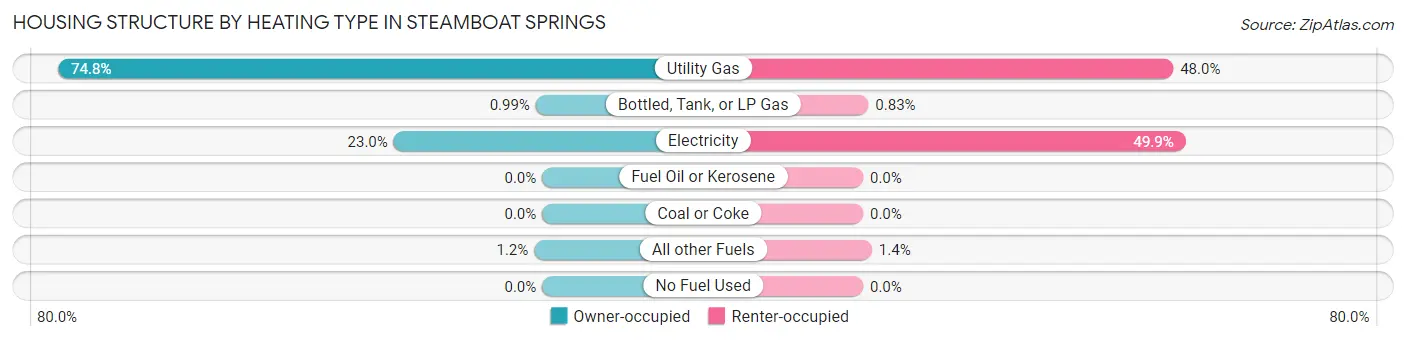
| Heating Type | Owner-occupied | Renter-occupied |
| Utility Gas | 3,036 (74.8%) | 806 (47.9%) |
| Bottled, Tank, or LP Gas | 40 (1.0%) | 14 (0.8%) |
| Electricity | 931 (23.0%) | 838 (49.8%) |
| Fuel Oil or Kerosene | 0 (0.0%) | 0 (0.0%) |
| Coal or Coke | 0 (0.0%) | 0 (0.0%) |
| All other Fuels | 50 (1.2%) | 23 (1.4%) |
| No Fuel Used | 0 (0.0%) | 0 (0.0%) |
| Total | 4,057 (100.0%) | 1,681 (100.0%) |
Household Vehicle Usage in Steamboat Springs
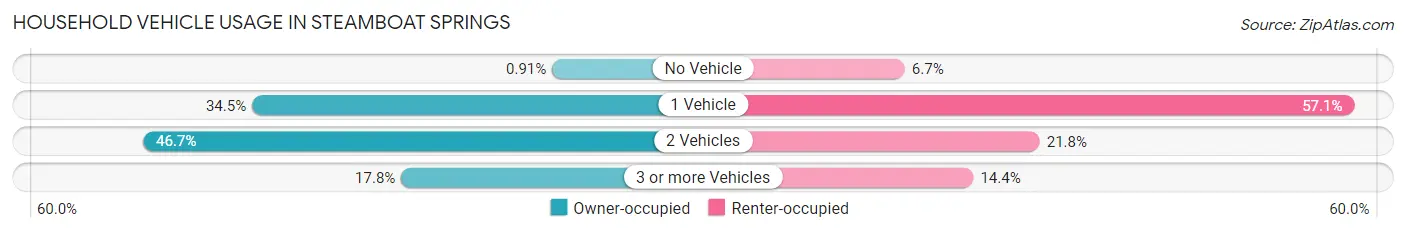
| Vehicles per Household | Owner-occupied | Renter-occupied |
| No Vehicle | 37 (0.9%) | 113 (6.7%) |
| 1 Vehicle | 1,401 (34.5%) | 959 (57.1%) |
| 2 Vehicles | 1,896 (46.7%) | 367 (21.8%) |
| 3 or more Vehicles | 723 (17.8%) | 242 (14.4%) |
| Total | 4,057 (100.0%) | 1,681 (100.0%) |
Real Estate & Mortgages in Steamboat Springs
Real Estate and Mortgage Overview in Steamboat Springs
| Characteristic | Without Mortgage | With Mortgage |
| Housing Units | 1,351 | 2,706 |
| Median Property Value | $842,200 | $747,500 |
| Median Household Income | $79,250 | $1,170 |
| Monthly Housing Costs | $739 | $902 |
| Real Estate Taxes | $2,854 | $25 |
Property Value by Mortgage Status in Steamboat Springs
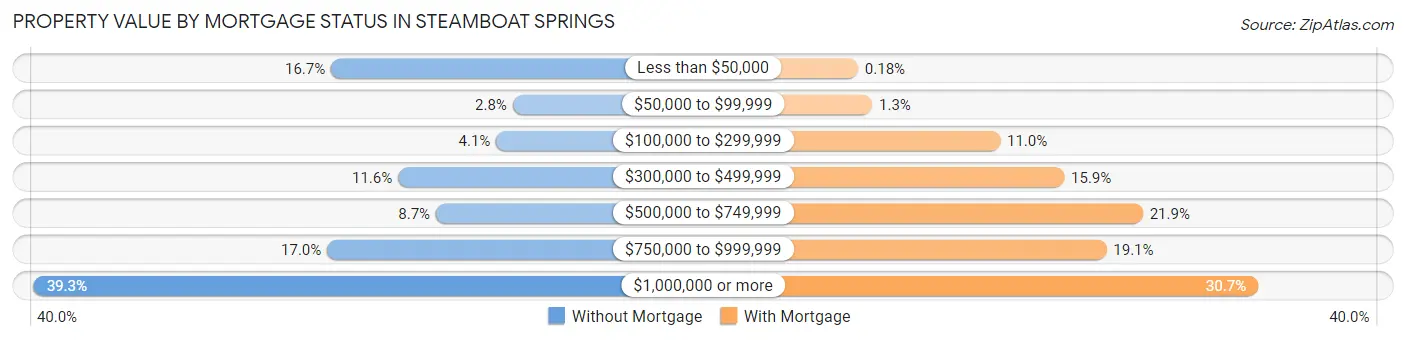
| Property Value | Without Mortgage | With Mortgage |
| Less than $50,000 | 225 (16.7%) | 5 (0.2%) |
| $50,000 to $99,999 | 38 (2.8%) | 34 (1.3%) |
| $100,000 to $299,999 | 55 (4.1%) | 298 (11.0%) |
| $300,000 to $499,999 | 156 (11.6%) | 430 (15.9%) |
| $500,000 to $749,999 | 117 (8.7%) | 592 (21.9%) |
| $750,000 to $999,999 | 229 (17.0%) | 517 (19.1%) |
| $1,000,000 or more | 531 (39.3%) | 830 (30.7%) |
| Total | 1,351 (100.0%) | 2,706 (100.0%) |
Household Income by Mortgage Status in Steamboat Springs
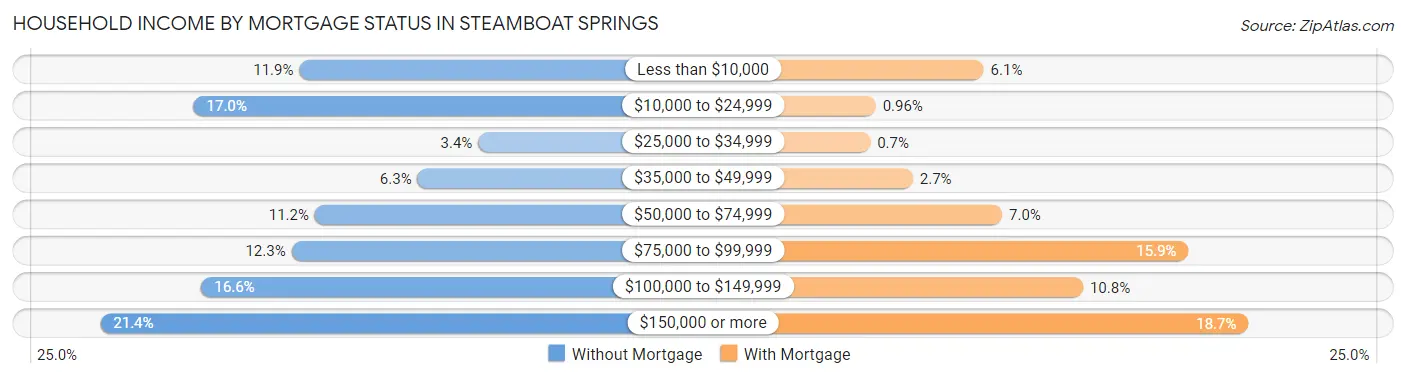
| Household Income | Without Mortgage | With Mortgage |
| Less than $10,000 | 161 (11.9%) | 165 (6.1%) |
| $10,000 to $24,999 | 229 (17.0%) | 26 (1.0%) |
| $25,000 to $34,999 | 46 (3.4%) | 19 (0.7%) |
| $35,000 to $49,999 | 85 (6.3%) | 74 (2.7%) |
| $50,000 to $74,999 | 151 (11.2%) | 189 (7.0%) |
| $75,000 to $99,999 | 166 (12.3%) | 429 (15.9%) |
| $100,000 to $149,999 | 224 (16.6%) | 293 (10.8%) |
| $150,000 or more | 289 (21.4%) | 506 (18.7%) |
| Total | 1,351 (100.0%) | 2,706 (100.0%) |
Property Value to Household Income Ratio in Steamboat Springs
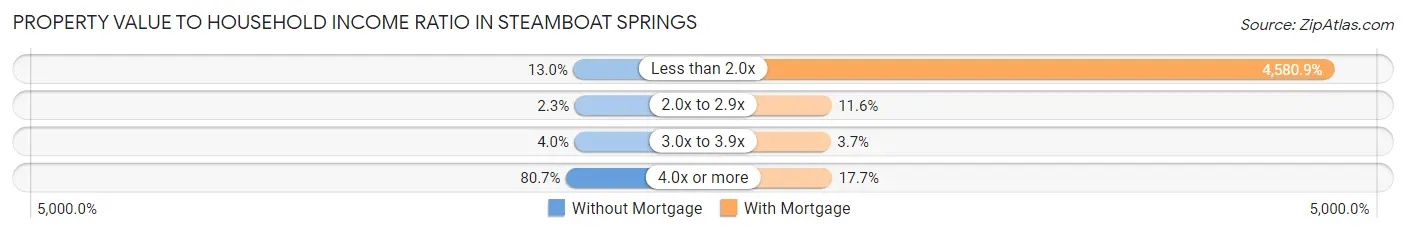
| Value-to-Income Ratio | Without Mortgage | With Mortgage |
| Less than 2.0x | 176 (13.0%) | 123,958 (4,580.9%) |
| 2.0x to 2.9x | 31 (2.3%) | 313 (11.6%) |
| 3.0x to 3.9x | 54 (4.0%) | 101 (3.7%) |
| 4.0x or more | 1,090 (80.7%) | 479 (17.7%) |
| Total | 1,351 (100.0%) | 2,706 (100.0%) |
Real Estate Taxes by Mortgage Status in Steamboat Springs
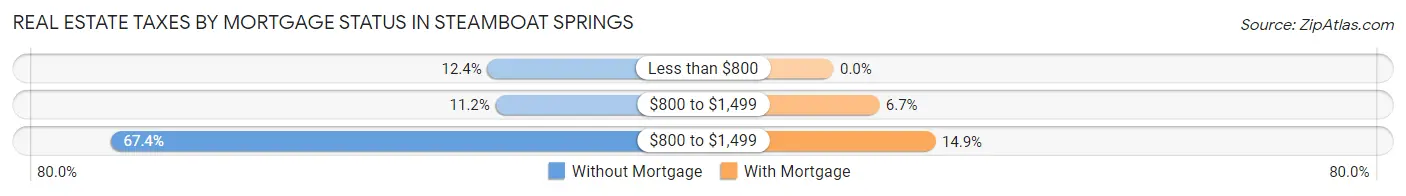
| Property Taxes | Without Mortgage | With Mortgage |
| Less than $800 | 167 (12.4%) | 0 (0.0%) |
| $800 to $1,499 | 151 (11.2%) | 181 (6.7%) |
| $800 to $1,499 | 911 (67.4%) | 403 (14.9%) |
| Total | 1,351 (100.0%) | 2,706 (100.0%) |
Health & Disability in Steamboat Springs
Health Insurance Coverage by Age in Steamboat Springs
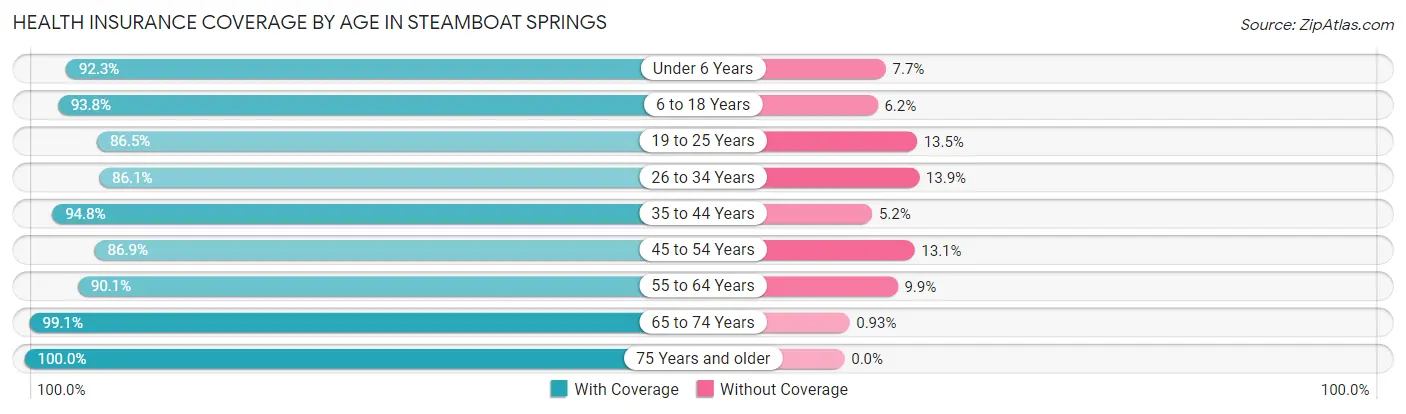
| Age Bracket | With Coverage | Without Coverage |
| Under 6 Years | 515 (92.3%) | 43 (7.7%) |
| 6 to 18 Years | 1,533 (93.8%) | 101 (6.2%) |
| 19 to 25 Years | 1,198 (86.5%) | 187 (13.5%) |
| 26 to 34 Years | 1,337 (86.1%) | 216 (13.9%) |
| 35 to 44 Years | 1,930 (94.8%) | 105 (5.2%) |
| 45 to 54 Years | 1,569 (86.9%) | 236 (13.1%) |
| 55 to 64 Years | 1,762 (90.1%) | 194 (9.9%) |
| 65 to 74 Years | 1,488 (99.1%) | 14 (0.9%) |
| 75 Years and older | 714 (100.0%) | 0 (0.0%) |
| Total | 12,046 (91.7%) | 1,096 (8.3%) |
Health Insurance Coverage by Citizenship Status in Steamboat Springs
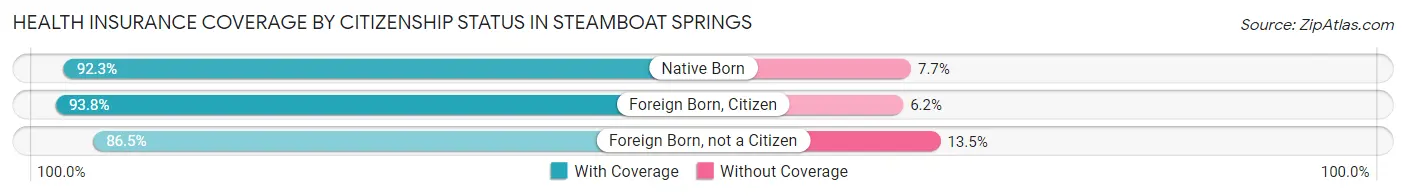
| Citizenship Status | With Coverage | Without Coverage |
| Native Born | 515 (92.3%) | 43 (7.7%) |
| Foreign Born, Citizen | 1,533 (93.8%) | 101 (6.2%) |
| Foreign Born, not a Citizen | 1,198 (86.5%) | 187 (13.5%) |
Health Insurance Coverage by Household Income in Steamboat Springs
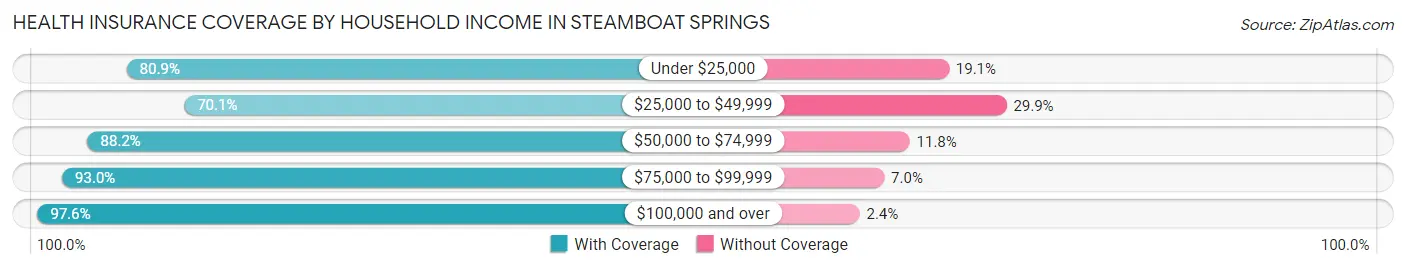
| Household Income | With Coverage | Without Coverage |
| Under $25,000 | 753 (80.9%) | 178 (19.1%) |
| $25,000 to $49,999 | 881 (70.1%) | 376 (29.9%) |
| $50,000 to $74,999 | 1,754 (88.2%) | 234 (11.8%) |
| $75,000 to $99,999 | 1,726 (93.0%) | 130 (7.0%) |
| $100,000 and over | 6,783 (97.6%) | 166 (2.4%) |
Public vs Private Health Insurance Coverage by Age in Steamboat Springs
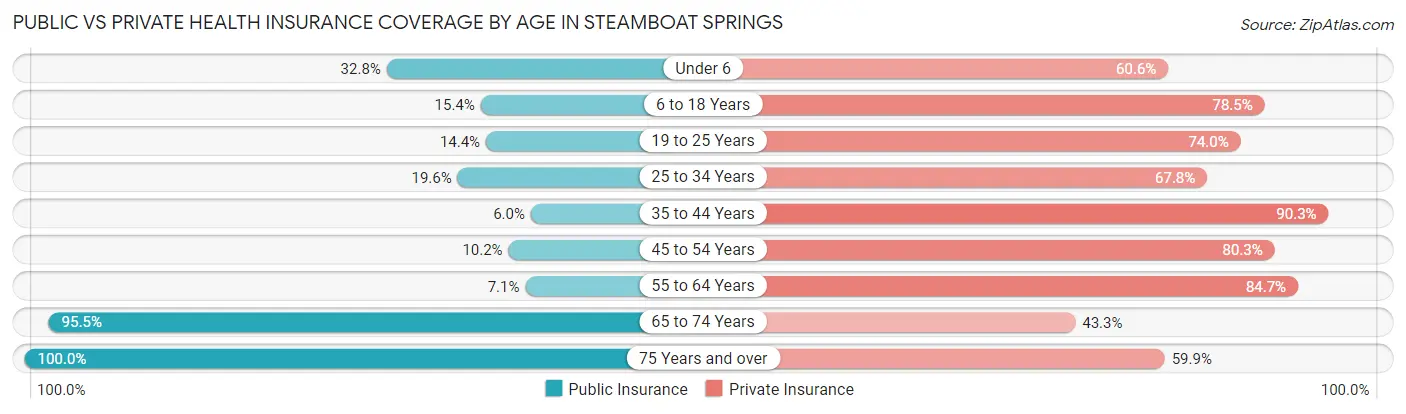
| Age Bracket | Public Insurance | Private Insurance |
| Under 6 | 183 (32.8%) | 338 (60.6%) |
| 6 to 18 Years | 251 (15.4%) | 1,282 (78.5%) |
| 19 to 25 Years | 199 (14.4%) | 1,025 (74.0%) |
| 25 to 34 Years | 305 (19.6%) | 1,053 (67.8%) |
| 35 to 44 Years | 123 (6.0%) | 1,838 (90.3%) |
| 45 to 54 Years | 184 (10.2%) | 1,450 (80.3%) |
| 55 to 64 Years | 138 (7.1%) | 1,656 (84.7%) |
| 65 to 74 Years | 1,435 (95.5%) | 651 (43.3%) |
| 75 Years and over | 714 (100.0%) | 428 (59.9%) |
| Total | 3,532 (26.9%) | 9,721 (74.0%) |
Disability Status by Sex by Age in Steamboat Springs
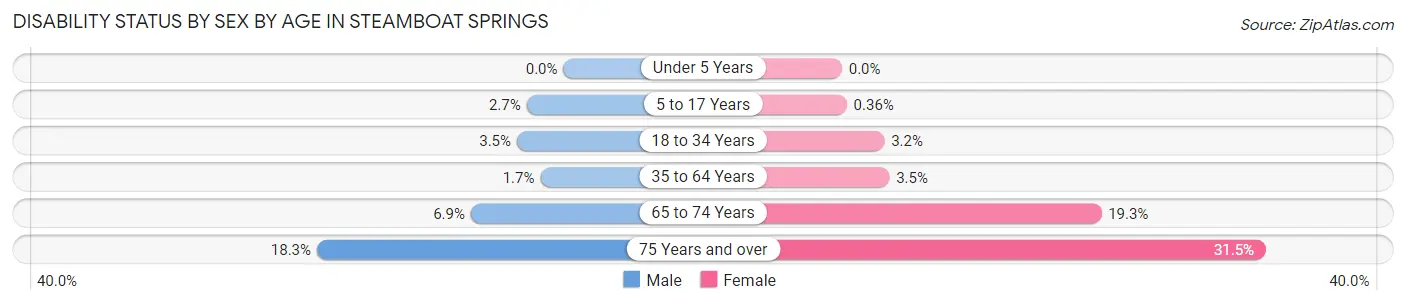
| Age Bracket | Male | Female |
| Under 5 Years | 0 (0.0%) | 0 (0.0%) |
| 5 to 17 Years | 22 (2.7%) | 3 (0.4%) |
| 18 to 34 Years | 58 (3.5%) | 43 (3.2%) |
| 35 to 64 Years | 50 (1.7%) | 101 (3.5%) |
| 65 to 74 Years | 55 (6.9%) | 135 (19.3%) |
| 75 Years and over | 58 (18.3%) | 125 (31.5%) |
Disability Class by Sex by Age in Steamboat Springs
Disability Class: Hearing Difficulty
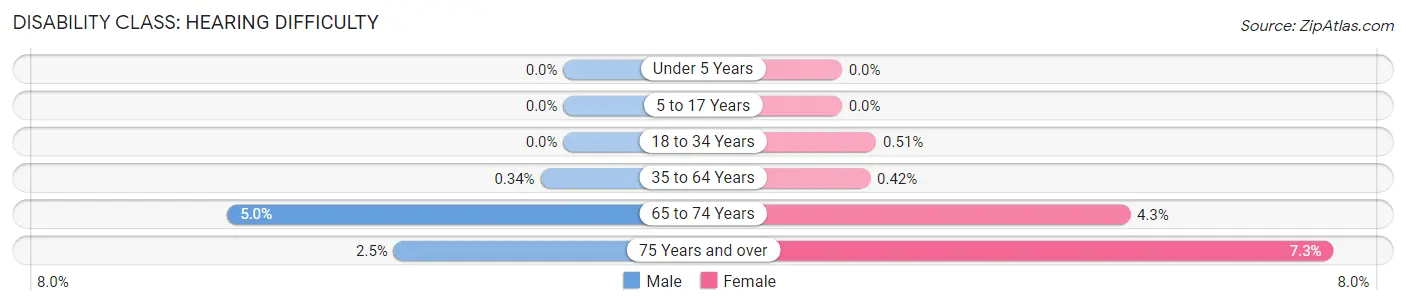
| Age Bracket | Male | Female |
| Under 5 Years | 0 (0.0%) | 0 (0.0%) |
| 5 to 17 Years | 0 (0.0%) | 0 (0.0%) |
| 18 to 34 Years | 0 (0.0%) | 7 (0.5%) |
| 35 to 64 Years | 10 (0.3%) | 12 (0.4%) |
| 65 to 74 Years | 40 (5.0%) | 30 (4.3%) |
| 75 Years and over | 8 (2.5%) | 29 (7.3%) |
Disability Class: Vision Difficulty
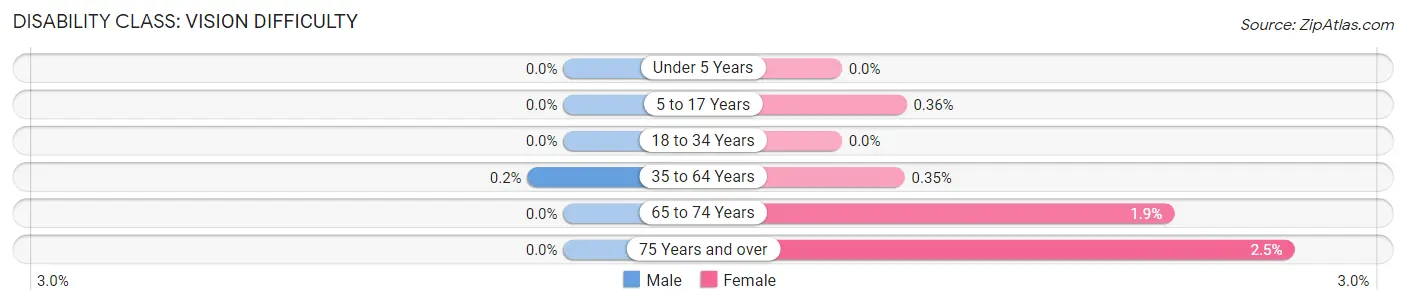
| Age Bracket | Male | Female |
| Under 5 Years | 0 (0.0%) | 0 (0.0%) |
| 5 to 17 Years | 0 (0.0%) | 3 (0.4%) |
| 18 to 34 Years | 0 (0.0%) | 0 (0.0%) |
| 35 to 64 Years | 6 (0.2%) | 10 (0.4%) |
| 65 to 74 Years | 0 (0.0%) | 13 (1.8%) |
| 75 Years and over | 0 (0.0%) | 10 (2.5%) |
Disability Class: Cognitive Difficulty
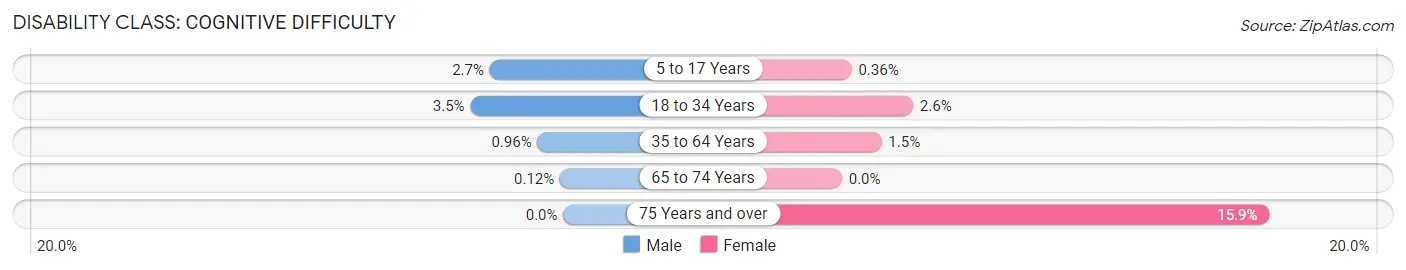
| Age Bracket | Male | Female |
| 5 to 17 Years | 22 (2.7%) | 3 (0.4%) |
| 18 to 34 Years | 58 (3.5%) | 36 (2.6%) |
| 35 to 64 Years | 28 (1.0%) | 42 (1.5%) |
| 65 to 74 Years | 1 (0.1%) | 0 (0.0%) |
| 75 Years and over | 0 (0.0%) | 63 (15.9%) |
Disability Class: Ambulatory Difficulty
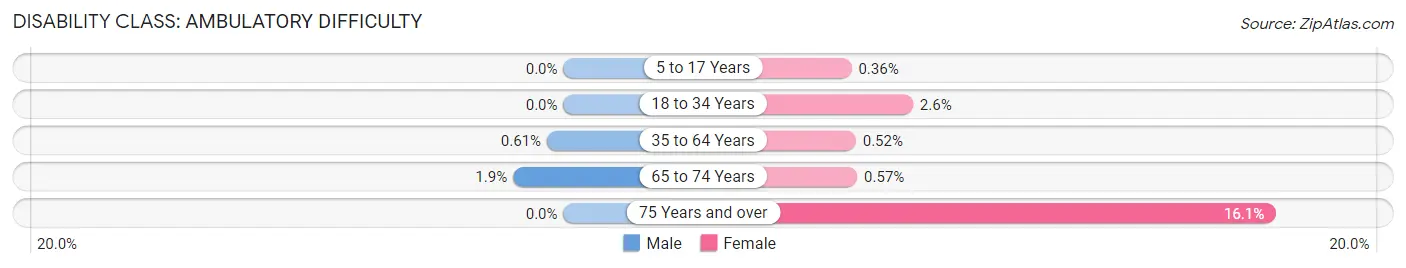
| Age Bracket | Male | Female |
| 5 to 17 Years | 0 (0.0%) | 3 (0.4%) |
| 18 to 34 Years | 0 (0.0%) | 36 (2.6%) |
| 35 to 64 Years | 18 (0.6%) | 15 (0.5%) |
| 65 to 74 Years | 15 (1.9%) | 4 (0.6%) |
| 75 Years and over | 0 (0.0%) | 64 (16.1%) |
Disability Class: Self-Care Difficulty
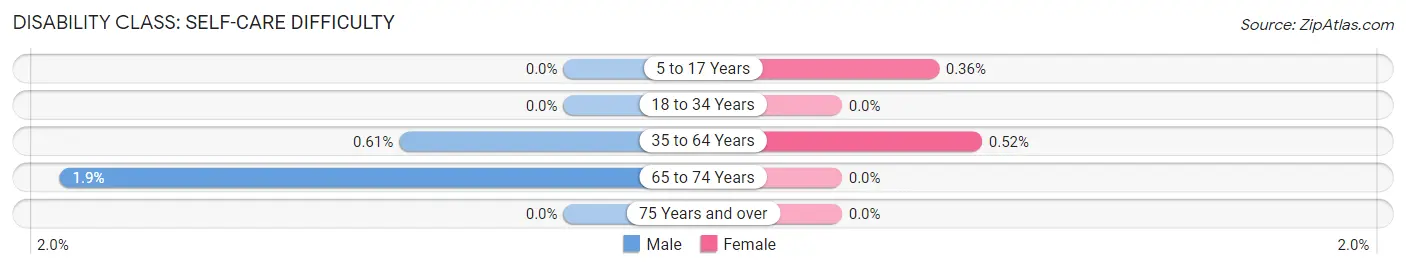
| Age Bracket | Male | Female |
| 5 to 17 Years | 0 (0.0%) | 3 (0.4%) |
| 18 to 34 Years | 0 (0.0%) | 0 (0.0%) |
| 35 to 64 Years | 18 (0.6%) | 15 (0.5%) |
| 65 to 74 Years | 15 (1.9%) | 0 (0.0%) |
| 75 Years and over | 0 (0.0%) | 0 (0.0%) |
Technology Access in Steamboat Springs
Computing Device Access in Steamboat Springs
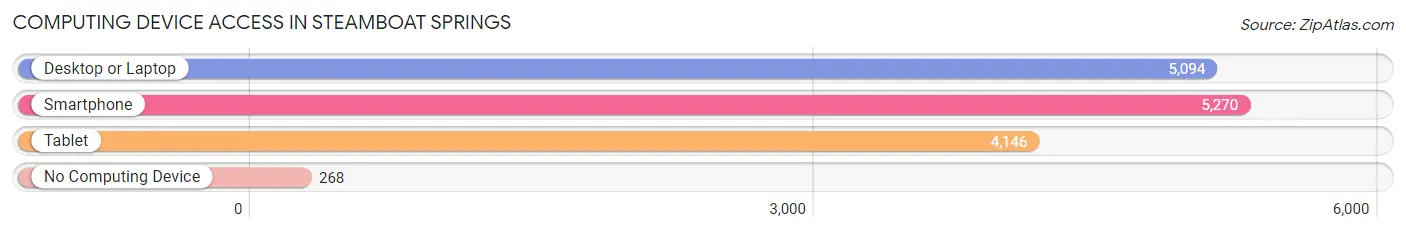
| Device Type | # Households | % Households |
| Desktop or Laptop | 5,094 | 88.8% |
| Smartphone | 5,270 | 91.8% |
| Tablet | 4,146 | 72.3% |
| No Computing Device | 268 | 4.7% |
| Total | 5,738 | 100.0% |
Internet Access in Steamboat Springs
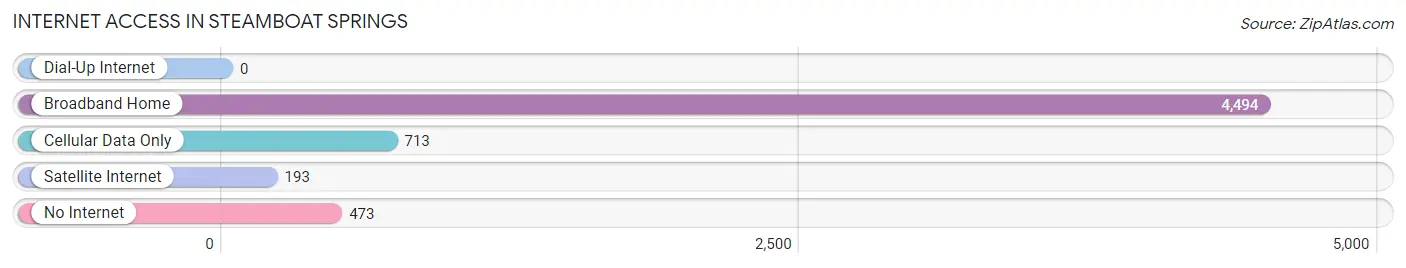
| Internet Type | # Households | % Households |
| Dial-Up Internet | 0 | 0.0% |
| Broadband Home | 4,494 | 78.3% |
| Cellular Data Only | 713 | 12.4% |
| Satellite Internet | 193 | 3.4% |
| No Internet | 473 | 8.2% |
| Total | 5,738 | 100.0% |
Steamboat Springs Summary
Steamboat Springs, Colorado is a small mountain town located in the northwest corner of the state. It is situated in the Yampa Valley, at an elevation of 6,732 feet, and is surrounded by the Rocky Mountains. The town is known for its hot springs, skiing, and outdoor recreation.
History
Steamboat Springs was first settled in the late 1800s by miners and ranchers. The town was named after the steamboats that used to travel up the Yampa River. In the early 1900s, the town began to grow as a resort destination. The first ski area was established in 1914, and the first ski jump was built in 1915. The town was incorporated in 1900, and the first mayor was elected in 1901.
Geography
Steamboat Springs is located in the Yampa Valley, at an elevation of 6,732 feet. The town is surrounded by the Rocky Mountains, and is located near the headwaters of the Yampa River. The town is located about 160 miles northwest of Denver, and is accessible by car or plane.
The climate in Steamboat Springs is generally mild, with cold winters and warm summers. The average annual temperature is around 40 degrees Fahrenheit. The town receives an average of about 20 inches of snow each year.
Economy
Steamboat Springs is a popular tourist destination, and the town’s economy is largely based on tourism. The town is home to several ski resorts, including Steamboat Ski Resort, which is one of the largest ski resorts in the United States. The town also has a thriving arts and culture scene, with several galleries, museums, and performing arts venues.
The town is also home to several businesses, including retail stores, restaurants, and hotels. The town is also home to several manufacturing companies, including a brewery and a distillery.
Demographics
As of the 2010 census, the population of Steamboat Springs was 12,088. The town has a median age of 36.7 years, and the median household income is $63,945. The town is predominantly white, with about 90% of the population identifying as white. The town also has a large Hispanic population, with about 10% of the population identifying as Hispanic or Latino.
Steamboat Springs is a small mountain town with a rich history and a vibrant culture. The town is known for its hot springs, skiing, and outdoor recreation. The town’s economy is largely based on tourism, and the town is home to several businesses, galleries, museums, and performing arts venues. The town has a diverse population, with a median age of 36.7 years and a median household income of $63,945.
Common Questions
What is Per Capita Income in Steamboat Springs?
Per Capita income in Steamboat Springs is $62,223.
What is the Median Family Income in Steamboat Springs?
Median Family Income in Steamboat Springs is $128,601.
What is the Median Household income in Steamboat Springs?
Median Household Income in Steamboat Springs is $93,280.
What is Income or Wage Gap in Steamboat Springs?
Income or Wage Gap in Steamboat Springs is 34.7%.
Women in Steamboat Springs earn 65.3 cents for every dollar earned by a man.
What is Inequality or Gini Index in Steamboat Springs?
Inequality or Gini Index in Steamboat Springs is 0.48.
What is the Total Population of Steamboat Springs?
Total Population of Steamboat Springs is 13,251.
What is the Total Male Population of Steamboat Springs?
Total Male Population of Steamboat Springs is 6,782.
What is the Total Female Population of Steamboat Springs?
Total Female Population of Steamboat Springs is 6,469.
What is the Ratio of Males per 100 Females in Steamboat Springs?
There are 104.84 Males per 100 Females in Steamboat Springs.
What is the Ratio of Females per 100 Males in Steamboat Springs?
There are 95.38 Females per 100 Males in Steamboat Springs.
What is the Median Population Age in Steamboat Springs?
Median Population Age in Steamboat Springs is 41.3 Years.
What is the Average Family Size in Steamboat Springs
Average Family Size in Steamboat Springs is 2.7 People.
What is the Average Household Size in Steamboat Springs
Average Household Size in Steamboat Springs is 2.3 People.
How Large is the Labor Force in Steamboat Springs?
There are 7,682 People in the Labor Forcein in Steamboat Springs.
What is the Percentage of People in the Labor Force in Steamboat Springs?
67.1% of People are in the Labor Force in Steamboat Springs.
What is the Unemployment Rate in Steamboat Springs?
Unemployment Rate in Steamboat Springs is 3.6%.