Cities with the Lowest Poverty Level Among Children Under the Age of 5 in Georgia
RELATED REPORTS & OPTIONS
Lowest Poverty | Child 0-5
Georgia
Compare Cities
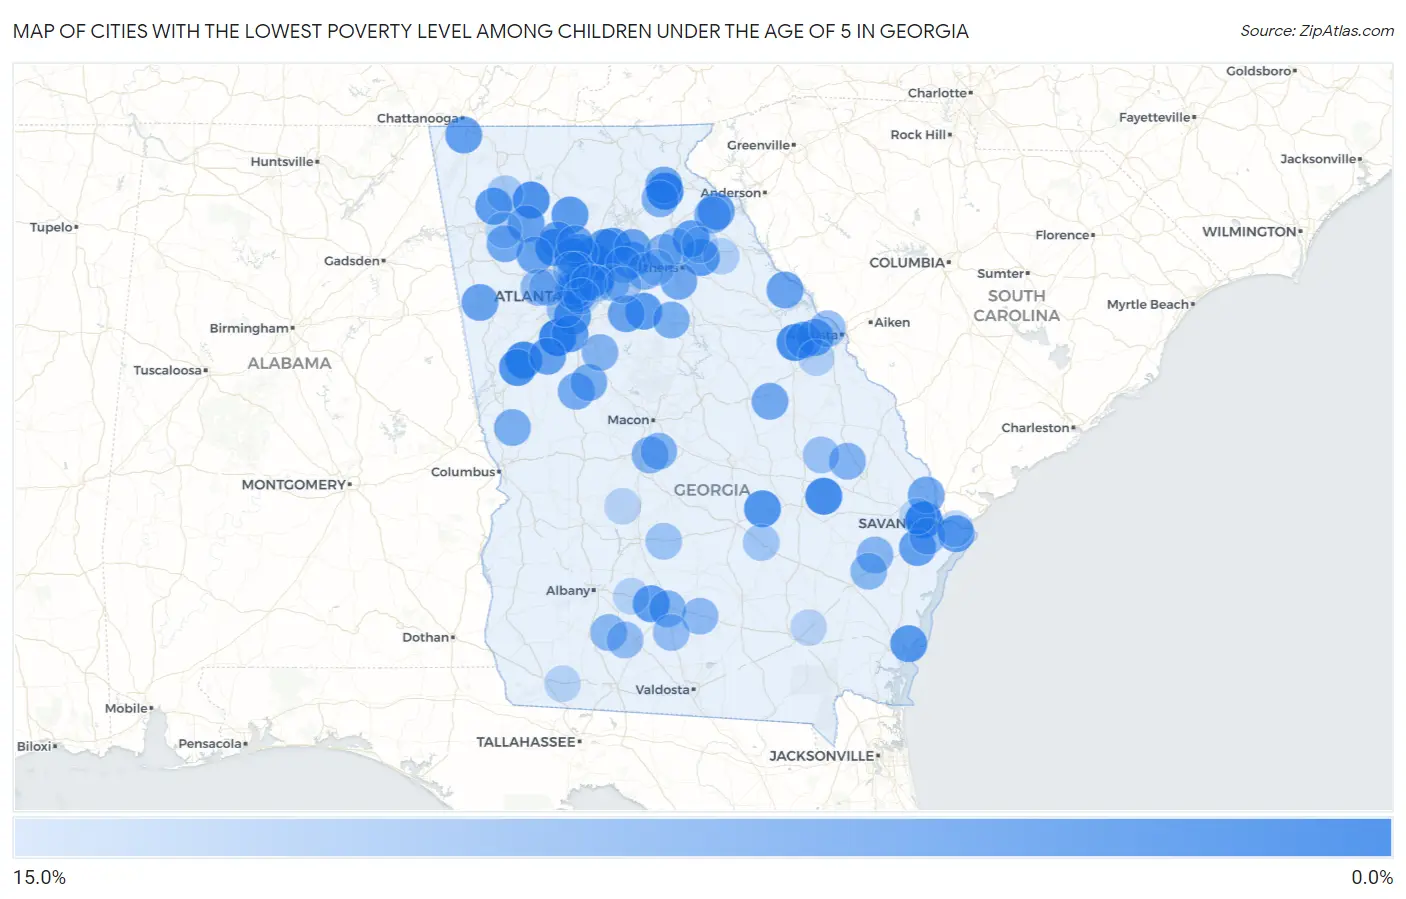
Map of Cities with the Lowest Poverty Level Among Children Under the Age of 5 in Georgia
15.0%
0.0%
Cities with the Lowest Poverty Level Among Children Under the Age of 5 in Georgia
| City | Child Poverty | vs State | vs National | |
| 1. | Fayetteville | 0.36% | 20.3%(-20.0)#1 | 18.1%(-17.7)#8 |
| 2. | Pooler | 0.40% | 20.3%(-19.9)#2 | 18.1%(-17.7)#12 |
| 3. | Johns Creek | 0.51% | 20.3%(-19.8)#3 | 18.1%(-17.5)#23 |
| 4. | Cornelia | 0.55% | 20.3%(-19.8)#4 | 18.1%(-17.5)#26 |
| 5. | Cobbtown | 1.9% | 20.3%(-18.5)#5 | 18.1%(-16.2)#303 |
| 6. | Moreland | 1.9% | 20.3%(-18.4)#6 | 18.1%(-16.1)#318 |
| 7. | Dearing | 2.0% | 20.3%(-18.3)#7 | 18.1%(-16.0)#357 |
| 8. | Lilburn | 2.1% | 20.3%(-18.3)#8 | 18.1%(-16.0)#367 |
| 9. | Woodstock | 2.1% | 20.3%(-18.2)#9 | 18.1%(-16.0)#377 |
| 10. | Fairmount | 2.7% | 20.3%(-17.6)#10 | 18.1%(-15.4)#579 |
| 11. | Grantville | 2.9% | 20.3%(-17.4)#11 | 18.1%(-15.2)#668 |
| 12. | Buford | 3.0% | 20.3%(-17.3)#12 | 18.1%(-15.0)#718 |
| 13. | Glenwood | 3.0% | 20.3%(-17.3)#13 | 18.1%(-15.0)#721 |
| 14. | Lake City | 3.6% | 20.3%(-16.7)#14 | 18.1%(-14.4)#963 |
| 15. | St Simons | 3.9% | 20.3%(-16.5)#15 | 18.1%(-14.2)#1,073 |
| 16. | Social Circle | 3.9% | 20.3%(-16.4)#16 | 18.1%(-14.1)#1,105 |
| 17. | Decatur | 4.0% | 20.3%(-16.4)#17 | 18.1%(-14.1)#1,114 |
| 18. | Ty Ty | 4.0% | 20.3%(-16.3)#18 | 18.1%(-14.1)#1,130 |
| 19. | Colbert | 4.0% | 20.3%(-16.3)#19 | 18.1%(-14.1)#1,131 |
| 20. | Ball Ground | 4.0% | 20.3%(-16.3)#20 | 18.1%(-14.0)#1,147 |
| 21. | Ila | 4.1% | 20.3%(-16.3)#21 | 18.1%(-14.0)#1,151 |
| 22. | Plainville | 4.2% | 20.3%(-16.2)#22 | 18.1%(-13.9)#1,211 |
| 23. | Bowersville | 4.3% | 20.3%(-16.0)#23 | 18.1%(-13.7)#1,275 |
| 24. | Duluth | 4.4% | 20.3%(-15.9)#24 | 18.1%(-13.7)#1,289 |
| 25. | Sugar Hill | 4.6% | 20.3%(-15.8)#25 | 18.1%(-13.5)#1,371 |
| 26. | Irondale | 4.7% | 20.3%(-15.7)#26 | 18.1%(-13.4)#1,406 |
| 27. | Grovetown | 4.7% | 20.3%(-15.6)#27 | 18.1%(-13.3)#1,433 |
| 28. | Fairview | 4.8% | 20.3%(-15.5)#28 | 18.1%(-13.2)#1,500 |
| 29. | Wilmington Island | 4.9% | 20.3%(-15.4)#29 | 18.1%(-13.2)#1,529 |
| 30. | Auburn | 4.9% | 20.3%(-15.4)#30 | 18.1%(-13.1)#1,540 |
| 31. | Richmond Hill | 4.9% | 20.3%(-15.4)#31 | 18.1%(-13.1)#1,542 |
| 32. | White | 5.1% | 20.3%(-15.3)#32 | 18.1%(-13.0)#1,602 |
| 33. | Senoia | 5.1% | 20.3%(-15.2)#33 | 18.1%(-12.9)#1,637 |
| 34. | Oxford | 5.2% | 20.3%(-15.1)#34 | 18.1%(-12.9)#1,657 |
| 35. | Holly Springs | 5.2% | 20.3%(-15.1)#35 | 18.1%(-12.8)#1,675 |
| 36. | Alpharetta | 5.3% | 20.3%(-15.0)#36 | 18.1%(-12.7)#1,715 |
| 37. | Bremen | 5.3% | 20.3%(-15.0)#37 | 18.1%(-12.7)#1,721 |
| 38. | Braselton | 5.4% | 20.3%(-14.9)#38 | 18.1%(-12.7)#1,746 |
| 39. | Roswell | 5.5% | 20.3%(-14.9)#39 | 18.1%(-12.6)#1,773 |
| 40. | Lincolnton | 5.6% | 20.3%(-14.8)#40 | 18.1%(-12.5)#1,799 |
| 41. | Acworth | 5.6% | 20.3%(-14.8)#41 | 18.1%(-12.5)#1,829 |
| 42. | Fairfield Plantation | 6.1% | 20.3%(-14.3)#42 | 18.1%(-12.0)#2,013 |
| 43. | Demorest | 6.1% | 20.3%(-14.3)#43 | 18.1%(-12.0)#2,017 |
| 44. | North Decatur | 6.2% | 20.3%(-14.1)#44 | 18.1%(-11.8)#2,077 |
| 45. | Euharlee | 6.2% | 20.3%(-14.1)#45 | 18.1%(-11.8)#2,086 |
| 46. | Watkinsville | 6.2% | 20.3%(-14.1)#46 | 18.1%(-11.8)#2,088 |
| 47. | Druid Hills | 6.3% | 20.3%(-14.1)#47 | 18.1%(-11.8)#2,116 |
| 48. | Rincon | 6.3% | 20.3%(-14.0)#48 | 18.1%(-11.7)#2,136 |
| 49. | Davisboro | 6.3% | 20.3%(-14.0)#49 | 18.1%(-11.7)#2,138 |
| 50. | Milton | 6.4% | 20.3%(-13.9)#50 | 18.1%(-11.7)#2,160 |
| 51. | Harlem | 6.6% | 20.3%(-13.8)#51 | 18.1%(-11.5)#2,222 |
| 52. | Meansville | 6.7% | 20.3%(-13.7)#52 | 18.1%(-11.4)#2,274 |
| 53. | Milner | 7.0% | 20.3%(-13.4)#53 | 18.1%(-11.1)#2,418 |
| 54. | Hamilton | 7.1% | 20.3%(-13.2)#54 | 18.1%(-10.9)#2,477 |
| 55. | Madison | 7.2% | 20.3%(-13.1)#55 | 18.1%(-10.8)#2,516 |
| 56. | Alto | 7.6% | 20.3%(-12.7)#56 | 18.1%(-10.5)#2,672 |
| 57. | Canon | 7.7% | 20.3%(-12.6)#57 | 18.1%(-10.4)#2,712 |
| 58. | Bethlehem | 7.7% | 20.3%(-12.6)#58 | 18.1%(-10.4)#2,717 |
| 59. | Warner Robins | 8.0% | 20.3%(-12.4)#59 | 18.1%(-10.1)#2,809 |
| 60. | Portal | 8.0% | 20.3%(-12.3)#60 | 18.1%(-10.1)#2,832 |
| 61. | Unionville | 8.0% | 20.3%(-12.3)#61 | 18.1%(-10.0)#2,842 |
| 62. | Robins Afb | 8.1% | 20.3%(-12.3)#62 | 18.1%(-9.98)#2,861 |
| 63. | Locust Grove | 8.2% | 20.3%(-12.1)#63 | 18.1%(-9.83)#2,919 |
| 64. | Arcade | 8.3% | 20.3%(-12.0)#64 | 18.1%(-9.73)#2,955 |
| 65. | Gumbranch | 8.5% | 20.3%(-11.8)#65 | 18.1%(-9.55)#3,047 |
| 66. | Ludowici | 8.6% | 20.3%(-11.7)#66 | 18.1%(-9.47)#3,085 |
| 67. | Sale City | 8.7% | 20.3%(-11.6)#67 | 18.1%(-9.37)#3,135 |
| 68. | Snellville | 9.1% | 20.3%(-11.3)#68 | 18.1%(-9.01)#3,258 |
| 69. | North Druid Hills | 9.1% | 20.3%(-11.3)#69 | 18.1%(-8.99)#3,264 |
| 70. | Alapaha | 9.1% | 20.3%(-11.2)#70 | 18.1%(-8.97)#3,292 |
| 71. | Georgetown | 9.1% | 20.3%(-11.2)#71 | 18.1%(-8.92)#3,327 |
| 72. | Austell | 9.2% | 20.3%(-11.2)#72 | 18.1%(-8.89)#3,339 |
| 73. | Martinez | 9.3% | 20.3%(-11.0)#73 | 18.1%(-8.74)#3,402 |
| 74. | Hapeville | 9.6% | 20.3%(-10.7)#74 | 18.1%(-8.41)#3,526 |
| 75. | Funston | 9.7% | 20.3%(-10.7)#75 | 18.1%(-8.39)#3,535 |
| 76. | Lenox | 9.8% | 20.3%(-10.5)#76 | 18.1%(-8.23)#3,588 |
| 77. | Dunwoody | 9.9% | 20.3%(-10.4)#77 | 18.1%(-8.12)#3,614 |
| 78. | Twin City | 10.3% | 20.3%(-10.1)#78 | 18.1%(-7.81)#3,755 |
| 79. | Nicholson | 10.4% | 20.3%(-9.89)#79 | 18.1%(-7.62)#3,828 |
| 80. | Mableton | 10.5% | 20.3%(-9.81)#80 | 18.1%(-7.54)#3,850 |
| 81. | Pitts | 10.5% | 20.3%(-9.81)#81 | 18.1%(-7.54)#3,878 |
| 82. | Dacula | 10.7% | 20.3%(-9.66)#82 | 18.1%(-7.39)#3,928 |
| 83. | Mountain Park | 10.8% | 20.3%(-9.57)#83 | 18.1%(-7.30)#3,963 |
| 84. | Loganville | 11.0% | 20.3%(-9.32)#84 | 18.1%(-7.05)#4,043 |
| 85. | Sandy Springs | 11.0% | 20.3%(-9.30)#85 | 18.1%(-7.03)#4,049 |
| 86. | Lumber City | 11.1% | 20.3%(-9.22)#86 | 18.1%(-6.95)#4,081 |
| 87. | Calhoun | 11.4% | 20.3%(-8.95)#87 | 18.1%(-6.68)#4,222 |
| 88. | Statham | 11.6% | 20.3%(-8.69)#88 | 18.1%(-6.42)#4,319 |
| 89. | Tucker | 12.4% | 20.3%(-7.89)#89 | 18.1%(-5.62)#4,585 |
| 90. | Talahi Island | 12.5% | 20.3%(-7.83)#90 | 18.1%(-5.56)#4,609 |
| 91. | Blythe | 12.5% | 20.3%(-7.83)#91 | 18.1%(-5.56)#4,624 |
| 92. | Carlton | 12.5% | 20.3%(-7.83)#92 | 18.1%(-5.56)#4,642 |
| 93. | Kingston | 12.9% | 20.3%(-7.43)#93 | 18.1%(-5.16)#4,805 |
| 94. | Sylvester | 13.0% | 20.3%(-7.33)#94 | 18.1%(-5.06)#4,835 |
| 95. | Bloomingdale | 13.0% | 20.3%(-7.29)#95 | 18.1%(-5.02)#4,842 |
| 96. | Climax | 13.0% | 20.3%(-7.29)#96 | 18.1%(-5.02)#4,855 |
| 97. | Belvedere Park | 13.1% | 20.3%(-7.28)#97 | 18.1%(-5.01)#4,858 |
| 98. | Danielsville | 13.1% | 20.3%(-7.22)#98 | 18.1%(-4.95)#4,880 |
| 99. | Blackshear | 13.1% | 20.3%(-7.19)#99 | 18.1%(-4.92)#4,889 |
| 100. | Byromville | 13.2% | 20.3%(-7.18)#100 | 18.1%(-4.90)#4,897 |
Common Questions
What are the Top 10 Cities with the Lowest Poverty Level Among Children Under the Age of 5 in Georgia?
Top 10 Cities with the Lowest Poverty Level Among Children Under the Age of 5 in Georgia are:
#1
0.36%
#2
0.40%
#3
0.51%
#4
0.55%
#5
1.9%
#6
1.9%
#7
2.0%
#8
2.1%
#9
2.1%
#10
2.7%
What city has the Lowest Poverty Level Among Children Under the Age of 5 in Georgia?
Fayetteville has the Lowest Poverty Level Among Children Under the Age of 5 in Georgia with 0.36%.
What is the Poverty Level Among Children Under the Age of 5 in the State of Georgia?
Poverty Level Among Children Under the Age of 5 in Georgia is 20.3%.
What is the Poverty Level Among Children Under the Age of 5 in the United States?
Poverty Level Among Children Under the Age of 5 in the United States is 18.1%.