Fruit Cove, FL Map & Demographics
Fruit Cove Map
Fruit Cove Overview
$54,802
PER CAPITA INCOME
$139,929
AVG FAMILY INCOME
$134,535
AVG HOUSEHOLD INCOME
45.3%
WAGE / INCOME GAP [ % ]
54.7¢/ $1
WAGE / INCOME GAP [ $ ]
$11,936
FAMILY INCOME DEFICIT
0.40
INEQUALITY / GINI INDEX
35,333
TOTAL POPULATION
18,189
MALE POPULATION
17,144
FEMALE POPULATION
106.10
MALES / 100 FEMALES
94.25
FEMALES / 100 MALES
41.5
MEDIAN AGE
3.3
AVG FAMILY SIZE
3.1
AVG HOUSEHOLD SIZE
17,691
LABOR FORCE [ PEOPLE ]
63.7%
PERCENT IN LABOR FORCE
2.7%
UNEMPLOYMENT RATE
Fruit Cove Area Codes
Income in Fruit Cove
Income Overview in Fruit Cove
Per Capita Income in Fruit Cove is $54,802, while median incomes of families and households are $139,929 and $134,535 respectively.
| Characteristic | Number | Measure |
| Per Capita Income | 35,333 | $54,802 |
| Median Family Income | 9,852 | $139,929 |
| Mean Family Income | 9,852 | $169,778 |
| Median Household Income | 11,435 | $134,535 |
| Mean Household Income | 11,435 | $161,879 |
| Income Deficit | 9,852 | $11,936 |
| Wage / Income Gap (%) | 35,333 | 45.26% |
| Wage / Income Gap ($) | 35,333 | 54.74¢ per $1 |
| Gini / Inequality Index | 35,333 | 0.40 |
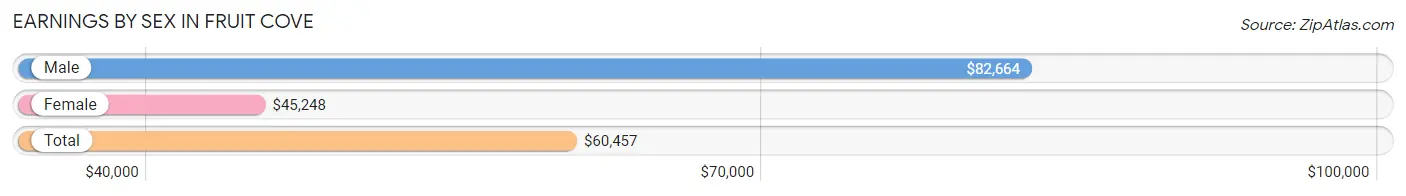
Earnings by Sex in Fruit Cove
Average Earnings in Fruit Cove are $60,457, $82,664 for men and $45,248 for women, a difference of 45.3%.
| Sex | Number | Average Earnings |
| Male | 10,789 (58.6%) | $82,664 |
| Female | 7,625 (41.4%) | $45,248 |
| Total | 18,414 (100.0%) | $60,457 |
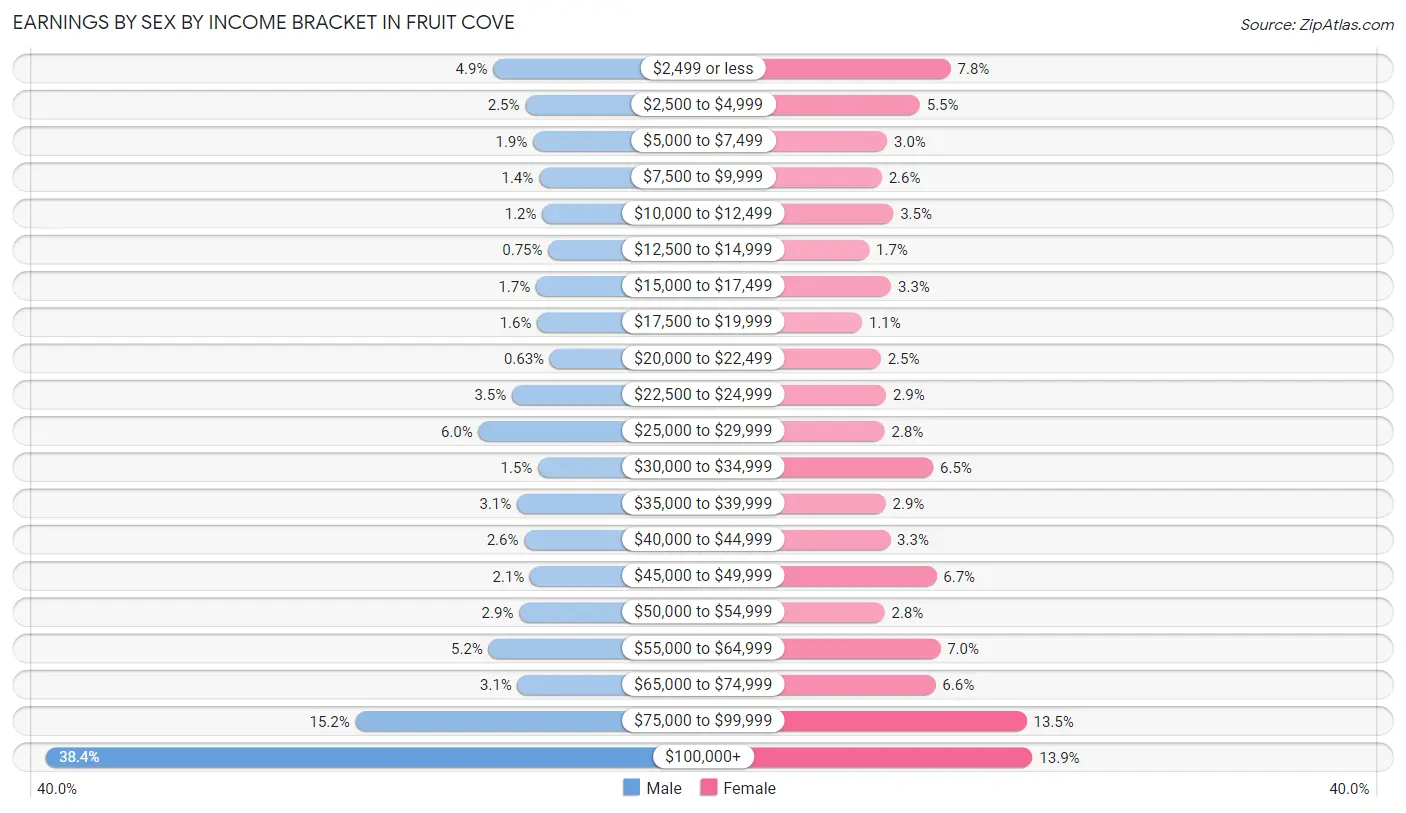
Earnings by Sex by Income Bracket in Fruit Cove
The most common earnings brackets in Fruit Cove are $100,000+ for men (4,142 | 38.4%) and $100,000+ for women (1,061 | 13.9%).
| Income | Male | Female |
| $2,499 or less | 526 (4.9%) | 593 (7.8%) |
| $2,500 to $4,999 | 266 (2.5%) | 417 (5.5%) |
| $5,000 to $7,499 | 204 (1.9%) | 230 (3.0%) |
| $7,500 to $9,999 | 155 (1.4%) | 200 (2.6%) |
| $10,000 to $12,499 | 130 (1.2%) | 265 (3.5%) |
| $12,500 to $14,999 | 81 (0.7%) | 127 (1.7%) |
| $15,000 to $17,499 | 180 (1.7%) | 253 (3.3%) |
| $17,500 to $19,999 | 171 (1.6%) | 87 (1.1%) |
| $20,000 to $22,499 | 68 (0.6%) | 194 (2.5%) |
| $22,500 to $24,999 | 374 (3.5%) | 224 (2.9%) |
| $25,000 to $29,999 | 645 (6.0%) | 216 (2.8%) |
| $30,000 to $34,999 | 163 (1.5%) | 493 (6.5%) |
| $35,000 to $39,999 | 333 (3.1%) | 222 (2.9%) |
| $40,000 to $44,999 | 275 (2.5%) | 248 (3.3%) |
| $45,000 to $49,999 | 228 (2.1%) | 512 (6.7%) |
| $50,000 to $54,999 | 316 (2.9%) | 216 (2.8%) |
| $55,000 to $64,999 | 563 (5.2%) | 534 (7.0%) |
| $65,000 to $74,999 | 329 (3.0%) | 506 (6.6%) |
| $75,000 to $99,999 | 1,640 (15.2%) | 1,027 (13.5%) |
| $100,000+ | 4,142 (38.4%) | 1,061 (13.9%) |
| Total | 10,789 (100.0%) | 7,625 (100.0%) |
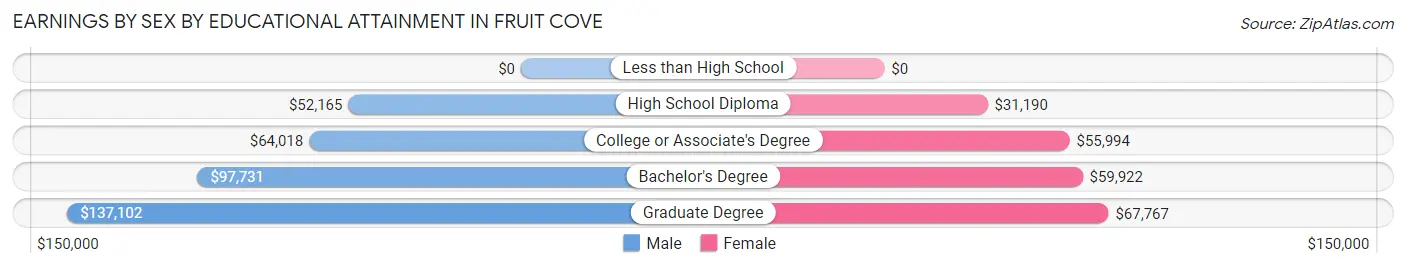
Earnings by Sex by Educational Attainment in Fruit Cove
Average earnings in Fruit Cove are $89,284 for men and $50,913 for women, a difference of 43.0%. Men with an educational attainment of graduate degree enjoy the highest average annual earnings of $137,102, while those with high school diploma education earn the least with $52,165. Women with an educational attainment of graduate degree earn the most with the average annual earnings of $67,767, while those with high school diploma education have the smallest earnings of $31,190.
| Educational Attainment | Male Income | Female Income |
| Less than High School | - | - |
| High School Diploma | $52,165 | $31,190 |
| College or Associate's Degree | $64,018 | $55,994 |
| Bachelor's Degree | $97,731 | $59,922 |
| Graduate Degree | $137,102 | $67,767 |
| Total | $89,284 | $50,913 |
Family Income in Fruit Cove
Family Income Brackets in Fruit Cove
According to the Fruit Cove family income data, there are 2,335 families falling into the $200,000+ income range, which is the most common income bracket and makes up 23.7% of all families. Conversely, the $10,000 to $14,999 income bracket is the least frequent group with only 20 families (0.2%) belonging to this category.
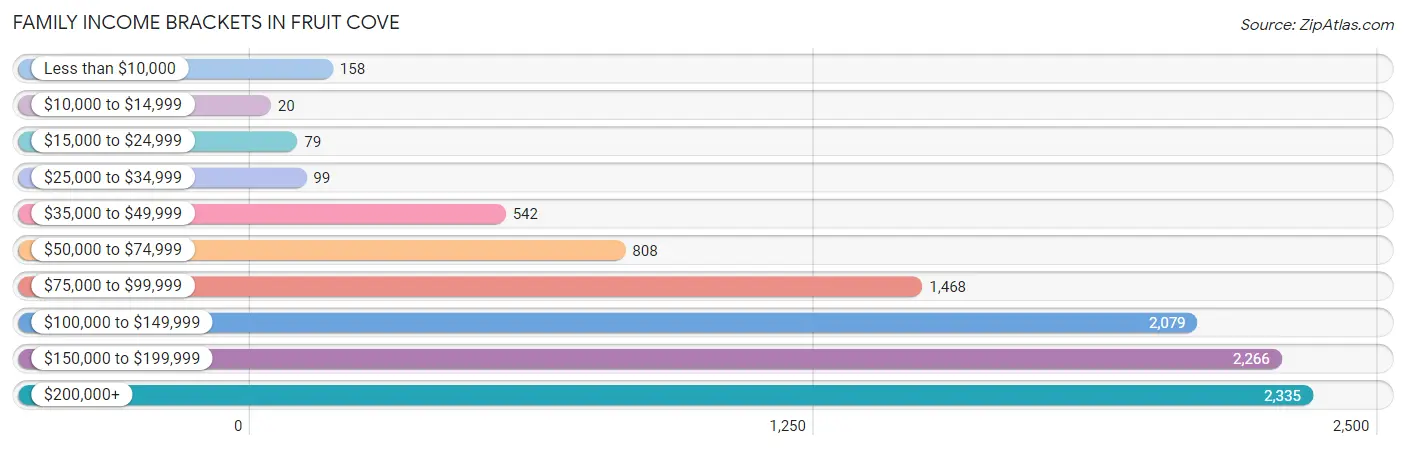
| Income Bracket | # Families | % Families |
| Less than $10,000 | 158 | 1.6% |
| $10,000 to $14,999 | 20 | 0.2% |
| $15,000 to $24,999 | 79 | 0.8% |
| $25,000 to $34,999 | 99 | 1.0% |
| $35,000 to $49,999 | 542 | 5.5% |
| $50,000 to $74,999 | 808 | 8.2% |
| $75,000 to $99,999 | 1,468 | 14.9% |
| $100,000 to $149,999 | 2,079 | 21.1% |
| $150,000 to $199,999 | 2,266 | 23.0% |
| $200,000+ | 2,335 | 23.7% |
Family Income by Famaliy Size in Fruit Cove
6-person families (74 | 0.7%) account for the highest median family income in Fruit Cove with $211,250 per family, while 2-person families (3,698 | 37.5%) have the highest median income of $60,514 per family member.
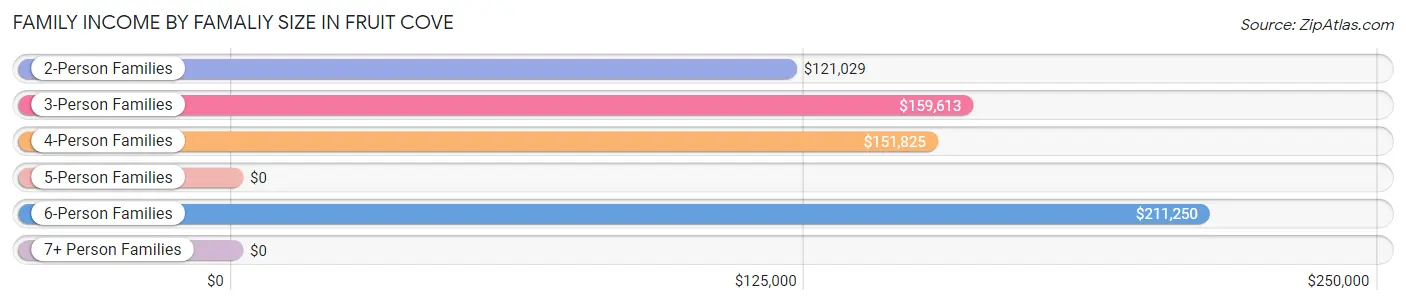
| Income Bracket | # Families | Median Income |
| 2-Person Families | 3,698 (37.5%) | $121,029 |
| 3-Person Families | 2,512 (25.5%) | $159,613 |
| 4-Person Families | 2,209 (22.4%) | $151,825 |
| 5-Person Families | 1,245 (12.6%) | $0 |
| 6-Person Families | 74 (0.7%) | $211,250 |
| 7+ Person Families | 114 (1.2%) | $0 |
| Total | 9,852 (100.0%) | $139,929 |
Family Income by Number of Earners in Fruit Cove
The median family income in Fruit Cove is $139,929, with families comprising 3+ earners (1,276) having the highest median family income of $173,594, while families with no earners (1,256) have the lowest median family income of $73,049, accounting for 13.0% and 12.8% of families, respectively.
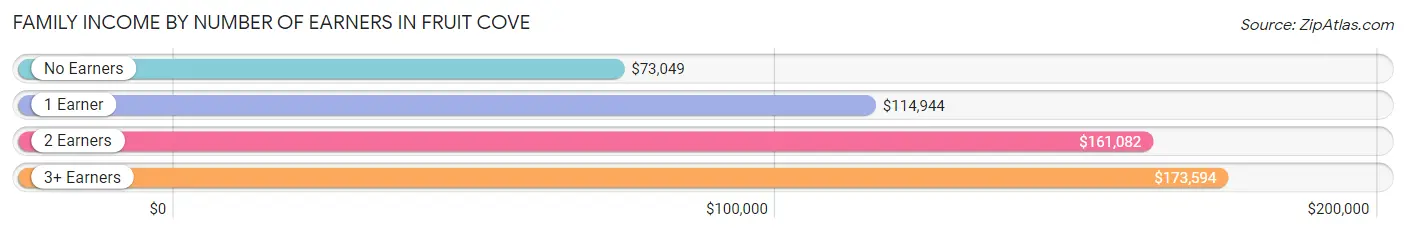
| Number of Earners | # Families | Median Income |
| No Earners | 1,256 (12.8%) | $73,049 |
| 1 Earner | 3,074 (31.2%) | $114,944 |
| 2 Earners | 4,246 (43.1%) | $161,082 |
| 3+ Earners | 1,276 (13.0%) | $173,594 |
| Total | 9,852 (100.0%) | $139,929 |
Household Income in Fruit Cove
Household Income Brackets in Fruit Cove
With 2,527 households falling in the category, the $200,000+ income range is the most frequent in Fruit Cove, accounting for 22.1% of all households. In contrast, only 46 households (0.4%) fall into the $10,000 to $14,999 income bracket, making it the least populous group.
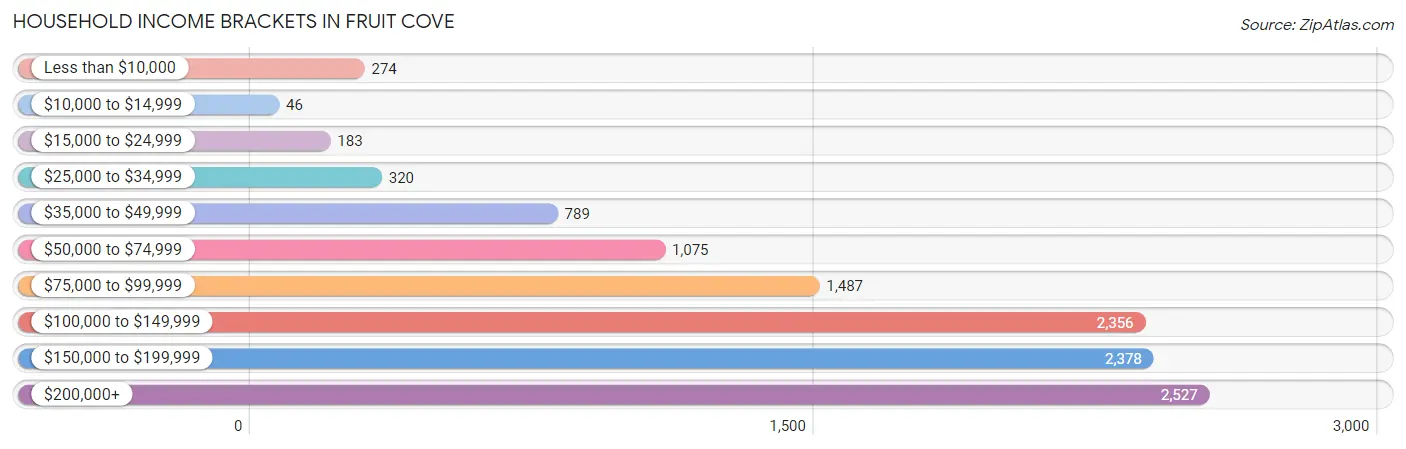
| Income Bracket | # Households | % Households |
| Less than $10,000 | 274 | 2.4% |
| $10,000 to $14,999 | 46 | 0.4% |
| $15,000 to $24,999 | 183 | 1.6% |
| $25,000 to $34,999 | 320 | 2.8% |
| $35,000 to $49,999 | 789 | 6.9% |
| $50,000 to $74,999 | 1,075 | 9.4% |
| $75,000 to $99,999 | 1,487 | 13.0% |
| $100,000 to $149,999 | 2,356 | 20.6% |
| $150,000 to $199,999 | 2,378 | 20.8% |
| $200,000+ | 2,527 | 22.1% |
Household Income by Householder Age in Fruit Cove
The median household income in Fruit Cove is $134,535, with the highest median household income of $158,846 found in the 25 to 44 years age bracket for the primary householder. A total of 2,762 households (24.1%) fall into this category. Meanwhile, the 15 to 24 years age bracket for the primary householder has the lowest median household income of $0, with 24 households (0.2%) in this group.
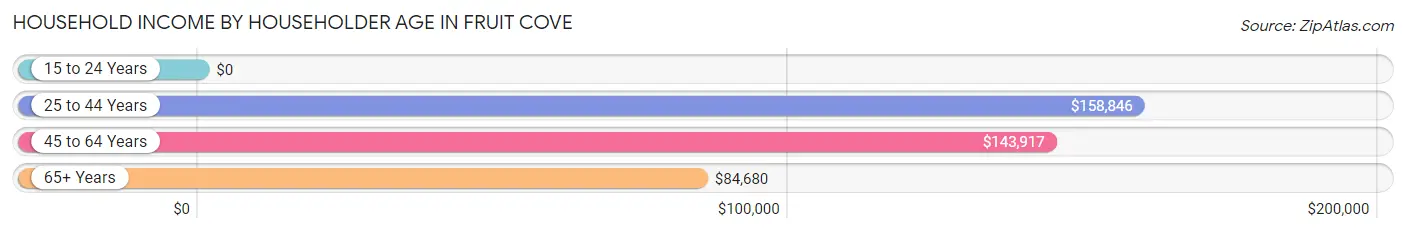
| Income Bracket | # Households | Median Income |
| 15 to 24 Years | 24 (0.2%) | $0 |
| 25 to 44 Years | 2,762 (24.1%) | $158,846 |
| 45 to 64 Years | 5,852 (51.2%) | $143,917 |
| 65+ Years | 2,797 (24.5%) | $84,680 |
| Total | 11,435 (100.0%) | $134,535 |
Poverty in Fruit Cove
Income Below Poverty by Sex and Age in Fruit Cove
With 2.3% poverty level for males and 2.3% for females among the residents of Fruit Cove, 75 year old and over males and 75 year old and over females are the most vulnerable to poverty, with 83 males (9.2%) and 121 females (9.6%) in their respective age groups living below the poverty level.
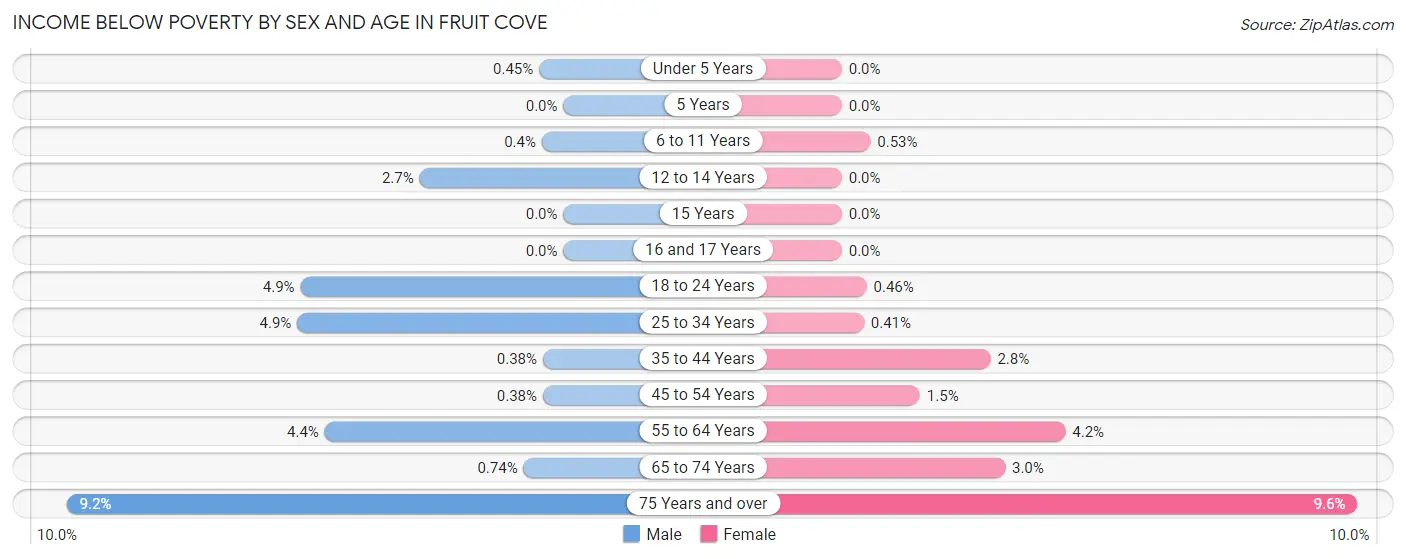
| Age Bracket | Male | Female |
| Under 5 Years | 3 (0.4%) | 0 (0.0%) |
| 5 Years | 0 (0.0%) | 0 (0.0%) |
| 6 to 11 Years | 6 (0.4%) | 9 (0.5%) |
| 12 to 14 Years | 25 (2.7%) | 0 (0.0%) |
| 15 Years | 0 (0.0%) | 0 (0.0%) |
| 16 and 17 Years | 0 (0.0%) | 0 (0.0%) |
| 18 to 24 Years | 76 (4.9%) | 6 (0.5%) |
| 25 to 34 Years | 64 (4.9%) | 5 (0.4%) |
| 35 to 44 Years | 10 (0.4%) | 64 (2.8%) |
| 45 to 54 Years | 10 (0.4%) | 37 (1.5%) |
| 55 to 64 Years | 137 (4.4%) | 115 (4.2%) |
| 65 to 74 Years | 10 (0.7%) | 41 (3.0%) |
| 75 Years and over | 83 (9.2%) | 121 (9.6%) |
| Total | 424 (2.3%) | 398 (2.3%) |
Income Above Poverty by Sex and Age in Fruit Cove
According to the poverty statistics in Fruit Cove, males aged 5 years and females aged under 5 years are the age groups that are most secure financially, with 100.0% of males and 100.0% of females in these age groups living above the poverty line.
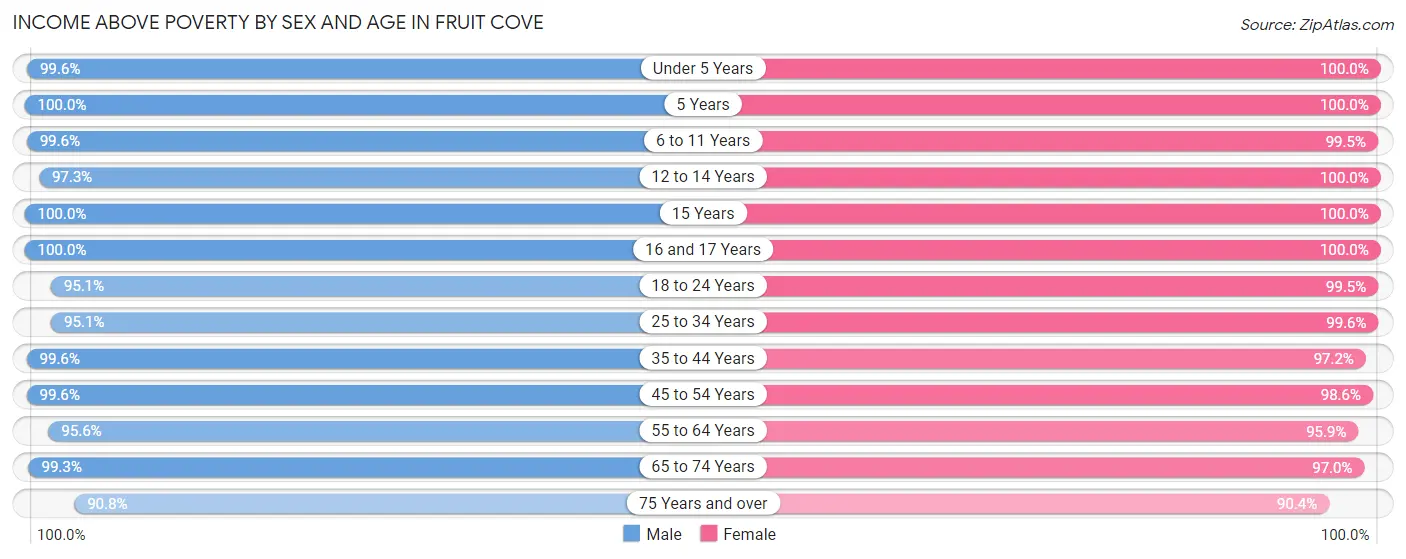
| Age Bracket | Male | Female |
| Under 5 Years | 657 (99.6%) | 682 (100.0%) |
| 5 Years | 420 (100.0%) | 174 (100.0%) |
| 6 to 11 Years | 1,498 (99.6%) | 1,680 (99.5%) |
| 12 to 14 Years | 912 (97.3%) | 957 (100.0%) |
| 15 Years | 389 (100.0%) | 100 (100.0%) |
| 16 and 17 Years | 775 (100.0%) | 601 (100.0%) |
| 18 to 24 Years | 1,481 (95.1%) | 1,309 (99.5%) |
| 25 to 34 Years | 1,231 (95.1%) | 1,219 (99.6%) |
| 35 to 44 Years | 2,624 (99.6%) | 2,253 (97.2%) |
| 45 to 54 Years | 2,610 (99.6%) | 2,519 (98.6%) |
| 55 to 64 Years | 2,958 (95.6%) | 2,656 (95.9%) |
| 65 to 74 Years | 1,348 (99.3%) | 1,313 (97.0%) |
| 75 Years and over | 817 (90.8%) | 1,143 (90.4%) |
| Total | 17,720 (97.7%) | 16,606 (97.7%) |
Income Below Poverty Among Married-Couple Families in Fruit Cove
The poverty statistics for married-couple families in Fruit Cove show that 1.9% or 160 of the total 8,511 families live below the poverty line. Families with no children have the highest poverty rate of 3.6%, comprising of 157 families. On the other hand, families with 3 or 4 children have the lowest poverty rate of 0.0%, which includes 0 families.
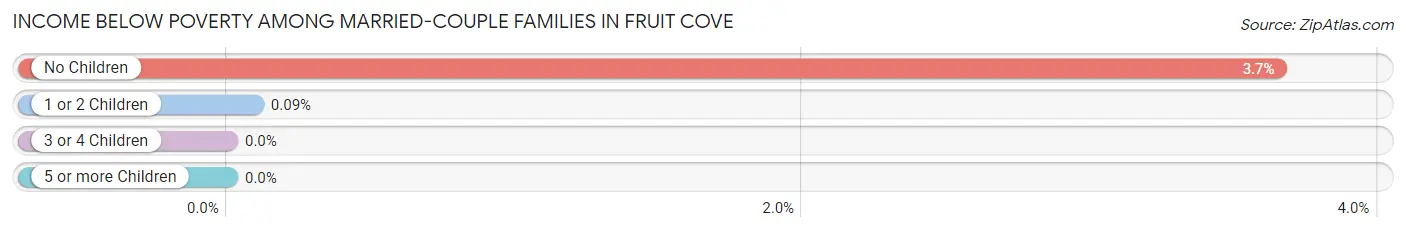
| Children | Above Poverty | Below Poverty |
| No Children | 4,145 (96.4%) | 157 (3.6%) |
| 1 or 2 Children | 3,171 (99.9%) | 3 (0.1%) |
| 3 or 4 Children | 1,035 (100.0%) | 0 (0.0%) |
| 5 or more Children | 0 (0.0%) | 0 (0.0%) |
| Total | 8,351 (98.1%) | 160 (1.9%) |
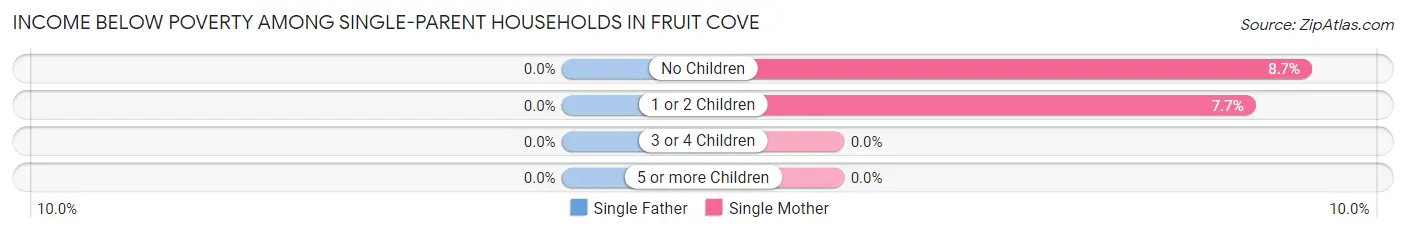
Income Below Poverty Among Single-Parent Households in Fruit Cove
| Children | Single Father | Single Mother |
| No Children | 0 (0.0%) | 28 (8.7%) |
| 1 or 2 Children | 0 (0.0%) | 33 (7.7%) |
| 3 or 4 Children | 0 (0.0%) | 0 (0.0%) |
| 5 or more Children | 0 (0.0%) | 0 (0.0%) |
| Total | 0 (0.0%) | 61 (7.2%) |
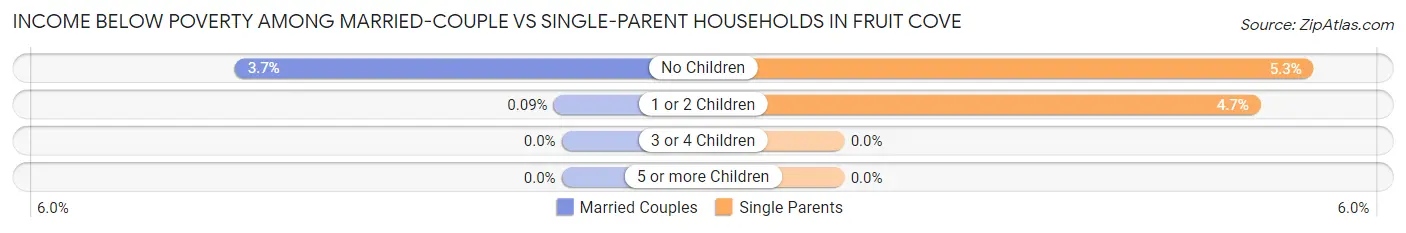
Income Below Poverty Among Married-Couple vs Single-Parent Households in Fruit Cove
The poverty data for Fruit Cove shows that 160 of the married-couple family households (1.9%) and 61 of the single-parent households (4.5%) are living below the poverty level. Within the married-couple family households, those with no children have the highest poverty rate, with 157 households (3.6%) falling below the poverty line. Among the single-parent households, those with no children have the highest poverty rate, with 28 household (5.2%) living below poverty.
| Children | Married-Couple Families | Single-Parent Households |
| No Children | 157 (3.6%) | 28 (5.2%) |
| 1 or 2 Children | 3 (0.1%) | 33 (4.7%) |
| 3 or 4 Children | 0 (0.0%) | 0 (0.0%) |
| 5 or more Children | 0 (0.0%) | 0 (0.0%) |
| Total | 160 (1.9%) | 61 (4.5%) |
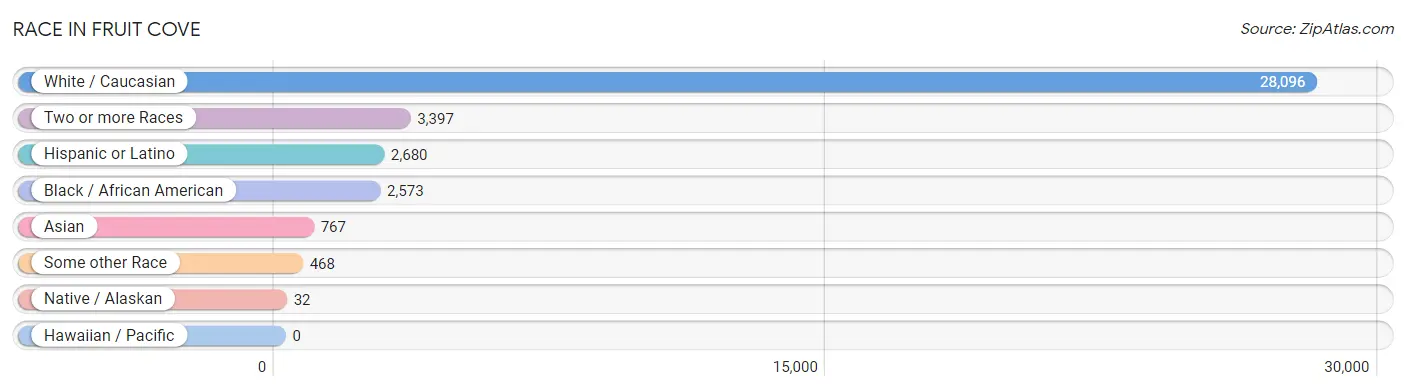
Race in Fruit Cove
The most populous races in Fruit Cove are White / Caucasian (28,096 | 79.5%), Two or more Races (3,397 | 9.6%), and Hispanic or Latino (2,680 | 7.6%).
| Race | # Population | % Population |
| Asian | 767 | 2.2% |
| Black / African American | 2,573 | 7.3% |
| Hawaiian / Pacific | 0 | 0.0% |
| Hispanic or Latino | 2,680 | 7.6% |
| Native / Alaskan | 32 | 0.1% |
| White / Caucasian | 28,096 | 79.5% |
| Two or more Races | 3,397 | 9.6% |
| Some other Race | 468 | 1.3% |
| Total | 35,333 | 100.0% |
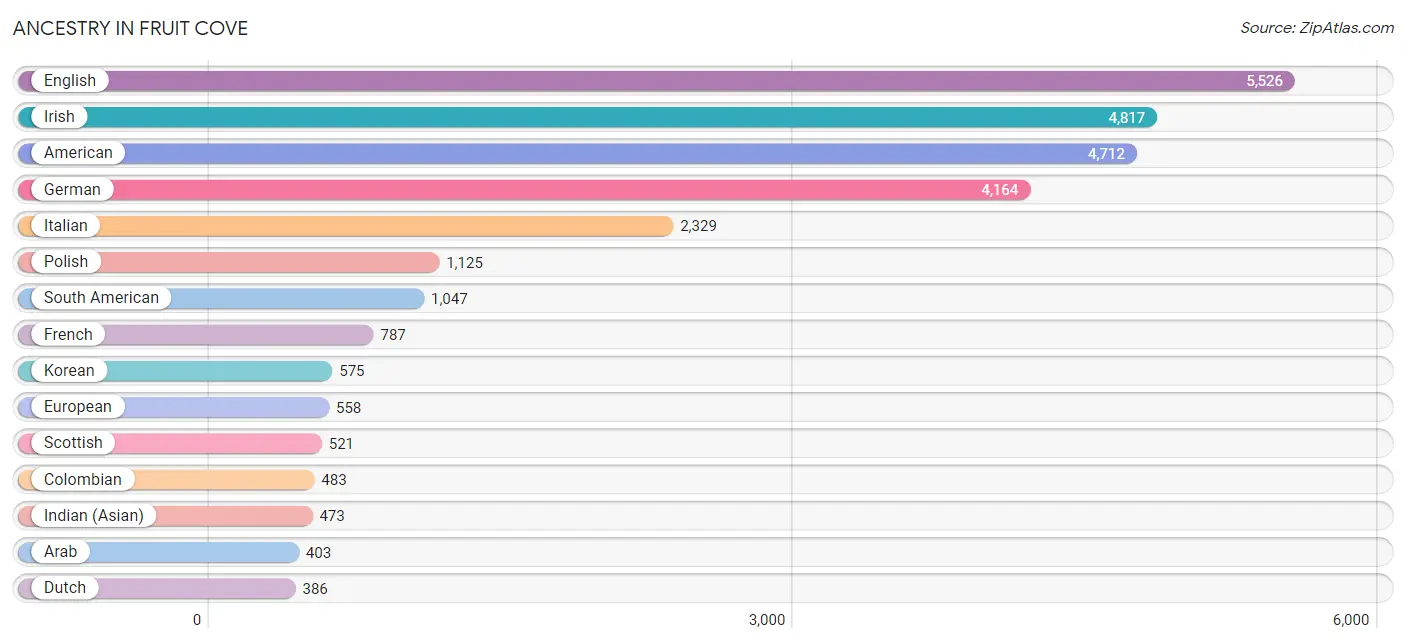
Ancestry in Fruit Cove
The most populous ancestries reported in Fruit Cove are English (5,526 | 15.6%), Irish (4,817 | 13.6%), American (4,712 | 13.3%), German (4,164 | 11.8%), and Italian (2,329 | 6.6%), together accounting for 61.0% of all Fruit Cove residents.
| Ancestry | # Population | % Population |
| African | 48 | 0.1% |
| Albanian | 60 | 0.2% |
| American | 4,712 | 13.3% |
| Arab | 403 | 1.1% |
| Argentinean | 12 | 0.0% |
| Armenian | 31 | 0.1% |
| Austrian | 97 | 0.3% |
| Belgian | 15 | 0.0% |
| Belizean | 9 | 0.0% |
| Bhutanese | 120 | 0.3% |
| Bolivian | 16 | 0.1% |
| Brazilian | 78 | 0.2% |
| British | 314 | 0.9% |
| Burmese | 57 | 0.2% |
| Canadian | 121 | 0.3% |
| Cape Verdean | 129 | 0.4% |
| Central American | 143 | 0.4% |
| Cherokee | 188 | 0.5% |
| Cheyenne | 117 | 0.3% |
| Chilean | 6 | 0.0% |
| Choctaw | 30 | 0.1% |
| Colombian | 483 | 1.4% |
| Creek | 7 | 0.0% |
| Croatian | 49 | 0.1% |
| Cuban | 363 | 1.0% |
| Czech | 143 | 0.4% |
| Czechoslovakian | 18 | 0.1% |
| Danish | 343 | 1.0% |
| Dominican | 129 | 0.4% |
| Dutch | 386 | 1.1% |
| Eastern European | 188 | 0.5% |
| Egyptian | 21 | 0.1% |
| English | 5,526 | 15.6% |
| European | 558 | 1.6% |
| Filipino | 75 | 0.2% |
| Finnish | 13 | 0.0% |
| French | 787 | 2.2% |
| French Canadian | 259 | 0.7% |
| German | 4,164 | 11.8% |
| Greek | 43 | 0.1% |
| Guamanian / Chamorro | 20 | 0.1% |
| Guyanese | 8 | 0.0% |
| Haitian | 50 | 0.1% |
| Honduran | 13 | 0.0% |
| Hungarian | 190 | 0.5% |
| Icelander | 20 | 0.1% |
| Indian (Asian) | 473 | 1.3% |
| Irish | 4,817 | 13.6% |
| Italian | 2,329 | 6.6% |
| Jamaican | 90 | 0.3% |
| Korean | 575 | 1.6% |
| Laotian | 22 | 0.1% |
| Lebanese | 218 | 0.6% |
| Lithuanian | 36 | 0.1% |
| Luxembourger | 30 | 0.1% |
| Malaysian | 31 | 0.1% |
| Mexican | 295 | 0.8% |
| Nicaraguan | 12 | 0.0% |
| Northern European | 62 | 0.2% |
| Norwegian | 224 | 0.6% |
| Pakistani | 56 | 0.2% |
| Panamanian | 108 | 0.3% |
| Peruvian | 386 | 1.1% |
| Polish | 1,125 | 3.2% |
| Portuguese | 28 | 0.1% |
| Puerto Rican | 277 | 0.8% |
| Romanian | 12 | 0.0% |
| Russian | 288 | 0.8% |
| Salvadoran | 10 | 0.0% |
| Scandinavian | 125 | 0.4% |
| Scotch-Irish | 350 | 1.0% |
| Scottish | 521 | 1.5% |
| Seminole | 32 | 0.1% |
| Serbian | 25 | 0.1% |
| Slavic | 28 | 0.1% |
| Slovak | 83 | 0.2% |
| South American | 1,047 | 3.0% |
| Spaniard | 121 | 0.3% |
| Spanish | 171 | 0.5% |
| Sri Lankan | 25 | 0.1% |
| Subsaharan African | 177 | 0.5% |
| Swedish | 250 | 0.7% |
| Swiss | 95 | 0.3% |
| Syrian | 104 | 0.3% |
| Thai | 72 | 0.2% |
| Turkish | 31 | 0.1% |
| Ukrainian | 224 | 0.6% |
| Ute | 27 | 0.1% |
| Venezuelan | 144 | 0.4% |
| Vietnamese | 52 | 0.2% |
| Welsh | 178 | 0.5% | View All 91 Rows |
Immigrants in Fruit Cove
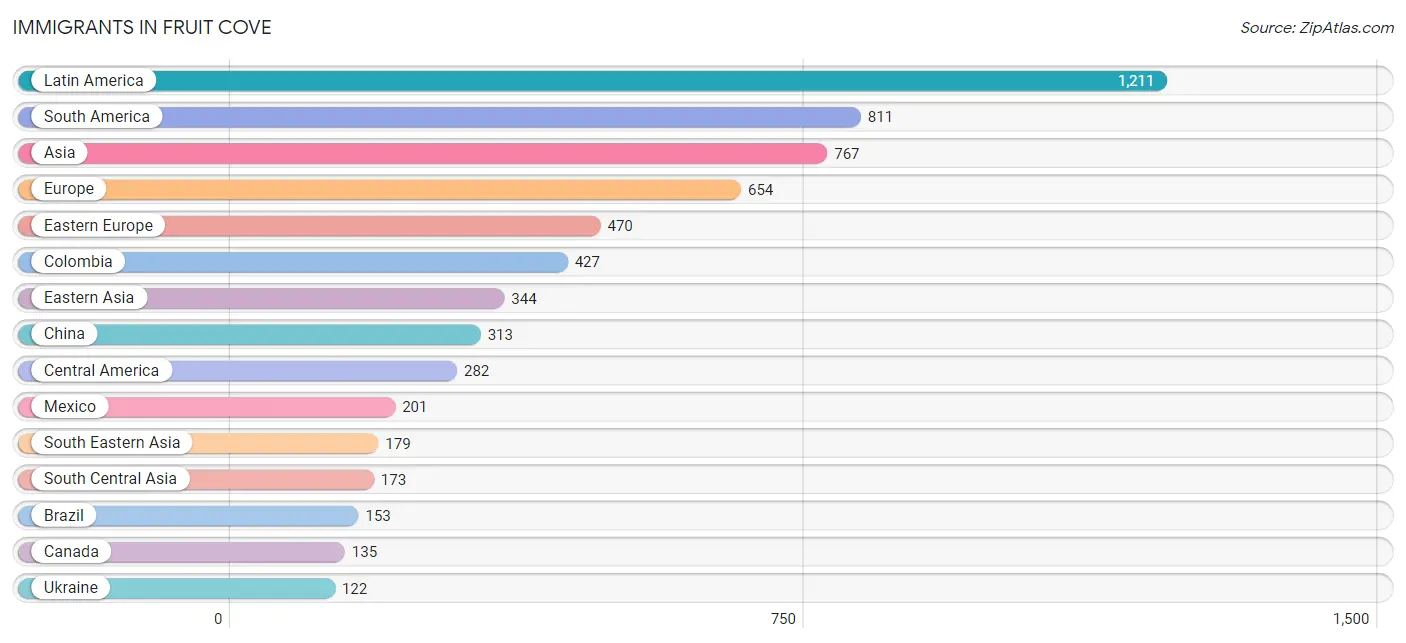
The most numerous immigrant groups reported in Fruit Cove came from Latin America (1,211 | 3.4%), South America (811 | 2.3%), Asia (767 | 2.2%), Europe (654 | 1.8%), and Eastern Europe (470 | 1.3%), together accounting for 11.1% of all Fruit Cove residents.
| Immigration Origin | # Population | % Population |
| Africa | 84 | 0.2% |
| Albania | 45 | 0.1% |
| Asia | 767 | 2.2% |
| Australia | 9 | 0.0% |
| Bangladesh | 52 | 0.2% |
| Belarus | 15 | 0.0% |
| Belize | 9 | 0.0% |
| Bosnia and Herzegovina | 12 | 0.0% |
| Brazil | 153 | 0.4% |
| Canada | 135 | 0.4% |
| Caribbean | 118 | 0.3% |
| Central America | 282 | 0.8% |
| China | 313 | 0.9% |
| Colombia | 427 | 1.2% |
| Cuba | 34 | 0.1% |
| Czechoslovakia | 18 | 0.1% |
| Dominican Republic | 25 | 0.1% |
| Eastern Asia | 344 | 1.0% |
| Eastern Europe | 470 | 1.3% |
| Ecuador | 6 | 0.0% |
| El Salvador | 10 | 0.0% |
| England | 27 | 0.1% |
| Europe | 654 | 1.8% |
| Germany | 84 | 0.2% |
| Guyana | 23 | 0.1% |
| Haiti | 21 | 0.1% |
| Honduras | 13 | 0.0% |
| Hong Kong | 5 | 0.0% |
| India | 34 | 0.1% |
| Indonesia | 6 | 0.0% |
| Ireland | 8 | 0.0% |
| Italy | 26 | 0.1% |
| Jamaica | 38 | 0.1% |
| Japan | 28 | 0.1% |
| Korea | 3 | 0.0% |
| Laos | 31 | 0.1% |
| Latin America | 1,211 | 3.4% |
| Malaysia | 21 | 0.1% |
| Mexico | 201 | 0.6% |
| Nicaragua | 12 | 0.0% |
| Nigeria | 26 | 0.1% |
| Northern Africa | 50 | 0.1% |
| Northern Europe | 74 | 0.2% |
| Oceania | 9 | 0.0% |
| Pakistan | 87 | 0.3% |
| Panama | 37 | 0.1% |
| Peru | 104 | 0.3% |
| Philippines | 96 | 0.3% |
| Poland | 102 | 0.3% |
| Romania | 65 | 0.2% |
| Russia | 91 | 0.3% |
| South Africa | 8 | 0.0% |
| South America | 811 | 2.3% |
| South Central Asia | 173 | 0.5% |
| South Eastern Asia | 179 | 0.5% |
| Southern Europe | 26 | 0.1% |
| Syria | 10 | 0.0% |
| Taiwan | 83 | 0.2% |
| Ukraine | 122 | 0.4% |
| Venezuela | 98 | 0.3% |
| Vietnam | 25 | 0.1% |
| Western Africa | 26 | 0.1% |
| Western Asia | 71 | 0.2% |
| Western Europe | 84 | 0.2% | View All 64 Rows |
Sex and Age in Fruit Cove
Sex and Age in Fruit Cove
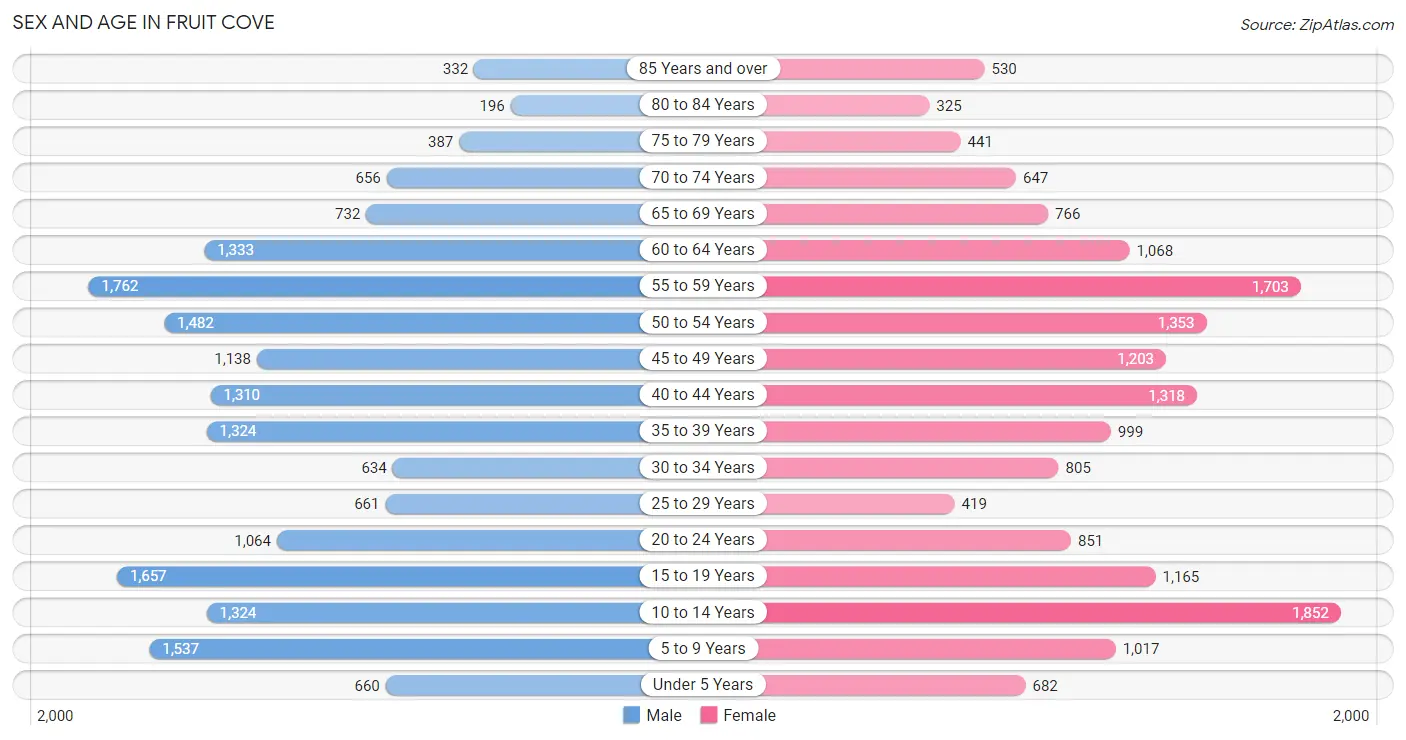
The most populous age groups in Fruit Cove are 55 to 59 Years (1,762 | 9.7%) for men and 10 to 14 Years (1,852 | 10.8%) for women.
| Age Bracket | Male | Female |
| Under 5 Years | 660 (3.6%) | 682 (4.0%) |
| 5 to 9 Years | 1,537 (8.5%) | 1,017 (5.9%) |
| 10 to 14 Years | 1,324 (7.3%) | 1,852 (10.8%) |
| 15 to 19 Years | 1,657 (9.1%) | 1,165 (6.8%) |
| 20 to 24 Years | 1,064 (5.9%) | 851 (5.0%) |
| 25 to 29 Years | 661 (3.6%) | 419 (2.4%) |
| 30 to 34 Years | 634 (3.5%) | 805 (4.7%) |
| 35 to 39 Years | 1,324 (7.3%) | 999 (5.8%) |
| 40 to 44 Years | 1,310 (7.2%) | 1,318 (7.7%) |
| 45 to 49 Years | 1,138 (6.3%) | 1,203 (7.0%) |
| 50 to 54 Years | 1,482 (8.2%) | 1,353 (7.9%) |
| 55 to 59 Years | 1,762 (9.7%) | 1,703 (9.9%) |
| 60 to 64 Years | 1,333 (7.3%) | 1,068 (6.2%) |
| 65 to 69 Years | 732 (4.0%) | 766 (4.5%) |
| 70 to 74 Years | 656 (3.6%) | 647 (3.8%) |
| 75 to 79 Years | 387 (2.1%) | 441 (2.6%) |
| 80 to 84 Years | 196 (1.1%) | 325 (1.9%) |
| 85 Years and over | 332 (1.8%) | 530 (3.1%) |
| Total | 18,189 (100.0%) | 17,144 (100.0%) |
Families and Households in Fruit Cove
Median Family Size in Fruit Cove
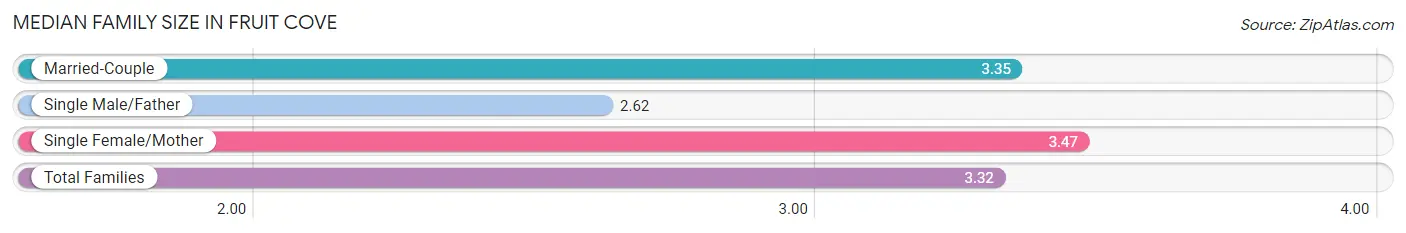
The median family size in Fruit Cove is 3.32 persons per family, with single female/mother families (843 | 8.6%) accounting for the largest median family size of 3.47 persons per family. On the other hand, single male/father families (498 | 5.1%) represent the smallest median family size with 2.62 persons per family.
| Family Type | # Families | Family Size |
| Married-Couple | 8,511 (86.4%) | 3.35 |
| Single Male/Father | 498 (5.1%) | 2.62 |
| Single Female/Mother | 843 (8.6%) | 3.47 |
| Total Families | 9,852 (100.0%) | 3.32 |
Median Household Size in Fruit Cove
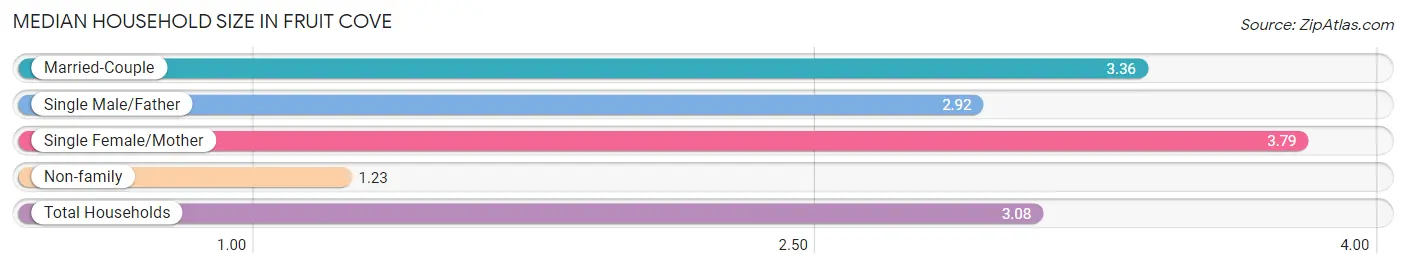
The median household size in Fruit Cove is 3.08 persons per household, with single female/mother households (843 | 7.4%) accounting for the largest median household size of 3.79 persons per household. non-family households (1,583 | 13.8%) represent the smallest median household size with 1.23 persons per household.
| Household Type | # Households | Household Size |
| Married-Couple | 8,511 (74.4%) | 3.36 |
| Single Male/Father | 498 (4.4%) | 2.92 |
| Single Female/Mother | 843 (7.4%) | 3.79 |
| Non-family | 1,583 (13.8%) | 1.23 |
| Total Households | 11,435 (100.0%) | 3.08 |
Household Size by Marriage Status in Fruit Cove
Out of a total of 11,435 households in Fruit Cove, 9,852 (86.2%) are family households, while 1,583 (13.8%) are nonfamily households. The most numerous type of family households are 2-person households, comprising 3,368, and the most common type of nonfamily households are 1-person households, comprising 1,298.
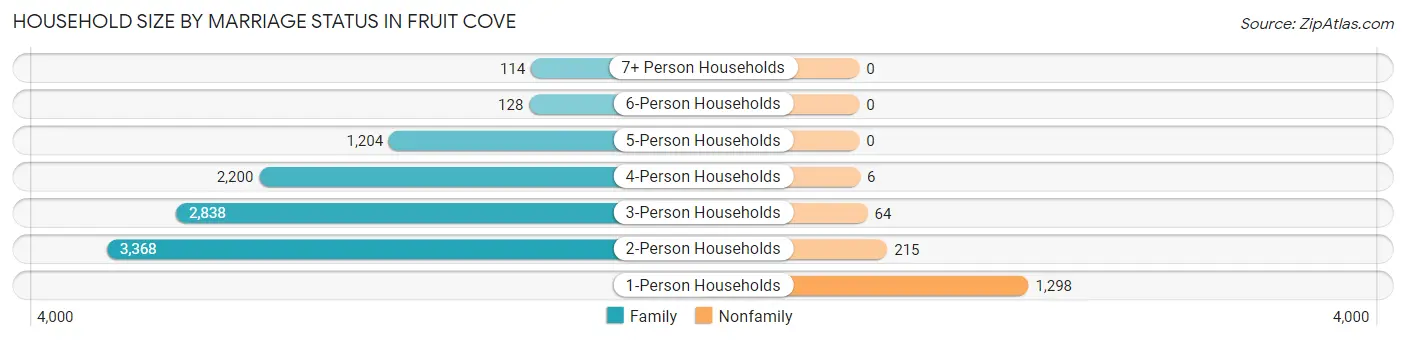
| Household Size | Family Households | Nonfamily Households |
| 1-Person Households | - | 1,298 (11.4%) |
| 2-Person Households | 3,368 (29.4%) | 215 (1.9%) |
| 3-Person Households | 2,838 (24.8%) | 64 (0.6%) |
| 4-Person Households | 2,200 (19.2%) | 6 (0.1%) |
| 5-Person Households | 1,204 (10.5%) | 0 (0.0%) |
| 6-Person Households | 128 (1.1%) | 0 (0.0%) |
| 7+ Person Households | 114 (1.0%) | 0 (0.0%) |
| Total | 9,852 (86.2%) | 1,583 (13.8%) |
Female Fertility in Fruit Cove
Fertility by Age in Fruit Cove
Average fertility rate in Fruit Cove is 33.0 births per 1,000 women. Women in the age bracket of 20 to 34 years have the highest fertility rate with 104.0 births per 1,000 women. Women in the age bracket of 20 to 34 years acount for 91.1% of all women with births.
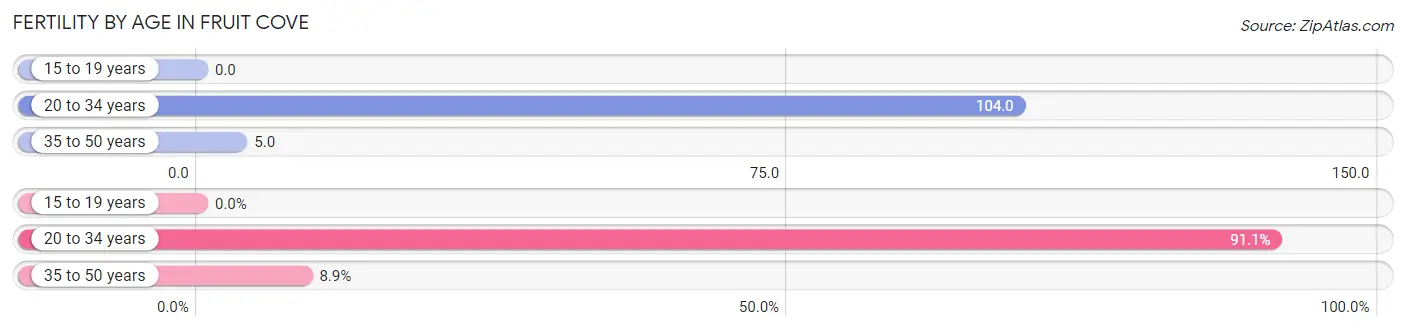
| Age Bracket | Women with Births | Births / 1,000 Women |
| 15 to 19 years | 0 (0.0%) | 0.0 |
| 20 to 34 years | 216 (91.1%) | 104.0 |
| 35 to 50 years | 21 (8.9%) | 5.0 |
| Total | 237 (100.0%) | 33.0 |
Fertility by Age by Marriage Status in Fruit Cove
97.0% of women with births (237) in Fruit Cove are married. The highest percentage of unmarried women with births falls into 20 to 34 years age bracket with 3.2% of them unmarried at the time of birth, while the lowest percentage of unmarried women with births belong to 35 to 50 years age bracket with 0.0% of them unmarried.
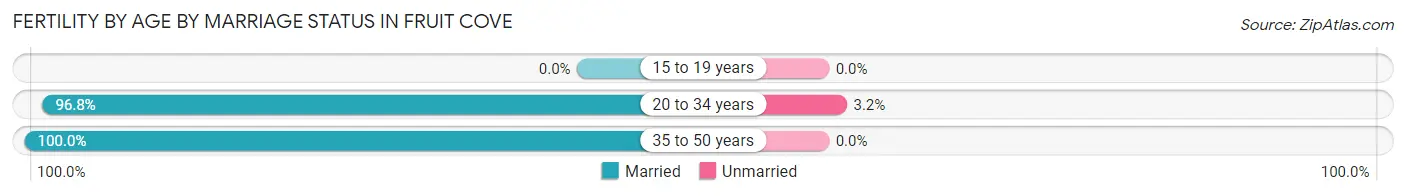
| Age Bracket | Married | Unmarried |
| 15 to 19 years | 0 (0.0%) | 0 (0.0%) |
| 20 to 34 years | 209 (96.8%) | 7 (3.2%) |
| 35 to 50 years | 21 (100.0%) | 0 (0.0%) |
| Total | 230 (97.1%) | 7 (2.9%) |
Fertility by Education in Fruit Cove
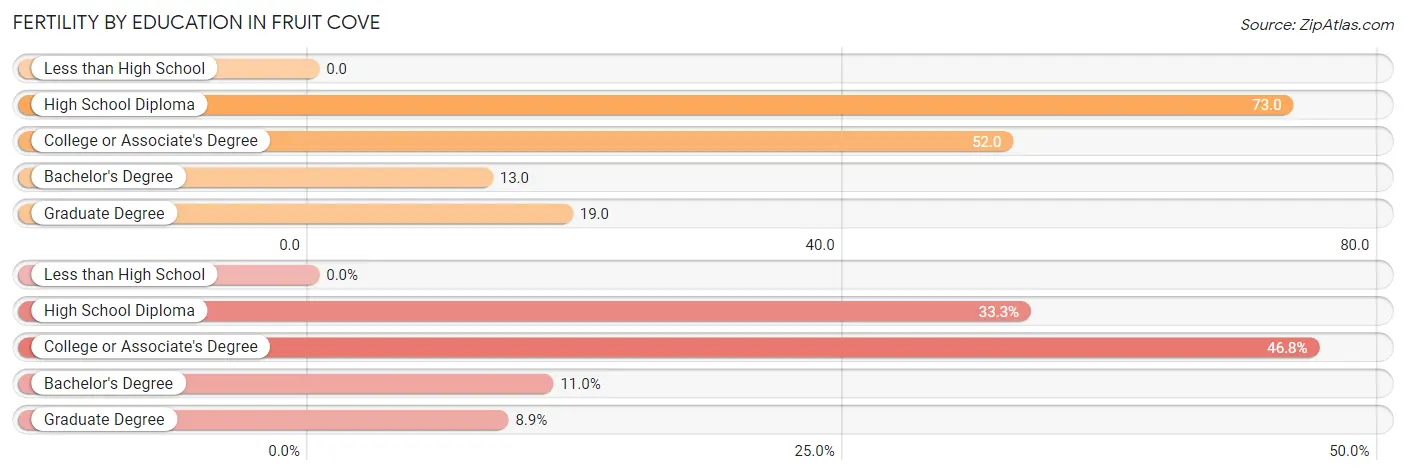
| Educational Attainment | Women with Births | Births / 1,000 Women |
| Less than High School | 0 (0.0%) | 0.0 |
| High School Diploma | 79 (33.3%) | 73.0 |
| College or Associate's Degree | 111 (46.8%) | 52.0 |
| Bachelor's Degree | 26 (11.0%) | 13.0 |
| Graduate Degree | 21 (8.9%) | 19.0 |
| Total | 237 (100.0%) | 33.0 |
Fertility by Education by Marriage Status in Fruit Cove
2.9% of women with births in Fruit Cove are unmarried. Women with the educational attainment of high school diploma are most likely to be married with 100.0% of them married at childbirth, while women with the educational attainment of bachelor's degree are least likely to be married with 26.9% of them unmarried at childbirth.
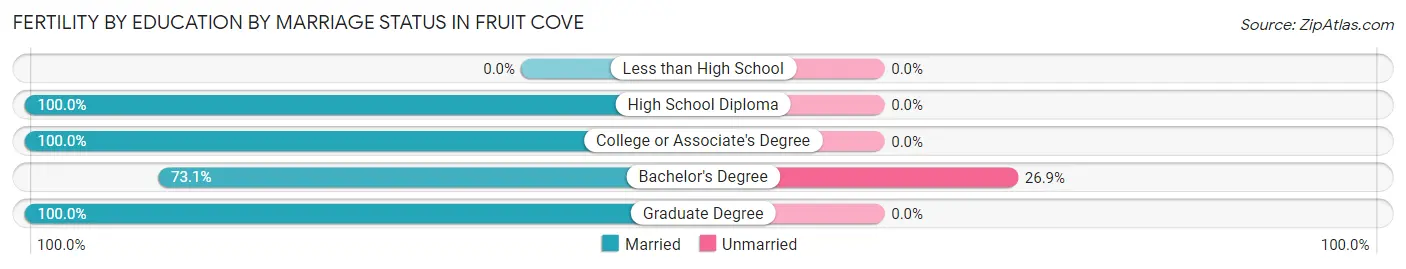
| Educational Attainment | Married | Unmarried |
| Less than High School | 0 (0.0%) | 0 (0.0%) |
| High School Diploma | 79 (100.0%) | 0 (0.0%) |
| College or Associate's Degree | 111 (100.0%) | 0 (0.0%) |
| Bachelor's Degree | 19 (73.1%) | 7 (26.9%) |
| Graduate Degree | 21 (100.0%) | 0 (0.0%) |
| Total | 230 (97.1%) | 7 (2.9%) |
Employment Characteristics in Fruit Cove
Employment by Class of Employer in Fruit Cove
Among the 17,023 employed individuals in Fruit Cove, private company employees (11,350 | 66.7%), not-for-profit organizations (1,529 | 9.0%), and self-employed (incorporated) (1,028 | 6.0%) make up the most common classes of employment.
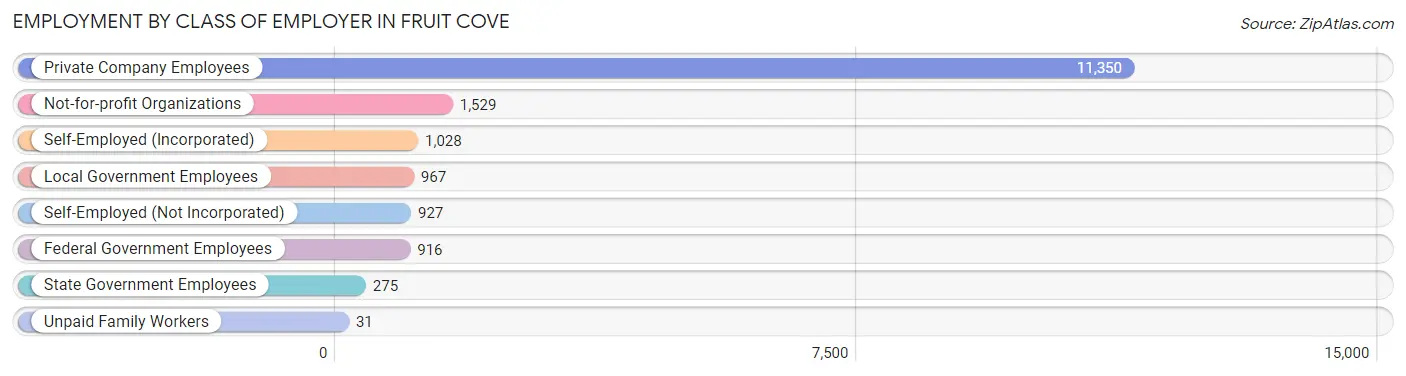
| Employer Class | # Employees | % Employees |
| Private Company Employees | 11,350 | 66.7% |
| Self-Employed (Incorporated) | 1,028 | 6.0% |
| Self-Employed (Not Incorporated) | 927 | 5.4% |
| Not-for-profit Organizations | 1,529 | 9.0% |
| Local Government Employees | 967 | 5.7% |
| State Government Employees | 275 | 1.6% |
| Federal Government Employees | 916 | 5.4% |
| Unpaid Family Workers | 31 | 0.2% |
| Total | 17,023 | 100.0% |
Employment Status by Age in Fruit Cove
According to the labor force statistics for Fruit Cove, out of the total population over 16 years of age (27,772), 63.7% or 17,691 individuals are in the labor force, with 2.7% or 478 of them unemployed. The age group with the highest labor force participation rate is 35 to 44 years, with 87.2% or 4,317 individuals in the labor force. Within the labor force, the 75 years and over age range has the highest percentage of unemployed individuals, with 15.9% or 20 of them being unemployed.
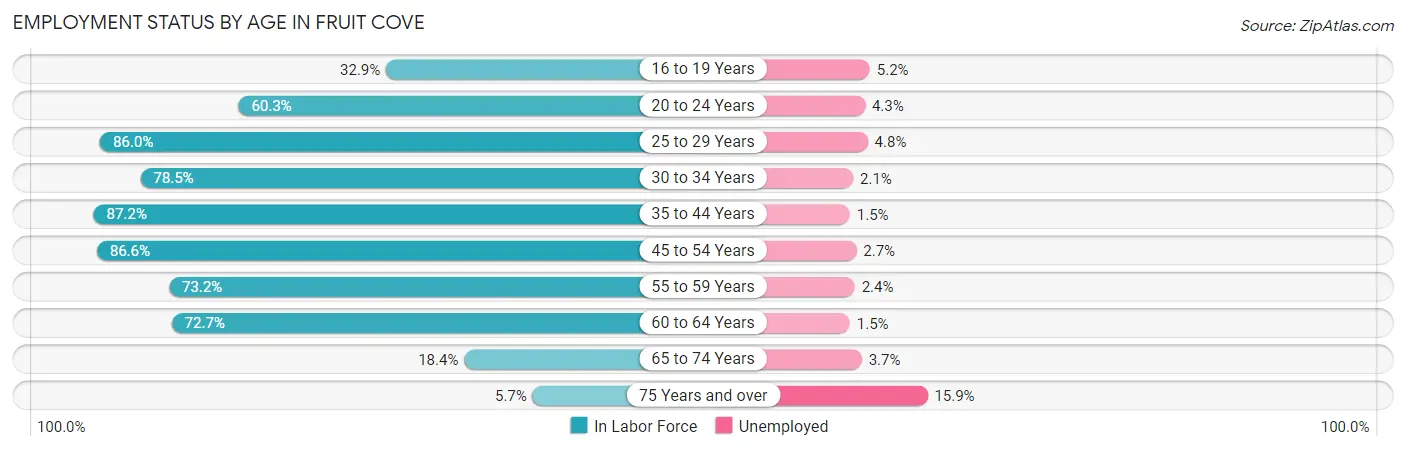
| Age Bracket | In Labor Force | Unemployed |
| 16 to 19 Years | 768 (32.9%) | 40 (5.2%) |
| 20 to 24 Years | 1,155 (60.3%) | 50 (4.3%) |
| 25 to 29 Years | 929 (86.0%) | 45 (4.8%) |
| 30 to 34 Years | 1,130 (78.5%) | 24 (2.1%) |
| 35 to 44 Years | 4,317 (87.2%) | 65 (1.5%) |
| 45 to 54 Years | 4,482 (86.6%) | 121 (2.7%) |
| 55 to 59 Years | 2,536 (73.2%) | 61 (2.4%) |
| 60 to 64 Years | 1,746 (72.7%) | 26 (1.5%) |
| 65 to 74 Years | 515 (18.4%) | 19 (3.7%) |
| 75 Years and over | 126 (5.7%) | 20 (15.9%) |
| Total | 17,691 (63.7%) | 478 (2.7%) |
Employment Status by Educational Attainment in Fruit Cove
According to labor force statistics for Fruit Cove, 81.8% of individuals (15,143) out of the total population between 25 and 64 years of age (18,512) are in the labor force, with 2.3% or 348 of them being unemployed. The group with the highest labor force participation rate are those with the educational attainment of bachelor's degree or higher, with 85.6% or 8,679 individuals in the labor force. Within the labor force, individuals with high school diploma education have the highest percentage of unemployment, with 3.1% or 77 of them being unemployed.
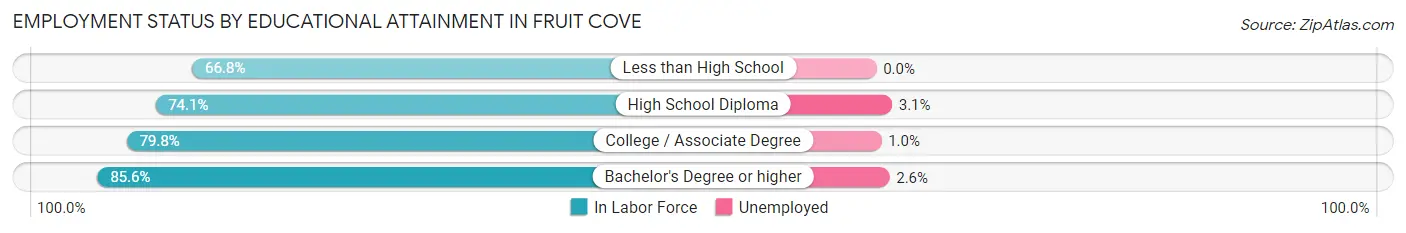
| Educational Attainment | In Labor Force | Unemployed |
| Less than High School | 181 (66.8%) | 0 (0.0%) |
| High School Diploma | 2,483 (74.1%) | 104 (3.1%) |
| College / Associate Degree | 3,791 (79.8%) | 48 (1.0%) |
| Bachelor's Degree or higher | 8,679 (85.6%) | 264 (2.6%) |
| Total | 15,143 (81.8%) | 426 (2.3%) |
Employment Occupations by Sex in Fruit Cove
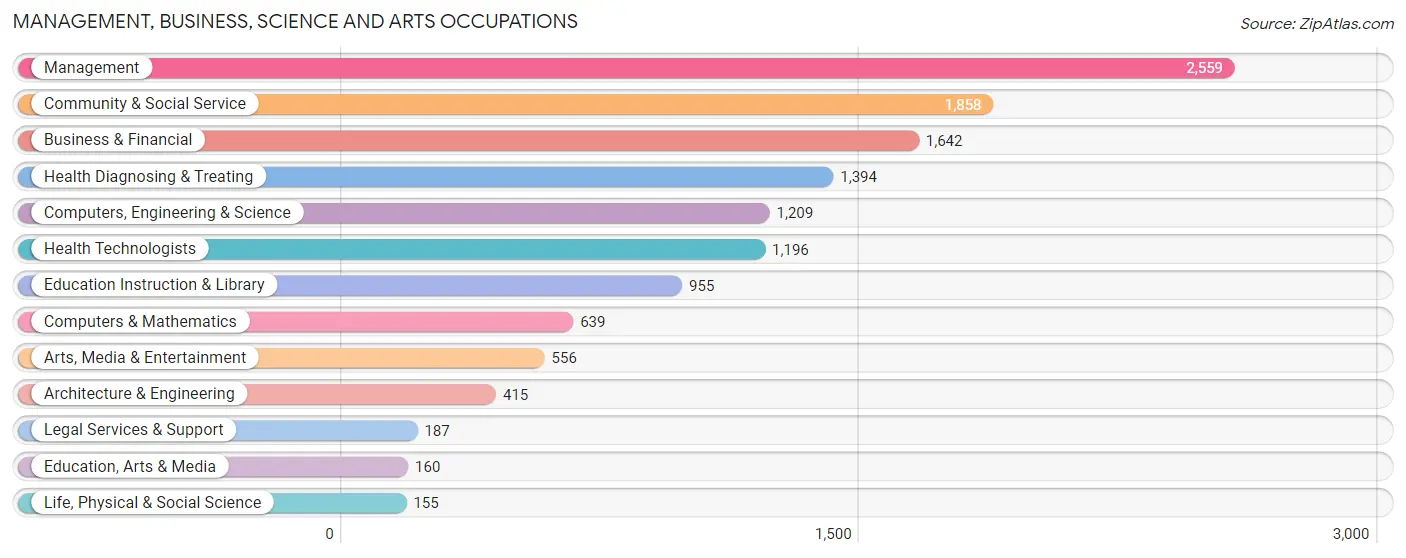
Management, Business, Science and Arts Occupations
The most common Management, Business, Science and Arts occupations in Fruit Cove are Management (2,559 | 15.1%), Community & Social Service (1,858 | 10.9%), Business & Financial (1,642 | 9.7%), Health Diagnosing & Treating (1,394 | 8.2%), and Computers, Engineering & Science (1,209 | 7.1%).
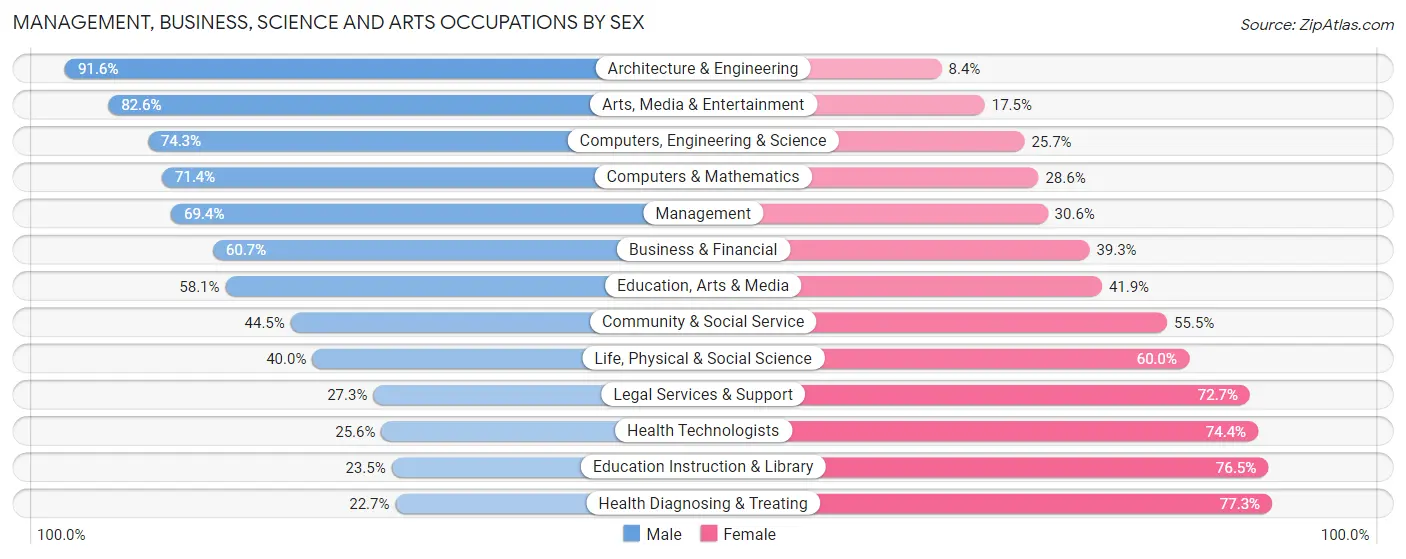
Management, Business, Science and Arts Occupations by Sex
Within the Management, Business, Science and Arts occupations in Fruit Cove, the most male-oriented occupations are Architecture & Engineering (91.6%), Arts, Media & Entertainment (82.6%), and Computers, Engineering & Science (74.3%), while the most female-oriented occupations are Health Diagnosing & Treating (77.3%), Education Instruction & Library (76.5%), and Health Technologists (74.4%).
| Occupation | Male | Female |
| Management | 1,777 (69.4%) | 782 (30.6%) |
| Business & Financial | 997 (60.7%) | 645 (39.3%) |
| Computers, Engineering & Science | 898 (74.3%) | 311 (25.7%) |
| Computers & Mathematics | 456 (71.4%) | 183 (28.6%) |
| Architecture & Engineering | 380 (91.6%) | 35 (8.4%) |
| Life, Physical & Social Science | 62 (40.0%) | 93 (60.0%) |
| Community & Social Service | 827 (44.5%) | 1,031 (55.5%) |
| Education, Arts & Media | 93 (58.1%) | 67 (41.9%) |
| Legal Services & Support | 51 (27.3%) | 136 (72.7%) |
| Education Instruction & Library | 224 (23.5%) | 731 (76.5%) |
| Arts, Media & Entertainment | 459 (82.6%) | 97 (17.4%) |
| Health Diagnosing & Treating | 316 (22.7%) | 1,078 (77.3%) |
| Health Technologists | 306 (25.6%) | 890 (74.4%) |
| Total (Category) | 4,815 (55.6%) | 3,847 (44.4%) |
| Total (Overall) | 10,016 (59.0%) | 6,971 (41.0%) |
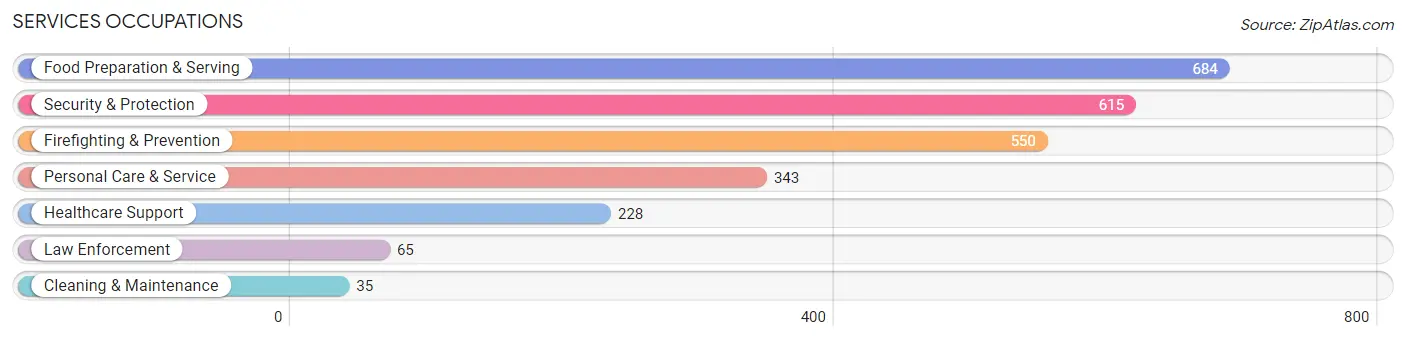
Services Occupations
The most common Services occupations in Fruit Cove are Food Preparation & Serving (684 | 4.0%), Security & Protection (615 | 3.6%), Firefighting & Prevention (550 | 3.2%), Personal Care & Service (343 | 2.0%), and Healthcare Support (228 | 1.3%).
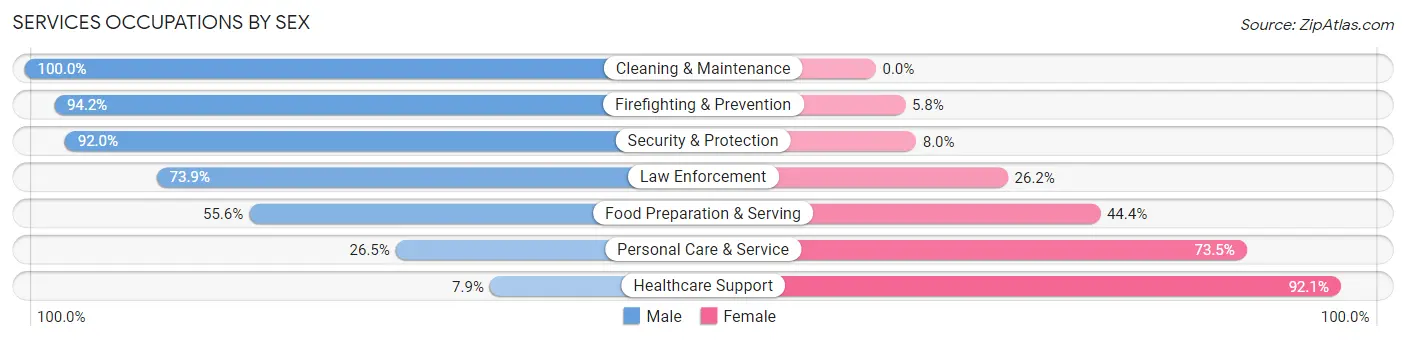
Services Occupations by Sex
Within the Services occupations in Fruit Cove, the most male-oriented occupations are Cleaning & Maintenance (100.0%), Firefighting & Prevention (94.2%), and Security & Protection (92.0%), while the most female-oriented occupations are Healthcare Support (92.1%), Personal Care & Service (73.5%), and Food Preparation & Serving (44.4%).
| Occupation | Male | Female |
| Healthcare Support | 18 (7.9%) | 210 (92.1%) |
| Security & Protection | 566 (92.0%) | 49 (8.0%) |
| Firefighting & Prevention | 518 (94.2%) | 32 (5.8%) |
| Law Enforcement | 48 (73.9%) | 17 (26.2%) |
| Food Preparation & Serving | 380 (55.6%) | 304 (44.4%) |
| Cleaning & Maintenance | 35 (100.0%) | 0 (0.0%) |
| Personal Care & Service | 91 (26.5%) | 252 (73.5%) |
| Total (Category) | 1,090 (57.2%) | 815 (42.8%) |
| Total (Overall) | 10,016 (59.0%) | 6,971 (41.0%) |
Sales and Office Occupations
The most common Sales and Office occupations in Fruit Cove are Sales & Related (2,759 | 16.2%), and Office & Administration (1,825 | 10.7%).

Sales and Office Occupations by Sex
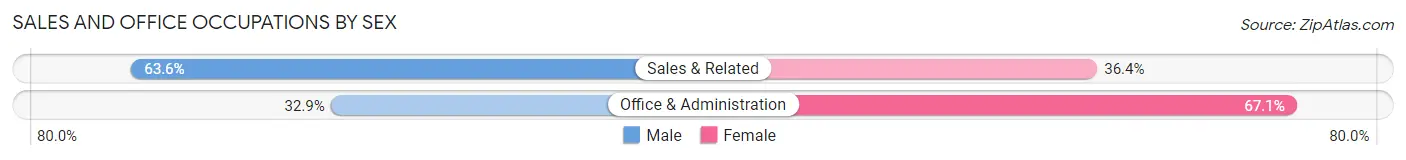
| Occupation | Male | Female |
| Sales & Related | 1,754 (63.6%) | 1,005 (36.4%) |
| Office & Administration | 601 (32.9%) | 1,224 (67.1%) |
| Total (Category) | 2,355 (51.4%) | 2,229 (48.6%) |
| Total (Overall) | 10,016 (59.0%) | 6,971 (41.0%) |
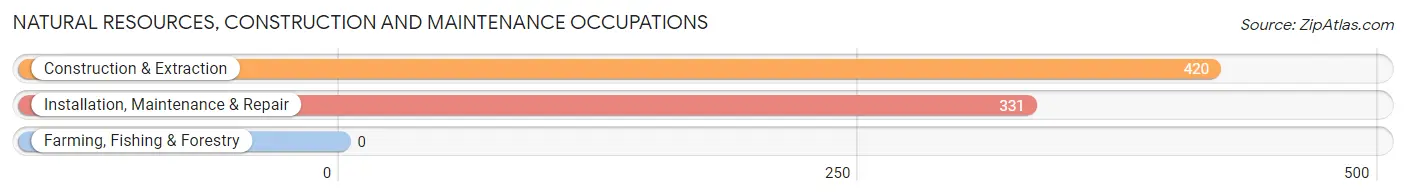
Natural Resources, Construction and Maintenance Occupations
The most common Natural Resources, Construction and Maintenance occupations in Fruit Cove are Construction & Extraction (420 | 2.5%), and Installation, Maintenance & Repair (331 | 1.9%).
Natural Resources, Construction and Maintenance Occupations by Sex
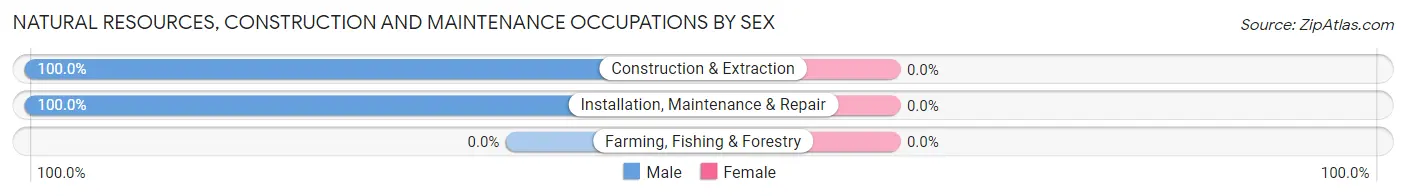
| Occupation | Male | Female |
| Farming, Fishing & Forestry | 0 (0.0%) | 0 (0.0%) |
| Construction & Extraction | 420 (100.0%) | 0 (0.0%) |
| Installation, Maintenance & Repair | 331 (100.0%) | 0 (0.0%) |
| Total (Category) | 751 (100.0%) | 0 (0.0%) |
| Total (Overall) | 10,016 (59.0%) | 6,971 (41.0%) |
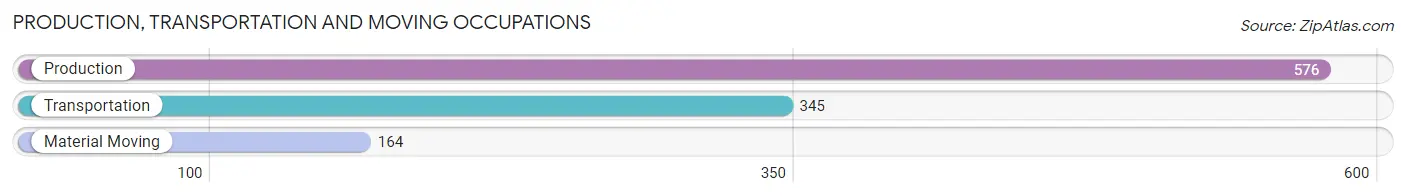
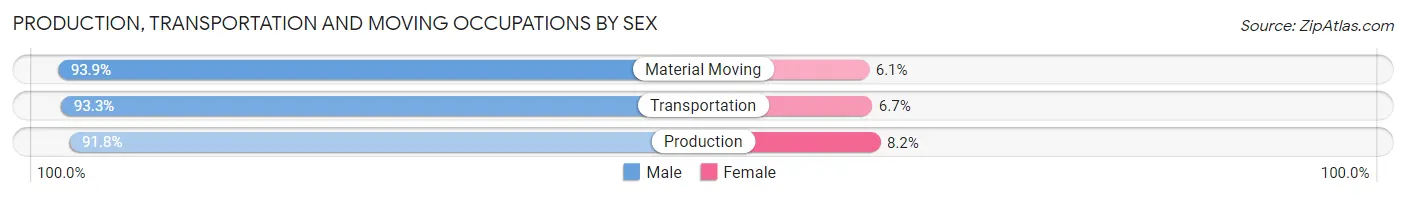
Production, Transportation and Moving Occupations
The most common Production, Transportation and Moving occupations in Fruit Cove are Production (576 | 3.4%), Transportation (345 | 2.0%), and Material Moving (164 | 1.0%).
Production, Transportation and Moving Occupations by Sex
| Occupation | Male | Female |
| Production | 529 (91.8%) | 47 (8.2%) |
| Transportation | 322 (93.3%) | 23 (6.7%) |
| Material Moving | 154 (93.9%) | 10 (6.1%) |
| Total (Category) | 1,005 (92.6%) | 80 (7.4%) |
| Total (Overall) | 10,016 (59.0%) | 6,971 (41.0%) |
Employment Industries by Sex in Fruit Cove
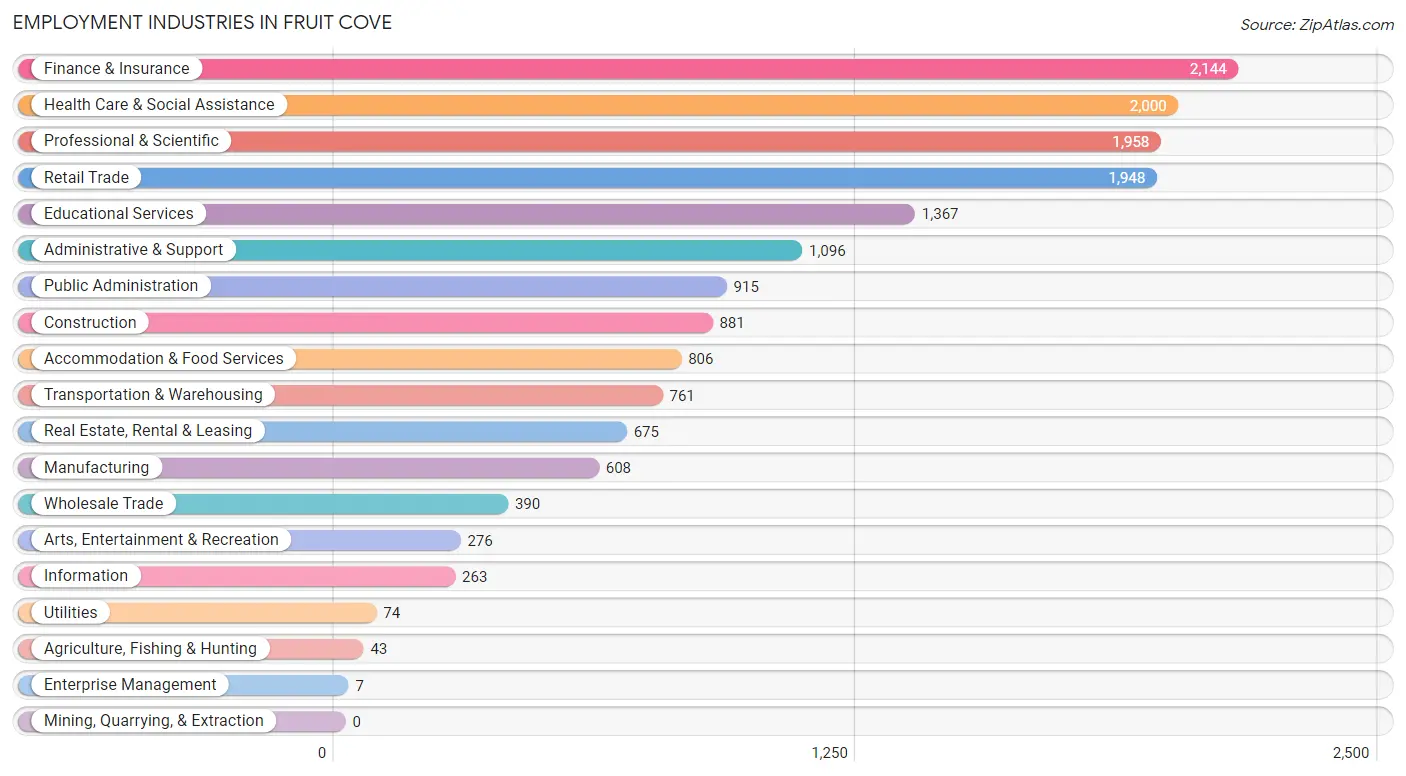
Employment Industries in Fruit Cove
The major employment industries in Fruit Cove include Finance & Insurance (2,144 | 12.6%), Health Care & Social Assistance (2,000 | 11.8%), Professional & Scientific (1,958 | 11.5%), Retail Trade (1,948 | 11.5%), and Educational Services (1,367 | 8.1%).
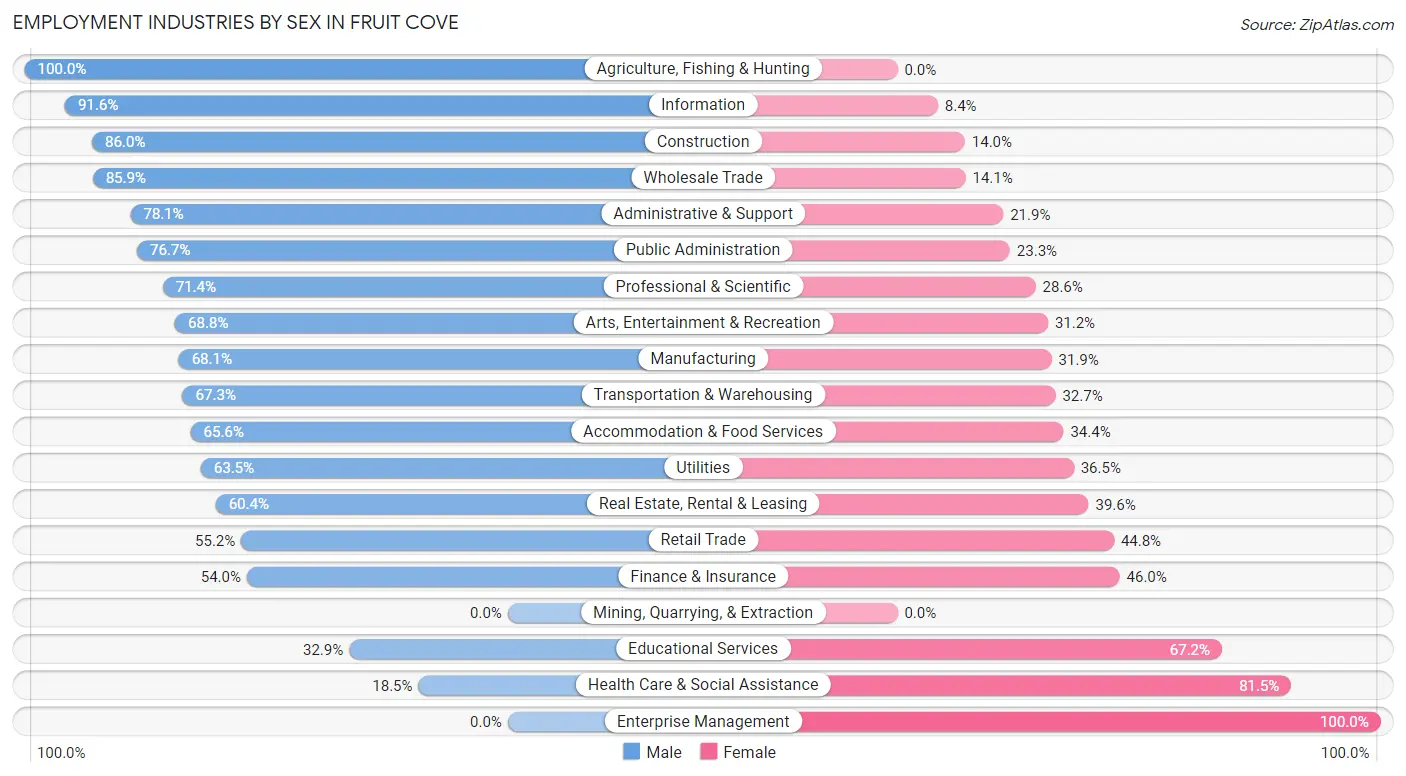
Employment Industries by Sex in Fruit Cove
The Fruit Cove industries that see more men than women are Agriculture, Fishing & Hunting (100.0%), Information (91.6%), and Construction (86.0%), whereas the industries that tend to have a higher number of women are Enterprise Management (100.0%), Health Care & Social Assistance (81.5%), and Educational Services (67.1%).
| Industry | Male | Female |
| Agriculture, Fishing & Hunting | 43 (100.0%) | 0 (0.0%) |
| Mining, Quarrying, & Extraction | 0 (0.0%) | 0 (0.0%) |
| Construction | 758 (86.0%) | 123 (14.0%) |
| Manufacturing | 414 (68.1%) | 194 (31.9%) |
| Wholesale Trade | 335 (85.9%) | 55 (14.1%) |
| Retail Trade | 1,075 (55.2%) | 873 (44.8%) |
| Transportation & Warehousing | 512 (67.3%) | 249 (32.7%) |
| Utilities | 47 (63.5%) | 27 (36.5%) |
| Information | 241 (91.6%) | 22 (8.4%) |
| Finance & Insurance | 1,158 (54.0%) | 986 (46.0%) |
| Real Estate, Rental & Leasing | 408 (60.4%) | 267 (39.6%) |
| Professional & Scientific | 1,398 (71.4%) | 560 (28.6%) |
| Enterprise Management | 0 (0.0%) | 7 (100.0%) |
| Administrative & Support | 856 (78.1%) | 240 (21.9%) |
| Educational Services | 449 (32.9%) | 918 (67.1%) |
| Health Care & Social Assistance | 370 (18.5%) | 1,630 (81.5%) |
| Arts, Entertainment & Recreation | 190 (68.8%) | 86 (31.2%) |
| Accommodation & Food Services | 529 (65.6%) | 277 (34.4%) |
| Public Administration | 702 (76.7%) | 213 (23.3%) |
| Total | 10,016 (59.0%) | 6,971 (41.0%) |
Education in Fruit Cove
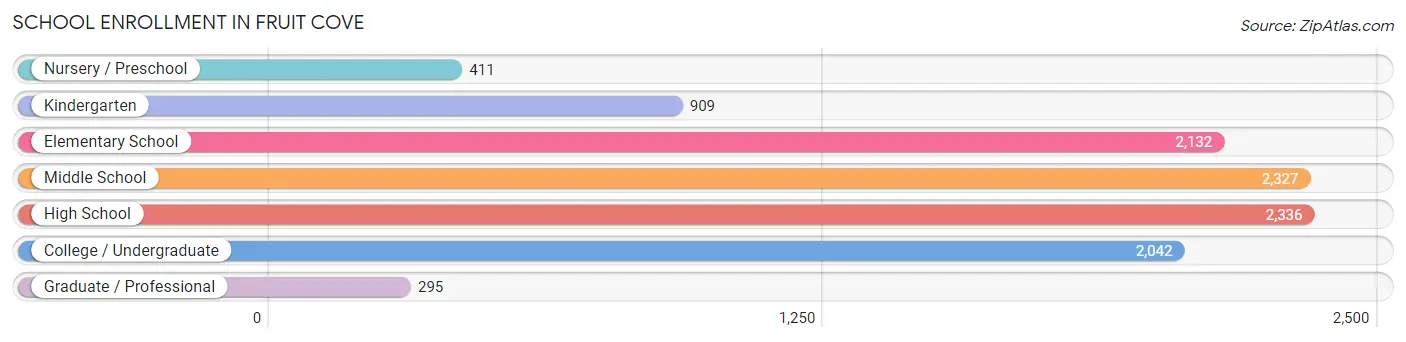
School Enrollment in Fruit Cove
The most common levels of schooling among the 10,452 students in Fruit Cove are high school (2,336 | 22.4%), middle school (2,327 | 22.3%), and elementary school (2,132 | 20.4%).
| School Level | # Students | % Students |
| Nursery / Preschool | 411 | 3.9% |
| Kindergarten | 909 | 8.7% |
| Elementary School | 2,132 | 20.4% |
| Middle School | 2,327 | 22.3% |
| High School | 2,336 | 22.4% |
| College / Undergraduate | 2,042 | 19.5% |
| Graduate / Professional | 295 | 2.8% |
| Total | 10,452 | 100.0% |
School Enrollment by Age by Funding Source in Fruit Cove
Out of a total of 10,452 students who are enrolled in schools in Fruit Cove, 1,432 (13.7%) attend a private institution, while the remaining 9,020 (86.3%) are enrolled in public schools. The age group of 3 to 4 year olds has the highest likelihood of being enrolled in private schools, with 198 (63.9% in the age bracket) enrolled. Conversely, the age group of 10 to 14 year olds has the lowest likelihood of being enrolled in a private school, with 3,054 (96.2% in the age bracket) attending a public institution.
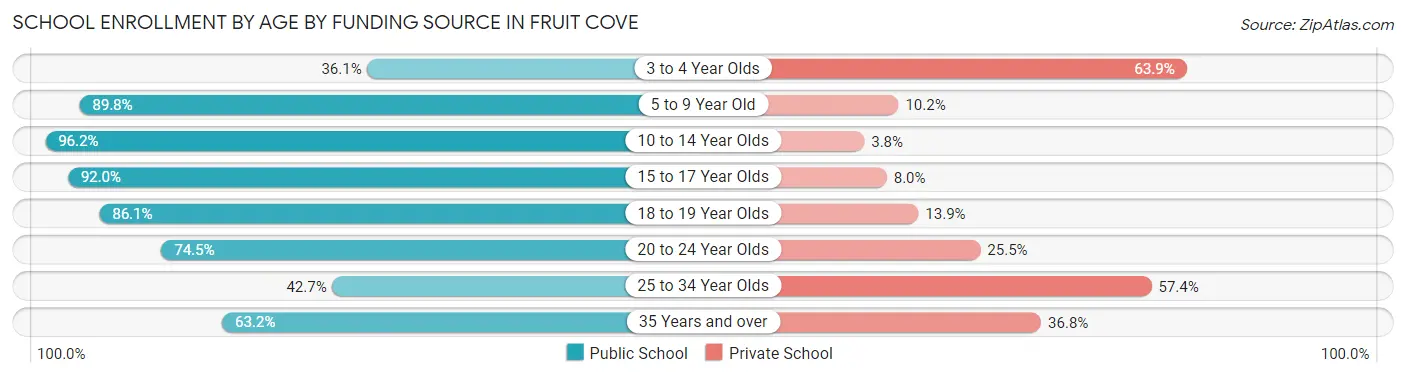
| Age Bracket | Public School | Private School |
| 3 to 4 Year Olds | 112 (36.1%) | 198 (63.9%) |
| 5 to 9 Year Old | 2,216 (89.8%) | 252 (10.2%) |
| 10 to 14 Year Olds | 3,054 (96.2%) | 122 (3.8%) |
| 15 to 17 Year Olds | 1,696 (92.0%) | 148 (8.0%) |
| 18 to 19 Year Olds | 711 (86.1%) | 115 (13.9%) |
| 20 to 24 Year Olds | 881 (74.5%) | 301 (25.5%) |
| 25 to 34 Year Olds | 119 (42.6%) | 160 (57.4%) |
| 35 Years and over | 232 (63.2%) | 135 (36.8%) |
| Total | 9,020 (86.3%) | 1,432 (13.7%) |
Educational Attainment by Field of Study in Fruit Cove
Business (4,073 | 31.2%), science & technology (1,518 | 11.6%), engineering (1,332 | 10.2%), education (1,274 | 9.8%), and social sciences (1,094 | 8.4%) are the most common fields of study among 13,069 individuals in Fruit Cove who have obtained a bachelor's degree or higher.
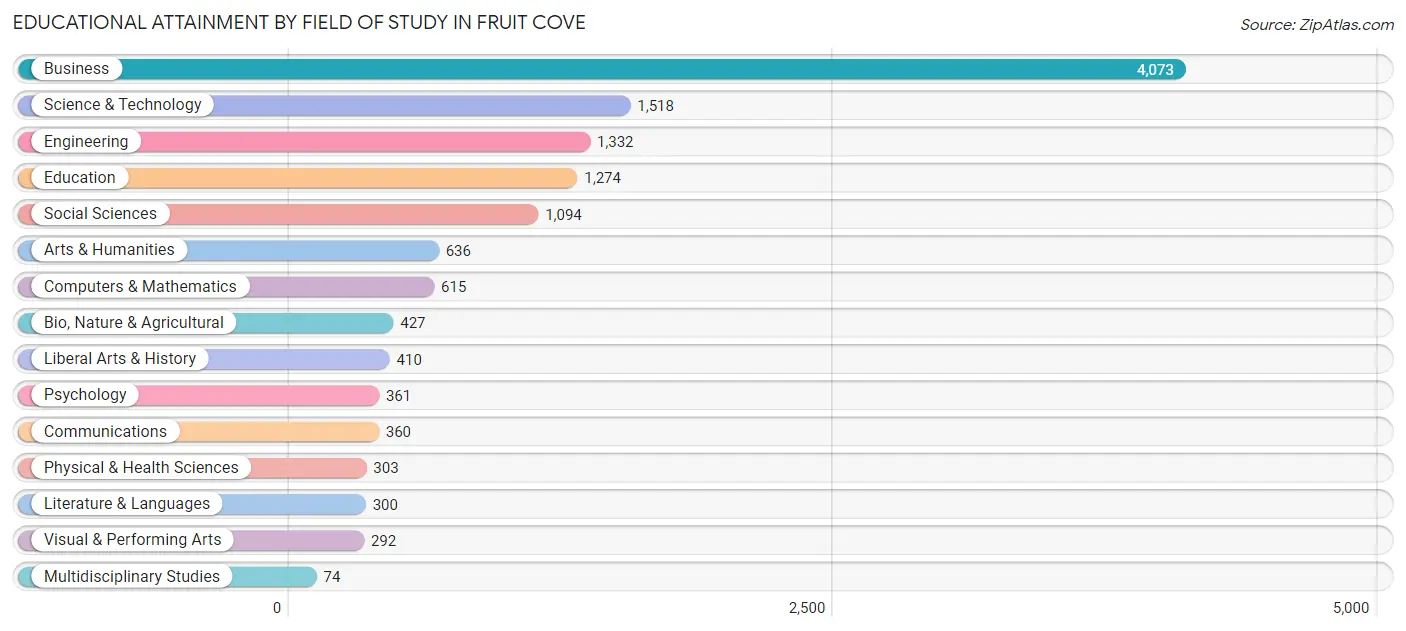
| Field of Study | # Graduates | % Graduates |
| Computers & Mathematics | 615 | 4.7% |
| Bio, Nature & Agricultural | 427 | 3.3% |
| Physical & Health Sciences | 303 | 2.3% |
| Psychology | 361 | 2.8% |
| Social Sciences | 1,094 | 8.4% |
| Engineering | 1,332 | 10.2% |
| Multidisciplinary Studies | 74 | 0.6% |
| Science & Technology | 1,518 | 11.6% |
| Business | 4,073 | 31.2% |
| Education | 1,274 | 9.8% |
| Literature & Languages | 300 | 2.3% |
| Liberal Arts & History | 410 | 3.1% |
| Visual & Performing Arts | 292 | 2.2% |
| Communications | 360 | 2.8% |
| Arts & Humanities | 636 | 4.9% |
| Total | 13,069 | 100.0% |
Transportation & Commute in Fruit Cove
Vehicle Availability by Sex in Fruit Cove
The most prevalent vehicle ownership categories in Fruit Cove are males with 2 vehicles (5,261, accounting for 51.7%) and females with 2 vehicles (3,341, making up 76.8%).
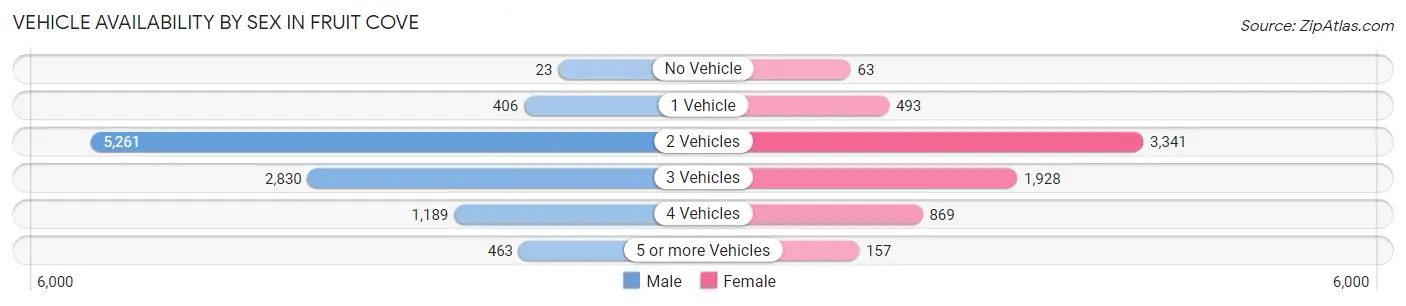
| Vehicles Available | Male | Female |
| No Vehicle | 23 (0.2%) | 63 (0.9%) |
| 1 Vehicle | 406 (4.0%) | 493 (7.2%) |
| 2 Vehicles | 5,261 (51.7%) | 3,341 (48.8%) |
| 3 Vehicles | 2,830 (27.8%) | 1,928 (28.1%) |
| 4 Vehicles | 1,189 (11.7%) | 869 (12.7%) |
| 5 or more Vehicles | 463 (4.5%) | 157 (2.3%) |
| Total | 10,172 (100.0%) | 6,851 (100.0%) |
Commute Time in Fruit Cove
The most frequently occuring commute durations in Fruit Cove are 30 to 34 minutes (4,007 commuters, 30.0%), 45 to 59 minutes (1,657 commuters, 12.4%), and 20 to 24 minutes (1,518 commuters, 11.4%).
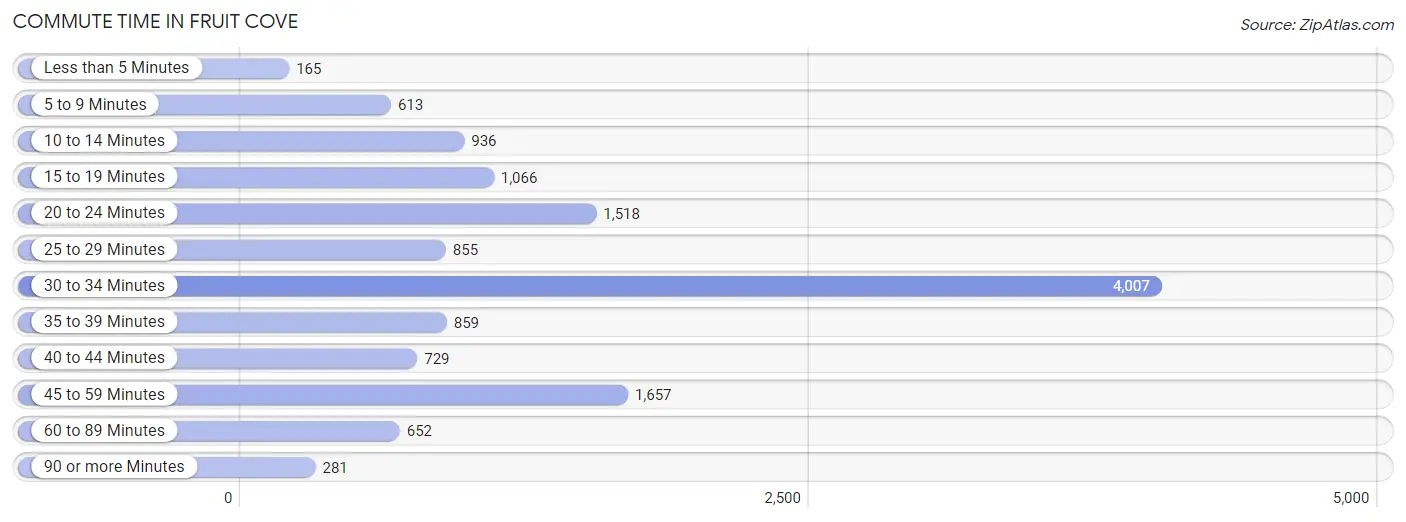
| Commute Time | # Commuters | % Commuters |
| Less than 5 Minutes | 165 | 1.2% |
| 5 to 9 Minutes | 613 | 4.6% |
| 10 to 14 Minutes | 936 | 7.0% |
| 15 to 19 Minutes | 1,066 | 8.0% |
| 20 to 24 Minutes | 1,518 | 11.4% |
| 25 to 29 Minutes | 855 | 6.4% |
| 30 to 34 Minutes | 4,007 | 30.0% |
| 35 to 39 Minutes | 859 | 6.4% |
| 40 to 44 Minutes | 729 | 5.5% |
| 45 to 59 Minutes | 1,657 | 12.4% |
| 60 to 89 Minutes | 652 | 4.9% |
| 90 or more Minutes | 281 | 2.1% |
Commute Time by Sex in Fruit Cove
The most common commute times in Fruit Cove are 30 to 34 minutes (2,512 commuters, 31.4%) for males and 30 to 34 minutes (1,495 commuters, 28.0%) for females.
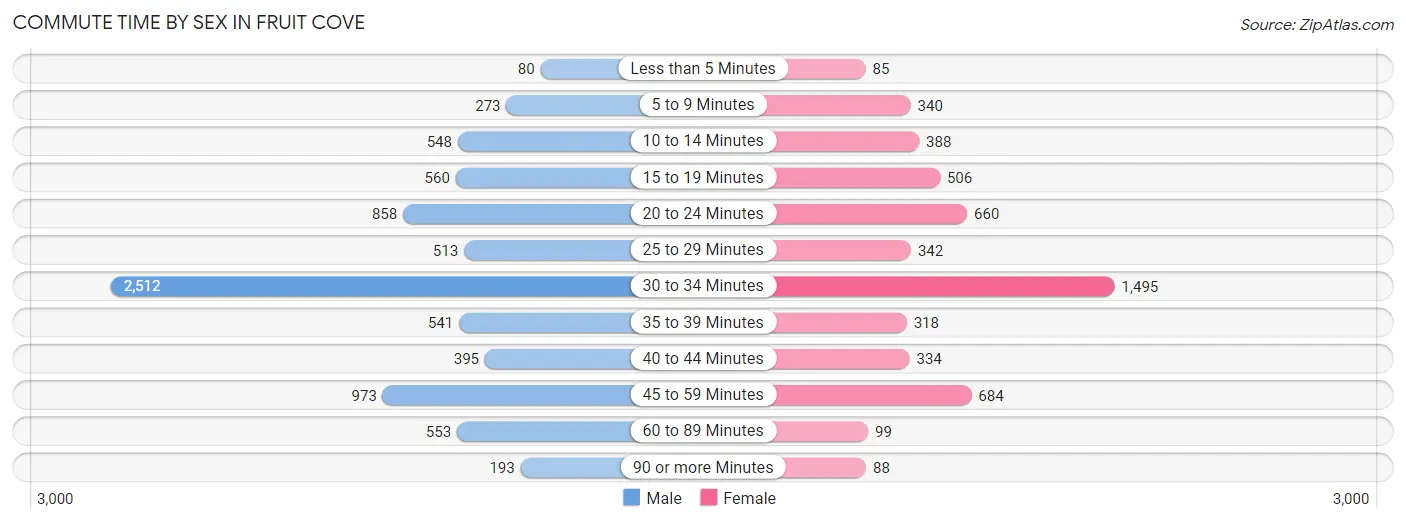
| Commute Time | Male | Female |
| Less than 5 Minutes | 80 (1.0%) | 85 (1.6%) |
| 5 to 9 Minutes | 273 (3.4%) | 340 (6.4%) |
| 10 to 14 Minutes | 548 (6.9%) | 388 (7.3%) |
| 15 to 19 Minutes | 560 (7.0%) | 506 (9.5%) |
| 20 to 24 Minutes | 858 (10.7%) | 660 (12.4%) |
| 25 to 29 Minutes | 513 (6.4%) | 342 (6.4%) |
| 30 to 34 Minutes | 2,512 (31.4%) | 1,495 (28.0%) |
| 35 to 39 Minutes | 541 (6.8%) | 318 (6.0%) |
| 40 to 44 Minutes | 395 (4.9%) | 334 (6.3%) |
| 45 to 59 Minutes | 973 (12.2%) | 684 (12.8%) |
| 60 to 89 Minutes | 553 (6.9%) | 99 (1.8%) |
| 90 or more Minutes | 193 (2.4%) | 88 (1.7%) |
Time of Departure to Work by Sex in Fruit Cove
The most frequent times of departure to work in Fruit Cove are 7:00 AM to 7:29 AM (1,270, 15.9%) for males and 7:30 AM to 7:59 AM (882, 16.5%) for females.
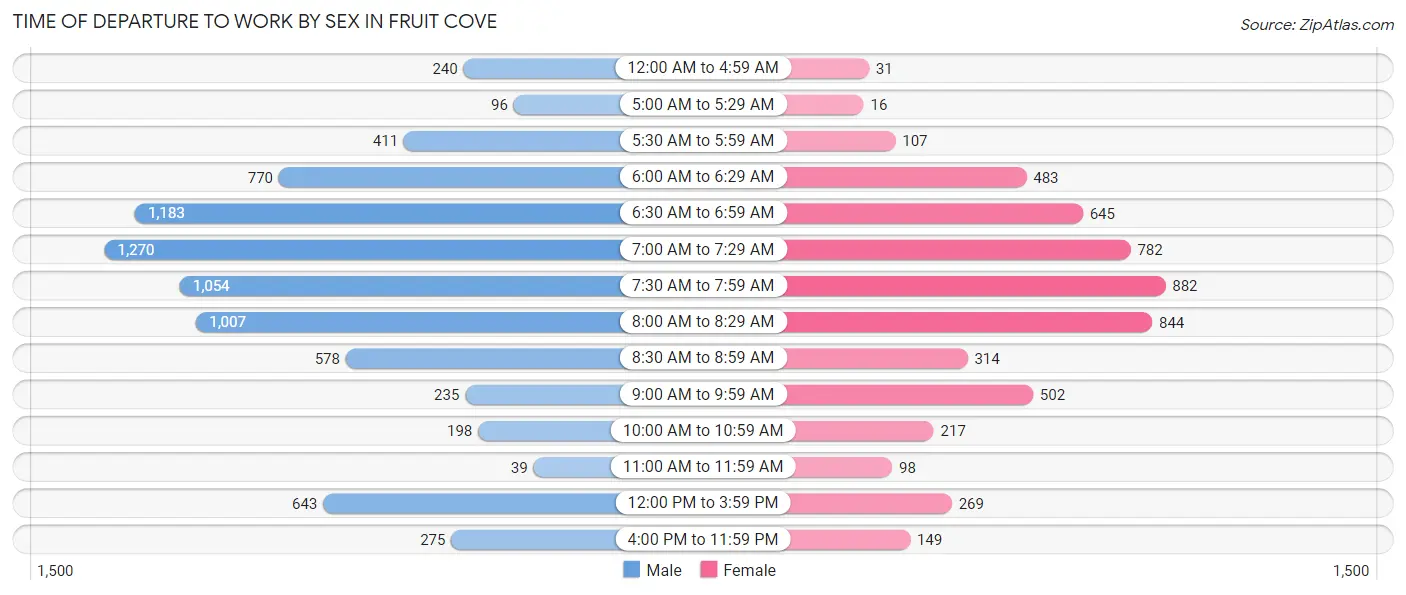
| Time of Departure | Male | Female |
| 12:00 AM to 4:59 AM | 240 (3.0%) | 31 (0.6%) |
| 5:00 AM to 5:29 AM | 96 (1.2%) | 16 (0.3%) |
| 5:30 AM to 5:59 AM | 411 (5.1%) | 107 (2.0%) |
| 6:00 AM to 6:29 AM | 770 (9.6%) | 483 (9.0%) |
| 6:30 AM to 6:59 AM | 1,183 (14.8%) | 645 (12.1%) |
| 7:00 AM to 7:29 AM | 1,270 (15.9%) | 782 (14.6%) |
| 7:30 AM to 7:59 AM | 1,054 (13.2%) | 882 (16.5%) |
| 8:00 AM to 8:29 AM | 1,007 (12.6%) | 844 (15.8%) |
| 8:30 AM to 8:59 AM | 578 (7.2%) | 314 (5.9%) |
| 9:00 AM to 9:59 AM | 235 (2.9%) | 502 (9.4%) |
| 10:00 AM to 10:59 AM | 198 (2.5%) | 217 (4.1%) |
| 11:00 AM to 11:59 AM | 39 (0.5%) | 98 (1.8%) |
| 12:00 PM to 3:59 PM | 643 (8.0%) | 269 (5.0%) |
| 4:00 PM to 11:59 PM | 275 (3.4%) | 149 (2.8%) |
| Total | 7,999 (100.0%) | 5,339 (100.0%) |
Housing Occupancy in Fruit Cove
Occupancy by Ownership in Fruit Cove
Of the total 11,435 dwellings in Fruit Cove, owner-occupied units account for 9,737 (85.2%), while renter-occupied units make up 1,698 (14.8%).
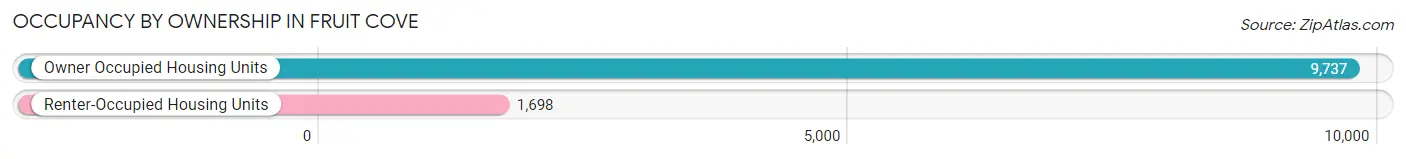
| Occupancy | # Housing Units | % Housing Units |
| Owner Occupied Housing Units | 9,737 | 85.2% |
| Renter-Occupied Housing Units | 1,698 | 14.8% |
| Total Occupied Housing Units | 11,435 | 100.0% |
Occupancy by Household Size in Fruit Cove
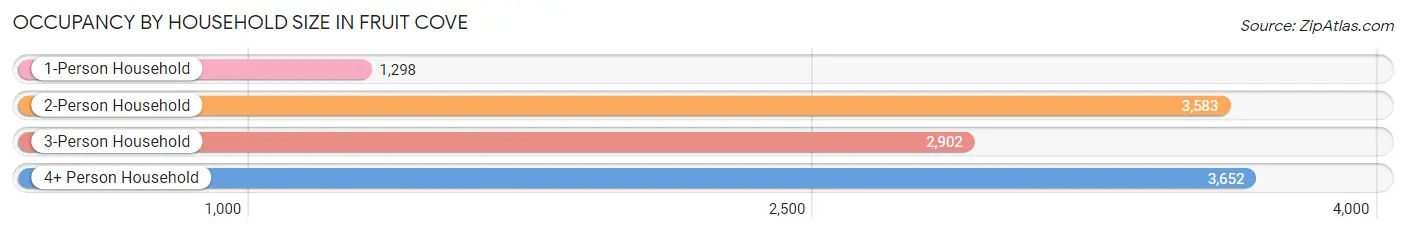
| Household Size | # Housing Units | % Housing Units |
| 1-Person Household | 1,298 | 11.4% |
| 2-Person Household | 3,583 | 31.3% |
| 3-Person Household | 2,902 | 25.4% |
| 4+ Person Household | 3,652 | 31.9% |
| Total Housing Units | 11,435 | 100.0% |
Occupancy by Ownership by Household Size in Fruit Cove
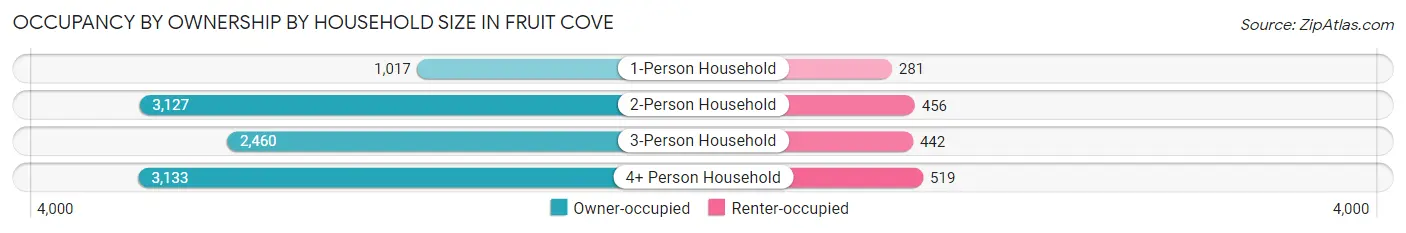
| Household Size | Owner-occupied | Renter-occupied |
| 1-Person Household | 1,017 (78.3%) | 281 (21.6%) |
| 2-Person Household | 3,127 (87.3%) | 456 (12.7%) |
| 3-Person Household | 2,460 (84.8%) | 442 (15.2%) |
| 4+ Person Household | 3,133 (85.8%) | 519 (14.2%) |
| Total Housing Units | 9,737 (85.2%) | 1,698 (14.8%) |
Occupancy by Educational Attainment in Fruit Cove
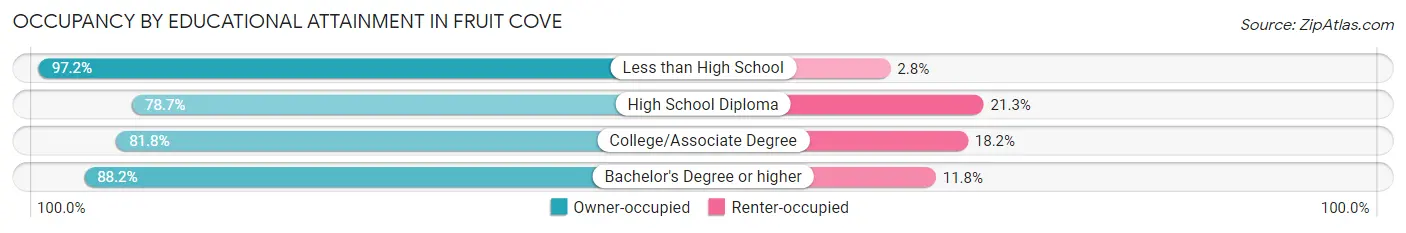
| Household Size | Owner-occupied | Renter-occupied |
| Less than High School | 207 (97.2%) | 6 (2.8%) |
| High School Diploma | 1,555 (78.7%) | 421 (21.3%) |
| College/Associate Degree | 2,286 (81.8%) | 508 (18.2%) |
| Bachelor's Degree or higher | 5,689 (88.2%) | 763 (11.8%) |
Occupancy by Age of Householder in Fruit Cove
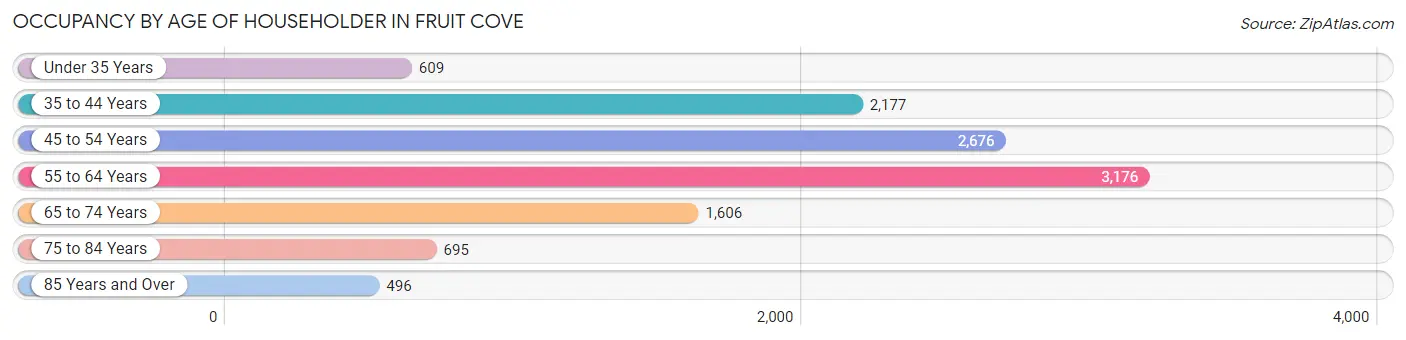
| Age Bracket | # Households | % Households |
| Under 35 Years | 609 | 5.3% |
| 35 to 44 Years | 2,177 | 19.0% |
| 45 to 54 Years | 2,676 | 23.4% |
| 55 to 64 Years | 3,176 | 27.8% |
| 65 to 74 Years | 1,606 | 14.0% |
| 75 to 84 Years | 695 | 6.1% |
| 85 Years and Over | 496 | 4.3% |
| Total | 11,435 | 100.0% |
Housing Finances in Fruit Cove
Median Income by Occupancy in Fruit Cove
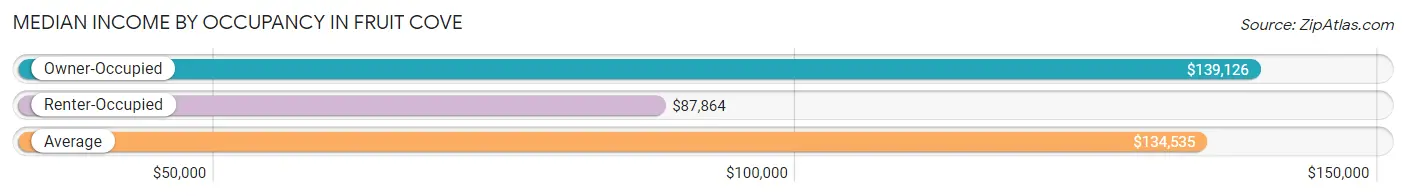
| Occupancy Type | # Households | Median Income |
| Owner-Occupied | 9,737 (85.2%) | $139,126 |
| Renter-Occupied | 1,698 (14.8%) | $87,864 |
| Average | 11,435 (100.0%) | $134,535 |
Occupancy by Householder Income Bracket in Fruit Cove
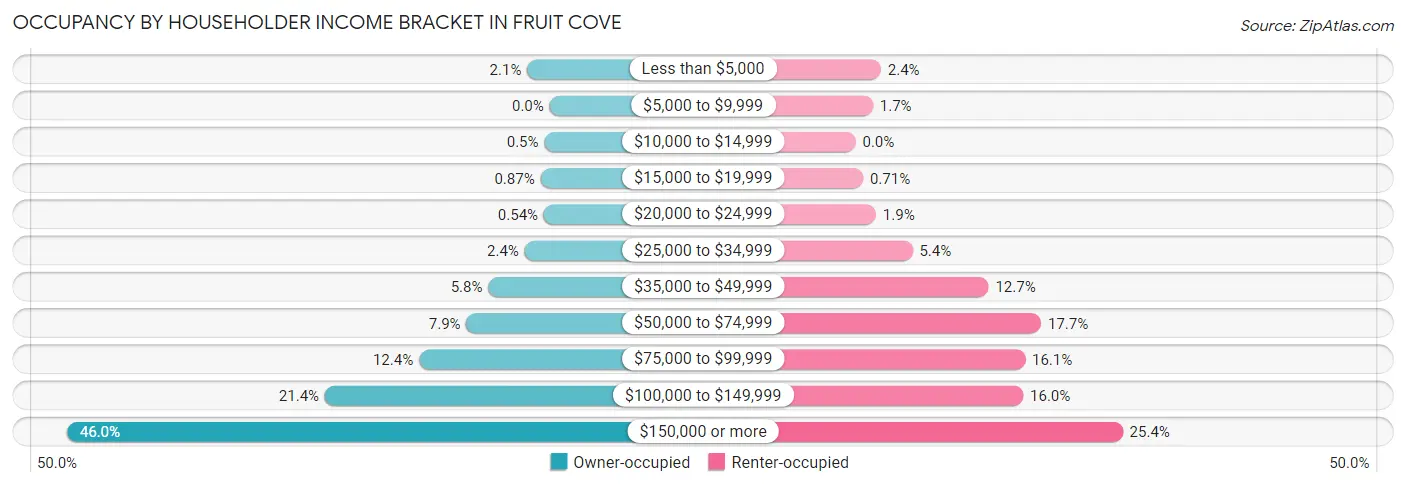
| Income Bracket | Owner-occupied | Renter-occupied |
| Less than $5,000 | 207 (2.1%) | 41 (2.4%) |
| $5,000 to $9,999 | 0 (0.0%) | 28 (1.7%) |
| $10,000 to $14,999 | 49 (0.5%) | 0 (0.0%) |
| $15,000 to $19,999 | 85 (0.9%) | 12 (0.7%) |
| $20,000 to $24,999 | 53 (0.5%) | 33 (1.9%) |
| $25,000 to $34,999 | 231 (2.4%) | 92 (5.4%) |
| $35,000 to $49,999 | 569 (5.8%) | 215 (12.7%) |
| $50,000 to $74,999 | 771 (7.9%) | 300 (17.7%) |
| $75,000 to $99,999 | 1,211 (12.4%) | 274 (16.1%) |
| $100,000 to $149,999 | 2,084 (21.4%) | 271 (16.0%) |
| $150,000 or more | 4,477 (46.0%) | 432 (25.4%) |
| Total | 9,737 (100.0%) | 1,698 (100.0%) |
Monthly Housing Cost Tiers in Fruit Cove
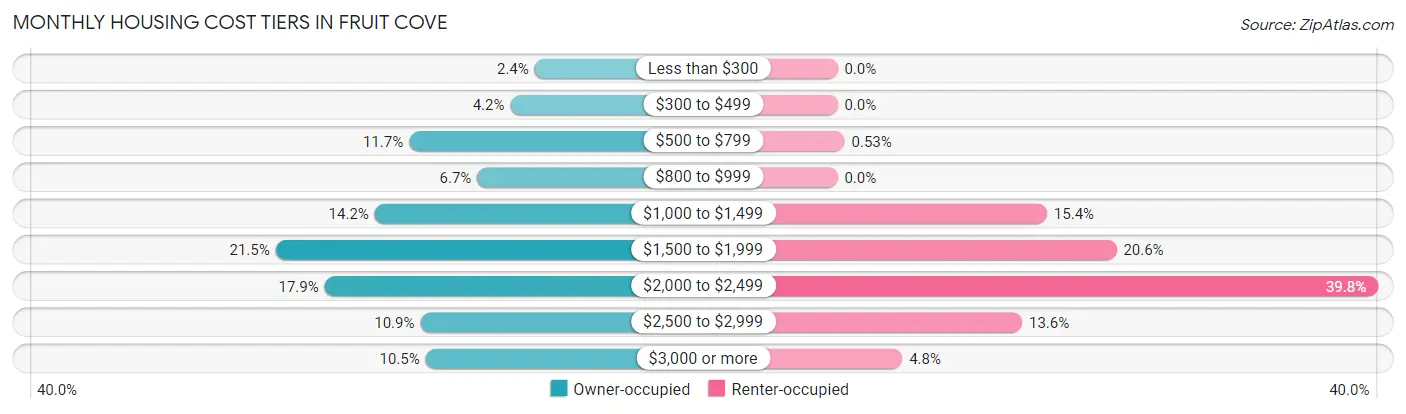
| Monthly Cost | Owner-occupied | Renter-occupied |
| Less than $300 | 238 (2.4%) | 0 (0.0%) |
| $300 to $499 | 412 (4.2%) | 0 (0.0%) |
| $500 to $799 | 1,138 (11.7%) | 9 (0.5%) |
| $800 to $999 | 649 (6.7%) | 0 (0.0%) |
| $1,000 to $1,499 | 1,385 (14.2%) | 262 (15.4%) |
| $1,500 to $1,999 | 2,095 (21.5%) | 349 (20.5%) |
| $2,000 to $2,499 | 1,744 (17.9%) | 676 (39.8%) |
| $2,500 to $2,999 | 1,057 (10.9%) | 231 (13.6%) |
| $3,000 or more | 1,019 (10.5%) | 81 (4.8%) |
| Total | 9,737 (100.0%) | 1,698 (100.0%) |
Physical Housing Characteristics in Fruit Cove
Housing Structures in Fruit Cove
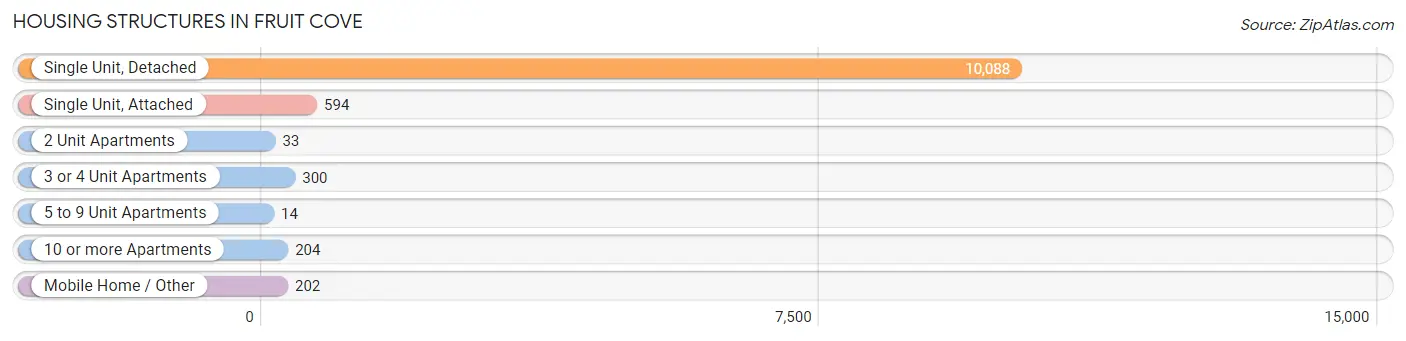
| Structure Type | # Housing Units | % Housing Units |
| Single Unit, Detached | 10,088 | 88.2% |
| Single Unit, Attached | 594 | 5.2% |
| 2 Unit Apartments | 33 | 0.3% |
| 3 or 4 Unit Apartments | 300 | 2.6% |
| 5 to 9 Unit Apartments | 14 | 0.1% |
| 10 or more Apartments | 204 | 1.8% |
| Mobile Home / Other | 202 | 1.8% |
| Total | 11,435 | 100.0% |
Housing Structures by Occupancy in Fruit Cove
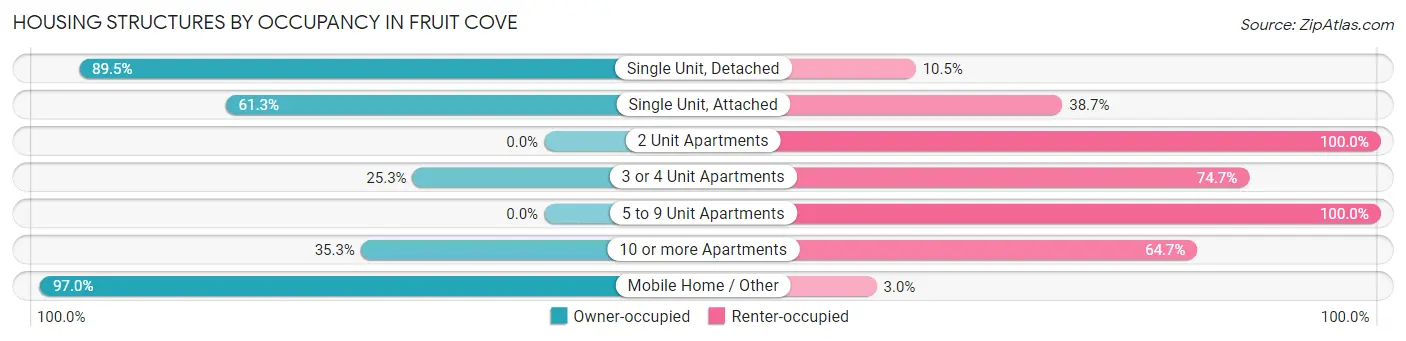
| Structure Type | Owner-occupied | Renter-occupied |
| Single Unit, Detached | 9,029 (89.5%) | 1,059 (10.5%) |
| Single Unit, Attached | 364 (61.3%) | 230 (38.7%) |
| 2 Unit Apartments | 0 (0.0%) | 33 (100.0%) |
| 3 or 4 Unit Apartments | 76 (25.3%) | 224 (74.7%) |
| 5 to 9 Unit Apartments | 0 (0.0%) | 14 (100.0%) |
| 10 or more Apartments | 72 (35.3%) | 132 (64.7%) |
| Mobile Home / Other | 196 (97.0%) | 6 (3.0%) |
| Total | 9,737 (85.2%) | 1,698 (14.8%) |
Housing Structures by Number of Rooms in Fruit Cove
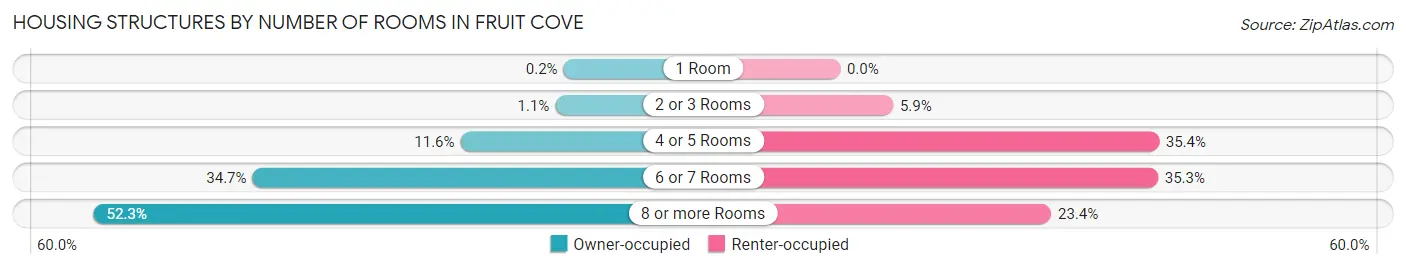
| Number of Rooms | Owner-occupied | Renter-occupied |
| 1 Room | 19 (0.2%) | 0 (0.0%) |
| 2 or 3 Rooms | 108 (1.1%) | 100 (5.9%) |
| 4 or 5 Rooms | 1,133 (11.6%) | 601 (35.4%) |
| 6 or 7 Rooms | 3,381 (34.7%) | 599 (35.3%) |
| 8 or more Rooms | 5,096 (52.3%) | 398 (23.4%) |
| Total | 9,737 (100.0%) | 1,698 (100.0%) |
Housing Structure by Heating Type in Fruit Cove
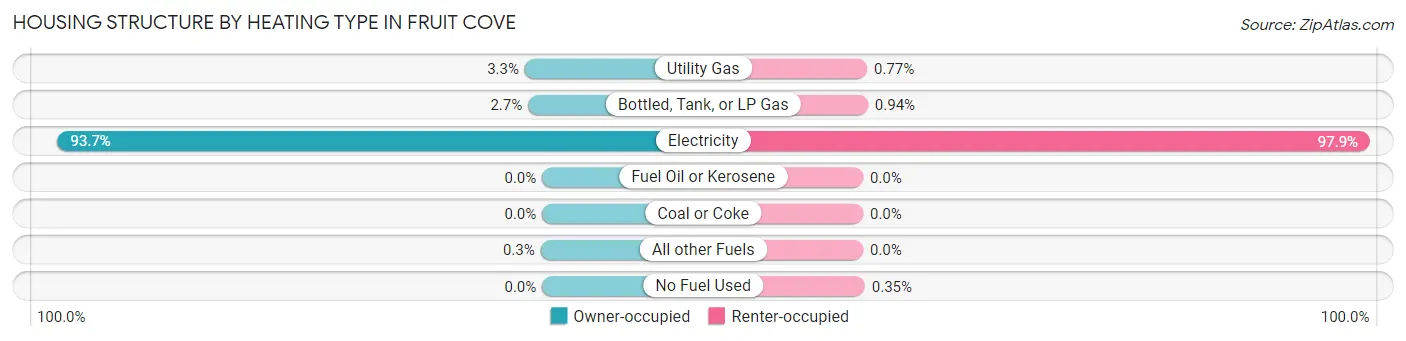
| Heating Type | Owner-occupied | Renter-occupied |
| Utility Gas | 325 (3.3%) | 13 (0.8%) |
| Bottled, Tank, or LP Gas | 264 (2.7%) | 16 (0.9%) |
| Electricity | 9,119 (93.6%) | 1,663 (97.9%) |
| Fuel Oil or Kerosene | 0 (0.0%) | 0 (0.0%) |
| Coal or Coke | 0 (0.0%) | 0 (0.0%) |
| All other Fuels | 29 (0.3%) | 0 (0.0%) |
| No Fuel Used | 0 (0.0%) | 6 (0.4%) |
| Total | 9,737 (100.0%) | 1,698 (100.0%) |
Household Vehicle Usage in Fruit Cove
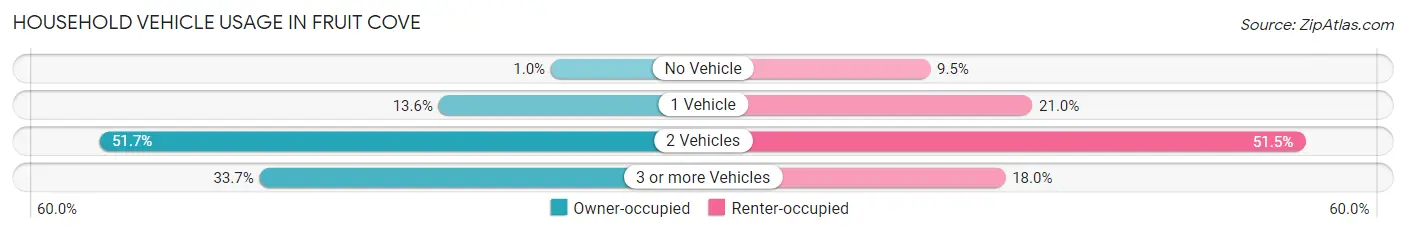
| Vehicles per Household | Owner-occupied | Renter-occupied |
| No Vehicle | 101 (1.0%) | 162 (9.5%) |
| 1 Vehicle | 1,325 (13.6%) | 356 (21.0%) |
| 2 Vehicles | 5,031 (51.7%) | 875 (51.5%) |
| 3 or more Vehicles | 3,280 (33.7%) | 305 (18.0%) |
| Total | 9,737 (100.0%) | 1,698 (100.0%) |
Real Estate & Mortgages in Fruit Cove
Real Estate and Mortgage Overview in Fruit Cove
| Characteristic | Without Mortgage | With Mortgage |
| Housing Units | 2,631 | 7,106 |
| Median Property Value | $397,600 | $410,100 |
| Median Household Income | $114,535 | $3,516 |
| Monthly Housing Costs | $672 | $1,019 |
| Real Estate Taxes | $3,183 | $36 |
Property Value by Mortgage Status in Fruit Cove
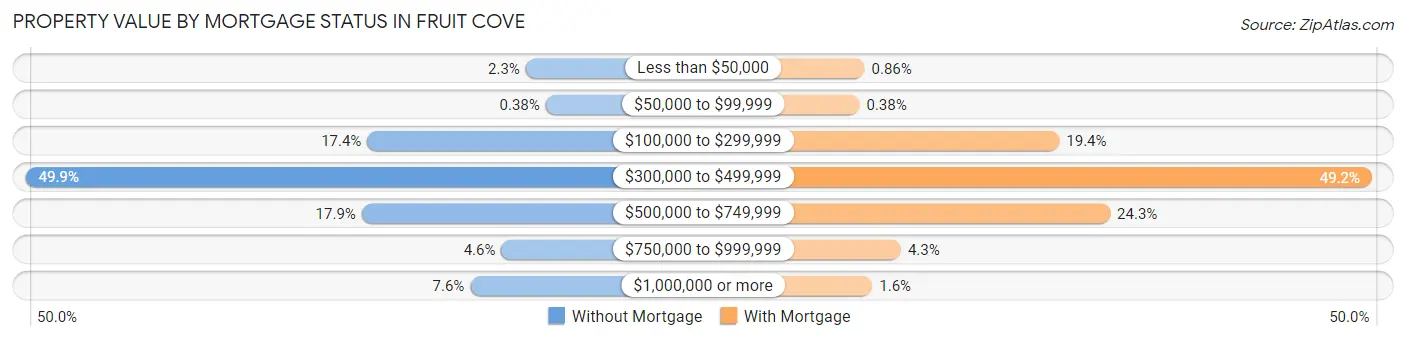
| Property Value | Without Mortgage | With Mortgage |
| Less than $50,000 | 60 (2.3%) | 61 (0.9%) |
| $50,000 to $99,999 | 10 (0.4%) | 27 (0.4%) |
| $100,000 to $299,999 | 457 (17.4%) | 1,379 (19.4%) |
| $300,000 to $499,999 | 1,313 (49.9%) | 3,494 (49.2%) |
| $500,000 to $749,999 | 471 (17.9%) | 1,723 (24.2%) |
| $750,000 to $999,999 | 121 (4.6%) | 308 (4.3%) |
| $1,000,000 or more | 199 (7.6%) | 114 (1.6%) |
| Total | 2,631 (100.0%) | 7,106 (100.0%) |
Household Income by Mortgage Status in Fruit Cove
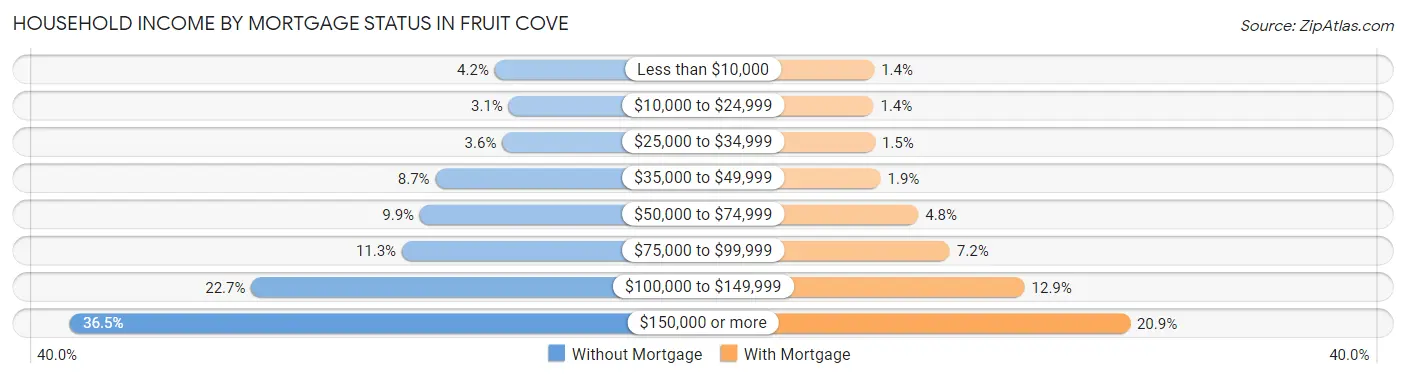
| Household Income | Without Mortgage | With Mortgage |
| Less than $10,000 | 110 (4.2%) | 101 (1.4%) |
| $10,000 to $24,999 | 82 (3.1%) | 97 (1.4%) |
| $25,000 to $34,999 | 95 (3.6%) | 105 (1.5%) |
| $35,000 to $49,999 | 229 (8.7%) | 136 (1.9%) |
| $50,000 to $74,999 | 260 (9.9%) | 340 (4.8%) |
| $75,000 to $99,999 | 296 (11.3%) | 511 (7.2%) |
| $100,000 to $149,999 | 598 (22.7%) | 915 (12.9%) |
| $150,000 or more | 961 (36.5%) | 1,486 (20.9%) |
| Total | 2,631 (100.0%) | 7,106 (100.0%) |
Property Value to Household Income Ratio in Fruit Cove
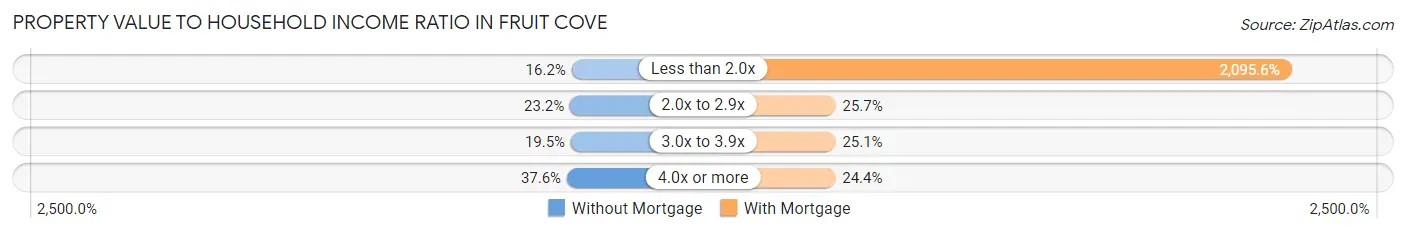
| Value-to-Income Ratio | Without Mortgage | With Mortgage |
| Less than 2.0x | 427 (16.2%) | 148,912 (2,095.6%) |
| 2.0x to 2.9x | 611 (23.2%) | 1,823 (25.7%) |
| 3.0x to 3.9x | 513 (19.5%) | 1,784 (25.1%) |
| 4.0x or more | 989 (37.6%) | 1,737 (24.4%) |
| Total | 2,631 (100.0%) | 7,106 (100.0%) |
Real Estate Taxes by Mortgage Status in Fruit Cove
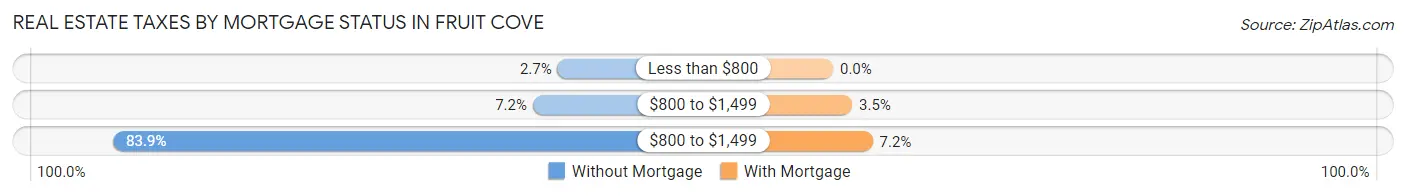
| Property Taxes | Without Mortgage | With Mortgage |
| Less than $800 | 70 (2.7%) | 0 (0.0%) |
| $800 to $1,499 | 189 (7.2%) | 247 (3.5%) |
| $800 to $1,499 | 2,206 (83.9%) | 513 (7.2%) |
| Total | 2,631 (100.0%) | 7,106 (100.0%) |
Health & Disability in Fruit Cove
Health Insurance Coverage by Age in Fruit Cove
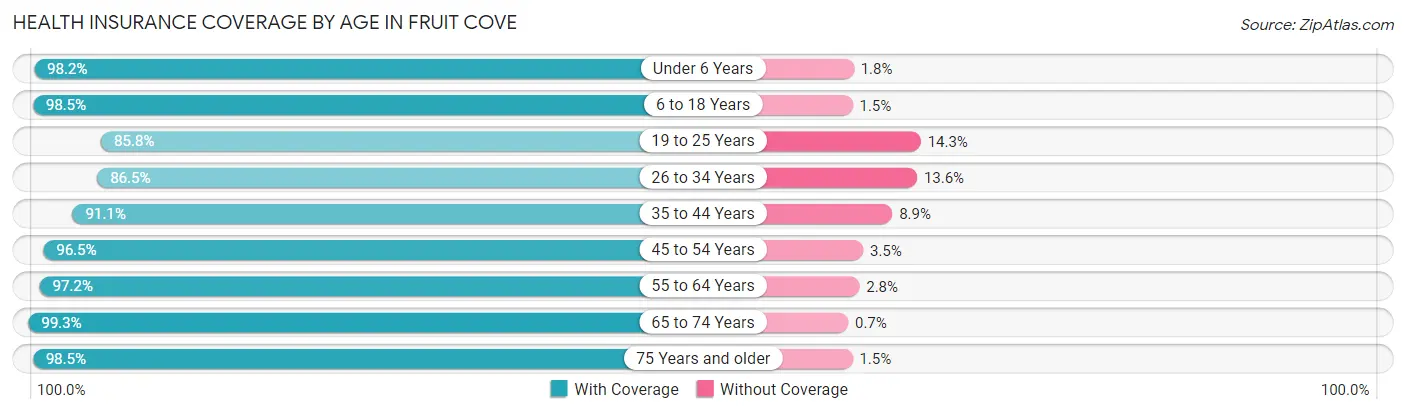
| Age Bracket | With Coverage | Without Coverage |
| Under 6 Years | 1,902 (98.2%) | 34 (1.8%) |
| 6 to 18 Years | 7,394 (98.5%) | 116 (1.5%) |
| 19 to 25 Years | 2,353 (85.8%) | 391 (14.2%) |
| 26 to 34 Years | 1,754 (86.5%) | 275 (13.6%) |
| 35 to 44 Years | 4,451 (91.1%) | 437 (8.9%) |
| 45 to 54 Years | 4,923 (96.5%) | 178 (3.5%) |
| 55 to 64 Years | 5,702 (97.2%) | 164 (2.8%) |
| 65 to 74 Years | 2,693 (99.3%) | 19 (0.7%) |
| 75 Years and older | 2,131 (98.5%) | 33 (1.5%) |
| Total | 33,303 (95.3%) | 1,647 (4.7%) |
Health Insurance Coverage by Citizenship Status in Fruit Cove
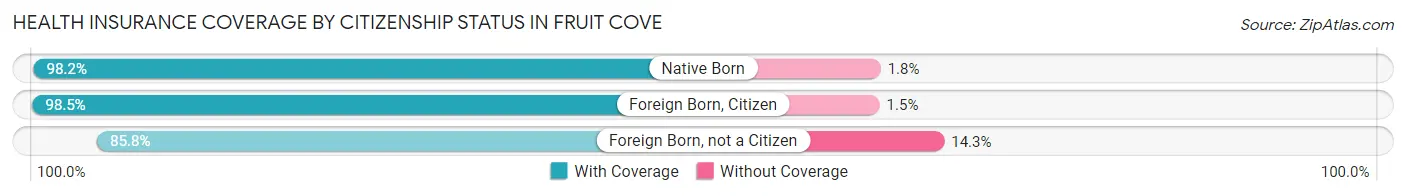
| Citizenship Status | With Coverage | Without Coverage |
| Native Born | 1,902 (98.2%) | 34 (1.8%) |
| Foreign Born, Citizen | 7,394 (98.5%) | 116 (1.5%) |
| Foreign Born, not a Citizen | 2,353 (85.8%) | 391 (14.2%) |
Health Insurance Coverage by Household Income in Fruit Cove
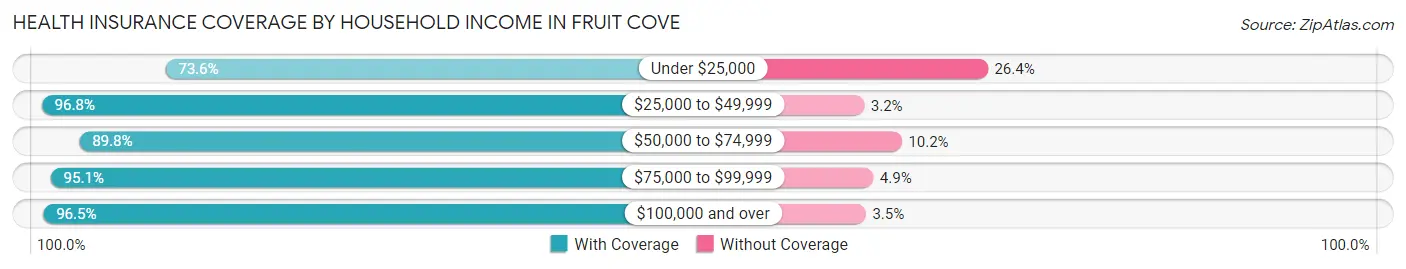
| Household Income | With Coverage | Without Coverage |
| Under $25,000 | 595 (73.6%) | 213 (26.4%) |
| $25,000 to $49,999 | 2,122 (96.8%) | 70 (3.2%) |
| $50,000 to $74,999 | 2,287 (89.8%) | 261 (10.2%) |
| $75,000 to $99,999 | 5,023 (95.1%) | 258 (4.9%) |
| $100,000 and over | 23,275 (96.5%) | 845 (3.5%) |
Public vs Private Health Insurance Coverage by Age in Fruit Cove
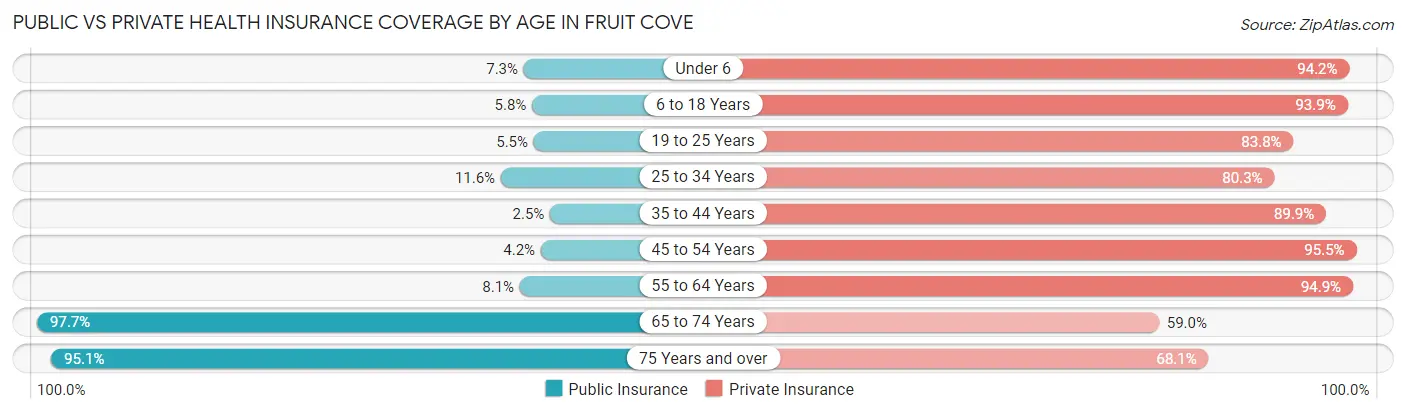
| Age Bracket | Public Insurance | Private Insurance |
| Under 6 | 142 (7.3%) | 1,824 (94.2%) |
| 6 to 18 Years | 434 (5.8%) | 7,049 (93.9%) |
| 19 to 25 Years | 150 (5.5%) | 2,300 (83.8%) |
| 25 to 34 Years | 235 (11.6%) | 1,629 (80.3%) |
| 35 to 44 Years | 120 (2.5%) | 4,394 (89.9%) |
| 45 to 54 Years | 212 (4.2%) | 4,872 (95.5%) |
| 55 to 64 Years | 473 (8.1%) | 5,565 (94.9%) |
| 65 to 74 Years | 2,650 (97.7%) | 1,601 (59.0%) |
| 75 Years and over | 2,057 (95.1%) | 1,473 (68.1%) |
| Total | 6,473 (18.5%) | 30,707 (87.9%) |
Disability Status by Sex by Age in Fruit Cove
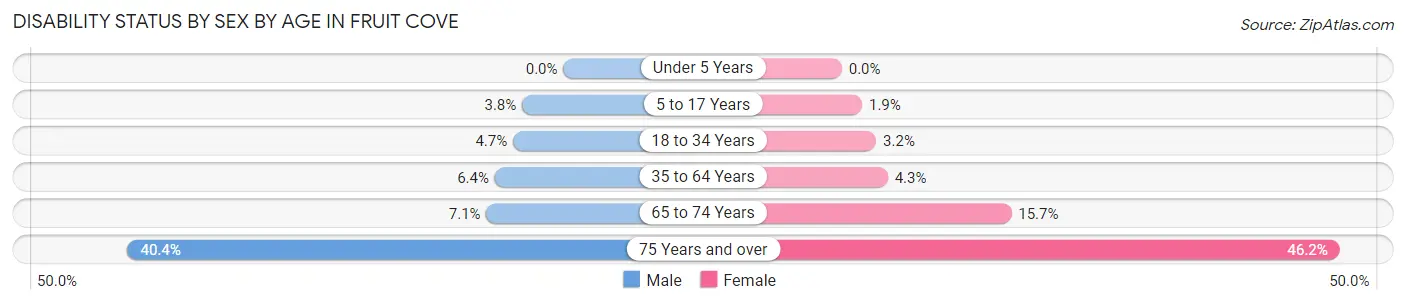
| Age Bracket | Male | Female |
| Under 5 Years | 0 (0.0%) | 0 (0.0%) |
| 5 to 17 Years | 154 (3.8%) | 67 (1.9%) |
| 18 to 34 Years | 128 (4.7%) | 81 (3.2%) |
| 35 to 64 Years | 522 (6.4%) | 326 (4.3%) |
| 65 to 74 Years | 97 (7.1%) | 213 (15.7%) |
| 75 Years and over | 364 (40.4%) | 584 (46.2%) |
Disability Class by Sex by Age in Fruit Cove
Disability Class: Hearing Difficulty
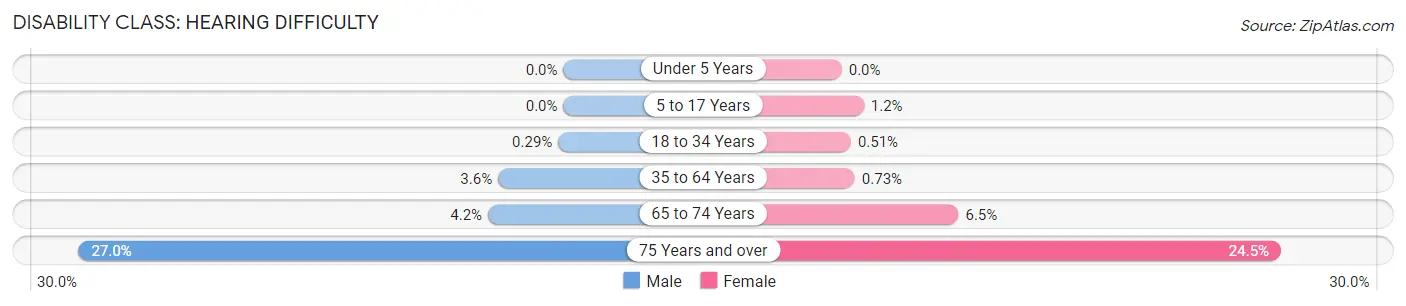
| Age Bracket | Male | Female |
| Under 5 Years | 0 (0.0%) | 0 (0.0%) |
| 5 to 17 Years | 0 (0.0%) | 44 (1.2%) |
| 18 to 34 Years | 8 (0.3%) | 13 (0.5%) |
| 35 to 64 Years | 299 (3.6%) | 56 (0.7%) |
| 65 to 74 Years | 57 (4.2%) | 88 (6.5%) |
| 75 Years and over | 243 (27.0%) | 309 (24.4%) |
Disability Class: Vision Difficulty
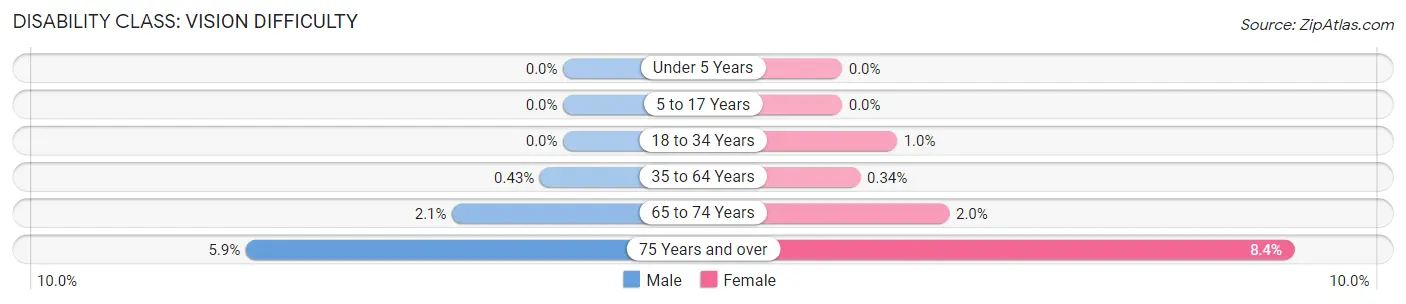
| Age Bracket | Male | Female |
| Under 5 Years | 0 (0.0%) | 0 (0.0%) |
| 5 to 17 Years | 0 (0.0%) | 0 (0.0%) |
| 18 to 34 Years | 0 (0.0%) | 26 (1.0%) |
| 35 to 64 Years | 35 (0.4%) | 26 (0.3%) |
| 65 to 74 Years | 28 (2.1%) | 27 (2.0%) |
| 75 Years and over | 53 (5.9%) | 106 (8.4%) |
Disability Class: Cognitive Difficulty
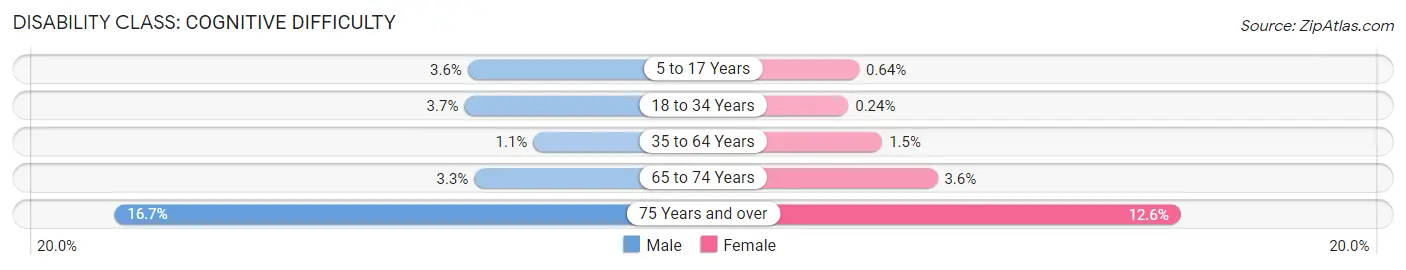
| Age Bracket | Male | Female |
| 5 to 17 Years | 143 (3.5%) | 23 (0.6%) |
| 18 to 34 Years | 101 (3.7%) | 6 (0.2%) |
| 35 to 64 Years | 92 (1.1%) | 115 (1.5%) |
| 65 to 74 Years | 45 (3.3%) | 48 (3.5%) |
| 75 Years and over | 150 (16.7%) | 159 (12.6%) |
Disability Class: Ambulatory Difficulty
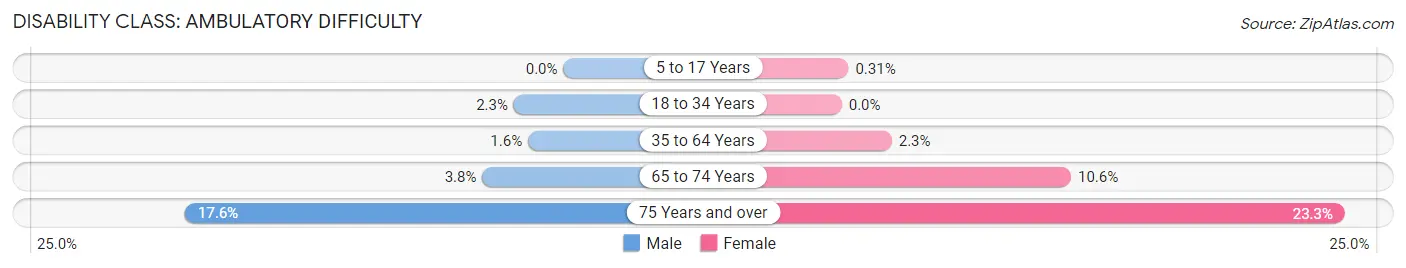
| Age Bracket | Male | Female |
| 5 to 17 Years | 0 (0.0%) | 11 (0.3%) |
| 18 to 34 Years | 63 (2.3%) | 0 (0.0%) |
| 35 to 64 Years | 135 (1.6%) | 177 (2.3%) |
| 65 to 74 Years | 51 (3.8%) | 144 (10.6%) |
| 75 Years and over | 158 (17.6%) | 295 (23.3%) |
Disability Class: Self-Care Difficulty
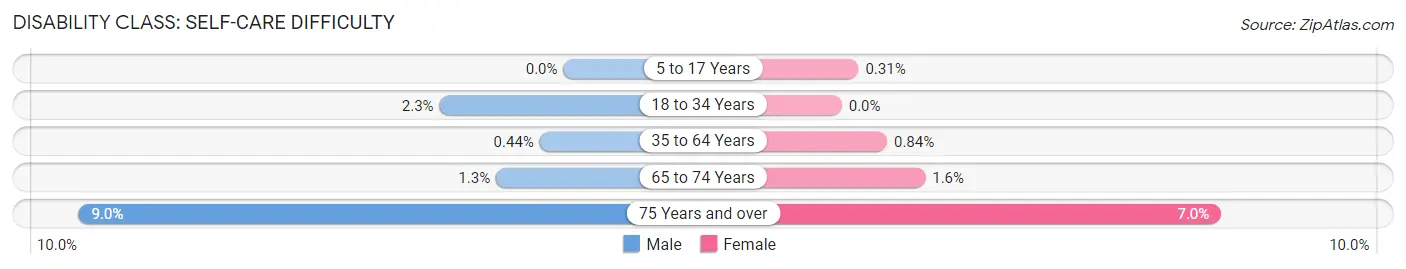
| Age Bracket | Male | Female |
| 5 to 17 Years | 0 (0.0%) | 11 (0.3%) |
| 18 to 34 Years | 63 (2.3%) | 0 (0.0%) |
| 35 to 64 Years | 36 (0.4%) | 64 (0.8%) |
| 65 to 74 Years | 17 (1.3%) | 21 (1.5%) |
| 75 Years and over | 81 (9.0%) | 89 (7.0%) |
Technology Access in Fruit Cove
Computing Device Access in Fruit Cove
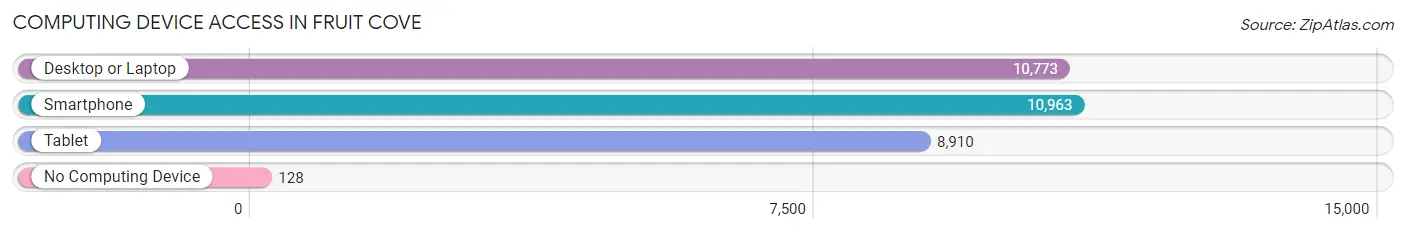
| Device Type | # Households | % Households |
| Desktop or Laptop | 10,773 | 94.2% |
| Smartphone | 10,963 | 95.9% |
| Tablet | 8,910 | 77.9% |
| No Computing Device | 128 | 1.1% |
| Total | 11,435 | 100.0% |
Internet Access in Fruit Cove
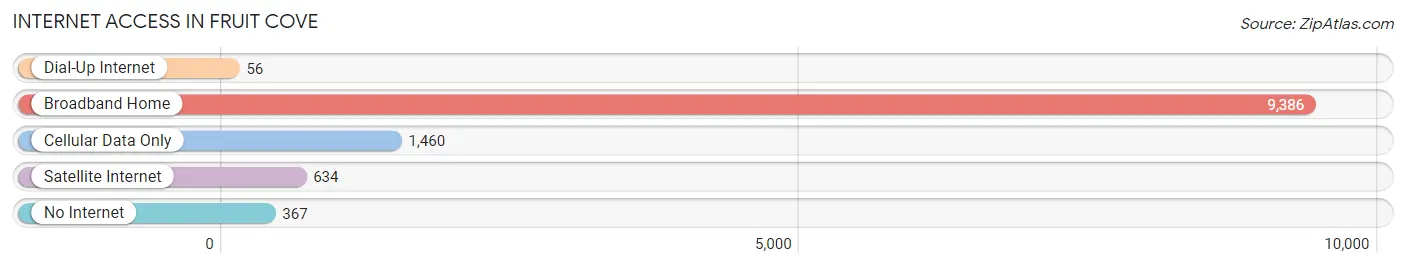
| Internet Type | # Households | % Households |
| Dial-Up Internet | 56 | 0.5% |
| Broadband Home | 9,386 | 82.1% |
| Cellular Data Only | 1,460 | 12.8% |
| Satellite Internet | 634 | 5.5% |
| No Internet | 367 | 3.2% |
| Total | 11,435 | 100.0% |
Fruit Cove Summary
Fruit Cove is an unincorporated community located in St. Johns County, Florida, United States. It is located on the western side of the St. Johns River, about 20 miles south of Jacksonville. The population was estimated to be around 10,000 in 2000.
Geography
Fruit Cove is located at 30°06'N 81°37'W (30.10, -81.62). It is situated on the western side of the St. Johns River, about 20 miles south of Jacksonville. The area is mostly flat, with some rolling hills. The soil is sandy and the climate is humid subtropical.
Economy
Fruit Cove is primarily a residential community, with most of its residents commuting to nearby cities for work. The main industries in the area are retail, healthcare, and education. The largest employers in the area are Baptist Medical Center South, Flagler College, and the St. Johns County School District.
Demographics
In 2000, the population of Fruit Cove was estimated to be around 10,000. The racial makeup of the town was 87.3% White, 8.2% African American, 0.7% Native American, 1.2% Asian, 0.2% Pacific Islander, 1.2% from other races, and 1.4% from two or more races. Hispanic or Latino of any race were 3.3% of the population.
The median income for a household in Fruit Cove was $50,945, and the median income for a family was $60,945. Males had a median income of $41,945 versus $30,945 for females. The per capita income for the town was $25,945. About 4.2% of families and 5.7% of the population were below the poverty line, including 6.7% of those under age 18 and 4.2% of those age 65 or over.
Education
Fruit Cove is served by the St. Johns County School District. The district operates several elementary, middle, and high schools in the area. The district also operates a number of private schools, including St. Johns Country Day School and St. Joseph Academy.
Conclusion
Fruit Cove is a small, unincorporated community located in St. Johns County, Florida. It is situated on the western side of the St. Johns River, about 20 miles south of Jacksonville. The population was estimated to be around 10,000 in 2000. The economy of Fruit Cove is primarily residential, with most of its residents commuting to nearby cities for work. The racial makeup of the town was 87.3% White, 8.2% African American, 0.7% Native American, 1.2% Asian, 0.2% Pacific Islander, 1.2% from other races, and 1.4% from two or more races. The median income for a household in Fruit Cove was $50,945, and the median income for a family was $60,945. The town is served by the St. Johns County School District, which operates several elementary, middle, and high schools in the area.
Common Questions
What is Per Capita Income in Fruit Cove?
Per Capita income in Fruit Cove is $54,802.
What is the Median Family Income in Fruit Cove?
Median Family Income in Fruit Cove is $139,929.
What is the Median Household income in Fruit Cove?
Median Household Income in Fruit Cove is $134,535.
What is Income or Wage Gap in Fruit Cove?
Income or Wage Gap in Fruit Cove is 45.3%.
Women in Fruit Cove earn 54.7 cents for every dollar earned by a man.
What is Family Income Deficit in Fruit Cove?
Family Income Deficit in Fruit Cove is $11,936.
Families that are below poverty line in Fruit Cove earn $11,936 less on average than the poverty threshold level.
What is Inequality or Gini Index in Fruit Cove?
Inequality or Gini Index in Fruit Cove is 0.40.
What is the Total Population of Fruit Cove?
Total Population of Fruit Cove is 35,333.
What is the Total Male Population of Fruit Cove?
Total Male Population of Fruit Cove is 18,189.
What is the Total Female Population of Fruit Cove?
Total Female Population of Fruit Cove is 17,144.
What is the Ratio of Males per 100 Females in Fruit Cove?
There are 106.10 Males per 100 Females in Fruit Cove.
What is the Ratio of Females per 100 Males in Fruit Cove?
There are 94.25 Females per 100 Males in Fruit Cove.
What is the Median Population Age in Fruit Cove?
Median Population Age in Fruit Cove is 41.5 Years.
What is the Average Family Size in Fruit Cove
Average Family Size in Fruit Cove is 3.3 People.
What is the Average Household Size in Fruit Cove
Average Household Size in Fruit Cove is 3.1 People.
How Large is the Labor Force in Fruit Cove?
There are 17,691 People in the Labor Forcein in Fruit Cove.
What is the Percentage of People in the Labor Force in Fruit Cove?
63.7% of People are in the Labor Force in Fruit Cove.
What is the Unemployment Rate in Fruit Cove?
Unemployment Rate in Fruit Cove is 2.7%.