Londonderry, NH Map & Demographics
Londonderry Map
Londonderry Overview
$50,175
PER CAPITA INCOME
$130,859
AVG FAMILY INCOME
$113,557
AVG HOUSEHOLD INCOME
35.4%
WAGE / INCOME GAP [ % ]
64.6¢/ $1
WAGE / INCOME GAP [ $ ]
$2,665
FAMILY INCOME DEFICIT
0.37
INEQUALITY / GINI INDEX
12,143
TOTAL POPULATION
6,002
MALE POPULATION
6,141
FEMALE POPULATION
97.74
MALES / 100 FEMALES
102.32
FEMALES / 100 MALES
42.7
MEDIAN AGE
3.2
AVG FAMILY SIZE
2.7
AVG HOUSEHOLD SIZE
7,151
LABOR FORCE [ PEOPLE ]
70.6%
PERCENT IN LABOR FORCE
4.7%
UNEMPLOYMENT RATE
Londonderry Zip Codes
Londonderry Area Codes
Income in Londonderry
Income Overview in Londonderry
Per Capita Income in Londonderry is $50,175, while median incomes of families and households are $130,859 and $113,557 respectively.
| Characteristic | Number | Measure |
| Per Capita Income | 12,143 | $50,175 |
| Median Family Income | 3,294 | $130,859 |
| Mean Family Income | 3,294 | $145,572 |
| Median Household Income | 4,539 | $113,557 |
| Mean Household Income | 4,539 | $130,582 |
| Income Deficit | 3,294 | $2,665 |
| Wage / Income Gap (%) | 12,143 | 35.39% |
| Wage / Income Gap ($) | 12,143 | 64.61¢ per $1 |
| Gini / Inequality Index | 12,143 | 0.37 |
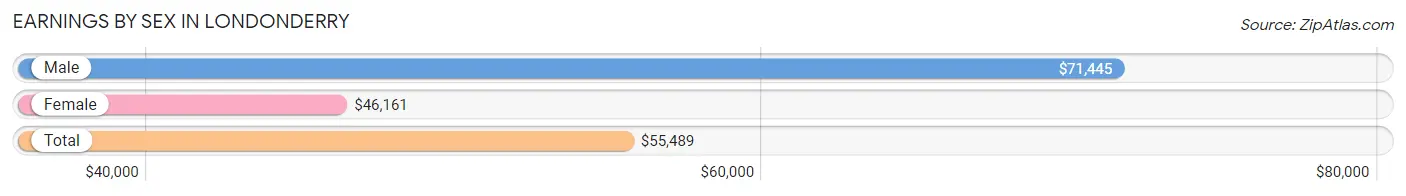
Earnings by Sex in Londonderry
Average Earnings in Londonderry are $55,489, $71,445 for men and $46,161 for women, a difference of 35.4%.
| Sex | Number | Average Earnings |
| Male | 3,784 (51.2%) | $71,445 |
| Female | 3,603 (48.8%) | $46,161 |
| Total | 7,387 (100.0%) | $55,489 |
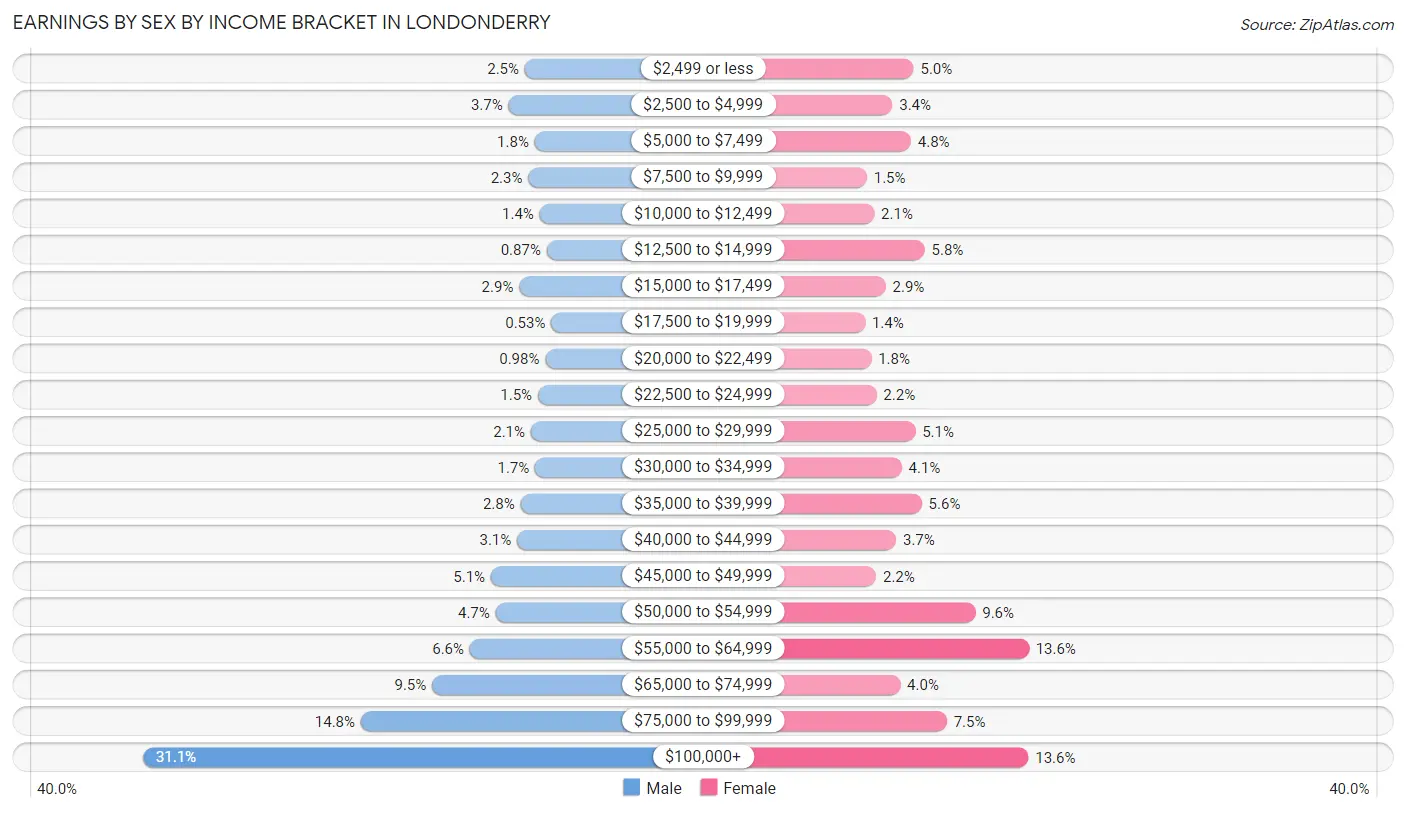
Earnings by Sex by Income Bracket in Londonderry
The most common earnings brackets in Londonderry are $100,000+ for men (1,178 | 31.1%) and $55,000 to $64,999 for women (491 | 13.6%).
| Income | Male | Female |
| $2,499 or less | 95 (2.5%) | 180 (5.0%) |
| $2,500 to $4,999 | 141 (3.7%) | 123 (3.4%) |
| $5,000 to $7,499 | 67 (1.8%) | 173 (4.8%) |
| $7,500 to $9,999 | 85 (2.2%) | 54 (1.5%) |
| $10,000 to $12,499 | 53 (1.4%) | 74 (2.1%) |
| $12,500 to $14,999 | 33 (0.9%) | 210 (5.8%) |
| $15,000 to $17,499 | 111 (2.9%) | 105 (2.9%) |
| $17,500 to $19,999 | 20 (0.5%) | 49 (1.4%) |
| $20,000 to $22,499 | 37 (1.0%) | 66 (1.8%) |
| $22,500 to $24,999 | 58 (1.5%) | 80 (2.2%) |
| $25,000 to $29,999 | 78 (2.1%) | 185 (5.1%) |
| $30,000 to $34,999 | 66 (1.7%) | 148 (4.1%) |
| $35,000 to $39,999 | 107 (2.8%) | 202 (5.6%) |
| $40,000 to $44,999 | 117 (3.1%) | 133 (3.7%) |
| $45,000 to $49,999 | 191 (5.1%) | 79 (2.2%) |
| $50,000 to $54,999 | 178 (4.7%) | 347 (9.6%) |
| $55,000 to $64,999 | 251 (6.6%) | 491 (13.6%) |
| $65,000 to $74,999 | 358 (9.5%) | 144 (4.0%) |
| $75,000 to $99,999 | 560 (14.8%) | 270 (7.5%) |
| $100,000+ | 1,178 (31.1%) | 490 (13.6%) |
| Total | 3,784 (100.0%) | 3,603 (100.0%) |
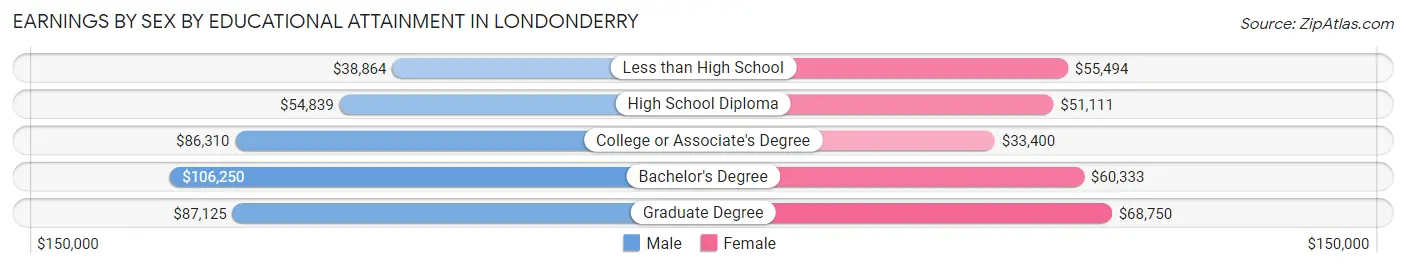
Earnings by Sex by Educational Attainment in Londonderry
Average earnings in Londonderry are $83,134 for men and $51,863 for women, a difference of 37.6%. Men with an educational attainment of bachelor's degree enjoy the highest average annual earnings of $106,250, while those with less than high school education earn the least with $38,864. Women with an educational attainment of graduate degree earn the most with the average annual earnings of $68,750, while those with college or associate's degree education have the smallest earnings of $33,400.
| Educational Attainment | Male Income | Female Income |
| Less than High School | $38,864 | $55,494 |
| High School Diploma | $54,839 | $51,111 |
| College or Associate's Degree | $86,310 | $33,400 |
| Bachelor's Degree | $106,250 | $60,333 |
| Graduate Degree | $87,125 | $68,750 |
| Total | $83,134 | $51,863 |
Family Income in Londonderry
Family Income Brackets in Londonderry
According to the Londonderry family income data, there are 820 families falling into the $200,000+ income range, which is the most common income bracket and makes up 24.9% of all families.
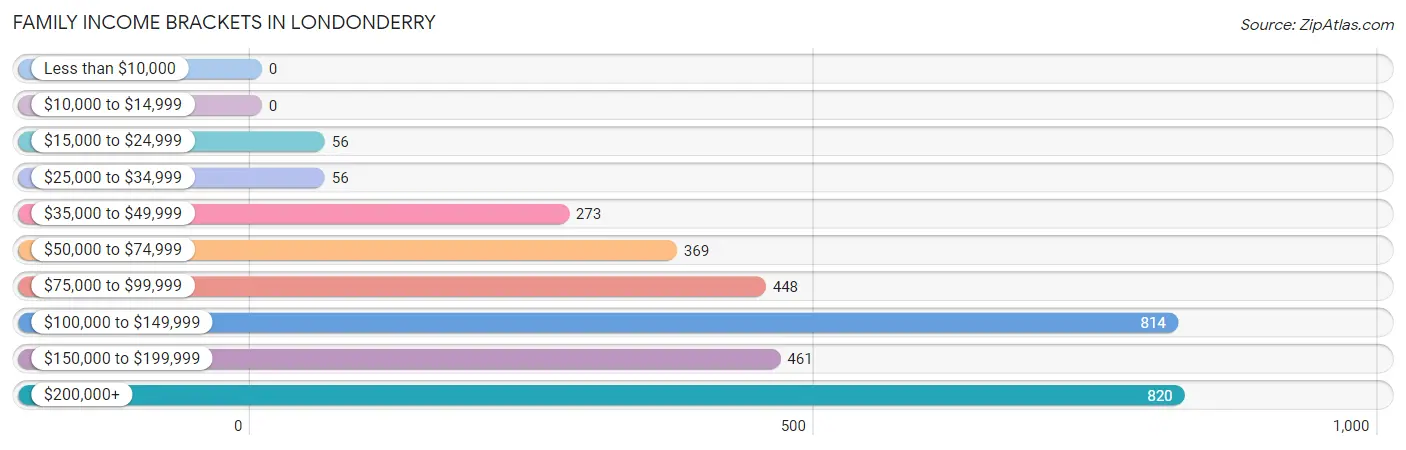
| Income Bracket | # Families | % Families |
| Less than $10,000 | 0 | 0.0% |
| $10,000 to $14,999 | 0 | 0.0% |
| $15,000 to $24,999 | 56 | 1.7% |
| $25,000 to $34,999 | 56 | 1.7% |
| $35,000 to $49,999 | 273 | 8.3% |
| $50,000 to $74,999 | 369 | 11.2% |
| $75,000 to $99,999 | 448 | 13.6% |
| $100,000 to $149,999 | 814 | 24.7% |
| $150,000 to $199,999 | 461 | 14.0% |
| $200,000+ | 820 | 24.9% |
Family Income by Famaliy Size in Londonderry
6-person families (93 | 2.8%) account for the highest median family income in Londonderry with $189,125 per family, while 3-person families (859 | 26.1%) have the highest median income of $52,577 per family member.
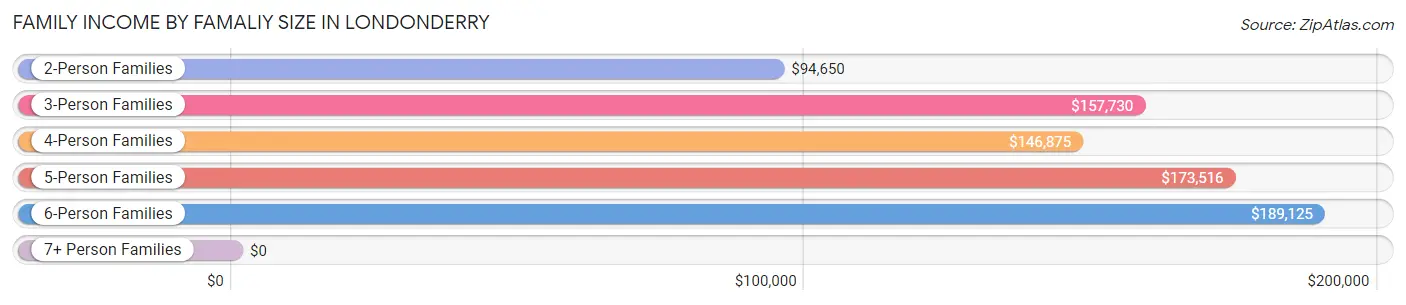
| Income Bracket | # Families | Median Income |
| 2-Person Families | 1,407 (42.7%) | $94,650 |
| 3-Person Families | 859 (26.1%) | $157,730 |
| 4-Person Families | 606 (18.4%) | $146,875 |
| 5-Person Families | 321 (9.7%) | $173,516 |
| 6-Person Families | 93 (2.8%) | $189,125 |
| 7+ Person Families | 8 (0.2%) | $0 |
| Total | 3,294 (100.0%) | $130,859 |
Family Income by Number of Earners in Londonderry
The median family income in Londonderry is $130,859, with families comprising 3+ earners (627) having the highest median family income of $210,387, while families with no earners (316) have the lowest median family income of $68,000, accounting for 19.0% and 9.6% of families, respectively.
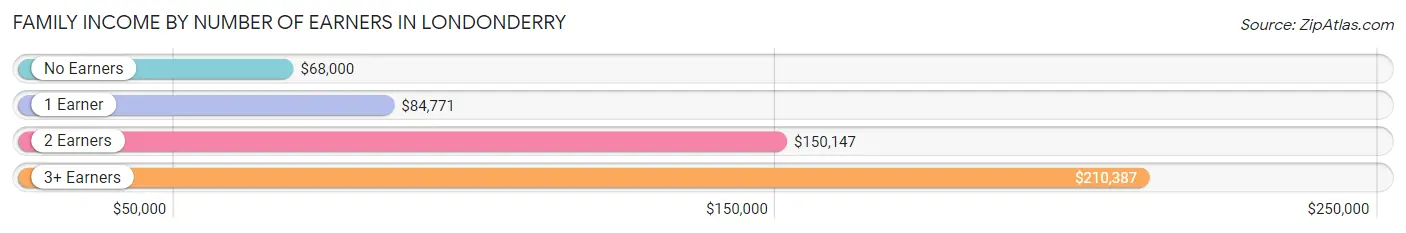
| Number of Earners | # Families | Median Income |
| No Earners | 316 (9.6%) | $68,000 |
| 1 Earner | 901 (27.4%) | $84,771 |
| 2 Earners | 1,450 (44.0%) | $150,147 |
| 3+ Earners | 627 (19.0%) | $210,387 |
| Total | 3,294 (100.0%) | $130,859 |
Household Income in Londonderry
Household Income Brackets in Londonderry
With 1,049 households falling in the category, the $100,000 to $149,999 income range is the most frequent in Londonderry, accounting for 23.1% of all households. In contrast, only 50 households (1.1%) fall into the $10,000 to $14,999 income bracket, making it the least populous group.
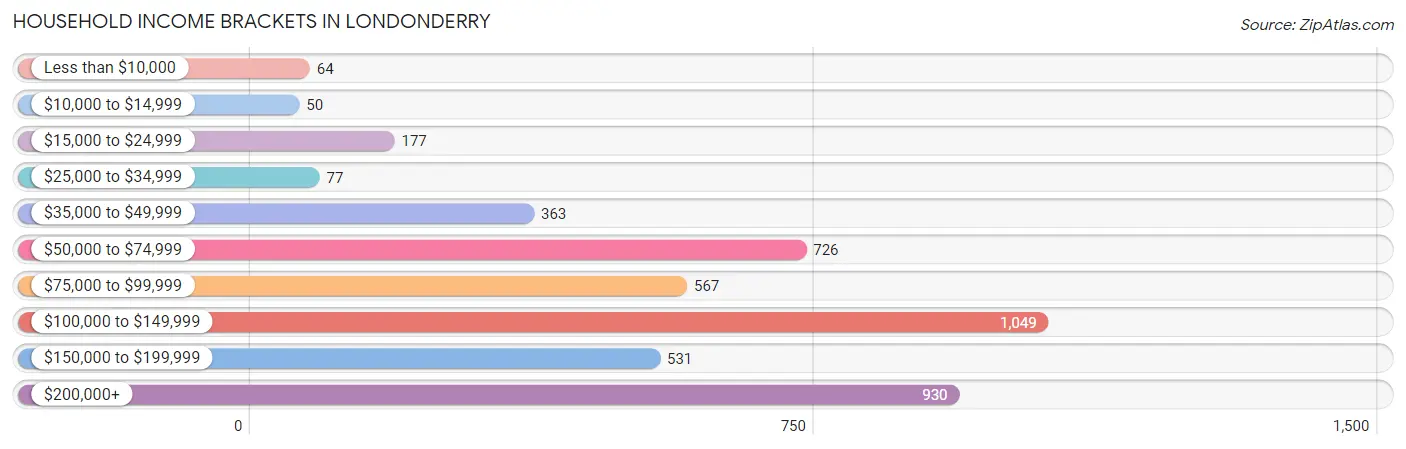
| Income Bracket | # Households | % Households |
| Less than $10,000 | 64 | 1.4% |
| $10,000 to $14,999 | 50 | 1.1% |
| $15,000 to $24,999 | 177 | 3.9% |
| $25,000 to $34,999 | 77 | 1.7% |
| $35,000 to $49,999 | 363 | 8.0% |
| $50,000 to $74,999 | 726 | 16.0% |
| $75,000 to $99,999 | 567 | 12.5% |
| $100,000 to $149,999 | 1,049 | 23.1% |
| $150,000 to $199,999 | 531 | 11.7% |
| $200,000+ | 930 | 20.5% |
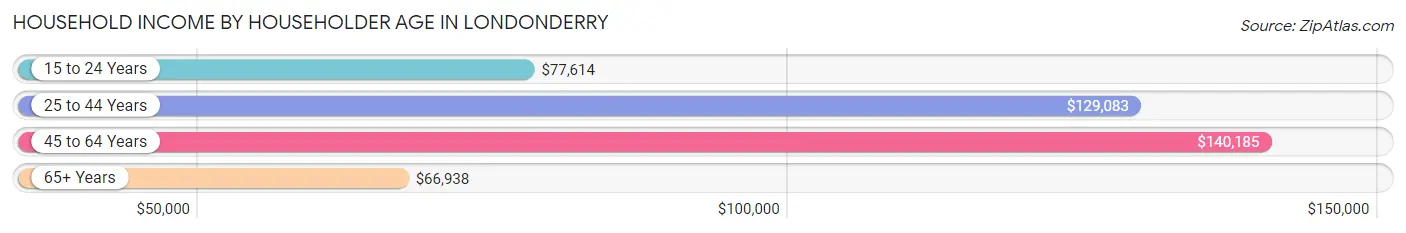
Household Income by Householder Age in Londonderry
The median household income in Londonderry is $113,557, with the highest median household income of $140,185 found in the 45 to 64 years age bracket for the primary householder. A total of 2,026 households (44.6%) fall into this category. Meanwhile, the 65+ years age bracket for the primary householder has the lowest median household income of $66,938, with 1,269 households (28.0%) in this group.
| Income Bracket | # Households | Median Income |
| 15 to 24 Years | 41 (0.9%) | $77,614 |
| 25 to 44 Years | 1,203 (26.5%) | $129,083 |
| 45 to 64 Years | 2,026 (44.6%) | $140,185 |
| 65+ Years | 1,269 (28.0%) | $66,938 |
| Total | 4,539 (100.0%) | $113,557 |
Poverty in Londonderry
Income Below Poverty by Sex and Age in Londonderry
With 1.5% poverty level for males and 2.4% for females among the residents of Londonderry, 6 to 11 year old males and 75 year old and over females are the most vulnerable to poverty, with 49 males (10.9%) and 47 females (9.5%) in their respective age groups living below the poverty level.
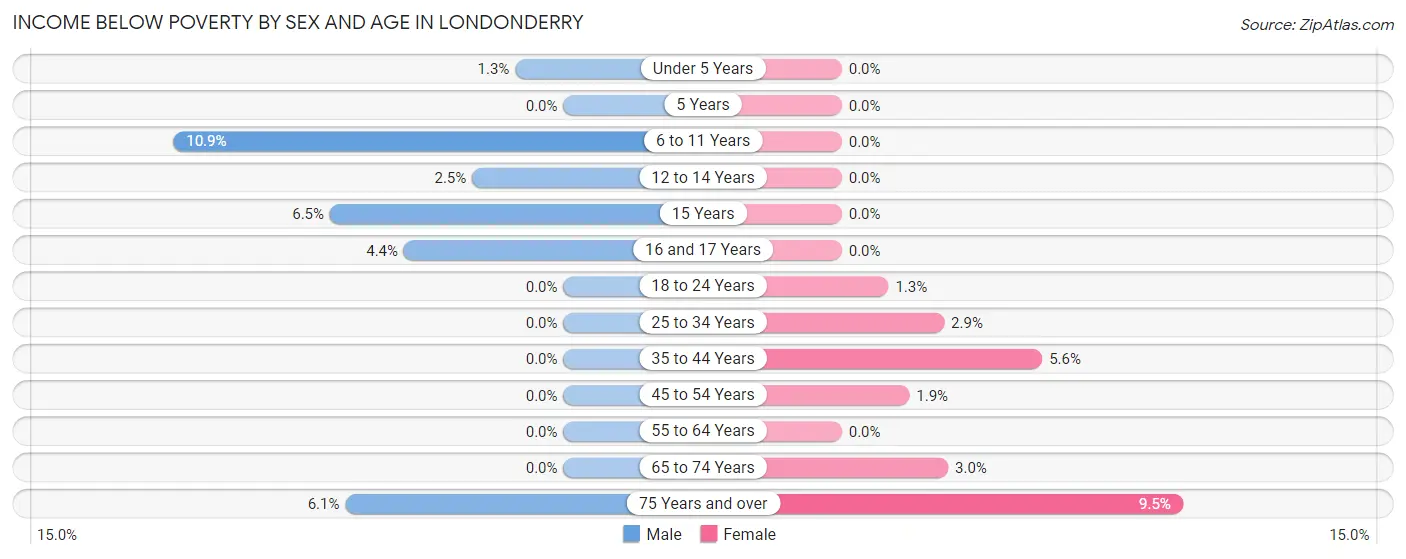
| Age Bracket | Male | Female |
| Under 5 Years | 4 (1.3%) | 0 (0.0%) |
| 5 Years | 0 (0.0%) | 0 (0.0%) |
| 6 to 11 Years | 49 (10.9%) | 0 (0.0%) |
| 12 to 14 Years | 7 (2.5%) | 0 (0.0%) |
| 15 Years | 8 (6.5%) | 0 (0.0%) |
| 16 and 17 Years | 4 (4.4%) | 0 (0.0%) |
| 18 to 24 Years | 0 (0.0%) | 10 (1.3%) |
| 25 to 34 Years | 0 (0.0%) | 19 (2.9%) |
| 35 to 44 Years | 0 (0.0%) | 41 (5.6%) |
| 45 to 54 Years | 0 (0.0%) | 17 (1.9%) |
| 55 to 64 Years | 0 (0.0%) | 0 (0.0%) |
| 65 to 74 Years | 0 (0.0%) | 16 (3.0%) |
| 75 Years and over | 21 (6.1%) | 47 (9.5%) |
| Total | 93 (1.5%) | 150 (2.4%) |
Income Above Poverty by Sex and Age in Londonderry
According to the poverty statistics in Londonderry, males aged 5 years and females aged under 5 years are the age groups that are most secure financially, with 100.0% of males and 100.0% of females in these age groups living above the poverty line.
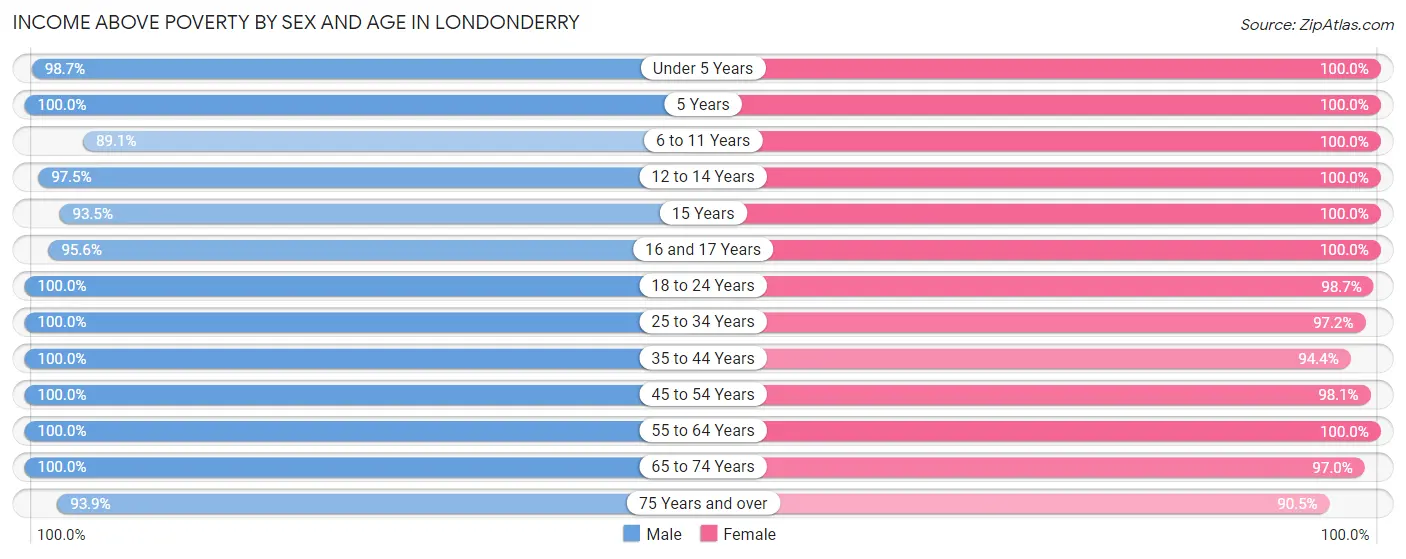
| Age Bracket | Male | Female |
| Under 5 Years | 294 (98.7%) | 236 (100.0%) |
| 5 Years | 76 (100.0%) | 29 (100.0%) |
| 6 to 11 Years | 402 (89.1%) | 220 (100.0%) |
| 12 to 14 Years | 269 (97.5%) | 230 (100.0%) |
| 15 Years | 115 (93.5%) | 75 (100.0%) |
| 16 and 17 Years | 86 (95.6%) | 118 (100.0%) |
| 18 to 24 Years | 736 (100.0%) | 760 (98.7%) |
| 25 to 34 Years | 648 (100.0%) | 648 (97.2%) |
| 35 to 44 Years | 723 (100.0%) | 694 (94.4%) |
| 45 to 54 Years | 827 (100.0%) | 885 (98.1%) |
| 55 to 64 Years | 889 (100.0%) | 1,124 (100.0%) |
| 65 to 74 Years | 519 (100.0%) | 524 (97.0%) |
| 75 Years and over | 325 (93.9%) | 448 (90.5%) |
| Total | 5,909 (98.5%) | 5,991 (97.6%) |
Income Below Poverty Among Married-Couple Families in Londonderry
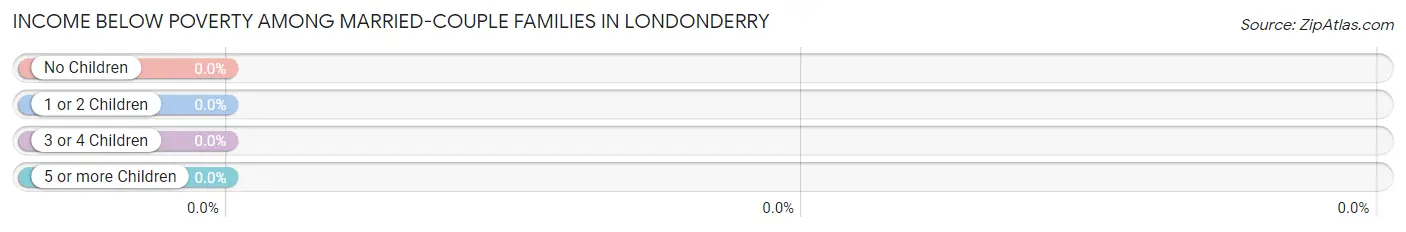
| Children | Above Poverty | Below Poverty |
| No Children | 1,640 (100.0%) | 0 (0.0%) |
| 1 or 2 Children | 844 (100.0%) | 0 (0.0%) |
| 3 or 4 Children | 139 (100.0%) | 0 (0.0%) |
| 5 or more Children | 0 (0.0%) | 0 (0.0%) |
| Total | 2,623 (100.0%) | 0 (0.0%) |
Income Below Poverty Among Single-Parent Households in Londonderry
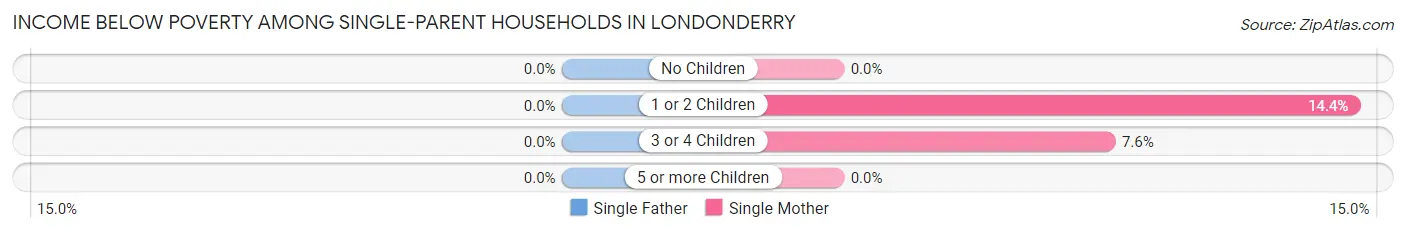
| Children | Single Father | Single Mother |
| No Children | 0 (0.0%) | 0 (0.0%) |
| 1 or 2 Children | 0 (0.0%) | 29 (14.4%) |
| 3 or 4 Children | 0 (0.0%) | 5 (7.6%) |
| 5 or more Children | 0 (0.0%) | 0 (0.0%) |
| Total | 0 (0.0%) | 34 (7.0%) |
Income Below Poverty Among Married-Couple vs Single-Parent Households in Londonderry
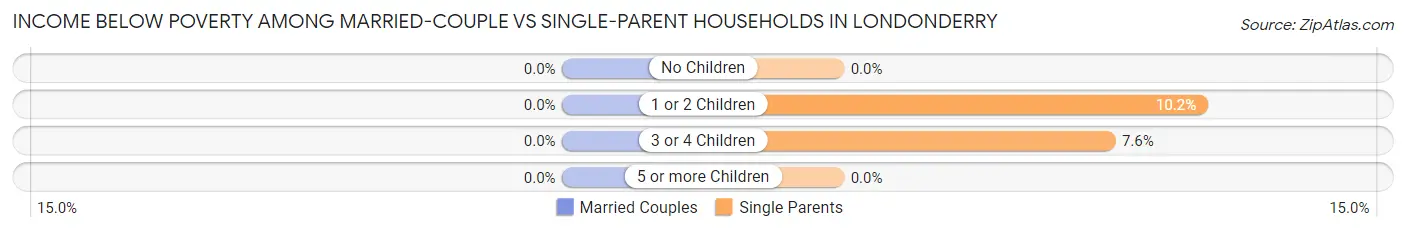
| Children | Married-Couple Families | Single-Parent Households |
| No Children | 0 (0.0%) | 0 (0.0%) |
| 1 or 2 Children | 0 (0.0%) | 29 (10.2%) |
| 3 or 4 Children | 0 (0.0%) | 5 (7.6%) |
| 5 or more Children | 0 (0.0%) | 0 (0.0%) |
| Total | 0 (0.0%) | 34 (5.1%) |
Race in Londonderry
The most populous races in Londonderry are White / Caucasian (11,527 | 94.9%), Hispanic or Latino (460 | 3.8%), and Two or more Races (457 | 3.8%).
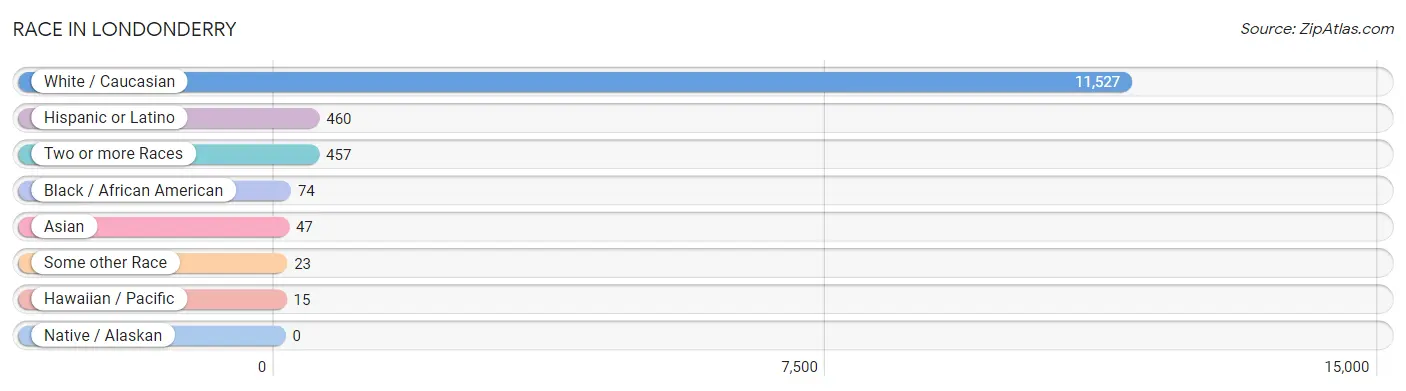
| Race | # Population | % Population |
| Asian | 47 | 0.4% |
| Black / African American | 74 | 0.6% |
| Hawaiian / Pacific | 15 | 0.1% |
| Hispanic or Latino | 460 | 3.8% |
| Native / Alaskan | 0 | 0.0% |
| White / Caucasian | 11,527 | 94.9% |
| Two or more Races | 457 | 3.8% |
| Some other Race | 23 | 0.2% |
| Total | 12,143 | 100.0% |
Ancestry in Londonderry
The most populous ancestries reported in Londonderry are Irish (3,189 | 26.3%), English (1,851 | 15.2%), Italian (1,771 | 14.6%), French Canadian (1,242 | 10.2%), and French (1,156 | 9.5%), together accounting for 75.8% of all Londonderry residents.
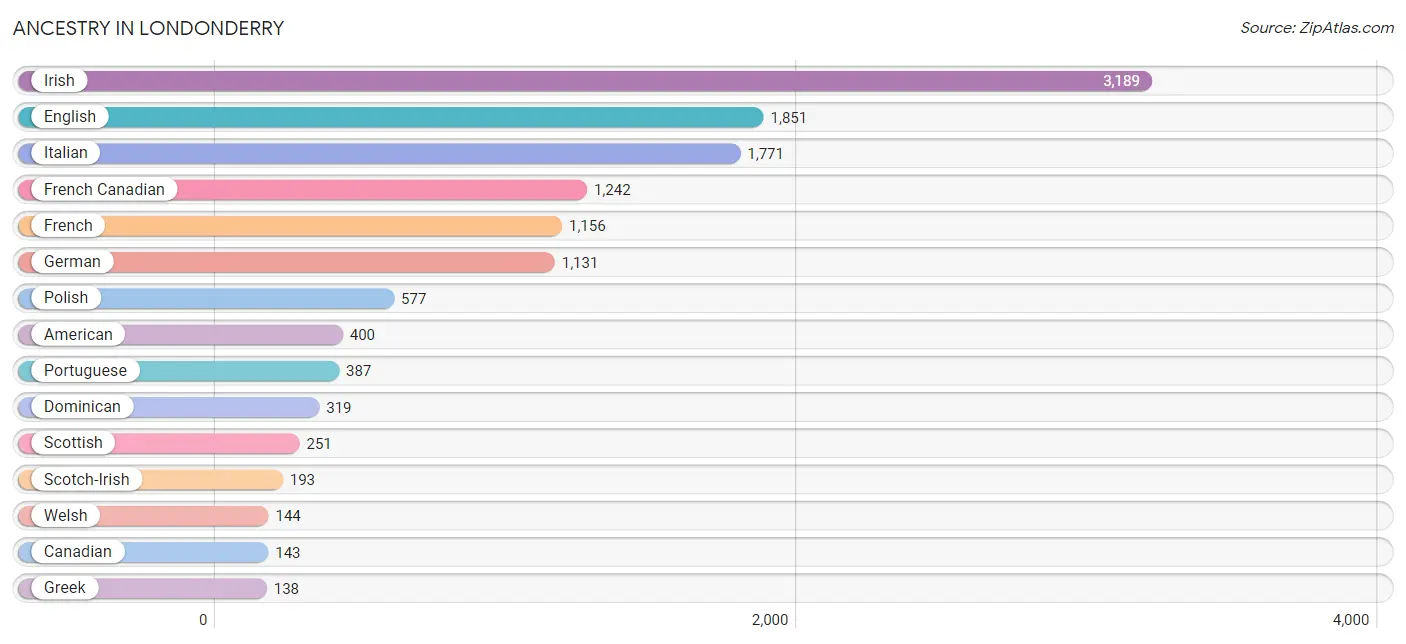
| Ancestry | # Population | % Population |
| American | 400 | 3.3% |
| Arab | 37 | 0.3% |
| Argentinean | 10 | 0.1% |
| Austrian | 18 | 0.2% |
| Bhutanese | 7 | 0.1% |
| Brazilian | 127 | 1.1% |
| British | 107 | 0.9% |
| Canadian | 143 | 1.2% |
| Colombian | 20 | 0.2% |
| Cuban | 11 | 0.1% |
| Czech | 34 | 0.3% |
| Danish | 77 | 0.6% |
| Dominican | 319 | 2.6% |
| Dutch | 60 | 0.5% |
| Eastern European | 122 | 1.0% |
| English | 1,851 | 15.2% |
| European | 87 | 0.7% |
| Finnish | 7 | 0.1% |
| French | 1,156 | 9.5% |
| French Canadian | 1,242 | 10.2% |
| German | 1,131 | 9.3% |
| Greek | 138 | 1.1% |
| Haitian | 14 | 0.1% |
| Hungarian | 61 | 0.5% |
| Icelander | 17 | 0.1% |
| Indian (Asian) | 69 | 0.6% |
| Irish | 3,189 | 26.3% |
| Italian | 1,771 | 14.6% |
| Lebanese | 37 | 0.3% |
| Lithuanian | 43 | 0.4% |
| Mexican | 21 | 0.2% |
| Native Hawaiian | 15 | 0.1% |
| Navajo | 6 | 0.1% |
| Nigerian | 21 | 0.2% |
| Northern European | 19 | 0.2% |
| Norwegian | 70 | 0.6% |
| Polish | 577 | 4.8% |
| Portuguese | 387 | 3.2% |
| Puerto Rican | 79 | 0.6% |
| Romanian | 49 | 0.4% |
| Russian | 75 | 0.6% |
| Scandinavian | 63 | 0.5% |
| Scotch-Irish | 193 | 1.6% |
| Scottish | 251 | 2.1% |
| Slavic | 14 | 0.1% |
| Slovak | 20 | 0.2% |
| Slovene | 7 | 0.1% |
| South American | 30 | 0.3% |
| Subsaharan African | 21 | 0.2% |
| Swedish | 96 | 0.8% |
| Swiss | 79 | 0.6% |
| Thai | 13 | 0.1% |
| Ukrainian | 8 | 0.1% |
| Welsh | 144 | 1.2% | View All 54 Rows |
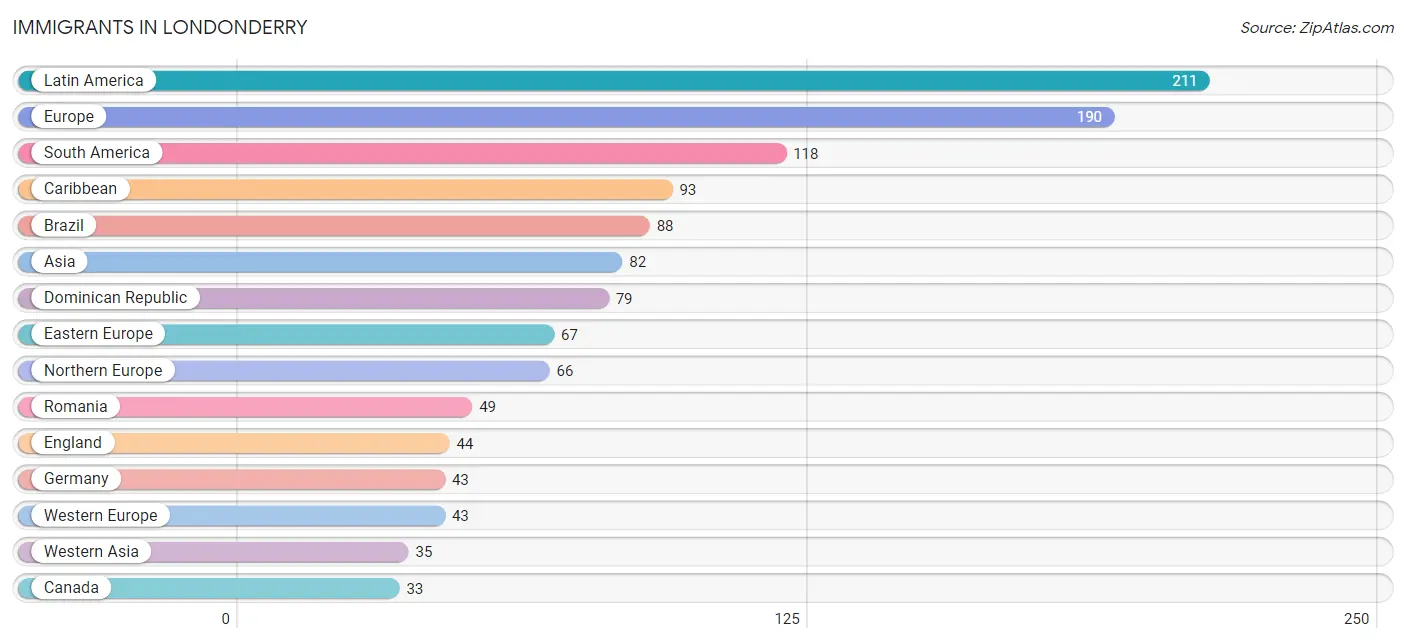
Immigrants in Londonderry
The most numerous immigrant groups reported in Londonderry came from Latin America (211 | 1.7%), Europe (190 | 1.6%), South America (118 | 1.0%), Caribbean (93 | 0.8%), and Brazil (88 | 0.7%), together accounting for 5.8% of all Londonderry residents.
| Immigration Origin | # Population | % Population |
| Argentina | 10 | 0.1% |
| Asia | 82 | 0.7% |
| Brazil | 88 | 0.7% |
| Canada | 33 | 0.3% |
| Caribbean | 93 | 0.8% |
| China | 11 | 0.1% |
| Colombia | 20 | 0.2% |
| Czechoslovakia | 18 | 0.2% |
| Denmark | 11 | 0.1% |
| Dominican Republic | 79 | 0.6% |
| Eastern Asia | 18 | 0.2% |
| Eastern Europe | 67 | 0.5% |
| England | 44 | 0.4% |
| Europe | 190 | 1.6% |
| Germany | 43 | 0.4% |
| Haiti | 14 | 0.1% |
| India | 29 | 0.2% |
| Israel | 11 | 0.1% |
| Japan | 7 | 0.1% |
| Latin America | 211 | 1.7% |
| Lebanon | 24 | 0.2% |
| Northern Europe | 66 | 0.5% |
| Portugal | 14 | 0.1% |
| Romania | 49 | 0.4% |
| South America | 118 | 1.0% |
| South Central Asia | 29 | 0.2% |
| Southern Europe | 14 | 0.1% |
| Western Asia | 35 | 0.3% |
| Western Europe | 43 | 0.4% | View All 29 Rows |
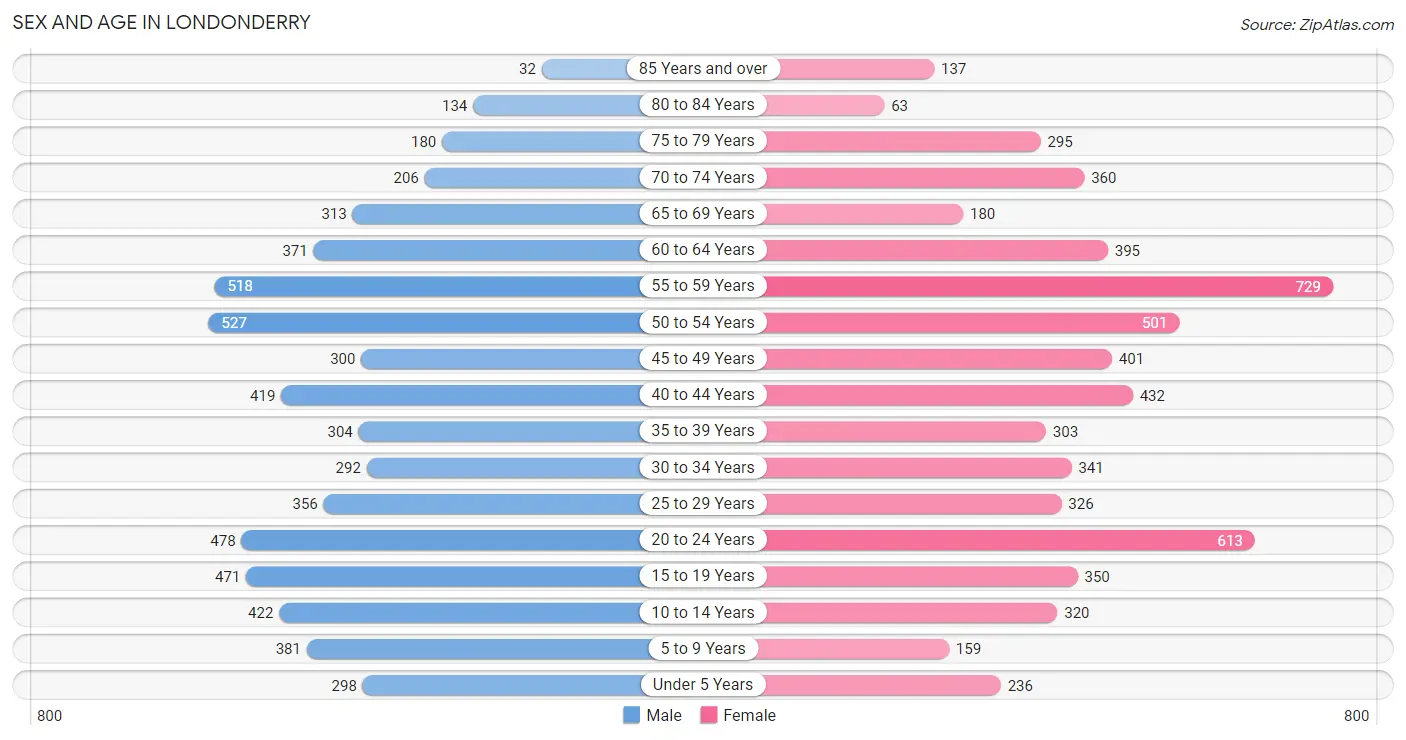
Sex and Age in Londonderry
Sex and Age in Londonderry
The most populous age groups in Londonderry are 50 to 54 Years (527 | 8.8%) for men and 55 to 59 Years (729 | 11.9%) for women.
| Age Bracket | Male | Female |
| Under 5 Years | 298 (5.0%) | 236 (3.8%) |
| 5 to 9 Years | 381 (6.4%) | 159 (2.6%) |
| 10 to 14 Years | 422 (7.0%) | 320 (5.2%) |
| 15 to 19 Years | 471 (7.9%) | 350 (5.7%) |
| 20 to 24 Years | 478 (8.0%) | 613 (10.0%) |
| 25 to 29 Years | 356 (5.9%) | 326 (5.3%) |
| 30 to 34 Years | 292 (4.9%) | 341 (5.6%) |
| 35 to 39 Years | 304 (5.1%) | 303 (4.9%) |
| 40 to 44 Years | 419 (7.0%) | 432 (7.0%) |
| 45 to 49 Years | 300 (5.0%) | 401 (6.5%) |
| 50 to 54 Years | 527 (8.8%) | 501 (8.2%) |
| 55 to 59 Years | 518 (8.6%) | 729 (11.9%) |
| 60 to 64 Years | 371 (6.2%) | 395 (6.4%) |
| 65 to 69 Years | 313 (5.2%) | 180 (2.9%) |
| 70 to 74 Years | 206 (3.4%) | 360 (5.9%) |
| 75 to 79 Years | 180 (3.0%) | 295 (4.8%) |
| 80 to 84 Years | 134 (2.2%) | 63 (1.0%) |
| 85 Years and over | 32 (0.5%) | 137 (2.2%) |
| Total | 6,002 (100.0%) | 6,141 (100.0%) |
Families and Households in Londonderry
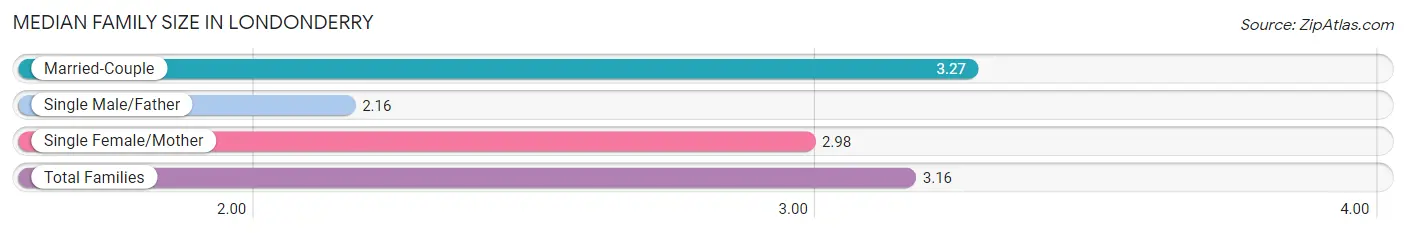
Median Family Size in Londonderry
The median family size in Londonderry is 3.16 persons per family, with married-couple families (2,623 | 79.6%) accounting for the largest median family size of 3.27 persons per family. On the other hand, single male/father families (183 | 5.6%) represent the smallest median family size with 2.16 persons per family.
| Family Type | # Families | Family Size |
| Married-Couple | 2,623 (79.6%) | 3.27 |
| Single Male/Father | 183 (5.6%) | 2.16 |
| Single Female/Mother | 488 (14.8%) | 2.98 |
| Total Families | 3,294 (100.0%) | 3.16 |
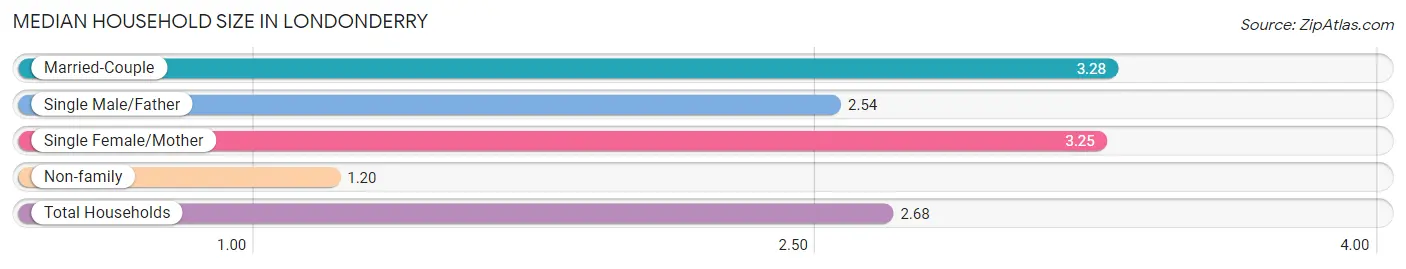
Median Household Size in Londonderry
The median household size in Londonderry is 2.68 persons per household, with married-couple households (2,623 | 57.8%) accounting for the largest median household size of 3.28 persons per household. non-family households (1,245 | 27.4%) represent the smallest median household size with 1.20 persons per household.
| Household Type | # Households | Household Size |
| Married-Couple | 2,623 (57.8%) | 3.28 |
| Single Male/Father | 183 (4.0%) | 2.54 |
| Single Female/Mother | 488 (10.7%) | 3.25 |
| Non-family | 1,245 (27.4%) | 1.20 |
| Total Households | 4,539 (100.0%) | 2.68 |
Household Size by Marriage Status in Londonderry
Out of a total of 4,539 households in Londonderry, 3,294 (72.6%) are family households, while 1,245 (27.4%) are nonfamily households. The most numerous type of family households are 2-person households, comprising 1,323, and the most common type of nonfamily households are 1-person households, comprising 1,033.
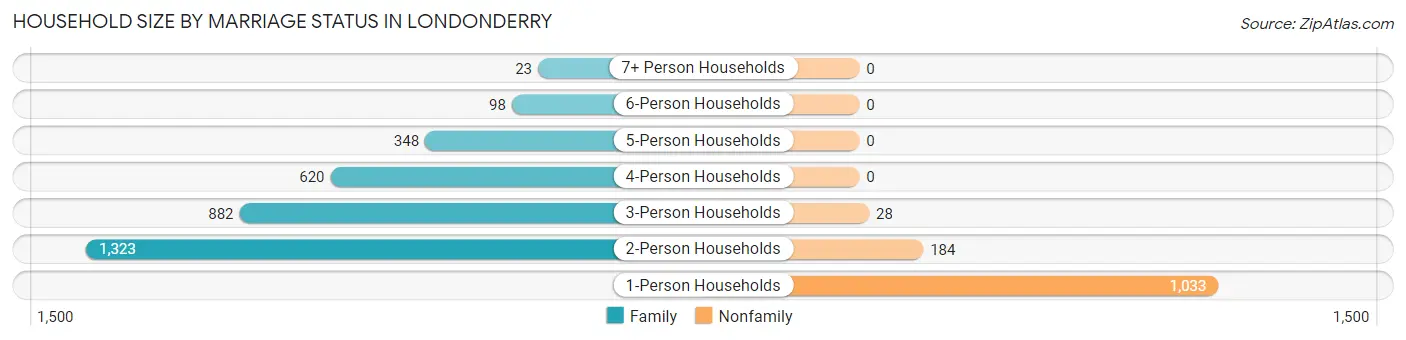
| Household Size | Family Households | Nonfamily Households |
| 1-Person Households | - | 1,033 (22.8%) |
| 2-Person Households | 1,323 (29.1%) | 184 (4.1%) |
| 3-Person Households | 882 (19.4%) | 28 (0.6%) |
| 4-Person Households | 620 (13.7%) | 0 (0.0%) |
| 5-Person Households | 348 (7.7%) | 0 (0.0%) |
| 6-Person Households | 98 (2.2%) | 0 (0.0%) |
| 7+ Person Households | 23 (0.5%) | 0 (0.0%) |
| Total | 3,294 (72.6%) | 1,245 (27.4%) |
Female Fertility in Londonderry
Fertility by Age in Londonderry
Average fertility rate in Londonderry is 30.0 births per 1,000 women. Women in the age bracket of 15 to 19 years have the highest fertility rate with 37.0 births per 1,000 women. Women in the age bracket of 20 to 34 years acount for 55.9% of all women with births.
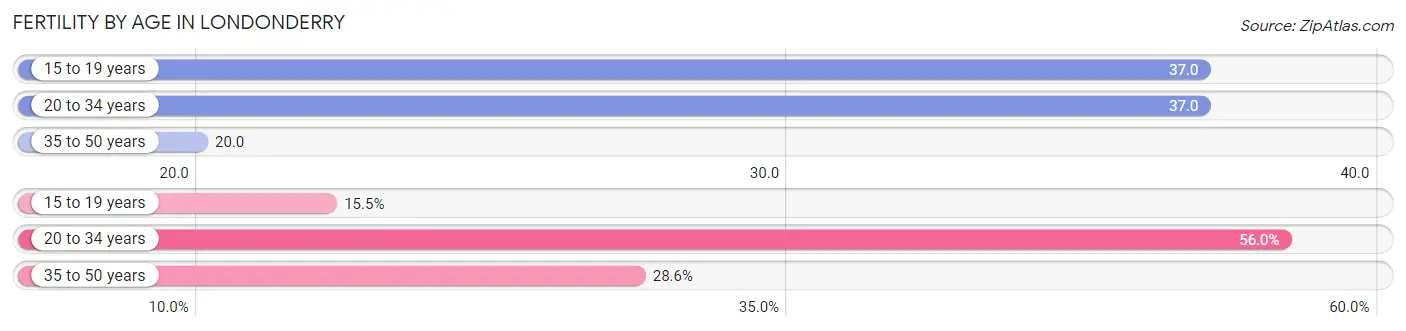
| Age Bracket | Women with Births | Births / 1,000 Women |
| 15 to 19 years | 13 (15.5%) | 37.0 |
| 20 to 34 years | 47 (55.9%) | 37.0 |
| 35 to 50 years | 24 (28.6%) | 20.0 |
| Total | 84 (100.0%) | 30.0 |
Fertility by Age by Marriage Status in Londonderry
70.2% of women with births (84) in Londonderry are married. The highest percentage of unmarried women with births falls into 15 to 19 years age bracket with 100.0% of them unmarried at the time of birth, while the lowest percentage of unmarried women with births belong to 20 to 34 years age bracket with 14.9% of them unmarried.
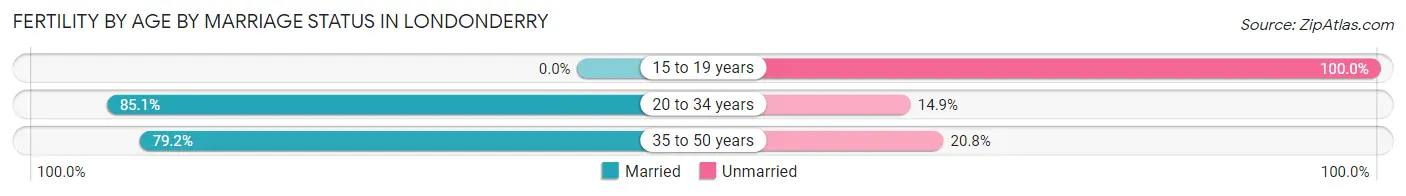
| Age Bracket | Married | Unmarried |
| 15 to 19 years | 0 (0.0%) | 13 (100.0%) |
| 20 to 34 years | 40 (85.1%) | 7 (14.9%) |
| 35 to 50 years | 19 (79.2%) | 5 (20.8%) |
| Total | 59 (70.2%) | 25 (29.8%) |
Fertility by Education in Londonderry
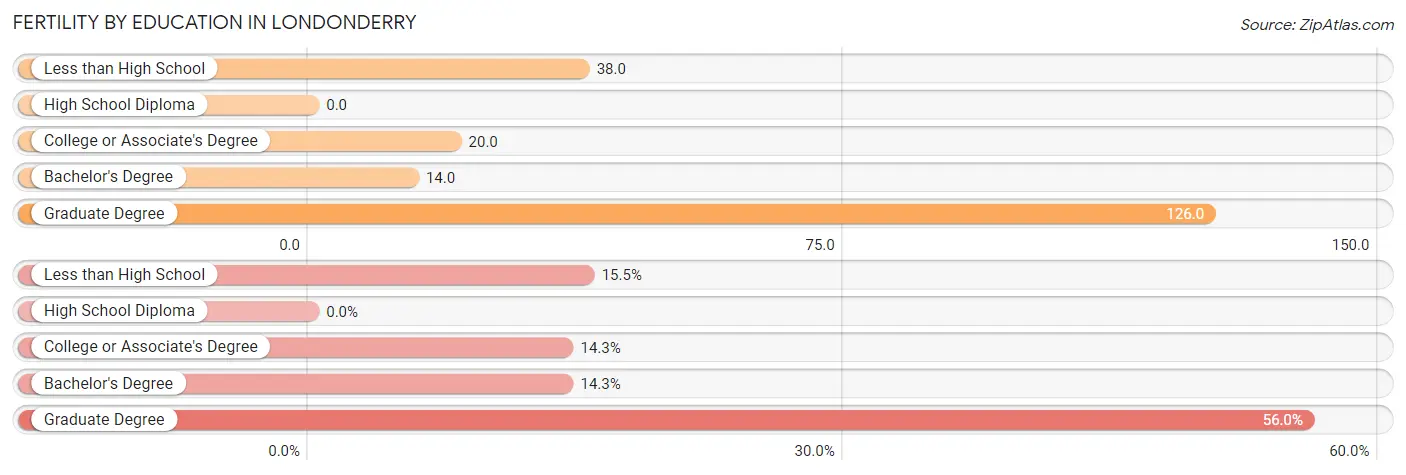
| Educational Attainment | Women with Births | Births / 1,000 Women |
| Less than High School | 13 (15.5%) | 38.0 |
| High School Diploma | 0 (0.0%) | 0.0 |
| College or Associate's Degree | 12 (14.3%) | 20.0 |
| Bachelor's Degree | 12 (14.3%) | 14.0 |
| Graduate Degree | 47 (55.9%) | 126.0 |
| Total | 84 (100.0%) | 30.0 |
Fertility by Education by Marriage Status in Londonderry
29.8% of women with births in Londonderry are unmarried. Women with the educational attainment of bachelor's degree are most likely to be married with 100.0% of them married at childbirth, while women with the educational attainment of less than high school are least likely to be married with 100.0% of them unmarried at childbirth.
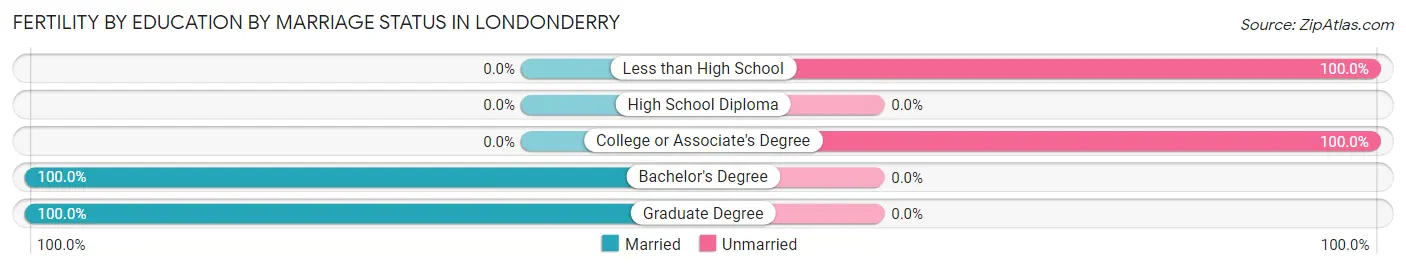
| Educational Attainment | Married | Unmarried |
| Less than High School | 0 (0.0%) | 13 (100.0%) |
| High School Diploma | 0 (0.0%) | 0 (0.0%) |
| College or Associate's Degree | 0 (0.0%) | 12 (100.0%) |
| Bachelor's Degree | 12 (100.0%) | 0 (0.0%) |
| Graduate Degree | 47 (100.0%) | 0 (0.0%) |
| Total | 59 (70.2%) | 25 (29.8%) |
Employment Characteristics in Londonderry
Employment by Class of Employer in Londonderry
Among the 6,494 employed individuals in Londonderry, private company employees (4,708 | 72.5%), not-for-profit organizations (548 | 8.4%), and local government employees (399 | 6.1%) make up the most common classes of employment.
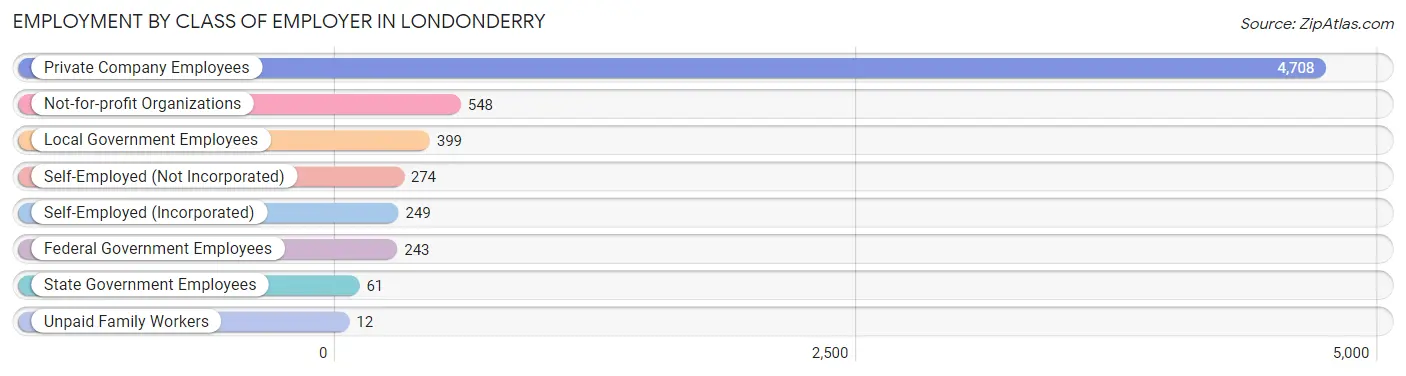
| Employer Class | # Employees | % Employees |
| Private Company Employees | 4,708 | 72.5% |
| Self-Employed (Incorporated) | 249 | 3.8% |
| Self-Employed (Not Incorporated) | 274 | 4.2% |
| Not-for-profit Organizations | 548 | 8.4% |
| Local Government Employees | 399 | 6.1% |
| State Government Employees | 61 | 0.9% |
| Federal Government Employees | 243 | 3.7% |
| Unpaid Family Workers | 12 | 0.2% |
| Total | 6,494 | 100.0% |
Employment Status by Age in Londonderry
According to the labor force statistics for Londonderry, out of the total population over 16 years of age (10,129), 70.6% or 7,151 individuals are in the labor force, with 4.7% or 336 of them unemployed. The age group with the highest labor force participation rate is 45 to 54 years, with 95.6% or 1,653 individuals in the labor force. Within the labor force, the 25 to 29 years age range has the highest percentage of unemployed individuals, with 16.4% or 101 of them being unemployed.
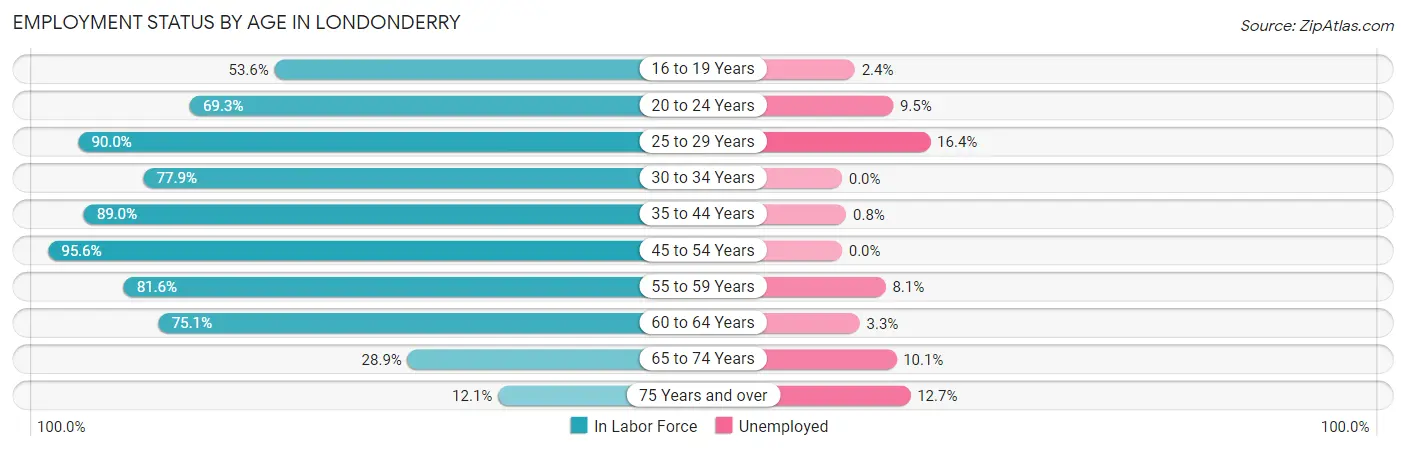
| Age Bracket | In Labor Force | Unemployed |
| 16 to 19 Years | 334 (53.6%) | 8 (2.4%) |
| 20 to 24 Years | 756 (69.3%) | 72 (9.5%) |
| 25 to 29 Years | 614 (90.0%) | 101 (16.4%) |
| 30 to 34 Years | 493 (77.9%) | 0 (0.0%) |
| 35 to 44 Years | 1,298 (89.0%) | 10 (0.8%) |
| 45 to 54 Years | 1,653 (95.6%) | 0 (0.0%) |
| 55 to 59 Years | 1,018 (81.6%) | 82 (8.1%) |
| 60 to 64 Years | 575 (75.1%) | 19 (3.3%) |
| 65 to 74 Years | 306 (28.9%) | 31 (10.1%) |
| 75 Years and over | 102 (12.1%) | 13 (12.7%) |
| Total | 7,151 (70.6%) | 336 (4.7%) |
Employment Status by Educational Attainment in Londonderry
According to labor force statistics for Londonderry, 86.7% of individuals (5,649) out of the total population between 25 and 64 years of age (6,515) are in the labor force, with 3.8% or 215 of them being unemployed. The group with the highest labor force participation rate are those with the educational attainment of less than high school, with 90.2% or 174 individuals in the labor force. Within the labor force, individuals with high school diploma education have the highest percentage of unemployment, with 6.9% or 94 of them being unemployed.
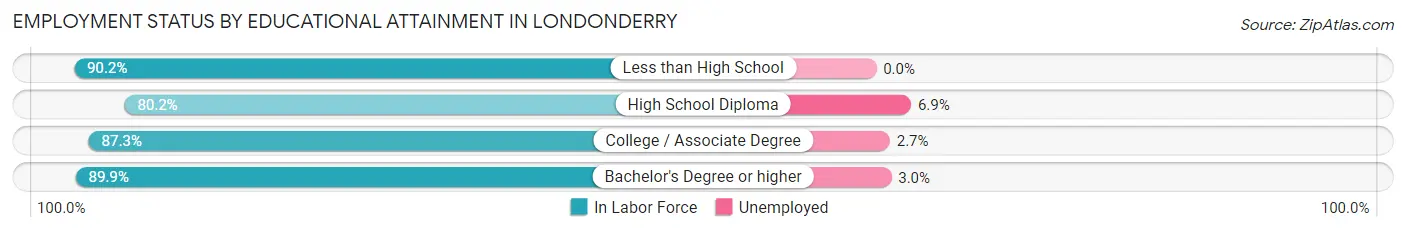
| Educational Attainment | In Labor Force | Unemployed |
| Less than High School | 174 (90.2%) | 0 (0.0%) |
| High School Diploma | 1,361 (80.2%) | 117 (6.9%) |
| College / Associate Degree | 1,410 (87.3%) | 44 (2.7%) |
| Bachelor's Degree or higher | 2,706 (89.9%) | 90 (3.0%) |
| Total | 5,649 (86.7%) | 248 (3.8%) |
Employment Occupations by Sex in Londonderry
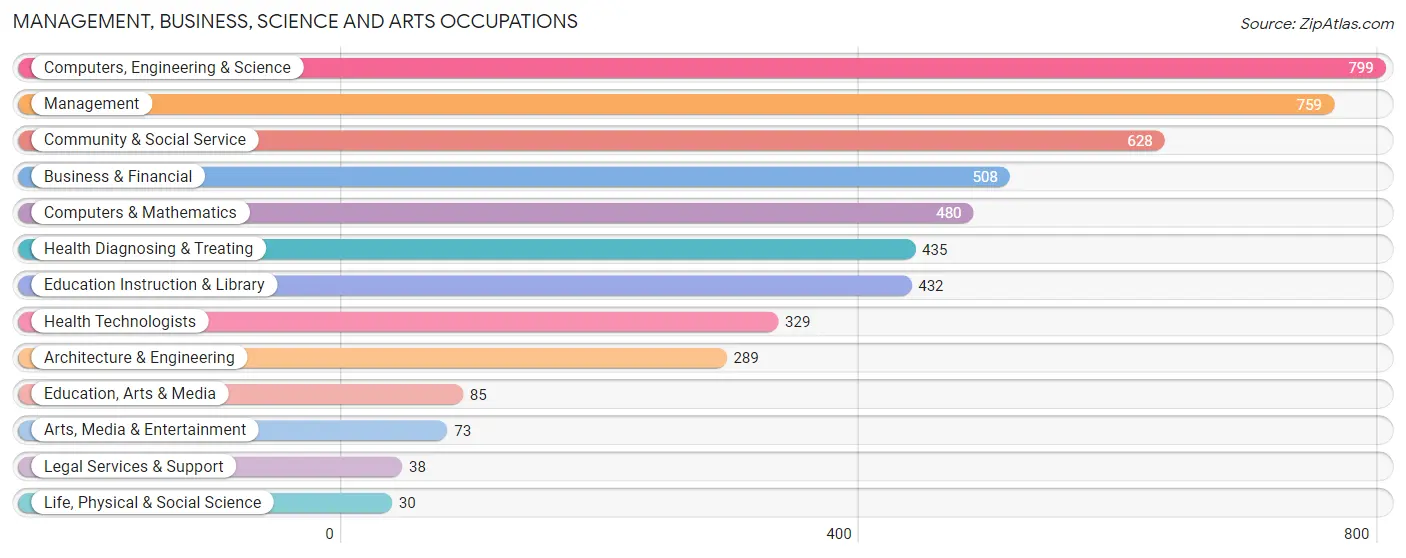
Management, Business, Science and Arts Occupations
The most common Management, Business, Science and Arts occupations in Londonderry are Computers, Engineering & Science (799 | 11.8%), Management (759 | 11.2%), Community & Social Service (628 | 9.2%), Business & Financial (508 | 7.5%), and Computers & Mathematics (480 | 7.1%).
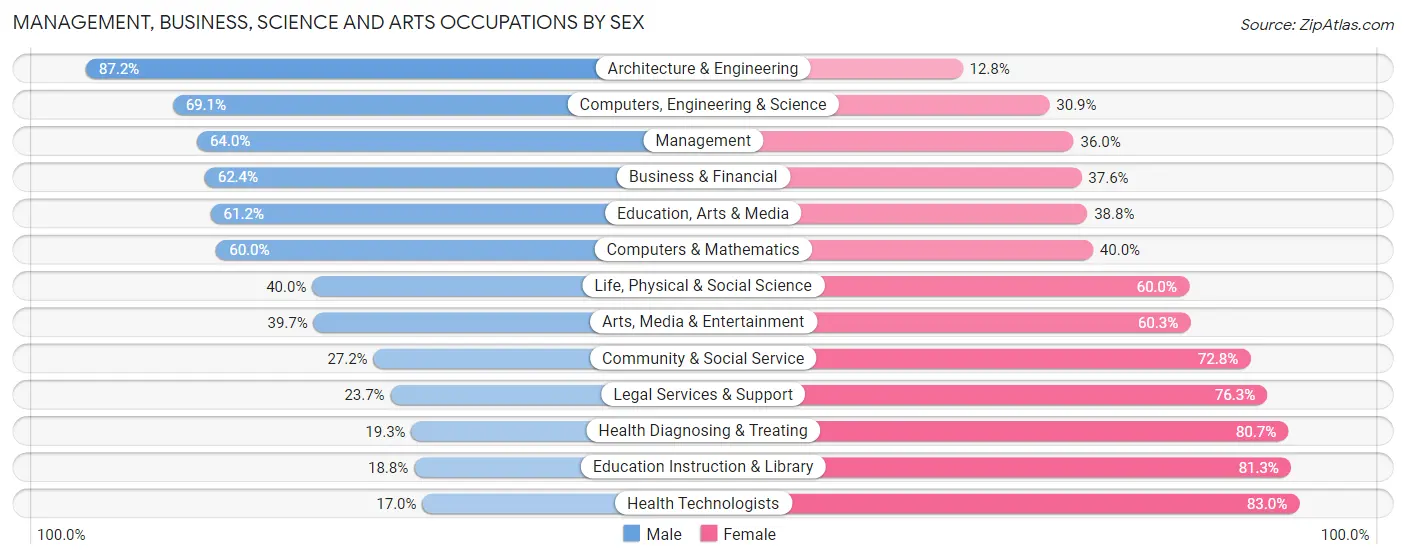
Management, Business, Science and Arts Occupations by Sex
Within the Management, Business, Science and Arts occupations in Londonderry, the most male-oriented occupations are Architecture & Engineering (87.2%), Computers, Engineering & Science (69.1%), and Management (64.0%), while the most female-oriented occupations are Health Technologists (83.0%), Education Instruction & Library (81.2%), and Health Diagnosing & Treating (80.7%).
| Occupation | Male | Female |
| Management | 486 (64.0%) | 273 (36.0%) |
| Business & Financial | 317 (62.4%) | 191 (37.6%) |
| Computers, Engineering & Science | 552 (69.1%) | 247 (30.9%) |
| Computers & Mathematics | 288 (60.0%) | 192 (40.0%) |
| Architecture & Engineering | 252 (87.2%) | 37 (12.8%) |
| Life, Physical & Social Science | 12 (40.0%) | 18 (60.0%) |
| Community & Social Service | 171 (27.2%) | 457 (72.8%) |
| Education, Arts & Media | 52 (61.2%) | 33 (38.8%) |
| Legal Services & Support | 9 (23.7%) | 29 (76.3%) |
| Education Instruction & Library | 81 (18.8%) | 351 (81.2%) |
| Arts, Media & Entertainment | 29 (39.7%) | 44 (60.3%) |
| Health Diagnosing & Treating | 84 (19.3%) | 351 (80.7%) |
| Health Technologists | 56 (17.0%) | 273 (83.0%) |
| Total (Category) | 1,610 (51.4%) | 1,519 (48.5%) |
| Total (Overall) | 3,470 (51.1%) | 3,319 (48.9%) |
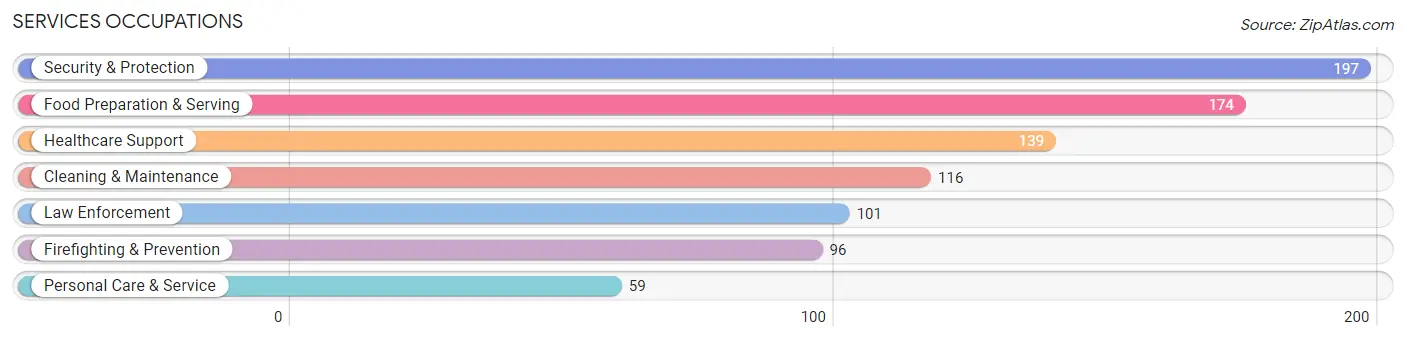
Services Occupations
The most common Services occupations in Londonderry are Security & Protection (197 | 2.9%), Food Preparation & Serving (174 | 2.6%), Healthcare Support (139 | 2.1%), Cleaning & Maintenance (116 | 1.7%), and Law Enforcement (101 | 1.5%).
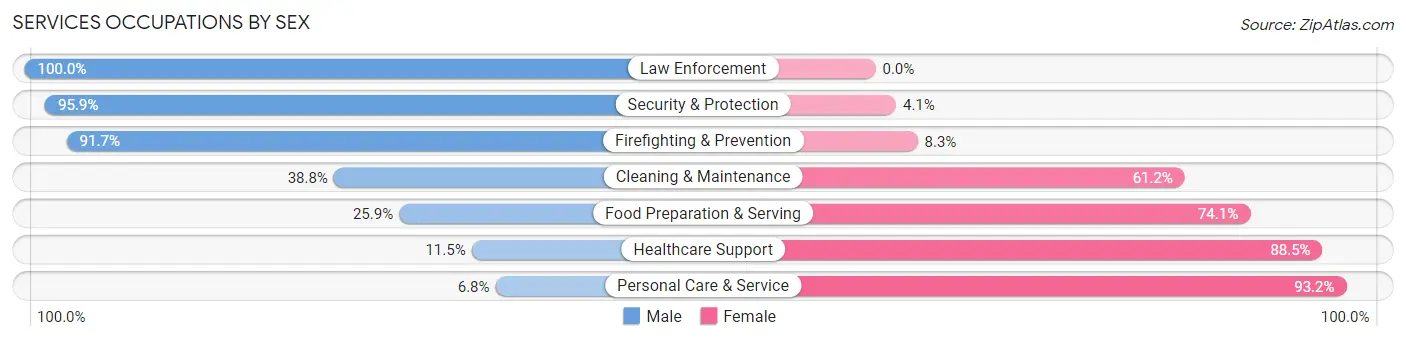
Services Occupations by Sex
Within the Services occupations in Londonderry, the most male-oriented occupations are Law Enforcement (100.0%), Security & Protection (95.9%), and Firefighting & Prevention (91.7%), while the most female-oriented occupations are Personal Care & Service (93.2%), Healthcare Support (88.5%), and Food Preparation & Serving (74.1%).
| Occupation | Male | Female |
| Healthcare Support | 16 (11.5%) | 123 (88.5%) |
| Security & Protection | 189 (95.9%) | 8 (4.1%) |
| Firefighting & Prevention | 88 (91.7%) | 8 (8.3%) |
| Law Enforcement | 101 (100.0%) | 0 (0.0%) |
| Food Preparation & Serving | 45 (25.9%) | 129 (74.1%) |
| Cleaning & Maintenance | 45 (38.8%) | 71 (61.2%) |
| Personal Care & Service | 4 (6.8%) | 55 (93.2%) |
| Total (Category) | 299 (43.6%) | 386 (56.4%) |
| Total (Overall) | 3,470 (51.1%) | 3,319 (48.9%) |
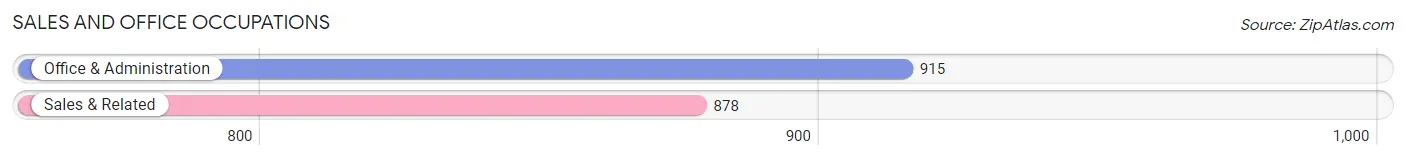
Sales and Office Occupations
The most common Sales and Office occupations in Londonderry are Office & Administration (915 | 13.5%), and Sales & Related (878 | 12.9%).
Sales and Office Occupations by Sex
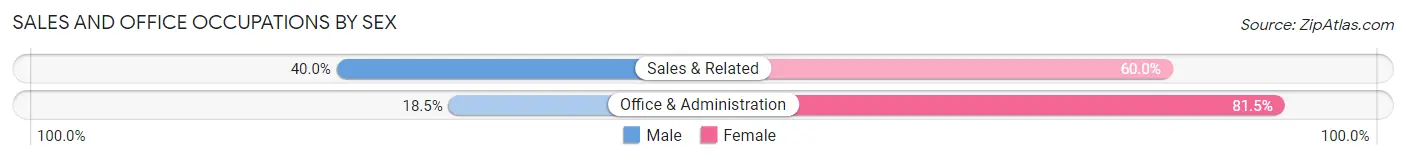
| Occupation | Male | Female |
| Sales & Related | 351 (40.0%) | 527 (60.0%) |
| Office & Administration | 169 (18.5%) | 746 (81.5%) |
| Total (Category) | 520 (29.0%) | 1,273 (71.0%) |
| Total (Overall) | 3,470 (51.1%) | 3,319 (48.9%) |
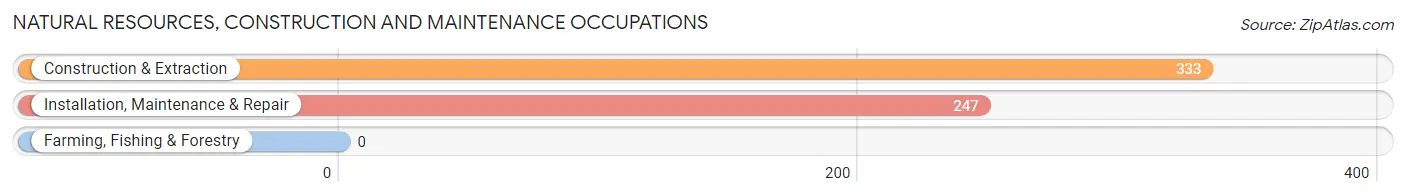
Natural Resources, Construction and Maintenance Occupations
The most common Natural Resources, Construction and Maintenance occupations in Londonderry are Construction & Extraction (333 | 4.9%), and Installation, Maintenance & Repair (247 | 3.6%).
Natural Resources, Construction and Maintenance Occupations by Sex
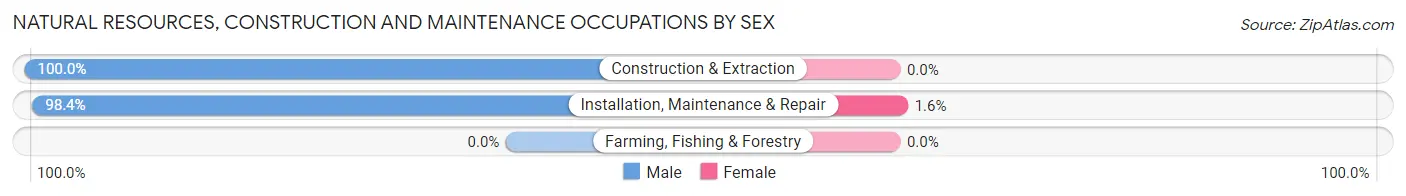
| Occupation | Male | Female |
| Farming, Fishing & Forestry | 0 (0.0%) | 0 (0.0%) |
| Construction & Extraction | 333 (100.0%) | 0 (0.0%) |
| Installation, Maintenance & Repair | 243 (98.4%) | 4 (1.6%) |
| Total (Category) | 576 (99.3%) | 4 (0.7%) |
| Total (Overall) | 3,470 (51.1%) | 3,319 (48.9%) |
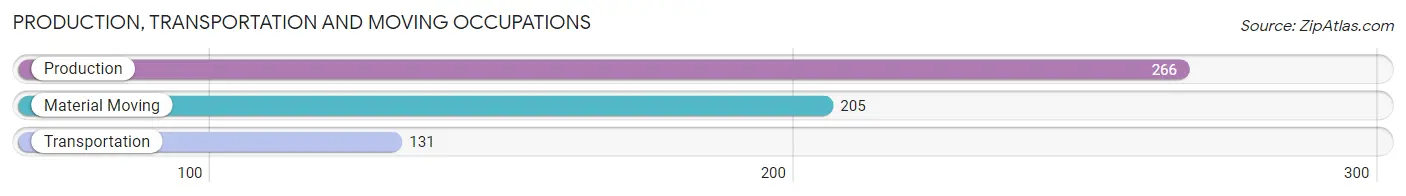
Production, Transportation and Moving Occupations
The most common Production, Transportation and Moving occupations in Londonderry are Production (266 | 3.9%), Material Moving (205 | 3.0%), and Transportation (131 | 1.9%).
Production, Transportation and Moving Occupations by Sex
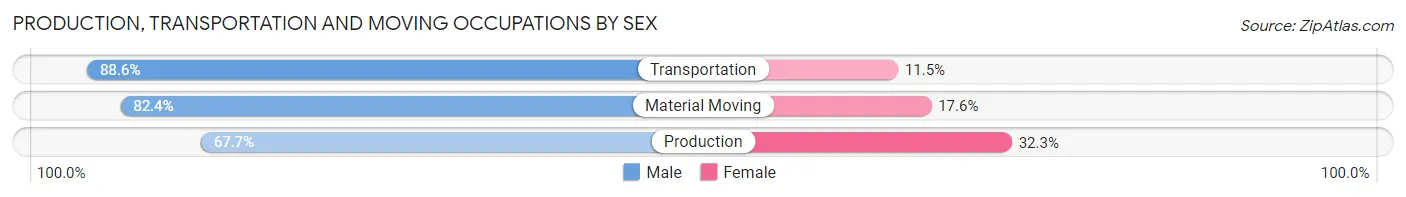
| Occupation | Male | Female |
| Production | 180 (67.7%) | 86 (32.3%) |
| Transportation | 116 (88.5%) | 15 (11.5%) |
| Material Moving | 169 (82.4%) | 36 (17.6%) |
| Total (Category) | 465 (77.2%) | 137 (22.8%) |
| Total (Overall) | 3,470 (51.1%) | 3,319 (48.9%) |
Employment Industries by Sex in Londonderry
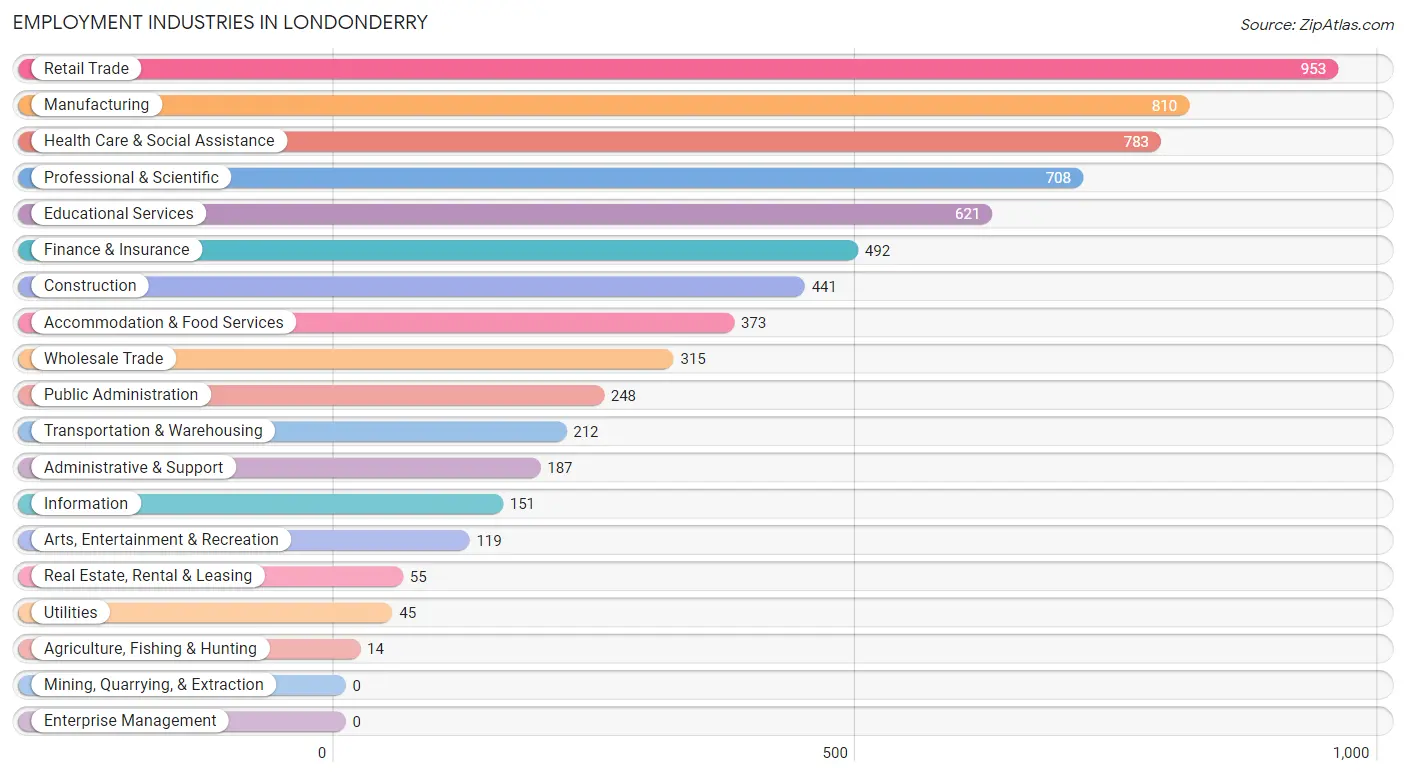
Employment Industries in Londonderry
The major employment industries in Londonderry include Retail Trade (953 | 14.0%), Manufacturing (810 | 11.9%), Health Care & Social Assistance (783 | 11.5%), Professional & Scientific (708 | 10.4%), and Educational Services (621 | 9.1%).
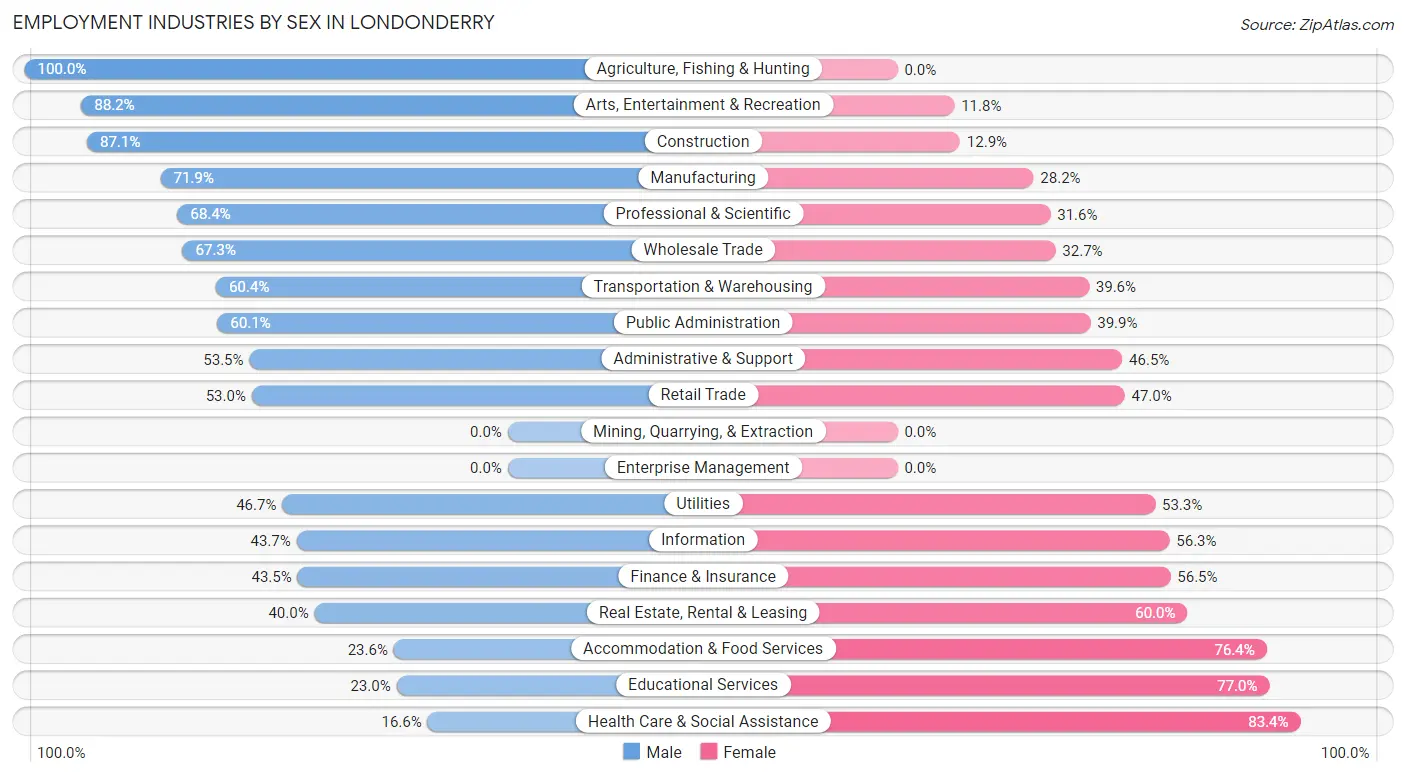
Employment Industries by Sex in Londonderry
The Londonderry industries that see more men than women are Agriculture, Fishing & Hunting (100.0%), Arts, Entertainment & Recreation (88.2%), and Construction (87.1%), whereas the industries that tend to have a higher number of women are Health Care & Social Assistance (83.4%), Educational Services (77.0%), and Accommodation & Food Services (76.4%).
| Industry | Male | Female |
| Agriculture, Fishing & Hunting | 14 (100.0%) | 0 (0.0%) |
| Mining, Quarrying, & Extraction | 0 (0.0%) | 0 (0.0%) |
| Construction | 384 (87.1%) | 57 (12.9%) |
| Manufacturing | 582 (71.9%) | 228 (28.1%) |
| Wholesale Trade | 212 (67.3%) | 103 (32.7%) |
| Retail Trade | 505 (53.0%) | 448 (47.0%) |
| Transportation & Warehousing | 128 (60.4%) | 84 (39.6%) |
| Utilities | 21 (46.7%) | 24 (53.3%) |
| Information | 66 (43.7%) | 85 (56.3%) |
| Finance & Insurance | 214 (43.5%) | 278 (56.5%) |
| Real Estate, Rental & Leasing | 22 (40.0%) | 33 (60.0%) |
| Professional & Scientific | 484 (68.4%) | 224 (31.6%) |
| Enterprise Management | 0 (0.0%) | 0 (0.0%) |
| Administrative & Support | 100 (53.5%) | 87 (46.5%) |
| Educational Services | 143 (23.0%) | 478 (77.0%) |
| Health Care & Social Assistance | 130 (16.6%) | 653 (83.4%) |
| Arts, Entertainment & Recreation | 105 (88.2%) | 14 (11.8%) |
| Accommodation & Food Services | 88 (23.6%) | 285 (76.4%) |
| Public Administration | 149 (60.1%) | 99 (39.9%) |
| Total | 3,470 (51.1%) | 3,319 (48.9%) |
Education in Londonderry
School Enrollment in Londonderry
The most common levels of schooling among the 2,661 students in Londonderry are high school (705 | 26.5%), college / undergraduate (628 | 23.6%), and middle school (494 | 18.6%).
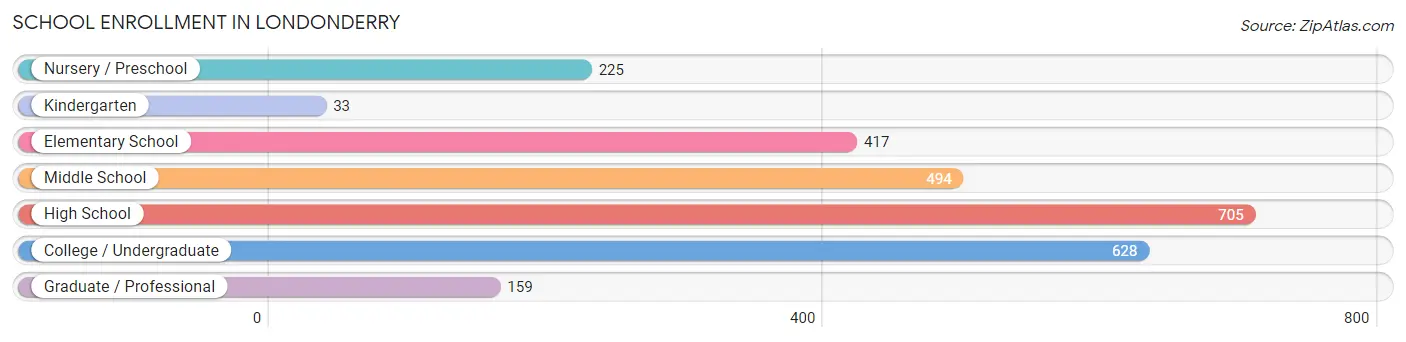
| School Level | # Students | % Students |
| Nursery / Preschool | 225 | 8.5% |
| Kindergarten | 33 | 1.2% |
| Elementary School | 417 | 15.7% |
| Middle School | 494 | 18.6% |
| High School | 705 | 26.5% |
| College / Undergraduate | 628 | 23.6% |
| Graduate / Professional | 159 | 6.0% |
| Total | 2,661 | 100.0% |
School Enrollment by Age by Funding Source in Londonderry
Out of a total of 2,661 students who are enrolled in schools in Londonderry, 476 (17.9%) attend a private institution, while the remaining 2,185 (82.1%) are enrolled in public schools. The age group of 3 to 4 year olds has the highest likelihood of being enrolled in private schools, with 93 (56.4% in the age bracket) enrolled. Conversely, the age group of 10 to 14 year olds has the lowest likelihood of being enrolled in a private school, with 712 (98.3% in the age bracket) attending a public institution.
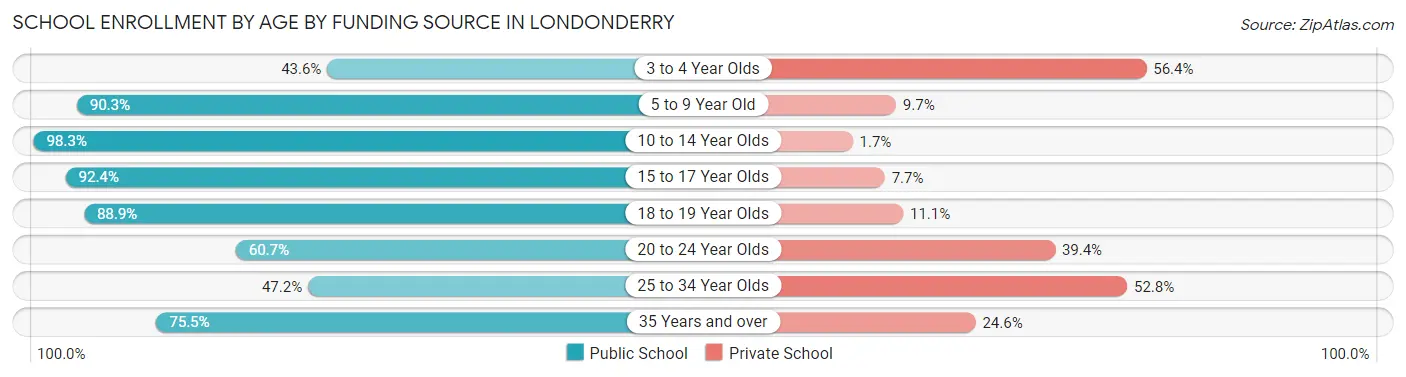
| Age Bracket | Public School | Private School |
| 3 to 4 Year Olds | 72 (43.6%) | 93 (56.4%) |
| 5 to 9 Year Old | 427 (90.3%) | 46 (9.7%) |
| 10 to 14 Year Olds | 712 (98.3%) | 12 (1.7%) |
| 15 to 17 Year Olds | 362 (92.3%) | 30 (7.6%) |
| 18 to 19 Year Olds | 177 (88.9%) | 22 (11.1%) |
| 20 to 24 Year Olds | 319 (60.7%) | 207 (39.4%) |
| 25 to 34 Year Olds | 34 (47.2%) | 38 (52.8%) |
| 35 Years and over | 83 (75.4%) | 27 (24.5%) |
| Total | 2,185 (82.1%) | 476 (17.9%) |
Educational Attainment by Field of Study in Londonderry
Business (918 | 22.6%), education (556 | 13.7%), science & technology (432 | 10.6%), engineering (395 | 9.7%), and arts & humanities (269 | 6.6%) are the most common fields of study among 4,062 individuals in Londonderry who have obtained a bachelor's degree or higher.
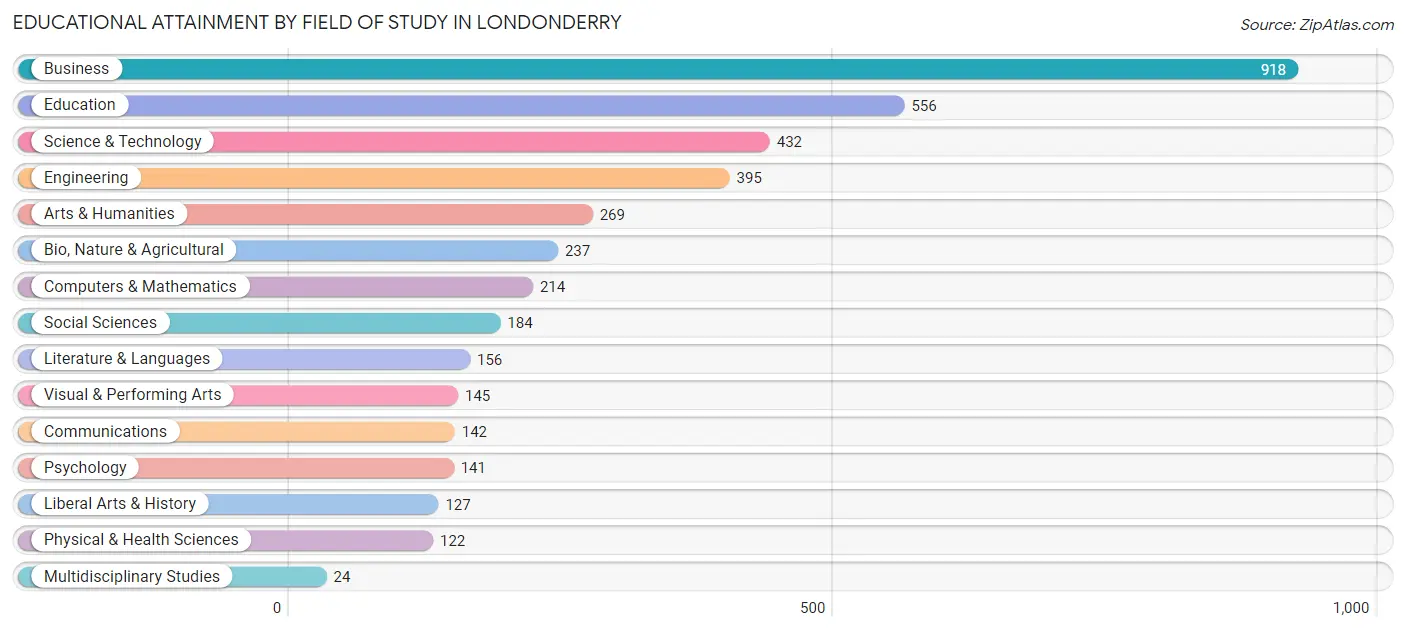
| Field of Study | # Graduates | % Graduates |
| Computers & Mathematics | 214 | 5.3% |
| Bio, Nature & Agricultural | 237 | 5.8% |
| Physical & Health Sciences | 122 | 3.0% |
| Psychology | 141 | 3.5% |
| Social Sciences | 184 | 4.5% |
| Engineering | 395 | 9.7% |
| Multidisciplinary Studies | 24 | 0.6% |
| Science & Technology | 432 | 10.6% |
| Business | 918 | 22.6% |
| Education | 556 | 13.7% |
| Literature & Languages | 156 | 3.8% |
| Liberal Arts & History | 127 | 3.1% |
| Visual & Performing Arts | 145 | 3.6% |
| Communications | 142 | 3.5% |
| Arts & Humanities | 269 | 6.6% |
| Total | 4,062 | 100.0% |
Transportation & Commute in Londonderry
Vehicle Availability by Sex in Londonderry
The most prevalent vehicle ownership categories in Londonderry are males with 2 vehicles (1,471, accounting for 43.3%) and females with 2 vehicles (1,246, making up 47.5%).
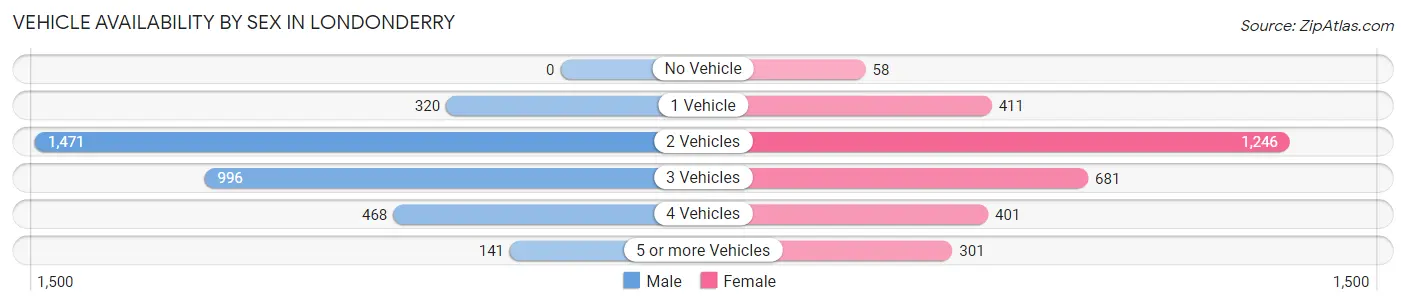
| Vehicles Available | Male | Female |
| No Vehicle | 0 (0.0%) | 58 (1.9%) |
| 1 Vehicle | 320 (9.4%) | 411 (13.3%) |
| 2 Vehicles | 1,471 (43.3%) | 1,246 (40.2%) |
| 3 Vehicles | 996 (29.3%) | 681 (22.0%) |
| 4 Vehicles | 468 (13.8%) | 401 (12.9%) |
| 5 or more Vehicles | 141 (4.2%) | 301 (9.7%) |
| Total | 3,396 (100.0%) | 3,098 (100.0%) |
Commute Time in Londonderry
The most frequently occuring commute durations in Londonderry are 30 to 34 minutes (883 commuters, 16.1%), 20 to 24 minutes (860 commuters, 15.7%), and 10 to 14 minutes (599 commuters, 10.9%).
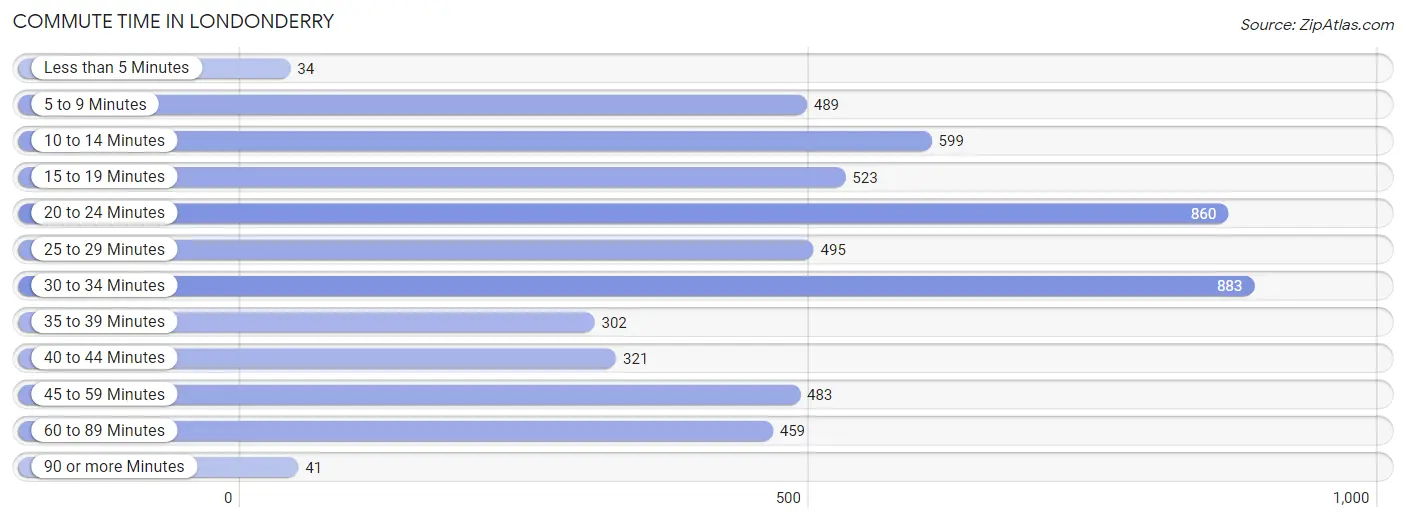
| Commute Time | # Commuters | % Commuters |
| Less than 5 Minutes | 34 | 0.6% |
| 5 to 9 Minutes | 489 | 8.9% |
| 10 to 14 Minutes | 599 | 10.9% |
| 15 to 19 Minutes | 523 | 9.5% |
| 20 to 24 Minutes | 860 | 15.7% |
| 25 to 29 Minutes | 495 | 9.0% |
| 30 to 34 Minutes | 883 | 16.1% |
| 35 to 39 Minutes | 302 | 5.5% |
| 40 to 44 Minutes | 321 | 5.9% |
| 45 to 59 Minutes | 483 | 8.8% |
| 60 to 89 Minutes | 459 | 8.4% |
| 90 or more Minutes | 41 | 0.7% |
Commute Time by Sex in Londonderry
The most common commute times in Londonderry are 30 to 34 minutes (414 commuters, 14.7%) for males and 30 to 34 minutes (469 commuters, 17.6%) for females.
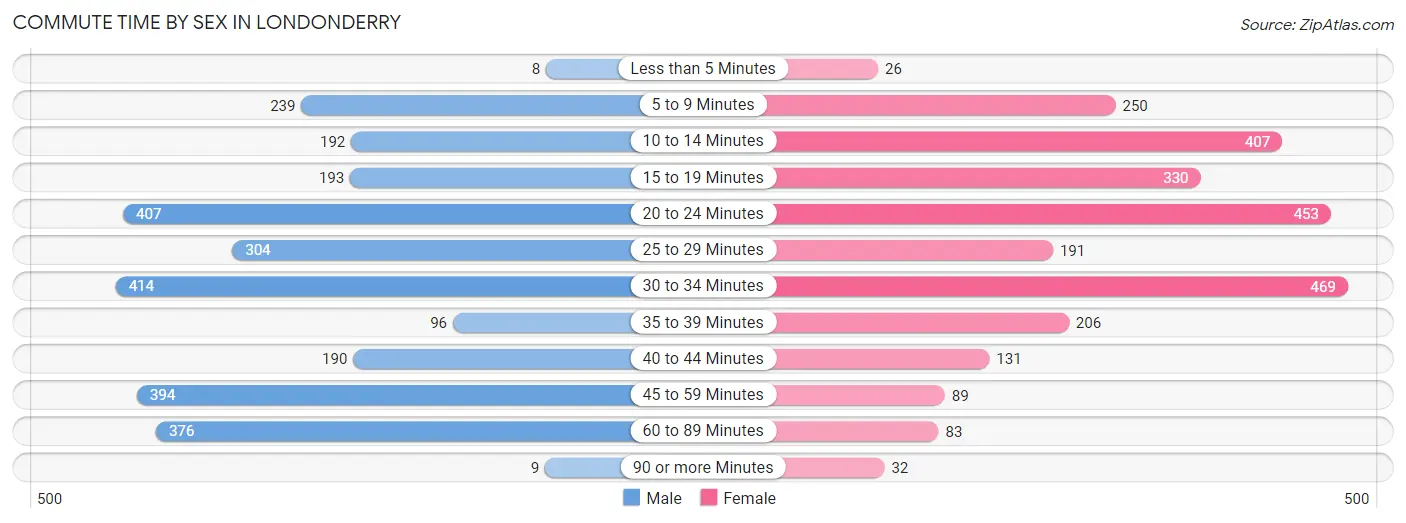
| Commute Time | Male | Female |
| Less than 5 Minutes | 8 (0.3%) | 26 (1.0%) |
| 5 to 9 Minutes | 239 (8.5%) | 250 (9.4%) |
| 10 to 14 Minutes | 192 (6.8%) | 407 (15.3%) |
| 15 to 19 Minutes | 193 (6.8%) | 330 (12.4%) |
| 20 to 24 Minutes | 407 (14.4%) | 453 (17.0%) |
| 25 to 29 Minutes | 304 (10.8%) | 191 (7.2%) |
| 30 to 34 Minutes | 414 (14.7%) | 469 (17.6%) |
| 35 to 39 Minutes | 96 (3.4%) | 206 (7.7%) |
| 40 to 44 Minutes | 190 (6.7%) | 131 (4.9%) |
| 45 to 59 Minutes | 394 (14.0%) | 89 (3.3%) |
| 60 to 89 Minutes | 376 (13.3%) | 83 (3.1%) |
| 90 or more Minutes | 9 (0.3%) | 32 (1.2%) |
Time of Departure to Work by Sex in Londonderry
The most frequent times of departure to work in Londonderry are 7:00 AM to 7:29 AM (471, 16.7%) for males and 7:30 AM to 7:59 AM (405, 15.2%) for females.
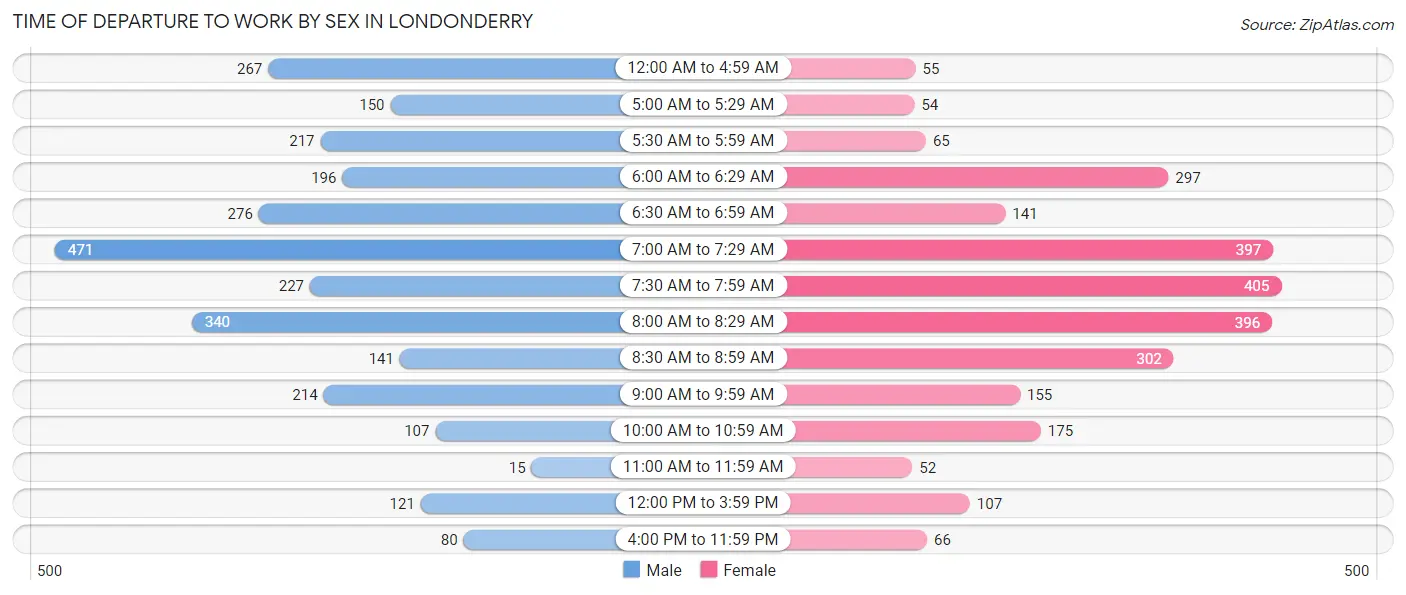
| Time of Departure | Male | Female |
| 12:00 AM to 4:59 AM | 267 (9.5%) | 55 (2.1%) |
| 5:00 AM to 5:29 AM | 150 (5.3%) | 54 (2.0%) |
| 5:30 AM to 5:59 AM | 217 (7.7%) | 65 (2.4%) |
| 6:00 AM to 6:29 AM | 196 (7.0%) | 297 (11.1%) |
| 6:30 AM to 6:59 AM | 276 (9.8%) | 141 (5.3%) |
| 7:00 AM to 7:29 AM | 471 (16.7%) | 397 (14.9%) |
| 7:30 AM to 7:59 AM | 227 (8.0%) | 405 (15.2%) |
| 8:00 AM to 8:29 AM | 340 (12.0%) | 396 (14.8%) |
| 8:30 AM to 8:59 AM | 141 (5.0%) | 302 (11.3%) |
| 9:00 AM to 9:59 AM | 214 (7.6%) | 155 (5.8%) |
| 10:00 AM to 10:59 AM | 107 (3.8%) | 175 (6.6%) |
| 11:00 AM to 11:59 AM | 15 (0.5%) | 52 (1.9%) |
| 12:00 PM to 3:59 PM | 121 (4.3%) | 107 (4.0%) |
| 4:00 PM to 11:59 PM | 80 (2.8%) | 66 (2.5%) |
| Total | 2,822 (100.0%) | 2,667 (100.0%) |
Housing Occupancy in Londonderry
Occupancy by Ownership in Londonderry
Of the total 4,539 dwellings in Londonderry, owner-occupied units account for 3,734 (82.3%), while renter-occupied units make up 805 (17.7%).
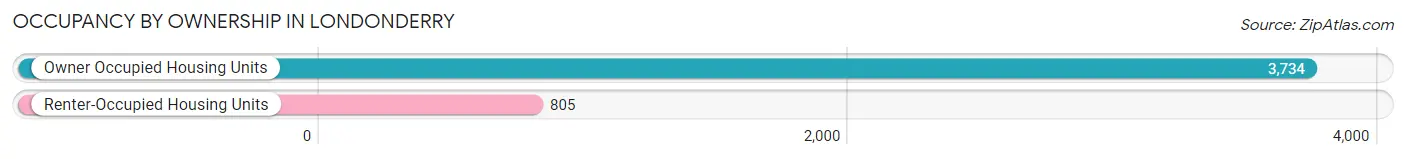
| Occupancy | # Housing Units | % Housing Units |
| Owner Occupied Housing Units | 3,734 | 82.3% |
| Renter-Occupied Housing Units | 805 | 17.7% |
| Total Occupied Housing Units | 4,539 | 100.0% |
Occupancy by Household Size in Londonderry
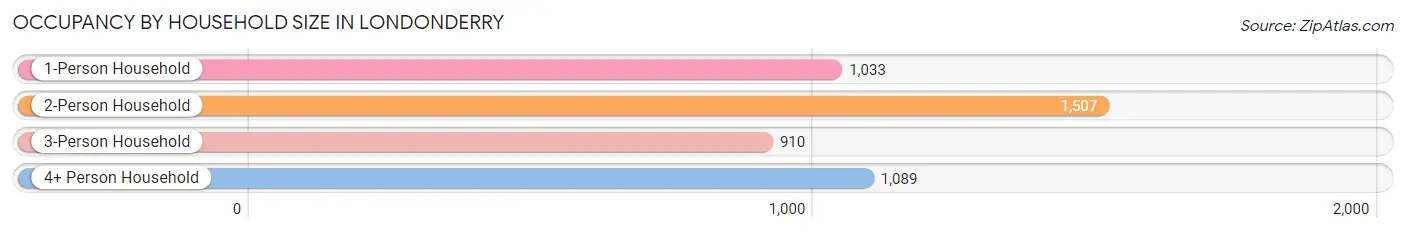
| Household Size | # Housing Units | % Housing Units |
| 1-Person Household | 1,033 | 22.8% |
| 2-Person Household | 1,507 | 33.2% |
| 3-Person Household | 910 | 20.1% |
| 4+ Person Household | 1,089 | 24.0% |
| Total Housing Units | 4,539 | 100.0% |
Occupancy by Ownership by Household Size in Londonderry
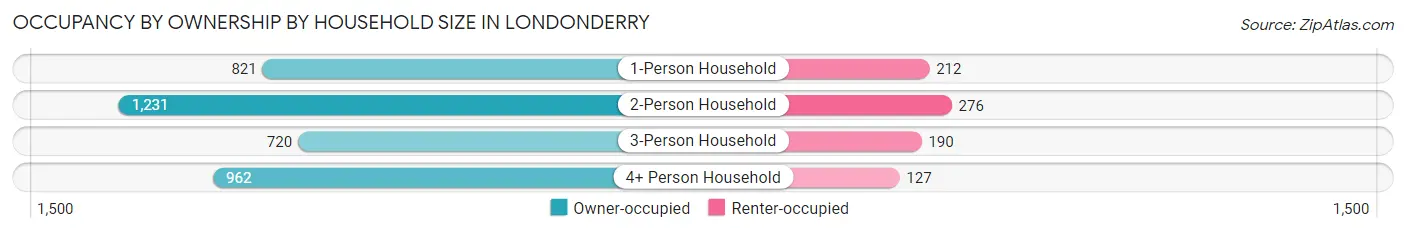
| Household Size | Owner-occupied | Renter-occupied |
| 1-Person Household | 821 (79.5%) | 212 (20.5%) |
| 2-Person Household | 1,231 (81.7%) | 276 (18.3%) |
| 3-Person Household | 720 (79.1%) | 190 (20.9%) |
| 4+ Person Household | 962 (88.3%) | 127 (11.7%) |
| Total Housing Units | 3,734 (82.3%) | 805 (17.7%) |
Occupancy by Educational Attainment in Londonderry
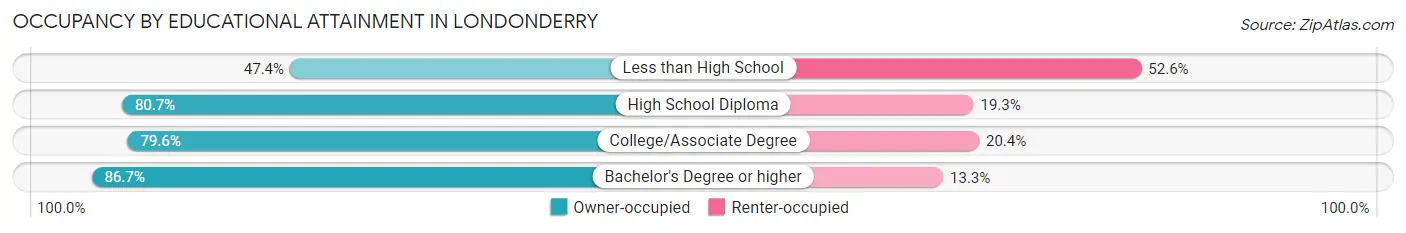
| Household Size | Owner-occupied | Renter-occupied |
| Less than High School | 64 (47.4%) | 71 (52.6%) |
| High School Diploma | 961 (80.7%) | 230 (19.3%) |
| College/Associate Degree | 866 (79.6%) | 222 (20.4%) |
| Bachelor's Degree or higher | 1,843 (86.7%) | 282 (13.3%) |
Occupancy by Age of Householder in Londonderry
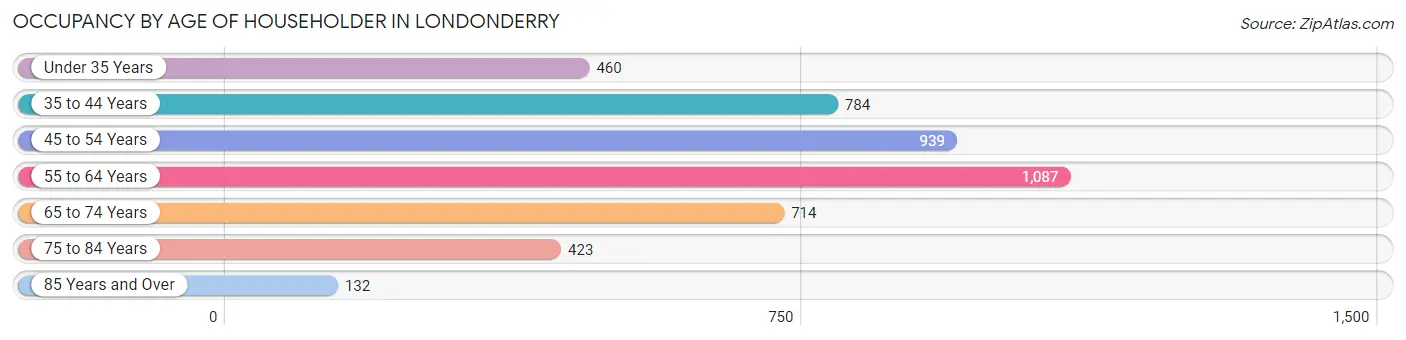
| Age Bracket | # Households | % Households |
| Under 35 Years | 460 | 10.1% |
| 35 to 44 Years | 784 | 17.3% |
| 45 to 54 Years | 939 | 20.7% |
| 55 to 64 Years | 1,087 | 23.9% |
| 65 to 74 Years | 714 | 15.7% |
| 75 to 84 Years | 423 | 9.3% |
| 85 Years and Over | 132 | 2.9% |
| Total | 4,539 | 100.0% |
Housing Finances in Londonderry
Median Income by Occupancy in Londonderry
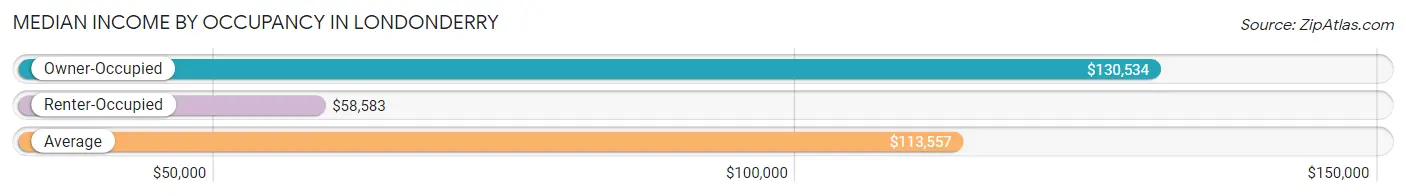
| Occupancy Type | # Households | Median Income |
| Owner-Occupied | 3,734 (82.3%) | $130,534 |
| Renter-Occupied | 805 (17.7%) | $58,583 |
| Average | 4,539 (100.0%) | $113,557 |
Occupancy by Householder Income Bracket in Londonderry
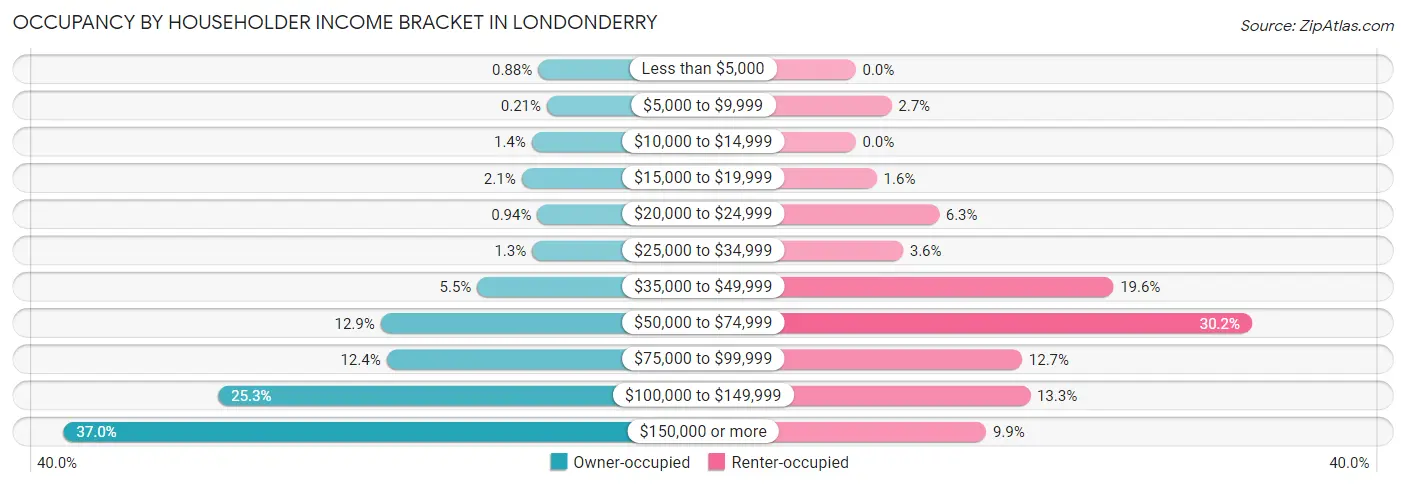
| Income Bracket | Owner-occupied | Renter-occupied |
| Less than $5,000 | 33 (0.9%) | 0 (0.0%) |
| $5,000 to $9,999 | 8 (0.2%) | 22 (2.7%) |
| $10,000 to $14,999 | 51 (1.4%) | 0 (0.0%) |
| $15,000 to $19,999 | 80 (2.1%) | 13 (1.6%) |
| $20,000 to $24,999 | 35 (0.9%) | 51 (6.3%) |
| $25,000 to $34,999 | 50 (1.3%) | 29 (3.6%) |
| $35,000 to $49,999 | 206 (5.5%) | 158 (19.6%) |
| $50,000 to $74,999 | 481 (12.9%) | 243 (30.2%) |
| $75,000 to $99,999 | 464 (12.4%) | 102 (12.7%) |
| $100,000 to $149,999 | 943 (25.3%) | 107 (13.3%) |
| $150,000 or more | 1,383 (37.0%) | 80 (9.9%) |
| Total | 3,734 (100.0%) | 805 (100.0%) |
Monthly Housing Cost Tiers in Londonderry
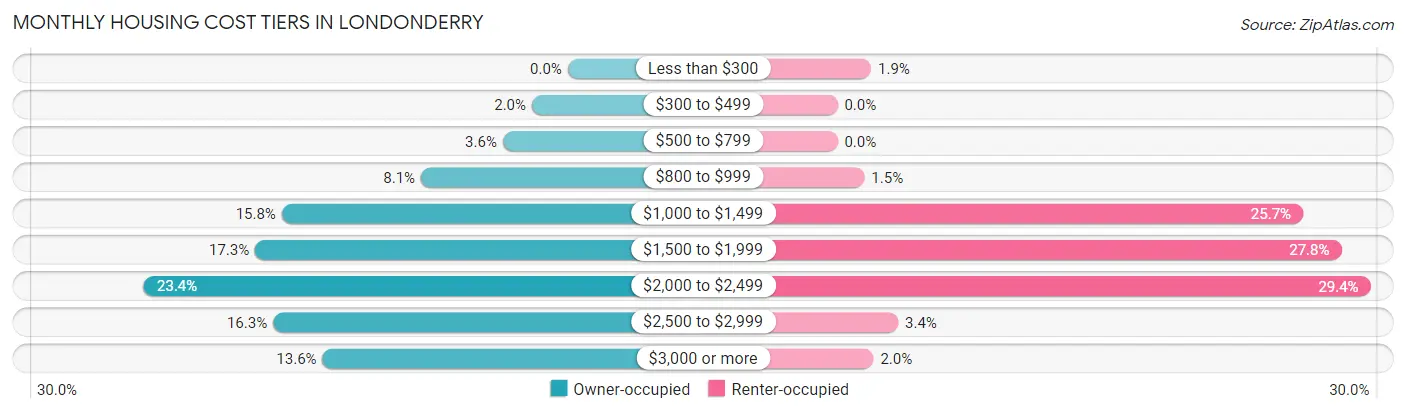
| Monthly Cost | Owner-occupied | Renter-occupied |
| Less than $300 | 0 (0.0%) | 15 (1.9%) |
| $300 to $499 | 74 (2.0%) | 0 (0.0%) |
| $500 to $799 | 134 (3.6%) | 0 (0.0%) |
| $800 to $999 | 303 (8.1%) | 12 (1.5%) |
| $1,000 to $1,499 | 590 (15.8%) | 207 (25.7%) |
| $1,500 to $1,999 | 645 (17.3%) | 224 (27.8%) |
| $2,000 to $2,499 | 874 (23.4%) | 237 (29.4%) |
| $2,500 to $2,999 | 608 (16.3%) | 27 (3.4%) |
| $3,000 or more | 506 (13.6%) | 16 (2.0%) |
| Total | 3,734 (100.0%) | 805 (100.0%) |
Physical Housing Characteristics in Londonderry
Housing Structures in Londonderry
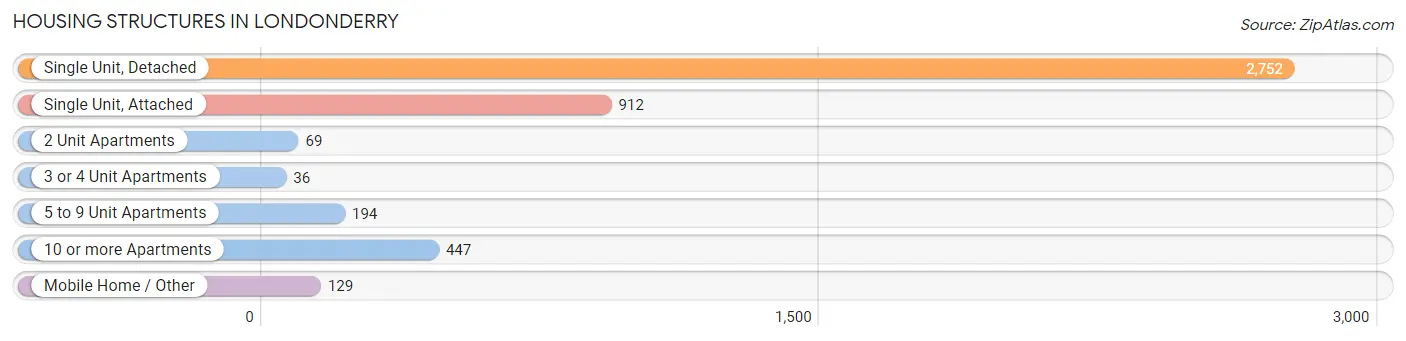
| Structure Type | # Housing Units | % Housing Units |
| Single Unit, Detached | 2,752 | 60.6% |
| Single Unit, Attached | 912 | 20.1% |
| 2 Unit Apartments | 69 | 1.5% |
| 3 or 4 Unit Apartments | 36 | 0.8% |
| 5 to 9 Unit Apartments | 194 | 4.3% |
| 10 or more Apartments | 447 | 9.9% |
| Mobile Home / Other | 129 | 2.8% |
| Total | 4,539 | 100.0% |
Housing Structures by Occupancy in Londonderry
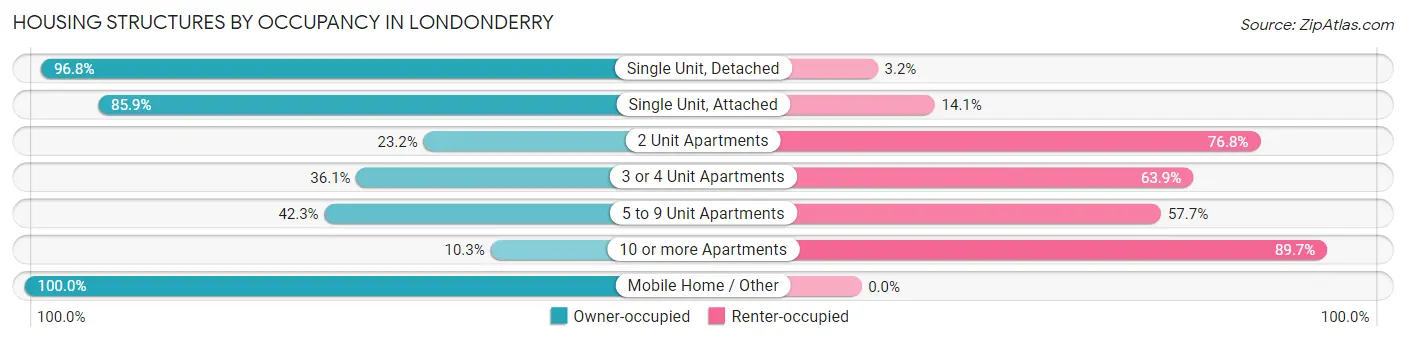
| Structure Type | Owner-occupied | Renter-occupied |
| Single Unit, Detached | 2,665 (96.8%) | 87 (3.2%) |
| Single Unit, Attached | 783 (85.9%) | 129 (14.1%) |
| 2 Unit Apartments | 16 (23.2%) | 53 (76.8%) |
| 3 or 4 Unit Apartments | 13 (36.1%) | 23 (63.9%) |
| 5 to 9 Unit Apartments | 82 (42.3%) | 112 (57.7%) |
| 10 or more Apartments | 46 (10.3%) | 401 (89.7%) |
| Mobile Home / Other | 129 (100.0%) | 0 (0.0%) |
| Total | 3,734 (82.3%) | 805 (17.7%) |
Housing Structures by Number of Rooms in Londonderry
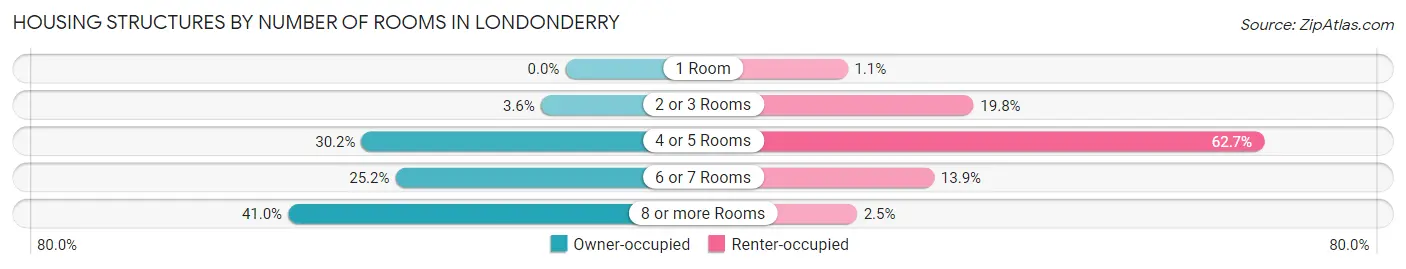
| Number of Rooms | Owner-occupied | Renter-occupied |
| 1 Room | 0 (0.0%) | 9 (1.1%) |
| 2 or 3 Rooms | 136 (3.6%) | 159 (19.8%) |
| 4 or 5 Rooms | 1,127 (30.2%) | 505 (62.7%) |
| 6 or 7 Rooms | 939 (25.2%) | 112 (13.9%) |
| 8 or more Rooms | 1,532 (41.0%) | 20 (2.5%) |
| Total | 3,734 (100.0%) | 805 (100.0%) |
Housing Structure by Heating Type in Londonderry
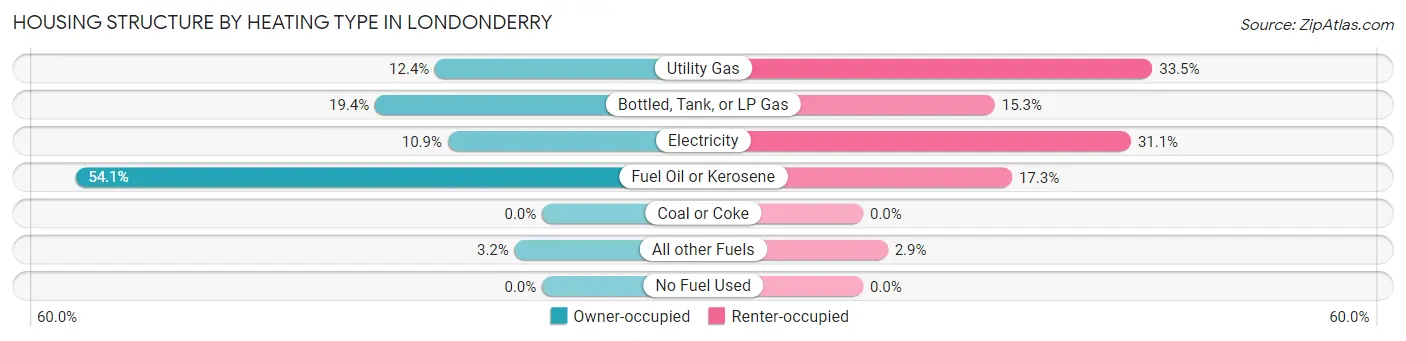
| Heating Type | Owner-occupied | Renter-occupied |
| Utility Gas | 463 (12.4%) | 270 (33.5%) |
| Bottled, Tank, or LP Gas | 723 (19.4%) | 123 (15.3%) |
| Electricity | 408 (10.9%) | 250 (31.1%) |
| Fuel Oil or Kerosene | 2,021 (54.1%) | 139 (17.3%) |
| Coal or Coke | 0 (0.0%) | 0 (0.0%) |
| All other Fuels | 119 (3.2%) | 23 (2.9%) |
| No Fuel Used | 0 (0.0%) | 0 (0.0%) |
| Total | 3,734 (100.0%) | 805 (100.0%) |
Household Vehicle Usage in Londonderry
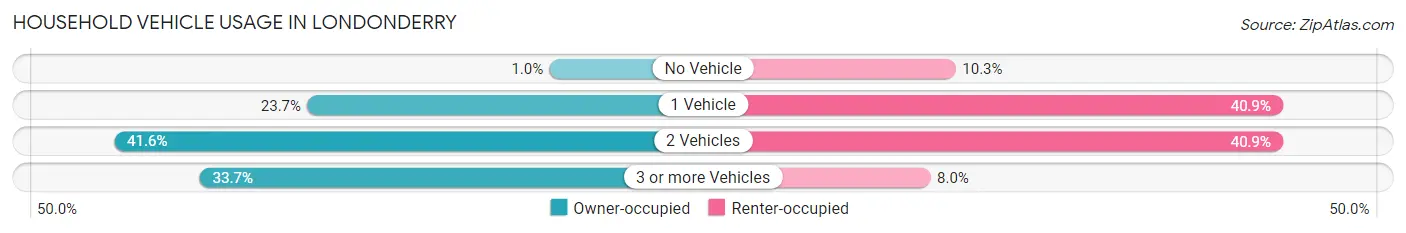
| Vehicles per Household | Owner-occupied | Renter-occupied |
| No Vehicle | 39 (1.0%) | 83 (10.3%) |
| 1 Vehicle | 883 (23.6%) | 329 (40.9%) |
| 2 Vehicles | 1,555 (41.6%) | 329 (40.9%) |
| 3 or more Vehicles | 1,257 (33.7%) | 64 (8.0%) |
| Total | 3,734 (100.0%) | 805 (100.0%) |
Real Estate & Mortgages in Londonderry
Real Estate and Mortgage Overview in Londonderry
| Characteristic | Without Mortgage | With Mortgage |
| Housing Units | 1,146 | 2,588 |
| Median Property Value | $356,100 | $411,400 |
| Median Household Income | $83,188 | $1,133 |
| Monthly Housing Costs | $1,057 | $506 |
| Real Estate Taxes | $6,705 | $35 |
Property Value by Mortgage Status in Londonderry
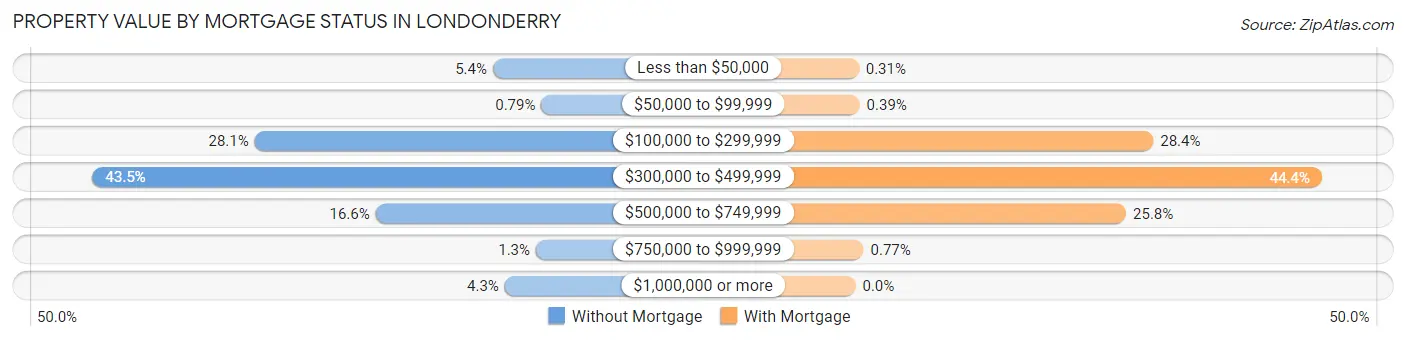
| Property Value | Without Mortgage | With Mortgage |
| Less than $50,000 | 62 (5.4%) | 8 (0.3%) |
| $50,000 to $99,999 | 9 (0.8%) | 10 (0.4%) |
| $100,000 to $299,999 | 322 (28.1%) | 734 (28.4%) |
| $300,000 to $499,999 | 499 (43.5%) | 1,149 (44.4%) |
| $500,000 to $749,999 | 190 (16.6%) | 667 (25.8%) |
| $750,000 to $999,999 | 15 (1.3%) | 20 (0.8%) |
| $1,000,000 or more | 49 (4.3%) | 0 (0.0%) |
| Total | 1,146 (100.0%) | 2,588 (100.0%) |
Household Income by Mortgage Status in Londonderry
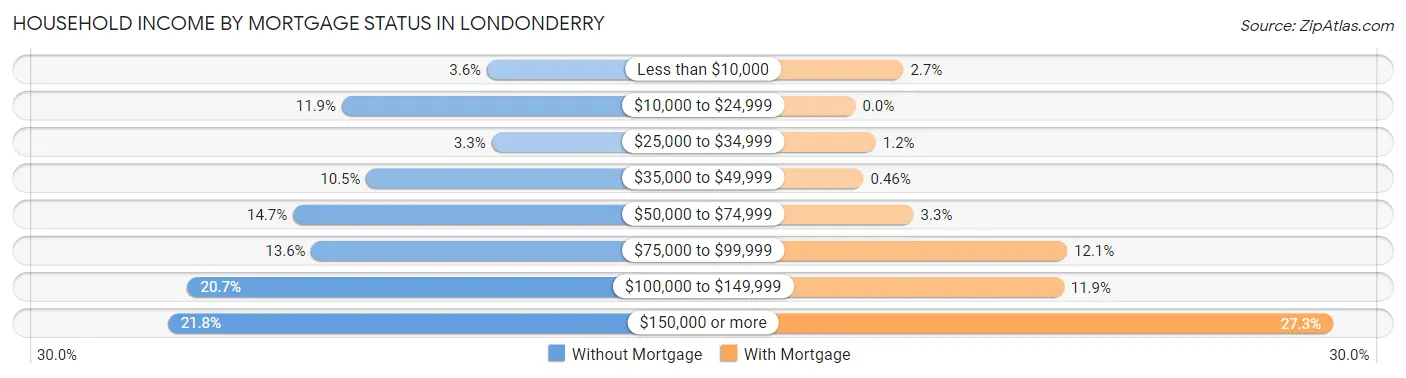
| Household Income | Without Mortgage | With Mortgage |
| Less than $10,000 | 41 (3.6%) | 71 (2.7%) |
| $10,000 to $24,999 | 136 (11.9%) | 0 (0.0%) |
| $25,000 to $34,999 | 38 (3.3%) | 30 (1.2%) |
| $35,000 to $49,999 | 120 (10.5%) | 12 (0.5%) |
| $50,000 to $74,999 | 168 (14.7%) | 86 (3.3%) |
| $75,000 to $99,999 | 156 (13.6%) | 313 (12.1%) |
| $100,000 to $149,999 | 237 (20.7%) | 308 (11.9%) |
| $150,000 or more | 250 (21.8%) | 706 (27.3%) |
| Total | 1,146 (100.0%) | 2,588 (100.0%) |
Property Value to Household Income Ratio in Londonderry
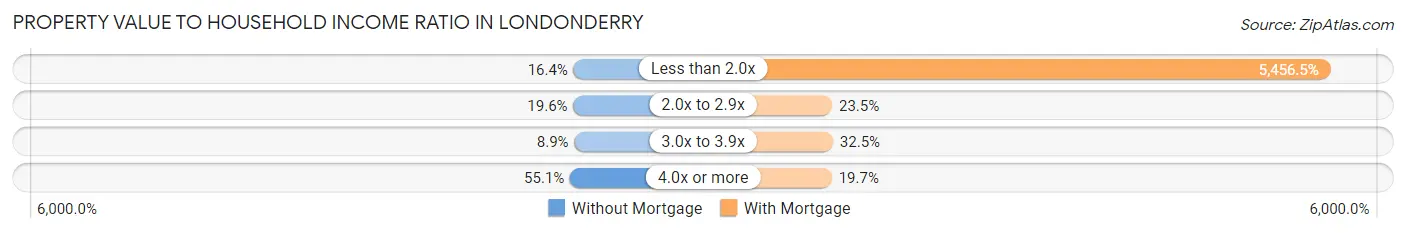
| Value-to-Income Ratio | Without Mortgage | With Mortgage |
| Less than 2.0x | 188 (16.4%) | 141,213 (5,456.5%) |
| 2.0x to 2.9x | 225 (19.6%) | 609 (23.5%) |
| 3.0x to 3.9x | 102 (8.9%) | 841 (32.5%) |
| 4.0x or more | 631 (55.1%) | 509 (19.7%) |
| Total | 1,146 (100.0%) | 2,588 (100.0%) |
Real Estate Taxes by Mortgage Status in Londonderry
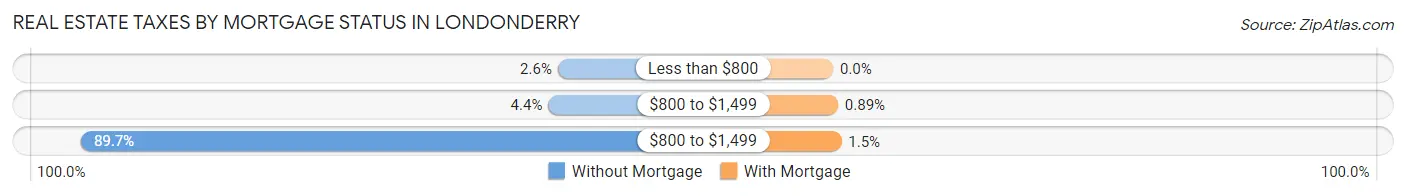
| Property Taxes | Without Mortgage | With Mortgage |
| Less than $800 | 30 (2.6%) | 0 (0.0%) |
| $800 to $1,499 | 50 (4.4%) | 23 (0.9%) |
| $800 to $1,499 | 1,028 (89.7%) | 39 (1.5%) |
| Total | 1,146 (100.0%) | 2,588 (100.0%) |
Health & Disability in Londonderry
Health Insurance Coverage by Age in Londonderry
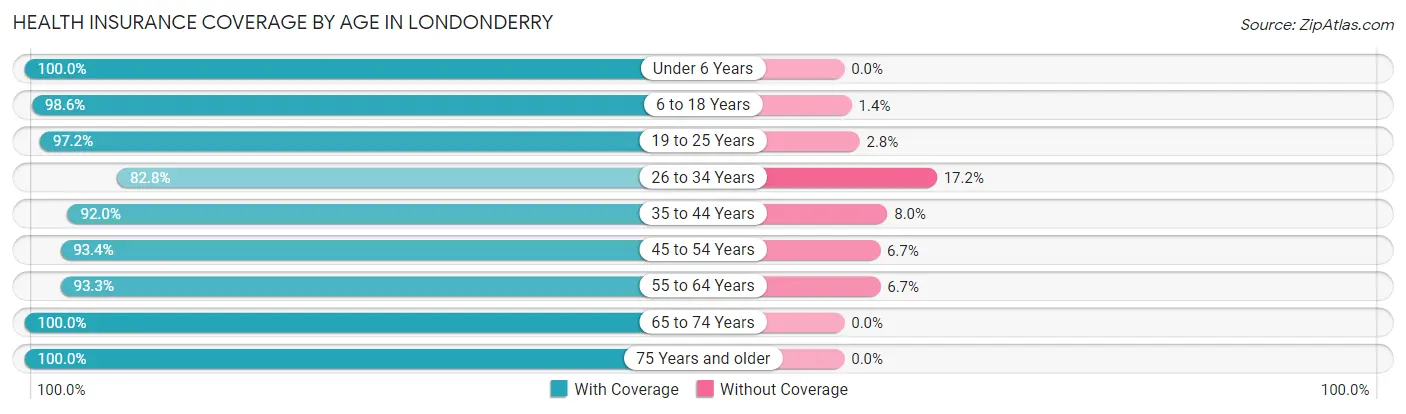
| Age Bracket | With Coverage | Without Coverage |
| Under 6 Years | 639 (100.0%) | 0 (0.0%) |
| 6 to 18 Years | 1,803 (98.6%) | 25 (1.4%) |
| 19 to 25 Years | 1,301 (97.2%) | 38 (2.8%) |
| 26 to 34 Years | 1,003 (82.8%) | 209 (17.2%) |
| 35 to 44 Years | 1,341 (92.0%) | 117 (8.0%) |
| 45 to 54 Years | 1,614 (93.3%) | 115 (6.7%) |
| 55 to 64 Years | 1,878 (93.3%) | 135 (6.7%) |
| 65 to 74 Years | 1,059 (100.0%) | 0 (0.0%) |
| 75 Years and older | 841 (100.0%) | 0 (0.0%) |
| Total | 11,479 (94.7%) | 639 (5.3%) |
Health Insurance Coverage by Citizenship Status in Londonderry
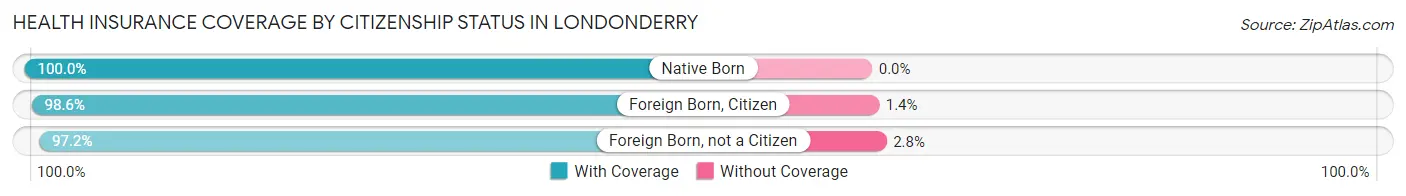
| Citizenship Status | With Coverage | Without Coverage |
| Native Born | 639 (100.0%) | 0 (0.0%) |
| Foreign Born, Citizen | 1,803 (98.6%) | 25 (1.4%) |
| Foreign Born, not a Citizen | 1,301 (97.2%) | 38 (2.8%) |
Health Insurance Coverage by Household Income in Londonderry
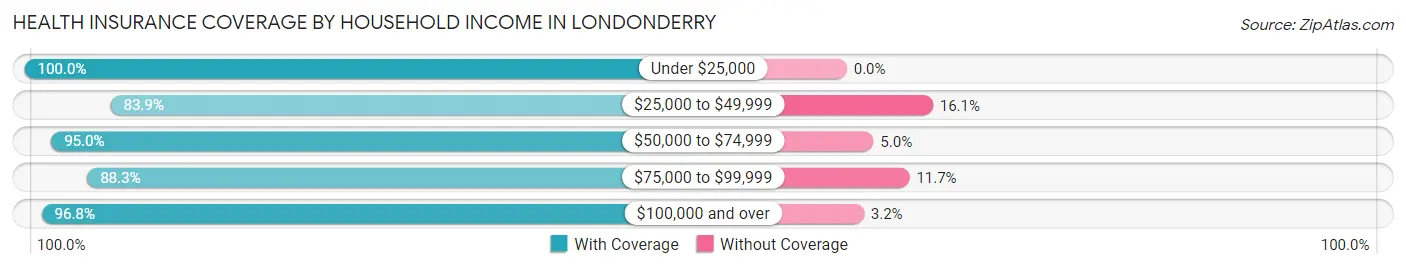
| Household Income | With Coverage | Without Coverage |
| Under $25,000 | 399 (100.0%) | 0 (0.0%) |
| $25,000 to $49,999 | 734 (83.9%) | 141 (16.1%) |
| $50,000 to $74,999 | 1,219 (95.0%) | 64 (5.0%) |
| $75,000 to $99,999 | 1,331 (88.3%) | 177 (11.7%) |
| $100,000 and over | 7,796 (96.8%) | 257 (3.2%) |
Public vs Private Health Insurance Coverage by Age in Londonderry
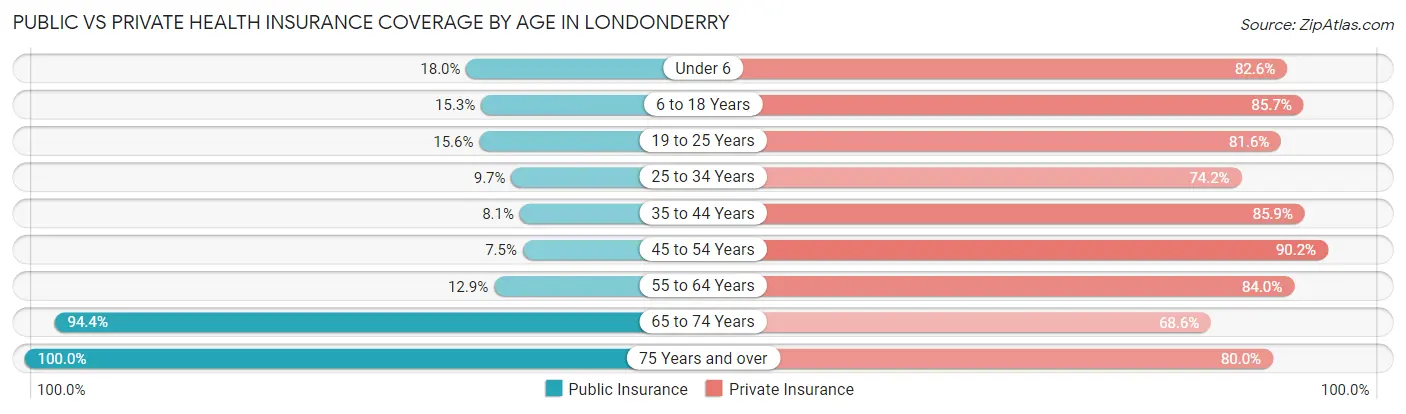
| Age Bracket | Public Insurance | Private Insurance |
| Under 6 | 115 (18.0%) | 528 (82.6%) |
| 6 to 18 Years | 279 (15.3%) | 1,567 (85.7%) |
| 19 to 25 Years | 209 (15.6%) | 1,092 (81.6%) |
| 25 to 34 Years | 117 (9.7%) | 899 (74.2%) |
| 35 to 44 Years | 118 (8.1%) | 1,253 (85.9%) |
| 45 to 54 Years | 130 (7.5%) | 1,560 (90.2%) |
| 55 to 64 Years | 259 (12.9%) | 1,690 (84.0%) |
| 65 to 74 Years | 1,000 (94.4%) | 726 (68.6%) |
| 75 Years and over | 841 (100.0%) | 673 (80.0%) |
| Total | 3,068 (25.3%) | 9,988 (82.4%) |
Disability Status by Sex by Age in Londonderry
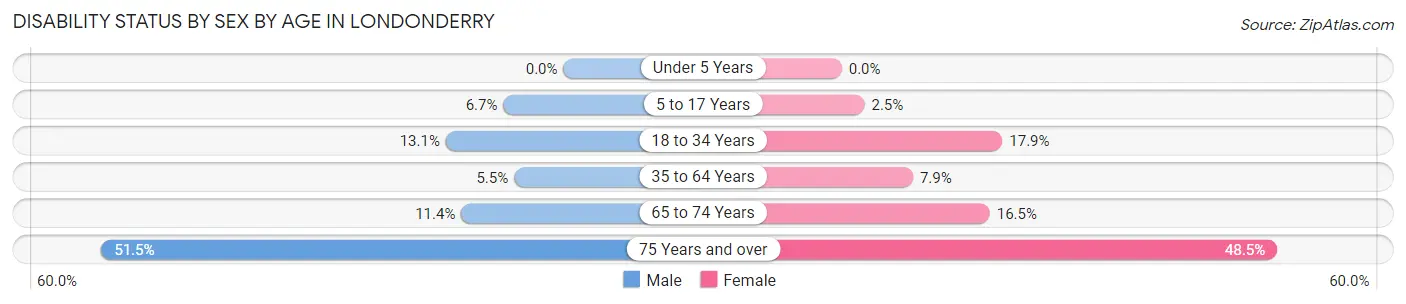
| Age Bracket | Male | Female |
| Under 5 Years | 0 (0.0%) | 0 (0.0%) |
| 5 to 17 Years | 68 (6.7%) | 17 (2.5%) |
| 18 to 34 Years | 178 (13.1%) | 257 (17.9%) |
| 35 to 64 Years | 134 (5.5%) | 219 (7.9%) |
| 65 to 74 Years | 59 (11.4%) | 89 (16.5%) |
| 75 Years and over | 178 (51.4%) | 240 (48.5%) |
Disability Class by Sex by Age in Londonderry
Disability Class: Hearing Difficulty
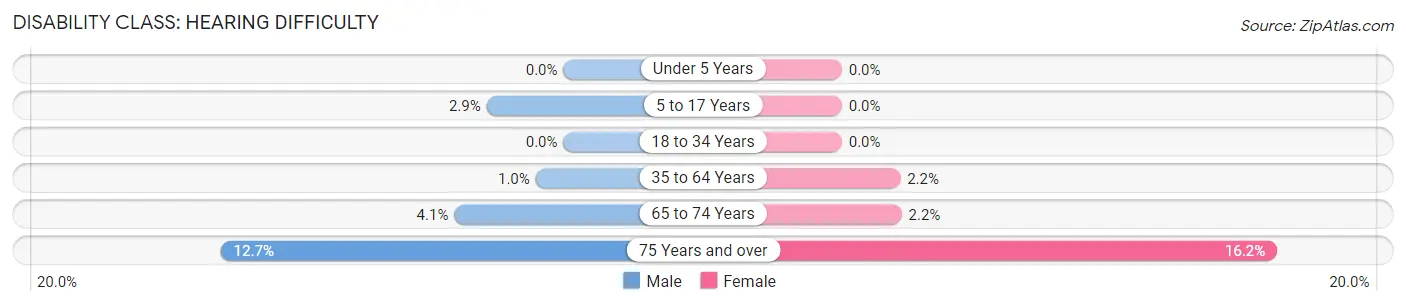
| Age Bracket | Male | Female |
| Under 5 Years | 0 (0.0%) | 0 (0.0%) |
| 5 to 17 Years | 29 (2.9%) | 0 (0.0%) |
| 18 to 34 Years | 0 (0.0%) | 0 (0.0%) |
| 35 to 64 Years | 25 (1.0%) | 60 (2.2%) |
| 65 to 74 Years | 21 (4.1%) | 12 (2.2%) |
| 75 Years and over | 44 (12.7%) | 80 (16.2%) |
Disability Class: Vision Difficulty
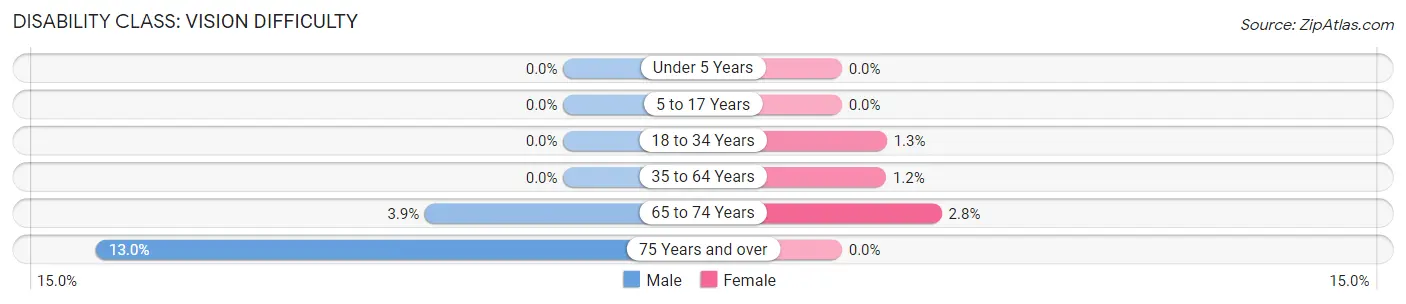
| Age Bracket | Male | Female |
| Under 5 Years | 0 (0.0%) | 0 (0.0%) |
| 5 to 17 Years | 0 (0.0%) | 0 (0.0%) |
| 18 to 34 Years | 0 (0.0%) | 18 (1.3%) |
| 35 to 64 Years | 0 (0.0%) | 34 (1.2%) |
| 65 to 74 Years | 20 (3.8%) | 15 (2.8%) |
| 75 Years and over | 45 (13.0%) | 0 (0.0%) |
Disability Class: Cognitive Difficulty
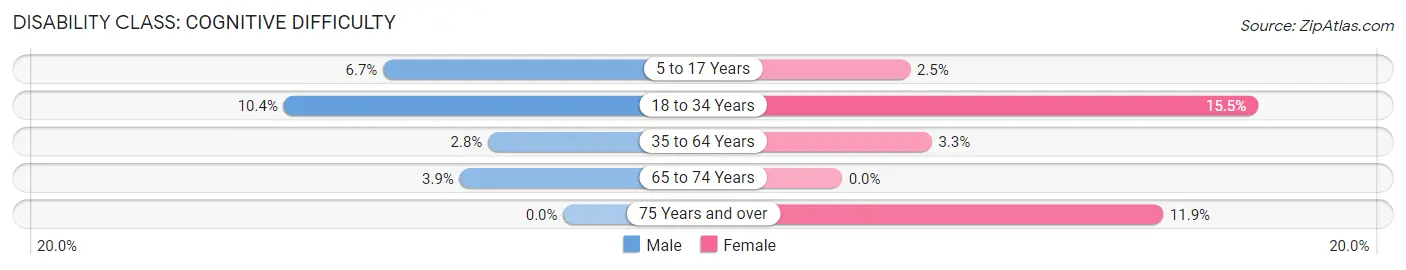
| Age Bracket | Male | Female |
| 5 to 17 Years | 68 (6.7%) | 17 (2.5%) |
| 18 to 34 Years | 141 (10.4%) | 222 (15.4%) |
| 35 to 64 Years | 68 (2.8%) | 92 (3.3%) |
| 65 to 74 Years | 20 (3.8%) | 0 (0.0%) |
| 75 Years and over | 0 (0.0%) | 59 (11.9%) |
Disability Class: Ambulatory Difficulty
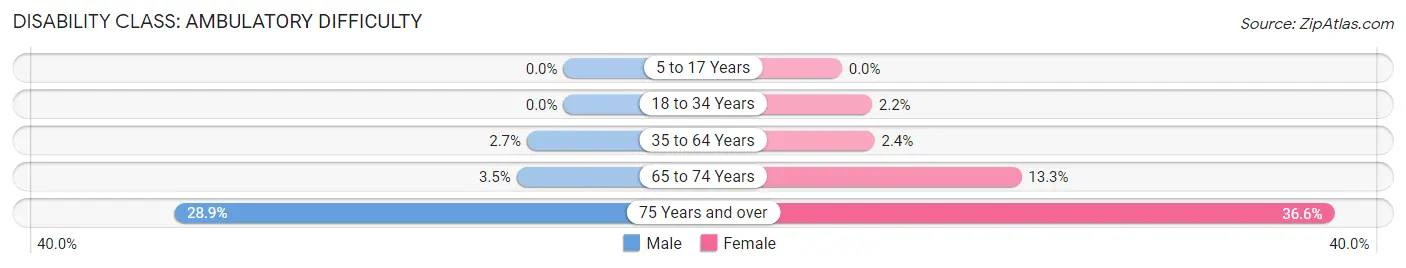
| Age Bracket | Male | Female |
| 5 to 17 Years | 0 (0.0%) | 0 (0.0%) |
| 18 to 34 Years | 0 (0.0%) | 32 (2.2%) |
| 35 to 64 Years | 66 (2.7%) | 67 (2.4%) |
| 65 to 74 Years | 18 (3.5%) | 72 (13.3%) |
| 75 Years and over | 100 (28.9%) | 181 (36.6%) |
Disability Class: Self-Care Difficulty
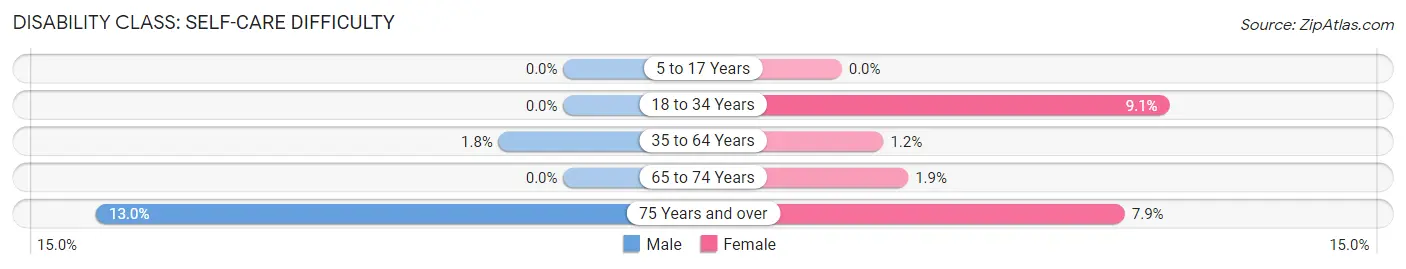
| Age Bracket | Male | Female |
| 5 to 17 Years | 0 (0.0%) | 0 (0.0%) |
| 18 to 34 Years | 0 (0.0%) | 131 (9.1%) |
| 35 to 64 Years | 44 (1.8%) | 32 (1.2%) |
| 65 to 74 Years | 0 (0.0%) | 10 (1.8%) |
| 75 Years and over | 45 (13.0%) | 39 (7.9%) |
Technology Access in Londonderry
Computing Device Access in Londonderry
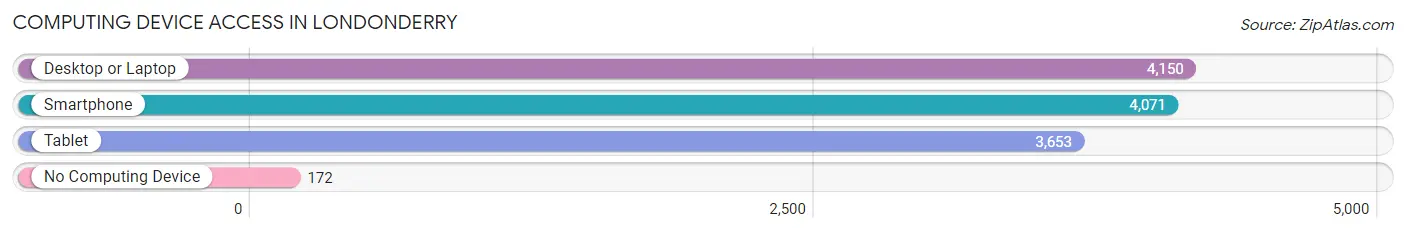
| Device Type | # Households | % Households |
| Desktop or Laptop | 4,150 | 91.4% |
| Smartphone | 4,071 | 89.7% |
| Tablet | 3,653 | 80.5% |
| No Computing Device | 172 | 3.8% |
| Total | 4,539 | 100.0% |
Internet Access in Londonderry
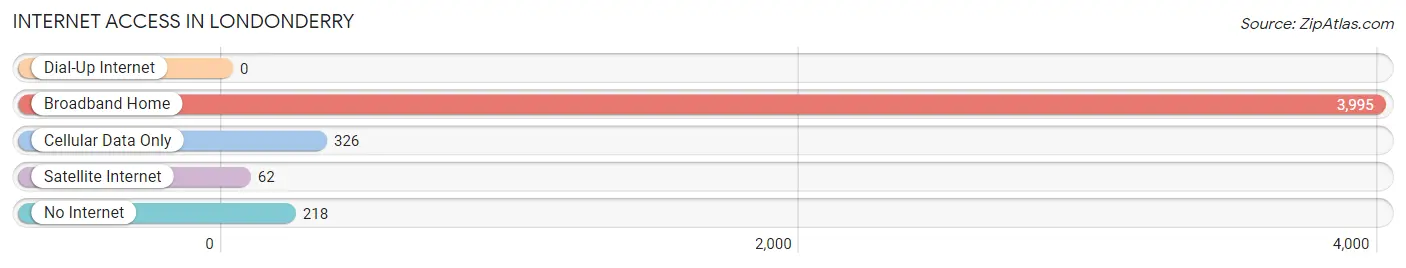
| Internet Type | # Households | % Households |
| Dial-Up Internet | 0 | 0.0% |
| Broadband Home | 3,995 | 88.0% |
| Cellular Data Only | 326 | 7.2% |
| Satellite Internet | 62 | 1.4% |
| No Internet | 218 | 4.8% |
| Total | 4,539 | 100.0% |
Londonderry Summary
Londonderry, New Hampshire is a town located in Rockingham County, in the southeastern part of the state. It is bordered by the towns of Derry to the north, Windham to the east, and Chester to the south. The town has a population of 24,129, according to the 2010 census, making it the fourth largest town in the state.
History
Londonderry was first settled in 1719 by Scots-Irish immigrants from the Londonderry Plantation in Ireland. The town was originally known as Nutfield, and was part of a larger tract of land granted to the Londonderry settlers by the Masonian Proprietors. The town was officially incorporated in 1722, and was renamed Londonderry in 1726.
The town was an important center of industry in the 19th century, with several mills and factories located along the banks of the Piscataquog River. The town was also home to a large shoe manufacturing industry, which employed many of the town's residents.
Geography
Londonderry is located in southeastern New Hampshire, in Rockingham County. It is bordered by the towns of Derry to the north, Windham to the east, and Chester to the south. The town covers an area of 33.2 square miles, and is located approximately 25 miles from the state capital of Concord.
The town is located in the Merrimack Valley region of New Hampshire, and is situated on the banks of the Piscataquog River. The town is mostly rural, with a few small villages scattered throughout. The highest point in the town is the summit of Bald Hill, which has an elevation of 890 feet.
Economy
Londonderry is home to a variety of businesses and industries, including manufacturing, retail, and service industries. The town is home to several large employers, including the Londonderry School District, the Londonderry Fire Department, and the Londonderry Public Library.
The town is also home to several retail stores, including Walmart, Target, and Home Depot. The town is also home to several restaurants, including the popular Applebee's and Olive Garden.
Demographics
According to the 2010 census, the population of Londonderry was 24,129. The racial makeup of the town was 94.3% White, 1.7% African American, 0.5% Native American, 1.7% Asian, 0.1% Pacific Islander, 0.7% from other races, and 1.7% from two or more races. Hispanic or Latino of any race were 2.7% of the population.
The median household income in the town was $76,845, and the median family income was $90,845. The per capita income for the town was $35,845. About 4.2% of families and 5.7% of the population were below the poverty line, including 6.3% of those under age 18 and 4.2% of those age 65 or over.
Common Questions
What is Per Capita Income in Londonderry?
Per Capita income in Londonderry is $50,175.
What is the Median Family Income in Londonderry?
Median Family Income in Londonderry is $130,859.
What is the Median Household income in Londonderry?
Median Household Income in Londonderry is $113,557.
What is Income or Wage Gap in Londonderry?
Income or Wage Gap in Londonderry is 35.4%.
Women in Londonderry earn 64.6 cents for every dollar earned by a man.
What is Family Income Deficit in Londonderry?
Family Income Deficit in Londonderry is $2,665.
Families that are below poverty line in Londonderry earn $2,665 less on average than the poverty threshold level.
What is Inequality or Gini Index in Londonderry?
Inequality or Gini Index in Londonderry is 0.37.
What is the Total Population of Londonderry?
Total Population of Londonderry is 12,143.
What is the Total Male Population of Londonderry?
Total Male Population of Londonderry is 6,002.
What is the Total Female Population of Londonderry?
Total Female Population of Londonderry is 6,141.
What is the Ratio of Males per 100 Females in Londonderry?
There are 97.74 Males per 100 Females in Londonderry.
What is the Ratio of Females per 100 Males in Londonderry?
There are 102.32 Females per 100 Males in Londonderry.
What is the Median Population Age in Londonderry?
Median Population Age in Londonderry is 42.7 Years.
What is the Average Family Size in Londonderry
Average Family Size in Londonderry is 3.2 People.
What is the Average Household Size in Londonderry
Average Household Size in Londonderry is 2.7 People.
How Large is the Labor Force in Londonderry?
There are 7,151 People in the Labor Forcein in Londonderry.
What is the Percentage of People in the Labor Force in Londonderry?
70.6% of People are in the Labor Force in Londonderry.
What is the Unemployment Rate in Londonderry?
Unemployment Rate in Londonderry is 4.7%.