Cities with the Lowest Poverty Level Among Children Under the Age of 5 in Alabama
RELATED REPORTS & OPTIONS
Lowest Poverty | Child 0-5
Alabama
Compare Cities
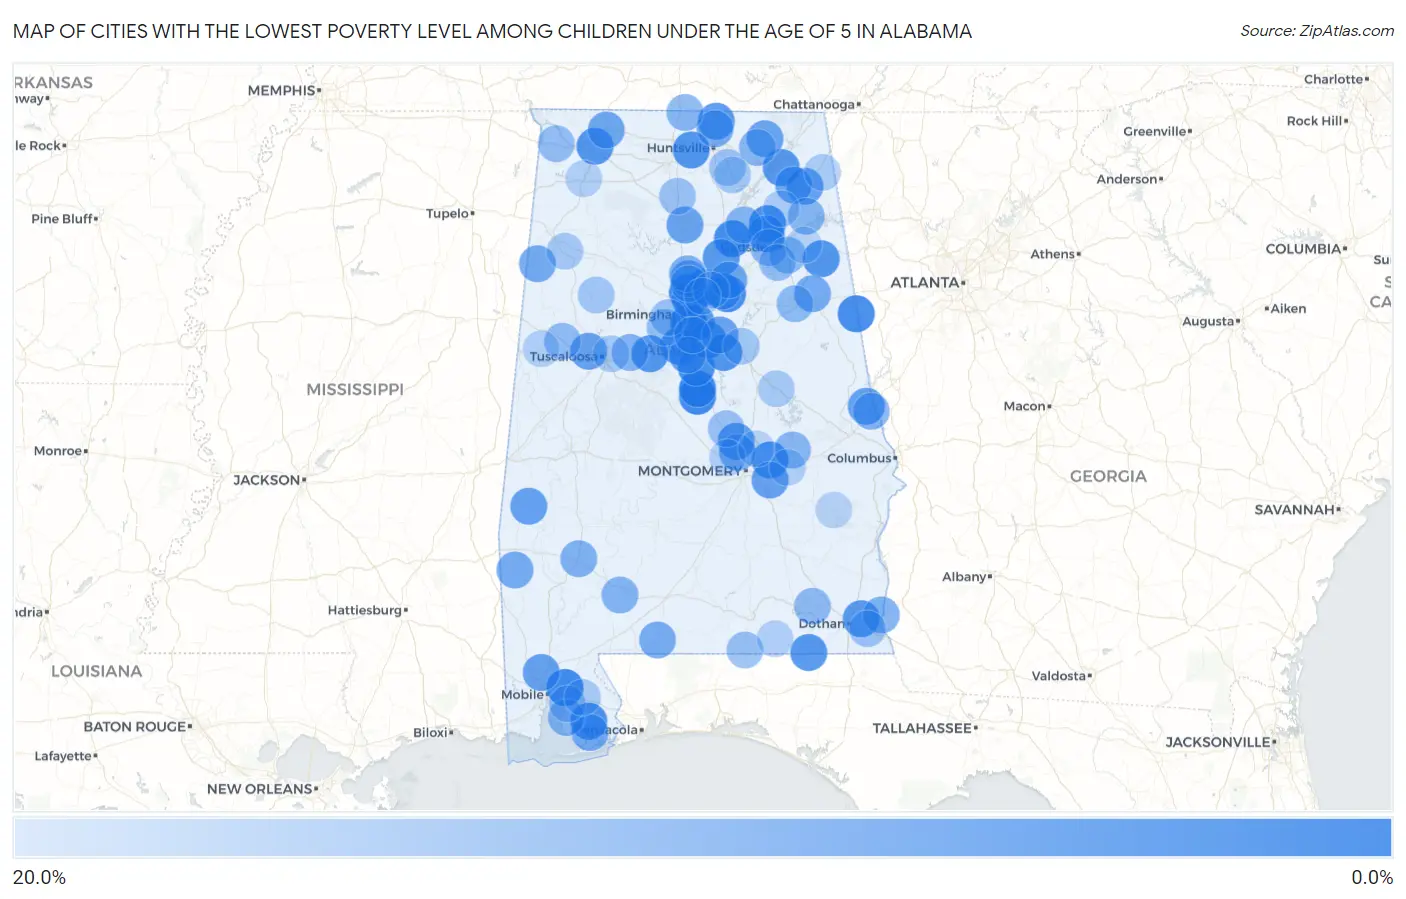
Map of Cities with the Lowest Poverty Level Among Children Under the Age of 5 in Alabama
20.0%
0.0%
Cities with the Lowest Poverty Level Among Children Under the Age of 5 in Alabama
| City | Child Poverty | vs State | vs National | |
| 1. | Gardendale | 0.61% | 25.1%(-24.5)#1 | 18.1%(-17.5)#32 |
| 2. | Homewood | 0.66% | 25.1%(-24.5)#2 | 18.1%(-17.4)#39 |
| 3. | Spanish Fort | 1.6% | 25.1%(-23.5)#3 | 18.1%(-16.5)#222 |
| 4. | Thorsby | 1.6% | 25.1%(-23.5)#4 | 18.1%(-16.4)#231 |
| 5. | Jemison | 1.7% | 25.1%(-23.5)#5 | 18.1%(-16.4)#242 |
| 6. | Margaret | 2.1% | 25.1%(-23.0)#6 | 18.1%(-16.0)#375 |
| 7. | Susan Moore | 2.3% | 25.1%(-22.9)#7 | 18.1%(-15.8)#437 |
| 8. | Ranburne | 2.4% | 25.1%(-22.7)#8 | 18.1%(-15.7)#475 |
| 9. | Summerdale | 2.7% | 25.1%(-22.5)#9 | 18.1%(-15.4)#563 |
| 10. | Sardis City | 2.8% | 25.1%(-22.3)#10 | 18.1%(-15.3)#610 |
| 11. | Helena | 2.9% | 25.1%(-22.3)#11 | 18.1%(-15.2)#660 |
| 12. | Calera | 2.9% | 25.1%(-22.2)#12 | 18.1%(-15.1)#681 |
| 13. | Chelsea | 3.5% | 25.1%(-21.6)#13 | 18.1%(-14.5)#931 |
| 14. | Wilsonville | 3.6% | 25.1%(-21.5)#14 | 18.1%(-14.4)#958 |
| 15. | Emerald Mountain | 3.7% | 25.1%(-21.4)#15 | 18.1%(-14.4)#989 |
| 16. | Carlisle Rockledge | 3.8% | 25.1%(-21.4)#16 | 18.1%(-14.3)#1,031 |
| 17. | Madison | 3.8% | 25.1%(-21.4)#17 | 18.1%(-14.3)#1,033 |
| 18. | Woodstock | 3.9% | 25.1%(-21.2)#18 | 18.1%(-14.2)#1,082 |
| 19. | Muscle Shoals | 3.9% | 25.1%(-21.2)#19 | 18.1%(-14.1)#1,091 |
| 20. | Pinson | 4.0% | 25.1%(-21.2)#20 | 18.1%(-14.1)#1,122 |
| 21. | Piedmont | 4.0% | 25.1%(-21.1)#21 | 18.1%(-14.1)#1,127 |
| 22. | Vestavia Hills | 4.1% | 25.1%(-21.0)#22 | 18.1%(-13.9)#1,172 |
| 23. | Black | 4.2% | 25.1%(-21.0)#23 | 18.1%(-13.9)#1,209 |
| 24. | Section | 4.4% | 25.1%(-20.7)#24 | 18.1%(-13.6)#1,314 |
| 25. | Webb | 4.6% | 25.1%(-20.6)#25 | 18.1%(-13.5)#1,378 |
| 26. | Oneonta | 4.7% | 25.1%(-20.5)#26 | 18.1%(-13.4)#1,410 |
| 27. | Hazel Green | 4.7% | 25.1%(-20.4)#27 | 18.1%(-13.3)#1,431 |
| 28. | Deatsville | 5.0% | 25.1%(-20.1)#28 | 18.1%(-13.0)#1,582 |
| 29. | Mccalla | 5.2% | 25.1%(-19.9)#29 | 18.1%(-12.9)#1,653 |
| 30. | Huguley | 5.9% | 25.1%(-19.2)#30 | 18.1%(-12.2)#1,955 |
| 31. | Butler | 5.9% | 25.1%(-19.2)#31 | 18.1%(-12.1)#1,957 |
| 32. | Pine Ridge | 6.0% | 25.1%(-19.1)#32 | 18.1%(-12.1)#1,985 |
| 33. | Coker | 6.2% | 25.1%(-18.9)#33 | 18.1%(-11.8)#2,091 |
| 34. | Pike Road | 6.3% | 25.1%(-18.9)#34 | 18.1%(-11.8)#2,111 |
| 35. | Saraland | 6.3% | 25.1%(-18.9)#35 | 18.1%(-11.8)#2,115 |
| 36. | Cullman | 6.5% | 25.1%(-18.6)#36 | 18.1%(-11.6)#2,183 |
| 37. | Westover | 6.5% | 25.1%(-18.6)#37 | 18.1%(-11.6)#2,192 |
| 38. | Fultondale | 6.6% | 25.1%(-18.5)#38 | 18.1%(-11.4)#2,240 |
| 39. | Skyline | 6.7% | 25.1%(-18.5)#39 | 18.1%(-11.4)#2,256 |
| 40. | Shiloh | 6.7% | 25.1%(-18.5)#40 | 18.1%(-11.4)#2,266 |
| 41. | Alabaster | 6.7% | 25.1%(-18.4)#41 | 18.1%(-11.4)#2,283 |
| 42. | Argo | 7.0% | 25.1%(-18.1)#42 | 18.1%(-11.1)#2,424 |
| 43. | Springville | 7.1% | 25.1%(-18.0)#43 | 18.1%(-10.9)#2,473 |
| 44. | Killen | 7.3% | 25.1%(-17.8)#44 | 18.1%(-10.7)#2,553 |
| 45. | Kimberly | 7.4% | 25.1%(-17.7)#45 | 18.1%(-10.7)#2,594 |
| 46. | Foley | 7.6% | 25.1%(-17.5)#46 | 18.1%(-10.4)#2,686 |
| 47. | Sulligent | 7.7% | 25.1%(-17.4)#47 | 18.1%(-10.3)#2,737 |
| 48. | Millry | 8.0% | 25.1%(-17.1)#48 | 18.1%(-10.1)#2,833 |
| 49. | Choccolocco | 8.0% | 25.1%(-17.1)#49 | 18.1%(-10.0)#2,848 |
| 50. | Brewton | 8.4% | 25.1%(-16.7)#50 | 18.1%(-9.63)#3,009 |
| 51. | Millbrook | 8.5% | 25.1%(-16.6)#51 | 18.1%(-9.54)#3,054 |
| 52. | Meridianville | 8.6% | 25.1%(-16.5)#52 | 18.1%(-9.44)#3,097 |
| 53. | Columbia | 9.1% | 25.1%(-16.0)#53 | 18.1%(-8.97)#3,285 |
| 54. | Warrior | 9.3% | 25.1%(-15.8)#54 | 18.1%(-8.78)#3,386 |
| 55. | Grove Hill | 9.4% | 25.1%(-15.8)#55 | 18.1%(-8.69)#3,415 |
| 56. | Brookwood | 9.5% | 25.1%(-15.6)#56 | 18.1%(-8.54)#3,467 |
| 57. | Valley | 9.8% | 25.1%(-15.4)#57 | 18.1%(-8.29)#3,571 |
| 58. | Frisco City | 9.8% | 25.1%(-15.3)#58 | 18.1%(-8.26)#3,578 |
| 59. | Douglas | 9.9% | 25.1%(-15.2)#59 | 18.1%(-8.14)#3,613 |
| 60. | Fairhope | 10.1% | 25.1%(-15.0)#60 | 18.1%(-7.95)#3,709 |
| 61. | Sand Rock | 10.2% | 25.1%(-14.9)#61 | 18.1%(-7.86)#3,738 |
| 62. | Pleasant Groves | 10.3% | 25.1%(-14.9)#62 | 18.1%(-7.81)#3,760 |
| 63. | Attalla | 10.3% | 25.1%(-14.8)#63 | 18.1%(-7.79)#3,766 |
| 64. | Tallassee | 10.3% | 25.1%(-14.8)#64 | 18.1%(-7.73)#3,788 |
| 65. | Ardmore | 10.4% | 25.1%(-14.7)#65 | 18.1%(-7.66)#3,807 |
| 66. | Glencoe | 10.7% | 25.1%(-14.4)#66 | 18.1%(-7.35)#3,938 |
| 67. | Oxford | 10.8% | 25.1%(-14.3)#67 | 18.1%(-7.23)#3,986 |
| 68. | Fort Rucker | 11.2% | 25.1%(-13.9)#68 | 18.1%(-6.82)#4,165 |
| 69. | Gordo | 11.3% | 25.1%(-13.8)#69 | 18.1%(-6.74)#4,196 |
| 70. | Hueytown | 11.6% | 25.1%(-13.5)#70 | 18.1%(-6.46)#4,301 |
| 71. | Southside | 12.0% | 25.1%(-13.1)#71 | 18.1%(-6.06)#4,446 |
| 72. | Cherokee | 12.0% | 25.1%(-13.1)#72 | 18.1%(-6.06)#4,453 |
| 73. | Florala | 12.2% | 25.1%(-12.9)#73 | 18.1%(-5.82)#4,531 |
| 74. | Marbury | 12.3% | 25.1%(-12.8)#74 | 18.1%(-5.74)#4,557 |
| 75. | Falkville | 12.5% | 25.1%(-12.6)#75 | 18.1%(-5.56)#4,606 |
| 76. | Pleasant Grove | 12.6% | 25.1%(-12.5)#76 | 18.1%(-5.42)#4,705 |
| 77. | Ashford | 12.7% | 25.1%(-12.5)#77 | 18.1%(-5.41)#4,709 |
| 78. | Morris | 12.8% | 25.1%(-12.3)#78 | 18.1%(-5.28)#4,751 |
| 79. | Daphne | 13.2% | 25.1%(-11.9)#79 | 18.1%(-4.83)#4,921 |
| 80. | Owens Cross Roads | 13.3% | 25.1%(-11.9)#80 | 18.1%(-4.80)#4,927 |
| 81. | Clay | 13.3% | 25.1%(-11.8)#81 | 18.1%(-4.73)#4,938 |
| 82. | Berry | 13.3% | 25.1%(-11.8)#82 | 18.1%(-4.73)#4,951 |
| 83. | Hoover | 13.5% | 25.1%(-11.7)#83 | 18.1%(-4.61)#4,997 |
| 84. | Childersburg | 13.8% | 25.1%(-11.3)#84 | 18.1%(-4.25)#5,142 |
| 85. | New Hope | 13.9% | 25.1%(-11.2)#85 | 18.1%(-4.14)#5,182 |
| 86. | Guin | 14.0% | 25.1%(-11.2)#86 | 18.1%(-4.11)#5,196 |
| 87. | Loxley | 14.1% | 25.1%(-11.0)#87 | 18.1%(-3.94)#5,253 |
| 88. | Holt | 14.2% | 25.1%(-10.9)#88 | 18.1%(-3.84)#5,291 |
| 89. | Kellyton | 14.3% | 25.1%(-10.8)#89 | 18.1%(-3.78)#5,363 |
| 90. | Valley Head | 14.7% | 25.1%(-10.4)#90 | 18.1%(-3.36)#5,483 |
| 91. | Crossville | 14.8% | 25.1%(-10.4)#91 | 18.1%(-3.31)#5,494 |
| 92. | Shorter | 15.0% | 25.1%(-10.1)#92 | 18.1%(-3.06)#5,598 |
| 93. | Russellville | 15.2% | 25.1%(-9.88)#93 | 18.1%(-2.81)#5,663 |
| 94. | Carrollton | 15.3% | 25.1%(-9.81)#94 | 18.1%(-2.75)#5,685 |
| 95. | Prattville | 15.4% | 25.1%(-9.75)#95 | 18.1%(-2.69)#5,698 |
| 96. | Samson | 15.5% | 25.1%(-9.65)#96 | 18.1%(-2.59)#5,768 |
| 97. | Center Point | 15.8% | 25.1%(-9.37)#97 | 18.1%(-2.31)#5,844 |
| 98. | Midway | 15.9% | 25.1%(-9.22)#98 | 18.1%(-2.15)#5,904 |
| 99. | Wetumpka | 16.0% | 25.1%(-9.16)#99 | 18.1%(-2.10)#5,917 |
| 100. | Ballplay | 16.0% | 25.1%(-9.13)#100 | 18.1%(-2.06)#5,930 |
Common Questions
What are the Top 10 Cities with the Lowest Poverty Level Among Children Under the Age of 5 in Alabama?
Top 10 Cities with the Lowest Poverty Level Among Children Under the Age of 5 in Alabama are:
#1
0.61%
#2
0.66%
#3
1.6%
#4
1.6%
#5
1.7%
#6
2.1%
#7
2.3%
#8
2.4%
#9
2.7%
#10
2.8%
What city has the Lowest Poverty Level Among Children Under the Age of 5 in Alabama?
Gardendale has the Lowest Poverty Level Among Children Under the Age of 5 in Alabama with 0.61%.
What is the Poverty Level Among Children Under the Age of 5 in the State of Alabama?
Poverty Level Among Children Under the Age of 5 in Alabama is 25.1%.
What is the Poverty Level Among Children Under the Age of 5 in the United States?
Poverty Level Among Children Under the Age of 5 in the United States is 18.1%.