Hillsboro, KS Map & Demographics
Hillsboro Map

Hillsboro Overview
$25,565
PER CAPITA INCOME
$76,875
AVG FAMILY INCOME
$55,000
AVG HOUSEHOLD INCOME
76.9%
WAGE / INCOME GAP [ % ]
23.1¢/ $1
WAGE / INCOME GAP [ $ ]
$5,994
FAMILY INCOME DEFICIT
0.40
INEQUALITY / GINI INDEX
2,744
TOTAL POPULATION
1,297
MALE POPULATION
1,447
FEMALE POPULATION
89.63
MALES / 100 FEMALES
111.57
FEMALES / 100 MALES
35.7
MEDIAN AGE
2.9
AVG FAMILY SIZE
2.3
AVG HOUSEHOLD SIZE
1,316
LABOR FORCE [ PEOPLE ]
58.3%
PERCENT IN LABOR FORCE
2.4%
UNEMPLOYMENT RATE
Hillsboro Zip Codes
Hillsboro Area Codes
Income in Hillsboro
Income Overview in Hillsboro
Per Capita Income in Hillsboro is $25,565, while median incomes of families and households are $76,875 and $55,000 respectively.
| Characteristic | Number | Measure |
| Per Capita Income | 2,744 | $25,565 |
| Median Family Income | 575 | $76,875 |
| Mean Family Income | 575 | $90,794 |
| Median Household Income | 948 | $55,000 |
| Mean Household Income | 948 | $71,492 |
| Income Deficit | 575 | $5,994 |
| Wage / Income Gap (%) | 2,744 | 76.94% |
| Wage / Income Gap ($) | 2,744 | 23.06¢ per $1 |
| Gini / Inequality Index | 2,744 | 0.40 |
Earnings by Sex in Hillsboro
Average Earnings in Hillsboro are $21,053, $35,486 for men and $8,184 for women, a difference of 76.9%.
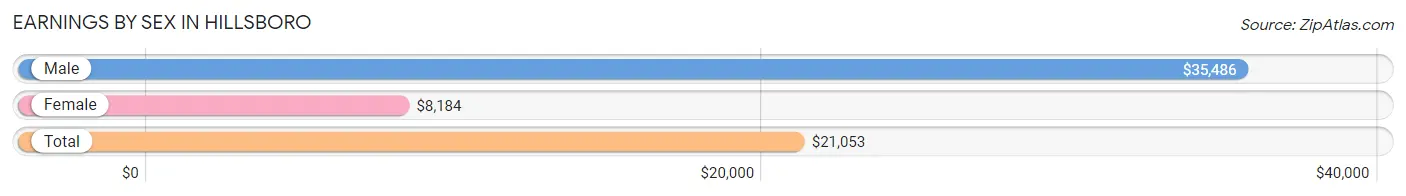
| Sex | Number | Average Earnings |
| Male | 779 (48.0%) | $35,486 |
| Female | 845 (52.0%) | $8,184 |
| Total | 1,624 (100.0%) | $21,053 |
Earnings by Sex by Income Bracket in Hillsboro
The most common earnings brackets in Hillsboro are $100,000+ for men (97 | 12.4%) and $2,499 or less for women (207 | 24.5%).
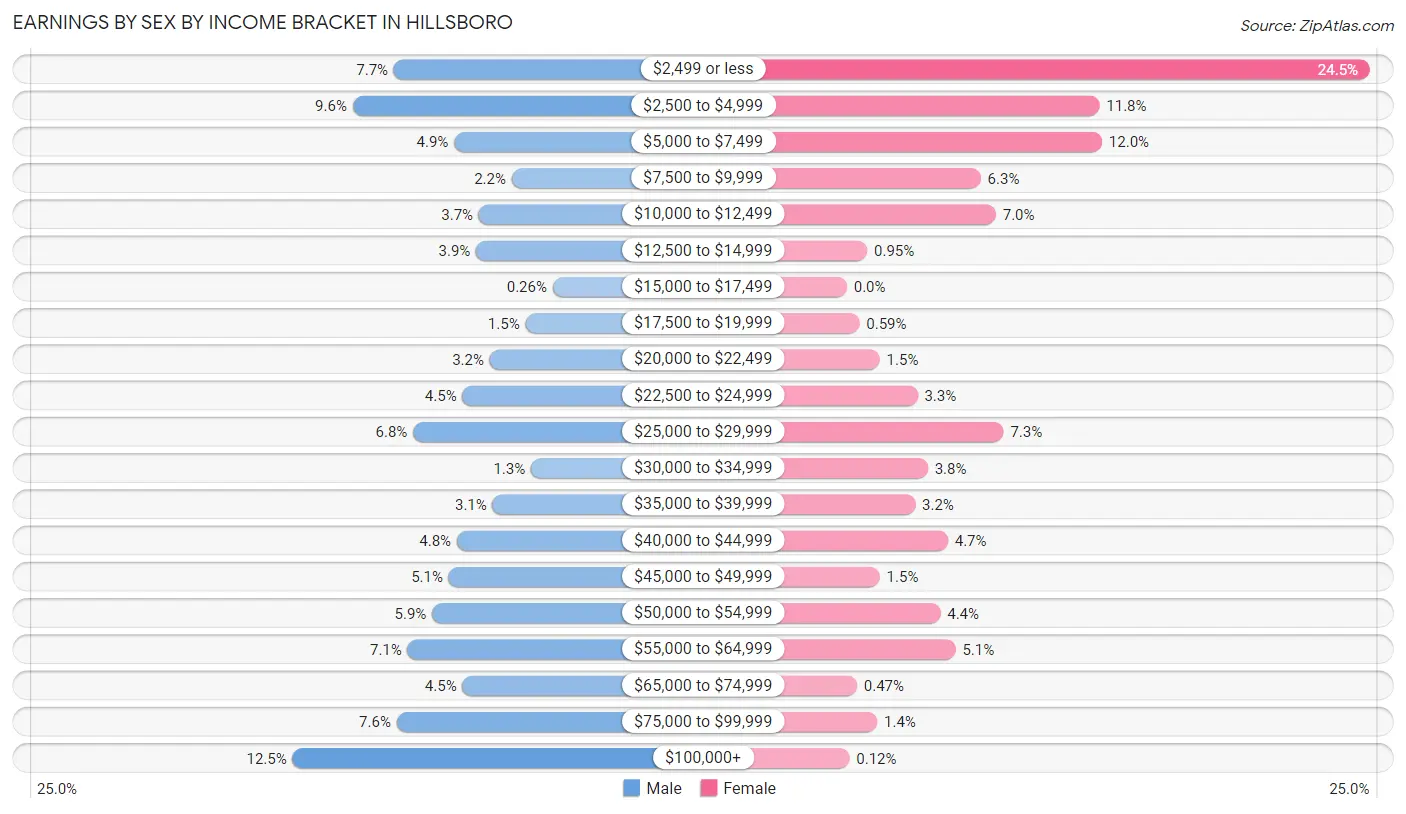
| Income | Male | Female |
| $2,499 or less | 60 (7.7%) | 207 (24.5%) |
| $2,500 to $4,999 | 75 (9.6%) | 100 (11.8%) |
| $5,000 to $7,499 | 38 (4.9%) | 101 (11.9%) |
| $7,500 to $9,999 | 17 (2.2%) | 53 (6.3%) |
| $10,000 to $12,499 | 29 (3.7%) | 59 (7.0%) |
| $12,500 to $14,999 | 30 (3.8%) | 8 (0.9%) |
| $15,000 to $17,499 | 2 (0.3%) | 0 (0.0%) |
| $17,500 to $19,999 | 12 (1.5%) | 5 (0.6%) |
| $20,000 to $22,499 | 25 (3.2%) | 13 (1.5%) |
| $22,500 to $24,999 | 35 (4.5%) | 28 (3.3%) |
| $25,000 to $29,999 | 53 (6.8%) | 62 (7.3%) |
| $30,000 to $34,999 | 10 (1.3%) | 32 (3.8%) |
| $35,000 to $39,999 | 24 (3.1%) | 27 (3.2%) |
| $40,000 to $44,999 | 37 (4.8%) | 40 (4.7%) |
| $45,000 to $49,999 | 40 (5.1%) | 13 (1.5%) |
| $50,000 to $54,999 | 46 (5.9%) | 37 (4.4%) |
| $55,000 to $64,999 | 55 (7.1%) | 43 (5.1%) |
| $65,000 to $74,999 | 35 (4.5%) | 4 (0.5%) |
| $75,000 to $99,999 | 59 (7.6%) | 12 (1.4%) |
| $100,000+ | 97 (12.4%) | 1 (0.1%) |
| Total | 779 (100.0%) | 845 (100.0%) |
Earnings by Sex by Educational Attainment in Hillsboro
Average earnings in Hillsboro are $50,714 for men and $22,768 for women, a difference of 55.1%. Men with an educational attainment of graduate degree enjoy the highest average annual earnings of $61,932, while those with high school diploma education earn the least with $41,518. Women with an educational attainment of graduate degree earn the most with the average annual earnings of $50,114, while those with bachelor's degree education have the smallest earnings of $29,722.
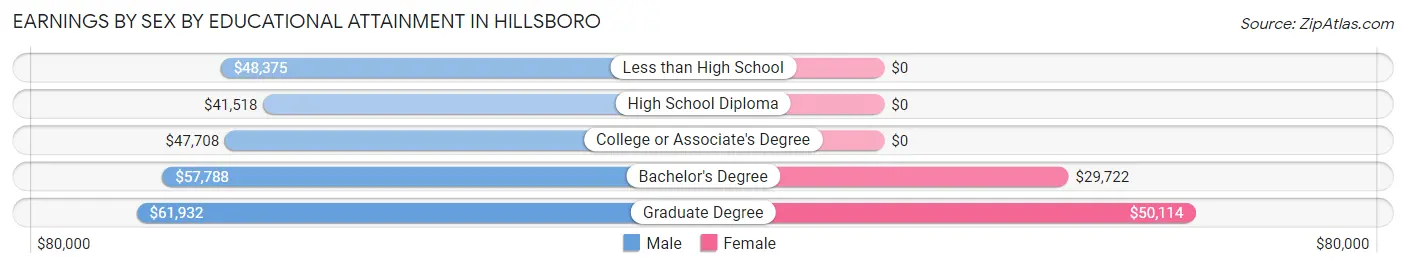
| Educational Attainment | Male Income | Female Income |
| Less than High School | $48,375 | $0 |
| High School Diploma | $41,518 | $0 |
| College or Associate's Degree | $47,708 | $0 |
| Bachelor's Degree | $57,788 | $29,722 |
| Graduate Degree | $61,932 | $50,114 |
| Total | $50,714 | $22,768 |
Family Income in Hillsboro
Family Income Brackets in Hillsboro
According to the Hillsboro family income data, there are 150 families falling into the $50,000 to $74,999 income range, which is the most common income bracket and makes up 26.1% of all families.
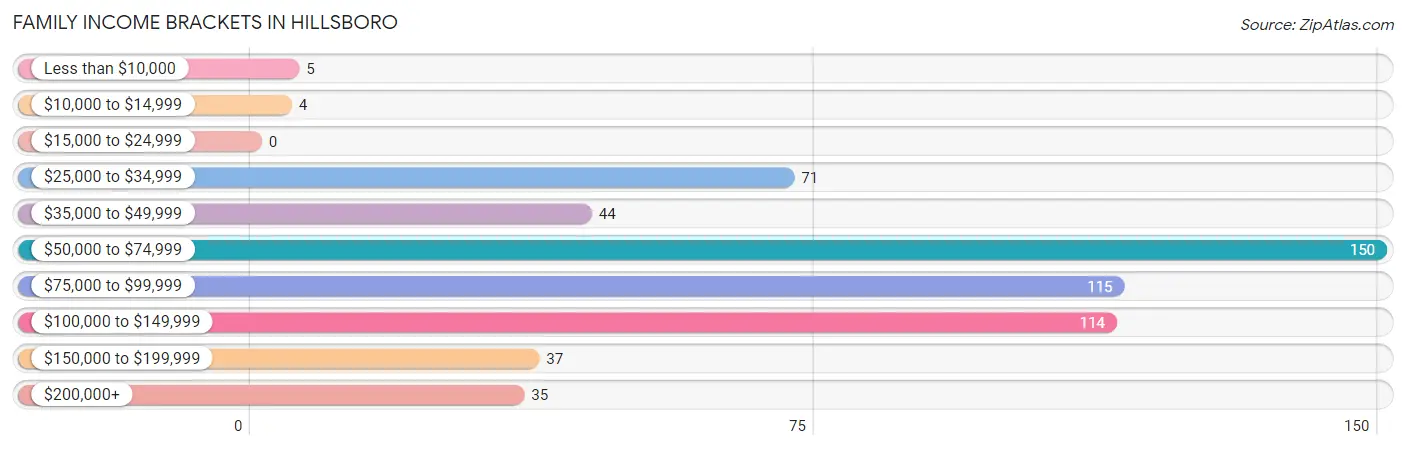
| Income Bracket | # Families | % Families |
| Less than $10,000 | 5 | 0.9% |
| $10,000 to $14,999 | 4 | 0.7% |
| $15,000 to $24,999 | 0 | 0.0% |
| $25,000 to $34,999 | 71 | 12.3% |
| $35,000 to $49,999 | 44 | 7.7% |
| $50,000 to $74,999 | 150 | 26.1% |
| $75,000 to $99,999 | 115 | 20.0% |
| $100,000 to $149,999 | 114 | 19.8% |
| $150,000 to $199,999 | 37 | 6.4% |
| $200,000+ | 35 | 6.1% |
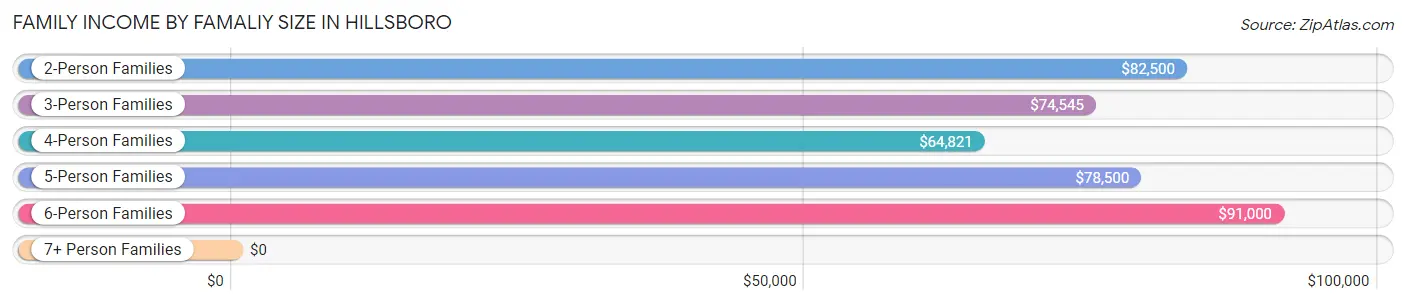
Family Income by Famaliy Size in Hillsboro
6-person families (36 | 6.3%) account for the highest median family income in Hillsboro with $91,000 per family, while 2-person families (294 | 51.1%) have the highest median income of $41,250 per family member.
| Income Bracket | # Families | Median Income |
| 2-Person Families | 294 (51.1%) | $82,500 |
| 3-Person Families | 78 (13.6%) | $74,545 |
| 4-Person Families | 87 (15.1%) | $64,821 |
| 5-Person Families | 80 (13.9%) | $78,500 |
| 6-Person Families | 36 (6.3%) | $91,000 |
| 7+ Person Families | 0 (0.0%) | $0 |
| Total | 575 (100.0%) | $76,875 |
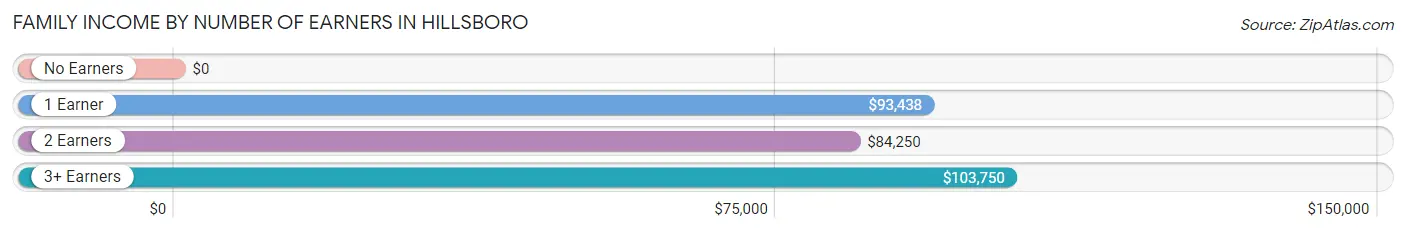
Family Income by Number of Earners in Hillsboro
| Number of Earners | # Families | Median Income |
| No Earners | 89 (15.5%) | $0 |
| 1 Earner | 107 (18.6%) | $93,438 |
| 2 Earners | 359 (62.4%) | $84,250 |
| 3+ Earners | 20 (3.5%) | $103,750 |
| Total | 575 (100.0%) | $76,875 |
Household Income in Hillsboro
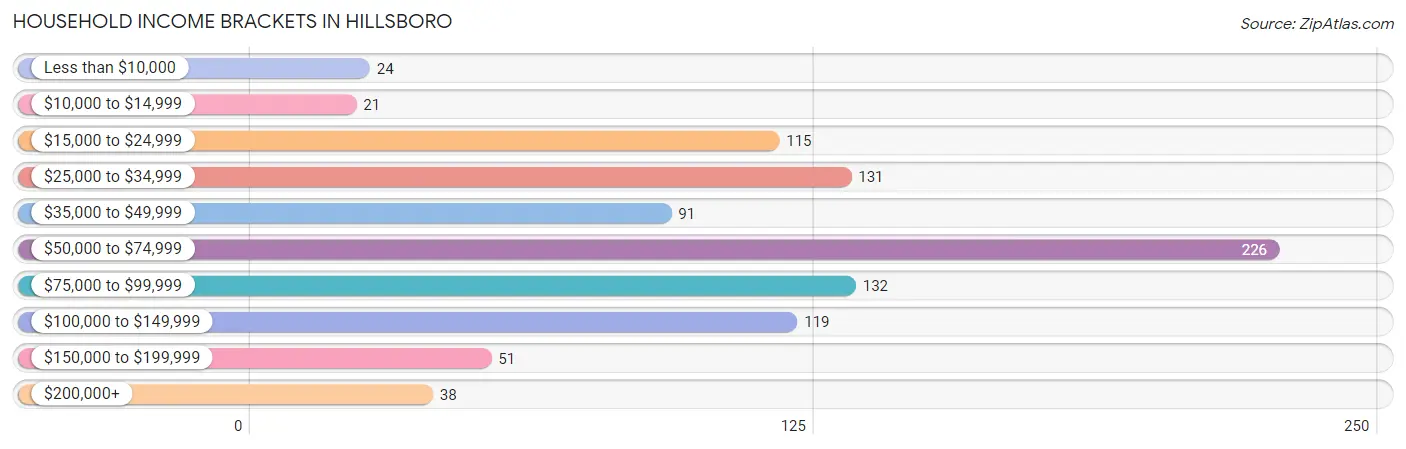
Household Income Brackets in Hillsboro
With 226 households falling in the category, the $50,000 to $74,999 income range is the most frequent in Hillsboro, accounting for 23.8% of all households. In contrast, only 21 households (2.2%) fall into the $10,000 to $14,999 income bracket, making it the least populous group.
| Income Bracket | # Households | % Households |
| Less than $10,000 | 24 | 2.5% |
| $10,000 to $14,999 | 21 | 2.2% |
| $15,000 to $24,999 | 115 | 12.1% |
| $25,000 to $34,999 | 131 | 13.8% |
| $35,000 to $49,999 | 91 | 9.6% |
| $50,000 to $74,999 | 226 | 23.8% |
| $75,000 to $99,999 | 132 | 13.9% |
| $100,000 to $149,999 | 119 | 12.6% |
| $150,000 to $199,999 | 51 | 5.4% |
| $200,000+ | 38 | 4.0% |
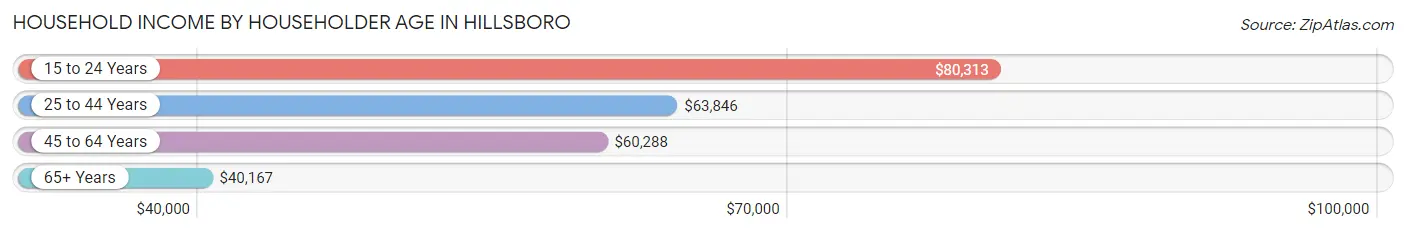
Household Income by Householder Age in Hillsboro
The median household income in Hillsboro is $55,000, with the highest median household income of $80,313 found in the 15 to 24 years age bracket for the primary householder. A total of 39 households (4.1%) fall into this category. Meanwhile, the 65+ years age bracket for the primary householder has the lowest median household income of $40,167, with 304 households (32.1%) in this group.
| Income Bracket | # Households | Median Income |
| 15 to 24 Years | 39 (4.1%) | $80,313 |
| 25 to 44 Years | 322 (34.0%) | $63,846 |
| 45 to 64 Years | 283 (29.8%) | $60,288 |
| 65+ Years | 304 (32.1%) | $40,167 |
| Total | 948 (100.0%) | $55,000 |
Poverty in Hillsboro
Income Below Poverty by Sex and Age in Hillsboro
With 7.7% poverty level for males and 7.6% for females among the residents of Hillsboro, 65 to 74 year old males and 25 to 34 year old females are the most vulnerable to poverty, with 20 males (16.5%) and 28 females (30.1%) in their respective age groups living below the poverty level.
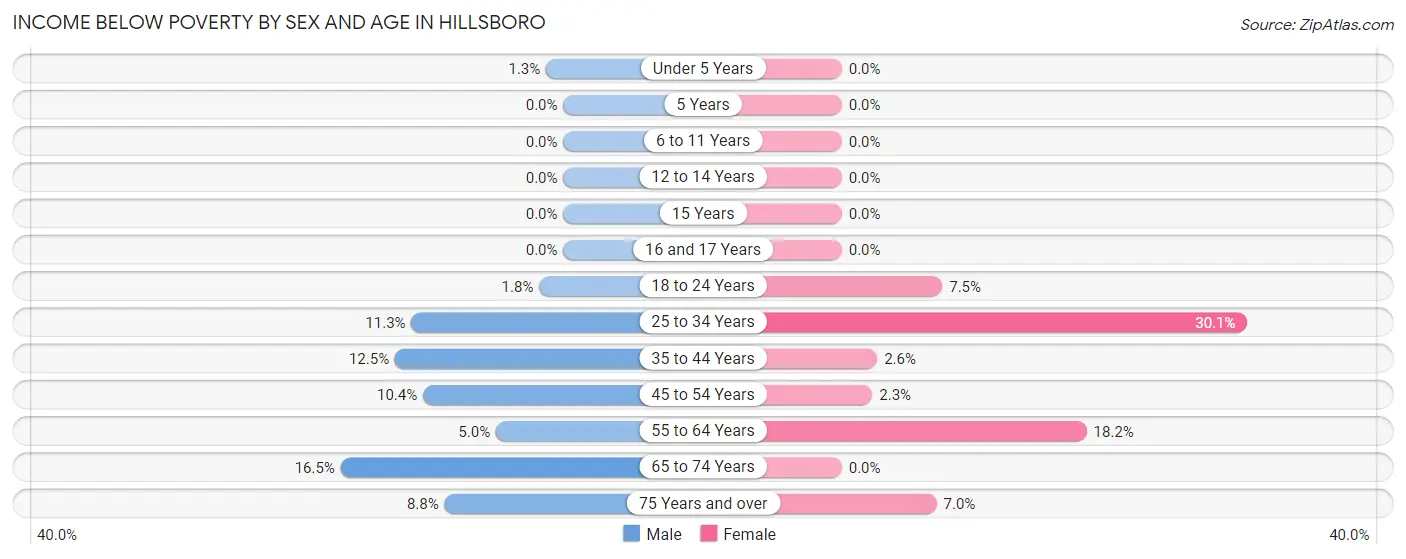
| Age Bracket | Male | Female |
| Under 5 Years | 1 (1.3%) | 0 (0.0%) |
| 5 Years | 0 (0.0%) | 0 (0.0%) |
| 6 to 11 Years | 0 (0.0%) | 0 (0.0%) |
| 12 to 14 Years | 0 (0.0%) | 0 (0.0%) |
| 15 Years | 0 (0.0%) | 0 (0.0%) |
| 16 and 17 Years | 0 (0.0%) | 0 (0.0%) |
| 18 to 24 Years | 1 (1.8%) | 5 (7.5%) |
| 25 to 34 Years | 15 (11.3%) | 28 (30.1%) |
| 35 to 44 Years | 23 (12.5%) | 5 (2.6%) |
| 45 to 54 Years | 10 (10.4%) | 2 (2.3%) |
| 55 to 64 Years | 6 (5.0%) | 34 (18.2%) |
| 65 to 74 Years | 20 (16.5%) | 0 (0.0%) |
| 75 Years and over | 6 (8.8%) | 10 (7.0%) |
| Total | 82 (7.7%) | 84 (7.6%) |
Income Above Poverty by Sex and Age in Hillsboro
According to the poverty statistics in Hillsboro, males aged 6 to 11 years and females aged under 5 years are the age groups that are most secure financially, with 100.0% of males and 100.0% of females in these age groups living above the poverty line.
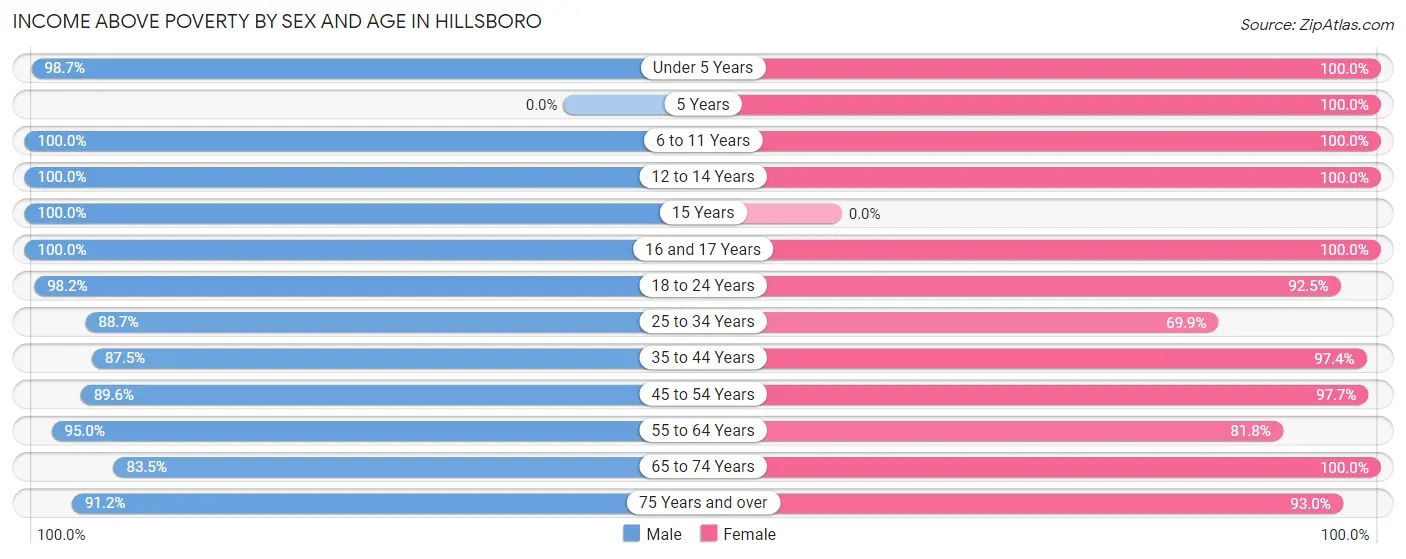
| Age Bracket | Male | Female |
| Under 5 Years | 77 (98.7%) | 31 (100.0%) |
| 5 Years | 0 (0.0%) | 22 (100.0%) |
| 6 to 11 Years | 145 (100.0%) | 118 (100.0%) |
| 12 to 14 Years | 15 (100.0%) | 62 (100.0%) |
| 15 Years | 13 (100.0%) | 0 (0.0%) |
| 16 and 17 Years | 31 (100.0%) | 12 (100.0%) |
| 18 to 24 Years | 55 (98.2%) | 62 (92.5%) |
| 25 to 34 Years | 118 (88.7%) | 65 (69.9%) |
| 35 to 44 Years | 161 (87.5%) | 185 (97.4%) |
| 45 to 54 Years | 86 (89.6%) | 86 (97.7%) |
| 55 to 64 Years | 114 (95.0%) | 153 (81.8%) |
| 65 to 74 Years | 101 (83.5%) | 96 (100.0%) |
| 75 Years and over | 62 (91.2%) | 132 (93.0%) |
| Total | 978 (92.3%) | 1,024 (92.4%) |
Income Below Poverty Among Married-Couple Families in Hillsboro
The poverty statistics for married-couple families in Hillsboro show that 3.6% or 18 of the total 500 families live below the poverty line. Families with 1 or 2 children have the highest poverty rate of 7.7%, comprising of 9 families. On the other hand, families with 3 or 4 children have the lowest poverty rate of 0.0%, which includes 0 families.
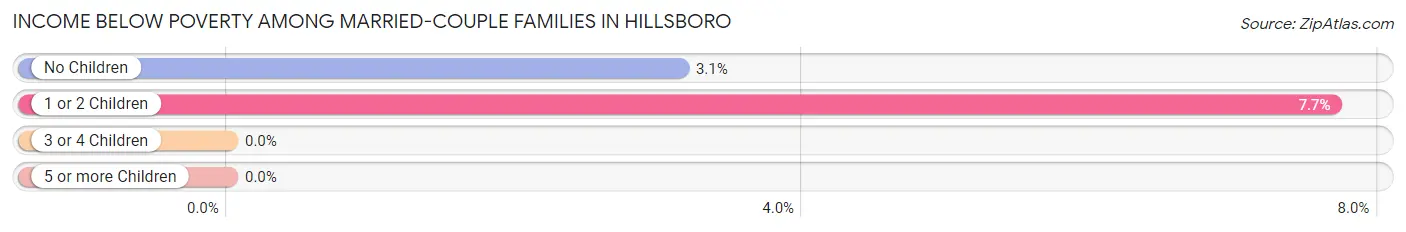
| Children | Above Poverty | Below Poverty |
| No Children | 278 (96.9%) | 9 (3.1%) |
| 1 or 2 Children | 108 (92.3%) | 9 (7.7%) |
| 3 or 4 Children | 96 (100.0%) | 0 (0.0%) |
| 5 or more Children | 0 (0.0%) | 0 (0.0%) |
| Total | 482 (96.4%) | 18 (3.6%) |
Income Below Poverty Among Single-Parent Households in Hillsboro
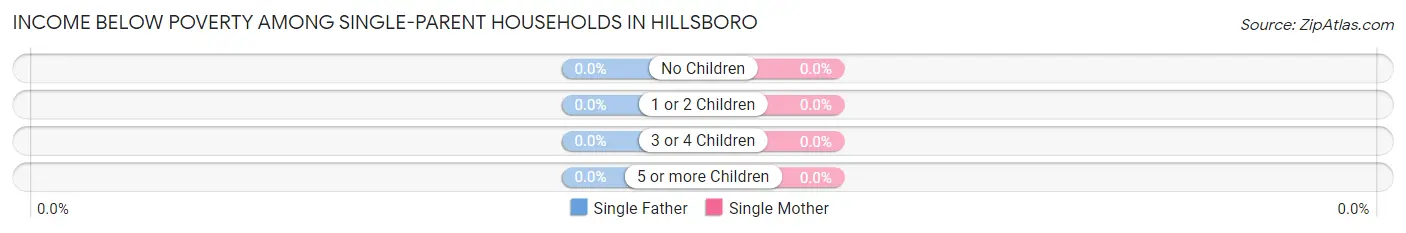
| Children | Single Father | Single Mother |
| No Children | 0 (0.0%) | 0 (0.0%) |
| 1 or 2 Children | 0 (0.0%) | 0 (0.0%) |
| 3 or 4 Children | 0 (0.0%) | 0 (0.0%) |
| 5 or more Children | 0 (0.0%) | 0 (0.0%) |
| Total | 0 (0.0%) | 0 (0.0%) |
Income Below Poverty Among Married-Couple vs Single-Parent Households in Hillsboro
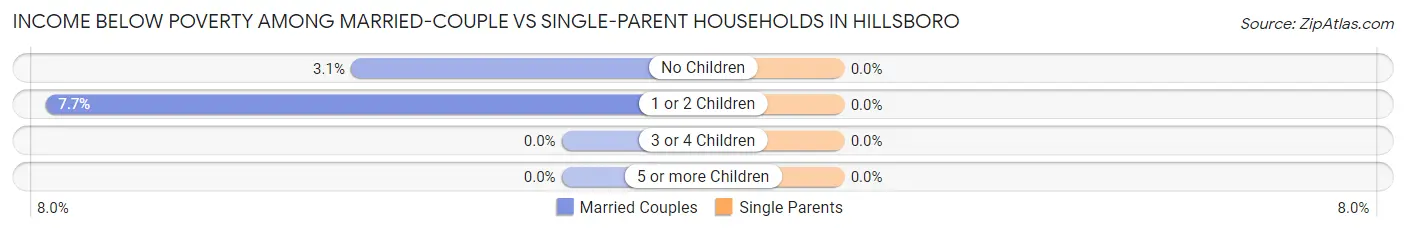
| Children | Married-Couple Families | Single-Parent Households |
| No Children | 9 (3.1%) | 0 (0.0%) |
| 1 or 2 Children | 9 (7.7%) | 0 (0.0%) |
| 3 or 4 Children | 0 (0.0%) | 0 (0.0%) |
| 5 or more Children | 0 (0.0%) | 0 (0.0%) |
| Total | 18 (3.6%) | 0 (0.0%) |
Race in Hillsboro
The most populous races in Hillsboro are White / Caucasian (2,485 | 90.6%), Two or more Races (97 | 3.5%), and Hispanic or Latino (93 | 3.4%).
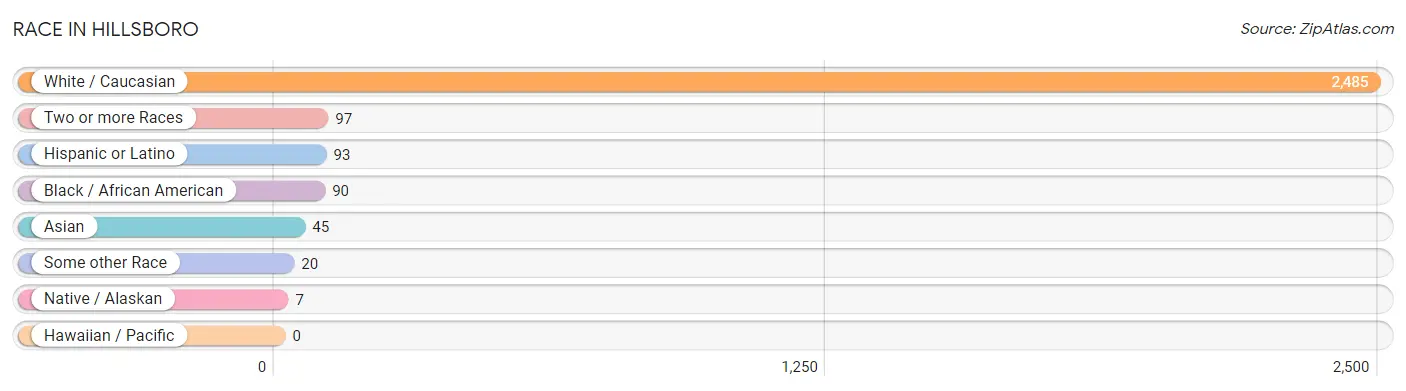
| Race | # Population | % Population |
| Asian | 45 | 1.6% |
| Black / African American | 90 | 3.3% |
| Hawaiian / Pacific | 0 | 0.0% |
| Hispanic or Latino | 93 | 3.4% |
| Native / Alaskan | 7 | 0.3% |
| White / Caucasian | 2,485 | 90.6% |
| Two or more Races | 97 | 3.5% |
| Some other Race | 20 | 0.7% |
| Total | 2,744 | 100.0% |
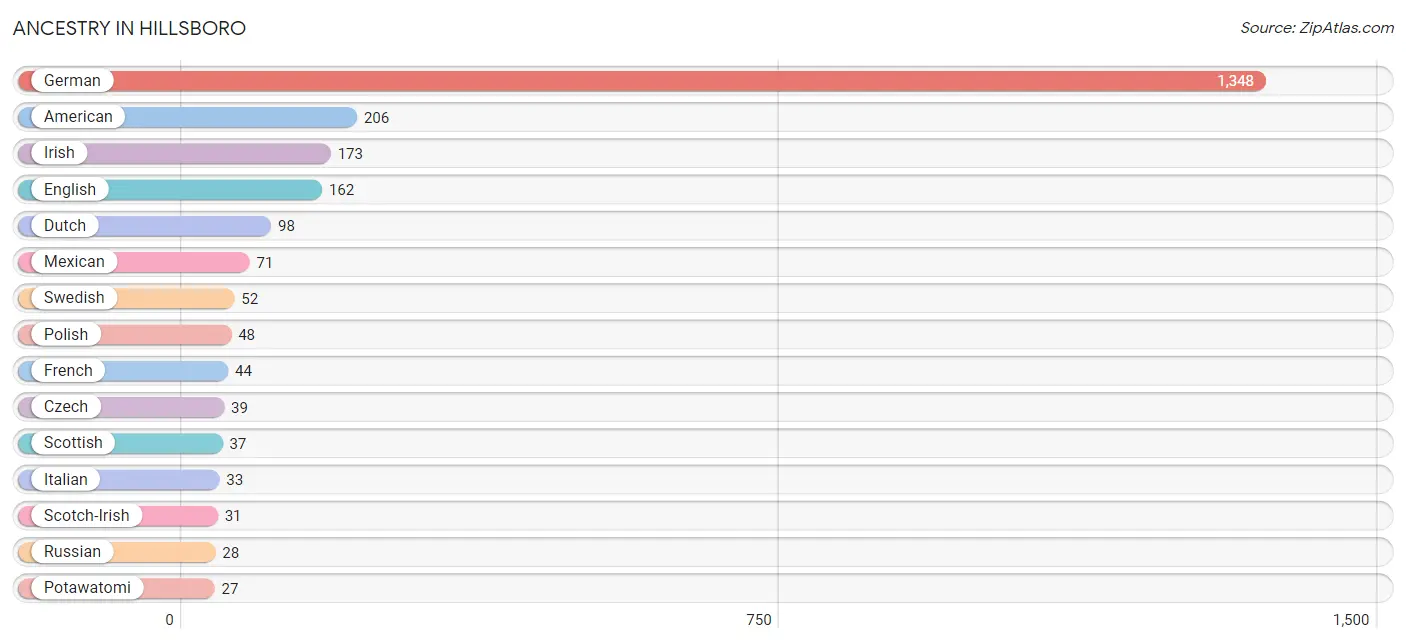
Ancestry in Hillsboro
The most populous ancestries reported in Hillsboro are German (1,348 | 49.1%), American (206 | 7.5%), Irish (173 | 6.3%), English (162 | 5.9%), and Dutch (98 | 3.6%), together accounting for 72.4% of all Hillsboro residents.
| Ancestry | # Population | % Population |
| African | 1 | 0.0% |
| American | 206 | 7.5% |
| Apache | 4 | 0.2% |
| Bhutanese | 24 | 0.9% |
| British | 5 | 0.2% |
| Central American | 4 | 0.2% |
| Cherokee | 7 | 0.3% |
| Cuban | 5 | 0.2% |
| Czech | 39 | 1.4% |
| Danish | 19 | 0.7% |
| Dutch | 98 | 3.6% |
| English | 162 | 5.9% |
| Ethiopian | 4 | 0.2% |
| European | 5 | 0.2% |
| Filipino | 12 | 0.4% |
| French | 44 | 1.6% |
| German | 1,348 | 49.1% |
| German Russian | 5 | 0.2% |
| Guatemalan | 4 | 0.2% |
| Hungarian | 19 | 0.7% |
| Indian (Asian) | 18 | 0.7% |
| Indonesian | 1 | 0.0% |
| Irish | 173 | 6.3% |
| Italian | 33 | 1.2% |
| Korean | 11 | 0.4% |
| Laotian | 9 | 0.3% |
| Mexican | 71 | 2.6% |
| Norwegian | 25 | 0.9% |
| Ottawa | 3 | 0.1% |
| Pennsylvania German | 6 | 0.2% |
| Polish | 48 | 1.8% |
| Potawatomi | 27 | 1.0% |
| Puerto Rican | 9 | 0.3% |
| Russian | 28 | 1.0% |
| Scotch-Irish | 31 | 1.1% |
| Scottish | 37 | 1.3% |
| Sioux | 2 | 0.1% |
| Subsaharan African | 8 | 0.3% |
| Swedish | 52 | 1.9% |
| Swiss | 6 | 0.2% |
| Ukrainian | 7 | 0.3% |
| Welsh | 14 | 0.5% | View All 42 Rows |
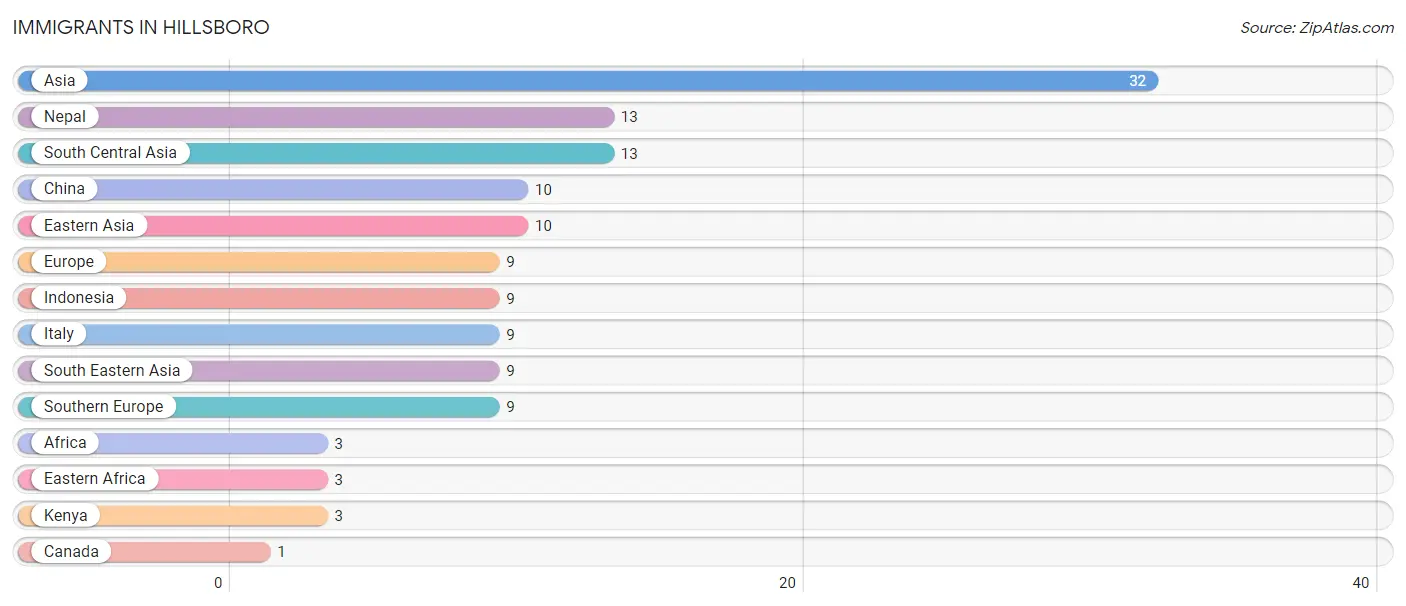
Immigrants in Hillsboro
The most numerous immigrant groups reported in Hillsboro came from Asia (32 | 1.2%), Nepal (13 | 0.5%), South Central Asia (13 | 0.5%), China (10 | 0.4%), and Eastern Asia (10 | 0.4%), together accounting for 2.8% of all Hillsboro residents.
| Immigration Origin | # Population | % Population |
| Africa | 3 | 0.1% |
| Asia | 32 | 1.2% |
| Canada | 1 | 0.0% |
| China | 10 | 0.4% |
| Eastern Africa | 3 | 0.1% |
| Eastern Asia | 10 | 0.4% |
| Europe | 9 | 0.3% |
| Indonesia | 9 | 0.3% |
| Italy | 9 | 0.3% |
| Kenya | 3 | 0.1% |
| Nepal | 13 | 0.5% |
| South Central Asia | 13 | 0.5% |
| South Eastern Asia | 9 | 0.3% |
| Southern Europe | 9 | 0.3% | View All 14 Rows |
Sex and Age in Hillsboro
Sex and Age in Hillsboro
The most populous age groups in Hillsboro are 15 to 19 Years (136 | 10.5%) for men and 20 to 24 Years (227 | 15.7%) for women.
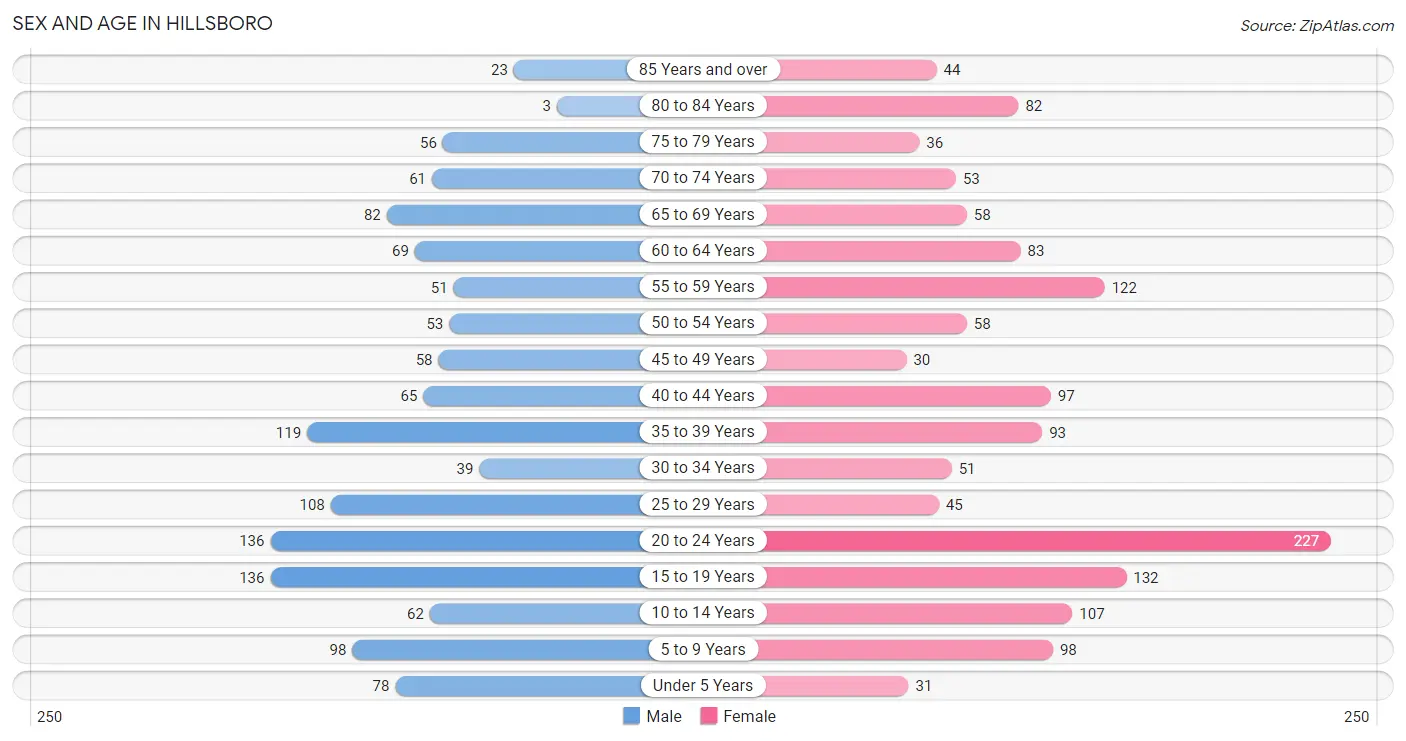
| Age Bracket | Male | Female |
| Under 5 Years | 78 (6.0%) | 31 (2.1%) |
| 5 to 9 Years | 98 (7.6%) | 98 (6.8%) |
| 10 to 14 Years | 62 (4.8%) | 107 (7.4%) |
| 15 to 19 Years | 136 (10.5%) | 132 (9.1%) |
| 20 to 24 Years | 136 (10.5%) | 227 (15.7%) |
| 25 to 29 Years | 108 (8.3%) | 45 (3.1%) |
| 30 to 34 Years | 39 (3.0%) | 51 (3.5%) |
| 35 to 39 Years | 119 (9.2%) | 93 (6.4%) |
| 40 to 44 Years | 65 (5.0%) | 97 (6.7%) |
| 45 to 49 Years | 58 (4.5%) | 30 (2.1%) |
| 50 to 54 Years | 53 (4.1%) | 58 (4.0%) |
| 55 to 59 Years | 51 (3.9%) | 122 (8.4%) |
| 60 to 64 Years | 69 (5.3%) | 83 (5.7%) |
| 65 to 69 Years | 82 (6.3%) | 58 (4.0%) |
| 70 to 74 Years | 61 (4.7%) | 53 (3.7%) |
| 75 to 79 Years | 56 (4.3%) | 36 (2.5%) |
| 80 to 84 Years | 3 (0.2%) | 82 (5.7%) |
| 85 Years and over | 23 (1.8%) | 44 (3.0%) |
| Total | 1,297 (100.0%) | 1,447 (100.0%) |
Families and Households in Hillsboro
Median Family Size in Hillsboro
The median family size in Hillsboro is 2.93 persons per family, with single male/father families (12 | 2.1%) accounting for the largest median family size of 3.25 persons per family. On the other hand, single female/mother families (63 | 11.0%) represent the smallest median family size with 2.75 persons per family.
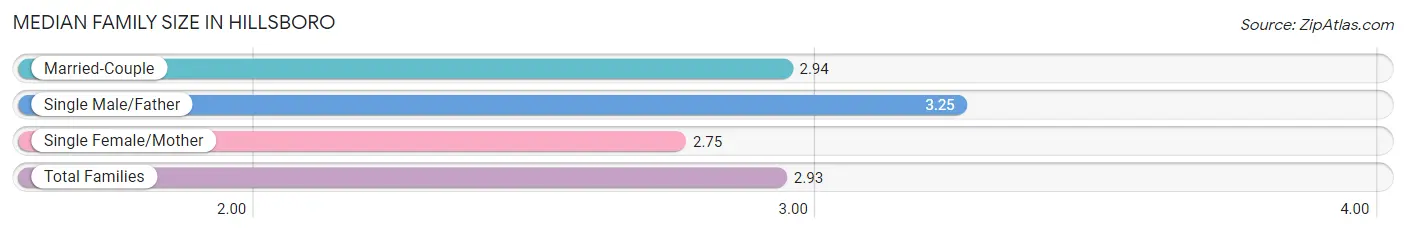
| Family Type | # Families | Family Size |
| Married-Couple | 500 (87.0%) | 2.94 |
| Single Male/Father | 12 (2.1%) | 3.25 |
| Single Female/Mother | 63 (11.0%) | 2.75 |
| Total Families | 575 (100.0%) | 2.93 |
Median Household Size in Hillsboro
The median household size in Hillsboro is 2.27 persons per household, with single male/father households (12 | 1.3%) accounting for the largest median household size of 3.25 persons per household. non-family households (373 | 39.4%) represent the smallest median household size with 1.20 persons per household.
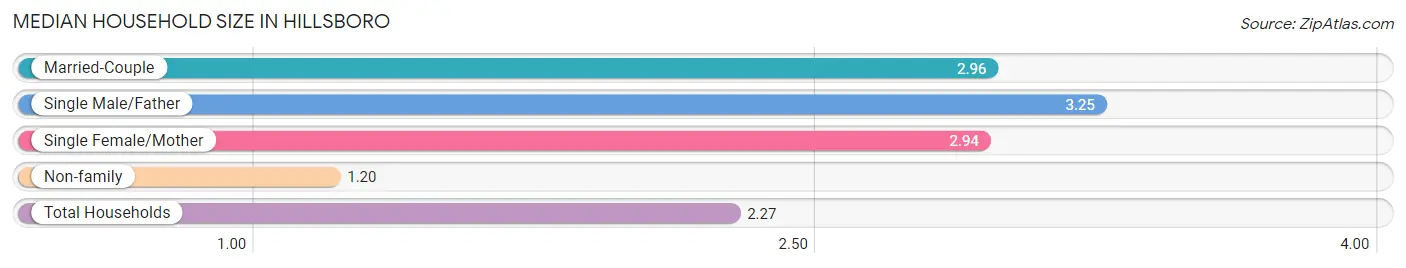
| Household Type | # Households | Household Size |
| Married-Couple | 500 (52.7%) | 2.96 |
| Single Male/Father | 12 (1.3%) | 3.25 |
| Single Female/Mother | 63 (6.7%) | 2.94 |
| Non-family | 373 (39.4%) | 1.20 |
| Total Households | 948 (100.0%) | 2.27 |
Household Size by Marriage Status in Hillsboro
Out of a total of 948 households in Hillsboro, 575 (60.7%) are family households, while 373 (39.4%) are nonfamily households. The most numerous type of family households are 2-person households, comprising 291, and the most common type of nonfamily households are 1-person households, comprising 318.
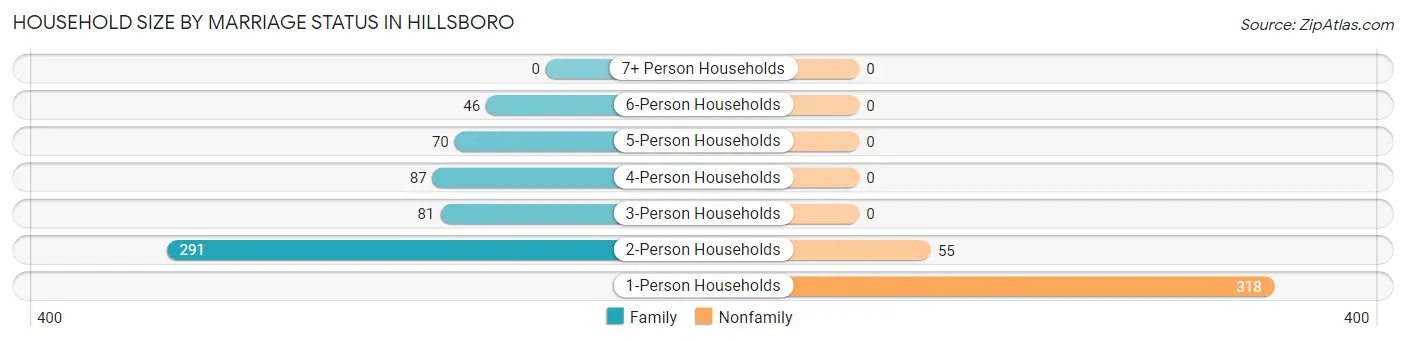
| Household Size | Family Households | Nonfamily Households |
| 1-Person Households | - | 318 (33.5%) |
| 2-Person Households | 291 (30.7%) | 55 (5.8%) |
| 3-Person Households | 81 (8.5%) | 0 (0.0%) |
| 4-Person Households | 87 (9.2%) | 0 (0.0%) |
| 5-Person Households | 70 (7.4%) | 0 (0.0%) |
| 6-Person Households | 46 (4.9%) | 0 (0.0%) |
| 7+ Person Households | 0 (0.0%) | 0 (0.0%) |
| Total | 575 (60.7%) | 373 (39.4%) |
Female Fertility in Hillsboro
Fertility by Age in Hillsboro
Average fertility rate in Hillsboro is 76.0 births per 1,000 women. Women in the age bracket of 35 to 50 years have the highest fertility rate with 133.0 births per 1,000 women. Women in the age bracket of 35 to 50 years acount for 57.7% of all women with births.
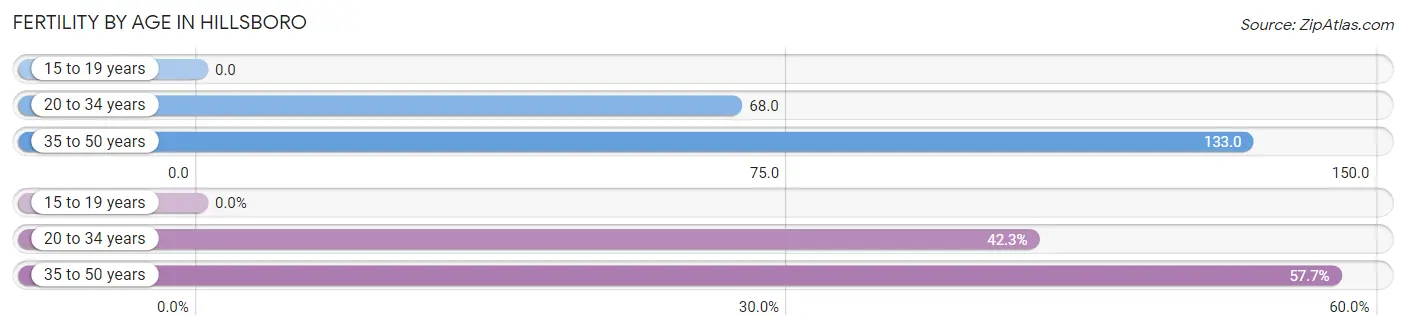
| Age Bracket | Women with Births | Births / 1,000 Women |
| 15 to 19 years | 0 (0.0%) | 0.0 |
| 20 to 34 years | 22 (42.3%) | 68.0 |
| 35 to 50 years | 30 (57.7%) | 133.0 |
| Total | 52 (100.0%) | 76.0 |
Fertility by Age by Marriage Status in Hillsboro
80.8% of women with births (52) in Hillsboro are married. The highest percentage of unmarried women with births falls into 20 to 34 years age bracket with 45.5% of them unmarried at the time of birth, while the lowest percentage of unmarried women with births belong to 35 to 50 years age bracket with 0.0% of them unmarried.
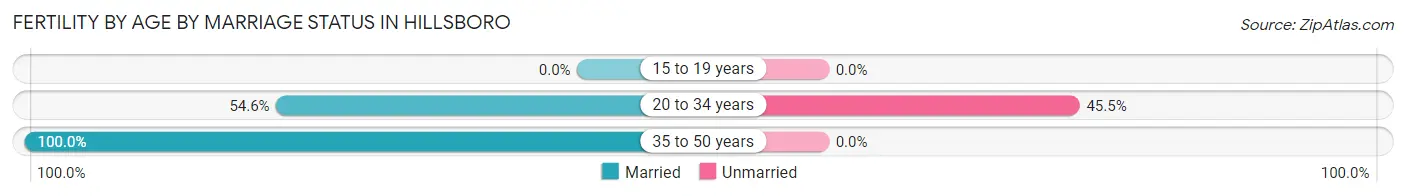
| Age Bracket | Married | Unmarried |
| 15 to 19 years | 0 (0.0%) | 0 (0.0%) |
| 20 to 34 years | 12 (54.5%) | 10 (45.5%) |
| 35 to 50 years | 30 (100.0%) | 0 (0.0%) |
| Total | 42 (80.8%) | 10 (19.2%) |
Fertility by Education in Hillsboro
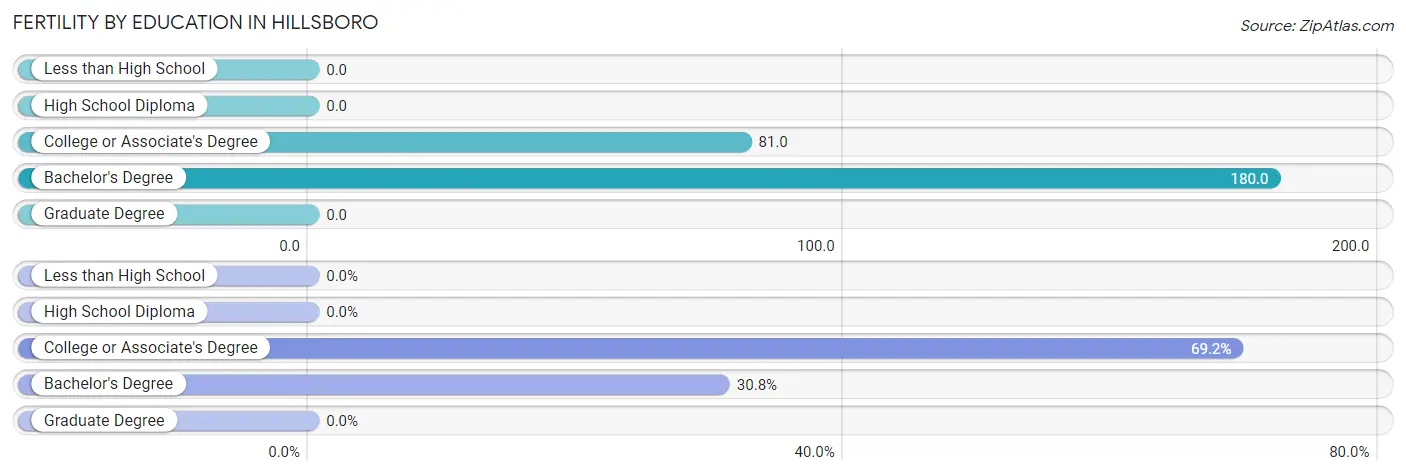
| Educational Attainment | Women with Births | Births / 1,000 Women |
| Less than High School | 0 (0.0%) | 0.0 |
| High School Diploma | 0 (0.0%) | 0.0 |
| College or Associate's Degree | 36 (69.2%) | 81.0 |
| Bachelor's Degree | 16 (30.8%) | 180.0 |
| Graduate Degree | 0 (0.0%) | 0.0 |
| Total | 52 (100.0%) | 76.0 |
Fertility by Education by Marriage Status in Hillsboro
19.2% of women with births in Hillsboro are unmarried. Women with the educational attainment of bachelor's degree are most likely to be married with 100.0% of them married at childbirth, while women with the educational attainment of college or associate's degree are least likely to be married with 27.8% of them unmarried at childbirth.
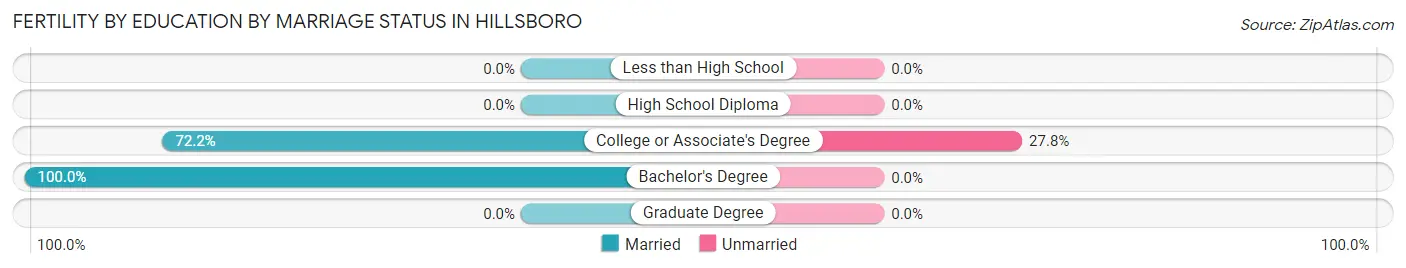
| Educational Attainment | Married | Unmarried |
| Less than High School | 0 (0.0%) | 0 (0.0%) |
| High School Diploma | 0 (0.0%) | 0 (0.0%) |
| College or Associate's Degree | 26 (72.2%) | 10 (27.8%) |
| Bachelor's Degree | 16 (100.0%) | 0 (0.0%) |
| Graduate Degree | 0 (0.0%) | 0 (0.0%) |
| Total | 42 (80.8%) | 10 (19.2%) |
Employment Characteristics in Hillsboro
Employment by Class of Employer in Hillsboro
Among the 1,242 employed individuals in Hillsboro, private company employees (672 | 54.1%), not-for-profit organizations (244 | 19.7%), and local government employees (150 | 12.1%) make up the most common classes of employment.
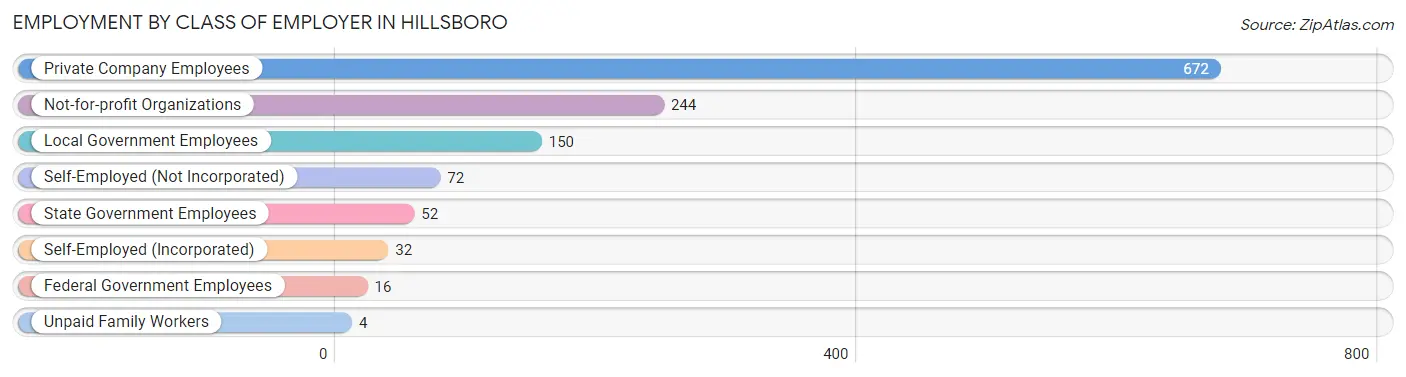
| Employer Class | # Employees | % Employees |
| Private Company Employees | 672 | 54.1% |
| Self-Employed (Incorporated) | 32 | 2.6% |
| Self-Employed (Not Incorporated) | 72 | 5.8% |
| Not-for-profit Organizations | 244 | 19.7% |
| Local Government Employees | 150 | 12.1% |
| State Government Employees | 52 | 4.2% |
| Federal Government Employees | 16 | 1.3% |
| Unpaid Family Workers | 4 | 0.3% |
| Total | 1,242 | 100.0% |
Employment Status by Age in Hillsboro
According to the labor force statistics for Hillsboro, out of the total population over 16 years of age (2,257), 58.3% or 1,316 individuals are in the labor force, with 2.4% or 32 of them unemployed. The age group with the highest labor force participation rate is 30 to 34 years, with 91.1% or 82 individuals in the labor force. Within the labor force, the 20 to 24 years age range has the highest percentage of unemployed individuals, with 10.3% or 24 of them being unemployed.
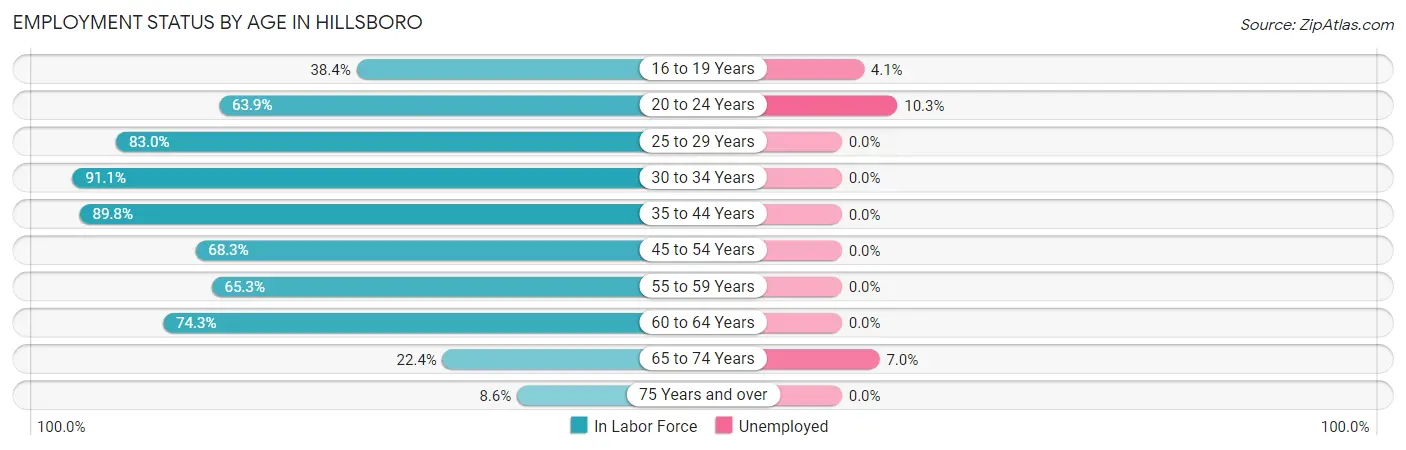
| Age Bracket | In Labor Force | Unemployed |
| 16 to 19 Years | 98 (38.4%) | 4 (4.1%) |
| 20 to 24 Years | 232 (63.9%) | 24 (10.3%) |
| 25 to 29 Years | 127 (83.0%) | 0 (0.0%) |
| 30 to 34 Years | 82 (91.1%) | 0 (0.0%) |
| 35 to 44 Years | 336 (89.8%) | 0 (0.0%) |
| 45 to 54 Years | 136 (68.3%) | 0 (0.0%) |
| 55 to 59 Years | 113 (65.3%) | 0 (0.0%) |
| 60 to 64 Years | 113 (74.3%) | 0 (0.0%) |
| 65 to 74 Years | 57 (22.4%) | 4 (7.0%) |
| 75 Years and over | 21 (8.6%) | 0 (0.0%) |
| Total | 1,316 (58.3%) | 32 (2.4%) |
Employment Status by Educational Attainment in Hillsboro
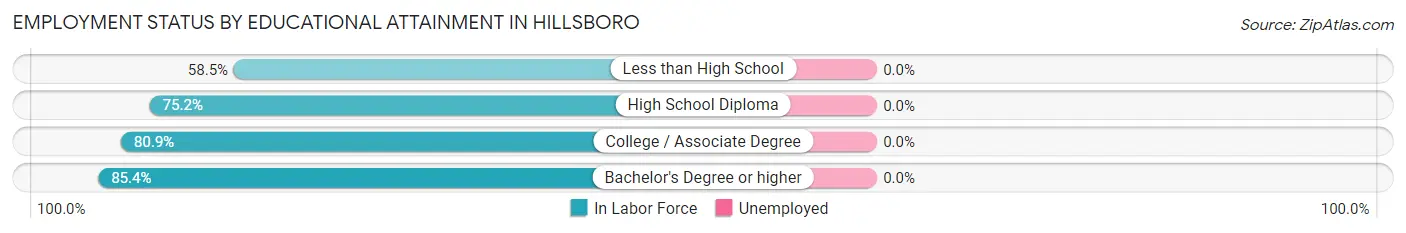
| Educational Attainment | In Labor Force | Unemployed |
| Less than High School | 38 (58.5%) | 0 (0.0%) |
| High School Diploma | 243 (75.2%) | 0 (0.0%) |
| College / Associate Degree | 310 (80.9%) | 0 (0.0%) |
| Bachelor's Degree or higher | 316 (85.4%) | 0 (0.0%) |
| Total | 907 (79.5%) | 0 (0.0%) |
Employment Occupations by Sex in Hillsboro
Management, Business, Science and Arts Occupations
The most common Management, Business, Science and Arts occupations in Hillsboro are Community & Social Service (272 | 21.2%), Education Instruction & Library (205 | 16.0%), Management (114 | 8.9%), Health Diagnosing & Treating (59 | 4.6%), and Arts, Media & Entertainment (52 | 4.1%).
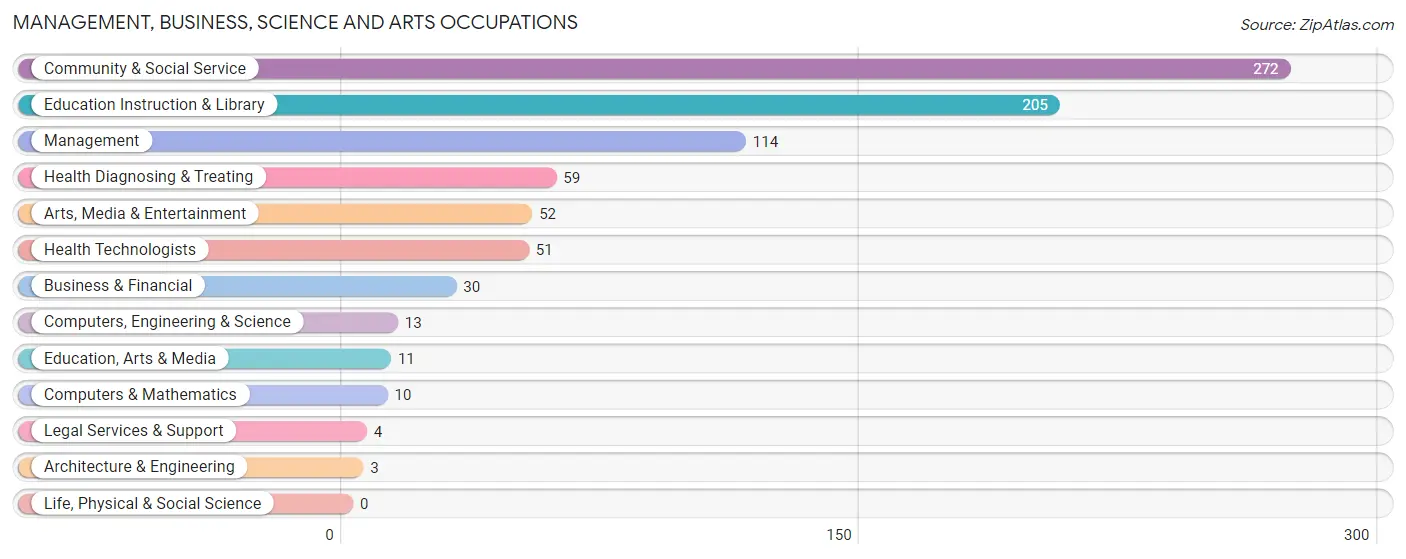
Management, Business, Science and Arts Occupations by Sex
Within the Management, Business, Science and Arts occupations in Hillsboro, the most male-oriented occupations are Computers, Engineering & Science (100.0%), Computers & Mathematics (100.0%), and Architecture & Engineering (100.0%), while the most female-oriented occupations are Legal Services & Support (100.0%), Health Technologists (88.2%), and Health Diagnosing & Treating (83.1%).
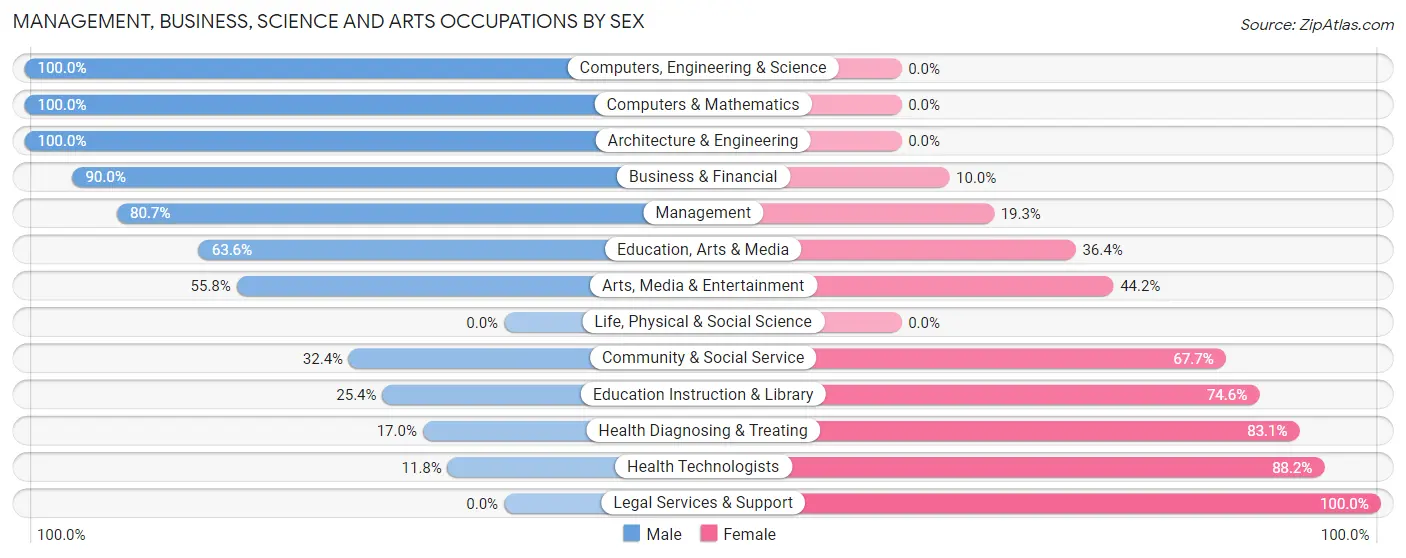
| Occupation | Male | Female |
| Management | 92 (80.7%) | 22 (19.3%) |
| Business & Financial | 27 (90.0%) | 3 (10.0%) |
| Computers, Engineering & Science | 13 (100.0%) | 0 (0.0%) |
| Computers & Mathematics | 10 (100.0%) | 0 (0.0%) |
| Architecture & Engineering | 3 (100.0%) | 0 (0.0%) |
| Life, Physical & Social Science | 0 (0.0%) | 0 (0.0%) |
| Community & Social Service | 88 (32.4%) | 184 (67.6%) |
| Education, Arts & Media | 7 (63.6%) | 4 (36.4%) |
| Legal Services & Support | 0 (0.0%) | 4 (100.0%) |
| Education Instruction & Library | 52 (25.4%) | 153 (74.6%) |
| Arts, Media & Entertainment | 29 (55.8%) | 23 (44.2%) |
| Health Diagnosing & Treating | 10 (17.0%) | 49 (83.1%) |
| Health Technologists | 6 (11.8%) | 45 (88.2%) |
| Total (Category) | 230 (47.1%) | 258 (52.9%) |
| Total (Overall) | 622 (48.5%) | 661 (51.5%) |
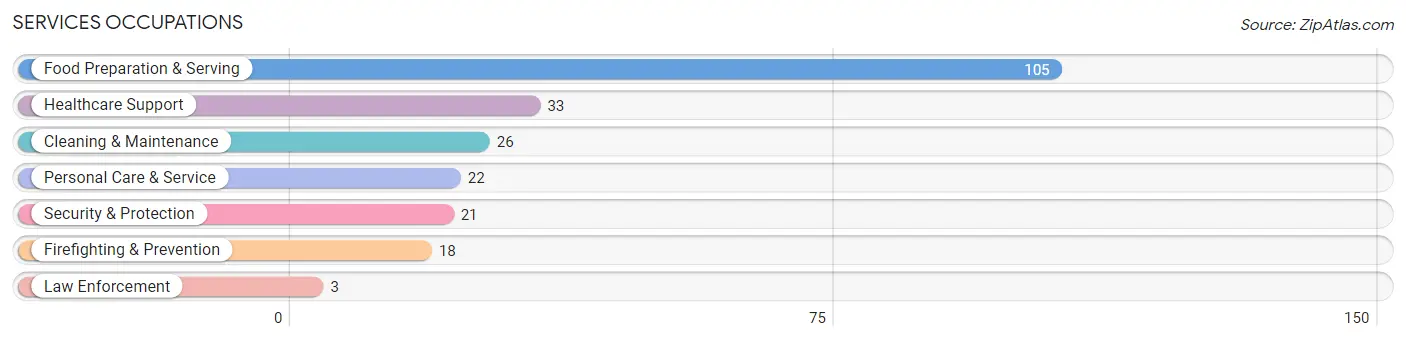
Services Occupations
The most common Services occupations in Hillsboro are Food Preparation & Serving (105 | 8.2%), Healthcare Support (33 | 2.6%), Cleaning & Maintenance (26 | 2.0%), Personal Care & Service (22 | 1.7%), and Security & Protection (21 | 1.6%).
Services Occupations by Sex
Within the Services occupations in Hillsboro, the most male-oriented occupations are Security & Protection (100.0%), Firefighting & Prevention (100.0%), and Law Enforcement (100.0%), while the most female-oriented occupations are Food Preparation & Serving (80.9%), Healthcare Support (63.6%), and Personal Care & Service (45.5%).
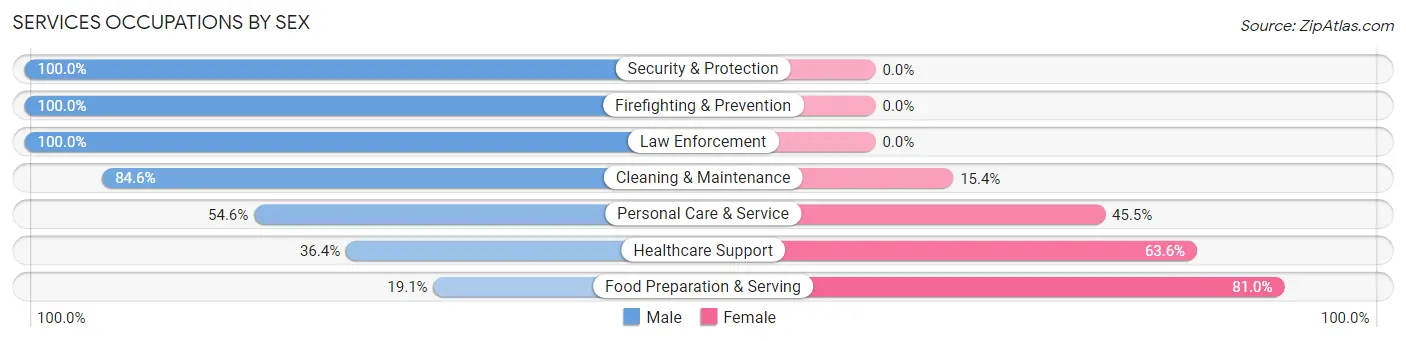
| Occupation | Male | Female |
| Healthcare Support | 12 (36.4%) | 21 (63.6%) |
| Security & Protection | 21 (100.0%) | 0 (0.0%) |
| Firefighting & Prevention | 18 (100.0%) | 0 (0.0%) |
| Law Enforcement | 3 (100.0%) | 0 (0.0%) |
| Food Preparation & Serving | 20 (19.1%) | 85 (80.9%) |
| Cleaning & Maintenance | 22 (84.6%) | 4 (15.4%) |
| Personal Care & Service | 12 (54.5%) | 10 (45.5%) |
| Total (Category) | 87 (42.0%) | 120 (58.0%) |
| Total (Overall) | 622 (48.5%) | 661 (51.5%) |
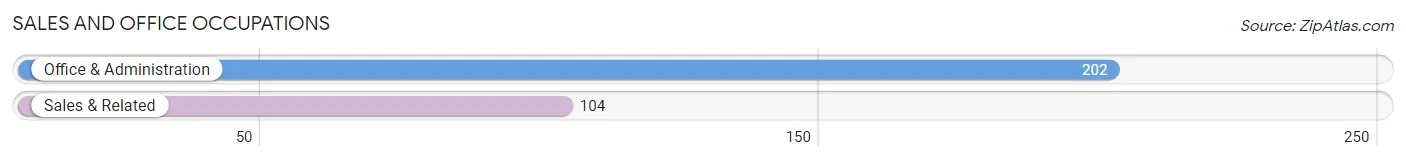
Sales and Office Occupations
The most common Sales and Office occupations in Hillsboro are Office & Administration (202 | 15.7%), and Sales & Related (104 | 8.1%).
Sales and Office Occupations by Sex
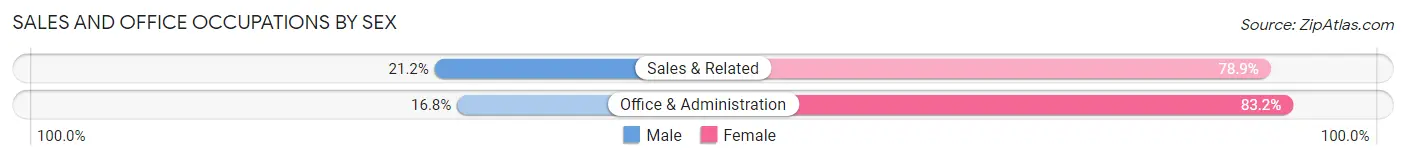
| Occupation | Male | Female |
| Sales & Related | 22 (21.1%) | 82 (78.8%) |
| Office & Administration | 34 (16.8%) | 168 (83.2%) |
| Total (Category) | 56 (18.3%) | 250 (81.7%) |
| Total (Overall) | 622 (48.5%) | 661 (51.5%) |
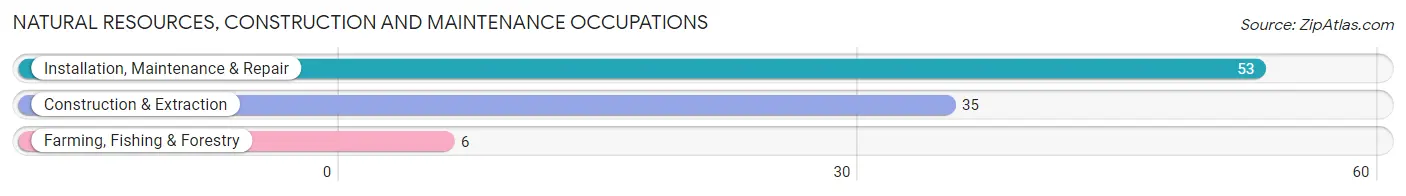
Natural Resources, Construction and Maintenance Occupations
The most common Natural Resources, Construction and Maintenance occupations in Hillsboro are Installation, Maintenance & Repair (53 | 4.1%), Construction & Extraction (35 | 2.7%), and Farming, Fishing & Forestry (6 | 0.5%).
Natural Resources, Construction and Maintenance Occupations by Sex
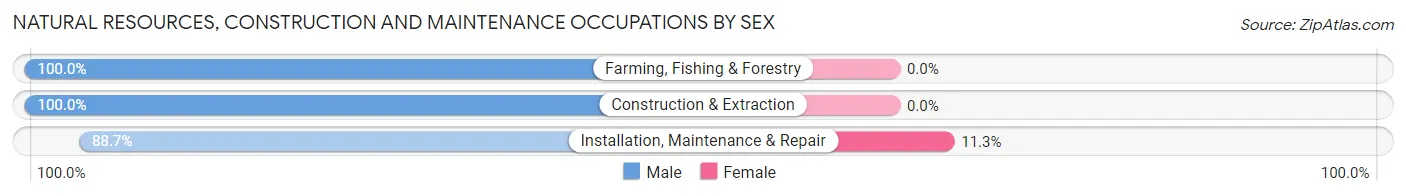
| Occupation | Male | Female |
| Farming, Fishing & Forestry | 6 (100.0%) | 0 (0.0%) |
| Construction & Extraction | 35 (100.0%) | 0 (0.0%) |
| Installation, Maintenance & Repair | 47 (88.7%) | 6 (11.3%) |
| Total (Category) | 88 (93.6%) | 6 (6.4%) |
| Total (Overall) | 622 (48.5%) | 661 (51.5%) |
Production, Transportation and Moving Occupations
The most common Production, Transportation and Moving occupations in Hillsboro are Production (97 | 7.6%), Transportation (57 | 4.4%), and Material Moving (34 | 2.6%).
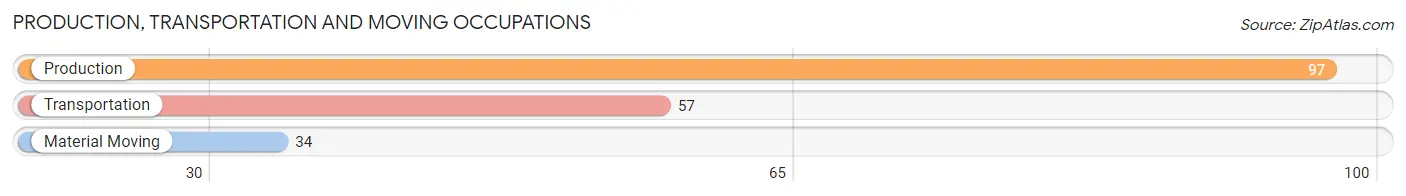
Production, Transportation and Moving Occupations by Sex
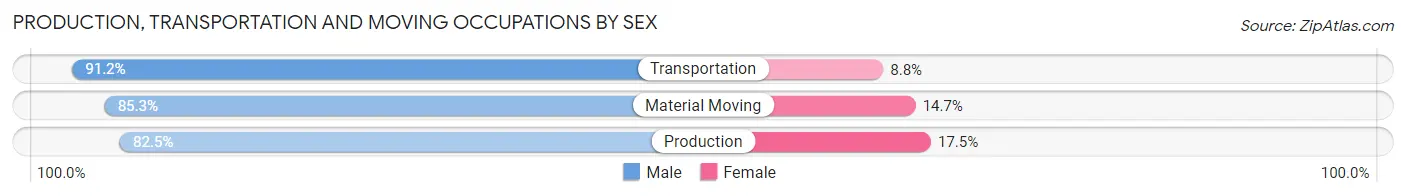
| Occupation | Male | Female |
| Production | 80 (82.5%) | 17 (17.5%) |
| Transportation | 52 (91.2%) | 5 (8.8%) |
| Material Moving | 29 (85.3%) | 5 (14.7%) |
| Total (Category) | 161 (85.6%) | 27 (14.4%) |
| Total (Overall) | 622 (48.5%) | 661 (51.5%) |
Employment Industries by Sex in Hillsboro
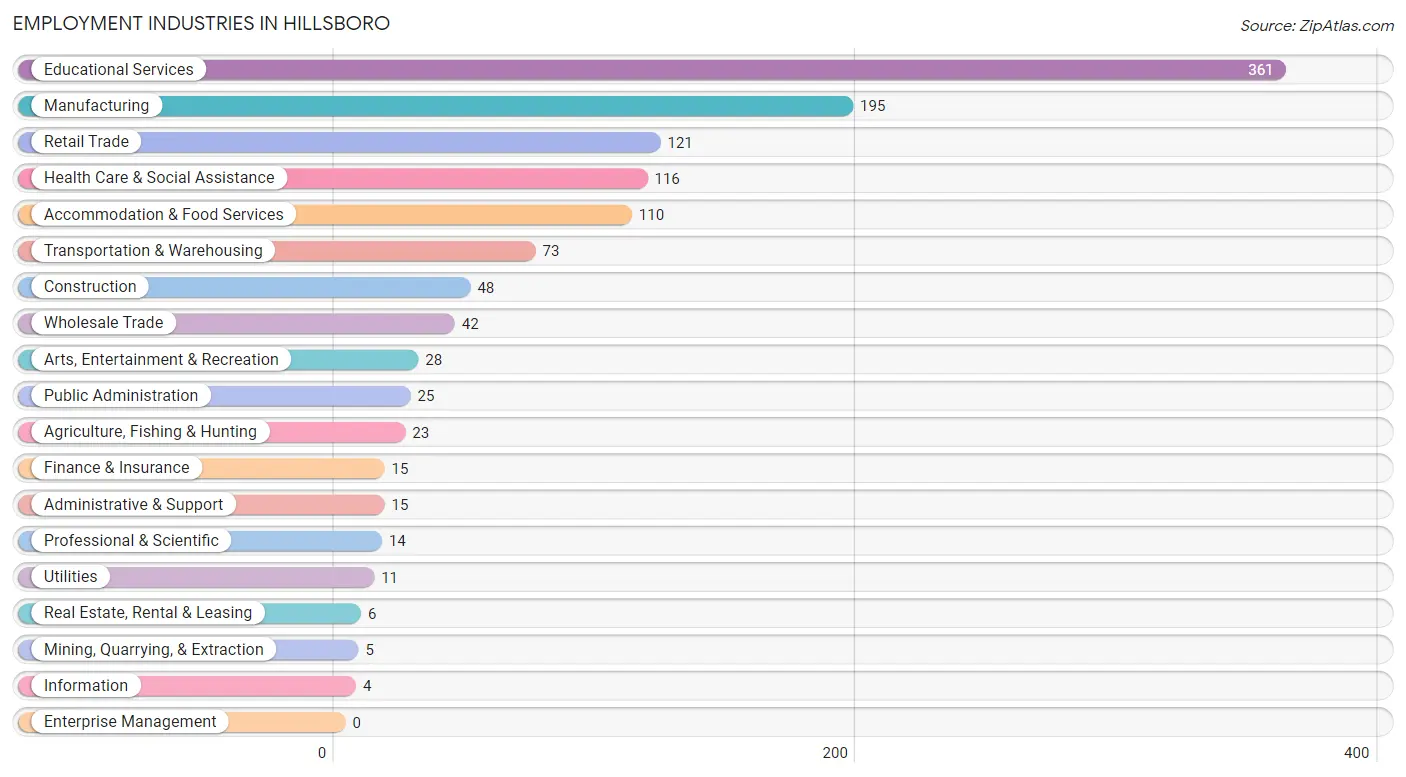
Employment Industries in Hillsboro
The major employment industries in Hillsboro include Educational Services (361 | 28.1%), Manufacturing (195 | 15.2%), Retail Trade (121 | 9.4%), Health Care & Social Assistance (116 | 9.0%), and Accommodation & Food Services (110 | 8.6%).
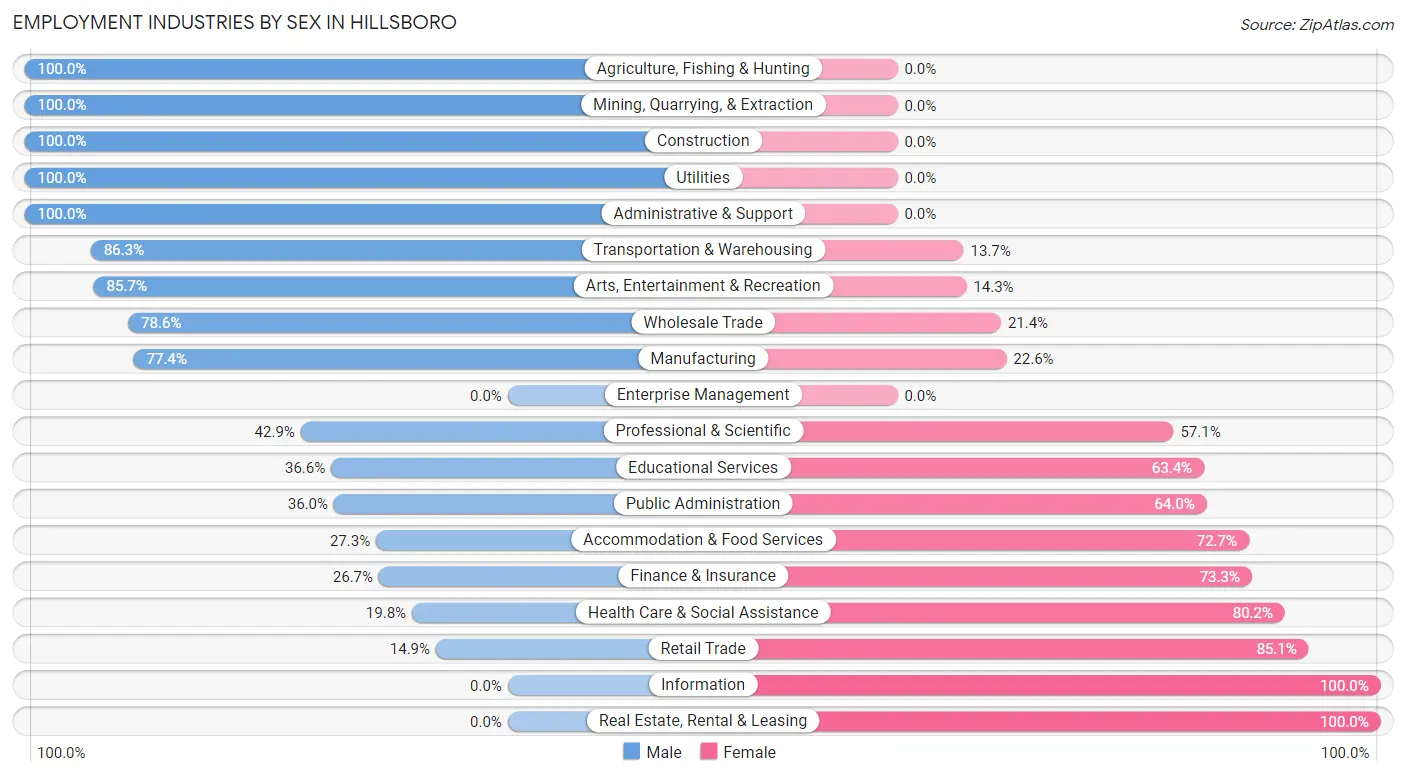
Employment Industries by Sex in Hillsboro
The Hillsboro industries that see more men than women are Agriculture, Fishing & Hunting (100.0%), Mining, Quarrying, & Extraction (100.0%), and Construction (100.0%), whereas the industries that tend to have a higher number of women are Information (100.0%), Real Estate, Rental & Leasing (100.0%), and Retail Trade (85.1%).
| Industry | Male | Female |
| Agriculture, Fishing & Hunting | 23 (100.0%) | 0 (0.0%) |
| Mining, Quarrying, & Extraction | 5 (100.0%) | 0 (0.0%) |
| Construction | 48 (100.0%) | 0 (0.0%) |
| Manufacturing | 151 (77.4%) | 44 (22.6%) |
| Wholesale Trade | 33 (78.6%) | 9 (21.4%) |
| Retail Trade | 18 (14.9%) | 103 (85.1%) |
| Transportation & Warehousing | 63 (86.3%) | 10 (13.7%) |
| Utilities | 11 (100.0%) | 0 (0.0%) |
| Information | 0 (0.0%) | 4 (100.0%) |
| Finance & Insurance | 4 (26.7%) | 11 (73.3%) |
| Real Estate, Rental & Leasing | 0 (0.0%) | 6 (100.0%) |
| Professional & Scientific | 6 (42.9%) | 8 (57.1%) |
| Enterprise Management | 0 (0.0%) | 0 (0.0%) |
| Administrative & Support | 15 (100.0%) | 0 (0.0%) |
| Educational Services | 132 (36.6%) | 229 (63.4%) |
| Health Care & Social Assistance | 23 (19.8%) | 93 (80.2%) |
| Arts, Entertainment & Recreation | 24 (85.7%) | 4 (14.3%) |
| Accommodation & Food Services | 30 (27.3%) | 80 (72.7%) |
| Public Administration | 9 (36.0%) | 16 (64.0%) |
| Total | 622 (48.5%) | 661 (51.5%) |
Education in Hillsboro
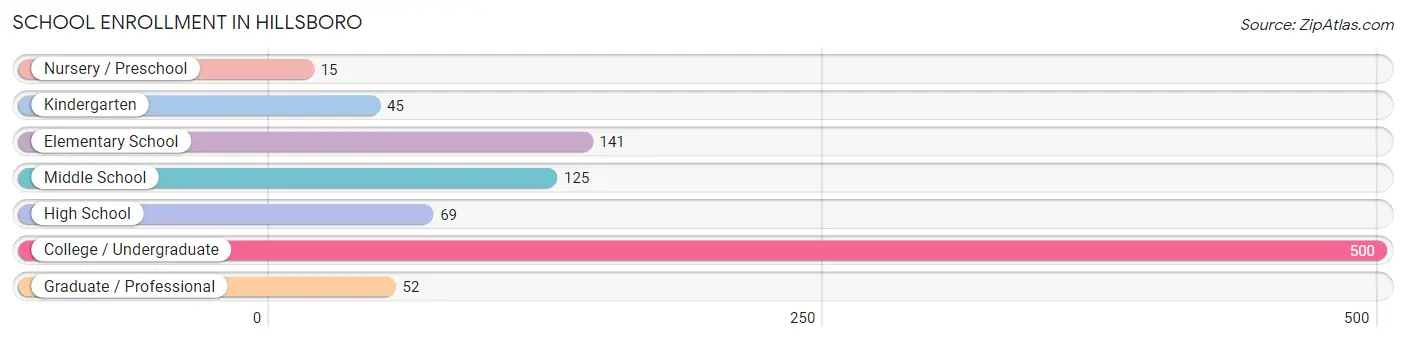
School Enrollment in Hillsboro
The most common levels of schooling among the 947 students in Hillsboro are college / undergraduate (500 | 52.8%), elementary school (141 | 14.9%), and middle school (125 | 13.2%).
| School Level | # Students | % Students |
| Nursery / Preschool | 15 | 1.6% |
| Kindergarten | 45 | 4.8% |
| Elementary School | 141 | 14.9% |
| Middle School | 125 | 13.2% |
| High School | 69 | 7.3% |
| College / Undergraduate | 500 | 52.8% |
| Graduate / Professional | 52 | 5.5% |
| Total | 947 | 100.0% |
School Enrollment by Age by Funding Source in Hillsboro
Out of a total of 947 students who are enrolled in schools in Hillsboro, 415 (43.8%) attend a private institution, while the remaining 532 (56.2%) are enrolled in public schools. The age group of 20 to 24 year olds has the highest likelihood of being enrolled in private schools, with 252 (89.4% in the age bracket) enrolled. Conversely, the age group of 3 to 4 year olds has the lowest likelihood of being enrolled in a private school, with 8 (100.0% in the age bracket) attending a public institution.
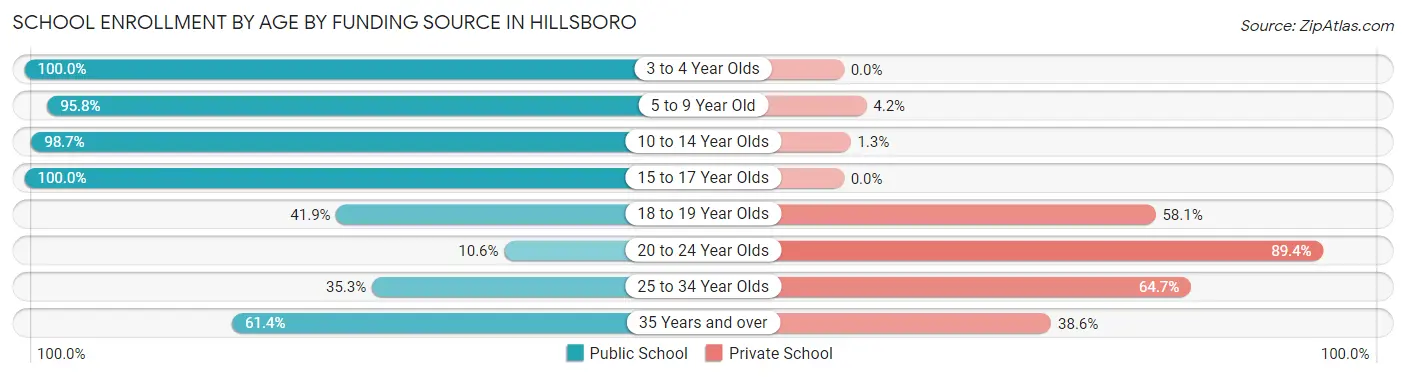
| Age Bracket | Public School | Private School |
| 3 to 4 Year Olds | 8 (100.0%) | 0 (0.0%) |
| 5 to 9 Year Old | 159 (95.8%) | 7 (4.2%) |
| 10 to 14 Year Olds | 157 (98.7%) | 2 (1.3%) |
| 15 to 17 Year Olds | 56 (100.0%) | 0 (0.0%) |
| 18 to 19 Year Olds | 83 (41.9%) | 115 (58.1%) |
| 20 to 24 Year Olds | 30 (10.6%) | 252 (89.4%) |
| 25 to 34 Year Olds | 12 (35.3%) | 22 (64.7%) |
| 35 Years and over | 27 (61.4%) | 17 (38.6%) |
| Total | 532 (56.2%) | 415 (43.8%) |
Educational Attainment by Field of Study in Hillsboro
Education (198 | 36.7%), business (79 | 14.7%), liberal arts & history (50 | 9.3%), science & technology (45 | 8.4%), and arts & humanities (44 | 8.2%) are the most common fields of study among 539 individuals in Hillsboro who have obtained a bachelor's degree or higher.
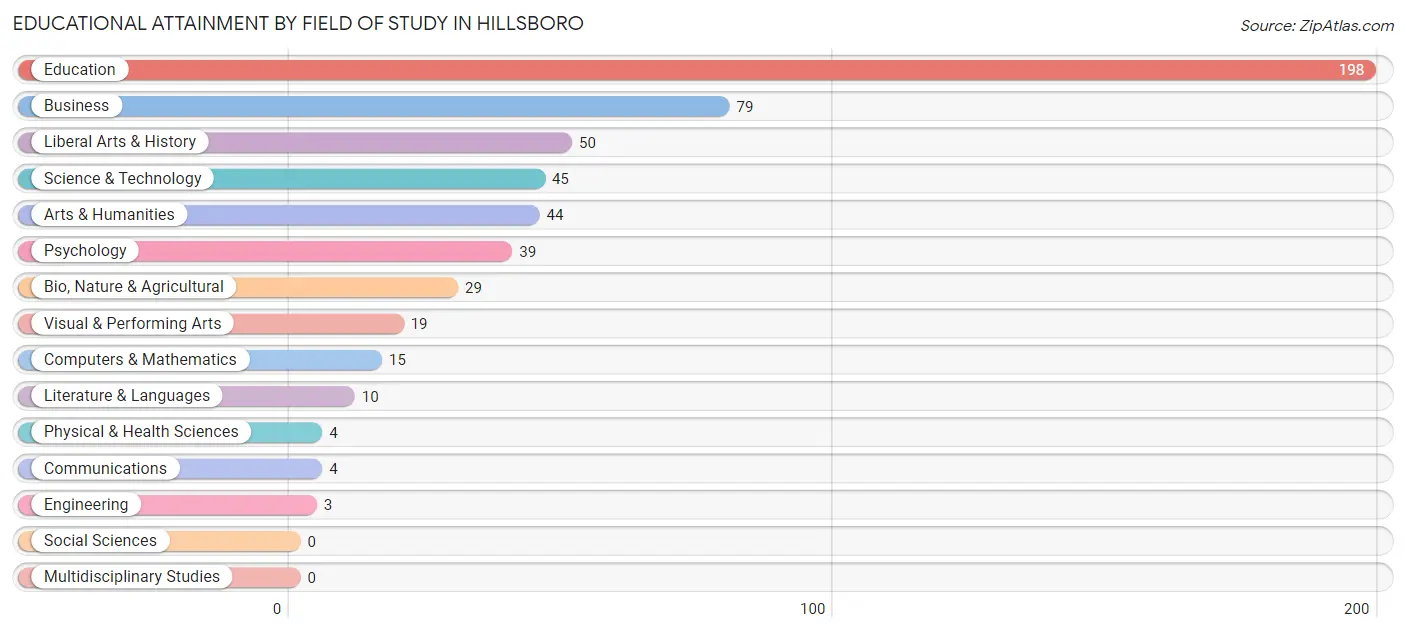
| Field of Study | # Graduates | % Graduates |
| Computers & Mathematics | 15 | 2.8% |
| Bio, Nature & Agricultural | 29 | 5.4% |
| Physical & Health Sciences | 4 | 0.7% |
| Psychology | 39 | 7.2% |
| Social Sciences | 0 | 0.0% |
| Engineering | 3 | 0.6% |
| Multidisciplinary Studies | 0 | 0.0% |
| Science & Technology | 45 | 8.4% |
| Business | 79 | 14.7% |
| Education | 198 | 36.7% |
| Literature & Languages | 10 | 1.9% |
| Liberal Arts & History | 50 | 9.3% |
| Visual & Performing Arts | 19 | 3.5% |
| Communications | 4 | 0.7% |
| Arts & Humanities | 44 | 8.2% |
| Total | 539 | 100.0% |
Transportation & Commute in Hillsboro
Vehicle Availability by Sex in Hillsboro
The most prevalent vehicle ownership categories in Hillsboro are males with 2 vehicles (219, accounting for 39.2%) and females with 2 vehicles (231, making up 43.0%).
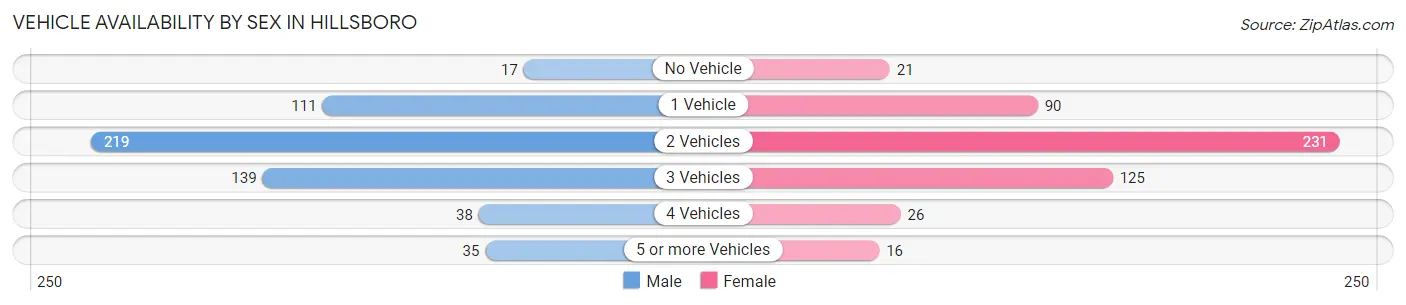
| Vehicles Available | Male | Female |
| No Vehicle | 17 (3.0%) | 21 (4.1%) |
| 1 Vehicle | 111 (19.9%) | 90 (17.7%) |
| 2 Vehicles | 219 (39.2%) | 231 (45.4%) |
| 3 Vehicles | 139 (24.9%) | 125 (24.6%) |
| 4 Vehicles | 38 (6.8%) | 26 (5.1%) |
| 5 or more Vehicles | 35 (6.3%) | 16 (3.1%) |
| Total | 559 (100.0%) | 509 (100.0%) |
Commute Time in Hillsboro
The most frequently occuring commute durations in Hillsboro are 5 to 9 minutes (422 commuters, 36.6%), less than 5 minutes (296 commuters, 25.7%), and 30 to 34 minutes (160 commuters, 13.9%).
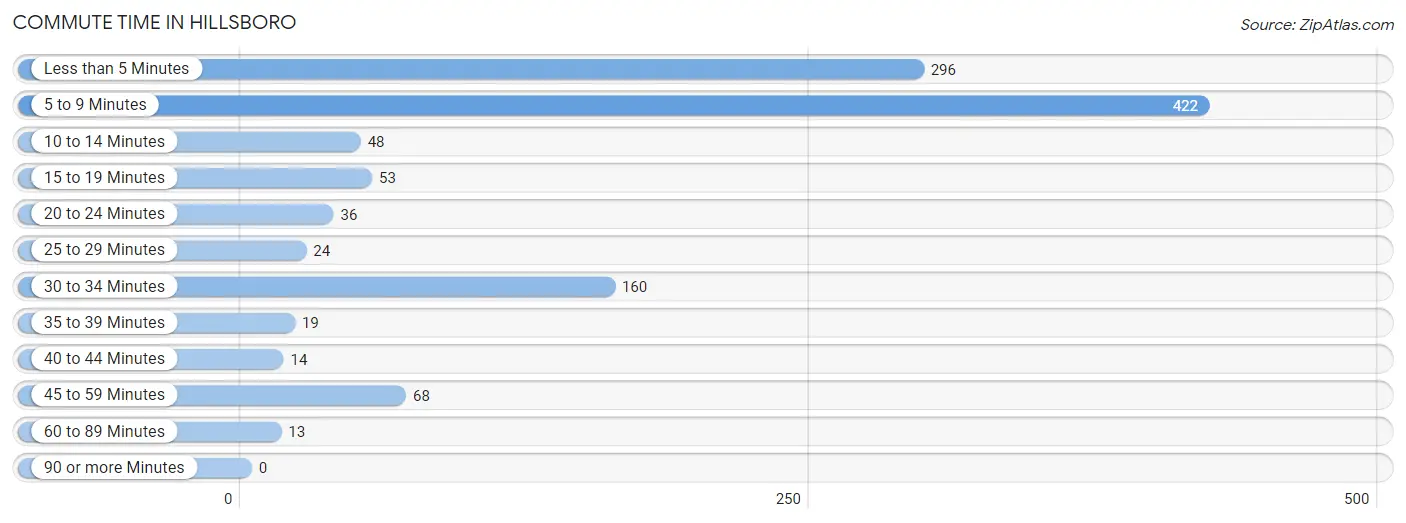
| Commute Time | # Commuters | % Commuters |
| Less than 5 Minutes | 296 | 25.7% |
| 5 to 9 Minutes | 422 | 36.6% |
| 10 to 14 Minutes | 48 | 4.2% |
| 15 to 19 Minutes | 53 | 4.6% |
| 20 to 24 Minutes | 36 | 3.1% |
| 25 to 29 Minutes | 24 | 2.1% |
| 30 to 34 Minutes | 160 | 13.9% |
| 35 to 39 Minutes | 19 | 1.7% |
| 40 to 44 Minutes | 14 | 1.2% |
| 45 to 59 Minutes | 68 | 5.9% |
| 60 to 89 Minutes | 13 | 1.1% |
| 90 or more Minutes | 0 | 0.0% |
Commute Time by Sex in Hillsboro
The most common commute times in Hillsboro are 5 to 9 minutes (189 commuters, 32.7%) for males and 5 to 9 minutes (233 commuters, 40.5%) for females.
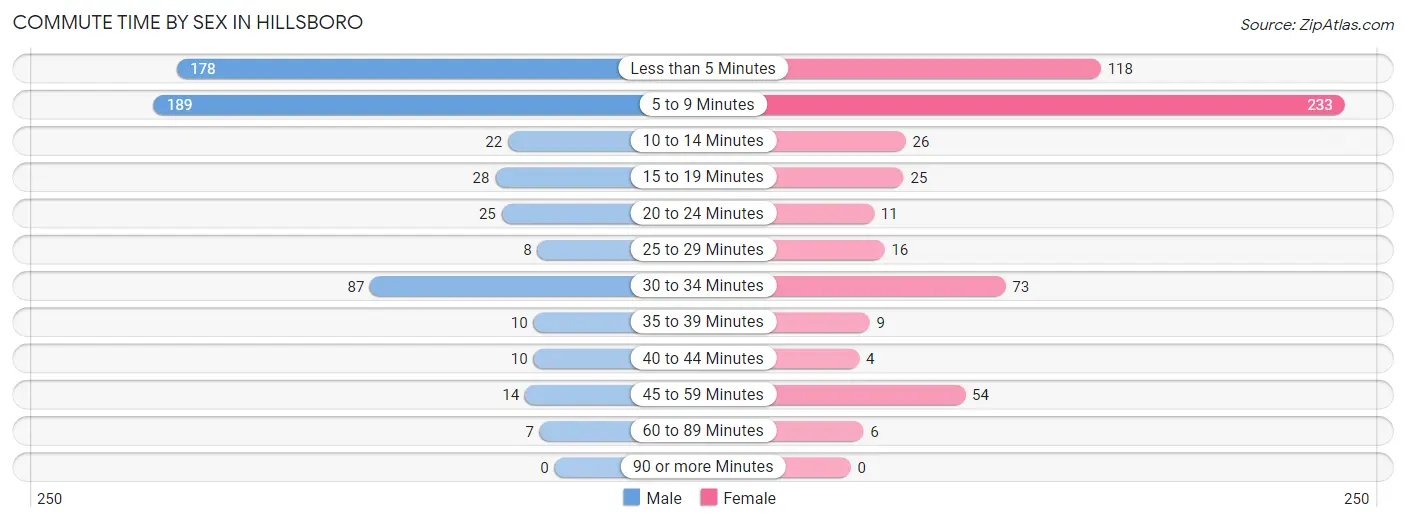
| Commute Time | Male | Female |
| Less than 5 Minutes | 178 (30.8%) | 118 (20.5%) |
| 5 to 9 Minutes | 189 (32.7%) | 233 (40.5%) |
| 10 to 14 Minutes | 22 (3.8%) | 26 (4.5%) |
| 15 to 19 Minutes | 28 (4.8%) | 25 (4.3%) |
| 20 to 24 Minutes | 25 (4.3%) | 11 (1.9%) |
| 25 to 29 Minutes | 8 (1.4%) | 16 (2.8%) |
| 30 to 34 Minutes | 87 (15.0%) | 73 (12.7%) |
| 35 to 39 Minutes | 10 (1.7%) | 9 (1.6%) |
| 40 to 44 Minutes | 10 (1.7%) | 4 (0.7%) |
| 45 to 59 Minutes | 14 (2.4%) | 54 (9.4%) |
| 60 to 89 Minutes | 7 (1.2%) | 6 (1.0%) |
| 90 or more Minutes | 0 (0.0%) | 0 (0.0%) |
Time of Departure to Work by Sex in Hillsboro
The most frequent times of departure to work in Hillsboro are 7:30 AM to 7:59 AM (102, 17.6%) for males and 12:00 PM to 3:59 PM (121, 21.0%) for females.
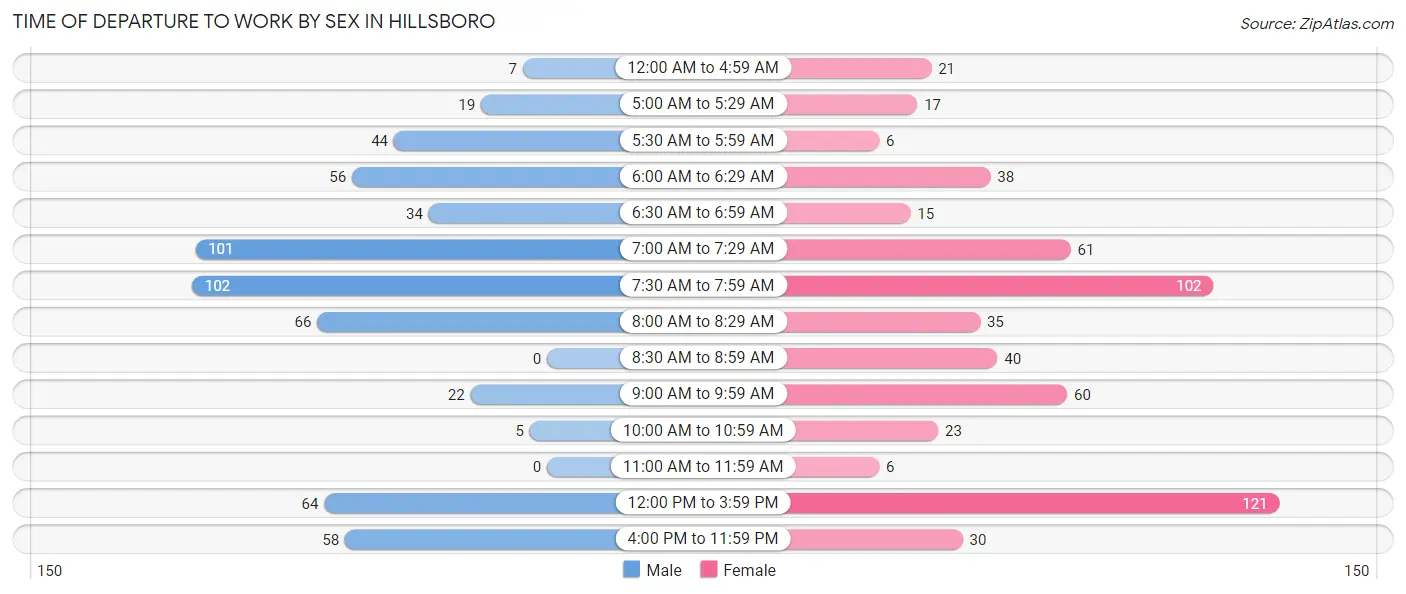
| Time of Departure | Male | Female |
| 12:00 AM to 4:59 AM | 7 (1.2%) | 21 (3.6%) |
| 5:00 AM to 5:29 AM | 19 (3.3%) | 17 (3.0%) |
| 5:30 AM to 5:59 AM | 44 (7.6%) | 6 (1.0%) |
| 6:00 AM to 6:29 AM | 56 (9.7%) | 38 (6.6%) |
| 6:30 AM to 6:59 AM | 34 (5.9%) | 15 (2.6%) |
| 7:00 AM to 7:29 AM | 101 (17.5%) | 61 (10.6%) |
| 7:30 AM to 7:59 AM | 102 (17.6%) | 102 (17.7%) |
| 8:00 AM to 8:29 AM | 66 (11.4%) | 35 (6.1%) |
| 8:30 AM to 8:59 AM | 0 (0.0%) | 40 (7.0%) |
| 9:00 AM to 9:59 AM | 22 (3.8%) | 60 (10.4%) |
| 10:00 AM to 10:59 AM | 5 (0.9%) | 23 (4.0%) |
| 11:00 AM to 11:59 AM | 0 (0.0%) | 6 (1.0%) |
| 12:00 PM to 3:59 PM | 64 (11.1%) | 121 (21.0%) |
| 4:00 PM to 11:59 PM | 58 (10.0%) | 30 (5.2%) |
| Total | 578 (100.0%) | 575 (100.0%) |
Housing Occupancy in Hillsboro
Occupancy by Ownership in Hillsboro
Of the total 948 dwellings in Hillsboro, owner-occupied units account for 716 (75.5%), while renter-occupied units make up 232 (24.5%).
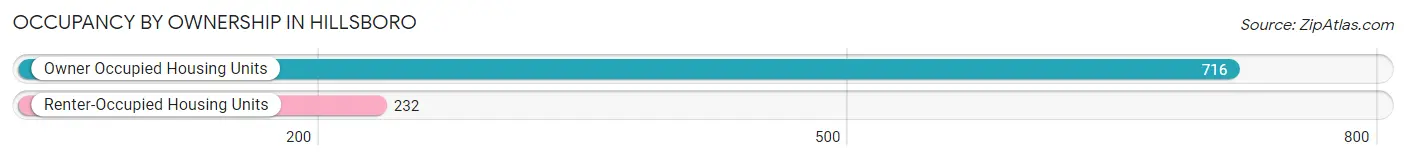
| Occupancy | # Housing Units | % Housing Units |
| Owner Occupied Housing Units | 716 | 75.5% |
| Renter-Occupied Housing Units | 232 | 24.5% |
| Total Occupied Housing Units | 948 | 100.0% |
Occupancy by Household Size in Hillsboro
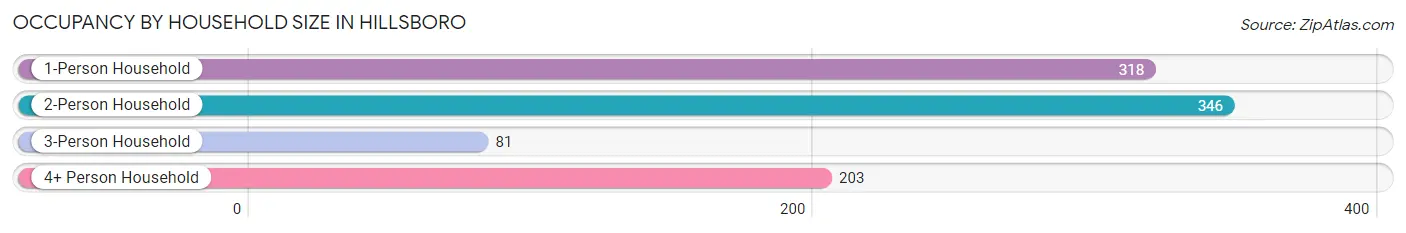
| Household Size | # Housing Units | % Housing Units |
| 1-Person Household | 318 | 33.5% |
| 2-Person Household | 346 | 36.5% |
| 3-Person Household | 81 | 8.5% |
| 4+ Person Household | 203 | 21.4% |
| Total Housing Units | 948 | 100.0% |
Occupancy by Ownership by Household Size in Hillsboro
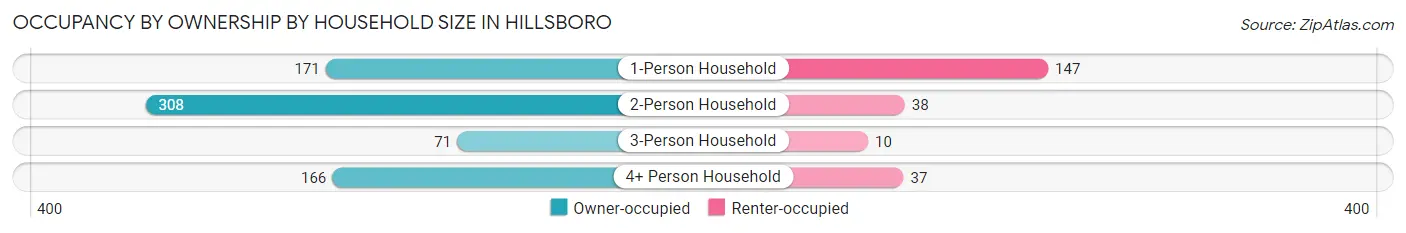
| Household Size | Owner-occupied | Renter-occupied |
| 1-Person Household | 171 (53.8%) | 147 (46.2%) |
| 2-Person Household | 308 (89.0%) | 38 (11.0%) |
| 3-Person Household | 71 (87.6%) | 10 (12.3%) |
| 4+ Person Household | 166 (81.8%) | 37 (18.2%) |
| Total Housing Units | 716 (75.5%) | 232 (24.5%) |
Occupancy by Educational Attainment in Hillsboro
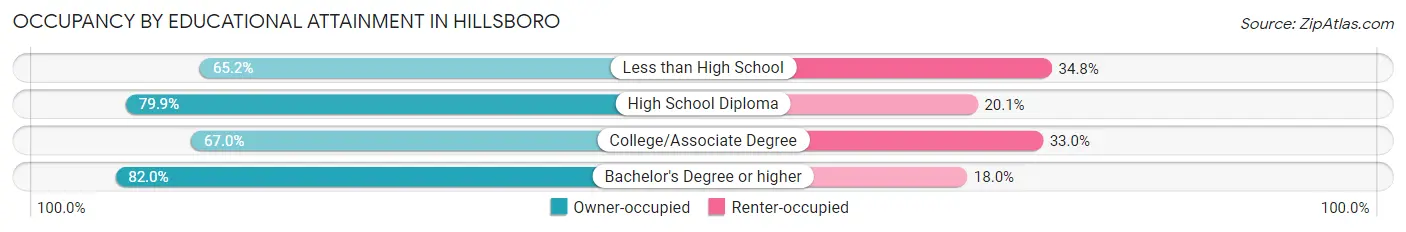
| Household Size | Owner-occupied | Renter-occupied |
| Less than High School | 30 (65.2%) | 16 (34.8%) |
| High School Diploma | 191 (79.9%) | 48 (20.1%) |
| College/Associate Degree | 217 (67.0%) | 107 (33.0%) |
| Bachelor's Degree or higher | 278 (82.0%) | 61 (18.0%) |
Occupancy by Age of Householder in Hillsboro
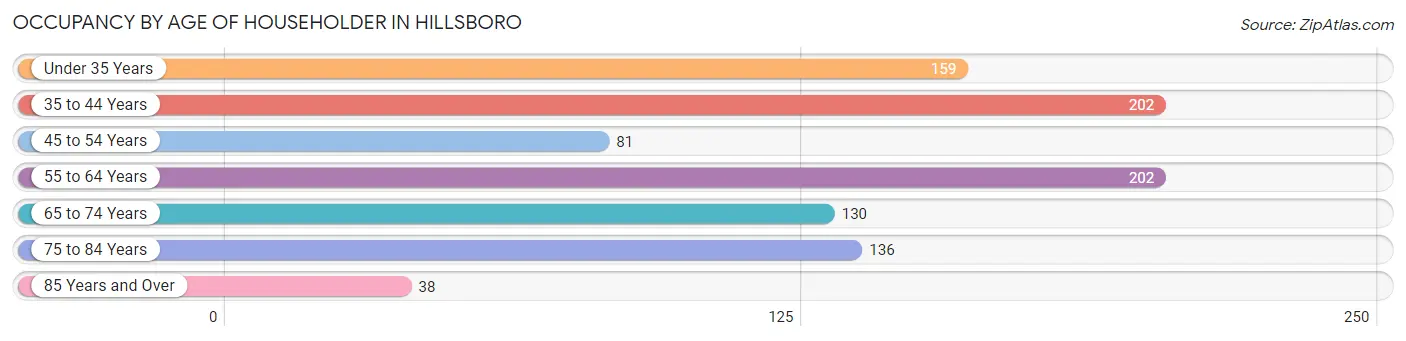
| Age Bracket | # Households | % Households |
| Under 35 Years | 159 | 16.8% |
| 35 to 44 Years | 202 | 21.3% |
| 45 to 54 Years | 81 | 8.5% |
| 55 to 64 Years | 202 | 21.3% |
| 65 to 74 Years | 130 | 13.7% |
| 75 to 84 Years | 136 | 14.3% |
| 85 Years and Over | 38 | 4.0% |
| Total | 948 | 100.0% |
Housing Finances in Hillsboro
Median Income by Occupancy in Hillsboro
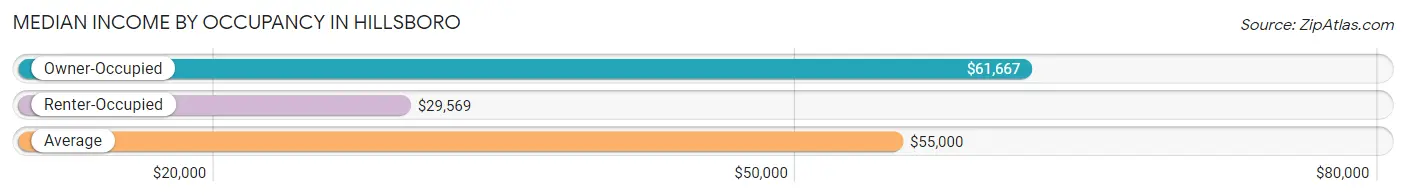
| Occupancy Type | # Households | Median Income |
| Owner-Occupied | 716 (75.5%) | $61,667 |
| Renter-Occupied | 232 (24.5%) | $29,569 |
| Average | 948 (100.0%) | $55,000 |
Occupancy by Householder Income Bracket in Hillsboro
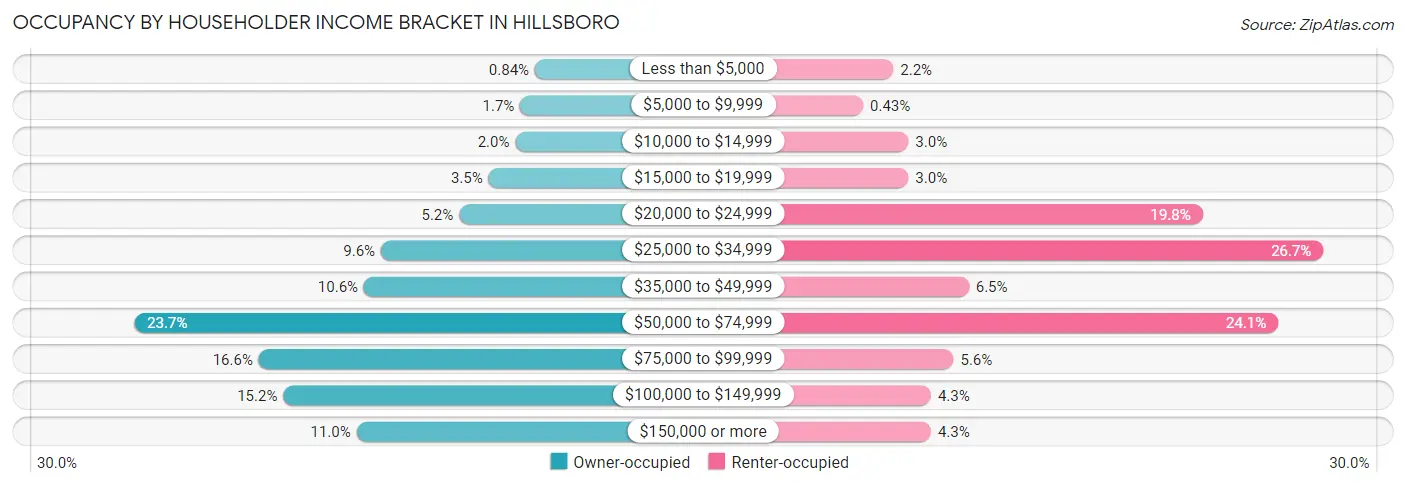
| Income Bracket | Owner-occupied | Renter-occupied |
| Less than $5,000 | 6 (0.8%) | 5 (2.2%) |
| $5,000 to $9,999 | 12 (1.7%) | 1 (0.4%) |
| $10,000 to $14,999 | 14 (2.0%) | 7 (3.0%) |
| $15,000 to $19,999 | 25 (3.5%) | 7 (3.0%) |
| $20,000 to $24,999 | 37 (5.2%) | 46 (19.8%) |
| $25,000 to $34,999 | 69 (9.6%) | 62 (26.7%) |
| $35,000 to $49,999 | 76 (10.6%) | 15 (6.5%) |
| $50,000 to $74,999 | 170 (23.7%) | 56 (24.1%) |
| $75,000 to $99,999 | 119 (16.6%) | 13 (5.6%) |
| $100,000 to $149,999 | 109 (15.2%) | 10 (4.3%) |
| $150,000 or more | 79 (11.0%) | 10 (4.3%) |
| Total | 716 (100.0%) | 232 (100.0%) |
Monthly Housing Cost Tiers in Hillsboro
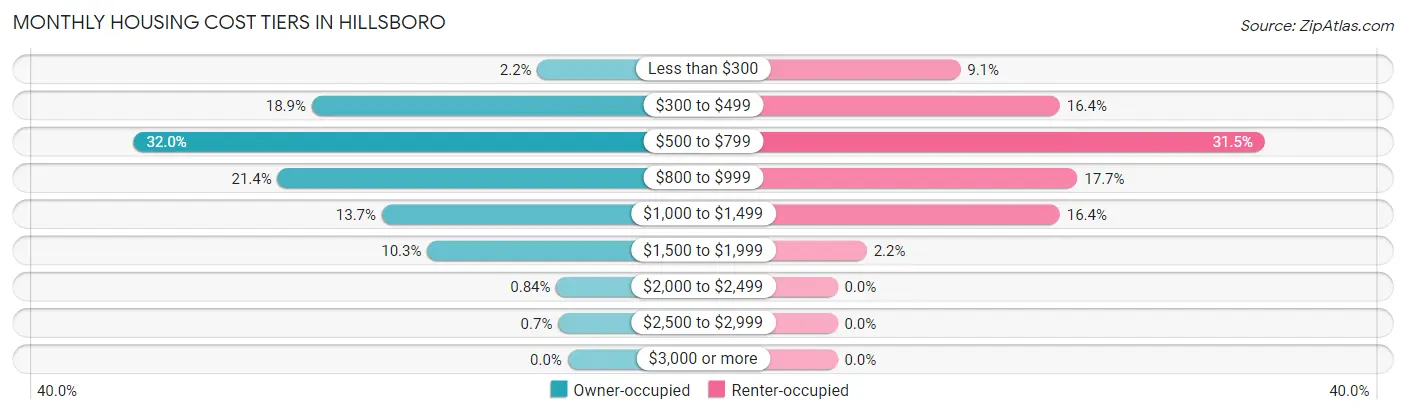
| Monthly Cost | Owner-occupied | Renter-occupied |
| Less than $300 | 16 (2.2%) | 21 (9.0%) |
| $300 to $499 | 135 (18.9%) | 38 (16.4%) |
| $500 to $799 | 229 (32.0%) | 73 (31.5%) |
| $800 to $999 | 153 (21.4%) | 41 (17.7%) |
| $1,000 to $1,499 | 98 (13.7%) | 38 (16.4%) |
| $1,500 to $1,999 | 74 (10.3%) | 5 (2.2%) |
| $2,000 to $2,499 | 6 (0.8%) | 0 (0.0%) |
| $2,500 to $2,999 | 5 (0.7%) | 0 (0.0%) |
| $3,000 or more | 0 (0.0%) | 0 (0.0%) |
| Total | 716 (100.0%) | 232 (100.0%) |
Physical Housing Characteristics in Hillsboro
Housing Structures in Hillsboro
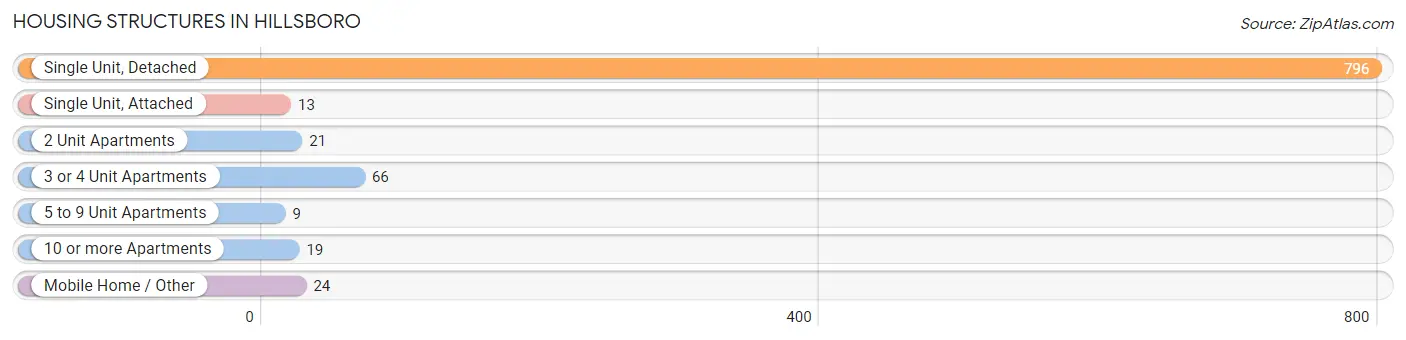
| Structure Type | # Housing Units | % Housing Units |
| Single Unit, Detached | 796 | 84.0% |
| Single Unit, Attached | 13 | 1.4% |
| 2 Unit Apartments | 21 | 2.2% |
| 3 or 4 Unit Apartments | 66 | 7.0% |
| 5 to 9 Unit Apartments | 9 | 0.9% |
| 10 or more Apartments | 19 | 2.0% |
| Mobile Home / Other | 24 | 2.5% |
| Total | 948 | 100.0% |
Housing Structures by Occupancy in Hillsboro
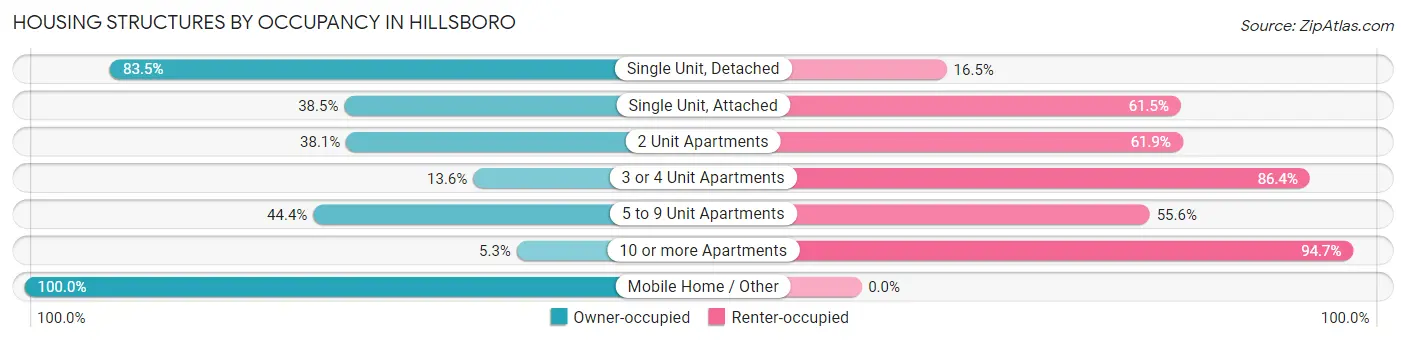
| Structure Type | Owner-occupied | Renter-occupied |
| Single Unit, Detached | 665 (83.5%) | 131 (16.5%) |
| Single Unit, Attached | 5 (38.5%) | 8 (61.5%) |
| 2 Unit Apartments | 8 (38.1%) | 13 (61.9%) |
| 3 or 4 Unit Apartments | 9 (13.6%) | 57 (86.4%) |
| 5 to 9 Unit Apartments | 4 (44.4%) | 5 (55.6%) |
| 10 or more Apartments | 1 (5.3%) | 18 (94.7%) |
| Mobile Home / Other | 24 (100.0%) | 0 (0.0%) |
| Total | 716 (75.5%) | 232 (24.5%) |
Housing Structures by Number of Rooms in Hillsboro
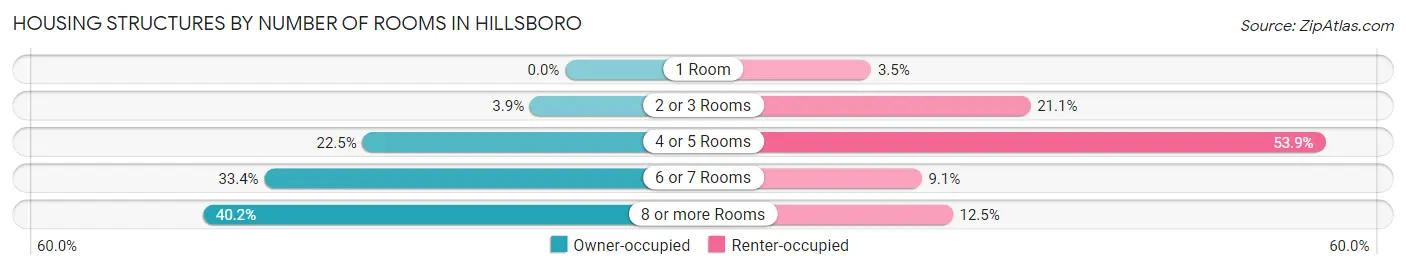
| Number of Rooms | Owner-occupied | Renter-occupied |
| 1 Room | 0 (0.0%) | 8 (3.5%) |
| 2 or 3 Rooms | 28 (3.9%) | 49 (21.1%) |
| 4 or 5 Rooms | 161 (22.5%) | 125 (53.9%) |
| 6 or 7 Rooms | 239 (33.4%) | 21 (9.0%) |
| 8 or more Rooms | 288 (40.2%) | 29 (12.5%) |
| Total | 716 (100.0%) | 232 (100.0%) |
Housing Structure by Heating Type in Hillsboro
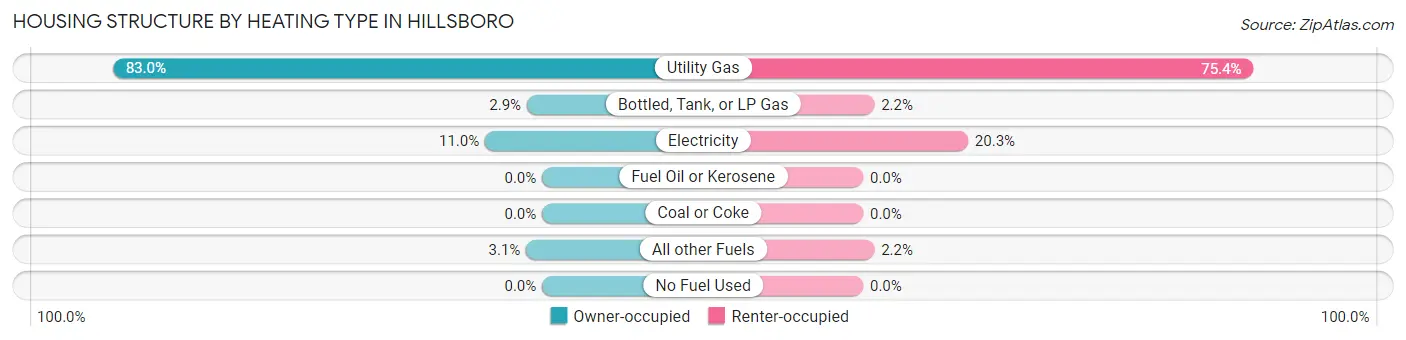
| Heating Type | Owner-occupied | Renter-occupied |
| Utility Gas | 594 (83.0%) | 175 (75.4%) |
| Bottled, Tank, or LP Gas | 21 (2.9%) | 5 (2.2%) |
| Electricity | 79 (11.0%) | 47 (20.3%) |
| Fuel Oil or Kerosene | 0 (0.0%) | 0 (0.0%) |
| Coal or Coke | 0 (0.0%) | 0 (0.0%) |
| All other Fuels | 22 (3.1%) | 5 (2.2%) |
| No Fuel Used | 0 (0.0%) | 0 (0.0%) |
| Total | 716 (100.0%) | 232 (100.0%) |
Household Vehicle Usage in Hillsboro
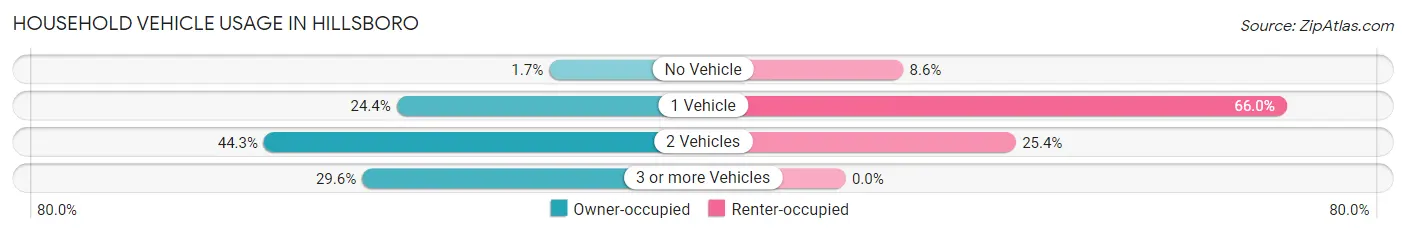
| Vehicles per Household | Owner-occupied | Renter-occupied |
| No Vehicle | 12 (1.7%) | 20 (8.6%) |
| 1 Vehicle | 175 (24.4%) | 153 (65.9%) |
| 2 Vehicles | 317 (44.3%) | 59 (25.4%) |
| 3 or more Vehicles | 212 (29.6%) | 0 (0.0%) |
| Total | 716 (100.0%) | 232 (100.0%) |
Real Estate & Mortgages in Hillsboro
Real Estate and Mortgage Overview in Hillsboro
| Characteristic | Without Mortgage | With Mortgage |
| Housing Units | 338 | 378 |
| Median Property Value | $114,800 | $87,300 |
| Median Household Income | $63,750 | $34 |
| Monthly Housing Costs | $579 | $0 |
| Real Estate Taxes | $2,256 | $5 |
Property Value by Mortgage Status in Hillsboro
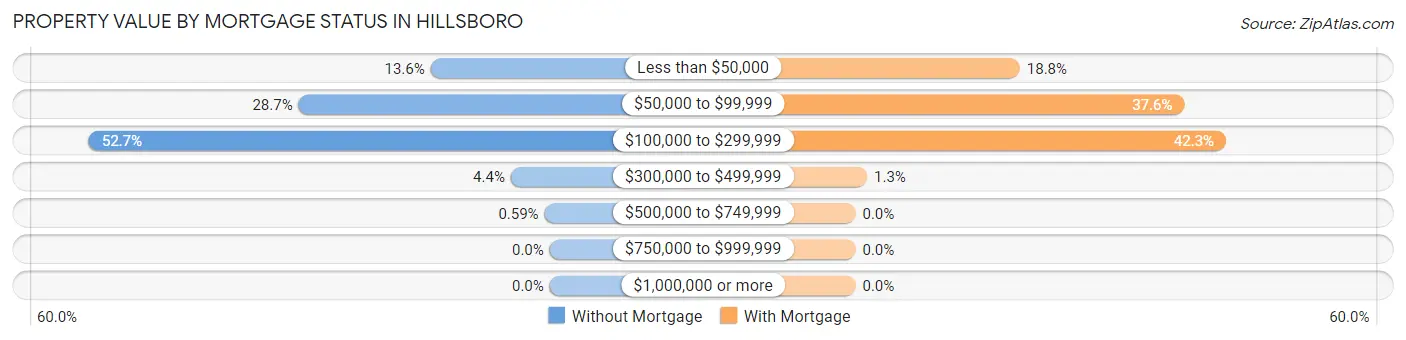
| Property Value | Without Mortgage | With Mortgage |
| Less than $50,000 | 46 (13.6%) | 71 (18.8%) |
| $50,000 to $99,999 | 97 (28.7%) | 142 (37.6%) |
| $100,000 to $299,999 | 178 (52.7%) | 160 (42.3%) |
| $300,000 to $499,999 | 15 (4.4%) | 5 (1.3%) |
| $500,000 to $749,999 | 2 (0.6%) | 0 (0.0%) |
| $750,000 to $999,999 | 0 (0.0%) | 0 (0.0%) |
| $1,000,000 or more | 0 (0.0%) | 0 (0.0%) |
| Total | 338 (100.0%) | 378 (100.0%) |
Household Income by Mortgage Status in Hillsboro
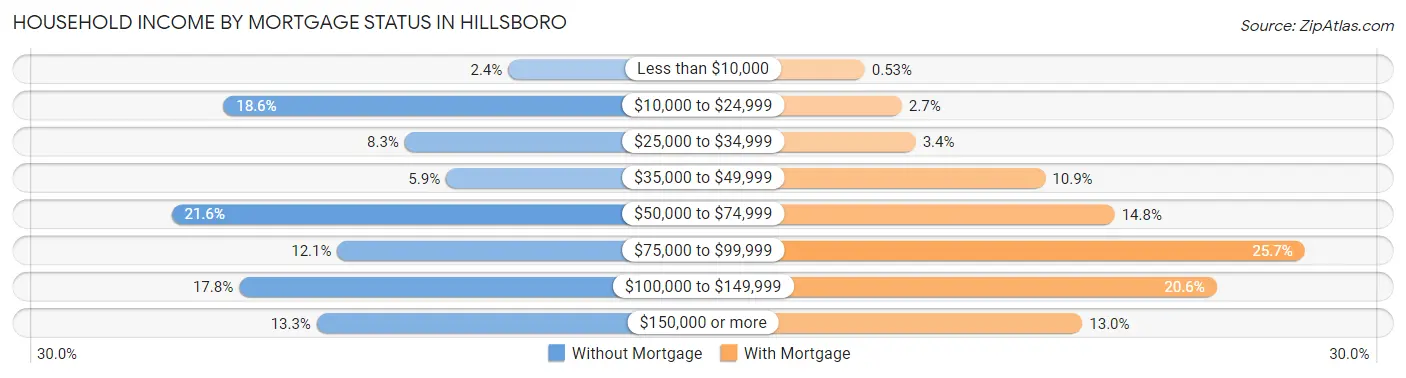
| Household Income | Without Mortgage | With Mortgage |
| Less than $10,000 | 8 (2.4%) | 2 (0.5%) |
| $10,000 to $24,999 | 63 (18.6%) | 10 (2.6%) |
| $25,000 to $34,999 | 28 (8.3%) | 13 (3.4%) |
| $35,000 to $49,999 | 20 (5.9%) | 41 (10.8%) |
| $50,000 to $74,999 | 73 (21.6%) | 56 (14.8%) |
| $75,000 to $99,999 | 41 (12.1%) | 97 (25.7%) |
| $100,000 to $149,999 | 60 (17.7%) | 78 (20.6%) |
| $150,000 or more | 45 (13.3%) | 49 (13.0%) |
| Total | 338 (100.0%) | 378 (100.0%) |
Property Value to Household Income Ratio in Hillsboro
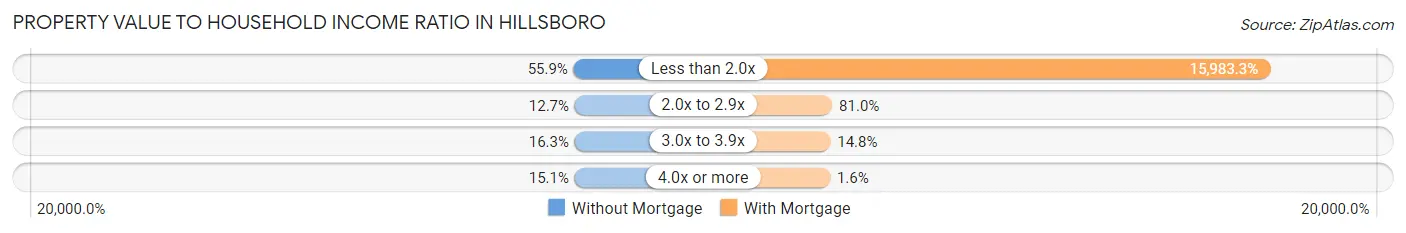
| Value-to-Income Ratio | Without Mortgage | With Mortgage |
| Less than 2.0x | 189 (55.9%) | 60,417 (15,983.3%) |
| 2.0x to 2.9x | 43 (12.7%) | 306 (80.9%) |
| 3.0x to 3.9x | 55 (16.3%) | 56 (14.8%) |
| 4.0x or more | 51 (15.1%) | 6 (1.6%) |
| Total | 338 (100.0%) | 378 (100.0%) |
Real Estate Taxes by Mortgage Status in Hillsboro
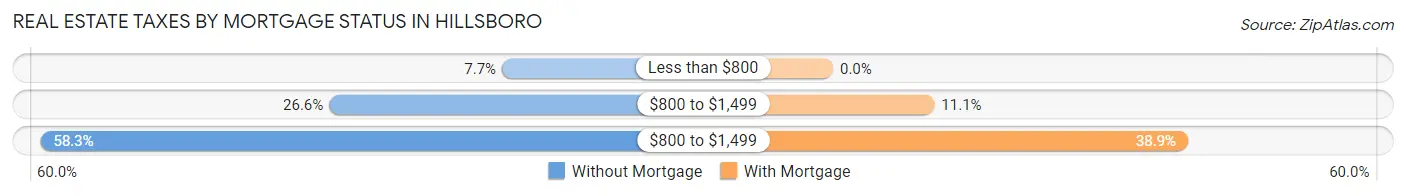
| Property Taxes | Without Mortgage | With Mortgage |
| Less than $800 | 26 (7.7%) | 0 (0.0%) |
| $800 to $1,499 | 90 (26.6%) | 42 (11.1%) |
| $800 to $1,499 | 197 (58.3%) | 147 (38.9%) |
| Total | 338 (100.0%) | 378 (100.0%) |
Health & Disability in Hillsboro
Health Insurance Coverage by Age in Hillsboro
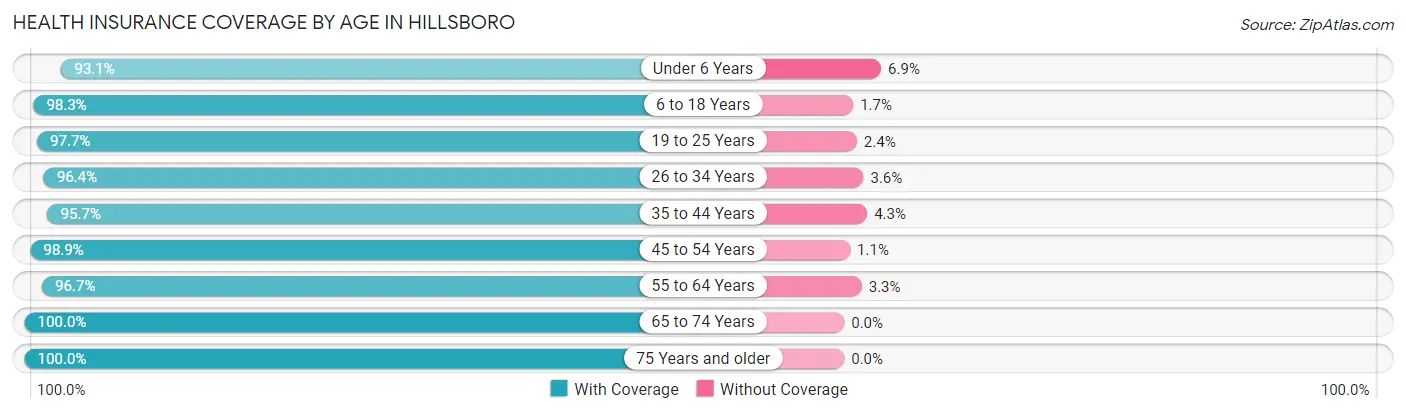
| Age Bracket | With Coverage | Without Coverage |
| Under 6 Years | 122 (93.1%) | 9 (6.9%) |
| 6 to 18 Years | 475 (98.3%) | 8 (1.7%) |
| 19 to 25 Years | 499 (97.7%) | 12 (2.4%) |
| 26 to 34 Years | 215 (96.4%) | 8 (3.6%) |
| 35 to 44 Years | 358 (95.7%) | 16 (4.3%) |
| 45 to 54 Years | 182 (98.9%) | 2 (1.1%) |
| 55 to 64 Years | 297 (96.7%) | 10 (3.3%) |
| 65 to 74 Years | 217 (100.0%) | 0 (0.0%) |
| 75 Years and older | 210 (100.0%) | 0 (0.0%) |
| Total | 2,575 (97.5%) | 65 (2.5%) |
Health Insurance Coverage by Citizenship Status in Hillsboro
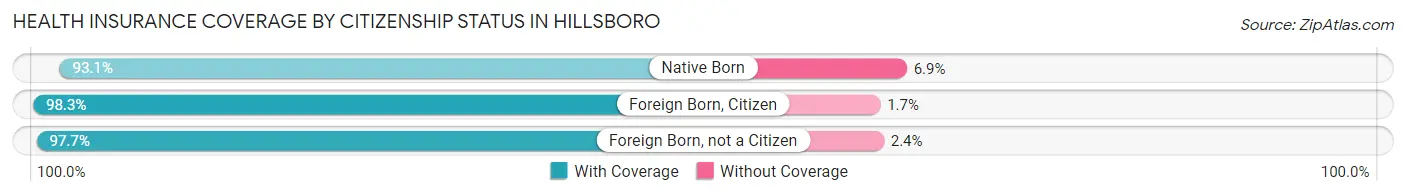
| Citizenship Status | With Coverage | Without Coverage |
| Native Born | 122 (93.1%) | 9 (6.9%) |
| Foreign Born, Citizen | 475 (98.3%) | 8 (1.7%) |
| Foreign Born, not a Citizen | 499 (97.7%) | 12 (2.4%) |
Health Insurance Coverage by Household Income in Hillsboro
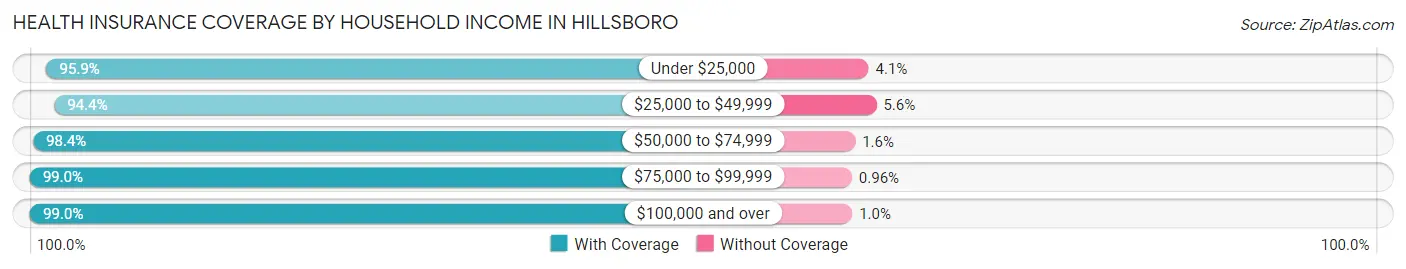
| Household Income | With Coverage | Without Coverage |
| Under $25,000 | 211 (95.9%) | 9 (4.1%) |
| $25,000 to $49,999 | 391 (94.4%) | 23 (5.6%) |
| $50,000 to $74,999 | 500 (98.4%) | 8 (1.6%) |
| $75,000 to $99,999 | 412 (99.0%) | 4 (1.0%) |
| $100,000 and over | 585 (99.0%) | 6 (1.0%) |
Public vs Private Health Insurance Coverage by Age in Hillsboro
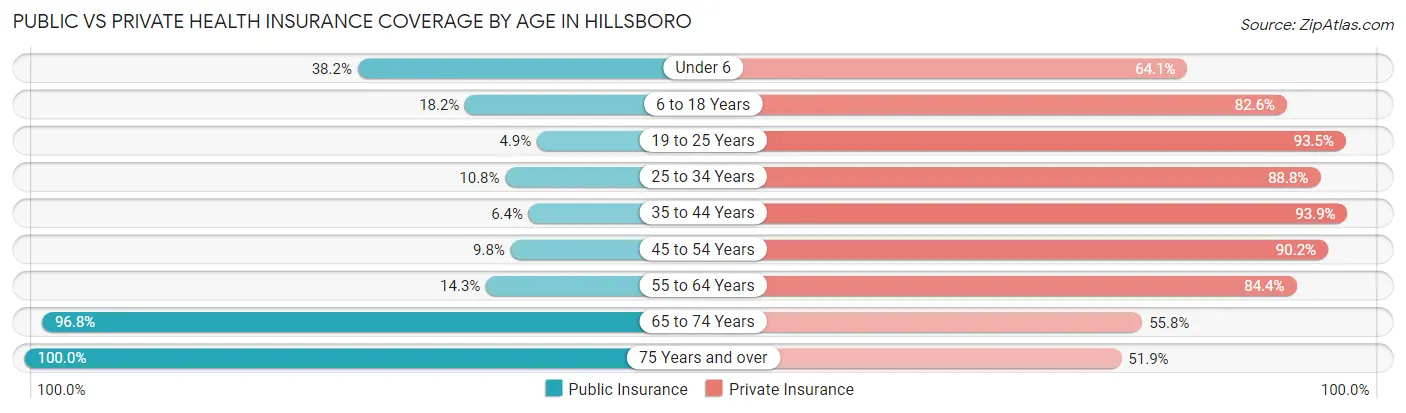
| Age Bracket | Public Insurance | Private Insurance |
| Under 6 | 50 (38.2%) | 84 (64.1%) |
| 6 to 18 Years | 88 (18.2%) | 399 (82.6%) |
| 19 to 25 Years | 25 (4.9%) | 478 (93.5%) |
| 25 to 34 Years | 24 (10.8%) | 198 (88.8%) |
| 35 to 44 Years | 24 (6.4%) | 351 (93.9%) |
| 45 to 54 Years | 18 (9.8%) | 166 (90.2%) |
| 55 to 64 Years | 44 (14.3%) | 259 (84.4%) |
| 65 to 74 Years | 210 (96.8%) | 121 (55.8%) |
| 75 Years and over | 210 (100.0%) | 109 (51.9%) |
| Total | 693 (26.3%) | 2,165 (82.0%) |
Disability Status by Sex by Age in Hillsboro
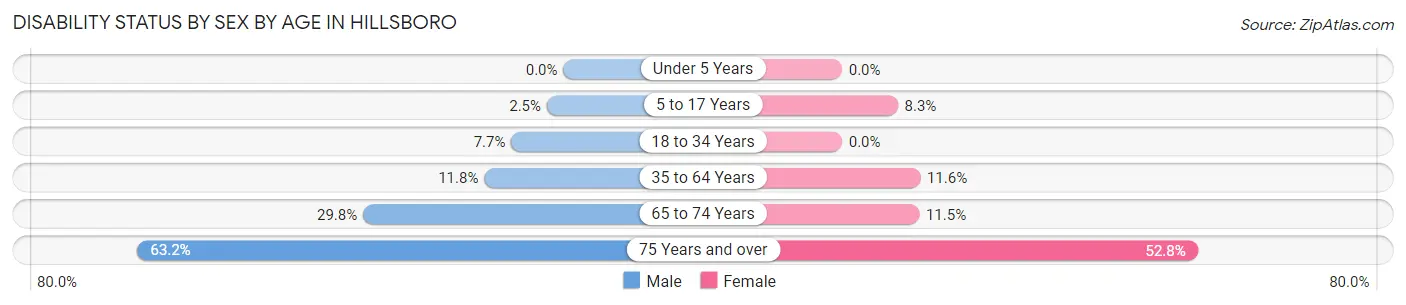
| Age Bracket | Male | Female |
| Under 5 Years | 0 (0.0%) | 0 (0.0%) |
| 5 to 17 Years | 5 (2.5%) | 18 (8.3%) |
| 18 to 34 Years | 29 (7.7%) | 0 (0.0%) |
| 35 to 64 Years | 47 (11.7%) | 54 (11.6%) |
| 65 to 74 Years | 36 (29.7%) | 11 (11.5%) |
| 75 Years and over | 43 (63.2%) | 75 (52.8%) |
Disability Class by Sex by Age in Hillsboro
Disability Class: Hearing Difficulty
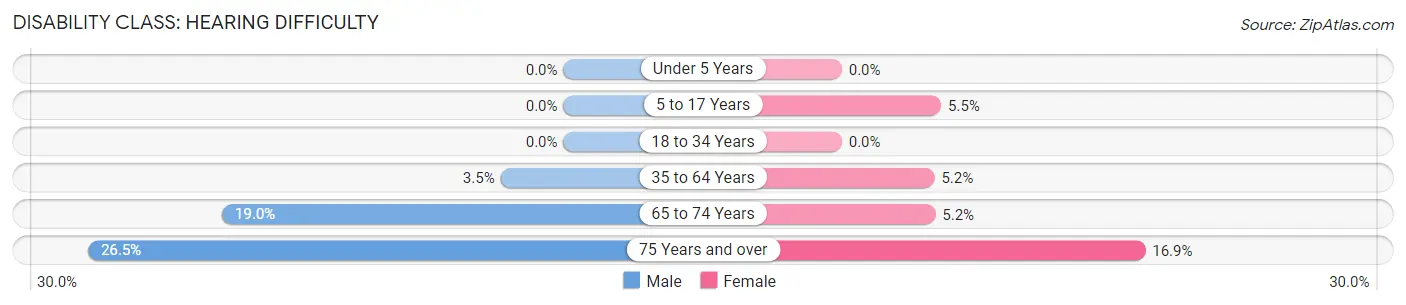
| Age Bracket | Male | Female |
| Under 5 Years | 0 (0.0%) | 0 (0.0%) |
| 5 to 17 Years | 0 (0.0%) | 12 (5.5%) |
| 18 to 34 Years | 0 (0.0%) | 0 (0.0%) |
| 35 to 64 Years | 14 (3.5%) | 24 (5.2%) |
| 65 to 74 Years | 23 (19.0%) | 5 (5.2%) |
| 75 Years and over | 18 (26.5%) | 24 (16.9%) |
Disability Class: Vision Difficulty
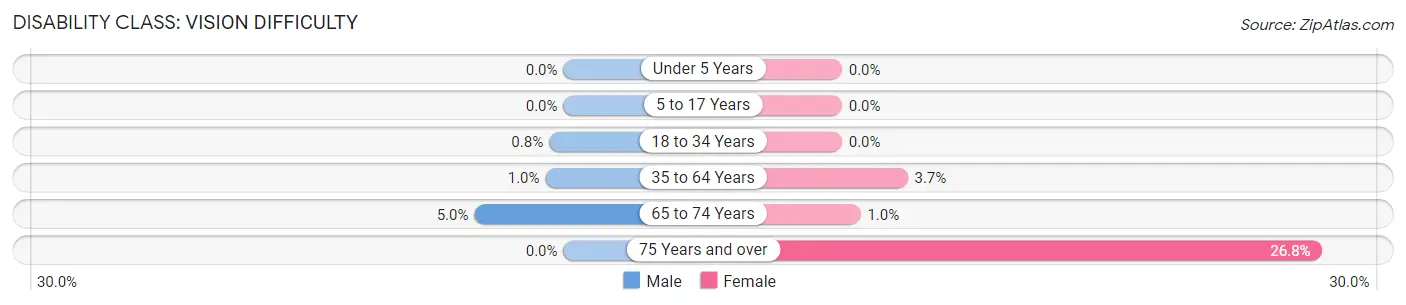
| Age Bracket | Male | Female |
| Under 5 Years | 0 (0.0%) | 0 (0.0%) |
| 5 to 17 Years | 0 (0.0%) | 0 (0.0%) |
| 18 to 34 Years | 3 (0.8%) | 0 (0.0%) |
| 35 to 64 Years | 4 (1.0%) | 17 (3.7%) |
| 65 to 74 Years | 6 (5.0%) | 1 (1.0%) |
| 75 Years and over | 0 (0.0%) | 38 (26.8%) |
Disability Class: Cognitive Difficulty
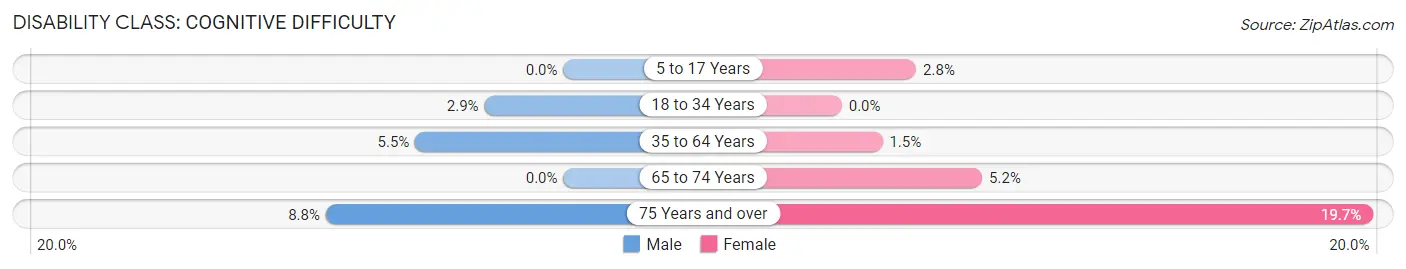
| Age Bracket | Male | Female |
| 5 to 17 Years | 0 (0.0%) | 6 (2.8%) |
| 18 to 34 Years | 11 (2.9%) | 0 (0.0%) |
| 35 to 64 Years | 22 (5.5%) | 7 (1.5%) |
| 65 to 74 Years | 0 (0.0%) | 5 (5.2%) |
| 75 Years and over | 6 (8.8%) | 28 (19.7%) |
Disability Class: Ambulatory Difficulty
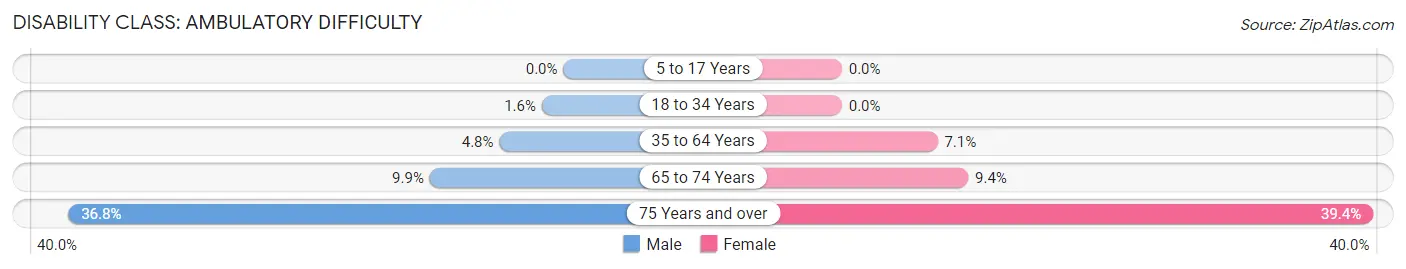
| Age Bracket | Male | Female |
| 5 to 17 Years | 0 (0.0%) | 0 (0.0%) |
| 18 to 34 Years | 6 (1.6%) | 0 (0.0%) |
| 35 to 64 Years | 19 (4.8%) | 33 (7.1%) |
| 65 to 74 Years | 12 (9.9%) | 9 (9.4%) |
| 75 Years and over | 25 (36.8%) | 56 (39.4%) |
Disability Class: Self-Care Difficulty
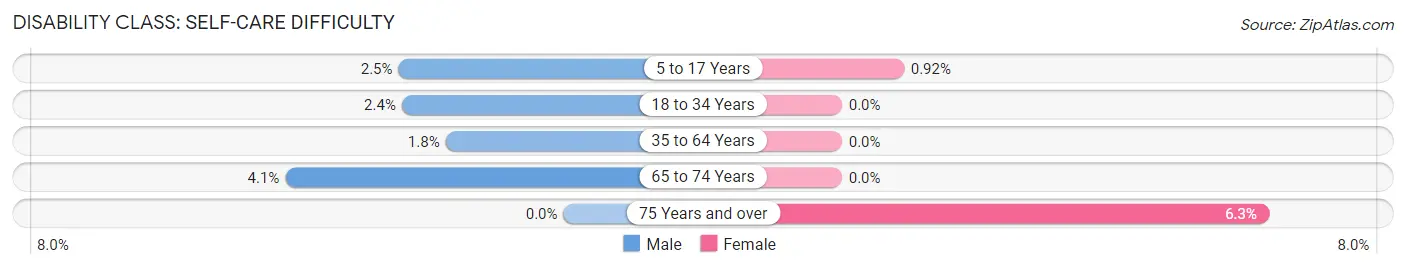
| Age Bracket | Male | Female |
| 5 to 17 Years | 5 (2.5%) | 2 (0.9%) |
| 18 to 34 Years | 9 (2.4%) | 0 (0.0%) |
| 35 to 64 Years | 7 (1.8%) | 0 (0.0%) |
| 65 to 74 Years | 5 (4.1%) | 0 (0.0%) |
| 75 Years and over | 0 (0.0%) | 9 (6.3%) |
Technology Access in Hillsboro
Computing Device Access in Hillsboro
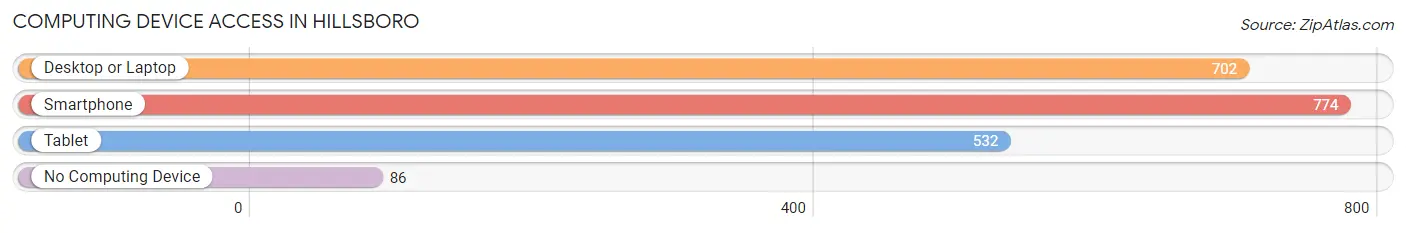
| Device Type | # Households | % Households |
| Desktop or Laptop | 702 | 74.1% |
| Smartphone | 774 | 81.7% |
| Tablet | 532 | 56.1% |
| No Computing Device | 86 | 9.1% |
| Total | 948 | 100.0% |
Internet Access in Hillsboro
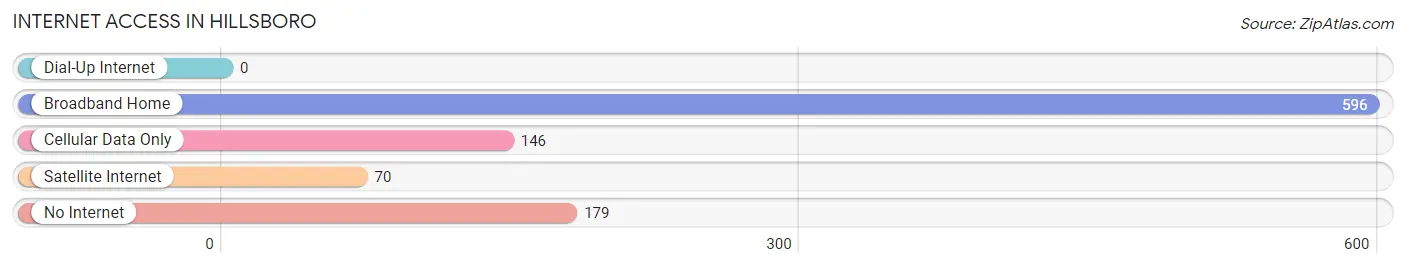
| Internet Type | # Households | % Households |
| Dial-Up Internet | 0 | 0.0% |
| Broadband Home | 596 | 62.9% |
| Cellular Data Only | 146 | 15.4% |
| Satellite Internet | 70 | 7.4% |
| No Internet | 179 | 18.9% |
| Total | 948 | 100.0% |
Hillsboro Summary
Hillsboro, Kansas is a small city located in Marion County, Kansas. It is situated in the Flint Hills region of the state, and is the county seat of Marion County. The city has a population of 2,902 as of the 2010 census, and is the second-largest city in the county.
History
Hillsboro was founded in 1871 by a group of settlers from Ohio. The city was named after the nearby hills, which were named after the hills of Ohio. The city was incorporated in 1872, and the first post office was established in 1873.
The city grew rapidly in the late 19th century, and by the early 20th century, it had become a major center for the region's agricultural and industrial activities. The city was also home to several large businesses, including a flour mill, a creamery, a canning factory, and a brickyard.
Geography
Hillsboro is located in the Flint Hills region of Kansas, and is situated in the center of Marion County. The city is located at an elevation of 1,072 feet (326 m) above sea level. The city is located at the intersection of U.S. Route 56 and Kansas Highway 99.
The city is located in a hilly area, and is surrounded by rolling hills and grasslands. The city is located in the Central Flyway, and is a popular destination for birdwatchers.
Economy
Hillsboro's economy is largely based on agriculture and manufacturing. The city is home to several large agricultural operations, including a large dairy farm and a large hog farm. The city is also home to several manufacturing companies, including a plastics manufacturer and a metal fabrication company.
The city is also home to several retail businesses, including a grocery store, a hardware store, and several restaurants. The city is also home to several service businesses, including a bank, a hospital, and a post office.
Demographics
As of the 2010 census, the population of Hillsboro was 2,902. The racial makeup of the city was 95.3% White, 0.7% African American, 0.3% Native American, 0.2% Asian, 0.1% Pacific Islander, 1.2% from other races, and 2.4% from two or more races. Hispanic or Latino of any race were 3.2% of the population.
The median income for a household in the city was $37,917, and the median income for a family was $45,938. The per capita income for the city was $18,945. About 11.2% of families and 14.2% of the population were below the poverty line, including 19.2% of those under age 18 and 8.2% of those age 65 or over.
Conclusion
Hillsboro, Kansas is a small city located in Marion County, Kansas. It is situated in the Flint Hills region of the state, and is the county seat of Marion County. The city has a population of 2,902 as of the 2010 census, and is the second-largest city in the county. The city's economy is largely based on agriculture and manufacturing, and it is home to several large agricultural operations and manufacturing companies. The city is also home to several retail businesses, service businesses, and other businesses. The population of the city is largely white, with a small percentage of African Americans, Native Americans, Asians, and Pacific Islanders. The median income for a household in the city is $37,917, and the median income for a family is $45,938.
Common Questions
What is Per Capita Income in Hillsboro?
Per Capita income in Hillsboro is $25,565.
What is the Median Family Income in Hillsboro?
Median Family Income in Hillsboro is $76,875.
What is the Median Household income in Hillsboro?
Median Household Income in Hillsboro is $55,000.
What is Income or Wage Gap in Hillsboro?
Income or Wage Gap in Hillsboro is 76.9%.
Women in Hillsboro earn 23.1 cents for every dollar earned by a man.
What is Family Income Deficit in Hillsboro?
Family Income Deficit in Hillsboro is $5,994.
Families that are below poverty line in Hillsboro earn $5,994 less on average than the poverty threshold level.
What is Inequality or Gini Index in Hillsboro?
Inequality or Gini Index in Hillsboro is 0.40.
What is the Total Population of Hillsboro?
Total Population of Hillsboro is 2,744.
What is the Total Male Population of Hillsboro?
Total Male Population of Hillsboro is 1,297.
What is the Total Female Population of Hillsboro?
Total Female Population of Hillsboro is 1,447.
What is the Ratio of Males per 100 Females in Hillsboro?
There are 89.63 Males per 100 Females in Hillsboro.
What is the Ratio of Females per 100 Males in Hillsboro?
There are 111.57 Females per 100 Males in Hillsboro.
What is the Median Population Age in Hillsboro?
Median Population Age in Hillsboro is 35.7 Years.
What is the Average Family Size in Hillsboro
Average Family Size in Hillsboro is 2.9 People.
What is the Average Household Size in Hillsboro
Average Household Size in Hillsboro is 2.3 People.
How Large is the Labor Force in Hillsboro?
There are 1,316 People in the Labor Forcein in Hillsboro.
What is the Percentage of People in the Labor Force in Hillsboro?
58.3% of People are in the Labor Force in Hillsboro.
What is the Unemployment Rate in Hillsboro?
Unemployment Rate in Hillsboro is 2.4%.