Morgan Hill, CA Map & Demographics
Morgan Hill Map
Morgan Hill Overview
$62,116
PER CAPITA INCOME
$166,776
AVG FAMILY INCOME
$152,199
AVG HOUSEHOLD INCOME
30.7%
WAGE / INCOME GAP [ % ]
69.3¢/ $1
WAGE / INCOME GAP [ $ ]
0.41
INEQUALITY / GINI INDEX
45,291
TOTAL POPULATION
21,692
MALE POPULATION
23,599
FEMALE POPULATION
91.92
MALES / 100 FEMALES
108.79
FEMALES / 100 MALES
38.0
MEDIAN AGE
3.4
AVG FAMILY SIZE
3.1
AVG HOUSEHOLD SIZE
23,040
LABOR FORCE [ PEOPLE ]
66.5%
PERCENT IN LABOR FORCE
4.9%
UNEMPLOYMENT RATE
Morgan Hill Zip Codes
Income in Morgan Hill
Income Overview in Morgan Hill
Per Capita Income in Morgan Hill is $62,116, while median incomes of families and households are $166,776 and $152,199 respectively.
| Characteristic | Number | Measure |
| Per Capita Income | 45,291 | $62,116 |
| Median Family Income | 11,611 | $166,776 |
| Mean Family Income | 11,611 | $197,660 |
| Median Household Income | 14,575 | $152,199 |
| Mean Household Income | 14,575 | $187,632 |
| Income Deficit | 11,611 | $0 |
| Wage / Income Gap (%) | 45,291 | 30.72% |
| Wage / Income Gap ($) | 45,291 | 69.28¢ per $1 |
| Gini / Inequality Index | 45,291 | 0.41 |
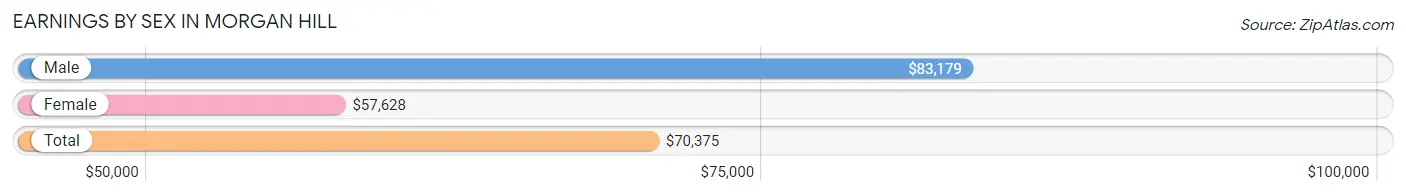
Earnings by Sex in Morgan Hill
Average Earnings in Morgan Hill are $70,375, $83,179 for men and $57,628 for women, a difference of 30.7%.
| Sex | Number | Average Earnings |
| Male | 12,956 (54.2%) | $83,179 |
| Female | 10,964 (45.8%) | $57,628 |
| Total | 23,920 (100.0%) | $70,375 |
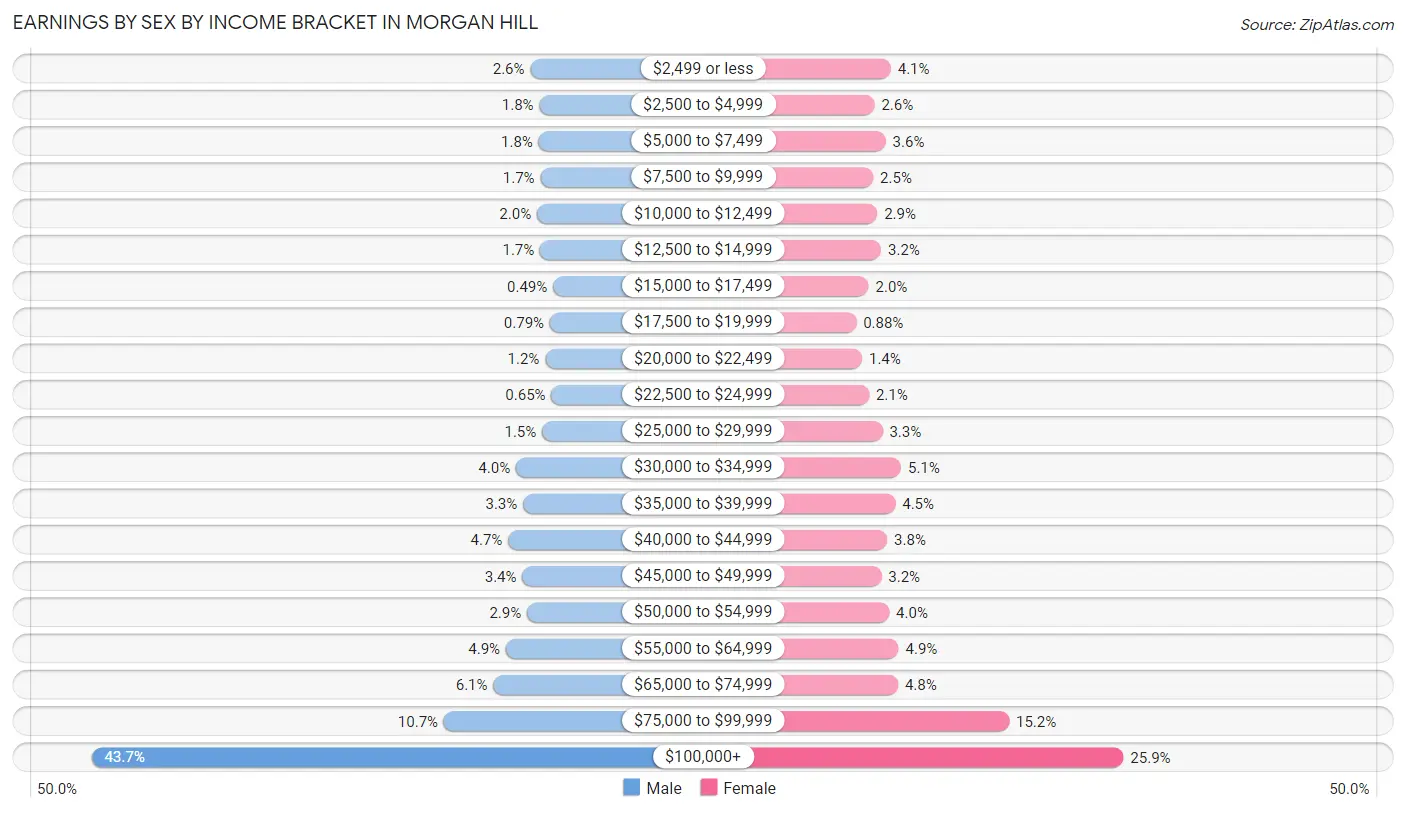
Earnings by Sex by Income Bracket in Morgan Hill
The most common earnings brackets in Morgan Hill are $100,000+ for men (5,666 | 43.7%) and $100,000+ for women (2,841 | 25.9%).
| Income | Male | Female |
| $2,499 or less | 339 (2.6%) | 452 (4.1%) |
| $2,500 to $4,999 | 229 (1.8%) | 284 (2.6%) |
| $5,000 to $7,499 | 238 (1.8%) | 399 (3.6%) |
| $7,500 to $9,999 | 218 (1.7%) | 271 (2.5%) |
| $10,000 to $12,499 | 259 (2.0%) | 312 (2.9%) |
| $12,500 to $14,999 | 222 (1.7%) | 352 (3.2%) |
| $15,000 to $17,499 | 63 (0.5%) | 224 (2.0%) |
| $17,500 to $19,999 | 102 (0.8%) | 96 (0.9%) |
| $20,000 to $22,499 | 159 (1.2%) | 157 (1.4%) |
| $22,500 to $24,999 | 84 (0.6%) | 228 (2.1%) |
| $25,000 to $29,999 | 197 (1.5%) | 366 (3.3%) |
| $30,000 to $34,999 | 514 (4.0%) | 557 (5.1%) |
| $35,000 to $39,999 | 427 (3.3%) | 498 (4.5%) |
| $40,000 to $44,999 | 609 (4.7%) | 414 (3.8%) |
| $45,000 to $49,999 | 436 (3.4%) | 355 (3.2%) |
| $50,000 to $54,999 | 380 (2.9%) | 435 (4.0%) |
| $55,000 to $64,999 | 636 (4.9%) | 532 (4.9%) |
| $65,000 to $74,999 | 789 (6.1%) | 525 (4.8%) |
| $75,000 to $99,999 | 1,389 (10.7%) | 1,666 (15.2%) |
| $100,000+ | 5,666 (43.7%) | 2,841 (25.9%) |
| Total | 12,956 (100.0%) | 10,964 (100.0%) |
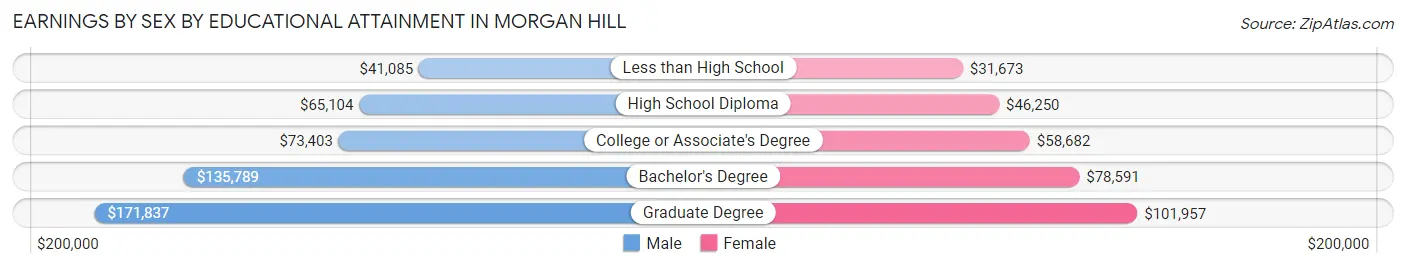
Earnings by Sex by Educational Attainment in Morgan Hill
Average earnings in Morgan Hill are $96,742 for men and $66,741 for women, a difference of 31.0%. Men with an educational attainment of graduate degree enjoy the highest average annual earnings of $171,837, while those with less than high school education earn the least with $41,085. Women with an educational attainment of graduate degree earn the most with the average annual earnings of $101,957, while those with less than high school education have the smallest earnings of $31,673.
| Educational Attainment | Male Income | Female Income |
| Less than High School | $41,085 | $31,673 |
| High School Diploma | $65,104 | $46,250 |
| College or Associate's Degree | $73,403 | $58,682 |
| Bachelor's Degree | $135,789 | $78,591 |
| Graduate Degree | $171,837 | $101,957 |
| Total | $96,742 | $66,741 |
Family Income in Morgan Hill
Family Income Brackets in Morgan Hill
According to the Morgan Hill family income data, there are 4,702 families falling into the $200,000+ income range, which is the most common income bracket and makes up 40.5% of all families. Conversely, the less than $10,000 income bracket is the least frequent group with only 12 families (0.1%) belonging to this category.
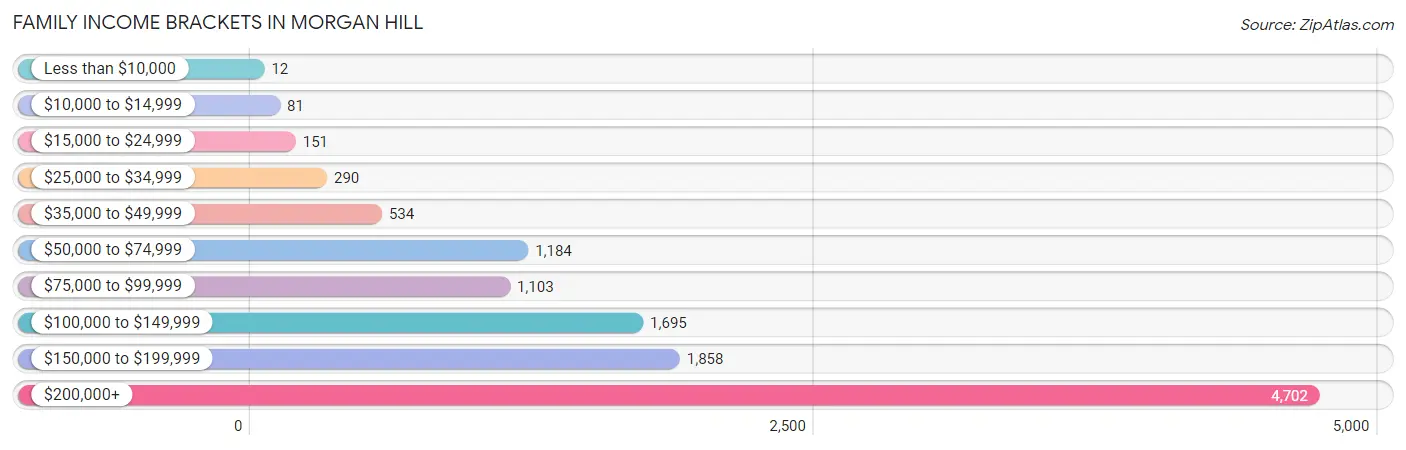
| Income Bracket | # Families | % Families |
| Less than $10,000 | 12 | 0.1% |
| $10,000 to $14,999 | 81 | 0.7% |
| $15,000 to $24,999 | 151 | 1.3% |
| $25,000 to $34,999 | 290 | 2.5% |
| $35,000 to $49,999 | 534 | 4.6% |
| $50,000 to $74,999 | 1,184 | 10.2% |
| $75,000 to $99,999 | 1,103 | 9.5% |
| $100,000 to $149,999 | 1,695 | 14.6% |
| $150,000 to $199,999 | 1,858 | 16.0% |
| $200,000+ | 4,702 | 40.5% |
Family Income by Famaliy Size in Morgan Hill
7+ person families (127 | 1.1%) account for the highest median family income in Morgan Hill with $250,001 per family, while 3-person families (2,304 | 19.8%) have the highest median income of $70,069 per family member.
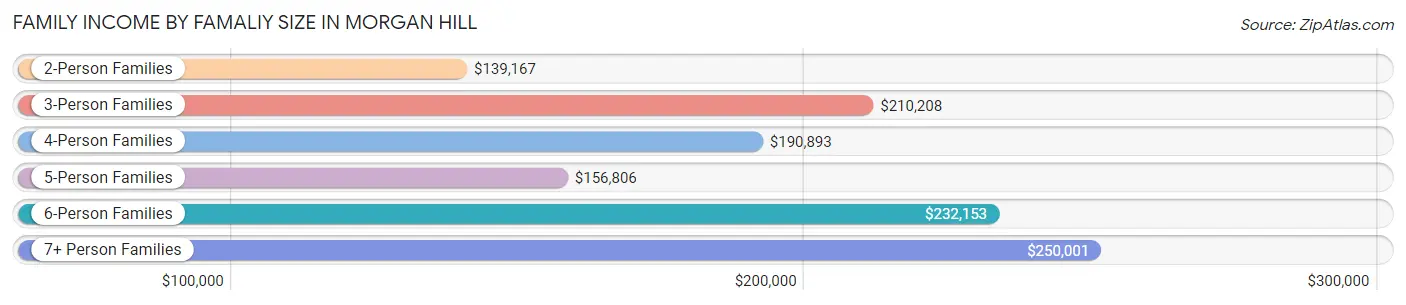
| Income Bracket | # Families | Median Income |
| 2-Person Families | 4,526 (39.0%) | $139,167 |
| 3-Person Families | 2,304 (19.8%) | $210,208 |
| 4-Person Families | 2,968 (25.6%) | $190,893 |
| 5-Person Families | 1,229 (10.6%) | $156,806 |
| 6-Person Families | 457 (3.9%) | $232,153 |
| 7+ Person Families | 127 (1.1%) | $250,001 |
| Total | 11,611 (100.0%) | $166,776 |
Family Income by Number of Earners in Morgan Hill
The median family income in Morgan Hill is $166,776, with families comprising 3+ earners (1,623) having the highest median family income of $231,602, while families with no earners (1,248) have the lowest median family income of $80,595, accounting for 14.0% and 10.7% of families, respectively.
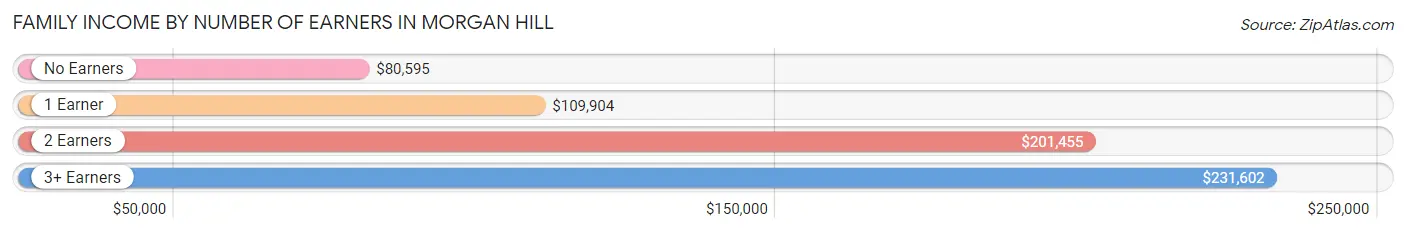
| Number of Earners | # Families | Median Income |
| No Earners | 1,248 (10.7%) | $80,595 |
| 1 Earner | 3,444 (29.7%) | $109,904 |
| 2 Earners | 5,296 (45.6%) | $201,455 |
| 3+ Earners | 1,623 (14.0%) | $231,602 |
| Total | 11,611 (100.0%) | $166,776 |
Household Income in Morgan Hill
Household Income Brackets in Morgan Hill
With 5,509 households falling in the category, the $200,000+ income range is the most frequent in Morgan Hill, accounting for 37.8% of all households. In contrast, only 73 households (0.5%) fall into the less than $10,000 income bracket, making it the least populous group.
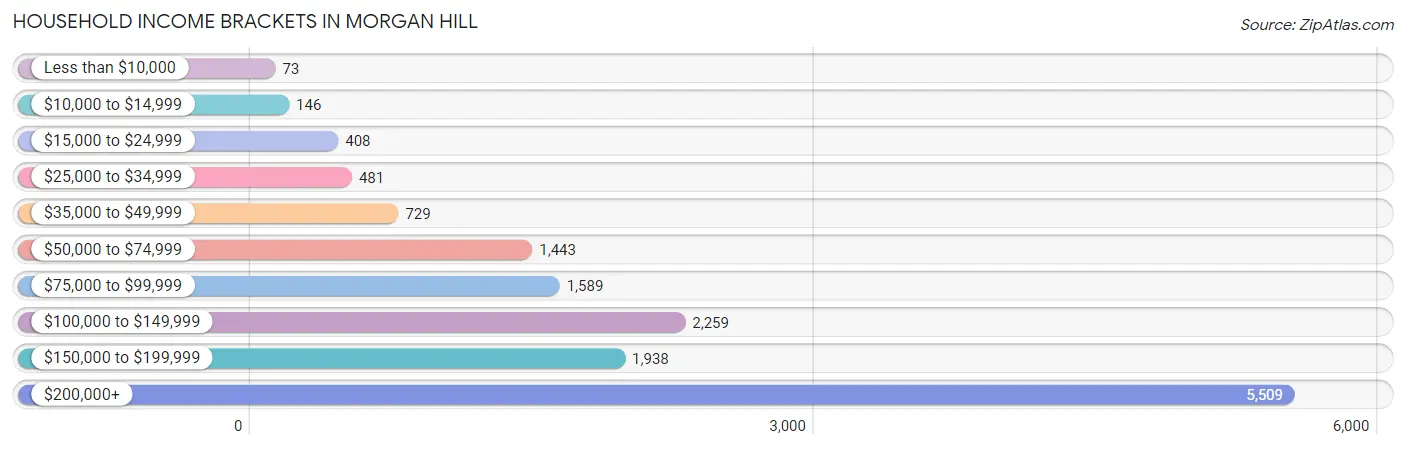
| Income Bracket | # Households | % Households |
| Less than $10,000 | 73 | 0.5% |
| $10,000 to $14,999 | 146 | 1.0% |
| $15,000 to $24,999 | 408 | 2.8% |
| $25,000 to $34,999 | 481 | 3.3% |
| $35,000 to $49,999 | 729 | 5.0% |
| $50,000 to $74,999 | 1,443 | 9.9% |
| $75,000 to $99,999 | 1,589 | 10.9% |
| $100,000 to $149,999 | 2,259 | 15.5% |
| $150,000 to $199,999 | 1,938 | 13.3% |
| $200,000+ | 5,509 | 37.8% |
Household Income by Householder Age in Morgan Hill
The median household income in Morgan Hill is $152,199, with the highest median household income of $178,609 found in the 45 to 64 years age bracket for the primary householder. A total of 6,121 households (42.0%) fall into this category. Meanwhile, the 15 to 24 years age bracket for the primary householder has the lowest median household income of $84,013, with 174 households (1.2%) in this group.
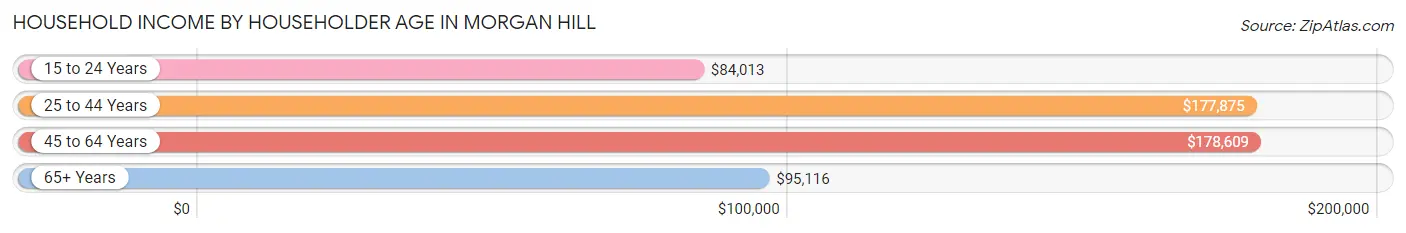
| Income Bracket | # Households | Median Income |
| 15 to 24 Years | 174 (1.2%) | $84,013 |
| 25 to 44 Years | 4,769 (32.7%) | $177,875 |
| 45 to 64 Years | 6,121 (42.0%) | $178,609 |
| 65+ Years | 3,511 (24.1%) | $95,116 |
| Total | 14,575 (100.0%) | $152,199 |
Poverty in Morgan Hill
Income Below Poverty by Sex and Age in Morgan Hill
With 2.8% poverty level for males and 4.5% for females among the residents of Morgan Hill, 16 and 17 year old males and 18 to 24 year old females are the most vulnerable to poverty, with 137 males (31.8%) and 226 females (12.8%) in their respective age groups living below the poverty level.
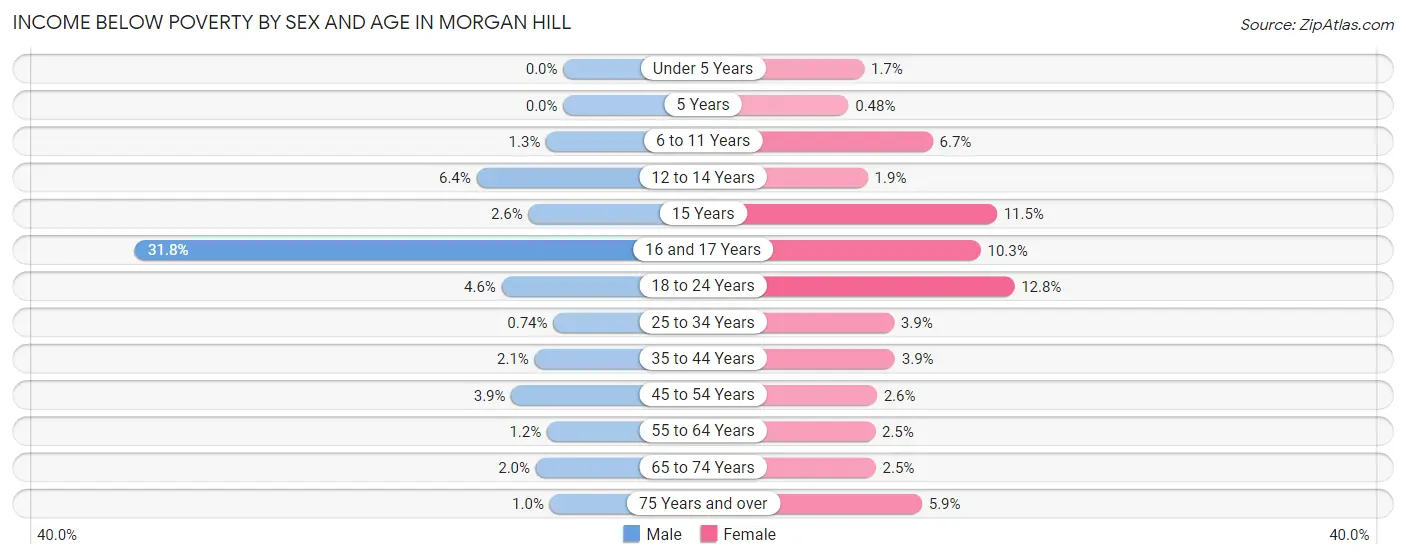
| Age Bracket | Male | Female |
| Under 5 Years | 0 (0.0%) | 32 (1.7%) |
| 5 Years | 0 (0.0%) | 1 (0.5%) |
| 6 to 11 Years | 20 (1.3%) | 147 (6.7%) |
| 12 to 14 Years | 65 (6.4%) | 22 (1.9%) |
| 15 Years | 8 (2.6%) | 56 (11.5%) |
| 16 and 17 Years | 137 (31.8%) | 69 (10.3%) |
| 18 to 24 Years | 80 (4.6%) | 226 (12.8%) |
| 25 to 34 Years | 21 (0.7%) | 99 (3.9%) |
| 35 to 44 Years | 64 (2.1%) | 122 (3.9%) |
| 45 to 54 Years | 112 (3.9%) | 79 (2.6%) |
| 55 to 64 Years | 35 (1.2%) | 74 (2.5%) |
| 65 to 74 Years | 39 (2.0%) | 54 (2.5%) |
| 75 Years and over | 12 (1.0%) | 76 (5.9%) |
| Total | 593 (2.8%) | 1,057 (4.5%) |
Income Above Poverty by Sex and Age in Morgan Hill
According to the poverty statistics in Morgan Hill, males aged under 5 years and females aged 5 years are the age groups that are most secure financially, with 100.0% of males and 99.5% of females in these age groups living above the poverty line.
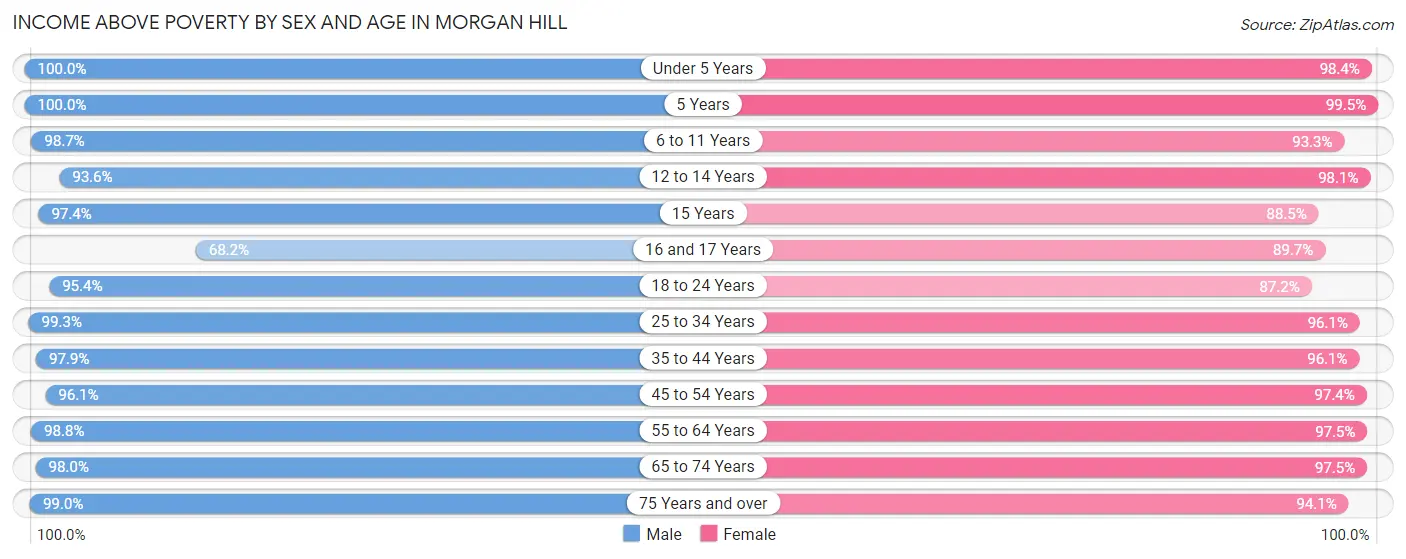
| Age Bracket | Male | Female |
| Under 5 Years | 1,487 (100.0%) | 1,906 (98.4%) |
| 5 Years | 266 (100.0%) | 207 (99.5%) |
| 6 to 11 Years | 1,551 (98.7%) | 2,035 (93.3%) |
| 12 to 14 Years | 944 (93.6%) | 1,124 (98.1%) |
| 15 Years | 302 (97.4%) | 431 (88.5%) |
| 16 and 17 Years | 294 (68.2%) | 601 (89.7%) |
| 18 to 24 Years | 1,667 (95.4%) | 1,540 (87.2%) |
| 25 to 34 Years | 2,813 (99.3%) | 2,456 (96.1%) |
| 35 to 44 Years | 2,941 (97.9%) | 2,972 (96.1%) |
| 45 to 54 Years | 2,789 (96.1%) | 2,966 (97.4%) |
| 55 to 64 Years | 2,852 (98.8%) | 2,929 (97.5%) |
| 65 to 74 Years | 1,872 (98.0%) | 2,095 (97.5%) |
| 75 Years and over | 1,173 (99.0%) | 1,203 (94.1%) |
| Total | 20,951 (97.3%) | 22,465 (95.5%) |
Income Below Poverty Among Married-Couple Families in Morgan Hill
The poverty statistics for married-couple families in Morgan Hill show that 0.9% or 79 of the total 9,187 families live below the poverty line. Families with 5 or more children have the highest poverty rate of 25.0%, comprising of 1 families. On the other hand, families with 1 or 2 children have the lowest poverty rate of 0.4%, which includes 16 families.
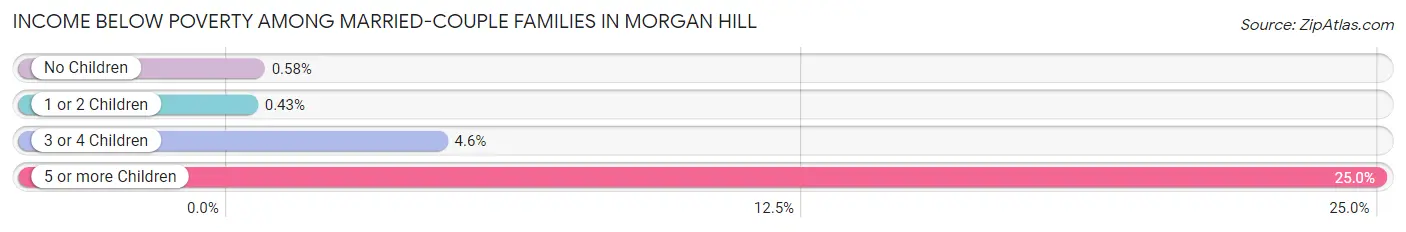
| Children | Above Poverty | Below Poverty |
| No Children | 4,644 (99.4%) | 27 (0.6%) |
| 1 or 2 Children | 3,729 (99.6%) | 16 (0.4%) |
| 3 or 4 Children | 732 (95.4%) | 35 (4.6%) |
| 5 or more Children | 3 (75.0%) | 1 (25.0%) |
| Total | 9,108 (99.1%) | 79 (0.9%) |
Income Below Poverty Among Single-Parent Households in Morgan Hill
According to the poverty data in Morgan Hill, 3.2% or 19 single-father households and 6.8% or 124 single-mother households are living below the poverty line. Among single-father households, those with 3 or 4 children have the highest poverty rate, with 8 households (16.0%) experiencing poverty. Likewise, among single-mother households, those with 5 or more children have the highest poverty rate, with 11 households (100.0%) falling below the poverty line.
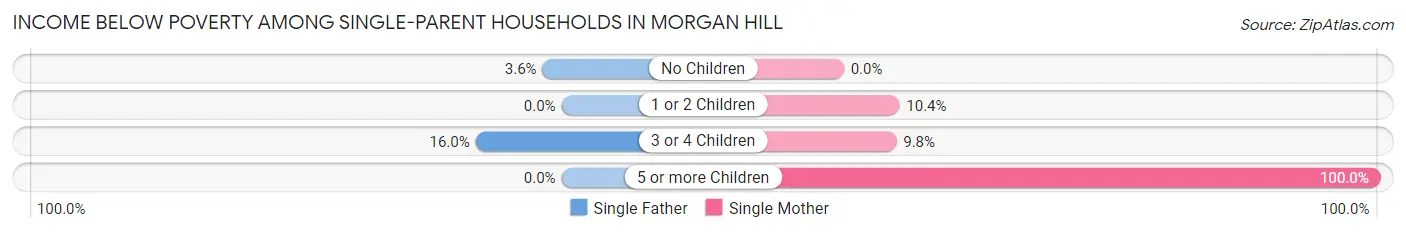
| Children | Single Father | Single Mother |
| No Children | 11 (3.5%) | 0 (0.0%) |
| 1 or 2 Children | 0 (0.0%) | 103 (10.4%) |
| 3 or 4 Children | 8 (16.0%) | 10 (9.8%) |
| 5 or more Children | 0 (0.0%) | 11 (100.0%) |
| Total | 19 (3.2%) | 124 (6.8%) |
Income Below Poverty Among Married-Couple vs Single-Parent Households in Morgan Hill
The poverty data for Morgan Hill shows that 79 of the married-couple family households (0.9%) and 143 of the single-parent households (5.9%) are living below the poverty level. Within the married-couple family households, those with 5 or more children have the highest poverty rate, with 1 households (25.0%) falling below the poverty line. Among the single-parent households, those with 5 or more children have the highest poverty rate, with 11 household (100.0%) living below poverty.
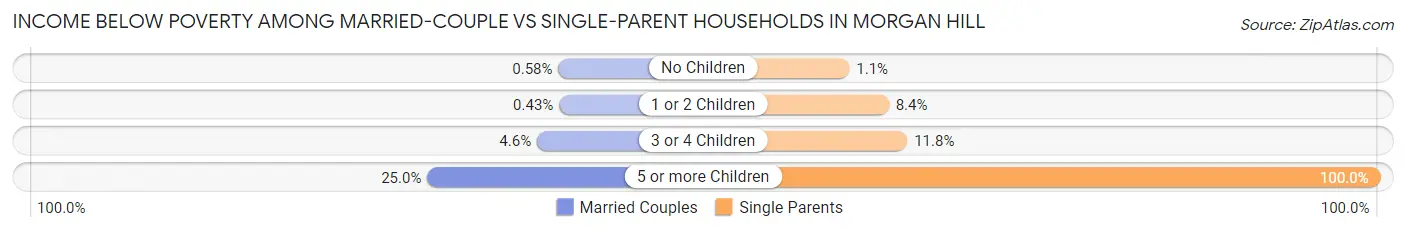
| Children | Married-Couple Families | Single-Parent Households |
| No Children | 27 (0.6%) | 11 (1.1%) |
| 1 or 2 Children | 16 (0.4%) | 103 (8.4%) |
| 3 or 4 Children | 35 (4.6%) | 18 (11.8%) |
| 5 or more Children | 1 (25.0%) | 11 (100.0%) |
| Total | 79 (0.9%) | 143 (5.9%) |
Race in Morgan Hill
The most populous races in Morgan Hill are White / Caucasian (25,359 | 56.0%), Hispanic or Latino (15,189 | 33.5%), and Two or more Races (8,723 | 19.3%).
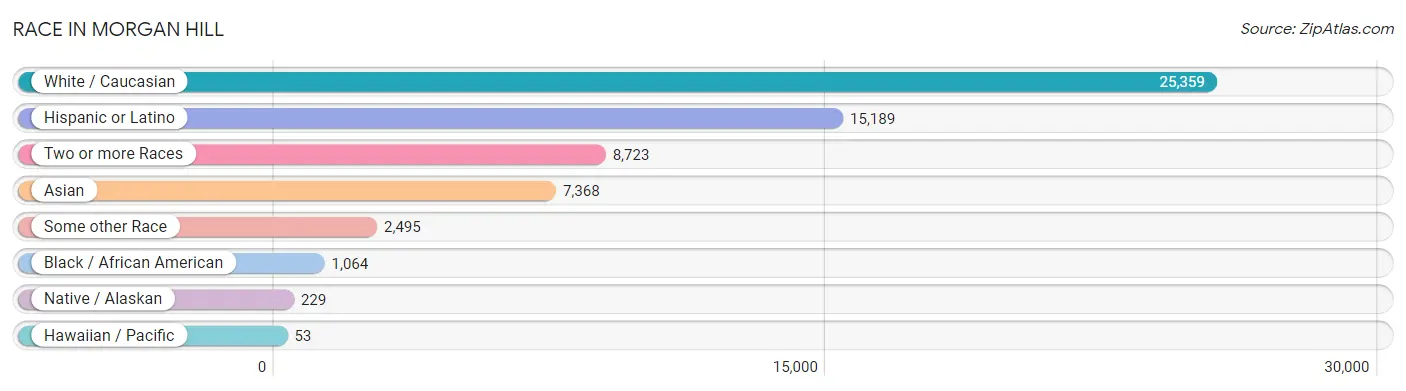
| Race | # Population | % Population |
| Asian | 7,368 | 16.3% |
| Black / African American | 1,064 | 2.4% |
| Hawaiian / Pacific | 53 | 0.1% |
| Hispanic or Latino | 15,189 | 33.5% |
| Native / Alaskan | 229 | 0.5% |
| White / Caucasian | 25,359 | 56.0% |
| Two or more Races | 8,723 | 19.3% |
| Some other Race | 2,495 | 5.5% |
| Total | 45,291 | 100.0% |
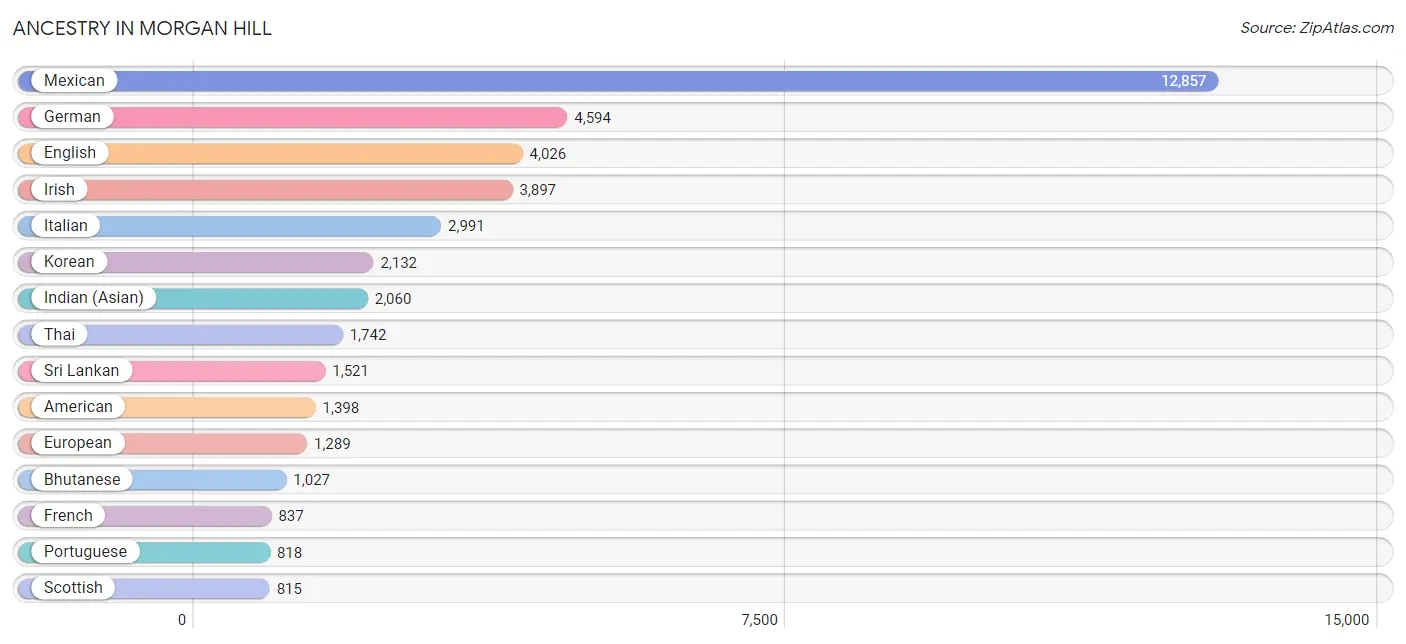
Ancestry in Morgan Hill
The most populous ancestries reported in Morgan Hill are Mexican (12,857 | 28.4%), German (4,594 | 10.1%), English (4,026 | 8.9%), Irish (3,897 | 8.6%), and Italian (2,991 | 6.6%), together accounting for 62.6% of all Morgan Hill residents.
| Ancestry | # Population | % Population |
| African | 134 | 0.3% |
| American | 1,398 | 3.1% |
| Apache | 22 | 0.1% |
| Arab | 183 | 0.4% |
| Argentinean | 23 | 0.1% |
| Armenian | 29 | 0.1% |
| Assyrian / Chaldean / Syriac | 22 | 0.1% |
| Austrian | 124 | 0.3% |
| Bangladeshi | 34 | 0.1% |
| Belgian | 20 | 0.0% |
| Bhutanese | 1,027 | 2.3% |
| Brazilian | 133 | 0.3% |
| British | 404 | 0.9% |
| British West Indian | 31 | 0.1% |
| Bulgarian | 9 | 0.0% |
| Burmese | 605 | 1.3% |
| Cajun | 4 | 0.0% |
| Canadian | 80 | 0.2% |
| Celtic | 184 | 0.4% |
| Central American | 339 | 0.7% |
| Central American Indian | 14 | 0.0% |
| Cherokee | 267 | 0.6% |
| Chilean | 236 | 0.5% |
| Choctaw | 12 | 0.0% |
| Colombian | 100 | 0.2% |
| Comanche | 146 | 0.3% |
| Croatian | 106 | 0.2% |
| Cuban | 155 | 0.3% |
| Czech | 68 | 0.2% |
| Czechoslovakian | 8 | 0.0% |
| Danish | 331 | 0.7% |
| Dominican | 87 | 0.2% |
| Dutch | 440 | 1.0% |
| Dutch West Indian | 7 | 0.0% |
| Eastern European | 103 | 0.2% |
| Ecuadorian | 34 | 0.1% |
| Egyptian | 60 | 0.1% |
| English | 4,026 | 8.9% |
| Estonian | 8 | 0.0% |
| Ethiopian | 107 | 0.2% |
| European | 1,289 | 2.9% |
| Filipino | 76 | 0.2% |
| Finnish | 104 | 0.2% |
| French | 837 | 1.8% |
| French Canadian | 294 | 0.6% |
| German | 4,594 | 10.1% |
| Ghanaian | 106 | 0.2% |
| Greek | 95 | 0.2% |
| Guamanian / Chamorro | 22 | 0.1% |
| Guatemalan | 39 | 0.1% |
| Haitian | 6 | 0.0% |
| Honduran | 4 | 0.0% |
| Hungarian | 90 | 0.2% |
| Icelander | 28 | 0.1% |
| Indian (Asian) | 2,060 | 4.5% |
| Iranian | 135 | 0.3% |
| Iraqi | 7 | 0.0% |
| Irish | 3,897 | 8.6% |
| Israeli | 12 | 0.0% |
| Italian | 2,991 | 6.6% |
| Jamaican | 42 | 0.1% |
| Japanese | 79 | 0.2% |
| Korean | 2,132 | 4.7% |
| Laotian | 46 | 0.1% |
| Latvian | 70 | 0.2% |
| Lebanese | 49 | 0.1% |
| Lithuanian | 102 | 0.2% |
| Luxembourger | 11 | 0.0% |
| Malaysian | 51 | 0.1% |
| Mexican | 12,857 | 28.4% |
| Mexican American Indian | 246 | 0.5% |
| Mongolian | 12 | 0.0% |
| Native Hawaiian | 235 | 0.5% |
| Navajo | 13 | 0.0% |
| Nicaraguan | 63 | 0.1% |
| Nigerian | 75 | 0.2% |
| Northern European | 57 | 0.1% |
| Norwegian | 284 | 0.6% |
| Pakistani | 62 | 0.1% |
| Palestinian | 29 | 0.1% |
| Pennsylvania German | 41 | 0.1% |
| Peruvian | 186 | 0.4% |
| Polish | 577 | 1.3% |
| Portuguese | 818 | 1.8% |
| Puerto Rican | 274 | 0.6% |
| Romanian | 32 | 0.1% |
| Russian | 226 | 0.5% |
| Salvadoran | 233 | 0.5% |
| Samoan | 35 | 0.1% |
| Scandinavian | 212 | 0.5% |
| Scotch-Irish | 407 | 0.9% |
| Scottish | 815 | 1.8% |
| Seminole | 19 | 0.0% |
| Serbian | 12 | 0.0% |
| Slavic | 41 | 0.1% |
| Slovak | 36 | 0.1% |
| Slovene | 16 | 0.0% |
| South African | 8 | 0.0% |
| South American | 628 | 1.4% |
| South American Indian | 6 | 0.0% |
| Spaniard | 496 | 1.1% |
| Spanish | 129 | 0.3% |
| Sri Lankan | 1,521 | 3.4% |
| Subsaharan African | 450 | 1.0% |
| Swedish | 366 | 0.8% |
| Swiss | 281 | 0.6% |
| Thai | 1,742 | 3.8% |
| Trinidadian and Tobagonian | 7 | 0.0% |
| Turkish | 6 | 0.0% |
| Ukrainian | 141 | 0.3% |
| Uruguayan | 18 | 0.0% |
| Venezuelan | 31 | 0.1% |
| Vietnamese | 51 | 0.1% |
| Welsh | 313 | 0.7% |
| West Indian | 17 | 0.0% |
| Yugoslavian | 26 | 0.1% | View All 116 Rows |
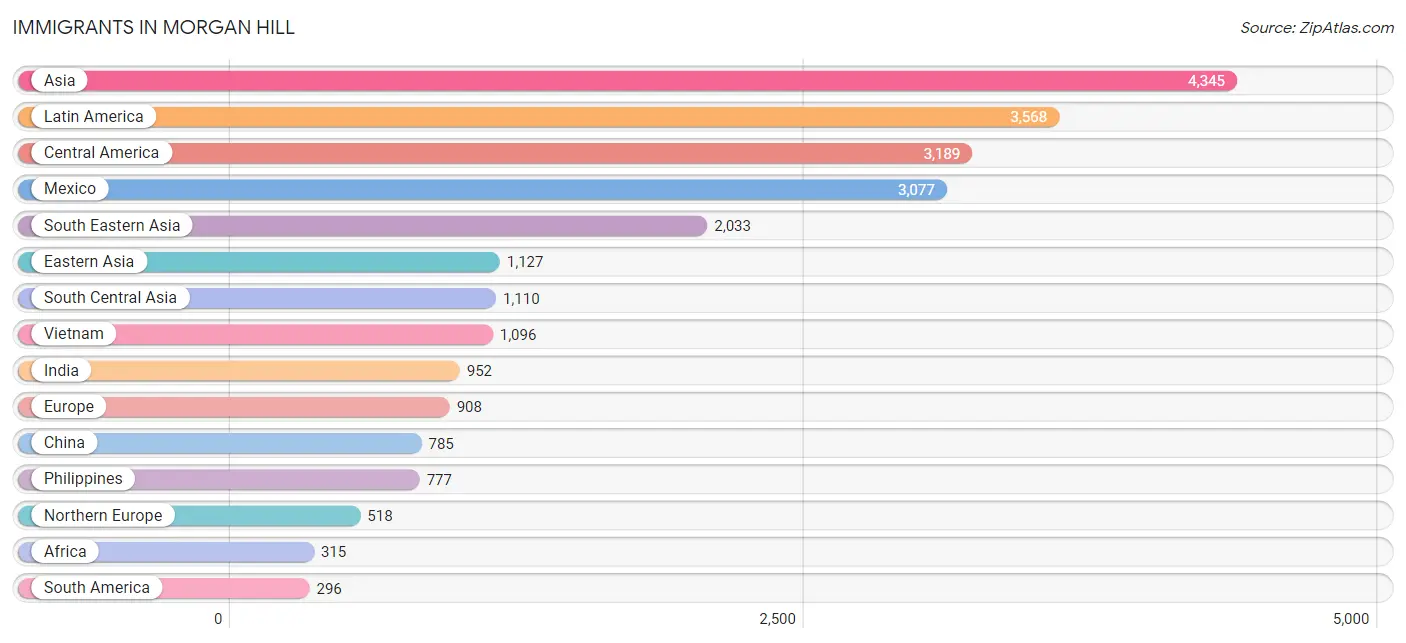
Immigrants in Morgan Hill
The most numerous immigrant groups reported in Morgan Hill came from Asia (4,345 | 9.6%), Latin America (3,568 | 7.9%), Central America (3,189 | 7.0%), Mexico (3,077 | 6.8%), and South Eastern Asia (2,033 | 4.5%), together accounting for 35.8% of all Morgan Hill residents.
| Immigration Origin | # Population | % Population |
| Africa | 315 | 0.7% |
| Argentina | 23 | 0.1% |
| Asia | 4,345 | 9.6% |
| Australia | 14 | 0.0% |
| Azores | 24 | 0.1% |
| Bangladesh | 32 | 0.1% |
| Belgium | 14 | 0.0% |
| Bolivia | 16 | 0.0% |
| Brazil | 113 | 0.3% |
| Cameroon | 103 | 0.2% |
| Canada | 239 | 0.5% |
| Caribbean | 83 | 0.2% |
| Central America | 3,189 | 7.0% |
| Chile | 21 | 0.1% |
| China | 785 | 1.7% |
| Colombia | 19 | 0.0% |
| Cuba | 83 | 0.2% |
| Czechoslovakia | 34 | 0.1% |
| Eastern Africa | 101 | 0.2% |
| Eastern Asia | 1,127 | 2.5% |
| Eastern Europe | 132 | 0.3% |
| Ecuador | 22 | 0.1% |
| Egypt | 30 | 0.1% |
| El Salvador | 40 | 0.1% |
| England | 162 | 0.4% |
| Ethiopia | 54 | 0.1% |
| Europe | 908 | 2.0% |
| Fiji | 11 | 0.0% |
| France | 13 | 0.0% |
| Germany | 66 | 0.2% |
| Ghana | 56 | 0.1% |
| Guatemala | 10 | 0.0% |
| Honduras | 4 | 0.0% |
| Hong Kong | 68 | 0.2% |
| India | 952 | 2.1% |
| Indonesia | 38 | 0.1% |
| Iran | 126 | 0.3% |
| Iraq | 7 | 0.0% |
| Ireland | 23 | 0.1% |
| Israel | 33 | 0.1% |
| Italy | 15 | 0.0% |
| Japan | 99 | 0.2% |
| Kenya | 16 | 0.0% |
| Korea | 243 | 0.5% |
| Laos | 61 | 0.1% |
| Latin America | 3,568 | 7.9% |
| Lebanon | 13 | 0.0% |
| Lithuania | 14 | 0.0% |
| Malaysia | 12 | 0.0% |
| Mexico | 3,077 | 6.8% |
| Middle Africa | 103 | 0.2% |
| Morocco | 4 | 0.0% |
| Netherlands | 71 | 0.2% |
| Nicaragua | 58 | 0.1% |
| Nigeria | 9 | 0.0% |
| Northern Africa | 34 | 0.1% |
| Northern Europe | 518 | 1.1% |
| Oceania | 25 | 0.1% |
| Peru | 26 | 0.1% |
| Philippines | 777 | 1.7% |
| Poland | 20 | 0.0% |
| Portugal | 60 | 0.1% |
| Romania | 12 | 0.0% |
| Russia | 52 | 0.1% |
| Saudi Arabia | 6 | 0.0% |
| Scotland | 40 | 0.1% |
| Singapore | 9 | 0.0% |
| South Africa | 12 | 0.0% |
| South America | 296 | 0.6% |
| South Central Asia | 1,110 | 2.5% |
| South Eastern Asia | 2,033 | 4.5% |
| Southern Europe | 94 | 0.2% |
| Spain | 19 | 0.0% |
| Sweden | 6 | 0.0% |
| Taiwan | 182 | 0.4% |
| Thailand | 40 | 0.1% |
| Turkey | 6 | 0.0% |
| Uganda | 31 | 0.1% |
| Uruguay | 18 | 0.0% |
| Venezuela | 31 | 0.1% |
| Vietnam | 1,096 | 2.4% |
| Western Africa | 65 | 0.1% |
| Western Asia | 71 | 0.2% |
| Western Europe | 164 | 0.4% |
| Yemen | 6 | 0.0% | View All 85 Rows |
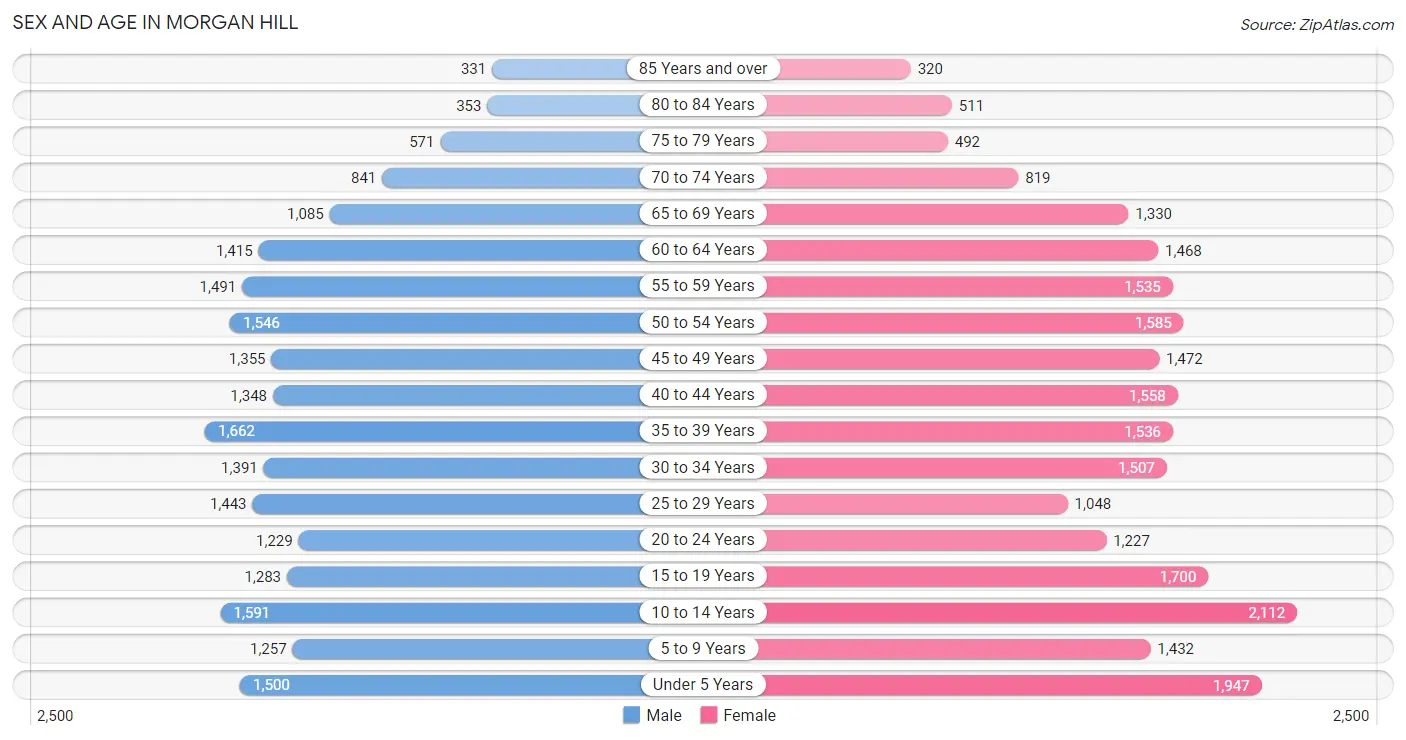
Sex and Age in Morgan Hill
Sex and Age in Morgan Hill
The most populous age groups in Morgan Hill are 35 to 39 Years (1,662 | 7.7%) for men and 10 to 14 Years (2,112 | 8.9%) for women.
| Age Bracket | Male | Female |
| Under 5 Years | 1,500 (6.9%) | 1,947 (8.3%) |
| 5 to 9 Years | 1,257 (5.8%) | 1,432 (6.1%) |
| 10 to 14 Years | 1,591 (7.3%) | 2,112 (8.9%) |
| 15 to 19 Years | 1,283 (5.9%) | 1,700 (7.2%) |
| 20 to 24 Years | 1,229 (5.7%) | 1,227 (5.2%) |
| 25 to 29 Years | 1,443 (6.7%) | 1,048 (4.4%) |
| 30 to 34 Years | 1,391 (6.4%) | 1,507 (6.4%) |
| 35 to 39 Years | 1,662 (7.7%) | 1,536 (6.5%) |
| 40 to 44 Years | 1,348 (6.2%) | 1,558 (6.6%) |
| 45 to 49 Years | 1,355 (6.2%) | 1,472 (6.2%) |
| 50 to 54 Years | 1,546 (7.1%) | 1,585 (6.7%) |
| 55 to 59 Years | 1,491 (6.9%) | 1,535 (6.5%) |
| 60 to 64 Years | 1,415 (6.5%) | 1,468 (6.2%) |
| 65 to 69 Years | 1,085 (5.0%) | 1,330 (5.6%) |
| 70 to 74 Years | 841 (3.9%) | 819 (3.5%) |
| 75 to 79 Years | 571 (2.6%) | 492 (2.1%) |
| 80 to 84 Years | 353 (1.6%) | 511 (2.2%) |
| 85 Years and over | 331 (1.5%) | 320 (1.4%) |
| Total | 21,692 (100.0%) | 23,599 (100.0%) |
Families and Households in Morgan Hill
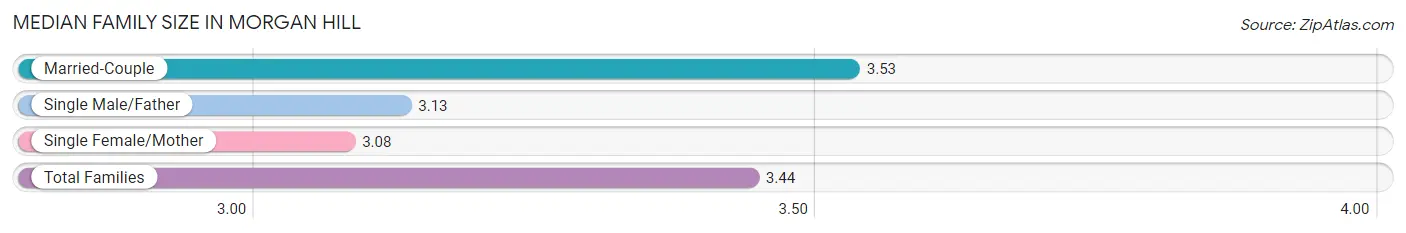
Median Family Size in Morgan Hill
The median family size in Morgan Hill is 3.44 persons per family, with married-couple families (9,187 | 79.1%) accounting for the largest median family size of 3.53 persons per family. On the other hand, single female/mother families (1,829 | 15.8%) represent the smallest median family size with 3.08 persons per family.
| Family Type | # Families | Family Size |
| Married-Couple | 9,187 (79.1%) | 3.53 |
| Single Male/Father | 595 (5.1%) | 3.13 |
| Single Female/Mother | 1,829 (15.8%) | 3.08 |
| Total Families | 11,611 (100.0%) | 3.44 |
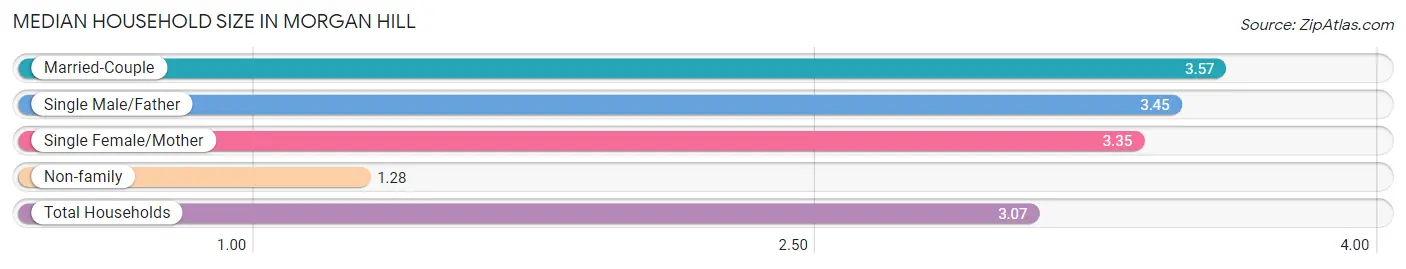
Median Household Size in Morgan Hill
The median household size in Morgan Hill is 3.07 persons per household, with married-couple households (9,187 | 63.0%) accounting for the largest median household size of 3.57 persons per household. non-family households (2,964 | 20.3%) represent the smallest median household size with 1.28 persons per household.
| Household Type | # Households | Household Size |
| Married-Couple | 9,187 (63.0%) | 3.57 |
| Single Male/Father | 595 (4.1%) | 3.45 |
| Single Female/Mother | 1,829 (12.6%) | 3.35 |
| Non-family | 2,964 (20.3%) | 1.28 |
| Total Households | 14,575 (100.0%) | 3.07 |
Household Size by Marriage Status in Morgan Hill
Out of a total of 14,575 households in Morgan Hill, 11,611 (79.7%) are family households, while 2,964 (20.3%) are nonfamily households. The most numerous type of family households are 2-person households, comprising 4,148, and the most common type of nonfamily households are 1-person households, comprising 2,339.
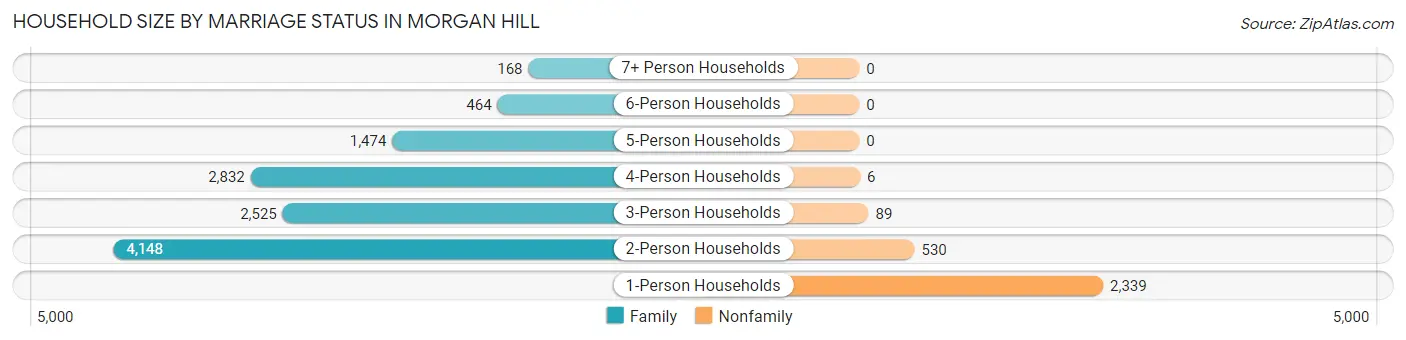
| Household Size | Family Households | Nonfamily Households |
| 1-Person Households | - | 2,339 (16.1%) |
| 2-Person Households | 4,148 (28.5%) | 530 (3.6%) |
| 3-Person Households | 2,525 (17.3%) | 89 (0.6%) |
| 4-Person Households | 2,832 (19.4%) | 6 (0.0%) |
| 5-Person Households | 1,474 (10.1%) | 0 (0.0%) |
| 6-Person Households | 464 (3.2%) | 0 (0.0%) |
| 7+ Person Households | 168 (1.1%) | 0 (0.0%) |
| Total | 11,611 (79.7%) | 2,964 (20.3%) |
Female Fertility in Morgan Hill
Fertility by Age in Morgan Hill
Average fertility rate in Morgan Hill is 56.0 births per 1,000 women. Women in the age bracket of 20 to 34 years have the highest fertility rate with 105.0 births per 1,000 women. Women in the age bracket of 20 to 34 years acount for 68.5% of all women with births.
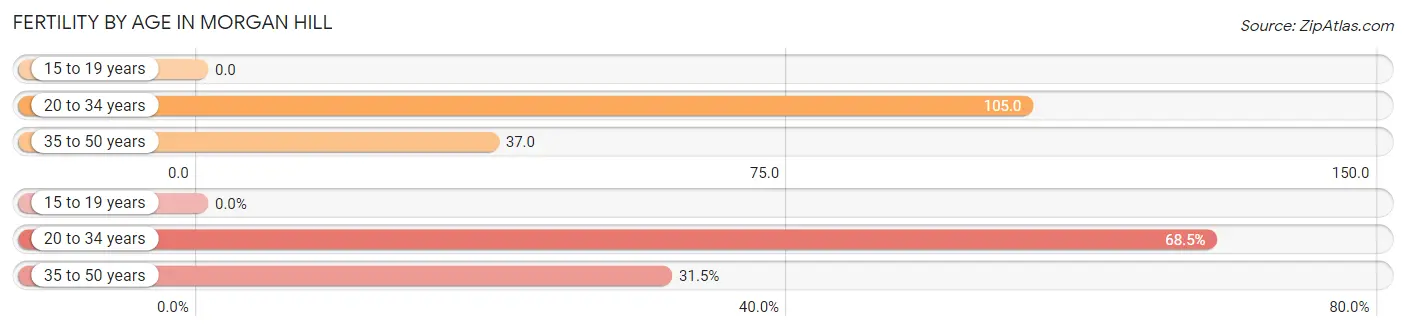
| Age Bracket | Women with Births | Births / 1,000 Women |
| 15 to 19 years | 0 (0.0%) | 0.0 |
| 20 to 34 years | 398 (68.5%) | 105.0 |
| 35 to 50 years | 183 (31.5%) | 37.0 |
| Total | 581 (100.0%) | 56.0 |
Fertility by Age by Marriage Status in Morgan Hill
73.7% of women with births (581) in Morgan Hill are married. The highest percentage of unmarried women with births falls into 20 to 34 years age bracket with 32.4% of them unmarried at the time of birth, while the lowest percentage of unmarried women with births belong to 35 to 50 years age bracket with 13.1% of them unmarried.
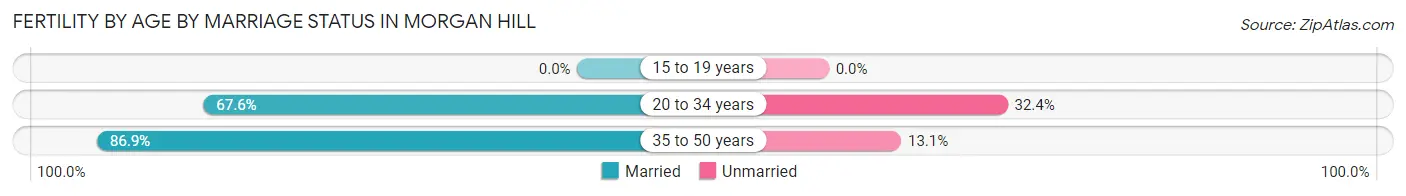
| Age Bracket | Married | Unmarried |
| 15 to 19 years | 0 (0.0%) | 0 (0.0%) |
| 20 to 34 years | 269 (67.6%) | 129 (32.4%) |
| 35 to 50 years | 159 (86.9%) | 24 (13.1%) |
| Total | 428 (73.7%) | 153 (26.3%) |
Fertility by Education in Morgan Hill
Average fertility rate in Morgan Hill is 56.0 births per 1,000 women. Women with the education attainment of bachelor's degree have the highest fertility rate of 97.0 births per 1,000 women, while women with the education attainment of college or associate's degree have the lowest fertility at 16.0 births per 1,000 women. Women with the education attainment of bachelor's degree represent 46.6% of all women with births.
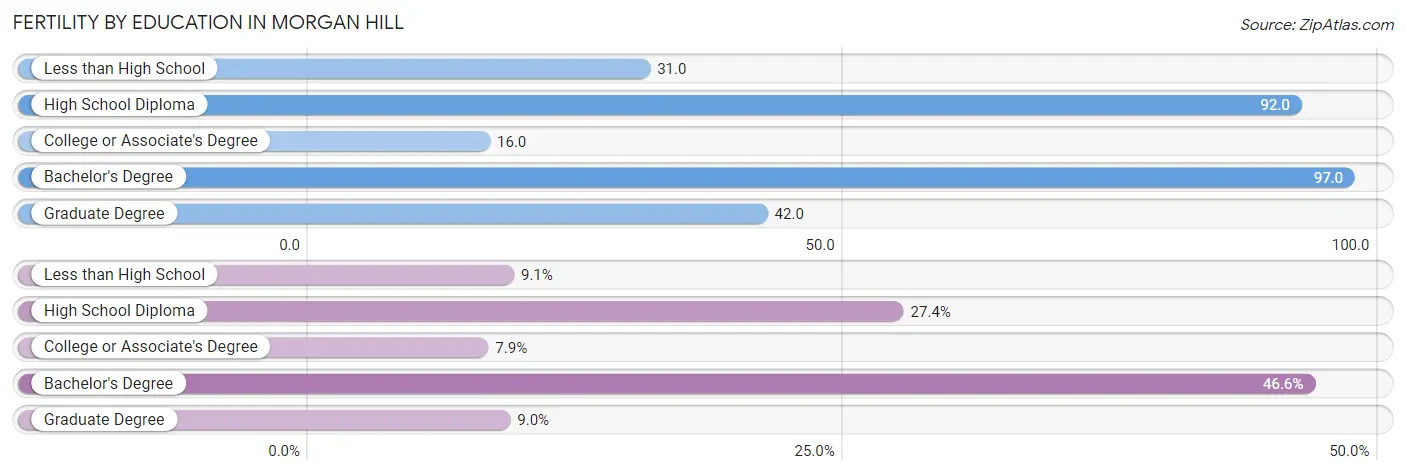
| Educational Attainment | Women with Births | Births / 1,000 Women |
| Less than High School | 53 (9.1%) | 31.0 |
| High School Diploma | 159 (27.4%) | 92.0 |
| College or Associate's Degree | 46 (7.9%) | 16.0 |
| Bachelor's Degree | 271 (46.6%) | 97.0 |
| Graduate Degree | 52 (8.9%) | 42.0 |
| Total | 581 (100.0%) | 56.0 |
Fertility by Education by Marriage Status in Morgan Hill
26.3% of women with births in Morgan Hill are unmarried. Women with the educational attainment of graduate degree are most likely to be married with 90.4% of them married at childbirth, while women with the educational attainment of less than high school are least likely to be married with 100.0% of them unmarried at childbirth.
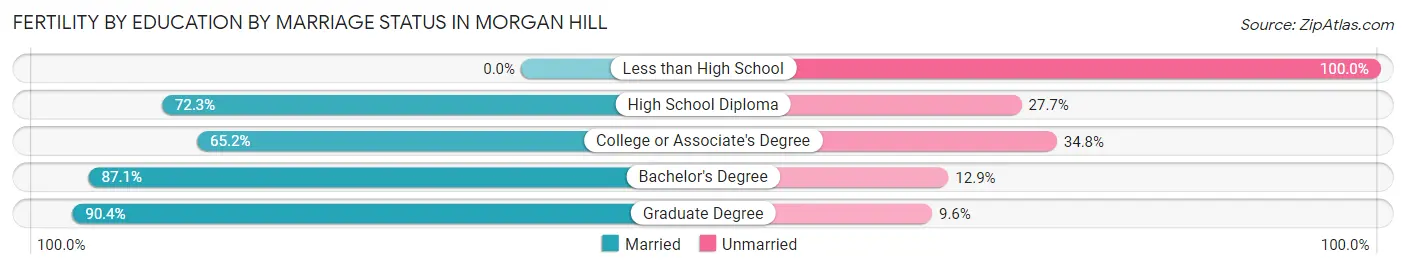
| Educational Attainment | Married | Unmarried |
| Less than High School | 0 (0.0%) | 53 (100.0%) |
| High School Diploma | 115 (72.3%) | 44 (27.7%) |
| College or Associate's Degree | 30 (65.2%) | 16 (34.8%) |
| Bachelor's Degree | 236 (87.1%) | 35 (12.9%) |
| Graduate Degree | 47 (90.4%) | 5 (9.6%) |
| Total | 428 (73.7%) | 153 (26.3%) |
Employment Characteristics in Morgan Hill
Employment by Class of Employer in Morgan Hill
Among the 20,981 employed individuals in Morgan Hill, private company employees (14,999 | 71.5%), local government employees (1,906 | 9.1%), and self-employed (not incorporated) (1,382 | 6.6%) make up the most common classes of employment.
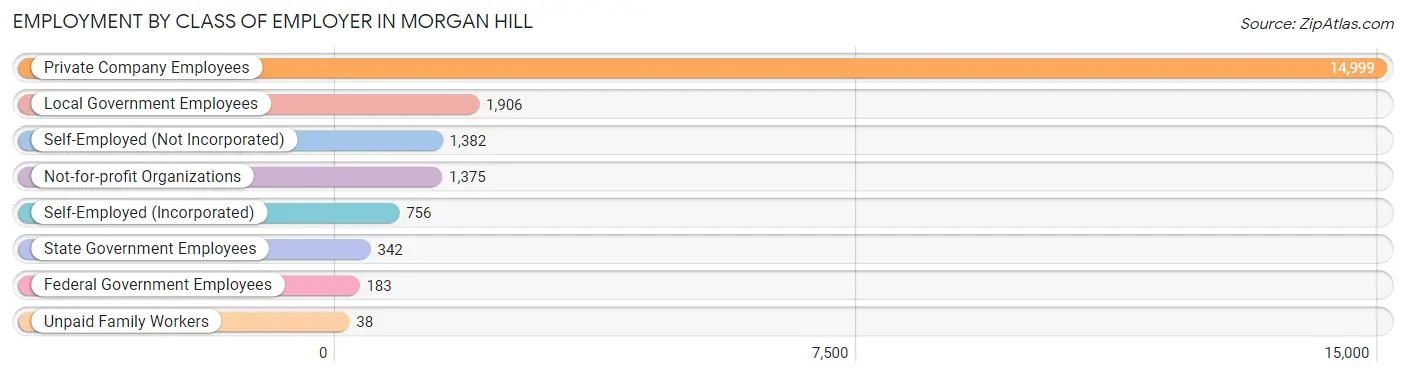
| Employer Class | # Employees | % Employees |
| Private Company Employees | 14,999 | 71.5% |
| Self-Employed (Incorporated) | 756 | 3.6% |
| Self-Employed (Not Incorporated) | 1,382 | 6.6% |
| Not-for-profit Organizations | 1,375 | 6.6% |
| Local Government Employees | 1,906 | 9.1% |
| State Government Employees | 342 | 1.6% |
| Federal Government Employees | 183 | 0.9% |
| Unpaid Family Workers | 38 | 0.2% |
| Total | 20,981 | 100.0% |
Employment Status by Age in Morgan Hill
According to the labor force statistics for Morgan Hill, out of the total population over 16 years of age (34,646), 66.5% or 23,040 individuals are in the labor force, with 4.9% or 1,129 of them unemployed. The age group with the highest labor force participation rate is 25 to 29 years, with 90.1% or 2,244 individuals in the labor force. Within the labor force, the 16 to 19 years age range has the highest percentage of unemployed individuals, with 18.8% or 150 of them being unemployed.
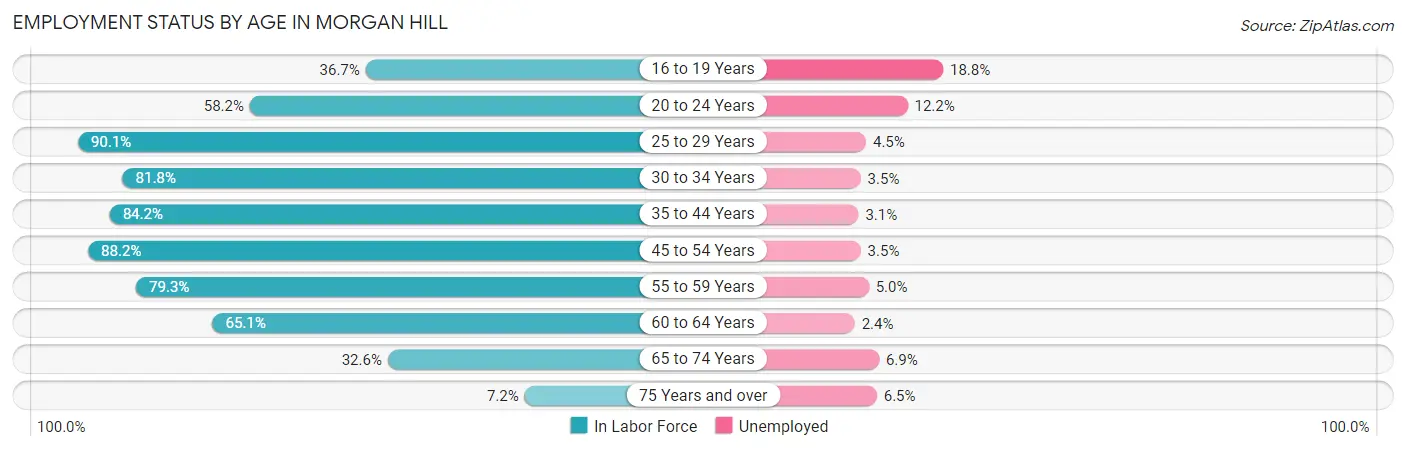
| Age Bracket | In Labor Force | Unemployed |
| 16 to 19 Years | 799 (36.7%) | 150 (18.8%) |
| 20 to 24 Years | 1,429 (58.2%) | 174 (12.2%) |
| 25 to 29 Years | 2,244 (90.1%) | 101 (4.5%) |
| 30 to 34 Years | 2,371 (81.8%) | 83 (3.5%) |
| 35 to 44 Years | 5,140 (84.2%) | 159 (3.1%) |
| 45 to 54 Years | 5,255 (88.2%) | 184 (3.5%) |
| 55 to 59 Years | 2,400 (79.3%) | 120 (5.0%) |
| 60 to 64 Years | 1,877 (65.1%) | 45 (2.4%) |
| 65 to 74 Years | 1,328 (32.6%) | 92 (6.9%) |
| 75 Years and over | 186 (7.2%) | 12 (6.5%) |
| Total | 23,040 (66.5%) | 1,129 (4.9%) |
Employment Status by Educational Attainment in Morgan Hill
According to labor force statistics for Morgan Hill, 82.6% of individuals (19,295) out of the total population between 25 and 64 years of age (23,360) are in the labor force, with 3.6% or 695 of them being unemployed. The group with the highest labor force participation rate are those with the educational attainment of bachelor's degree or higher, with 88.1% or 9,729 individuals in the labor force. Within the labor force, individuals with less than high school education have the highest percentage of unemployment, with 9.3% or 121 of them being unemployed.
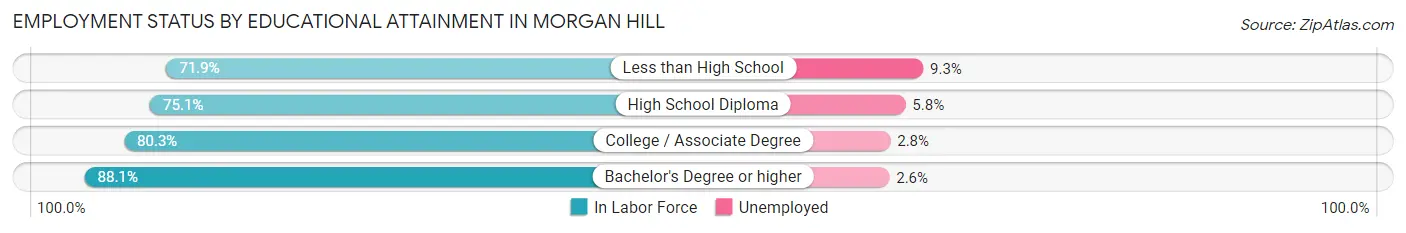
| Educational Attainment | In Labor Force | Unemployed |
| Less than High School | 1,304 (71.9%) | 169 (9.3%) |
| High School Diploma | 2,758 (75.1%) | 213 (5.8%) |
| College / Associate Degree | 5,485 (80.3%) | 191 (2.8%) |
| Bachelor's Degree or higher | 9,729 (88.1%) | 287 (2.6%) |
| Total | 19,295 (82.6%) | 841 (3.6%) |
Employment Occupations by Sex in Morgan Hill
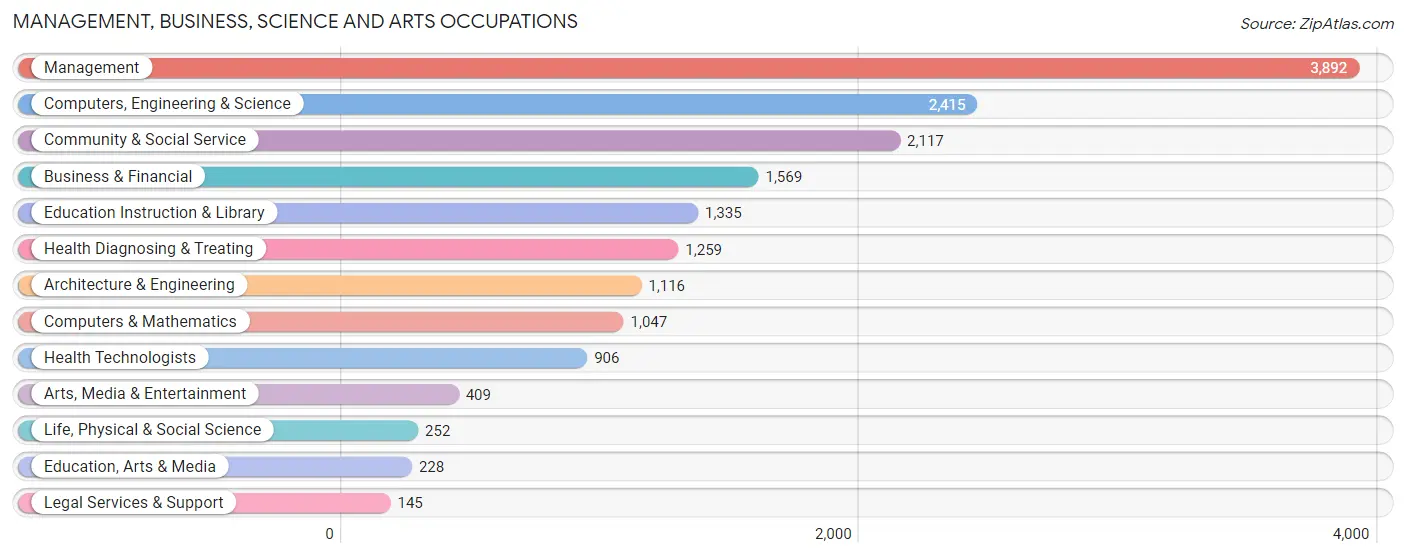
Management, Business, Science and Arts Occupations
The most common Management, Business, Science and Arts occupations in Morgan Hill are Management (3,892 | 17.8%), Computers, Engineering & Science (2,415 | 11.0%), Community & Social Service (2,117 | 9.7%), Business & Financial (1,569 | 7.2%), and Education Instruction & Library (1,335 | 6.1%).
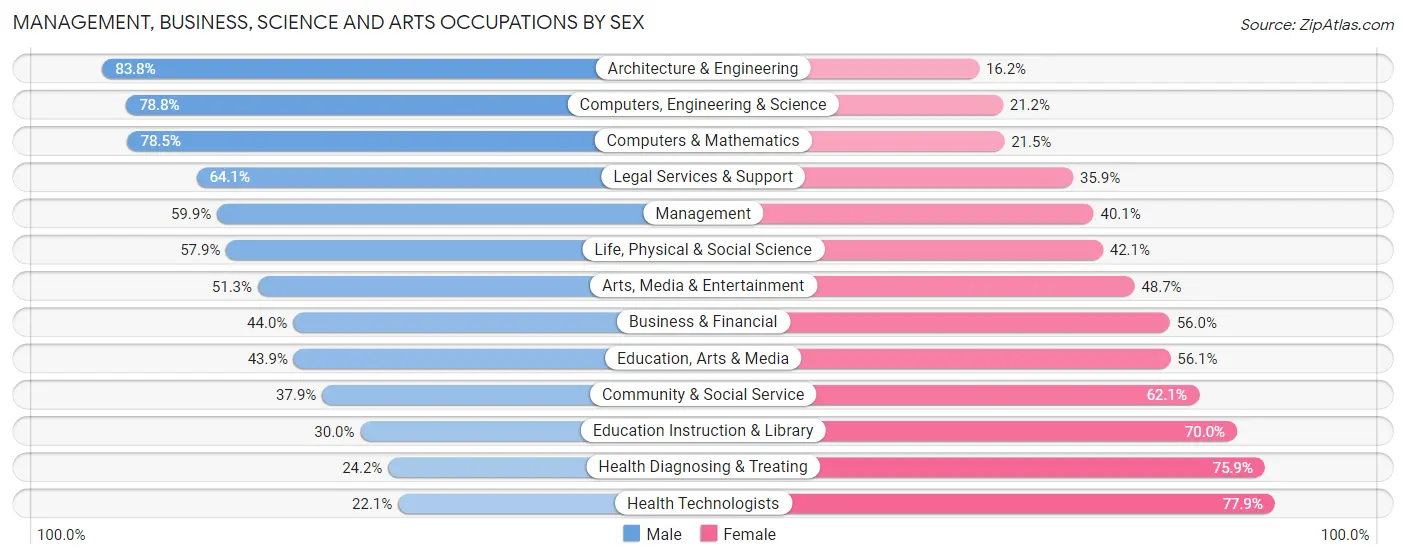
Management, Business, Science and Arts Occupations by Sex
Within the Management, Business, Science and Arts occupations in Morgan Hill, the most male-oriented occupations are Architecture & Engineering (83.8%), Computers, Engineering & Science (78.8%), and Computers & Mathematics (78.5%), while the most female-oriented occupations are Health Technologists (77.9%), Health Diagnosing & Treating (75.8%), and Education Instruction & Library (70.0%).
| Occupation | Male | Female |
| Management | 2,330 (59.9%) | 1,562 (40.1%) |
| Business & Financial | 690 (44.0%) | 879 (56.0%) |
| Computers, Engineering & Science | 1,903 (78.8%) | 512 (21.2%) |
| Computers & Mathematics | 822 (78.5%) | 225 (21.5%) |
| Architecture & Engineering | 935 (83.8%) | 181 (16.2%) |
| Life, Physical & Social Science | 146 (57.9%) | 106 (42.1%) |
| Community & Social Service | 803 (37.9%) | 1,314 (62.1%) |
| Education, Arts & Media | 100 (43.9%) | 128 (56.1%) |
| Legal Services & Support | 93 (64.1%) | 52 (35.9%) |
| Education Instruction & Library | 400 (30.0%) | 935 (70.0%) |
| Arts, Media & Entertainment | 210 (51.3%) | 199 (48.7%) |
| Health Diagnosing & Treating | 304 (24.1%) | 955 (75.8%) |
| Health Technologists | 200 (22.1%) | 706 (77.9%) |
| Total (Category) | 6,030 (53.6%) | 5,222 (46.4%) |
| Total (Overall) | 11,910 (54.4%) | 9,996 (45.6%) |
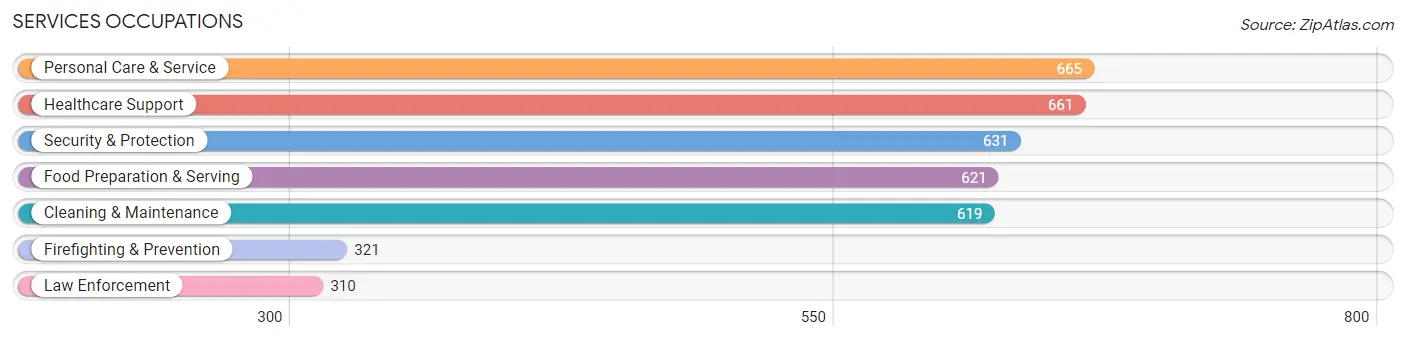
Services Occupations
The most common Services occupations in Morgan Hill are Personal Care & Service (665 | 3.0%), Healthcare Support (661 | 3.0%), Security & Protection (631 | 2.9%), Food Preparation & Serving (621 | 2.8%), and Cleaning & Maintenance (619 | 2.8%).
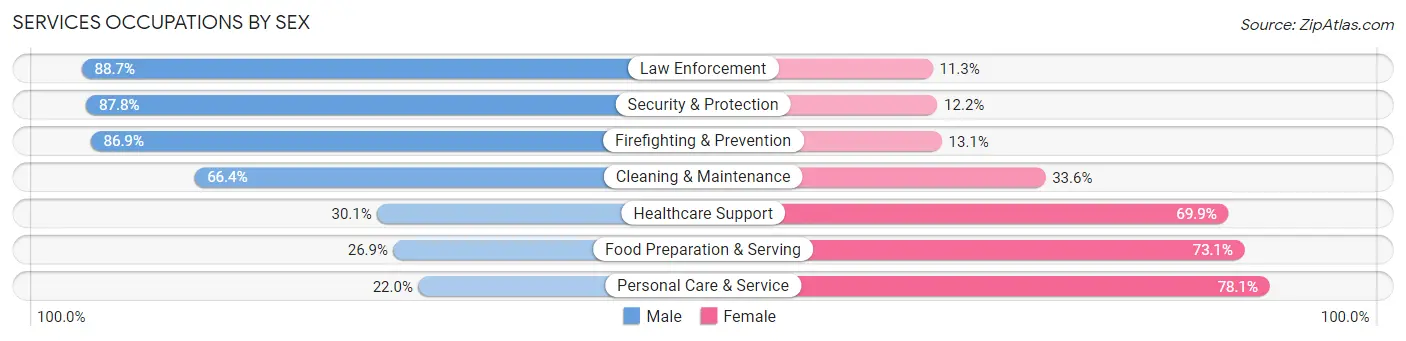
Services Occupations by Sex
Within the Services occupations in Morgan Hill, the most male-oriented occupations are Law Enforcement (88.7%), Security & Protection (87.8%), and Firefighting & Prevention (86.9%), while the most female-oriented occupations are Personal Care & Service (78.0%), Food Preparation & Serving (73.1%), and Healthcare Support (69.9%).
| Occupation | Male | Female |
| Healthcare Support | 199 (30.1%) | 462 (69.9%) |
| Security & Protection | 554 (87.8%) | 77 (12.2%) |
| Firefighting & Prevention | 279 (86.9%) | 42 (13.1%) |
| Law Enforcement | 275 (88.7%) | 35 (11.3%) |
| Food Preparation & Serving | 167 (26.9%) | 454 (73.1%) |
| Cleaning & Maintenance | 411 (66.4%) | 208 (33.6%) |
| Personal Care & Service | 146 (22.0%) | 519 (78.0%) |
| Total (Category) | 1,477 (46.2%) | 1,720 (53.8%) |
| Total (Overall) | 11,910 (54.4%) | 9,996 (45.6%) |
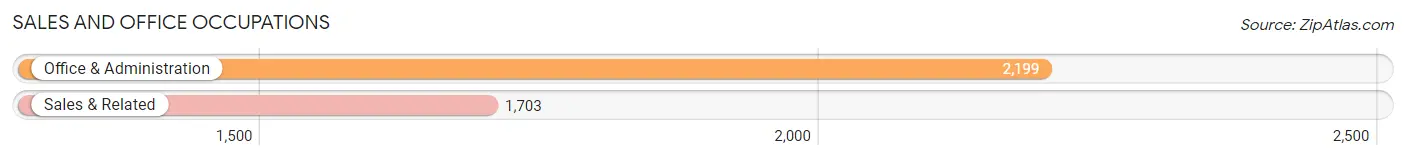
Sales and Office Occupations
The most common Sales and Office occupations in Morgan Hill are Office & Administration (2,199 | 10.0%), and Sales & Related (1,703 | 7.8%).
Sales and Office Occupations by Sex
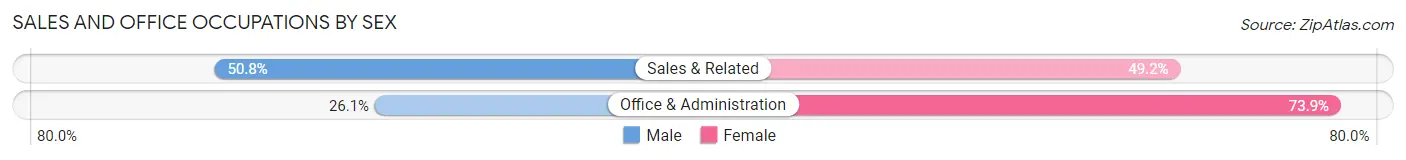
| Occupation | Male | Female |
| Sales & Related | 865 (50.8%) | 838 (49.2%) |
| Office & Administration | 574 (26.1%) | 1,625 (73.9%) |
| Total (Category) | 1,439 (36.9%) | 2,463 (63.1%) |
| Total (Overall) | 11,910 (54.4%) | 9,996 (45.6%) |
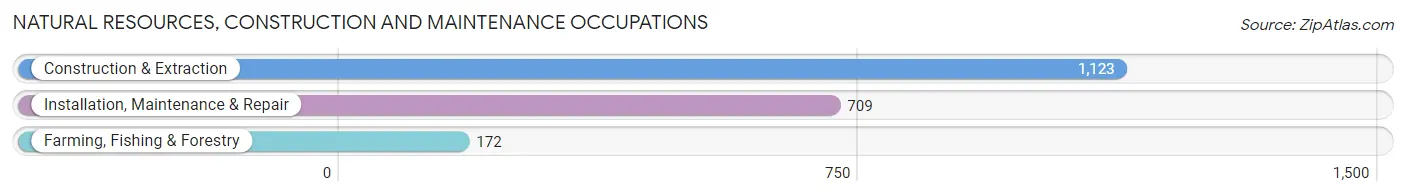
Natural Resources, Construction and Maintenance Occupations
The most common Natural Resources, Construction and Maintenance occupations in Morgan Hill are Construction & Extraction (1,123 | 5.1%), Installation, Maintenance & Repair (709 | 3.2%), and Farming, Fishing & Forestry (172 | 0.8%).
Natural Resources, Construction and Maintenance Occupations by Sex
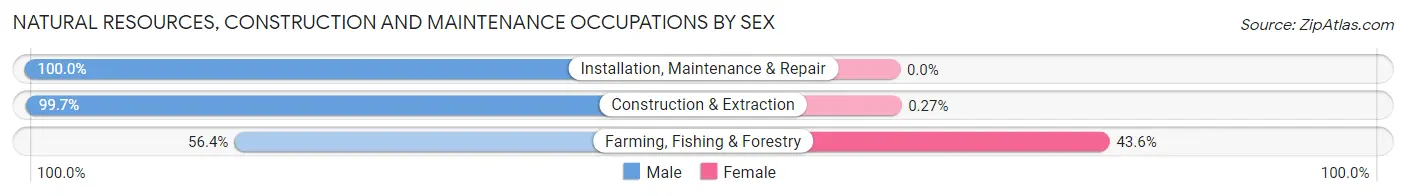
| Occupation | Male | Female |
| Farming, Fishing & Forestry | 97 (56.4%) | 75 (43.6%) |
| Construction & Extraction | 1,120 (99.7%) | 3 (0.3%) |
| Installation, Maintenance & Repair | 709 (100.0%) | 0 (0.0%) |
| Total (Category) | 1,926 (96.1%) | 78 (3.9%) |
| Total (Overall) | 11,910 (54.4%) | 9,996 (45.6%) |
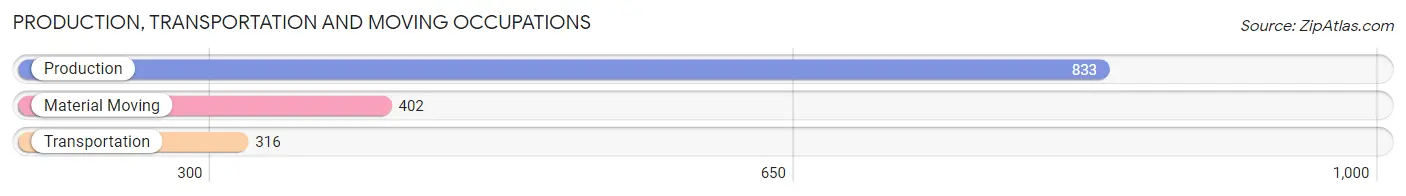
Production, Transportation and Moving Occupations
The most common Production, Transportation and Moving occupations in Morgan Hill are Production (833 | 3.8%), Material Moving (402 | 1.8%), and Transportation (316 | 1.4%).
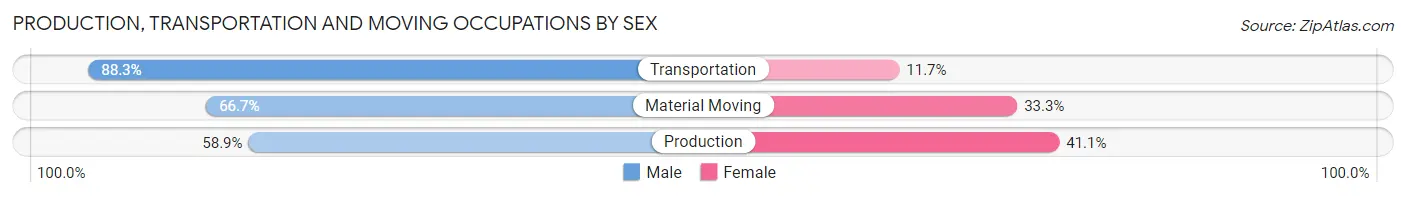
Production, Transportation and Moving Occupations by Sex
| Occupation | Male | Female |
| Production | 491 (58.9%) | 342 (41.1%) |
| Transportation | 279 (88.3%) | 37 (11.7%) |
| Material Moving | 268 (66.7%) | 134 (33.3%) |
| Total (Category) | 1,038 (66.9%) | 513 (33.1%) |
| Total (Overall) | 11,910 (54.4%) | 9,996 (45.6%) |
Employment Industries by Sex in Morgan Hill
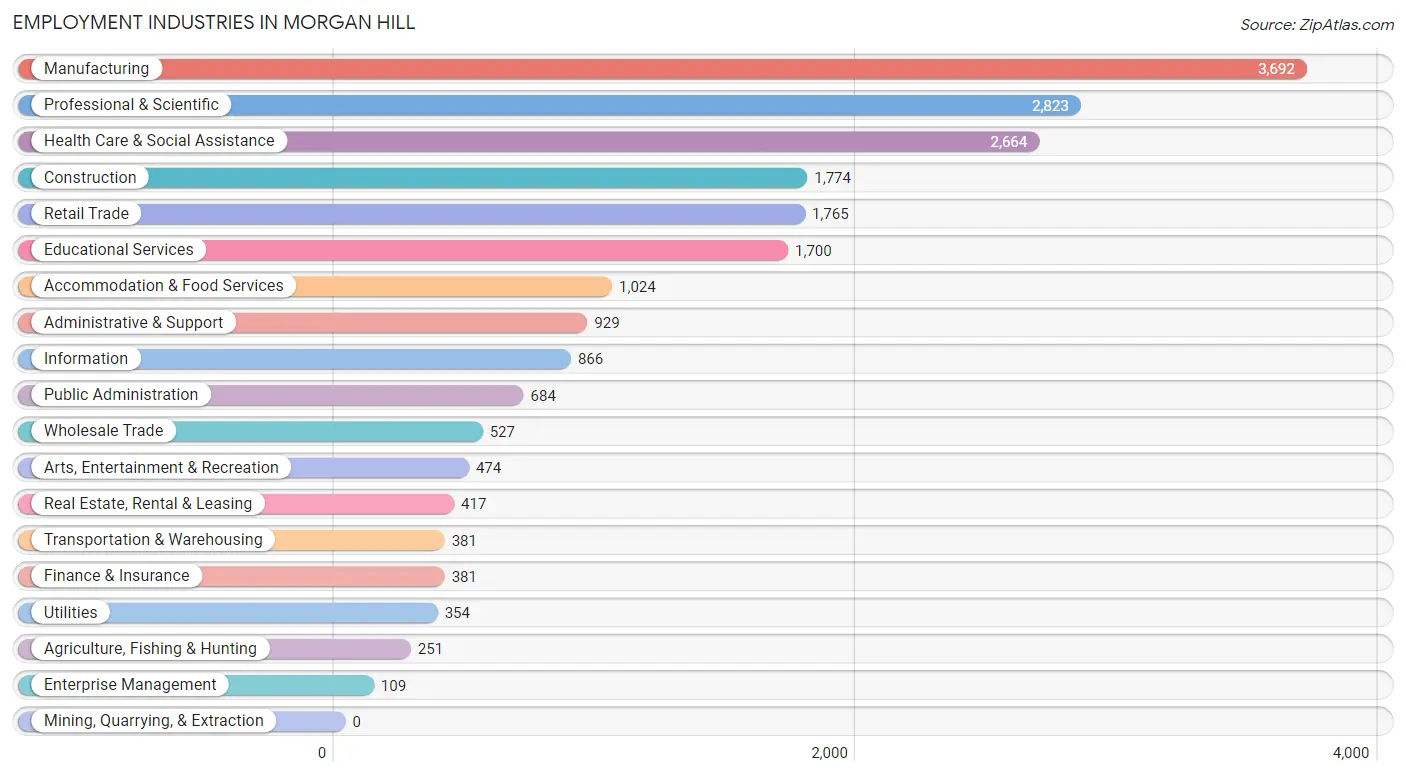
Employment Industries in Morgan Hill
The major employment industries in Morgan Hill include Manufacturing (3,692 | 16.9%), Professional & Scientific (2,823 | 12.9%), Health Care & Social Assistance (2,664 | 12.2%), Construction (1,774 | 8.1%), and Retail Trade (1,765 | 8.1%).
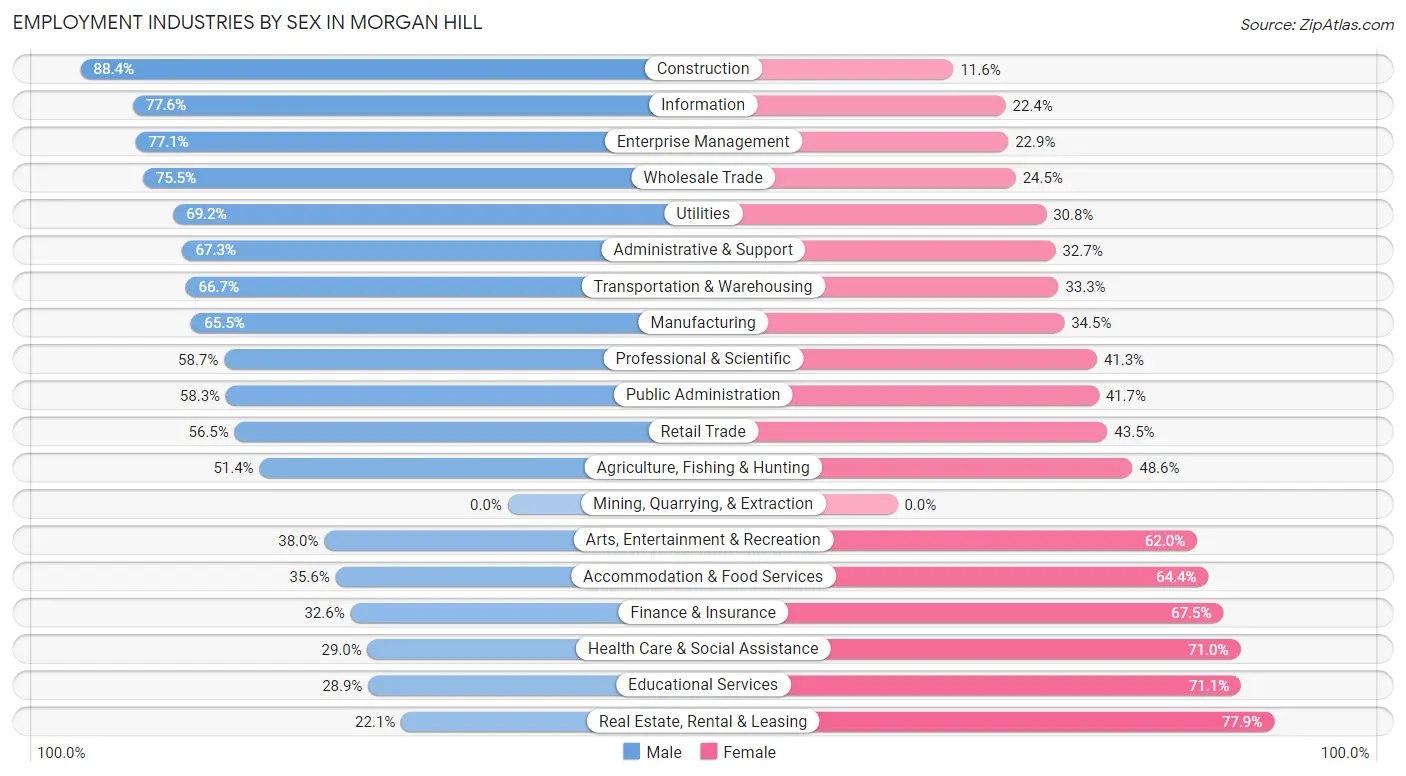
Employment Industries by Sex in Morgan Hill
The Morgan Hill industries that see more men than women are Construction (88.4%), Information (77.6%), and Enterprise Management (77.1%), whereas the industries that tend to have a higher number of women are Real Estate, Rental & Leasing (77.9%), Educational Services (71.1%), and Health Care & Social Assistance (71.0%).
| Industry | Male | Female |
| Agriculture, Fishing & Hunting | 129 (51.4%) | 122 (48.6%) |
| Mining, Quarrying, & Extraction | 0 (0.0%) | 0 (0.0%) |
| Construction | 1,568 (88.4%) | 206 (11.6%) |
| Manufacturing | 2,417 (65.5%) | 1,275 (34.5%) |
| Wholesale Trade | 398 (75.5%) | 129 (24.5%) |
| Retail Trade | 998 (56.5%) | 767 (43.5%) |
| Transportation & Warehousing | 254 (66.7%) | 127 (33.3%) |
| Utilities | 245 (69.2%) | 109 (30.8%) |
| Information | 672 (77.6%) | 194 (22.4%) |
| Finance & Insurance | 124 (32.6%) | 257 (67.4%) |
| Real Estate, Rental & Leasing | 92 (22.1%) | 325 (77.9%) |
| Professional & Scientific | 1,657 (58.7%) | 1,166 (41.3%) |
| Enterprise Management | 84 (77.1%) | 25 (22.9%) |
| Administrative & Support | 625 (67.3%) | 304 (32.7%) |
| Educational Services | 491 (28.9%) | 1,209 (71.1%) |
| Health Care & Social Assistance | 773 (29.0%) | 1,891 (71.0%) |
| Arts, Entertainment & Recreation | 180 (38.0%) | 294 (62.0%) |
| Accommodation & Food Services | 365 (35.6%) | 659 (64.4%) |
| Public Administration | 399 (58.3%) | 285 (41.7%) |
| Total | 11,910 (54.4%) | 9,996 (45.6%) |
Education in Morgan Hill
School Enrollment in Morgan Hill
The most common levels of schooling among the 12,242 students in Morgan Hill are middle school (2,767 | 22.6%), high school (2,767 | 22.6%), and elementary school (2,491 | 20.3%).
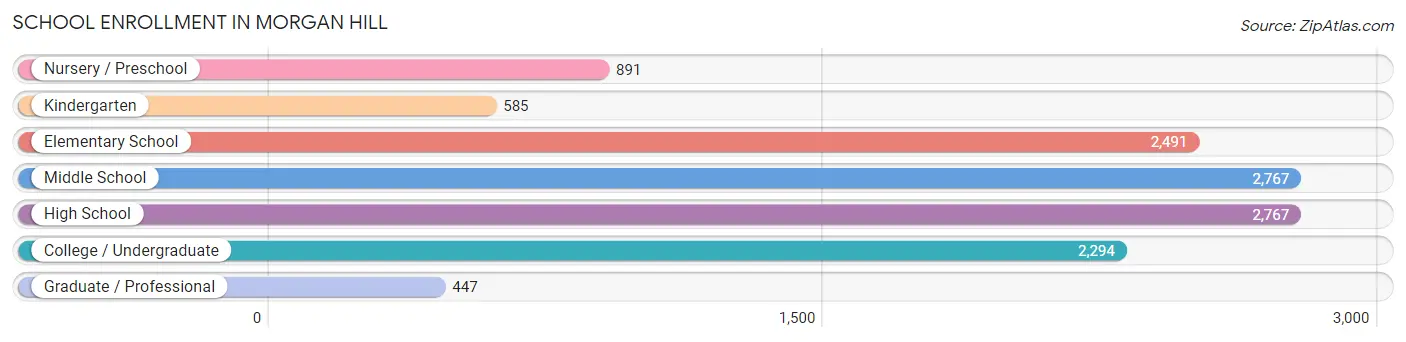
| School Level | # Students | % Students |
| Nursery / Preschool | 891 | 7.3% |
| Kindergarten | 585 | 4.8% |
| Elementary School | 2,491 | 20.3% |
| Middle School | 2,767 | 22.6% |
| High School | 2,767 | 22.6% |
| College / Undergraduate | 2,294 | 18.7% |
| Graduate / Professional | 447 | 3.6% |
| Total | 12,242 | 100.0% |
School Enrollment by Age by Funding Source in Morgan Hill
Out of a total of 12,242 students who are enrolled in schools in Morgan Hill, 2,595 (21.2%) attend a private institution, while the remaining 9,647 (78.8%) are enrolled in public schools. The age group of 3 to 4 year olds has the highest likelihood of being enrolled in private schools, with 642 (82.0% in the age bracket) enrolled. Conversely, the age group of 25 to 34 year olds has the lowest likelihood of being enrolled in a private school, with 446 (89.9% in the age bracket) attending a public institution.
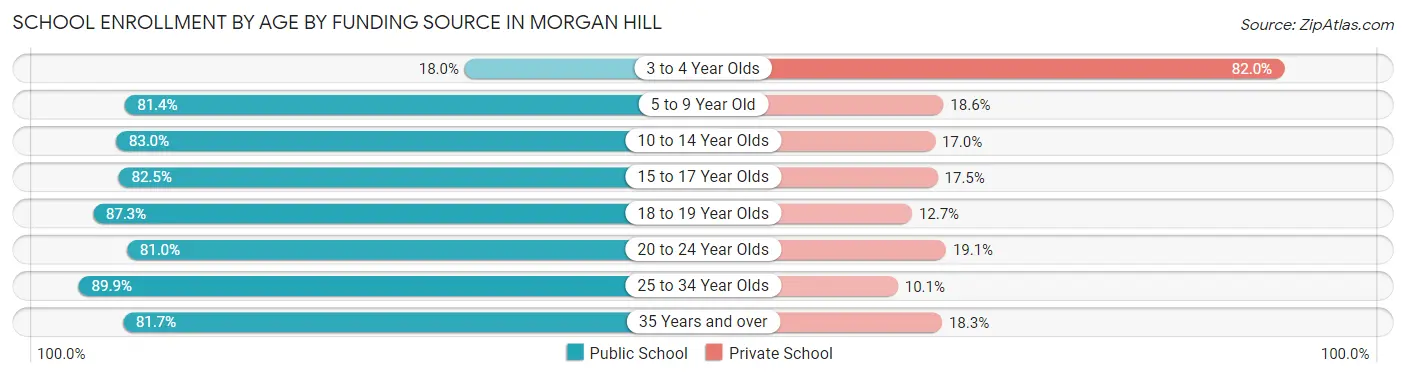
| Age Bracket | Public School | Private School |
| 3 to 4 Year Olds | 141 (18.0%) | 642 (82.0%) |
| 5 to 9 Year Old | 2,121 (81.4%) | 484 (18.6%) |
| 10 to 14 Year Olds | 3,030 (83.0%) | 621 (17.0%) |
| 15 to 17 Year Olds | 1,584 (82.5%) | 336 (17.5%) |
| 18 to 19 Year Olds | 837 (87.3%) | 122 (12.7%) |
| 20 to 24 Year Olds | 799 (80.9%) | 188 (19.1%) |
| 25 to 34 Year Olds | 446 (89.9%) | 50 (10.1%) |
| 35 Years and over | 687 (81.7%) | 154 (18.3%) |
| Total | 9,647 (78.8%) | 2,595 (21.2%) |
Educational Attainment by Field of Study in Morgan Hill
Business (2,641 | 18.0%), engineering (2,494 | 17.0%), science & technology (1,354 | 9.2%), social sciences (1,121 | 7.7%), and computers & mathematics (944 | 6.5%) are the most common fields of study among 14,633 individuals in Morgan Hill who have obtained a bachelor's degree or higher.
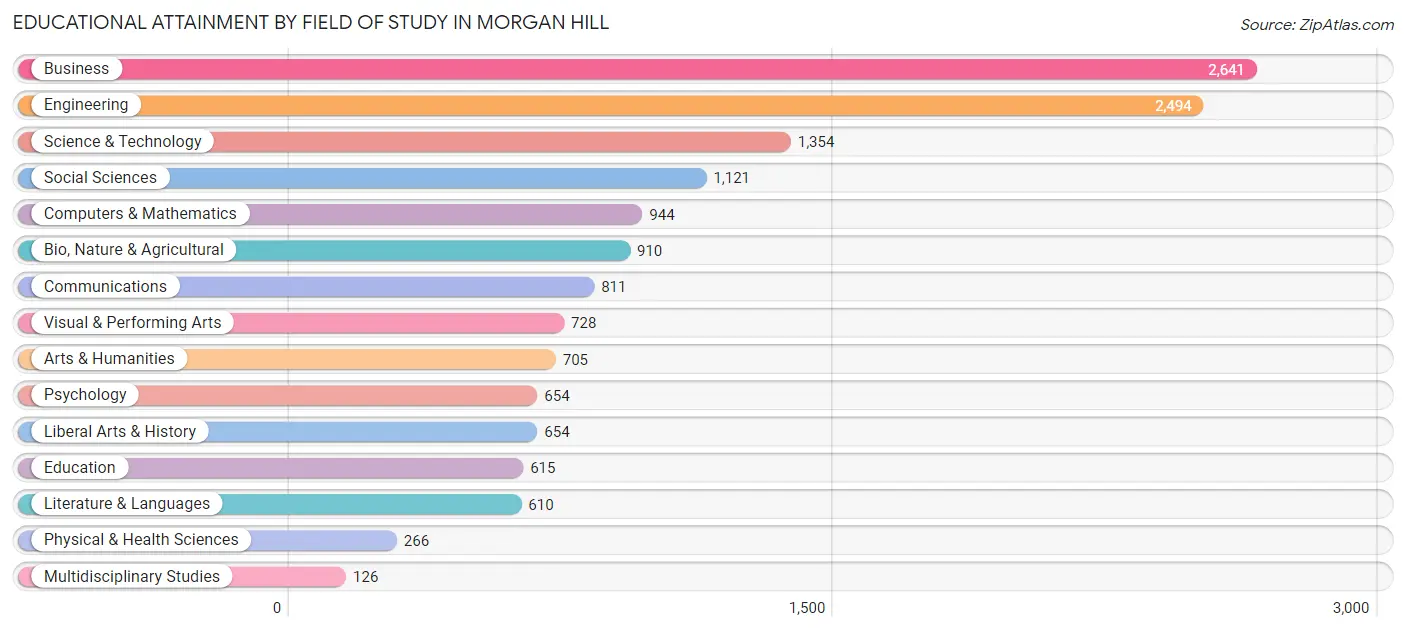
| Field of Study | # Graduates | % Graduates |
| Computers & Mathematics | 944 | 6.5% |
| Bio, Nature & Agricultural | 910 | 6.2% |
| Physical & Health Sciences | 266 | 1.8% |
| Psychology | 654 | 4.5% |
| Social Sciences | 1,121 | 7.7% |
| Engineering | 2,494 | 17.0% |
| Multidisciplinary Studies | 126 | 0.9% |
| Science & Technology | 1,354 | 9.2% |
| Business | 2,641 | 18.0% |
| Education | 615 | 4.2% |
| Literature & Languages | 610 | 4.2% |
| Liberal Arts & History | 654 | 4.5% |
| Visual & Performing Arts | 728 | 5.0% |
| Communications | 811 | 5.5% |
| Arts & Humanities | 705 | 4.8% |
| Total | 14,633 | 100.0% |
Transportation & Commute in Morgan Hill
Vehicle Availability by Sex in Morgan Hill
The most prevalent vehicle ownership categories in Morgan Hill are males with 2 vehicles (5,179, accounting for 44.6%) and females with 2 vehicles (3,758, making up 55.3%).
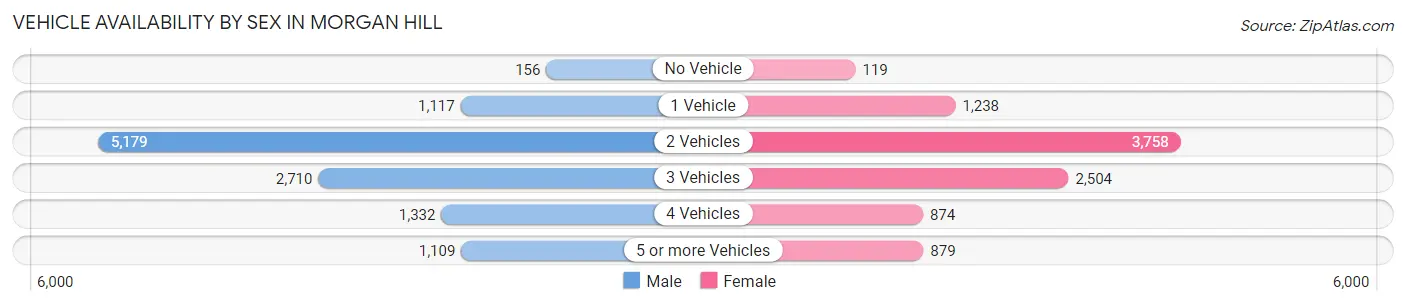
| Vehicles Available | Male | Female |
| No Vehicle | 156 (1.3%) | 119 (1.3%) |
| 1 Vehicle | 1,117 (9.6%) | 1,238 (13.2%) |
| 2 Vehicles | 5,179 (44.6%) | 3,758 (40.1%) |
| 3 Vehicles | 2,710 (23.4%) | 2,504 (26.7%) |
| 4 Vehicles | 1,332 (11.5%) | 874 (9.3%) |
| 5 or more Vehicles | 1,109 (9.6%) | 879 (9.4%) |
| Total | 11,603 (100.0%) | 9,372 (100.0%) |
Commute Time in Morgan Hill
The most frequently occuring commute durations in Morgan Hill are 60 to 89 minutes (2,691 commuters, 15.4%), 45 to 59 minutes (2,533 commuters, 14.5%), and 30 to 34 minutes (1,840 commuters, 10.6%).
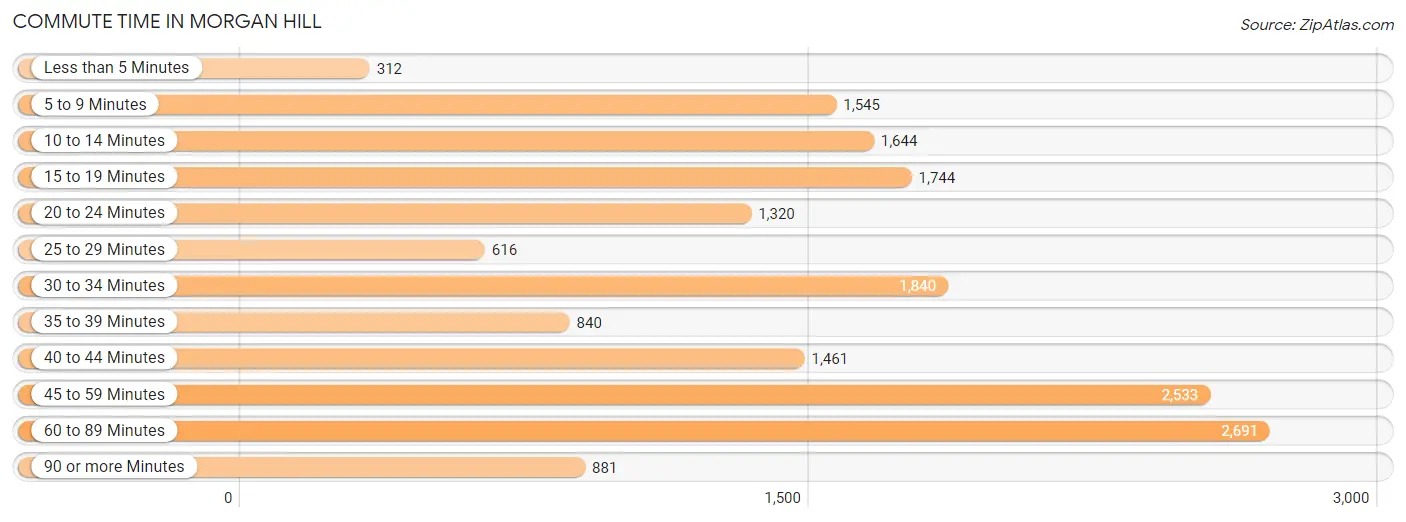
| Commute Time | # Commuters | % Commuters |
| Less than 5 Minutes | 312 | 1.8% |
| 5 to 9 Minutes | 1,545 | 8.9% |
| 10 to 14 Minutes | 1,644 | 9.4% |
| 15 to 19 Minutes | 1,744 | 10.0% |
| 20 to 24 Minutes | 1,320 | 7.6% |
| 25 to 29 Minutes | 616 | 3.5% |
| 30 to 34 Minutes | 1,840 | 10.6% |
| 35 to 39 Minutes | 840 | 4.8% |
| 40 to 44 Minutes | 1,461 | 8.4% |
| 45 to 59 Minutes | 2,533 | 14.5% |
| 60 to 89 Minutes | 2,691 | 15.4% |
| 90 or more Minutes | 881 | 5.1% |
Commute Time by Sex in Morgan Hill
The most common commute times in Morgan Hill are 60 to 89 minutes (1,836 commuters, 19.0%) for males and 45 to 59 minutes (1,022 commuters, 13.2%) for females.
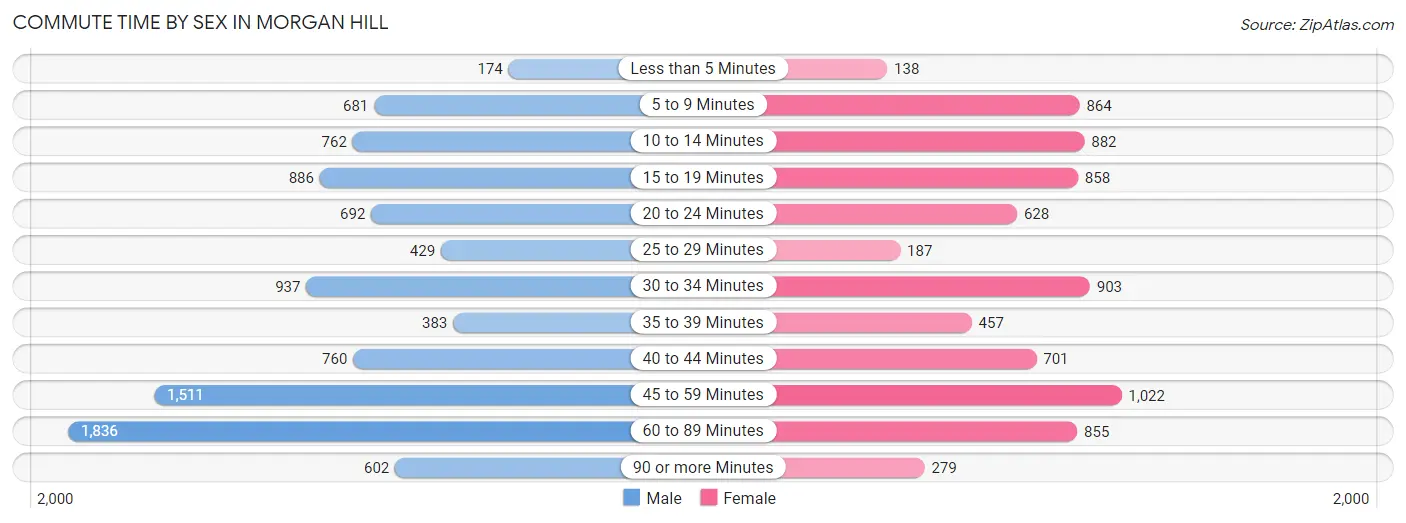
| Commute Time | Male | Female |
| Less than 5 Minutes | 174 (1.8%) | 138 (1.8%) |
| 5 to 9 Minutes | 681 (7.0%) | 864 (11.1%) |
| 10 to 14 Minutes | 762 (7.9%) | 882 (11.4%) |
| 15 to 19 Minutes | 886 (9.2%) | 858 (11.0%) |
| 20 to 24 Minutes | 692 (7.2%) | 628 (8.1%) |
| 25 to 29 Minutes | 429 (4.4%) | 187 (2.4%) |
| 30 to 34 Minutes | 937 (9.7%) | 903 (11.6%) |
| 35 to 39 Minutes | 383 (4.0%) | 457 (5.9%) |
| 40 to 44 Minutes | 760 (7.9%) | 701 (9.0%) |
| 45 to 59 Minutes | 1,511 (15.7%) | 1,022 (13.2%) |
| 60 to 89 Minutes | 1,836 (19.0%) | 855 (11.0%) |
| 90 or more Minutes | 602 (6.2%) | 279 (3.6%) |
Time of Departure to Work by Sex in Morgan Hill
The most frequent times of departure to work in Morgan Hill are 7:00 AM to 7:29 AM (1,283, 13.3%) for males and 7:00 AM to 7:29 AM (1,458, 18.8%) for females.
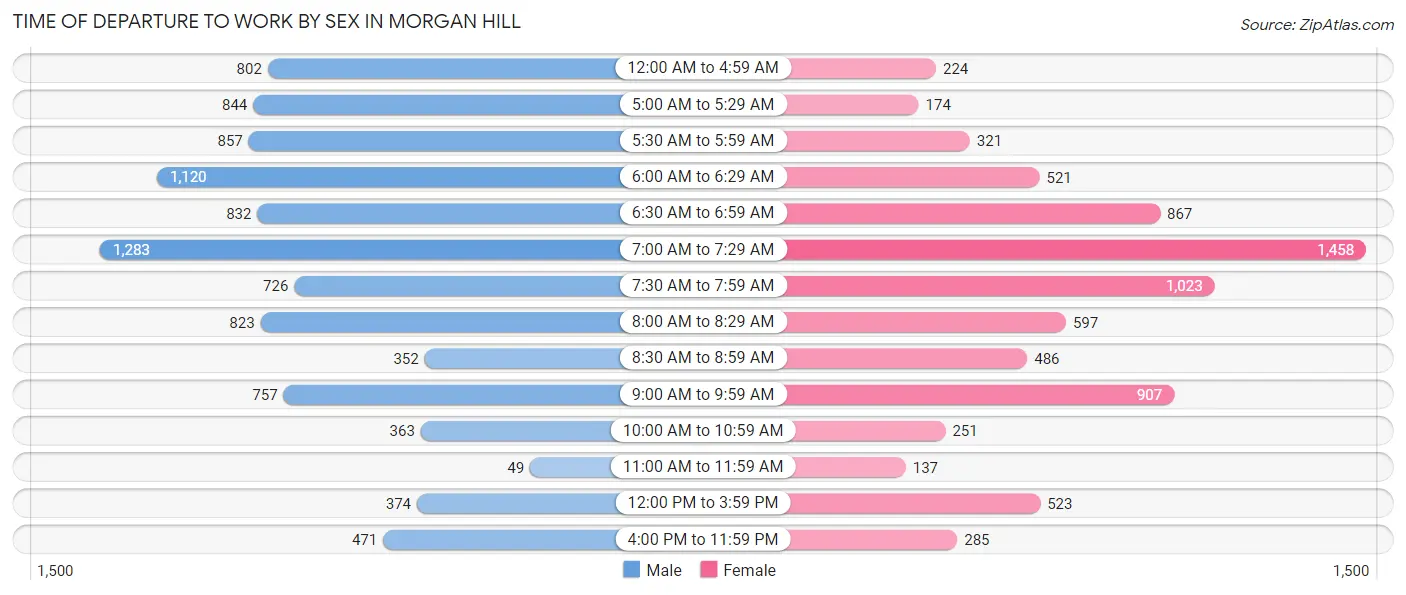
| Time of Departure | Male | Female |
| 12:00 AM to 4:59 AM | 802 (8.3%) | 224 (2.9%) |
| 5:00 AM to 5:29 AM | 844 (8.7%) | 174 (2.2%) |
| 5:30 AM to 5:59 AM | 857 (8.9%) | 321 (4.1%) |
| 6:00 AM to 6:29 AM | 1,120 (11.6%) | 521 (6.7%) |
| 6:30 AM to 6:59 AM | 832 (8.6%) | 867 (11.2%) |
| 7:00 AM to 7:29 AM | 1,283 (13.3%) | 1,458 (18.8%) |
| 7:30 AM to 7:59 AM | 726 (7.5%) | 1,023 (13.2%) |
| 8:00 AM to 8:29 AM | 823 (8.5%) | 597 (7.7%) |
| 8:30 AM to 8:59 AM | 352 (3.6%) | 486 (6.2%) |
| 9:00 AM to 9:59 AM | 757 (7.8%) | 907 (11.7%) |
| 10:00 AM to 10:59 AM | 363 (3.8%) | 251 (3.2%) |
| 11:00 AM to 11:59 AM | 49 (0.5%) | 137 (1.8%) |
| 12:00 PM to 3:59 PM | 374 (3.9%) | 523 (6.7%) |
| 4:00 PM to 11:59 PM | 471 (4.9%) | 285 (3.7%) |
| Total | 9,653 (100.0%) | 7,774 (100.0%) |
Housing Occupancy in Morgan Hill
Occupancy by Ownership in Morgan Hill
Of the total 14,575 dwellings in Morgan Hill, owner-occupied units account for 10,449 (71.7%), while renter-occupied units make up 4,126 (28.3%).
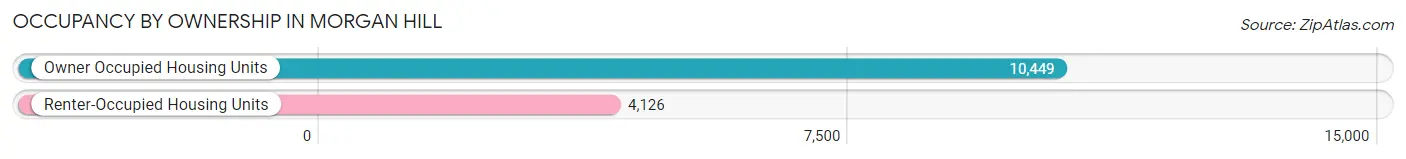
| Occupancy | # Housing Units | % Housing Units |
| Owner Occupied Housing Units | 10,449 | 71.7% |
| Renter-Occupied Housing Units | 4,126 | 28.3% |
| Total Occupied Housing Units | 14,575 | 100.0% |
Occupancy by Household Size in Morgan Hill
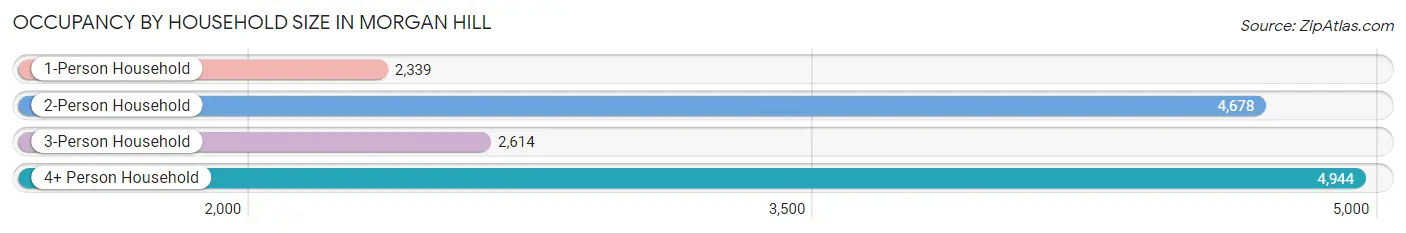
| Household Size | # Housing Units | % Housing Units |
| 1-Person Household | 2,339 | 16.1% |
| 2-Person Household | 4,678 | 32.1% |
| 3-Person Household | 2,614 | 17.9% |
| 4+ Person Household | 4,944 | 33.9% |
| Total Housing Units | 14,575 | 100.0% |
Occupancy by Ownership by Household Size in Morgan Hill
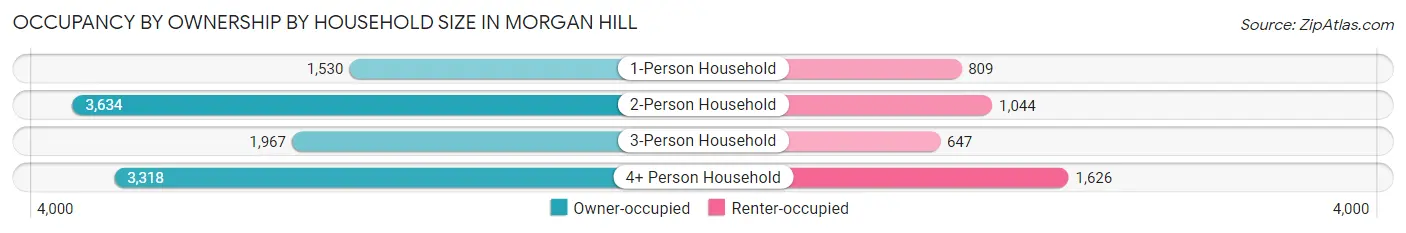
| Household Size | Owner-occupied | Renter-occupied |
| 1-Person Household | 1,530 (65.4%) | 809 (34.6%) |
| 2-Person Household | 3,634 (77.7%) | 1,044 (22.3%) |
| 3-Person Household | 1,967 (75.2%) | 647 (24.7%) |
| 4+ Person Household | 3,318 (67.1%) | 1,626 (32.9%) |
| Total Housing Units | 10,449 (71.7%) | 4,126 (28.3%) |
Occupancy by Educational Attainment in Morgan Hill
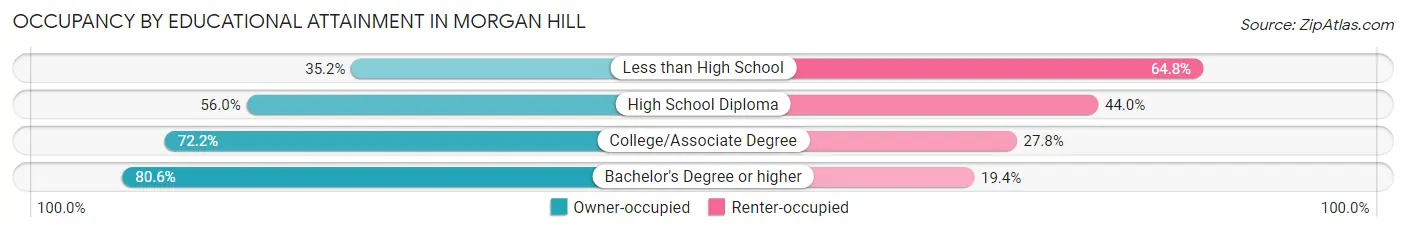
| Household Size | Owner-occupied | Renter-occupied |
| Less than High School | 373 (35.2%) | 686 (64.8%) |
| High School Diploma | 1,048 (56.0%) | 823 (44.0%) |
| College/Associate Degree | 3,062 (72.2%) | 1,181 (27.8%) |
| Bachelor's Degree or higher | 5,966 (80.6%) | 1,436 (19.4%) |
Occupancy by Age of Householder in Morgan Hill
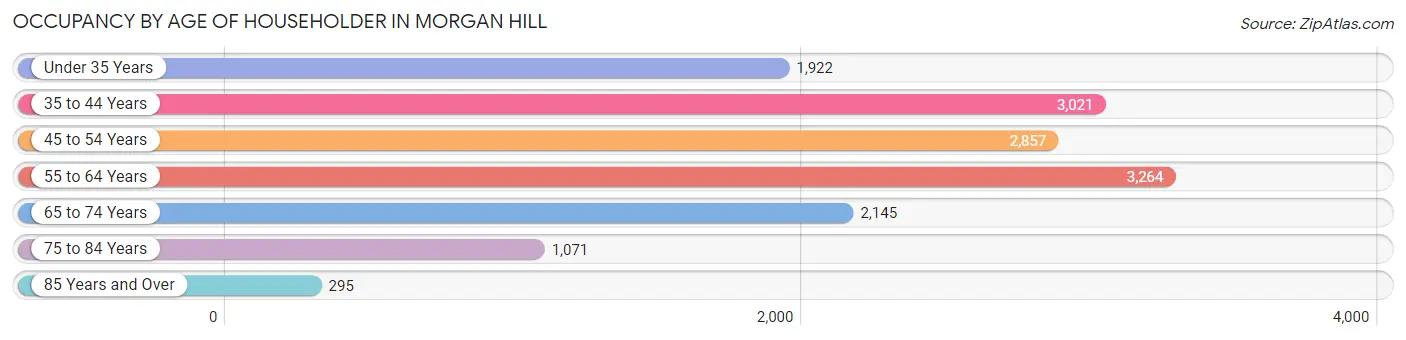
| Age Bracket | # Households | % Households |
| Under 35 Years | 1,922 | 13.2% |
| 35 to 44 Years | 3,021 | 20.7% |
| 45 to 54 Years | 2,857 | 19.6% |
| 55 to 64 Years | 3,264 | 22.4% |
| 65 to 74 Years | 2,145 | 14.7% |
| 75 to 84 Years | 1,071 | 7.3% |
| 85 Years and Over | 295 | 2.0% |
| Total | 14,575 | 100.0% |
Housing Finances in Morgan Hill
Median Income by Occupancy in Morgan Hill
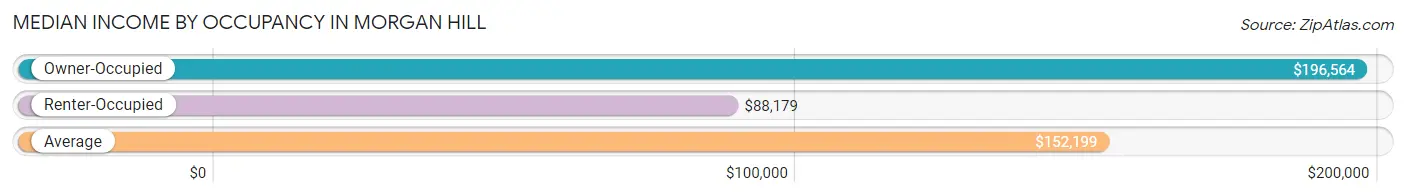
| Occupancy Type | # Households | Median Income |
| Owner-Occupied | 10,449 (71.7%) | $196,564 |
| Renter-Occupied | 4,126 (28.3%) | $88,179 |
| Average | 14,575 (100.0%) | $152,199 |
Occupancy by Householder Income Bracket in Morgan Hill
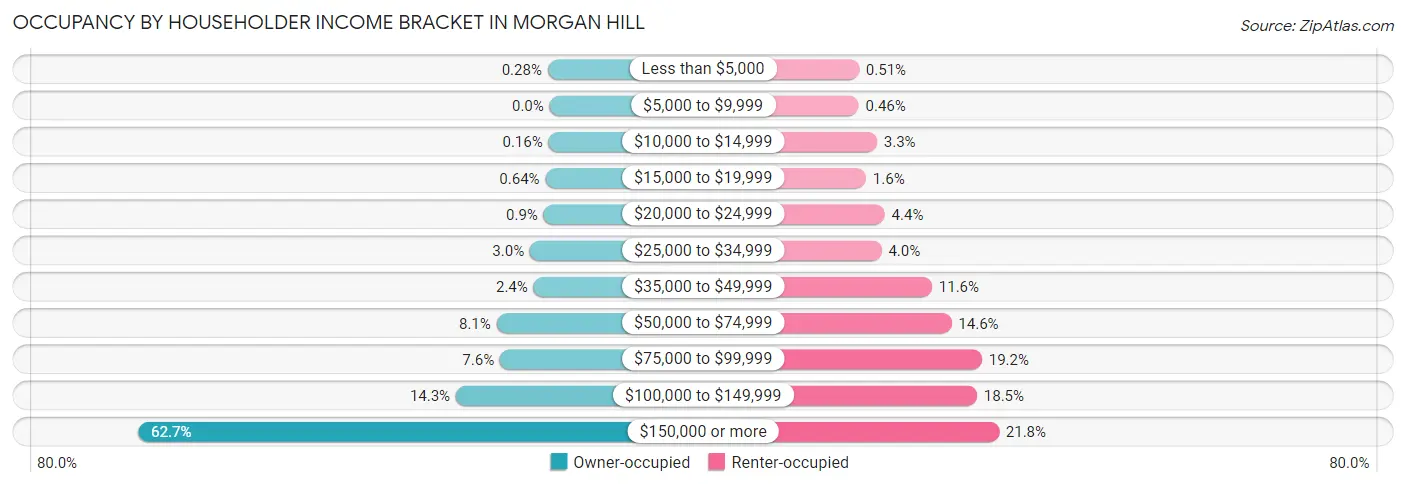
| Income Bracket | Owner-occupied | Renter-occupied |
| Less than $5,000 | 29 (0.3%) | 21 (0.5%) |
| $5,000 to $9,999 | 0 (0.0%) | 19 (0.5%) |
| $10,000 to $14,999 | 17 (0.2%) | 134 (3.3%) |
| $15,000 to $19,999 | 67 (0.6%) | 65 (1.6%) |
| $20,000 to $24,999 | 94 (0.9%) | 183 (4.4%) |
| $25,000 to $34,999 | 312 (3.0%) | 163 (4.0%) |
| $35,000 to $49,999 | 255 (2.4%) | 480 (11.6%) |
| $50,000 to $74,999 | 843 (8.1%) | 603 (14.6%) |
| $75,000 to $99,999 | 790 (7.6%) | 794 (19.2%) |
| $100,000 to $149,999 | 1,491 (14.3%) | 763 (18.5%) |
| $150,000 or more | 6,551 (62.7%) | 901 (21.8%) |
| Total | 10,449 (100.0%) | 4,126 (100.0%) |
Monthly Housing Cost Tiers in Morgan Hill
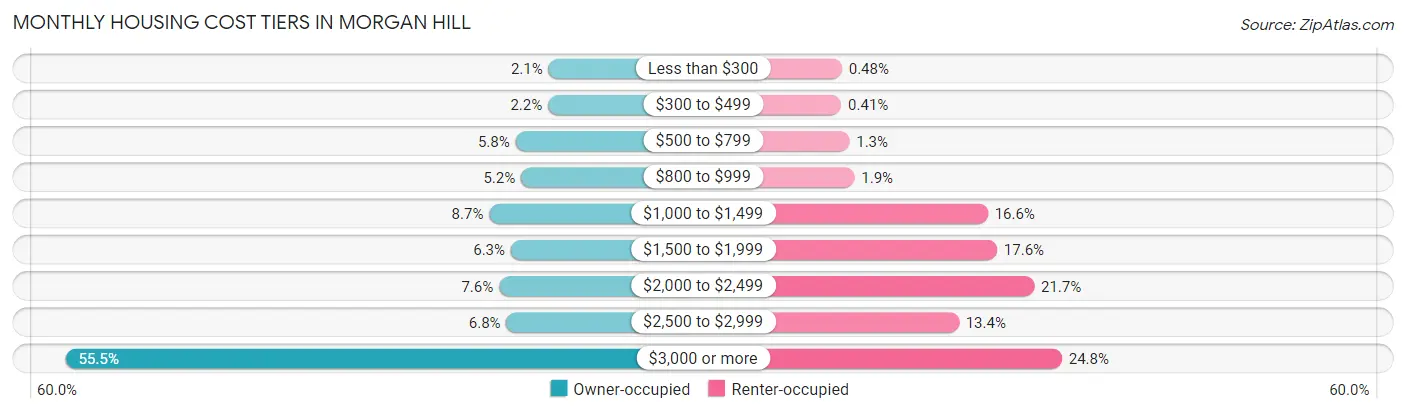
| Monthly Cost | Owner-occupied | Renter-occupied |
| Less than $300 | 222 (2.1%) | 20 (0.5%) |
| $300 to $499 | 227 (2.2%) | 17 (0.4%) |
| $500 to $799 | 602 (5.8%) | 54 (1.3%) |
| $800 to $999 | 539 (5.2%) | 77 (1.9%) |
| $1,000 to $1,499 | 906 (8.7%) | 685 (16.6%) |
| $1,500 to $1,999 | 656 (6.3%) | 727 (17.6%) |
| $2,000 to $2,499 | 793 (7.6%) | 896 (21.7%) |
| $2,500 to $2,999 | 707 (6.8%) | 553 (13.4%) |
| $3,000 or more | 5,797 (55.5%) | 1,023 (24.8%) |
| Total | 10,449 (100.0%) | 4,126 (100.0%) |
Physical Housing Characteristics in Morgan Hill
Housing Structures in Morgan Hill
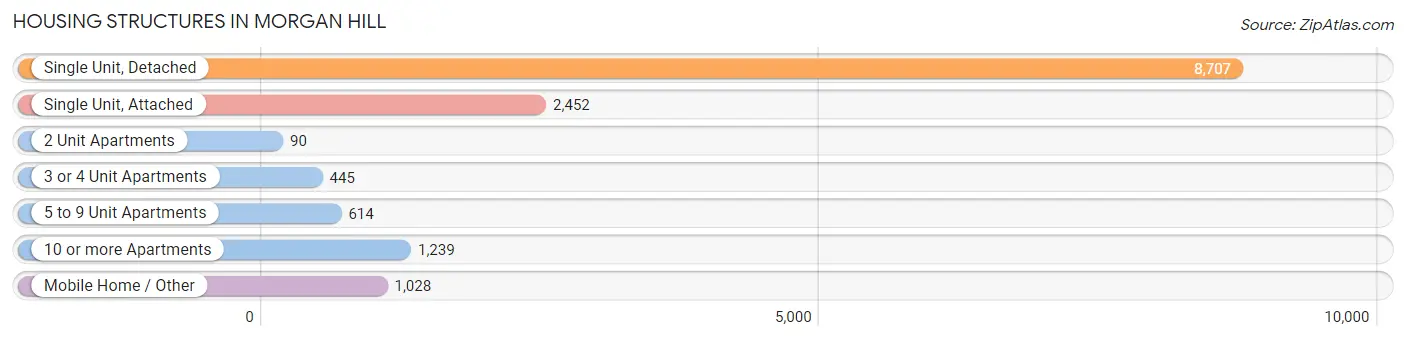
| Structure Type | # Housing Units | % Housing Units |
| Single Unit, Detached | 8,707 | 59.7% |
| Single Unit, Attached | 2,452 | 16.8% |
| 2 Unit Apartments | 90 | 0.6% |
| 3 or 4 Unit Apartments | 445 | 3.0% |
| 5 to 9 Unit Apartments | 614 | 4.2% |
| 10 or more Apartments | 1,239 | 8.5% |
| Mobile Home / Other | 1,028 | 7.0% |
| Total | 14,575 | 100.0% |
Housing Structures by Occupancy in Morgan Hill
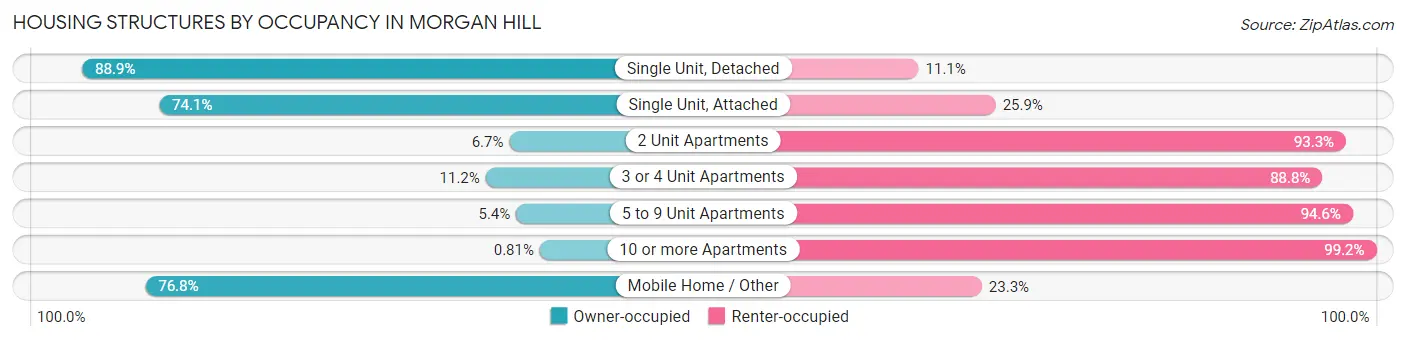
| Structure Type | Owner-occupied | Renter-occupied |
| Single Unit, Detached | 7,744 (88.9%) | 963 (11.1%) |
| Single Unit, Attached | 1,817 (74.1%) | 635 (25.9%) |
| 2 Unit Apartments | 6 (6.7%) | 84 (93.3%) |
| 3 or 4 Unit Apartments | 50 (11.2%) | 395 (88.8%) |
| 5 to 9 Unit Apartments | 33 (5.4%) | 581 (94.6%) |
| 10 or more Apartments | 10 (0.8%) | 1,229 (99.2%) |
| Mobile Home / Other | 789 (76.7%) | 239 (23.3%) |
| Total | 10,449 (71.7%) | 4,126 (28.3%) |
Housing Structures by Number of Rooms in Morgan Hill
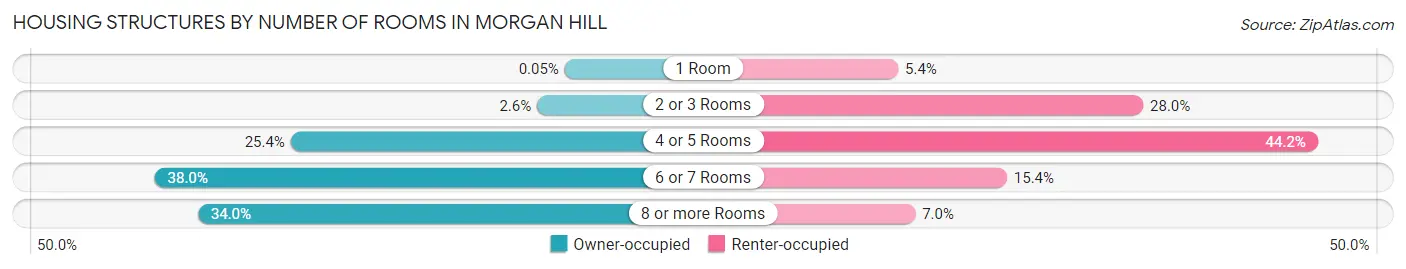
| Number of Rooms | Owner-occupied | Renter-occupied |
| 1 Room | 5 (0.1%) | 222 (5.4%) |
| 2 or 3 Rooms | 273 (2.6%) | 1,157 (28.0%) |
| 4 or 5 Rooms | 2,653 (25.4%) | 1,823 (44.2%) |
| 6 or 7 Rooms | 3,967 (38.0%) | 637 (15.4%) |
| 8 or more Rooms | 3,551 (34.0%) | 287 (7.0%) |
| Total | 10,449 (100.0%) | 4,126 (100.0%) |
Housing Structure by Heating Type in Morgan Hill
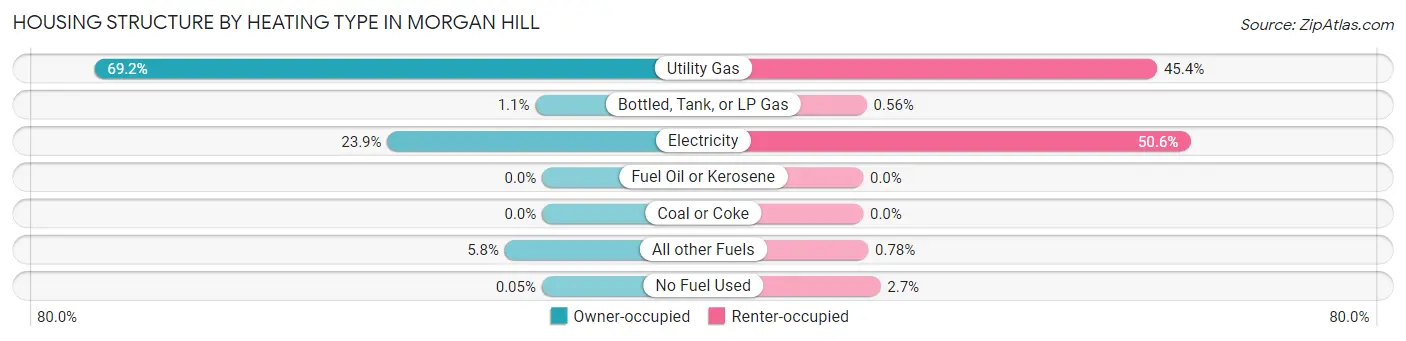
| Heating Type | Owner-occupied | Renter-occupied |
| Utility Gas | 7,232 (69.2%) | 1,875 (45.4%) |
| Bottled, Tank, or LP Gas | 110 (1.1%) | 23 (0.6%) |
| Electricity | 2,499 (23.9%) | 2,086 (50.6%) |
| Fuel Oil or Kerosene | 0 (0.0%) | 0 (0.0%) |
| Coal or Coke | 0 (0.0%) | 0 (0.0%) |
| All other Fuels | 603 (5.8%) | 32 (0.8%) |
| No Fuel Used | 5 (0.1%) | 110 (2.7%) |
| Total | 10,449 (100.0%) | 4,126 (100.0%) |
Household Vehicle Usage in Morgan Hill
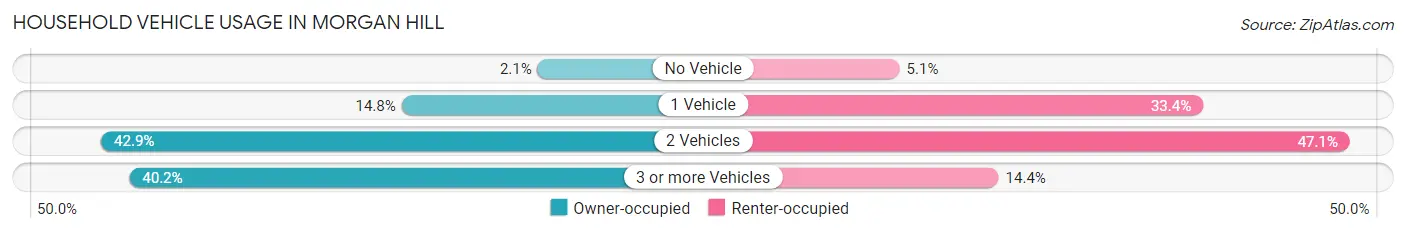
| Vehicles per Household | Owner-occupied | Renter-occupied |
| No Vehicle | 221 (2.1%) | 211 (5.1%) |
| 1 Vehicle | 1,548 (14.8%) | 1,379 (33.4%) |
| 2 Vehicles | 4,477 (42.8%) | 1,944 (47.1%) |
| 3 or more Vehicles | 4,203 (40.2%) | 592 (14.3%) |
| Total | 10,449 (100.0%) | 4,126 (100.0%) |
Real Estate & Mortgages in Morgan Hill
Real Estate and Mortgage Overview in Morgan Hill
| Characteristic | Without Mortgage | With Mortgage |
| Housing Units | 2,525 | 7,924 |
| Median Property Value | $957,000 | $1,098,800 |
| Median Household Income | $102,121 | $5,602 |
| Monthly Housing Costs | $918 | $5,797 |
| Real Estate Taxes | $5,088 | $207 |
Property Value by Mortgage Status in Morgan Hill
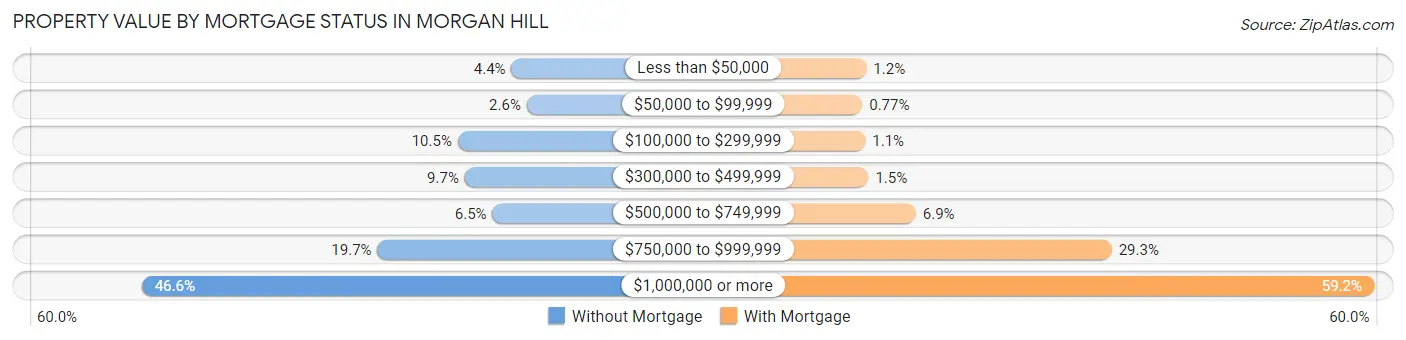
| Property Value | Without Mortgage | With Mortgage |
| Less than $50,000 | 110 (4.4%) | 98 (1.2%) |
| $50,000 to $99,999 | 66 (2.6%) | 61 (0.8%) |
| $100,000 to $299,999 | 265 (10.5%) | 89 (1.1%) |
| $300,000 to $499,999 | 245 (9.7%) | 117 (1.5%) |
| $500,000 to $749,999 | 165 (6.5%) | 546 (6.9%) |
| $750,000 to $999,999 | 497 (19.7%) | 2,320 (29.3%) |
| $1,000,000 or more | 1,177 (46.6%) | 4,693 (59.2%) |
| Total | 2,525 (100.0%) | 7,924 (100.0%) |
Household Income by Mortgage Status in Morgan Hill
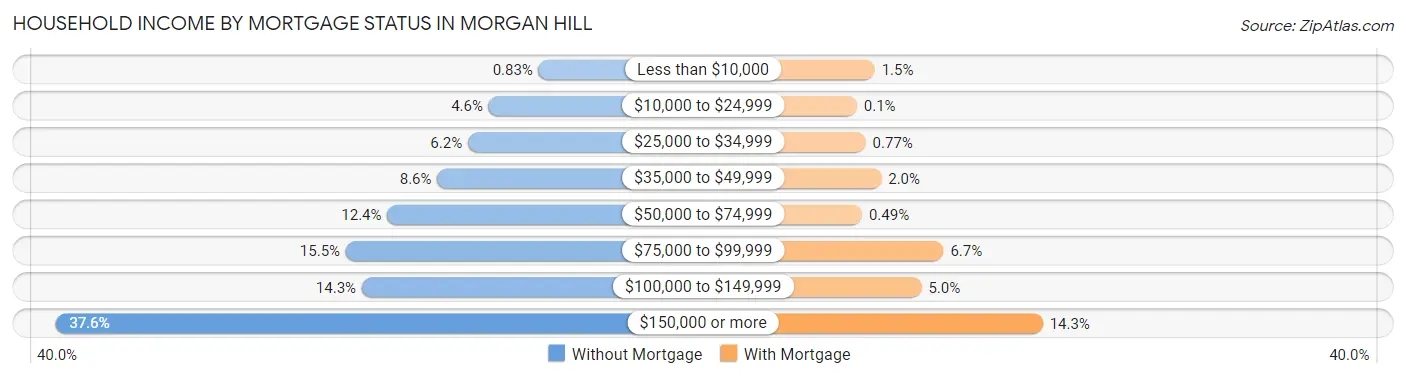
| Household Income | Without Mortgage | With Mortgage |
| Less than $10,000 | 21 (0.8%) | 116 (1.5%) |
| $10,000 to $24,999 | 117 (4.6%) | 8 (0.1%) |
| $25,000 to $34,999 | 157 (6.2%) | 61 (0.8%) |
| $35,000 to $49,999 | 216 (8.6%) | 155 (2.0%) |
| $50,000 to $74,999 | 312 (12.4%) | 39 (0.5%) |
| $75,000 to $99,999 | 392 (15.5%) | 531 (6.7%) |
| $100,000 to $149,999 | 361 (14.3%) | 398 (5.0%) |
| $150,000 or more | 949 (37.6%) | 1,130 (14.3%) |
| Total | 2,525 (100.0%) | 7,924 (100.0%) |
Property Value to Household Income Ratio in Morgan Hill
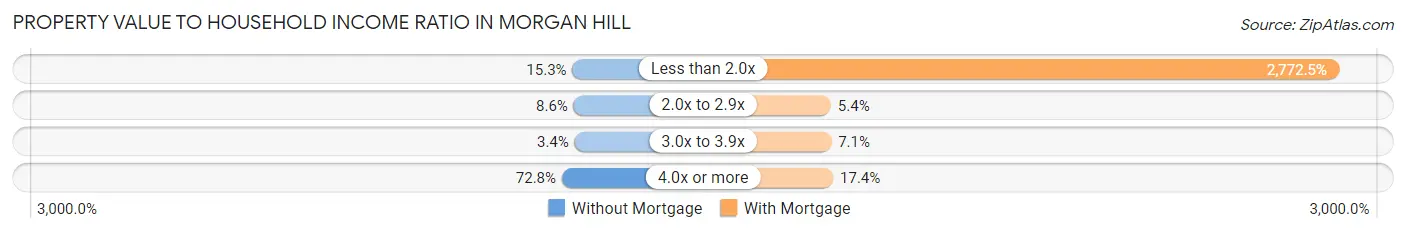
| Value-to-Income Ratio | Without Mortgage | With Mortgage |
| Less than 2.0x | 386 (15.3%) | 219,693 (2,772.5%) |
| 2.0x to 2.9x | 216 (8.6%) | 425 (5.4%) |
| 3.0x to 3.9x | 85 (3.4%) | 561 (7.1%) |
| 4.0x or more | 1,838 (72.8%) | 1,381 (17.4%) |
| Total | 2,525 (100.0%) | 7,924 (100.0%) |
Real Estate Taxes by Mortgage Status in Morgan Hill
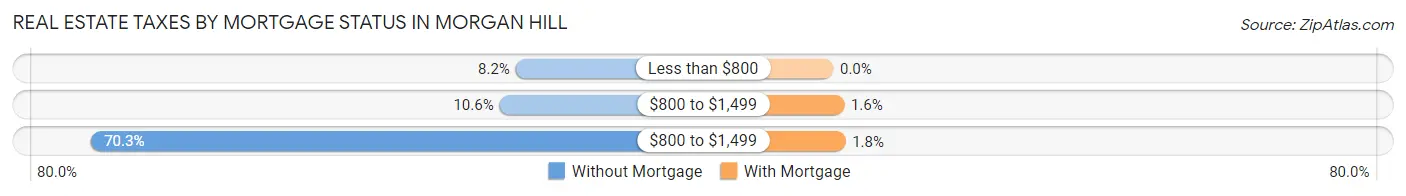
| Property Taxes | Without Mortgage | With Mortgage |
| Less than $800 | 208 (8.2%) | 0 (0.0%) |
| $800 to $1,499 | 268 (10.6%) | 127 (1.6%) |
| $800 to $1,499 | 1,774 (70.3%) | 141 (1.8%) |
| Total | 2,525 (100.0%) | 7,924 (100.0%) |
Health & Disability in Morgan Hill
Health Insurance Coverage by Age in Morgan Hill
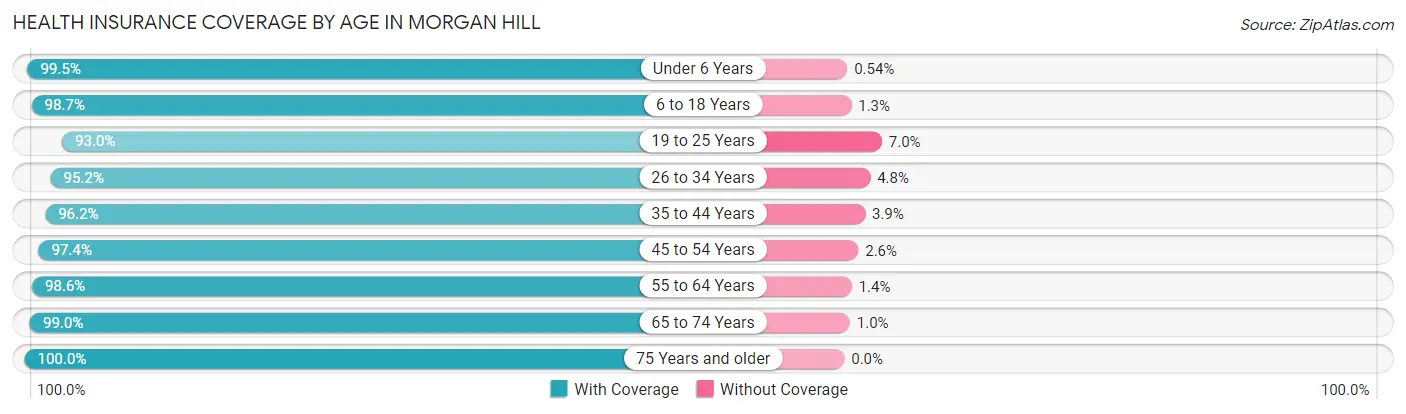
| Age Bracket | With Coverage | Without Coverage |
| Under 6 Years | 3,900 (99.5%) | 21 (0.5%) |
| 6 to 18 Years | 8,415 (98.7%) | 111 (1.3%) |
| 19 to 25 Years | 3,080 (93.0%) | 232 (7.0%) |
| 26 to 34 Years | 4,642 (95.2%) | 236 (4.8%) |
| 35 to 44 Years | 5,864 (96.2%) | 235 (3.8%) |
| 45 to 54 Years | 5,791 (97.4%) | 155 (2.6%) |
| 55 to 64 Years | 5,809 (98.6%) | 81 (1.4%) |
| 65 to 74 Years | 4,018 (99.0%) | 42 (1.0%) |
| 75 Years and older | 2,464 (100.0%) | 0 (0.0%) |
| Total | 43,983 (97.5%) | 1,113 (2.5%) |
Health Insurance Coverage by Citizenship Status in Morgan Hill
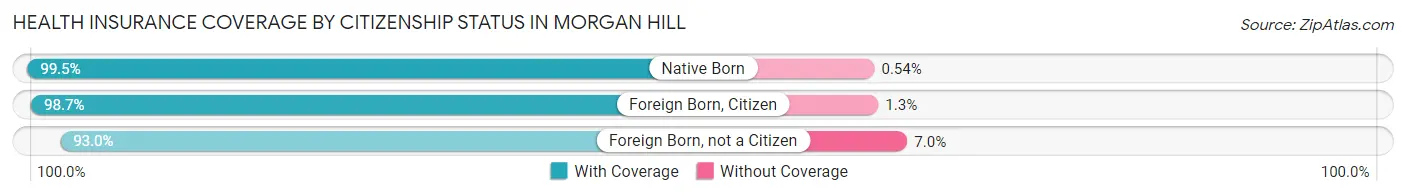
| Citizenship Status | With Coverage | Without Coverage |
| Native Born | 3,900 (99.5%) | 21 (0.5%) |
| Foreign Born, Citizen | 8,415 (98.7%) | 111 (1.3%) |
| Foreign Born, not a Citizen | 3,080 (93.0%) | 232 (7.0%) |
Health Insurance Coverage by Household Income in Morgan Hill
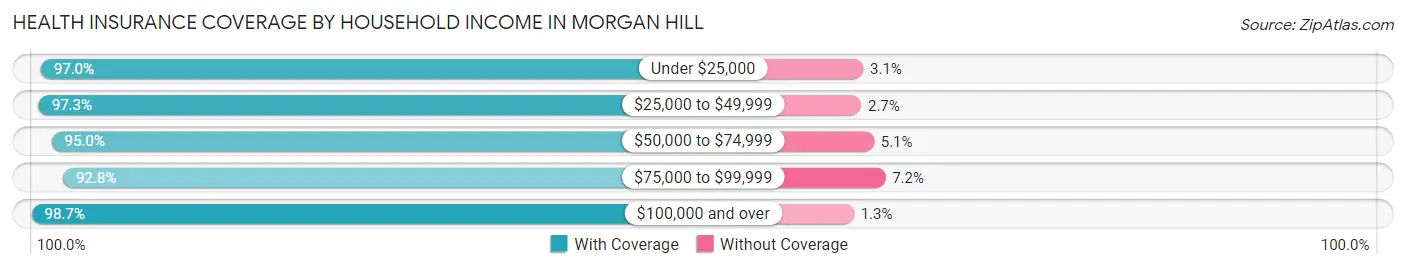
| Household Income | With Coverage | Without Coverage |
| Under $25,000 | 1,111 (97.0%) | 35 (3.0%) |
| $25,000 to $49,999 | 2,846 (97.3%) | 78 (2.7%) |
| $50,000 to $74,999 | 3,647 (95.0%) | 194 (5.1%) |
| $75,000 to $99,999 | 4,611 (92.8%) | 358 (7.2%) |
| $100,000 and over | 31,483 (98.7%) | 415 (1.3%) |
Public vs Private Health Insurance Coverage by Age in Morgan Hill
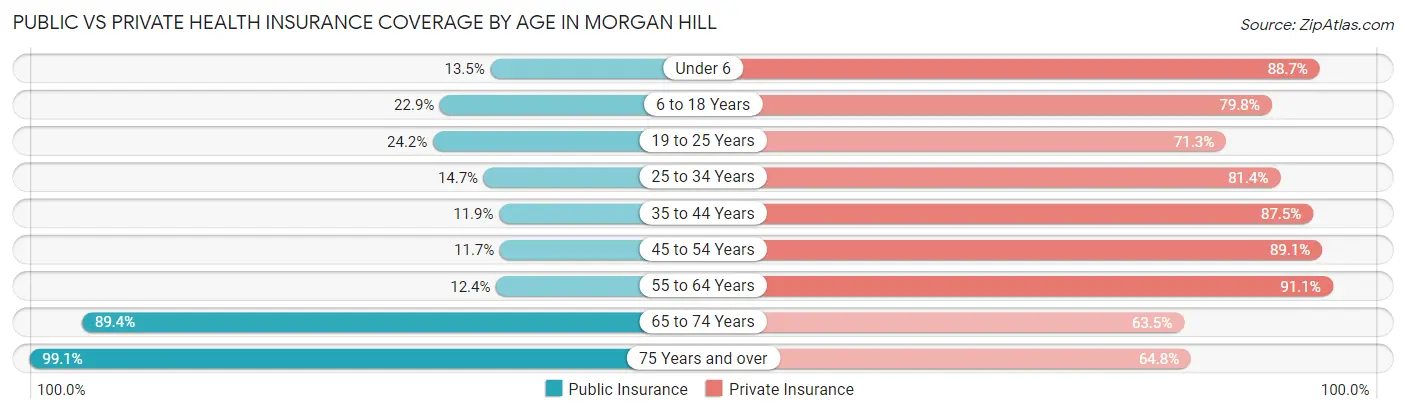
| Age Bracket | Public Insurance | Private Insurance |
| Under 6 | 530 (13.5%) | 3,478 (88.7%) |
| 6 to 18 Years | 1,950 (22.9%) | 6,801 (79.8%) |
| 19 to 25 Years | 801 (24.2%) | 2,362 (71.3%) |
| 25 to 34 Years | 719 (14.7%) | 3,969 (81.4%) |
| 35 to 44 Years | 725 (11.9%) | 5,335 (87.5%) |
| 45 to 54 Years | 698 (11.7%) | 5,300 (89.1%) |
| 55 to 64 Years | 733 (12.4%) | 5,364 (91.1%) |
| 65 to 74 Years | 3,629 (89.4%) | 2,579 (63.5%) |
| 75 Years and over | 2,442 (99.1%) | 1,597 (64.8%) |
| Total | 12,227 (27.1%) | 36,785 (81.6%) |
Disability Status by Sex by Age in Morgan Hill
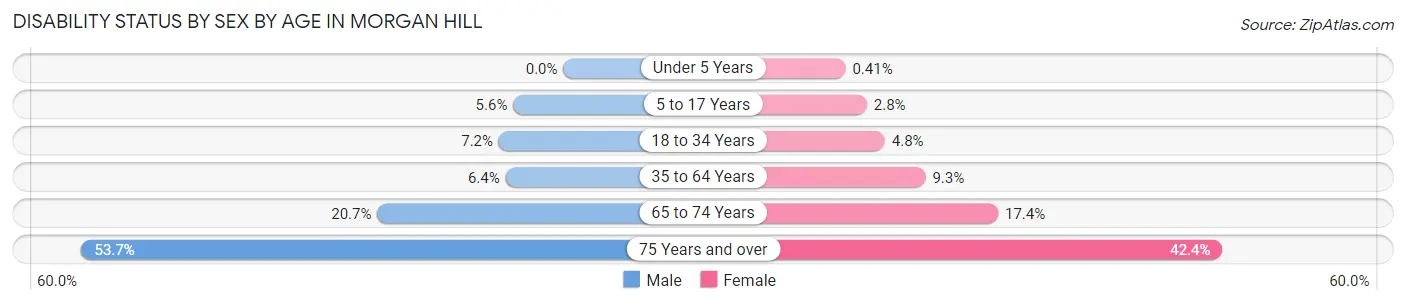
| Age Bracket | Male | Female |
| Under 5 Years | 0 (0.0%) | 8 (0.4%) |
| 5 to 17 Years | 200 (5.6%) | 131 (2.8%) |
| 18 to 34 Years | 329 (7.2%) | 207 (4.8%) |
| 35 to 64 Years | 566 (6.4%) | 852 (9.3%) |
| 65 to 74 Years | 396 (20.7%) | 374 (17.4%) |
| 75 Years and over | 636 (53.7%) | 542 (42.4%) |
Disability Class by Sex by Age in Morgan Hill
Disability Class: Hearing Difficulty
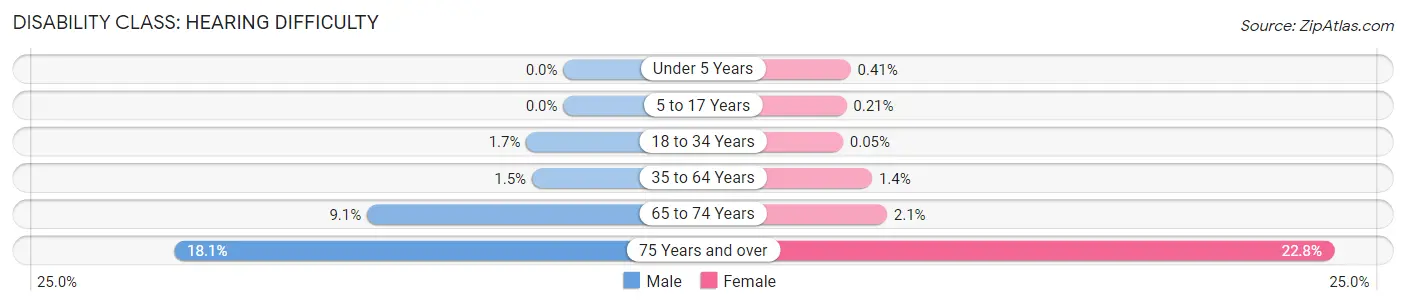
| Age Bracket | Male | Female |
| Under 5 Years | 0 (0.0%) | 8 (0.4%) |
| 5 to 17 Years | 0 (0.0%) | 10 (0.2%) |
| 18 to 34 Years | 79 (1.7%) | 2 (0.1%) |
| 35 to 64 Years | 128 (1.5%) | 128 (1.4%) |
| 65 to 74 Years | 174 (9.1%) | 45 (2.1%) |
| 75 Years and over | 214 (18.1%) | 292 (22.8%) |
Disability Class: Vision Difficulty
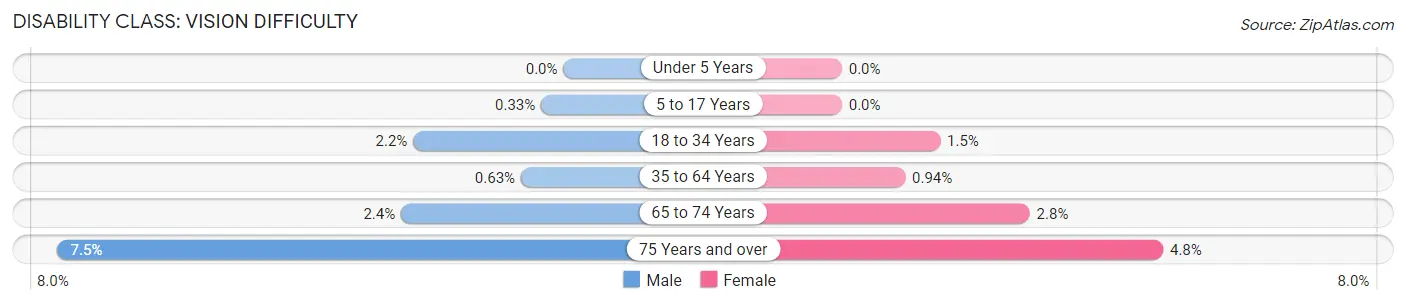
| Age Bracket | Male | Female |
| Under 5 Years | 0 (0.0%) | 0 (0.0%) |
| 5 to 17 Years | 12 (0.3%) | 0 (0.0%) |
| 18 to 34 Years | 102 (2.2%) | 63 (1.5%) |
| 35 to 64 Years | 55 (0.6%) | 86 (0.9%) |
| 65 to 74 Years | 46 (2.4%) | 60 (2.8%) |
| 75 Years and over | 89 (7.5%) | 61 (4.8%) |
Disability Class: Cognitive Difficulty
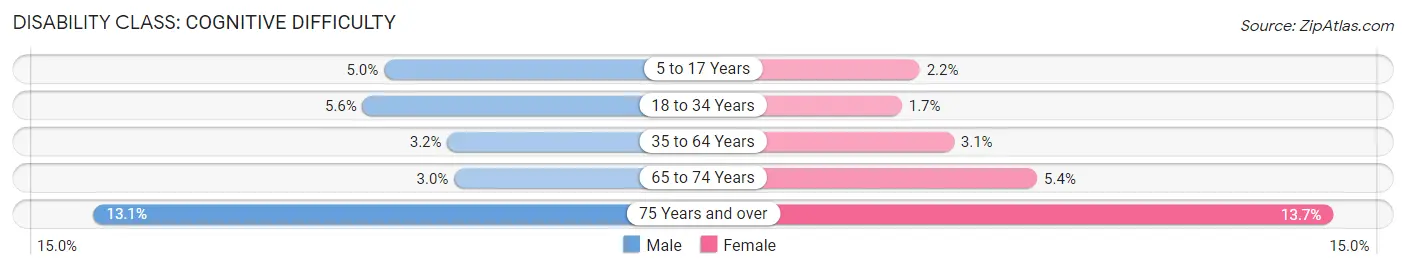
| Age Bracket | Male | Female |
| 5 to 17 Years | 179 (5.0%) | 102 (2.2%) |
| 18 to 34 Years | 256 (5.6%) | 72 (1.7%) |
| 35 to 64 Years | 284 (3.2%) | 285 (3.1%) |
| 65 to 74 Years | 58 (3.0%) | 117 (5.4%) |
| 75 Years and over | 155 (13.1%) | 175 (13.7%) |
Disability Class: Ambulatory Difficulty
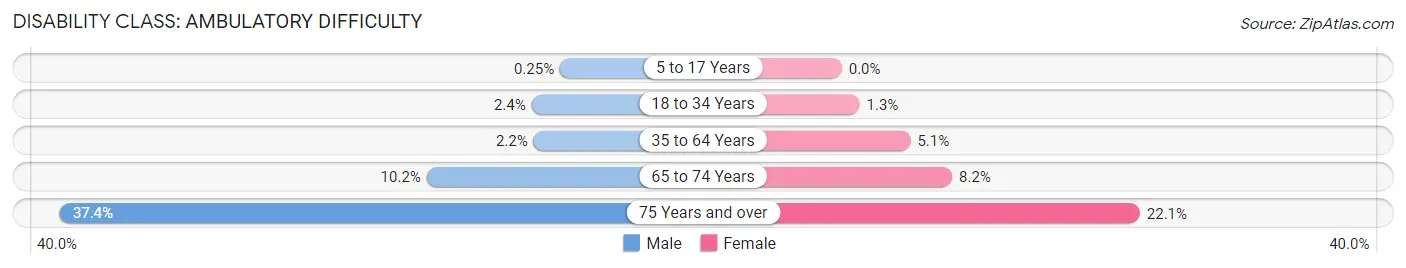
| Age Bracket | Male | Female |
| 5 to 17 Years | 9 (0.3%) | 0 (0.0%) |
| 18 to 34 Years | 108 (2.4%) | 57 (1.3%) |
| 35 to 64 Years | 194 (2.2%) | 466 (5.1%) |
| 65 to 74 Years | 194 (10.2%) | 176 (8.2%) |
| 75 Years and over | 443 (37.4%) | 283 (22.1%) |
Disability Class: Self-Care Difficulty
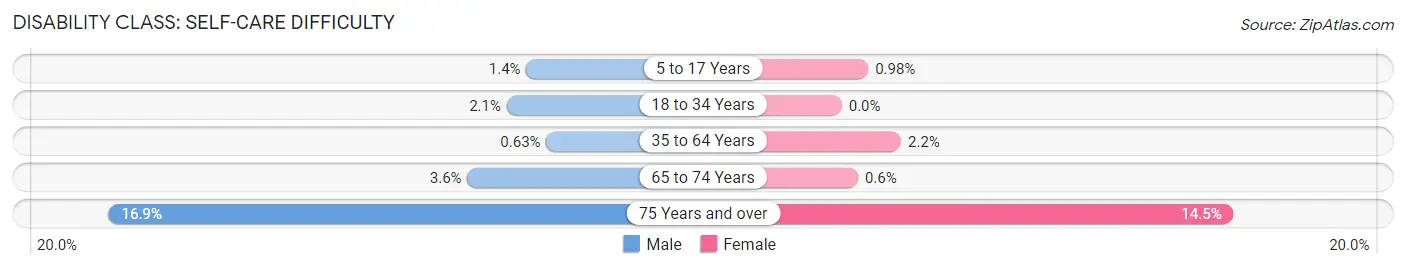
| Age Bracket | Male | Female |
| 5 to 17 Years | 49 (1.4%) | 46 (1.0%) |
| 18 to 34 Years | 96 (2.1%) | 0 (0.0%) |
| 35 to 64 Years | 55 (0.6%) | 201 (2.2%) |
| 65 to 74 Years | 68 (3.6%) | 13 (0.6%) |
| 75 Years and over | 200 (16.9%) | 186 (14.5%) |
Technology Access in Morgan Hill
Computing Device Access in Morgan Hill
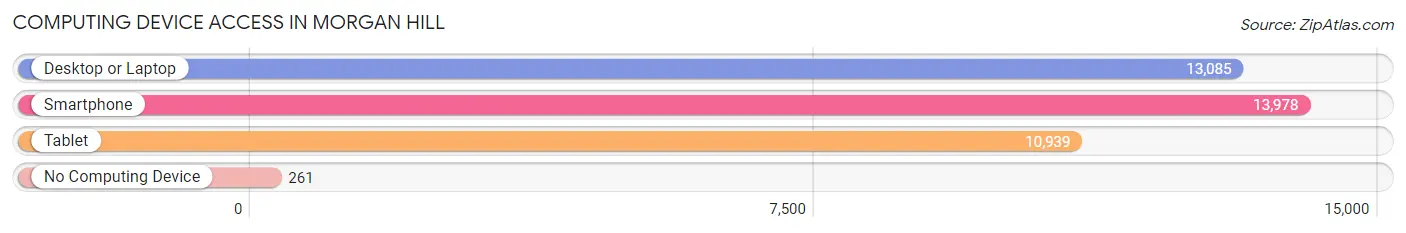
| Device Type | # Households | % Households |
| Desktop or Laptop | 13,085 | 89.8% |
| Smartphone | 13,978 | 95.9% |
| Tablet | 10,939 | 75.0% |
| No Computing Device | 261 | 1.8% |
| Total | 14,575 | 100.0% |
Internet Access in Morgan Hill
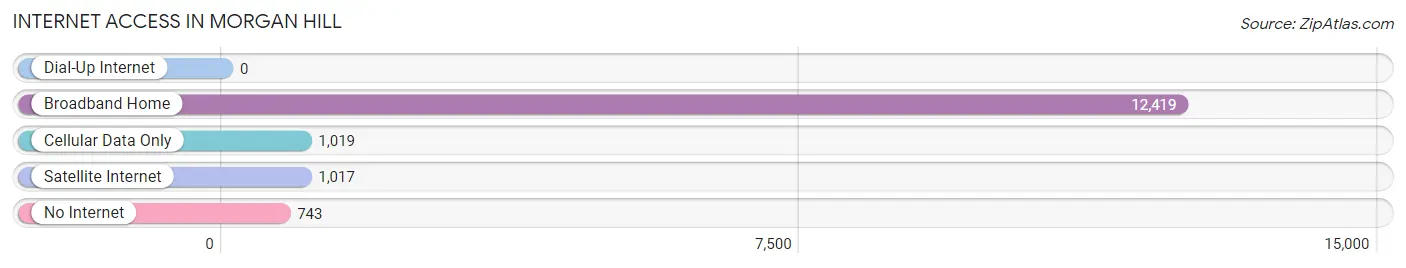
| Internet Type | # Households | % Households |
| Dial-Up Internet | 0 | 0.0% |
| Broadband Home | 12,419 | 85.2% |
| Cellular Data Only | 1,019 | 7.0% |
| Satellite Internet | 1,017 | 7.0% |
| No Internet | 743 | 5.1% |
| Total | 14,575 | 100.0% |
Morgan Hill Summary
History
The history of Morgan Hill, California dates back to the mid-1800s when the area was first settled by the Ohlone Indians. The Ohlone Indians were a peaceful tribe that lived in the area for centuries before the arrival of the Spanish in the late 1700s. The Spanish were the first Europeans to settle in the area and they established the Mission Santa Clara de Asís in 1777. The mission was the first of its kind in California and served as a center of religious and cultural activity for the Ohlone Indians.
In the mid-1800s, the area was settled by American settlers who established the town of Morgan Hill. The town was named after Hiram Morgan Hill, a prominent local rancher and businessman. The town quickly grew and became a popular destination for tourists and travelers. In the late 1800s, the town was home to several hotels, saloons, and other businesses.
In the early 1900s, the town experienced a period of growth and development. The population increased and the town was home to several businesses, including a cannery, a brickyard, and a dairy. The town also became a popular destination for tourists and travelers.
In the mid-1900s, the town experienced a period of decline. The population decreased and many businesses closed. In the late 1900s, the town experienced a period of revitalization. The population increased and the town was home to several new businesses, including a winery, a brewery, and a distillery.
Geography
Morgan Hill is located in Santa Clara County, California, approximately 30 miles south of San Jose. The city is situated in the foothills of the Santa Cruz Mountains and is surrounded by rolling hills and open space. The city is home to several parks and recreational areas, including Anderson Lake County Park, Coyote Creek Regional Park, and Uvas Creek Park.
The city has a Mediterranean climate, with warm, dry summers and mild, wet winters. The average annual temperature is around 60 degrees Fahrenheit. The average annual precipitation is around 20 inches.
Economy
The economy of Morgan Hill is largely based on agriculture and tourism. The city is home to several wineries, breweries, and distilleries, as well as a variety of restaurants and shops. The city is also home to several technology companies, including Intel, Oracle, and Cisco Systems.
The city is home to several educational institutions, including Gavilan College and the University of California, Santa Cruz. The city is also home to several hospitals and medical centers, including the Santa Clara Valley Medical Center and the Morgan Hill Community Hospital.
Demographics
As of the 2010 census, the population of Morgan Hill was 42,039. The racial makeup of the city was 68.3% White, 0.9% African American, 0.7% Native American, 11.2% Asian, 0.2% Pacific Islander, 13.2% from other races, and 5.5% from two or more races. Hispanic or Latino of any race were 33.2% of the population.
The median income for a household in the city was $87,945, and the median income for a family was $103,945. The per capita income for the city was $37,945. About 8.2% of families and 11.2% of the population were below the poverty line, including 15.2% of those under age 18 and 6.2% of those age 65 or over.
Common Questions
What is Per Capita Income in Morgan Hill?
Per Capita income in Morgan Hill is $62,116.
What is the Median Family Income in Morgan Hill?
Median Family Income in Morgan Hill is $166,776.
What is the Median Household income in Morgan Hill?
Median Household Income in Morgan Hill is $152,199.
What is Income or Wage Gap in Morgan Hill?
Income or Wage Gap in Morgan Hill is 30.7%.
Women in Morgan Hill earn 69.3 cents for every dollar earned by a man.
What is Inequality or Gini Index in Morgan Hill?
Inequality or Gini Index in Morgan Hill is 0.41.
What is the Total Population of Morgan Hill?
Total Population of Morgan Hill is 45,291.
What is the Total Male Population of Morgan Hill?
Total Male Population of Morgan Hill is 21,692.
What is the Total Female Population of Morgan Hill?
Total Female Population of Morgan Hill is 23,599.
What is the Ratio of Males per 100 Females in Morgan Hill?
There are 91.92 Males per 100 Females in Morgan Hill.
What is the Ratio of Females per 100 Males in Morgan Hill?
There are 108.79 Females per 100 Males in Morgan Hill.
What is the Median Population Age in Morgan Hill?
Median Population Age in Morgan Hill is 38.0 Years.
What is the Average Family Size in Morgan Hill
Average Family Size in Morgan Hill is 3.4 People.
What is the Average Household Size in Morgan Hill
Average Household Size in Morgan Hill is 3.1 People.
How Large is the Labor Force in Morgan Hill?
There are 23,040 People in the Labor Forcein in Morgan Hill.
What is the Percentage of People in the Labor Force in Morgan Hill?
66.5% of People are in the Labor Force in Morgan Hill.
What is the Unemployment Rate in Morgan Hill?
Unemployment Rate in Morgan Hill is 4.9%.