Winchester, MA Map & Demographics
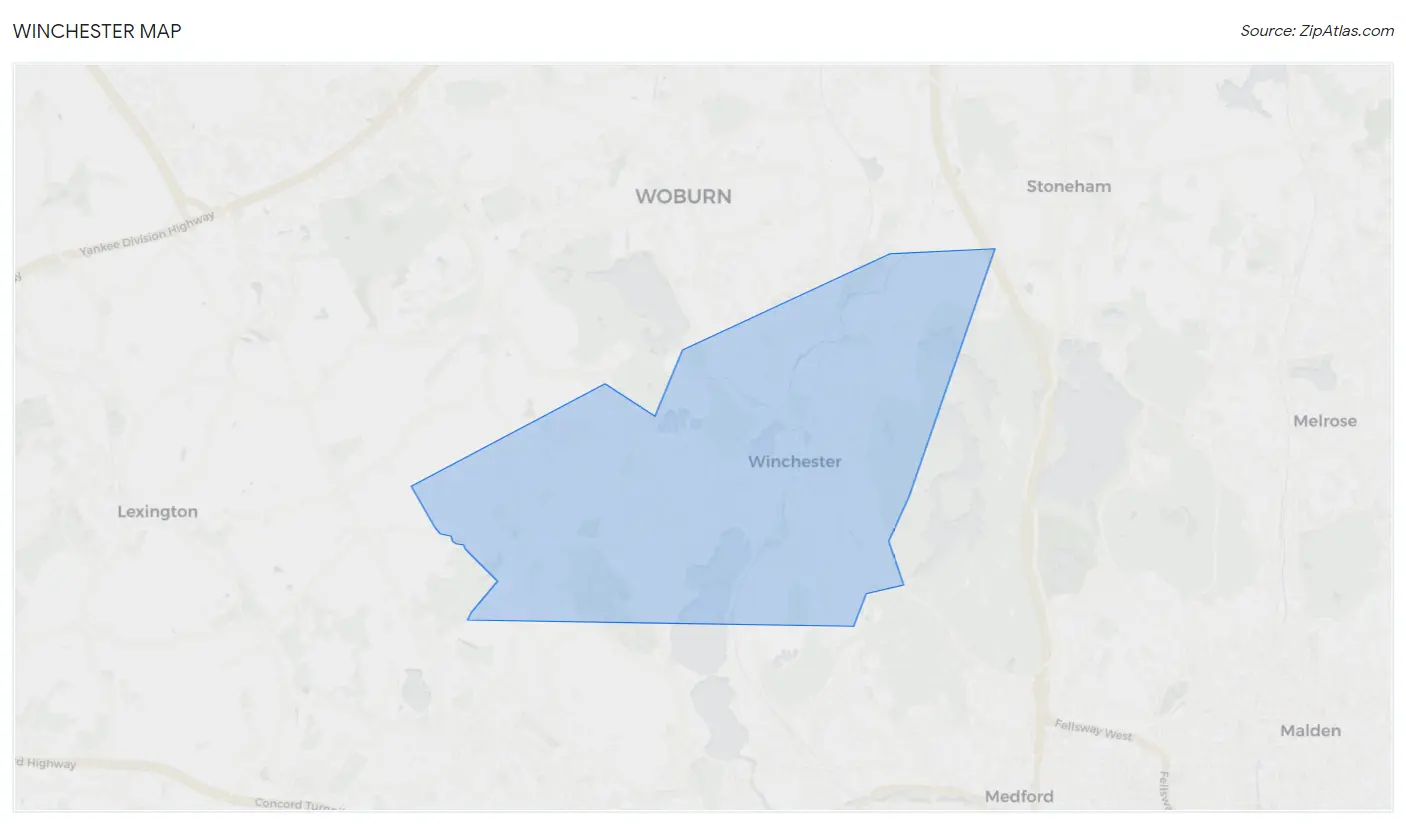
Winchester Map
Winchester Overview
$100,383
PER CAPITA INCOME
$250,001
AVG FAMILY INCOME
$208,531
AVG HOUSEHOLD INCOME
40.0%
WAGE / INCOME GAP [ % ]
60.0¢/ $1
WAGE / INCOME GAP [ $ ]
0.47
INEQUALITY / GINI INDEX
22,809
TOTAL POPULATION
10,614
MALE POPULATION
12,195
FEMALE POPULATION
87.04
MALES / 100 FEMALES
114.90
FEMALES / 100 MALES
42.3
MEDIAN AGE
3.3
AVG FAMILY SIZE
2.8
AVG HOUSEHOLD SIZE
11,734
LABOR FORCE [ PEOPLE ]
67.7%
PERCENT IN LABOR FORCE
3.4%
UNEMPLOYMENT RATE
Winchester Zip Codes
Winchester Area Codes
Income in Winchester
Income Overview in Winchester
Per Capita Income in Winchester is $100,383, while median incomes of families and households are $250,001 and $208,531 respectively.
| Characteristic | Number | Measure |
| Per Capita Income | 22,809 | $100,383 |
| Median Family Income | 6,050 | $250,001 |
| Mean Family Income | 6,050 | $339,808 |
| Median Household Income | 8,066 | $208,531 |
| Mean Household Income | 8,066 | $283,632 |
| Income Deficit | 6,050 | $0 |
| Wage / Income Gap (%) | 22,809 | 39.99% |
| Wage / Income Gap ($) | 22,809 | 60.01¢ per $1 |
| Gini / Inequality Index | 22,809 | 0.47 |
Earnings by Sex in Winchester
Average Earnings in Winchester are $103,659, $139,453 for men and $83,687 for women, a difference of 40.0%.
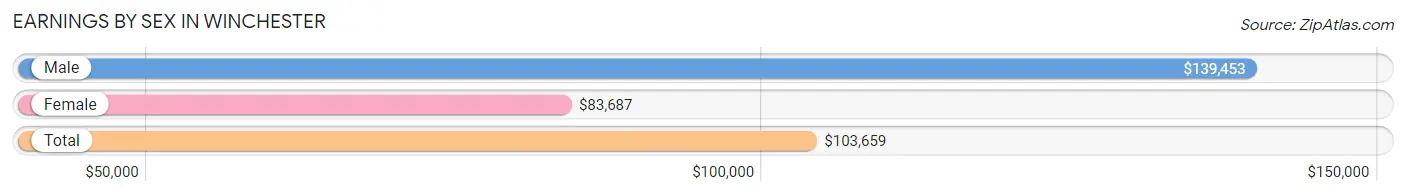
| Sex | Number | Average Earnings |
| Male | 6,416 (52.2%) | $139,453 |
| Female | 5,877 (47.8%) | $83,687 |
| Total | 12,293 (100.0%) | $103,659 |
Earnings by Sex by Income Bracket in Winchester
The most common earnings brackets in Winchester are $100,000+ for men (3,936 | 61.4%) and $100,000+ for women (2,396 | 40.8%).
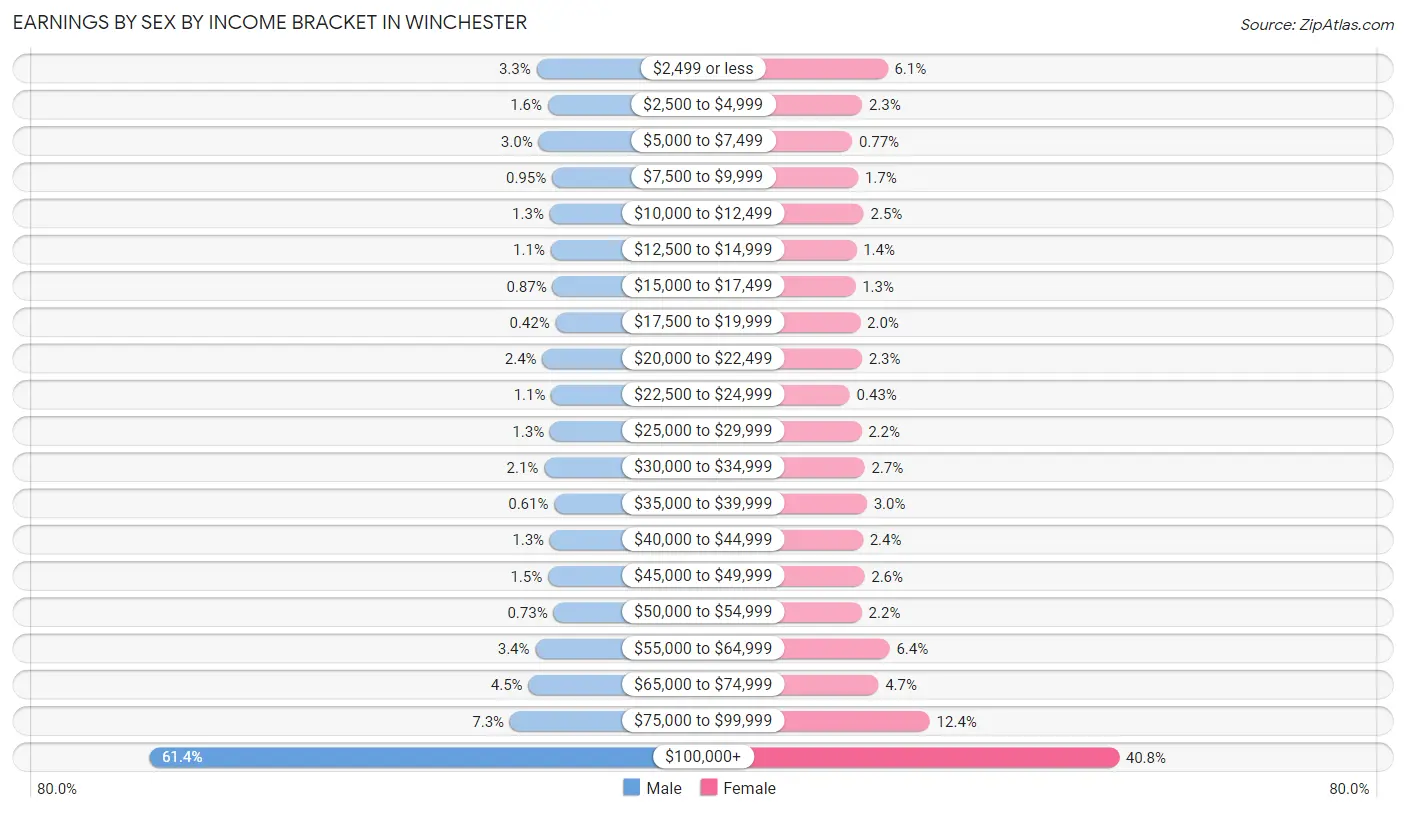
| Income | Male | Female |
| $2,499 or less | 210 (3.3%) | 358 (6.1%) |
| $2,500 to $4,999 | 101 (1.6%) | 134 (2.3%) |
| $5,000 to $7,499 | 191 (3.0%) | 45 (0.8%) |
| $7,500 to $9,999 | 61 (0.9%) | 98 (1.7%) |
| $10,000 to $12,499 | 83 (1.3%) | 148 (2.5%) |
| $12,500 to $14,999 | 73 (1.1%) | 83 (1.4%) |
| $15,000 to $17,499 | 56 (0.9%) | 74 (1.3%) |
| $17,500 to $19,999 | 27 (0.4%) | 117 (2.0%) |
| $20,000 to $22,499 | 153 (2.4%) | 132 (2.2%) |
| $22,500 to $24,999 | 68 (1.1%) | 25 (0.4%) |
| $25,000 to $29,999 | 80 (1.3%) | 127 (2.2%) |
| $30,000 to $34,999 | 136 (2.1%) | 156 (2.6%) |
| $35,000 to $39,999 | 39 (0.6%) | 176 (3.0%) |
| $40,000 to $44,999 | 81 (1.3%) | 140 (2.4%) |
| $45,000 to $49,999 | 99 (1.5%) | 154 (2.6%) |
| $50,000 to $54,999 | 47 (0.7%) | 131 (2.2%) |
| $55,000 to $64,999 | 221 (3.4%) | 376 (6.4%) |
| $65,000 to $74,999 | 288 (4.5%) | 277 (4.7%) |
| $75,000 to $99,999 | 466 (7.3%) | 730 (12.4%) |
| $100,000+ | 3,936 (61.4%) | 2,396 (40.8%) |
| Total | 6,416 (100.0%) | 5,877 (100.0%) |
Earnings by Sex by Educational Attainment in Winchester
Average earnings in Winchester are $163,150 for men and $89,453 for women, a difference of 45.2%. Men with an educational attainment of graduate degree enjoy the highest average annual earnings of $207,938, while those with high school diploma education earn the least with $63,523. Women with an educational attainment of graduate degree earn the most with the average annual earnings of $108,750, while those with high school diploma education have the smallest earnings of $39,712.
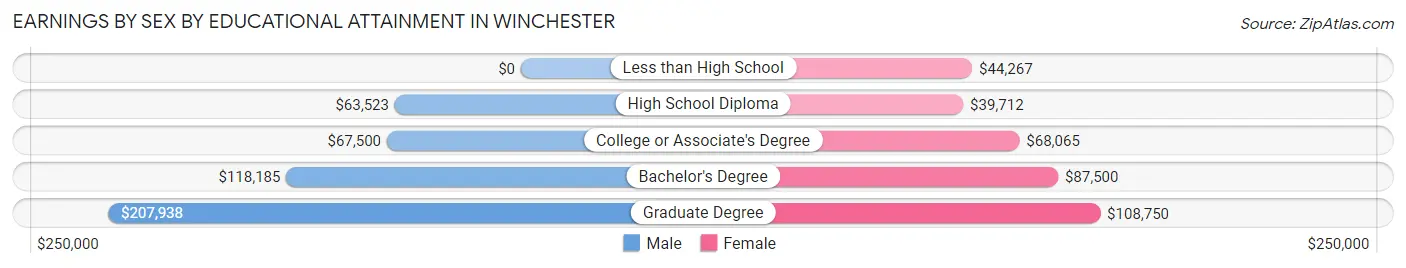
| Educational Attainment | Male Income | Female Income |
| Less than High School | - | - |
| High School Diploma | $63,523 | $39,712 |
| College or Associate's Degree | $67,500 | $68,065 |
| Bachelor's Degree | $118,185 | $87,500 |
| Graduate Degree | $207,938 | $108,750 |
| Total | $163,150 | $89,453 |
Family Income in Winchester
Family Income Brackets in Winchester
According to the Winchester family income data, there are 3,908 families falling into the $200,000+ income range, which is the most common income bracket and makes up 64.6% of all families. Conversely, the $10,000 to $14,999 income bracket is the least frequent group with only 6 families (0.1%) belonging to this category.
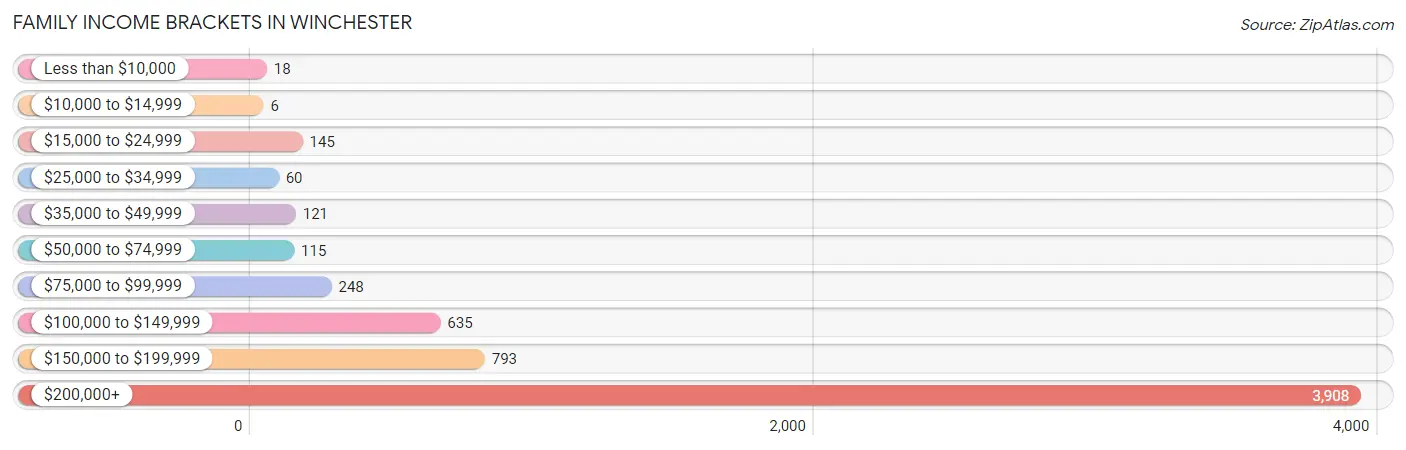
| Income Bracket | # Families | % Families |
| Less than $10,000 | 18 | 0.3% |
| $10,000 to $14,999 | 6 | 0.1% |
| $15,000 to $24,999 | 145 | 2.4% |
| $25,000 to $34,999 | 60 | 1.0% |
| $35,000 to $49,999 | 121 | 2.0% |
| $50,000 to $74,999 | 115 | 1.9% |
| $75,000 to $99,999 | 248 | 4.1% |
| $100,000 to $149,999 | 635 | 10.5% |
| $150,000 to $199,999 | 793 | 13.1% |
| $200,000+ | 3,908 | 64.6% |
Family Income by Famaliy Size in Winchester
3-person families (1,215 | 20.1%) account for the highest median family income in Winchester with $250,001 per family, while 2-person families (2,181 | 36.0%) have the highest median income of $100,156 per family member.
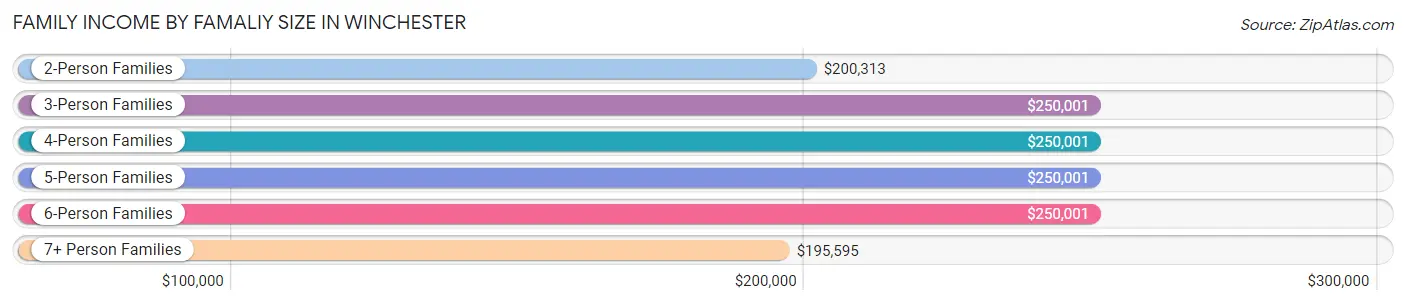
| Income Bracket | # Families | Median Income |
| 2-Person Families | 2,181 (36.0%) | $200,313 |
| 3-Person Families | 1,215 (20.1%) | $250,001 |
| 4-Person Families | 1,761 (29.1%) | $250,001 |
| 5-Person Families | 675 (11.2%) | $250,001 |
| 6-Person Families | 156 (2.6%) | $250,001 |
| 7+ Person Families | 62 (1.0%) | $195,595 |
| Total | 6,050 (100.0%) | $250,001 |
Family Income by Number of Earners in Winchester
The median family income in Winchester is $250,001, with families comprising 1 earner (1,403) having the highest median family income of $250,001, while families with no earners (502) have the lowest median family income of $154,048, accounting for 23.2% and 8.3% of families, respectively.
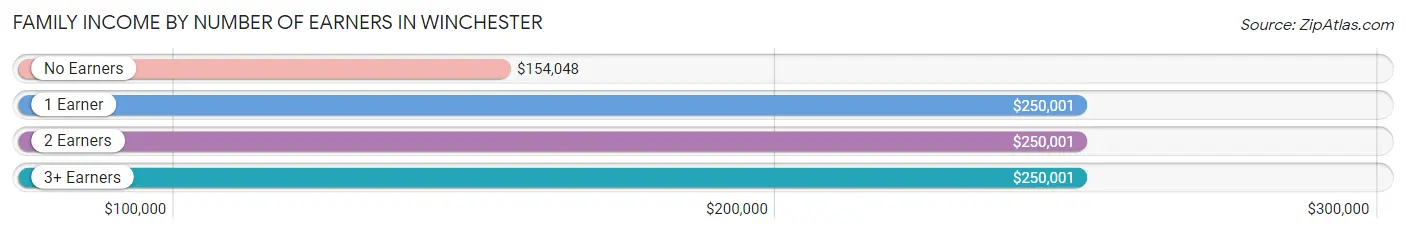
| Number of Earners | # Families | Median Income |
| No Earners | 502 (8.3%) | $154,048 |
| 1 Earner | 1,403 (23.2%) | $250,001 |
| 2 Earners | 3,437 (56.8%) | $250,001 |
| 3+ Earners | 708 (11.7%) | $250,001 |
| Total | 6,050 (100.0%) | $250,001 |
Household Income in Winchester
Household Income Brackets in Winchester
With 4,235 households falling in the category, the $200,000+ income range is the most frequent in Winchester, accounting for 52.5% of all households. In contrast, only 81 households (1.0%) fall into the $10,000 to $14,999 income bracket, making it the least populous group.
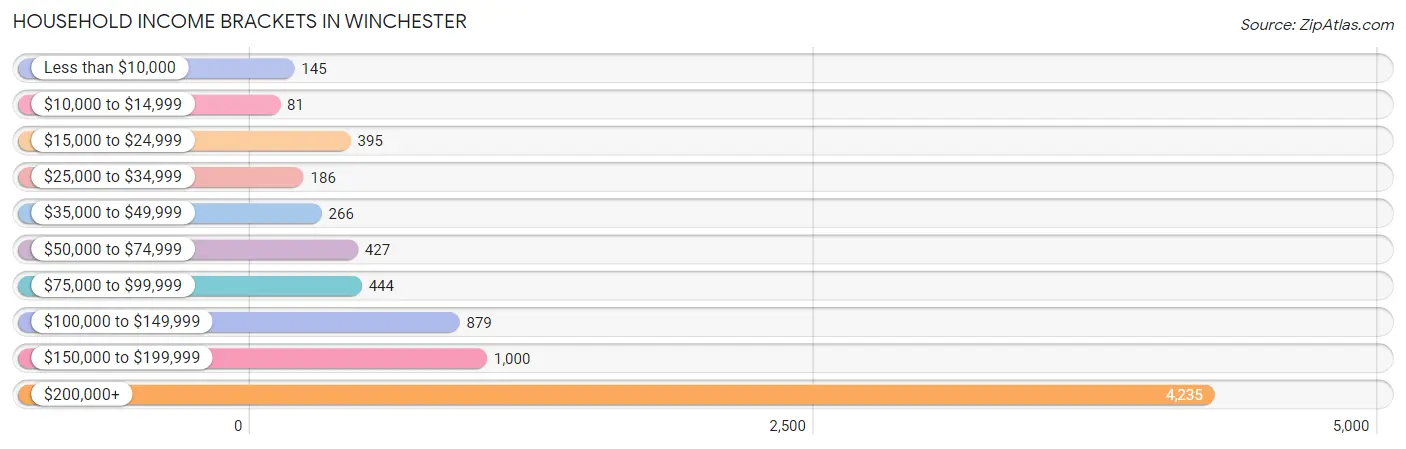
| Income Bracket | # Households | % Households |
| Less than $10,000 | 145 | 1.8% |
| $10,000 to $14,999 | 81 | 1.0% |
| $15,000 to $24,999 | 395 | 4.9% |
| $25,000 to $34,999 | 186 | 2.3% |
| $35,000 to $49,999 | 266 | 3.3% |
| $50,000 to $74,999 | 427 | 5.3% |
| $75,000 to $99,999 | 444 | 5.5% |
| $100,000 to $149,999 | 879 | 10.9% |
| $150,000 to $199,999 | 1,000 | 12.4% |
| $200,000+ | 4,235 | 52.5% |
Household Income by Householder Age in Winchester
The median household income in Winchester is $208,531, with the highest median household income of $250,001 found in the 45 to 64 years age bracket for the primary householder. A total of 3,459 households (42.9%) fall into this category. Meanwhile, the 15 to 24 years age bracket for the primary householder has the lowest median household income of $73,661, with 46 households (0.6%) in this group.
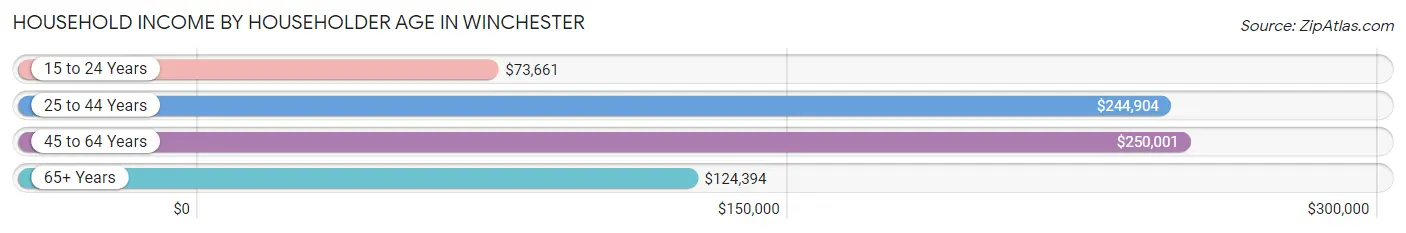
| Income Bracket | # Households | Median Income |
| 15 to 24 Years | 46 (0.6%) | $73,661 |
| 25 to 44 Years | 2,103 (26.1%) | $244,904 |
| 45 to 64 Years | 3,459 (42.9%) | $250,001 |
| 65+ Years | 2,458 (30.5%) | $124,394 |
| Total | 8,066 (100.0%) | $208,531 |
Poverty in Winchester
Income Below Poverty by Sex and Age in Winchester
With 3.3% poverty level for males and 3.4% for females among the residents of Winchester, 45 to 54 year old males and 75 year old and over females are the most vulnerable to poverty, with 141 males (7.3%) and 169 females (14.7%) in their respective age groups living below the poverty level.
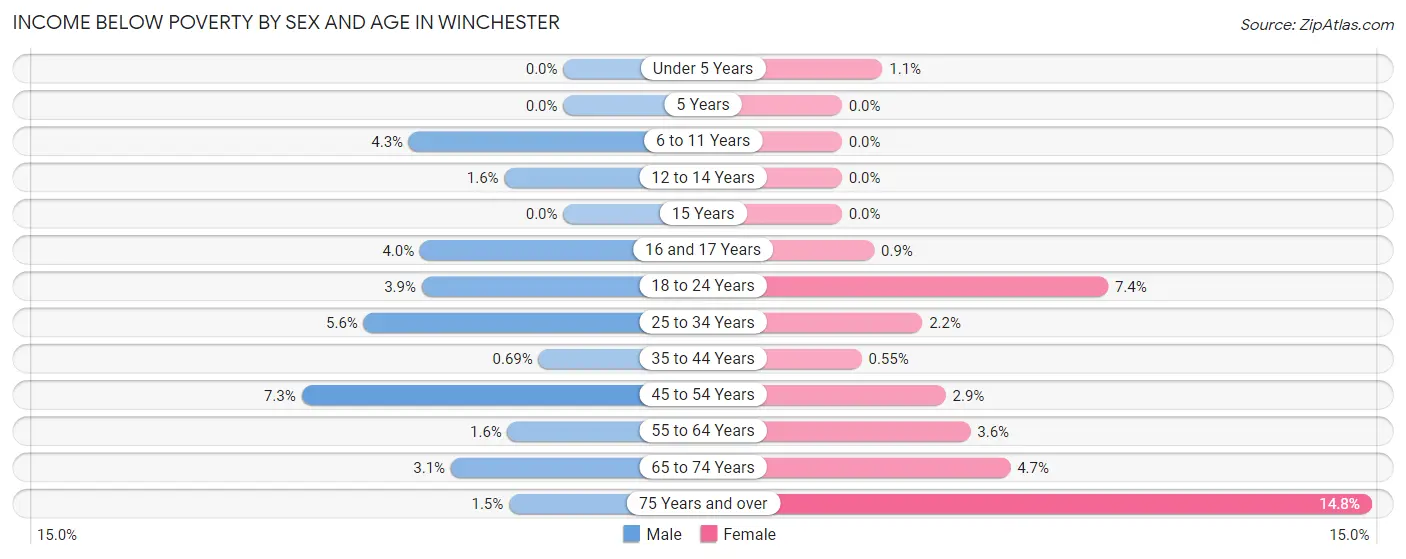
| Age Bracket | Male | Female |
| Under 5 Years | 0 (0.0%) | 9 (1.1%) |
| 5 Years | 0 (0.0%) | 0 (0.0%) |
| 6 to 11 Years | 41 (4.3%) | 0 (0.0%) |
| 12 to 14 Years | 9 (1.6%) | 0 (0.0%) |
| 15 Years | 0 (0.0%) | 0 (0.0%) |
| 16 and 17 Years | 14 (4.0%) | 4 (0.9%) |
| 18 to 24 Years | 25 (3.9%) | 43 (7.4%) |
| 25 to 34 Years | 44 (5.6%) | 16 (2.2%) |
| 35 to 44 Years | 10 (0.7%) | 9 (0.5%) |
| 45 to 54 Years | 141 (7.3%) | 56 (2.9%) |
| 55 to 64 Years | 20 (1.5%) | 53 (3.6%) |
| 65 to 74 Years | 30 (3.1%) | 52 (4.7%) |
| 75 Years and over | 9 (1.5%) | 169 (14.7%) |
| Total | 343 (3.3%) | 411 (3.4%) |
Income Above Poverty by Sex and Age in Winchester
According to the poverty statistics in Winchester, males aged under 5 years and females aged 5 years are the age groups that are most secure financially, with 100.0% of males and 100.0% of females in these age groups living above the poverty line.
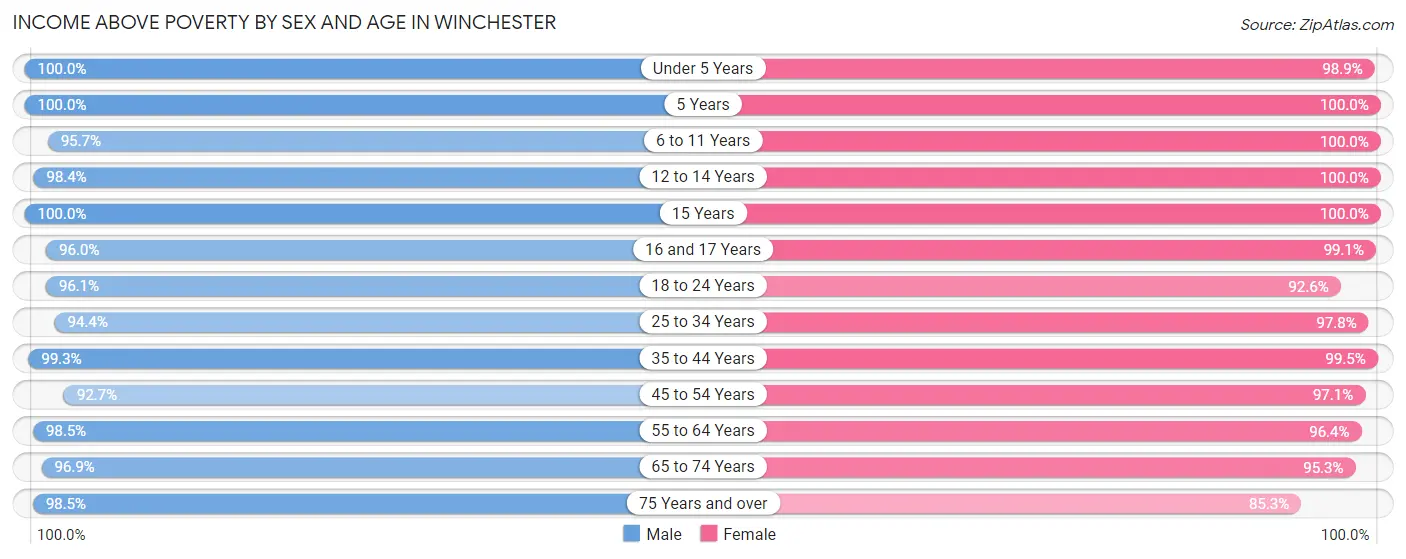
| Age Bracket | Male | Female |
| Under 5 Years | 534 (100.0%) | 786 (98.9%) |
| 5 Years | 275 (100.0%) | 297 (100.0%) |
| 6 to 11 Years | 912 (95.7%) | 1,018 (100.0%) |
| 12 to 14 Years | 541 (98.4%) | 630 (100.0%) |
| 15 Years | 231 (100.0%) | 193 (100.0%) |
| 16 and 17 Years | 337 (96.0%) | 438 (99.1%) |
| 18 to 24 Years | 609 (96.1%) | 537 (92.6%) |
| 25 to 34 Years | 748 (94.4%) | 698 (97.8%) |
| 35 to 44 Years | 1,435 (99.3%) | 1,636 (99.5%) |
| 45 to 54 Years | 1,792 (92.7%) | 1,883 (97.1%) |
| 55 to 64 Years | 1,274 (98.5%) | 1,427 (96.4%) |
| 65 to 74 Years | 927 (96.9%) | 1,057 (95.3%) |
| 75 Years and over | 588 (98.5%) | 977 (85.3%) |
| Total | 10,203 (96.8%) | 11,577 (96.6%) |
Income Below Poverty Among Married-Couple Families in Winchester
The poverty statistics for married-couple families in Winchester show that 1.0% or 51 of the total 5,223 families live below the poverty line. Families with 3 or 4 children have the highest poverty rate of 1.8%, comprising of 9 families. On the other hand, families with 5 or more children have the lowest poverty rate of 0.0%, which includes 0 families.
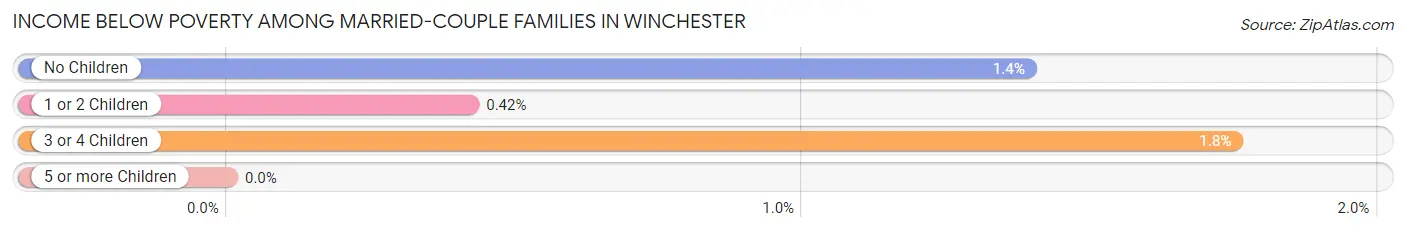
| Children | Above Poverty | Below Poverty |
| No Children | 2,268 (98.6%) | 32 (1.4%) |
| 1 or 2 Children | 2,372 (99.6%) | 10 (0.4%) |
| 3 or 4 Children | 505 (98.3%) | 9 (1.8%) |
| 5 or more Children | 27 (100.0%) | 0 (0.0%) |
| Total | 5,172 (99.0%) | 51 (1.0%) |
Income Below Poverty Among Single-Parent Households in Winchester
According to the poverty data in Winchester, 13.5% or 29 single-father households and 13.9% or 85 single-mother households are living below the poverty line. Among single-father households, those with 1 or 2 children have the highest poverty rate, with 29 households (18.5%) experiencing poverty. Likewise, among single-mother households, those with no children have the highest poverty rate, with 70 households (21.7%) falling below the poverty line.
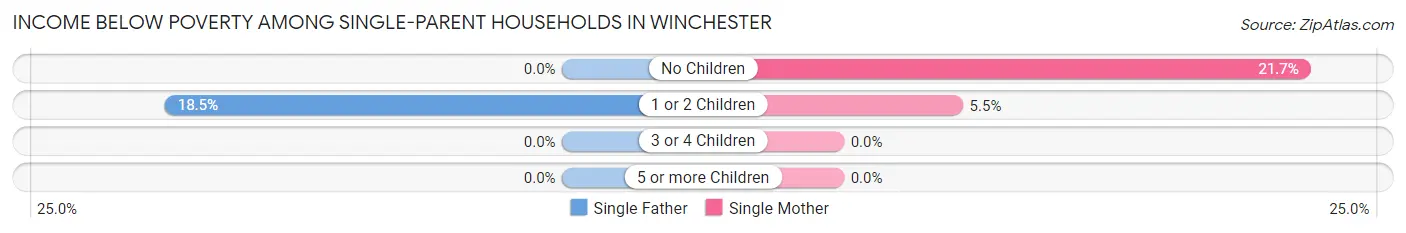
| Children | Single Father | Single Mother |
| No Children | 0 (0.0%) | 70 (21.7%) |
| 1 or 2 Children | 29 (18.5%) | 15 (5.5%) |
| 3 or 4 Children | 0 (0.0%) | 0 (0.0%) |
| 5 or more Children | 0 (0.0%) | 0 (0.0%) |
| Total | 29 (13.5%) | 85 (13.9%) |
Income Below Poverty Among Married-Couple vs Single-Parent Households in Winchester
The poverty data for Winchester shows that 51 of the married-couple family households (1.0%) and 114 of the single-parent households (13.8%) are living below the poverty level. Within the married-couple family households, those with 3 or 4 children have the highest poverty rate, with 9 households (1.8%) falling below the poverty line. Among the single-parent households, those with no children have the highest poverty rate, with 70 household (19.5%) living below poverty.
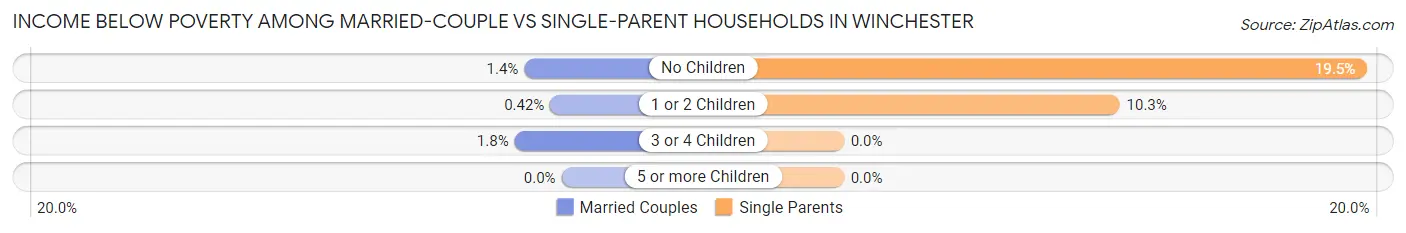
| Children | Married-Couple Families | Single-Parent Households |
| No Children | 32 (1.4%) | 70 (19.5%) |
| 1 or 2 Children | 10 (0.4%) | 44 (10.3%) |
| 3 or 4 Children | 9 (1.8%) | 0 (0.0%) |
| 5 or more Children | 0 (0.0%) | 0 (0.0%) |
| Total | 51 (1.0%) | 114 (13.8%) |
Race in Winchester
The most populous races in Winchester are White / Caucasian (17,075 | 74.9%), Asian (3,600 | 15.8%), and Two or more Races (1,228 | 5.4%).
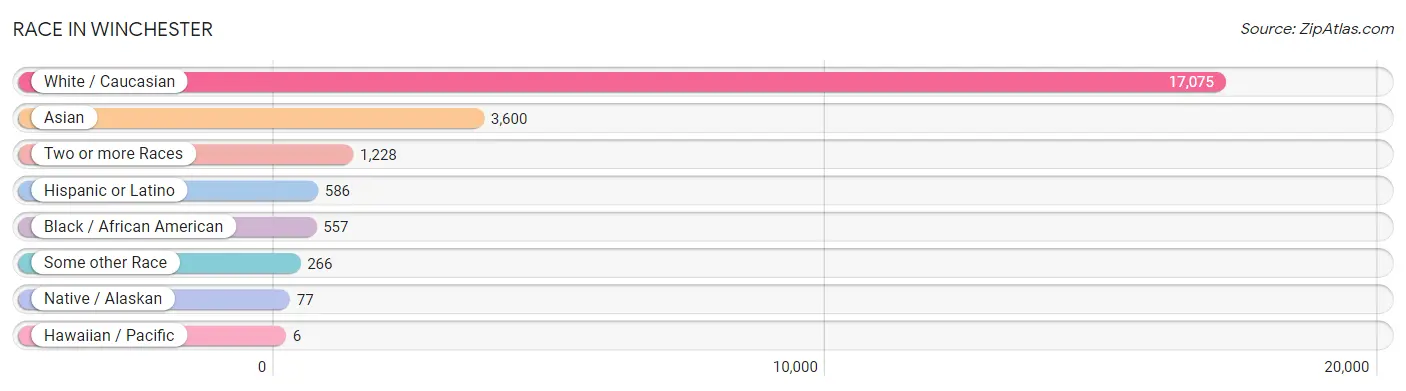
| Race | # Population | % Population |
| Asian | 3,600 | 15.8% |
| Black / African American | 557 | 2.4% |
| Hawaiian / Pacific | 6 | 0.0% |
| Hispanic or Latino | 586 | 2.6% |
| Native / Alaskan | 77 | 0.3% |
| White / Caucasian | 17,075 | 74.9% |
| Two or more Races | 1,228 | 5.4% |
| Some other Race | 266 | 1.2% |
| Total | 22,809 | 100.0% |
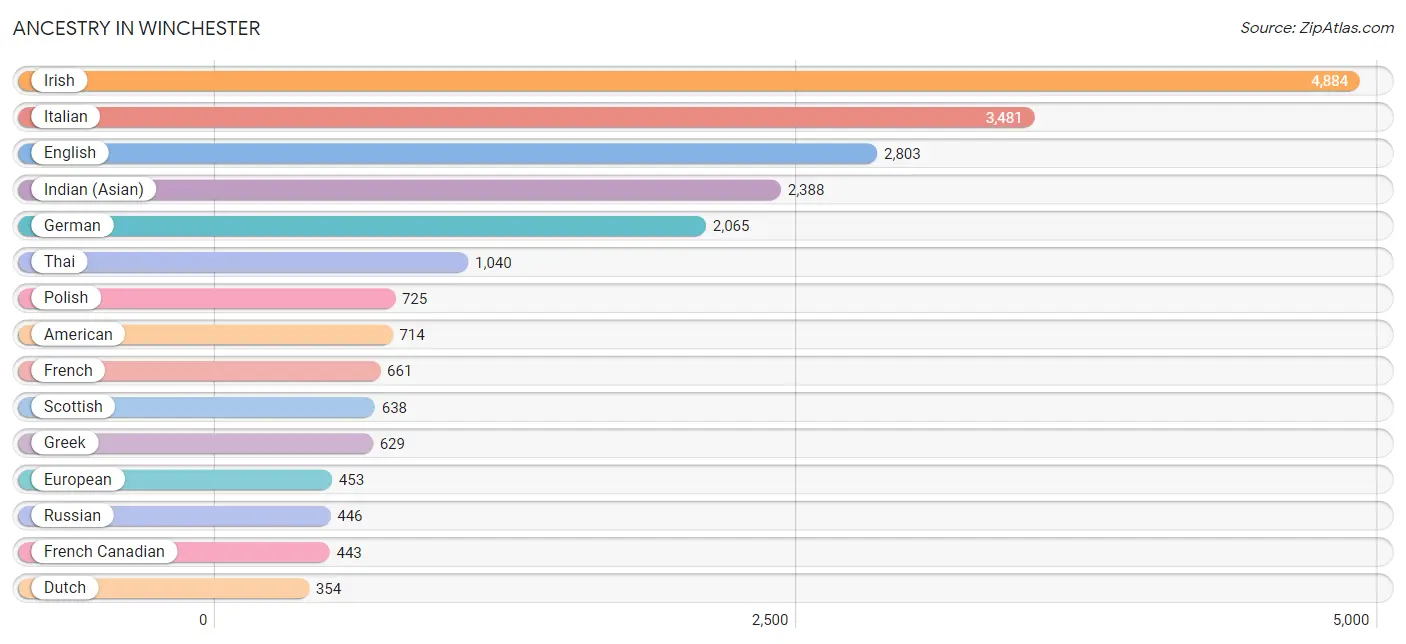
Ancestry in Winchester
The most populous ancestries reported in Winchester are Irish (4,884 | 21.4%), Italian (3,481 | 15.3%), English (2,803 | 12.3%), Indian (Asian) (2,388 | 10.5%), and German (2,065 | 9.0%), together accounting for 68.5% of all Winchester residents.
| Ancestry | # Population | % Population |
| African | 54 | 0.2% |
| American | 714 | 3.1% |
| Arab | 166 | 0.7% |
| Argentinean | 216 | 0.9% |
| Armenian | 227 | 1.0% |
| Australian | 11 | 0.1% |
| Austrian | 120 | 0.5% |
| Belgian | 28 | 0.1% |
| Bhutanese | 35 | 0.2% |
| Brazilian | 73 | 0.3% |
| British | 291 | 1.3% |
| British West Indian | 99 | 0.4% |
| Bulgarian | 105 | 0.5% |
| Burmese | 165 | 0.7% |
| Cambodian | 17 | 0.1% |
| Canadian | 126 | 0.5% |
| Central American | 54 | 0.2% |
| Chilean | 6 | 0.0% |
| Colombian | 66 | 0.3% |
| Creek | 6 | 0.0% |
| Croatian | 115 | 0.5% |
| Cuban | 17 | 0.1% |
| Czech | 14 | 0.1% |
| Danish | 120 | 0.5% |
| Dominican | 1 | 0.0% |
| Dutch | 354 | 1.5% |
| Eastern European | 188 | 0.8% |
| Egyptian | 15 | 0.1% |
| English | 2,803 | 12.3% |
| European | 453 | 2.0% |
| Filipino | 84 | 0.4% |
| Finnish | 42 | 0.2% |
| French | 661 | 2.9% |
| French Canadian | 443 | 1.9% |
| German | 2,065 | 9.0% |
| Greek | 629 | 2.8% |
| Guatemalan | 6 | 0.0% |
| Haitian | 271 | 1.2% |
| Honduran | 48 | 0.2% |
| Hungarian | 33 | 0.1% |
| Indian (Asian) | 2,388 | 10.5% |
| Iranian | 37 | 0.2% |
| Iraqi | 16 | 0.1% |
| Irish | 4,884 | 21.4% |
| Italian | 3,481 | 15.3% |
| Jamaican | 84 | 0.4% |
| Japanese | 76 | 0.3% |
| Korean | 60 | 0.3% |
| Latvian | 7 | 0.0% |
| Lebanese | 27 | 0.1% |
| Lithuanian | 48 | 0.2% |
| Mexican | 65 | 0.3% |
| Moroccan | 42 | 0.2% |
| Nigerian | 103 | 0.4% |
| Northern European | 74 | 0.3% |
| Norwegian | 86 | 0.4% |
| Pennsylvania German | 9 | 0.0% |
| Polish | 725 | 3.2% |
| Portuguese | 269 | 1.2% |
| Pueblo | 4 | 0.0% |
| Puerto Rican | 83 | 0.4% |
| Romanian | 62 | 0.3% |
| Russian | 446 | 2.0% |
| Scotch-Irish | 238 | 1.0% |
| Scottish | 638 | 2.8% |
| Sioux | 4 | 0.0% |
| Slovak | 30 | 0.1% |
| Slovene | 77 | 0.3% |
| South African | 9 | 0.0% |
| South American | 319 | 1.4% |
| Spaniard | 47 | 0.2% |
| Sri Lankan | 73 | 0.3% |
| Subsaharan African | 166 | 0.7% |
| Swedish | 299 | 1.3% |
| Swiss | 75 | 0.3% |
| Syrian | 55 | 0.2% |
| Thai | 1,040 | 4.6% |
| Turkish | 65 | 0.3% |
| Ukrainian | 61 | 0.3% |
| Venezuelan | 31 | 0.1% |
| Welsh | 152 | 0.7% | View All 81 Rows |
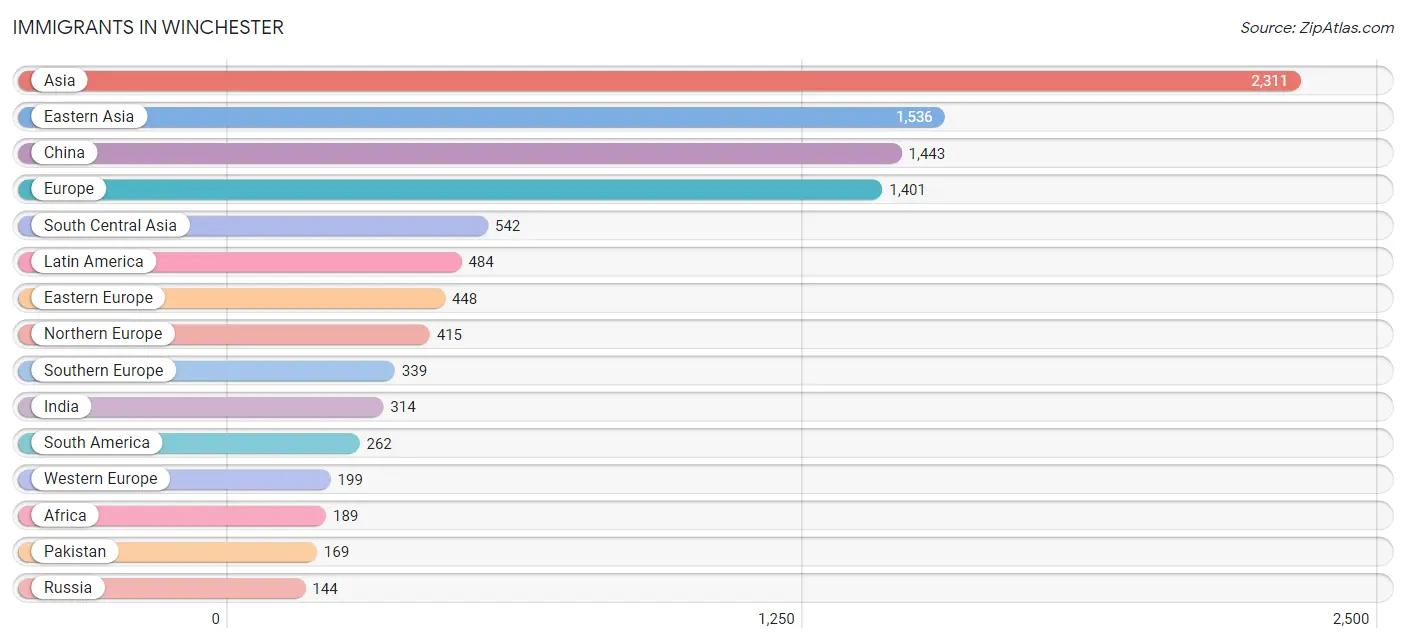
Immigrants in Winchester
The most numerous immigrant groups reported in Winchester came from Asia (2,311 | 10.1%), Eastern Asia (1,536 | 6.7%), China (1,443 | 6.3%), Europe (1,401 | 6.1%), and South Central Asia (542 | 2.4%), together accounting for 31.7% of all Winchester residents.
| Immigration Origin | # Population | % Population |
| Africa | 189 | 0.8% |
| Argentina | 77 | 0.3% |
| Asia | 2,311 | 10.1% |
| Azores | 28 | 0.1% |
| Belarus | 37 | 0.2% |
| Belgium | 18 | 0.1% |
| Brazil | 84 | 0.4% |
| Bulgaria | 91 | 0.4% |
| Cambodia | 16 | 0.1% |
| Canada | 92 | 0.4% |
| Caribbean | 131 | 0.6% |
| Central America | 91 | 0.4% |
| China | 1,443 | 6.3% |
| Colombia | 70 | 0.3% |
| Cuba | 4 | 0.0% |
| Denmark | 21 | 0.1% |
| Dominican Republic | 1 | 0.0% |
| Eastern Africa | 32 | 0.1% |
| Eastern Asia | 1,536 | 6.7% |
| Eastern Europe | 448 | 2.0% |
| Egypt | 41 | 0.2% |
| England | 86 | 0.4% |
| Europe | 1,401 | 6.1% |
| France | 78 | 0.3% |
| Germany | 65 | 0.3% |
| Greece | 125 | 0.5% |
| Guatemala | 72 | 0.3% |
| Haiti | 75 | 0.3% |
| Hong Kong | 76 | 0.3% |
| India | 314 | 1.4% |
| Iran | 31 | 0.1% |
| Iraq | 16 | 0.1% |
| Ireland | 105 | 0.5% |
| Italy | 113 | 0.5% |
| Japan | 8 | 0.0% |
| Kenya | 32 | 0.1% |
| Korea | 85 | 0.4% |
| Latin America | 484 | 2.1% |
| Lebanon | 29 | 0.1% |
| Mexico | 19 | 0.1% |
| Morocco | 36 | 0.2% |
| Nepal | 3 | 0.0% |
| Netherlands | 38 | 0.2% |
| Nigeria | 60 | 0.3% |
| Northern Africa | 77 | 0.3% |
| Northern Europe | 415 | 1.8% |
| Pakistan | 169 | 0.7% |
| Philippines | 71 | 0.3% |
| Poland | 49 | 0.2% |
| Portugal | 64 | 0.3% |
| Romania | 36 | 0.2% |
| Russia | 144 | 0.6% |
| Saudi Arabia | 17 | 0.1% |
| Scotland | 10 | 0.0% |
| Sierra Leone | 11 | 0.1% |
| Singapore | 18 | 0.1% |
| South Africa | 9 | 0.0% |
| South America | 262 | 1.1% |
| South Central Asia | 542 | 2.4% |
| South Eastern Asia | 105 | 0.5% |
| Southern Europe | 339 | 1.5% |
| Spain | 37 | 0.2% |
| Syria | 10 | 0.0% |
| Taiwan | 73 | 0.3% |
| Turkey | 42 | 0.2% |
| Ukraine | 52 | 0.2% |
| Uruguay | 12 | 0.1% |
| Uzbekistan | 17 | 0.1% |
| Venezuela | 19 | 0.1% |
| Western Africa | 71 | 0.3% |
| Western Asia | 128 | 0.6% |
| Western Europe | 199 | 0.9% | View All 72 Rows |
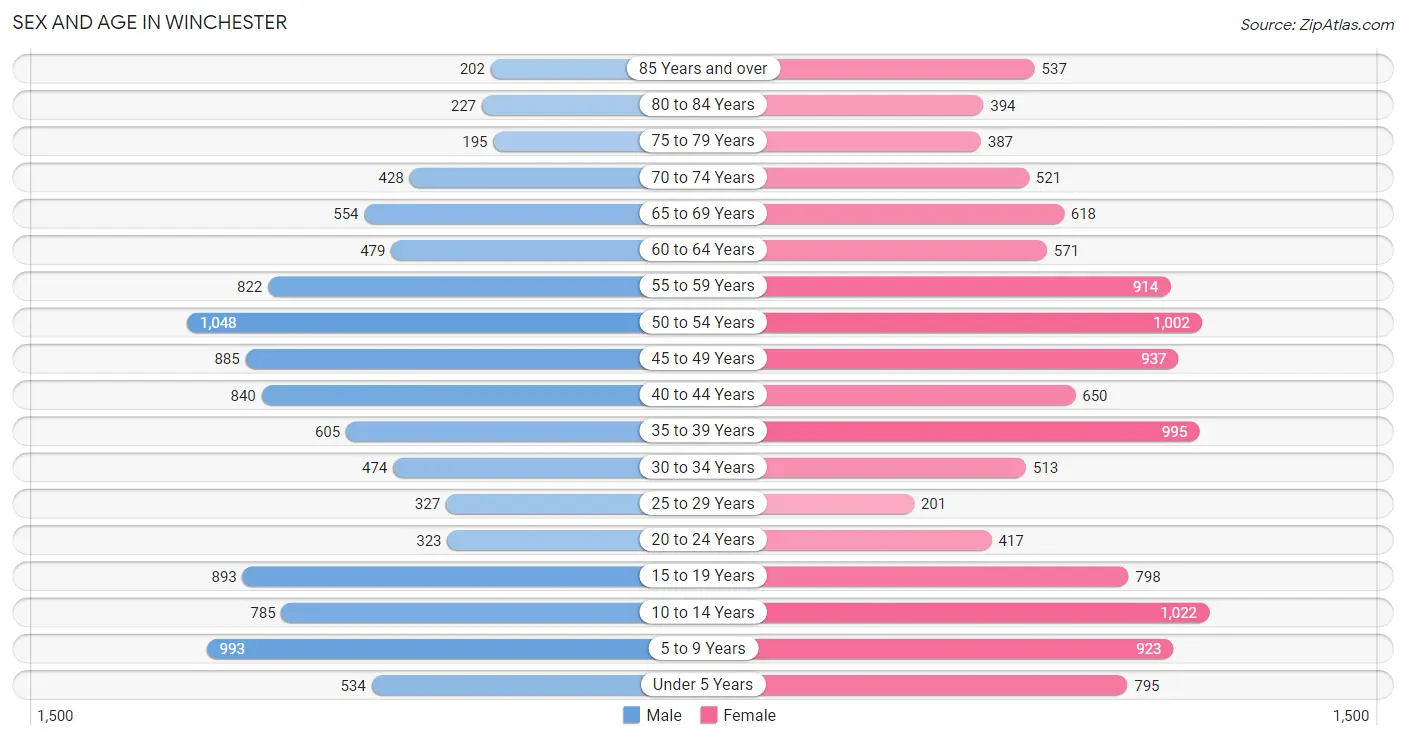
Sex and Age in Winchester
Sex and Age in Winchester
The most populous age groups in Winchester are 50 to 54 Years (1,048 | 9.9%) for men and 10 to 14 Years (1,022 | 8.4%) for women.
| Age Bracket | Male | Female |
| Under 5 Years | 534 (5.0%) | 795 (6.5%) |
| 5 to 9 Years | 993 (9.4%) | 923 (7.6%) |
| 10 to 14 Years | 785 (7.4%) | 1,022 (8.4%) |
| 15 to 19 Years | 893 (8.4%) | 798 (6.5%) |
| 20 to 24 Years | 323 (3.0%) | 417 (3.4%) |
| 25 to 29 Years | 327 (3.1%) | 201 (1.7%) |
| 30 to 34 Years | 474 (4.5%) | 513 (4.2%) |
| 35 to 39 Years | 605 (5.7%) | 995 (8.2%) |
| 40 to 44 Years | 840 (7.9%) | 650 (5.3%) |
| 45 to 49 Years | 885 (8.3%) | 937 (7.7%) |
| 50 to 54 Years | 1,048 (9.9%) | 1,002 (8.2%) |
| 55 to 59 Years | 822 (7.7%) | 914 (7.5%) |
| 60 to 64 Years | 479 (4.5%) | 571 (4.7%) |
| 65 to 69 Years | 554 (5.2%) | 618 (5.1%) |
| 70 to 74 Years | 428 (4.0%) | 521 (4.3%) |
| 75 to 79 Years | 195 (1.8%) | 387 (3.2%) |
| 80 to 84 Years | 227 (2.1%) | 394 (3.2%) |
| 85 Years and over | 202 (1.9%) | 537 (4.4%) |
| Total | 10,614 (100.0%) | 12,195 (100.0%) |
Families and Households in Winchester
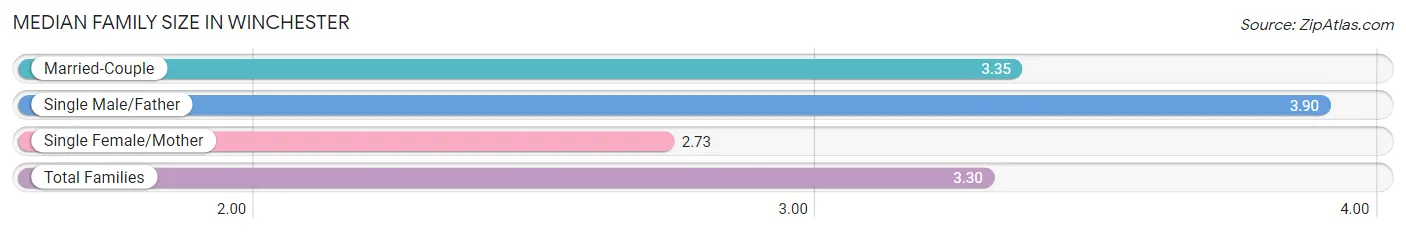
Median Family Size in Winchester
The median family size in Winchester is 3.30 persons per family, with single male/father families (215 | 3.5%) accounting for the largest median family size of 3.9 persons per family. On the other hand, single female/mother families (612 | 10.1%) represent the smallest median family size with 2.73 persons per family.
| Family Type | # Families | Family Size |
| Married-Couple | 5,223 (86.3%) | 3.35 |
| Single Male/Father | 215 (3.5%) | 3.90 |
| Single Female/Mother | 612 (10.1%) | 2.73 |
| Total Families | 6,050 (100.0%) | 3.30 |
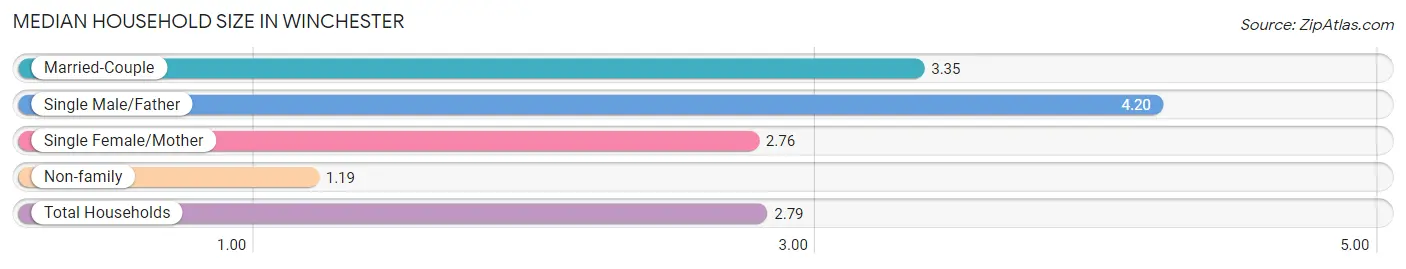
Median Household Size in Winchester
The median household size in Winchester is 2.79 persons per household, with single male/father households (215 | 2.7%) accounting for the largest median household size of 4.2 persons per household. non-family households (2,016 | 25.0%) represent the smallest median household size with 1.19 persons per household.
| Household Type | # Households | Household Size |
| Married-Couple | 5,223 (64.7%) | 3.35 |
| Single Male/Father | 215 (2.7%) | 4.20 |
| Single Female/Mother | 612 (7.6%) | 2.76 |
| Non-family | 2,016 (25.0%) | 1.19 |
| Total Households | 8,066 (100.0%) | 2.79 |
Household Size by Marriage Status in Winchester
Out of a total of 8,066 households in Winchester, 6,050 (75.0%) are family households, while 2,016 (25.0%) are nonfamily households. The most numerous type of family households are 2-person households, comprising 2,152, and the most common type of nonfamily households are 1-person households, comprising 1,656.
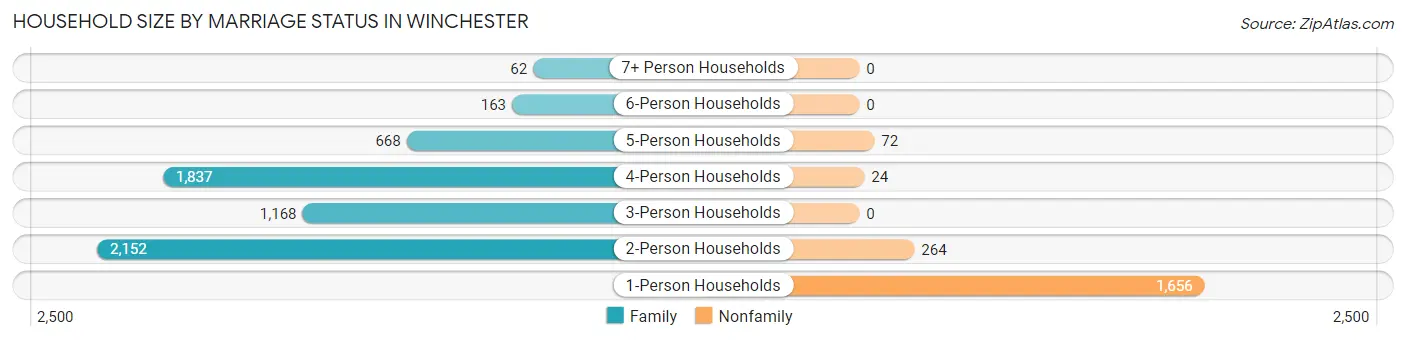
| Household Size | Family Households | Nonfamily Households |
| 1-Person Households | - | 1,656 (20.5%) |
| 2-Person Households | 2,152 (26.7%) | 264 (3.3%) |
| 3-Person Households | 1,168 (14.5%) | 0 (0.0%) |
| 4-Person Households | 1,837 (22.8%) | 24 (0.3%) |
| 5-Person Households | 668 (8.3%) | 72 (0.9%) |
| 6-Person Households | 163 (2.0%) | 0 (0.0%) |
| 7+ Person Households | 62 (0.8%) | 0 (0.0%) |
| Total | 6,050 (75.0%) | 2,016 (25.0%) |
Female Fertility in Winchester
Fertility by Age in Winchester
Average fertility rate in Winchester is 44.0 births per 1,000 women. Women in the age bracket of 20 to 34 years have the highest fertility rate with 57.0 births per 1,000 women. Women in the age bracket of 35 to 50 years acount for 69.3% of all women with births.
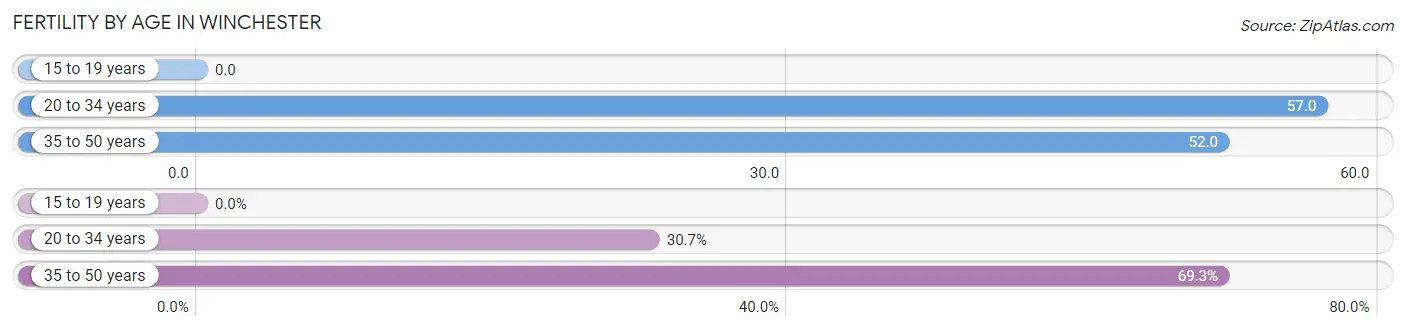
| Age Bracket | Women with Births | Births / 1,000 Women |
| 15 to 19 years | 0 (0.0%) | 0.0 |
| 20 to 34 years | 65 (30.7%) | 57.0 |
| 35 to 50 years | 147 (69.3%) | 52.0 |
| Total | 212 (100.0%) | 44.0 |
Fertility by Age by Marriage Status in Winchester
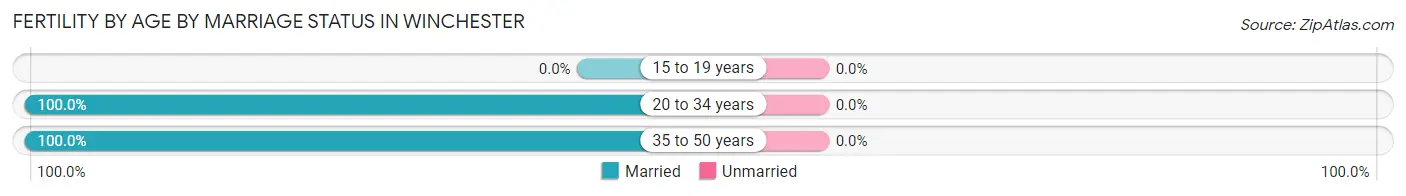
| Age Bracket | Married | Unmarried |
| 15 to 19 years | 0 (0.0%) | 0 (0.0%) |
| 20 to 34 years | 65 (100.0%) | 0 (0.0%) |
| 35 to 50 years | 147 (100.0%) | 0 (0.0%) |
| Total | 212 (100.0%) | 0 (0.0%) |
Fertility by Education in Winchester
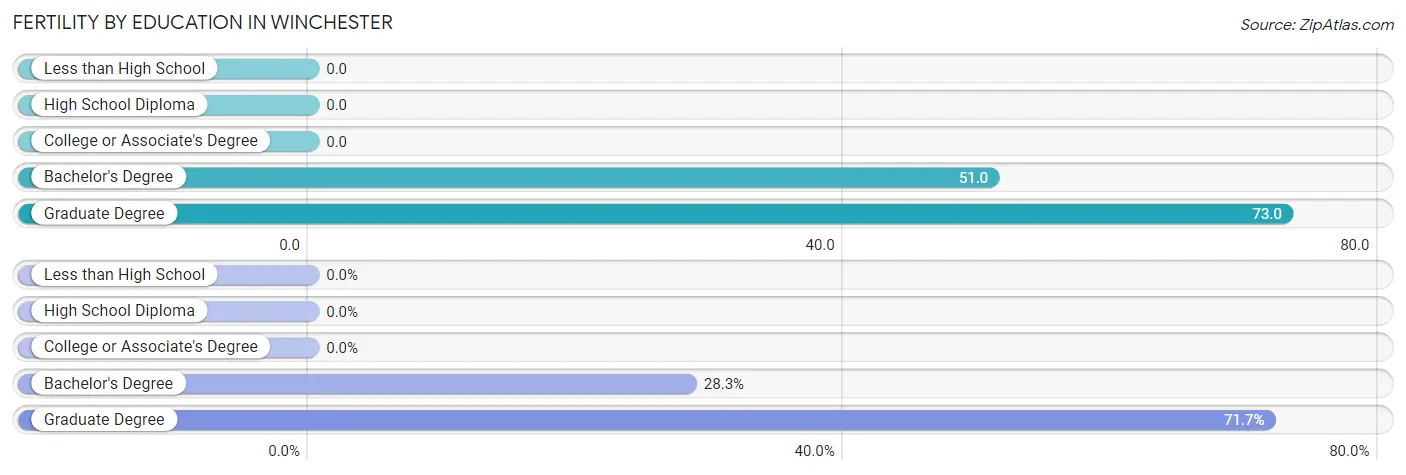
| Educational Attainment | Women with Births | Births / 1,000 Women |
| Less than High School | 0 (0.0%) | 0.0 |
| High School Diploma | 0 (0.0%) | 0.0 |
| College or Associate's Degree | 0 (0.0%) | 0.0 |
| Bachelor's Degree | 60 (28.3%) | 51.0 |
| Graduate Degree | 152 (71.7%) | 73.0 |
| Total | 212 (100.0%) | 44.0 |
Fertility by Education by Marriage Status in Winchester
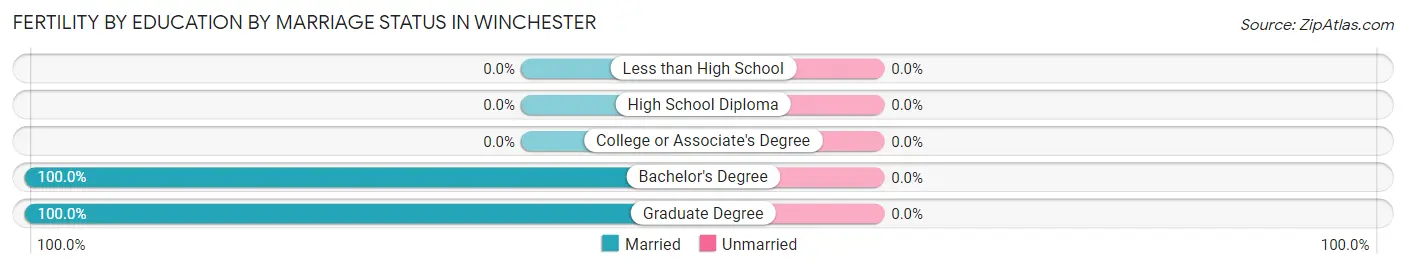
| Educational Attainment | Married | Unmarried |
| Less than High School | 0 (0.0%) | 0 (0.0%) |
| High School Diploma | 0 (0.0%) | 0 (0.0%) |
| College or Associate's Degree | 0 (0.0%) | 0 (0.0%) |
| Bachelor's Degree | 60 (100.0%) | 0 (0.0%) |
| Graduate Degree | 152 (100.0%) | 0 (0.0%) |
| Total | 212 (100.0%) | 0 (0.0%) |
Employment Characteristics in Winchester
Employment by Class of Employer in Winchester
Among the 11,268 employed individuals in Winchester, private company employees (7,294 | 64.7%), not-for-profit organizations (1,770 | 15.7%), and self-employed (incorporated) (685 | 6.1%) make up the most common classes of employment.
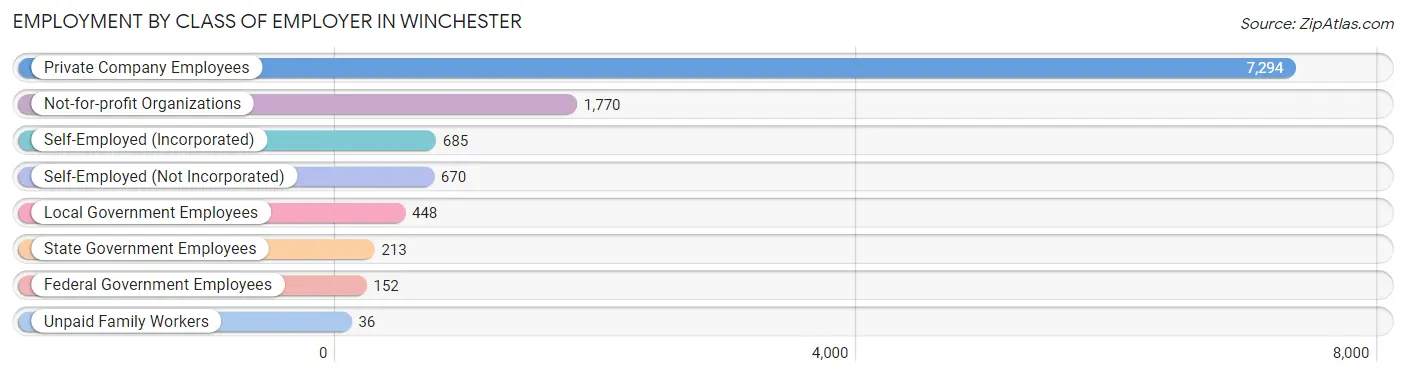
| Employer Class | # Employees | % Employees |
| Private Company Employees | 7,294 | 64.7% |
| Self-Employed (Incorporated) | 685 | 6.1% |
| Self-Employed (Not Incorporated) | 670 | 5.9% |
| Not-for-profit Organizations | 1,770 | 15.7% |
| Local Government Employees | 448 | 4.0% |
| State Government Employees | 213 | 1.9% |
| Federal Government Employees | 152 | 1.3% |
| Unpaid Family Workers | 36 | 0.3% |
| Total | 11,268 | 100.0% |
Employment Status by Age in Winchester
According to the labor force statistics for Winchester, out of the total population over 16 years of age (17,333), 67.7% or 11,734 individuals are in the labor force, with 3.4% or 399 of them unemployed. The age group with the highest labor force participation rate is 45 to 54 years, with 90.9% or 3,520 individuals in the labor force. Within the labor force, the 16 to 19 years age range has the highest percentage of unemployed individuals, with 16.4% or 55 of them being unemployed.
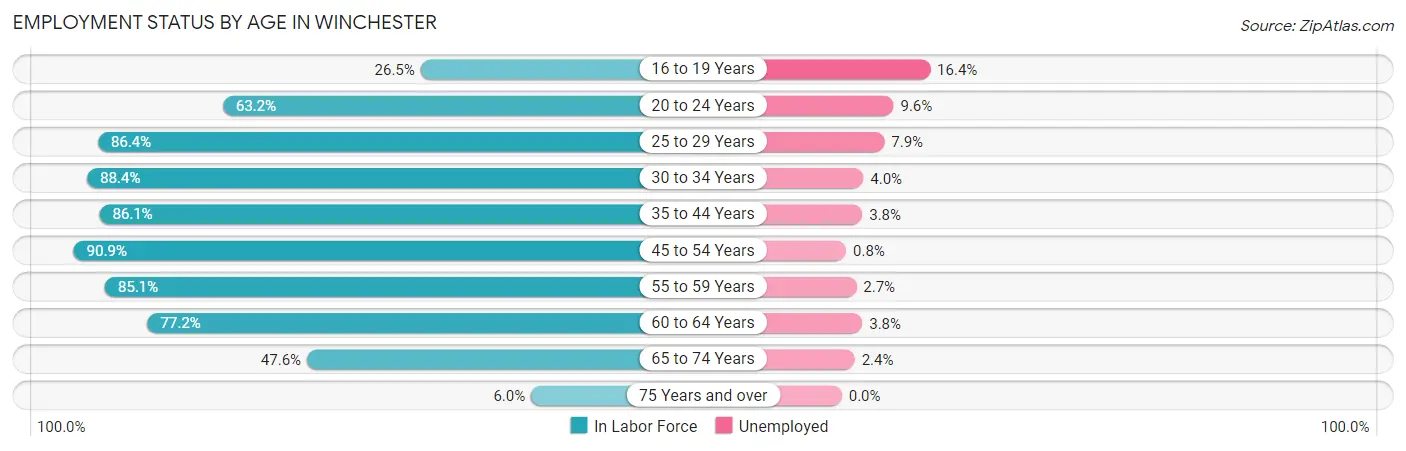
| Age Bracket | In Labor Force | Unemployed |
| 16 to 19 Years | 336 (26.5%) | 55 (16.4%) |
| 20 to 24 Years | 468 (63.2%) | 45 (9.6%) |
| 25 to 29 Years | 456 (86.4%) | 36 (7.9%) |
| 30 to 34 Years | 873 (88.4%) | 35 (4.0%) |
| 35 to 44 Years | 2,660 (86.1%) | 101 (3.8%) |
| 45 to 54 Years | 3,520 (90.9%) | 28 (0.8%) |
| 55 to 59 Years | 1,477 (85.1%) | 40 (2.7%) |
| 60 to 64 Years | 811 (77.2%) | 31 (3.8%) |
| 65 to 74 Years | 1,010 (47.6%) | 24 (2.4%) |
| 75 Years and over | 117 (6.0%) | 0 (0.0%) |
| Total | 11,734 (67.7%) | 399 (3.4%) |
Employment Status by Educational Attainment in Winchester
According to labor force statistics for Winchester, 87.0% of individuals (9,799) out of the total population between 25 and 64 years of age (11,263) are in the labor force, with 2.8% or 274 of them being unemployed. The group with the highest labor force participation rate are those with the educational attainment of bachelor's degree or higher, with 89.3% or 8,333 individuals in the labor force. Within the labor force, individuals with college / associate degree education have the highest percentage of unemployment, with 8.3% or 75 of them being unemployed.
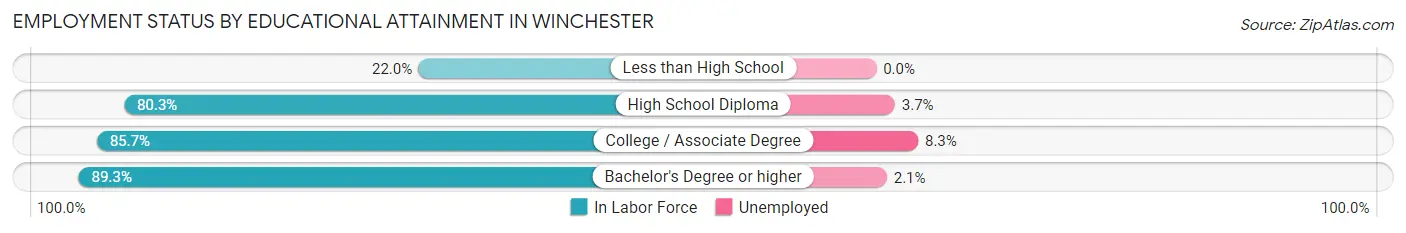
| Educational Attainment | In Labor Force | Unemployed |
| Less than High School | 53 (22.0%) | 0 (0.0%) |
| High School Diploma | 514 (80.3%) | 24 (3.7%) |
| College / Associate Degree | 901 (85.7%) | 87 (8.3%) |
| Bachelor's Degree or higher | 8,333 (89.3%) | 196 (2.1%) |
| Total | 9,799 (87.0%) | 315 (2.8%) |
Employment Occupations by Sex in Winchester
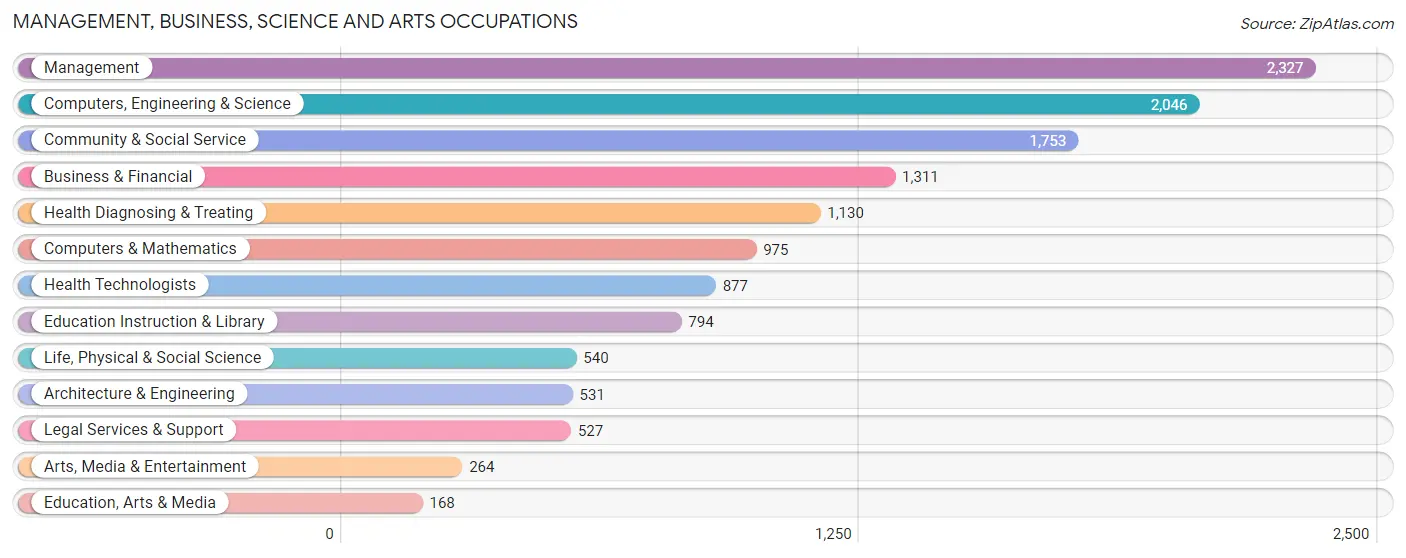
Management, Business, Science and Arts Occupations
The most common Management, Business, Science and Arts occupations in Winchester are Management (2,327 | 20.5%), Computers, Engineering & Science (2,046 | 18.1%), Community & Social Service (1,753 | 15.5%), Business & Financial (1,311 | 11.6%), and Health Diagnosing & Treating (1,130 | 10.0%).
Management, Business, Science and Arts Occupations by Sex
Within the Management, Business, Science and Arts occupations in Winchester, the most male-oriented occupations are Architecture & Engineering (70.6%), Computers & Mathematics (68.3%), and Computers, Engineering & Science (64.8%), while the most female-oriented occupations are Education, Arts & Media (92.3%), Health Diagnosing & Treating (68.0%), and Education Instruction & Library (67.6%).
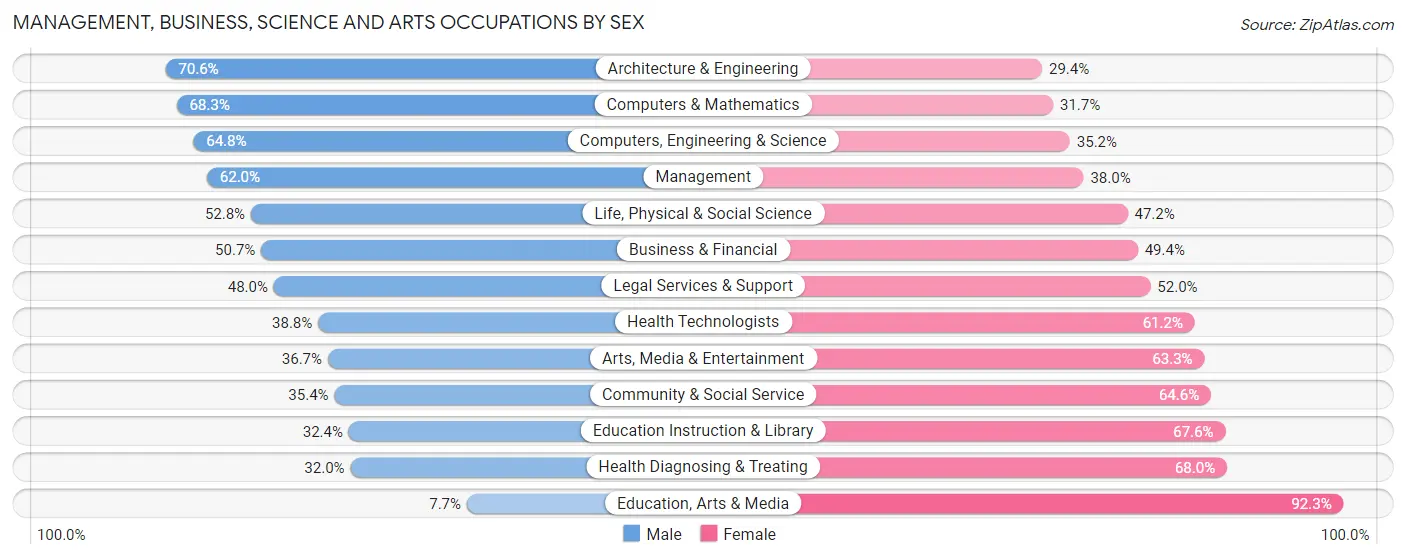
| Occupation | Male | Female |
| Management | 1,442 (62.0%) | 885 (38.0%) |
| Business & Financial | 664 (50.6%) | 647 (49.3%) |
| Computers, Engineering & Science | 1,326 (64.8%) | 720 (35.2%) |
| Computers & Mathematics | 666 (68.3%) | 309 (31.7%) |
| Architecture & Engineering | 375 (70.6%) | 156 (29.4%) |
| Life, Physical & Social Science | 285 (52.8%) | 255 (47.2%) |
| Community & Social Service | 620 (35.4%) | 1,133 (64.6%) |
| Education, Arts & Media | 13 (7.7%) | 155 (92.3%) |
| Legal Services & Support | 253 (48.0%) | 274 (52.0%) |
| Education Instruction & Library | 257 (32.4%) | 537 (67.6%) |
| Arts, Media & Entertainment | 97 (36.7%) | 167 (63.3%) |
| Health Diagnosing & Treating | 362 (32.0%) | 768 (68.0%) |
| Health Technologists | 340 (38.8%) | 537 (61.2%) |
| Total (Category) | 4,414 (51.5%) | 4,153 (48.5%) |
| Total (Overall) | 5,910 (52.1%) | 5,422 (47.8%) |
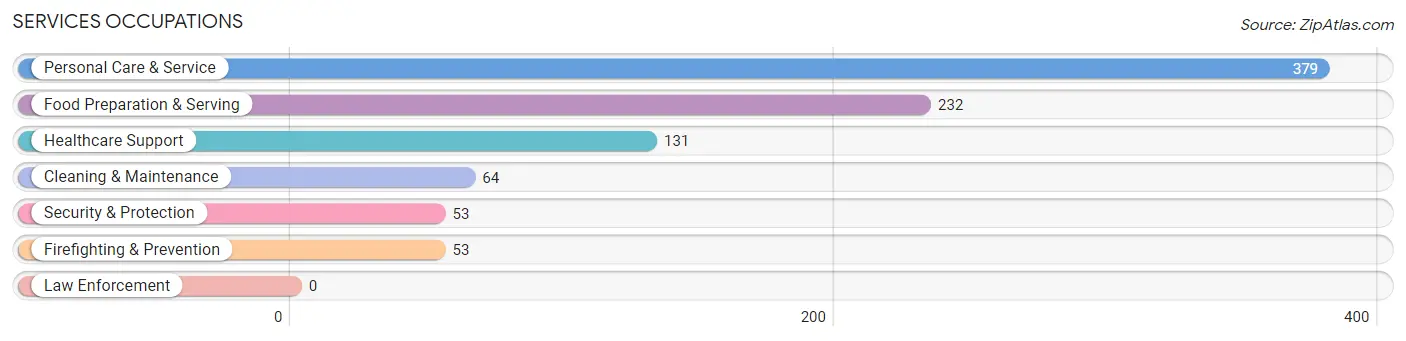
Services Occupations
The most common Services occupations in Winchester are Personal Care & Service (379 | 3.3%), Food Preparation & Serving (232 | 2.1%), Healthcare Support (131 | 1.2%), Cleaning & Maintenance (64 | 0.6%), and Security & Protection (53 | 0.5%).
Services Occupations by Sex
Within the Services occupations in Winchester, the most male-oriented occupations are Cleaning & Maintenance (90.6%), Security & Protection (81.1%), and Firefighting & Prevention (81.1%), while the most female-oriented occupations are Personal Care & Service (69.9%), Healthcare Support (65.6%), and Food Preparation & Serving (37.5%).
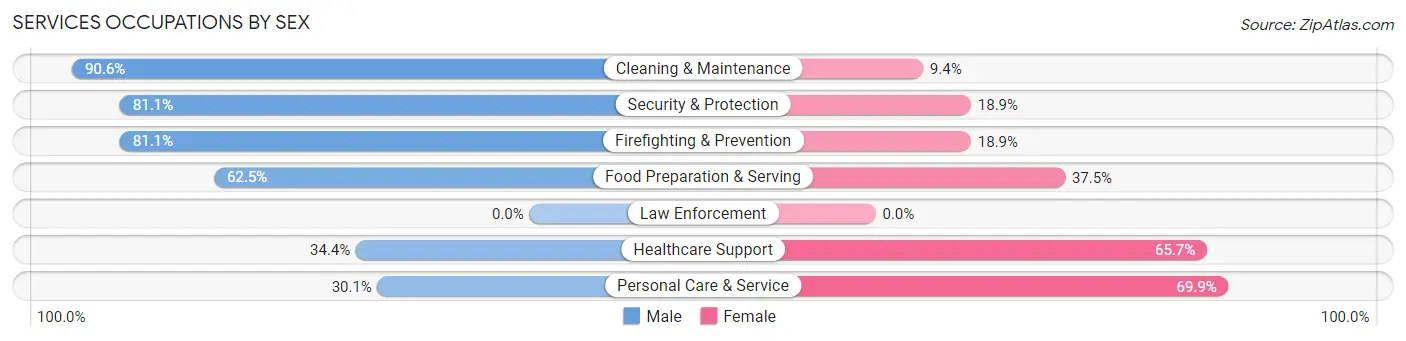
| Occupation | Male | Female |
| Healthcare Support | 45 (34.4%) | 86 (65.6%) |
| Security & Protection | 43 (81.1%) | 10 (18.9%) |
| Firefighting & Prevention | 43 (81.1%) | 10 (18.9%) |
| Law Enforcement | 0 (0.0%) | 0 (0.0%) |
| Food Preparation & Serving | 145 (62.5%) | 87 (37.5%) |
| Cleaning & Maintenance | 58 (90.6%) | 6 (9.4%) |
| Personal Care & Service | 114 (30.1%) | 265 (69.9%) |
| Total (Category) | 405 (47.1%) | 454 (52.8%) |
| Total (Overall) | 5,910 (52.1%) | 5,422 (47.8%) |
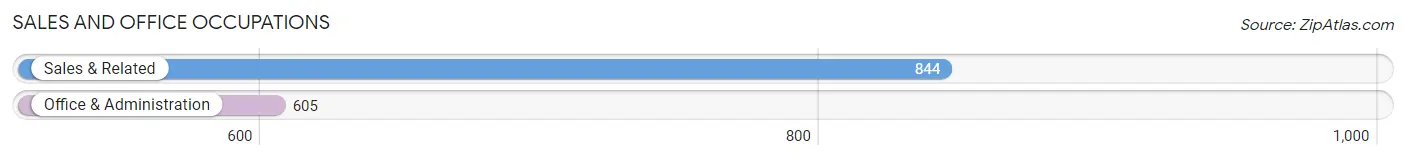
Sales and Office Occupations
The most common Sales and Office occupations in Winchester are Sales & Related (844 | 7.4%), and Office & Administration (605 | 5.3%).
Sales and Office Occupations by Sex
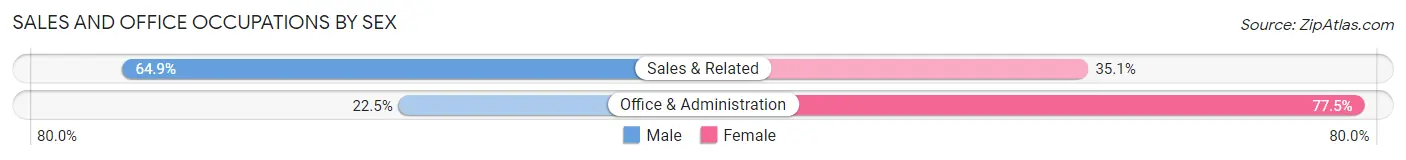
| Occupation | Male | Female |
| Sales & Related | 548 (64.9%) | 296 (35.1%) |
| Office & Administration | 136 (22.5%) | 469 (77.5%) |
| Total (Category) | 684 (47.2%) | 765 (52.8%) |
| Total (Overall) | 5,910 (52.1%) | 5,422 (47.8%) |
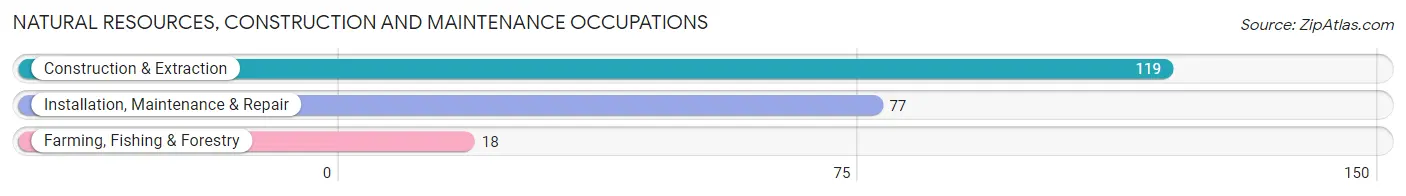
Natural Resources, Construction and Maintenance Occupations
The most common Natural Resources, Construction and Maintenance occupations in Winchester are Construction & Extraction (119 | 1.1%), Installation, Maintenance & Repair (77 | 0.7%), and Farming, Fishing & Forestry (18 | 0.2%).
Natural Resources, Construction and Maintenance Occupations by Sex
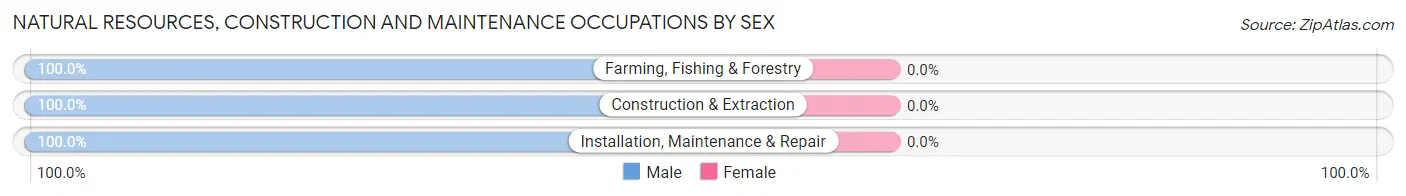
| Occupation | Male | Female |
| Farming, Fishing & Forestry | 18 (100.0%) | 0 (0.0%) |
| Construction & Extraction | 119 (100.0%) | 0 (0.0%) |
| Installation, Maintenance & Repair | 77 (100.0%) | 0 (0.0%) |
| Total (Category) | 214 (100.0%) | 0 (0.0%) |
| Total (Overall) | 5,910 (52.1%) | 5,422 (47.8%) |
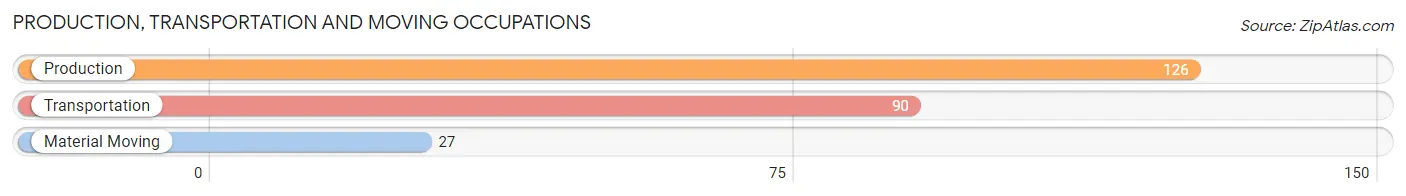
Production, Transportation and Moving Occupations
The most common Production, Transportation and Moving occupations in Winchester are Production (126 | 1.1%), Transportation (90 | 0.8%), and Material Moving (27 | 0.2%).
Production, Transportation and Moving Occupations by Sex
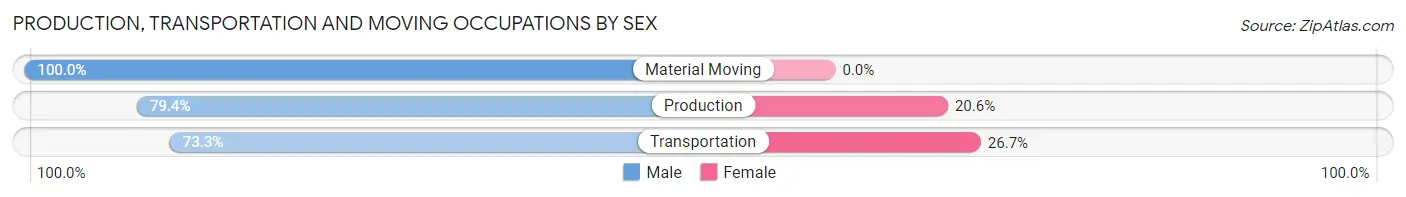
| Occupation | Male | Female |
| Production | 100 (79.4%) | 26 (20.6%) |
| Transportation | 66 (73.3%) | 24 (26.7%) |
| Material Moving | 27 (100.0%) | 0 (0.0%) |
| Total (Category) | 193 (79.4%) | 50 (20.6%) |
| Total (Overall) | 5,910 (52.1%) | 5,422 (47.8%) |
Employment Industries by Sex in Winchester
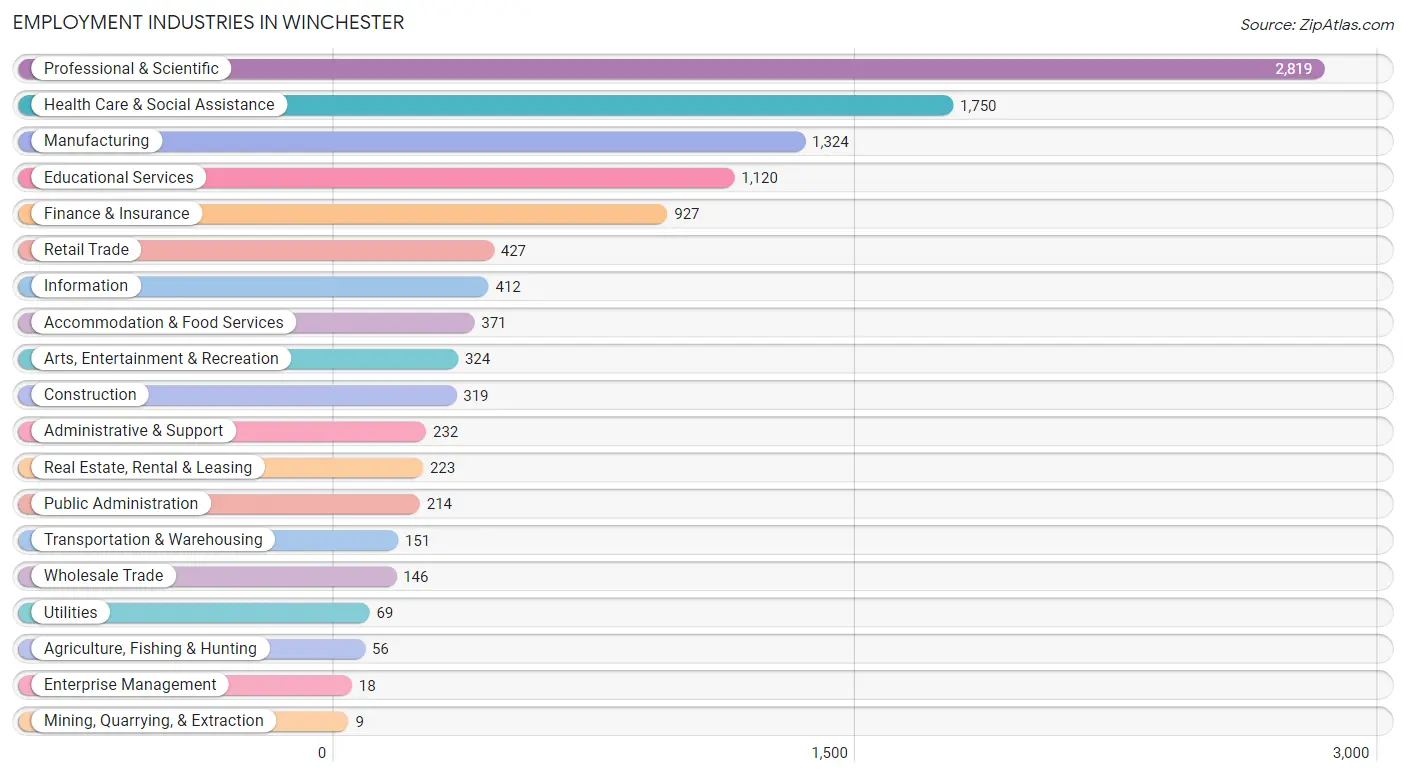
Employment Industries in Winchester
The major employment industries in Winchester include Professional & Scientific (2,819 | 24.9%), Health Care & Social Assistance (1,750 | 15.4%), Manufacturing (1,324 | 11.7%), Educational Services (1,120 | 9.9%), and Finance & Insurance (927 | 8.2%).
Employment Industries by Sex in Winchester
The Winchester industries that see more men than women are Utilities (100.0%), Transportation & Warehousing (80.8%), and Construction (77.4%), whereas the industries that tend to have a higher number of women are Mining, Quarrying, & Extraction (100.0%), Enterprise Management (100.0%), and Health Care & Social Assistance (71.4%).
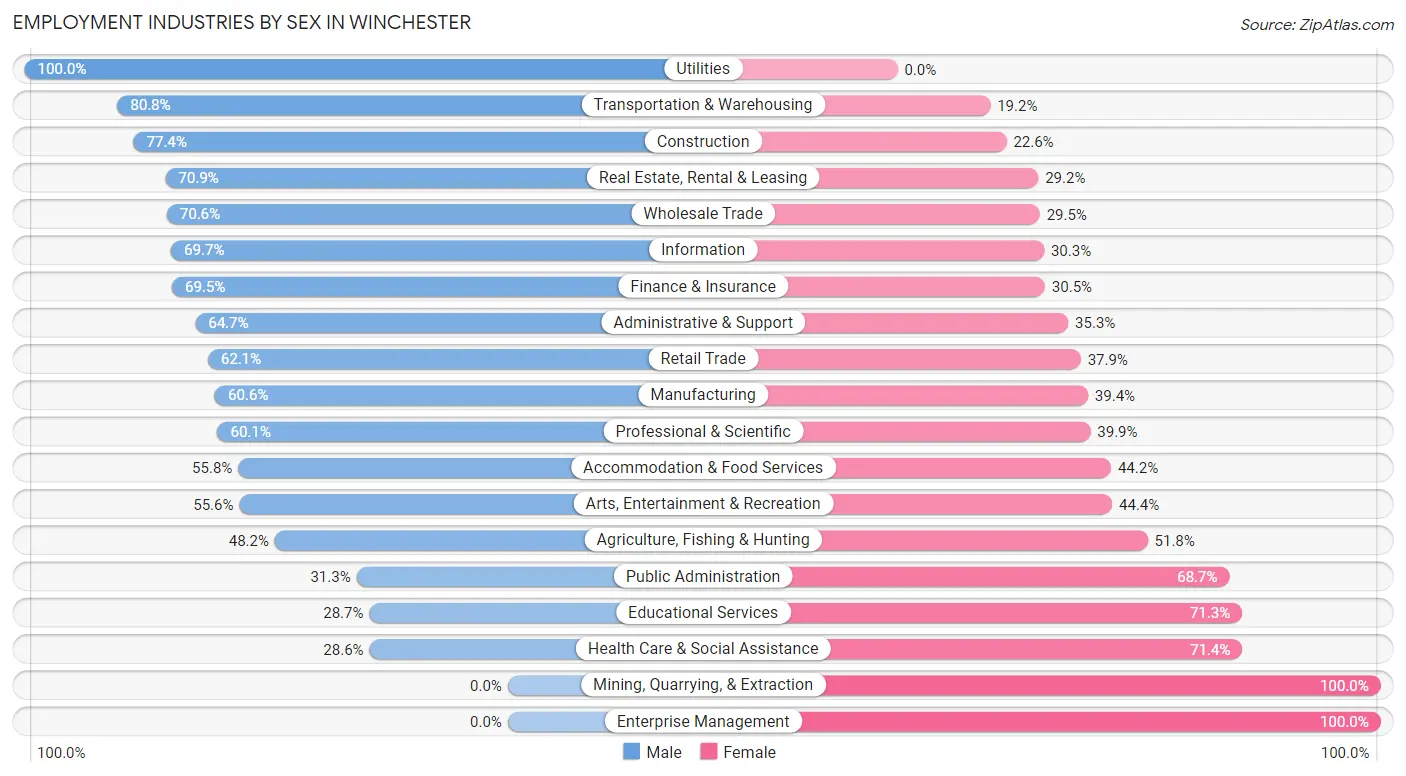
| Industry | Male | Female |
| Agriculture, Fishing & Hunting | 27 (48.2%) | 29 (51.8%) |
| Mining, Quarrying, & Extraction | 0 (0.0%) | 9 (100.0%) |
| Construction | 247 (77.4%) | 72 (22.6%) |
| Manufacturing | 802 (60.6%) | 522 (39.4%) |
| Wholesale Trade | 103 (70.6%) | 43 (29.4%) |
| Retail Trade | 265 (62.1%) | 162 (37.9%) |
| Transportation & Warehousing | 122 (80.8%) | 29 (19.2%) |
| Utilities | 69 (100.0%) | 0 (0.0%) |
| Information | 287 (69.7%) | 125 (30.3%) |
| Finance & Insurance | 644 (69.5%) | 283 (30.5%) |
| Real Estate, Rental & Leasing | 158 (70.9%) | 65 (29.1%) |
| Professional & Scientific | 1,693 (60.1%) | 1,126 (39.9%) |
| Enterprise Management | 0 (0.0%) | 18 (100.0%) |
| Administrative & Support | 150 (64.7%) | 82 (35.3%) |
| Educational Services | 321 (28.7%) | 799 (71.3%) |
| Health Care & Social Assistance | 501 (28.6%) | 1,249 (71.4%) |
| Arts, Entertainment & Recreation | 180 (55.6%) | 144 (44.4%) |
| Accommodation & Food Services | 207 (55.8%) | 164 (44.2%) |
| Public Administration | 67 (31.3%) | 147 (68.7%) |
| Total | 5,910 (52.1%) | 5,422 (47.8%) |
Education in Winchester
School Enrollment in Winchester
The most common levels of schooling among the 6,725 students in Winchester are high school (1,626 | 24.2%), middle school (1,483 | 22.1%), and elementary school (1,255 | 18.7%).
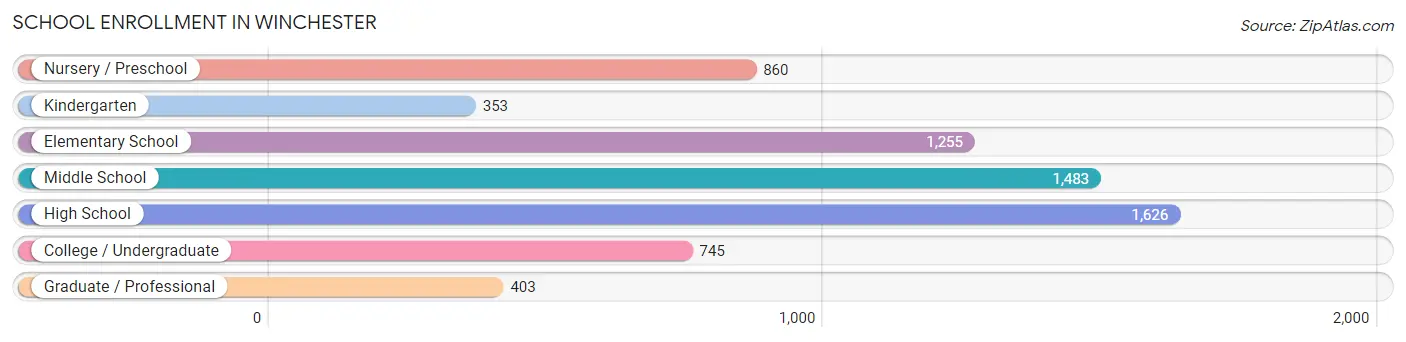
| School Level | # Students | % Students |
| Nursery / Preschool | 860 | 12.8% |
| Kindergarten | 353 | 5.2% |
| Elementary School | 1,255 | 18.7% |
| Middle School | 1,483 | 22.1% |
| High School | 1,626 | 24.2% |
| College / Undergraduate | 745 | 11.1% |
| Graduate / Professional | 403 | 6.0% |
| Total | 6,725 | 100.0% |
School Enrollment by Age by Funding Source in Winchester
Out of a total of 6,725 students who are enrolled in schools in Winchester, 1,944 (28.9%) attend a private institution, while the remaining 4,781 (71.1%) are enrolled in public schools. The age group of 3 to 4 year olds has the highest likelihood of being enrolled in private schools, with 347 (72.4% in the age bracket) enrolled. Conversely, the age group of 10 to 14 year olds has the lowest likelihood of being enrolled in a private school, with 1,546 (87.6% in the age bracket) attending a public institution.
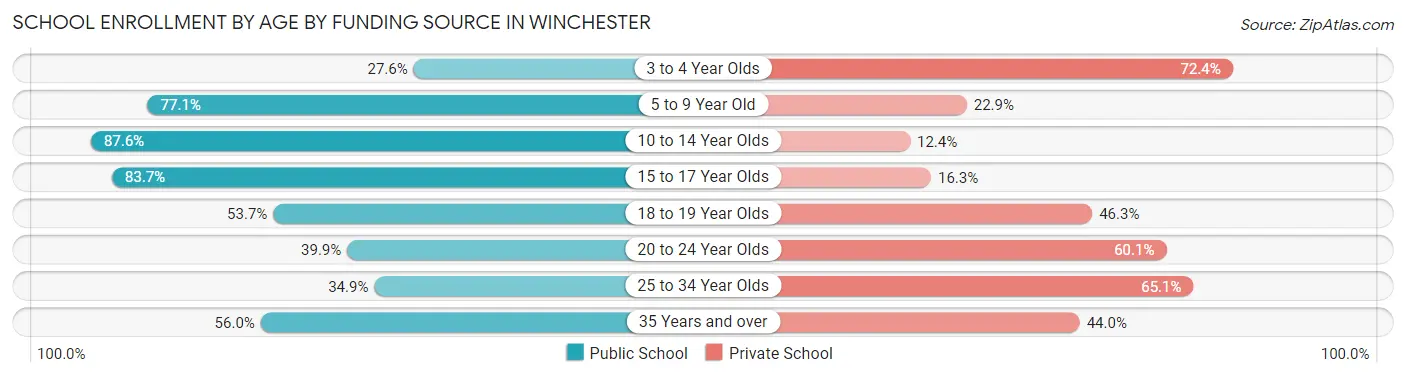
| Age Bracket | Public School | Private School |
| 3 to 4 Year Olds | 132 (27.6%) | 347 (72.4%) |
| 5 to 9 Year Old | 1,432 (77.1%) | 426 (22.9%) |
| 10 to 14 Year Olds | 1,546 (87.6%) | 218 (12.4%) |
| 15 to 17 Year Olds | 1,019 (83.7%) | 198 (16.3%) |
| 18 to 19 Year Olds | 232 (53.7%) | 200 (46.3%) |
| 20 to 24 Year Olds | 228 (39.9%) | 343 (60.1%) |
| 25 to 34 Year Olds | 60 (34.9%) | 112 (65.1%) |
| 35 Years and over | 130 (56.0%) | 102 (44.0%) |
| Total | 4,781 (71.1%) | 1,944 (28.9%) |
Educational Attainment by Field of Study in Winchester
Engineering (1,771 | 13.6%), business (1,626 | 12.5%), social sciences (1,561 | 12.0%), bio, nature & agricultural (1,303 | 10.0%), and science & technology (952 | 7.3%) are the most common fields of study among 13,014 individuals in Winchester who have obtained a bachelor's degree or higher.
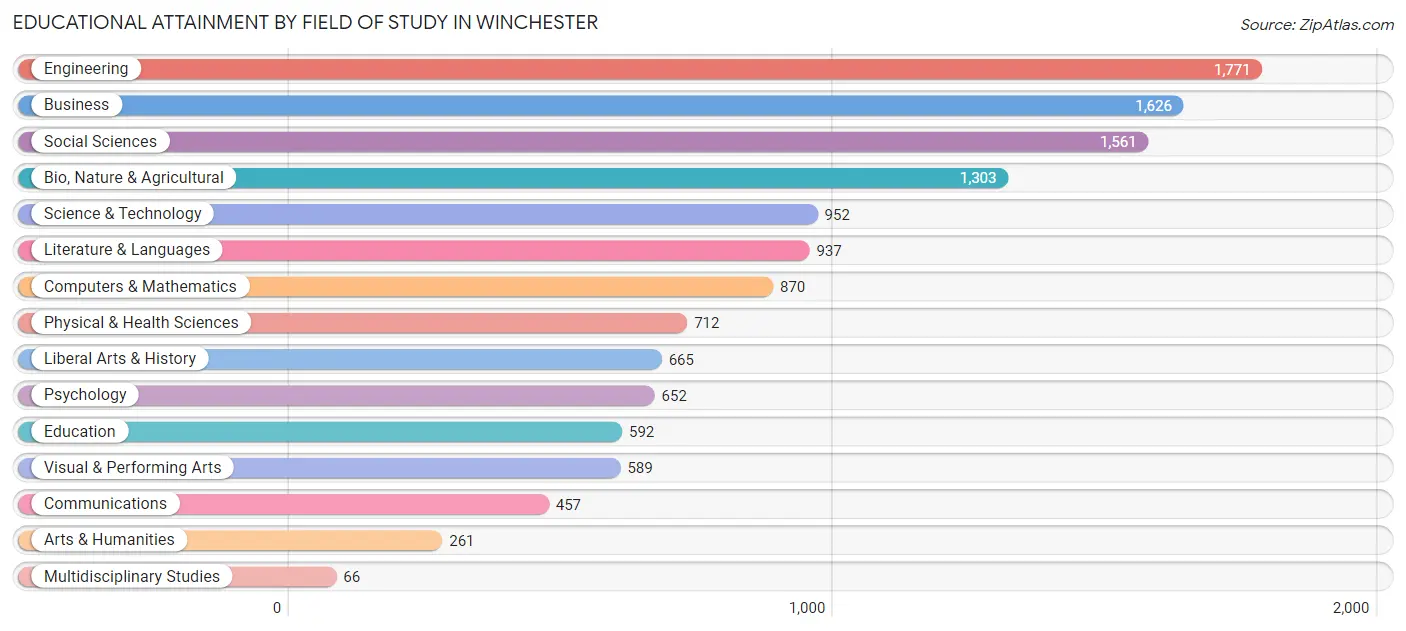
| Field of Study | # Graduates | % Graduates |
| Computers & Mathematics | 870 | 6.7% |
| Bio, Nature & Agricultural | 1,303 | 10.0% |
| Physical & Health Sciences | 712 | 5.5% |
| Psychology | 652 | 5.0% |
| Social Sciences | 1,561 | 12.0% |
| Engineering | 1,771 | 13.6% |
| Multidisciplinary Studies | 66 | 0.5% |
| Science & Technology | 952 | 7.3% |
| Business | 1,626 | 12.5% |
| Education | 592 | 4.5% |
| Literature & Languages | 937 | 7.2% |
| Liberal Arts & History | 665 | 5.1% |
| Visual & Performing Arts | 589 | 4.5% |
| Communications | 457 | 3.5% |
| Arts & Humanities | 261 | 2.0% |
| Total | 13,014 | 100.0% |
Transportation & Commute in Winchester
Vehicle Availability by Sex in Winchester
The most prevalent vehicle ownership categories in Winchester are males with 2 vehicles (3,635, accounting for 61.9%) and females with 2 vehicles (3,127, making up 67.5%).
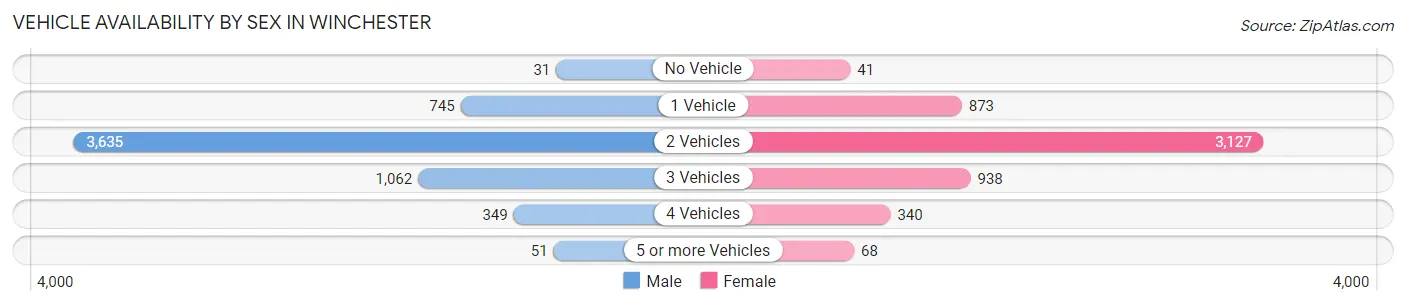
| Vehicles Available | Male | Female |
| No Vehicle | 31 (0.5%) | 41 (0.8%) |
| 1 Vehicle | 745 (12.7%) | 873 (16.2%) |
| 2 Vehicles | 3,635 (61.9%) | 3,127 (58.1%) |
| 3 Vehicles | 1,062 (18.1%) | 938 (17.4%) |
| 4 Vehicles | 349 (5.9%) | 340 (6.3%) |
| 5 or more Vehicles | 51 (0.9%) | 68 (1.3%) |
| Total | 5,873 (100.0%) | 5,387 (100.0%) |
Commute Time in Winchester
The most frequently occuring commute durations in Winchester are 45 to 59 minutes (1,471 commuters, 17.9%), 30 to 34 minutes (1,445 commuters, 17.6%), and 20 to 24 minutes (1,068 commuters, 13.0%).
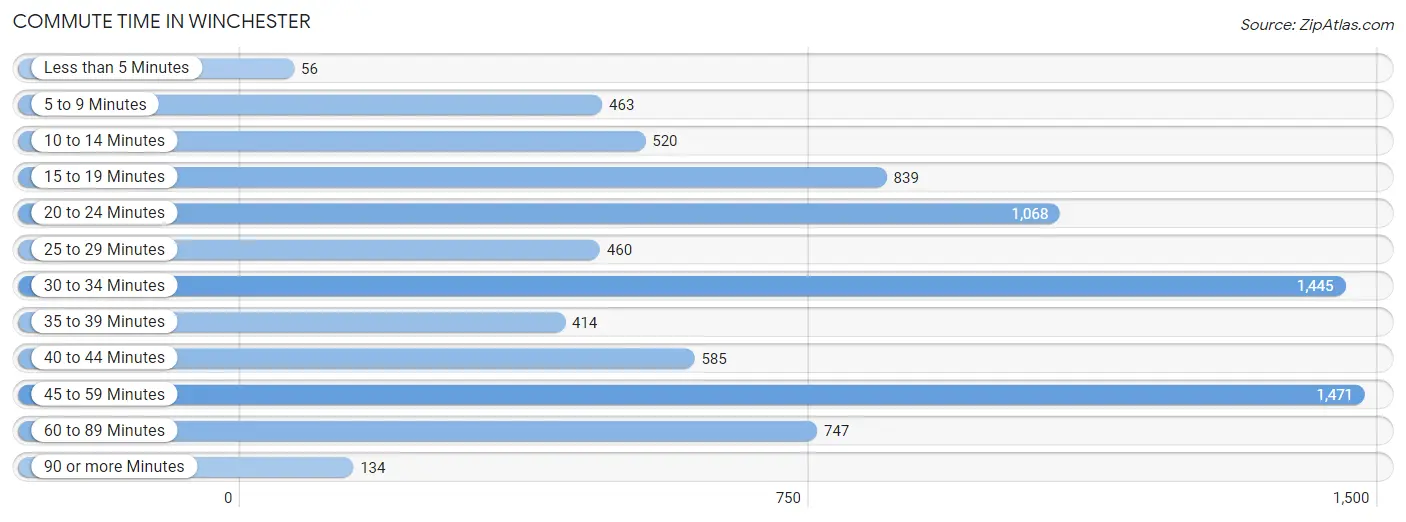
| Commute Time | # Commuters | % Commuters |
| Less than 5 Minutes | 56 | 0.7% |
| 5 to 9 Minutes | 463 | 5.6% |
| 10 to 14 Minutes | 520 | 6.3% |
| 15 to 19 Minutes | 839 | 10.2% |
| 20 to 24 Minutes | 1,068 | 13.0% |
| 25 to 29 Minutes | 460 | 5.6% |
| 30 to 34 Minutes | 1,445 | 17.6% |
| 35 to 39 Minutes | 414 | 5.1% |
| 40 to 44 Minutes | 585 | 7.1% |
| 45 to 59 Minutes | 1,471 | 17.9% |
| 60 to 89 Minutes | 747 | 9.1% |
| 90 or more Minutes | 134 | 1.6% |
Commute Time by Sex in Winchester
The most common commute times in Winchester are 45 to 59 minutes (821 commuters, 18.9%) for males and 30 to 34 minutes (725 commuters, 18.8%) for females.
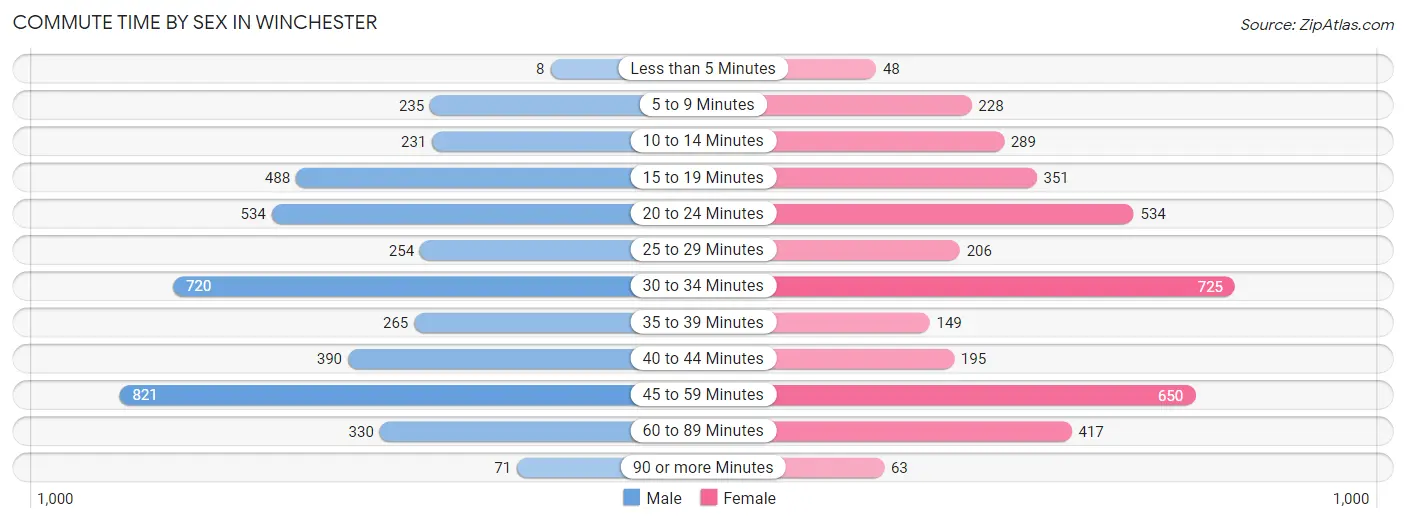
| Commute Time | Male | Female |
| Less than 5 Minutes | 8 (0.2%) | 48 (1.3%) |
| 5 to 9 Minutes | 235 (5.4%) | 228 (5.9%) |
| 10 to 14 Minutes | 231 (5.3%) | 289 (7.5%) |
| 15 to 19 Minutes | 488 (11.2%) | 351 (9.1%) |
| 20 to 24 Minutes | 534 (12.3%) | 534 (13.9%) |
| 25 to 29 Minutes | 254 (5.8%) | 206 (5.3%) |
| 30 to 34 Minutes | 720 (16.6%) | 725 (18.8%) |
| 35 to 39 Minutes | 265 (6.1%) | 149 (3.9%) |
| 40 to 44 Minutes | 390 (9.0%) | 195 (5.1%) |
| 45 to 59 Minutes | 821 (18.9%) | 650 (16.9%) |
| 60 to 89 Minutes | 330 (7.6%) | 417 (10.8%) |
| 90 or more Minutes | 71 (1.6%) | 63 (1.6%) |
Time of Departure to Work by Sex in Winchester
The most frequent times of departure to work in Winchester are 7:00 AM to 7:29 AM (922, 21.2%) for males and 8:00 AM to 8:29 AM (860, 22.3%) for females.
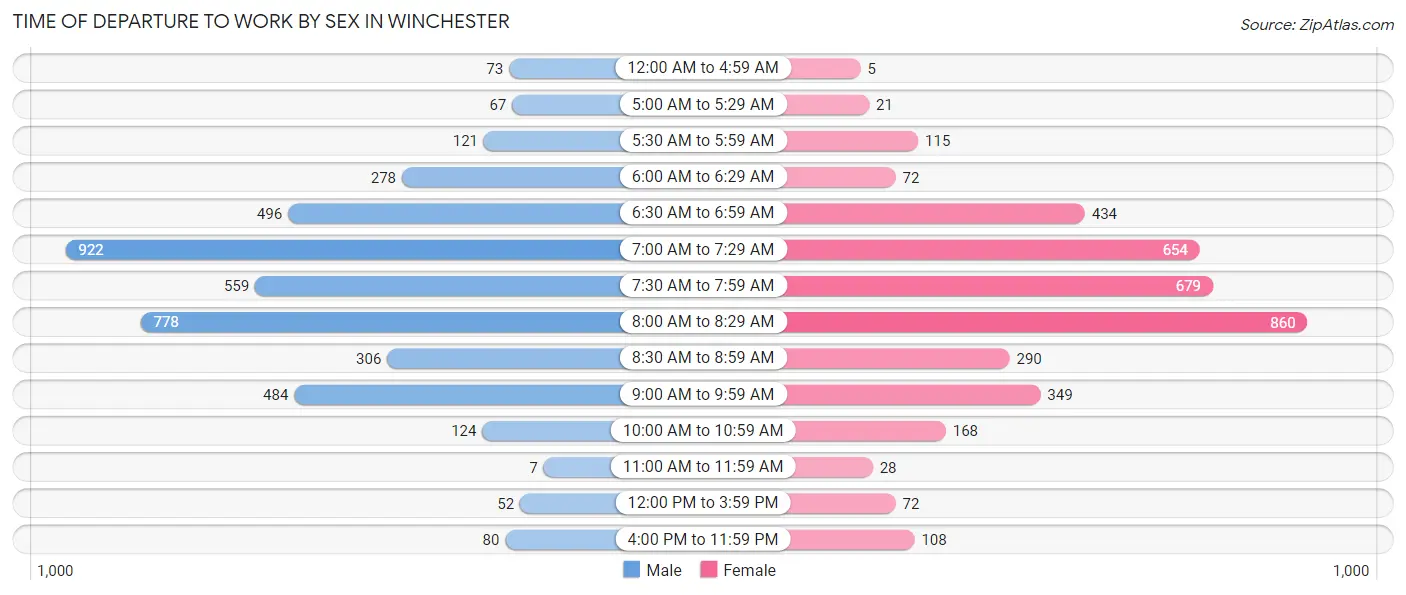
| Time of Departure | Male | Female |
| 12:00 AM to 4:59 AM | 73 (1.7%) | 5 (0.1%) |
| 5:00 AM to 5:29 AM | 67 (1.5%) | 21 (0.5%) |
| 5:30 AM to 5:59 AM | 121 (2.8%) | 115 (3.0%) |
| 6:00 AM to 6:29 AM | 278 (6.4%) | 72 (1.9%) |
| 6:30 AM to 6:59 AM | 496 (11.4%) | 434 (11.3%) |
| 7:00 AM to 7:29 AM | 922 (21.2%) | 654 (17.0%) |
| 7:30 AM to 7:59 AM | 559 (12.9%) | 679 (17.6%) |
| 8:00 AM to 8:29 AM | 778 (17.9%) | 860 (22.3%) |
| 8:30 AM to 8:59 AM | 306 (7.0%) | 290 (7.5%) |
| 9:00 AM to 9:59 AM | 484 (11.1%) | 349 (9.0%) |
| 10:00 AM to 10:59 AM | 124 (2.9%) | 168 (4.4%) |
| 11:00 AM to 11:59 AM | 7 (0.2%) | 28 (0.7%) |
| 12:00 PM to 3:59 PM | 52 (1.2%) | 72 (1.9%) |
| 4:00 PM to 11:59 PM | 80 (1.8%) | 108 (2.8%) |
| Total | 4,347 (100.0%) | 3,855 (100.0%) |
Housing Occupancy in Winchester
Occupancy by Ownership in Winchester
Of the total 8,066 dwellings in Winchester, owner-occupied units account for 6,717 (83.3%), while renter-occupied units make up 1,349 (16.7%).
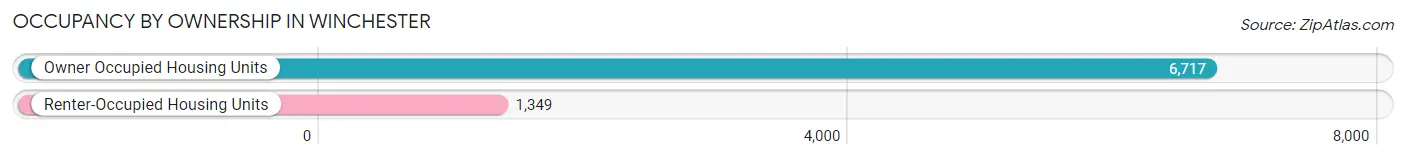
| Occupancy | # Housing Units | % Housing Units |
| Owner Occupied Housing Units | 6,717 | 83.3% |
| Renter-Occupied Housing Units | 1,349 | 16.7% |
| Total Occupied Housing Units | 8,066 | 100.0% |
Occupancy by Household Size in Winchester
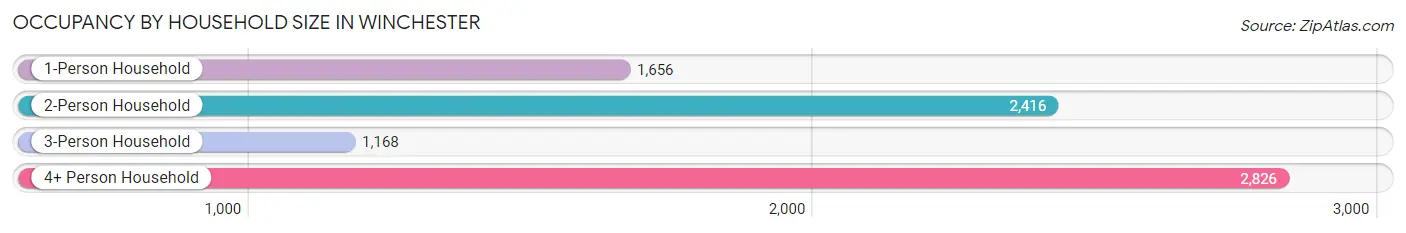
| Household Size | # Housing Units | % Housing Units |
| 1-Person Household | 1,656 | 20.5% |
| 2-Person Household | 2,416 | 29.9% |
| 3-Person Household | 1,168 | 14.5% |
| 4+ Person Household | 2,826 | 35.0% |
| Total Housing Units | 8,066 | 100.0% |
Occupancy by Ownership by Household Size in Winchester
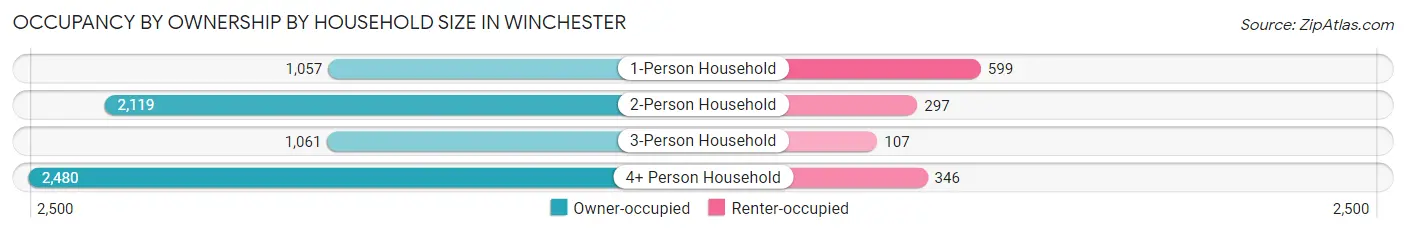
| Household Size | Owner-occupied | Renter-occupied |
| 1-Person Household | 1,057 (63.8%) | 599 (36.2%) |
| 2-Person Household | 2,119 (87.7%) | 297 (12.3%) |
| 3-Person Household | 1,061 (90.8%) | 107 (9.2%) |
| 4+ Person Household | 2,480 (87.8%) | 346 (12.2%) |
| Total Housing Units | 6,717 (83.3%) | 1,349 (16.7%) |
Occupancy by Educational Attainment in Winchester
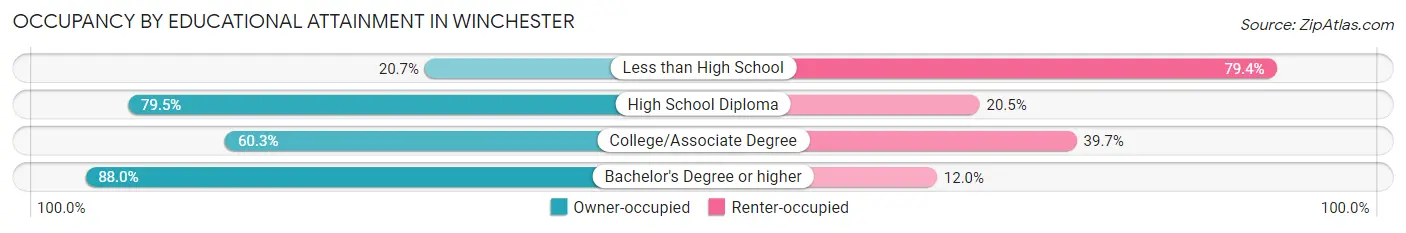
| Household Size | Owner-occupied | Renter-occupied |
| Less than High School | 19 (20.6%) | 73 (79.3%) |
| High School Diploma | 551 (79.5%) | 142 (20.5%) |
| College/Associate Degree | 561 (60.3%) | 370 (39.7%) |
| Bachelor's Degree or higher | 5,586 (88.0%) | 764 (12.0%) |
Occupancy by Age of Householder in Winchester
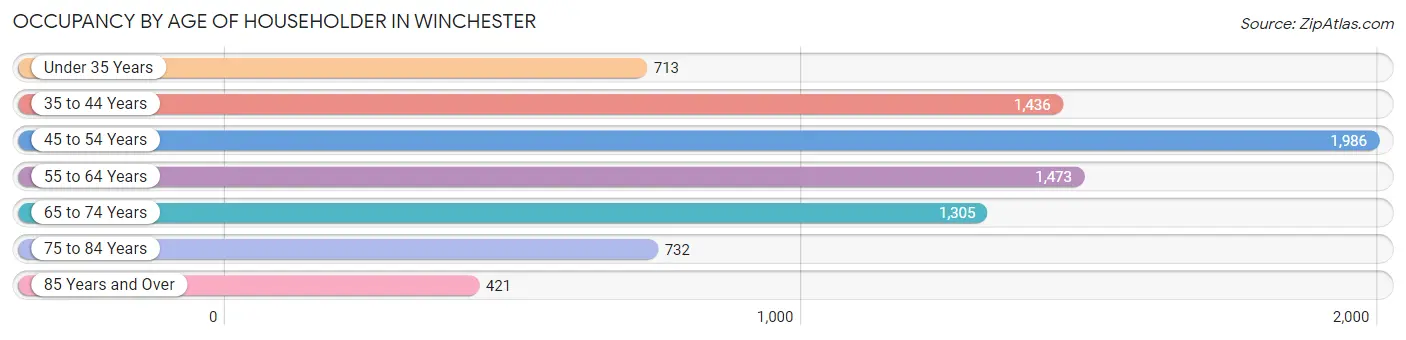
| Age Bracket | # Households | % Households |
| Under 35 Years | 713 | 8.8% |
| 35 to 44 Years | 1,436 | 17.8% |
| 45 to 54 Years | 1,986 | 24.6% |
| 55 to 64 Years | 1,473 | 18.3% |
| 65 to 74 Years | 1,305 | 16.2% |
| 75 to 84 Years | 732 | 9.1% |
| 85 Years and Over | 421 | 5.2% |
| Total | 8,066 | 100.0% |
Housing Finances in Winchester
Median Income by Occupancy in Winchester
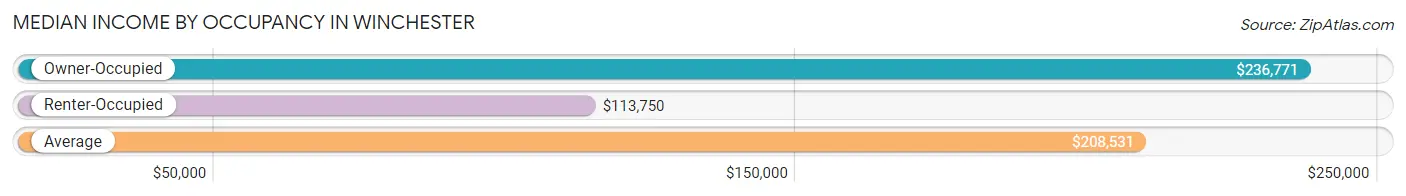
| Occupancy Type | # Households | Median Income |
| Owner-Occupied | 6,717 (83.3%) | $236,771 |
| Renter-Occupied | 1,349 (16.7%) | $113,750 |
| Average | 8,066 (100.0%) | $208,531 |
Occupancy by Householder Income Bracket in Winchester
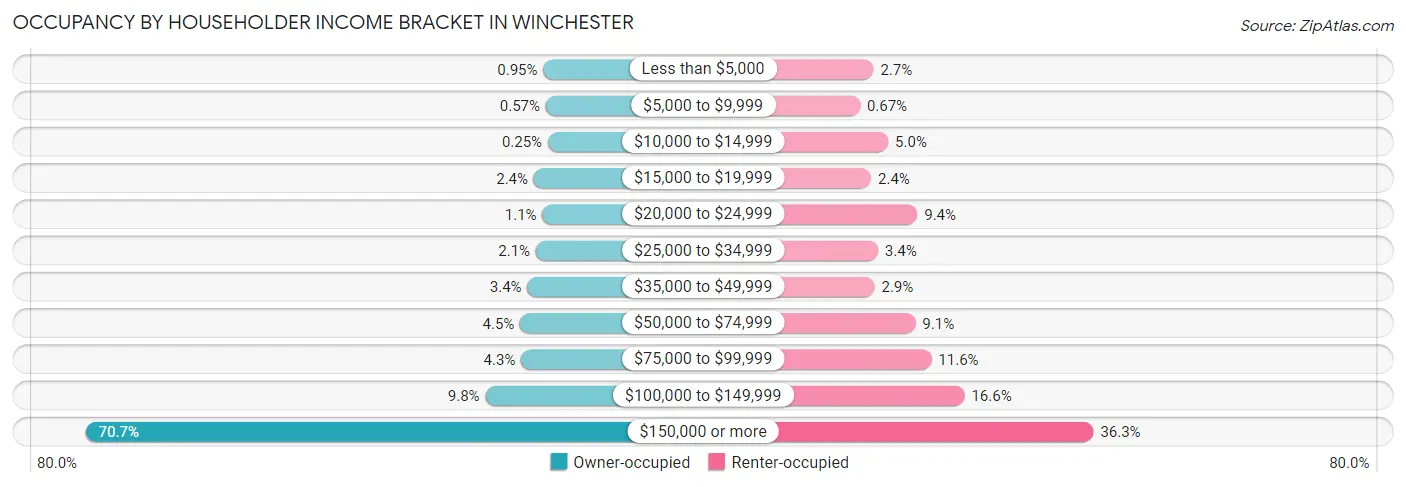
| Income Bracket | Owner-occupied | Renter-occupied |
| Less than $5,000 | 64 (0.9%) | 37 (2.7%) |
| $5,000 to $9,999 | 38 (0.6%) | 9 (0.7%) |
| $10,000 to $14,999 | 17 (0.3%) | 67 (5.0%) |
| $15,000 to $19,999 | 161 (2.4%) | 32 (2.4%) |
| $20,000 to $24,999 | 73 (1.1%) | 127 (9.4%) |
| $25,000 to $34,999 | 140 (2.1%) | 46 (3.4%) |
| $35,000 to $49,999 | 227 (3.4%) | 39 (2.9%) |
| $50,000 to $74,999 | 301 (4.5%) | 123 (9.1%) |
| $75,000 to $99,999 | 290 (4.3%) | 156 (11.6%) |
| $100,000 to $149,999 | 657 (9.8%) | 224 (16.6%) |
| $150,000 or more | 4,749 (70.7%) | 489 (36.2%) |
| Total | 6,717 (100.0%) | 1,349 (100.0%) |
Monthly Housing Cost Tiers in Winchester
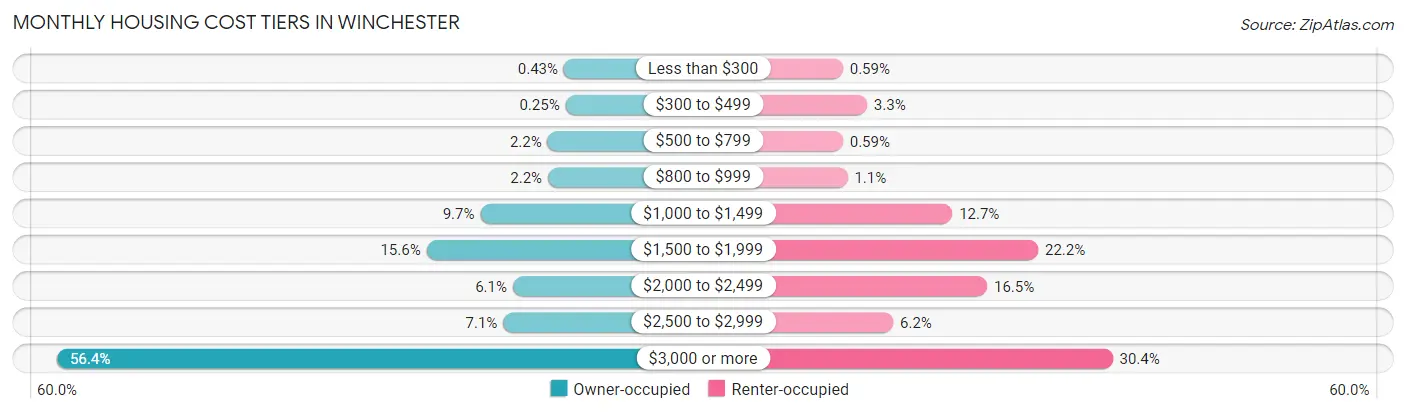
| Monthly Cost | Owner-occupied | Renter-occupied |
| Less than $300 | 29 (0.4%) | 8 (0.6%) |
| $300 to $499 | 17 (0.3%) | 44 (3.3%) |
| $500 to $799 | 150 (2.2%) | 8 (0.6%) |
| $800 to $999 | 147 (2.2%) | 15 (1.1%) |
| $1,000 to $1,499 | 649 (9.7%) | 171 (12.7%) |
| $1,500 to $1,999 | 1,048 (15.6%) | 299 (22.2%) |
| $2,000 to $2,499 | 408 (6.1%) | 223 (16.5%) |
| $2,500 to $2,999 | 479 (7.1%) | 83 (6.1%) |
| $3,000 or more | 3,790 (56.4%) | 410 (30.4%) |
| Total | 6,717 (100.0%) | 1,349 (100.0%) |
Physical Housing Characteristics in Winchester
Housing Structures in Winchester
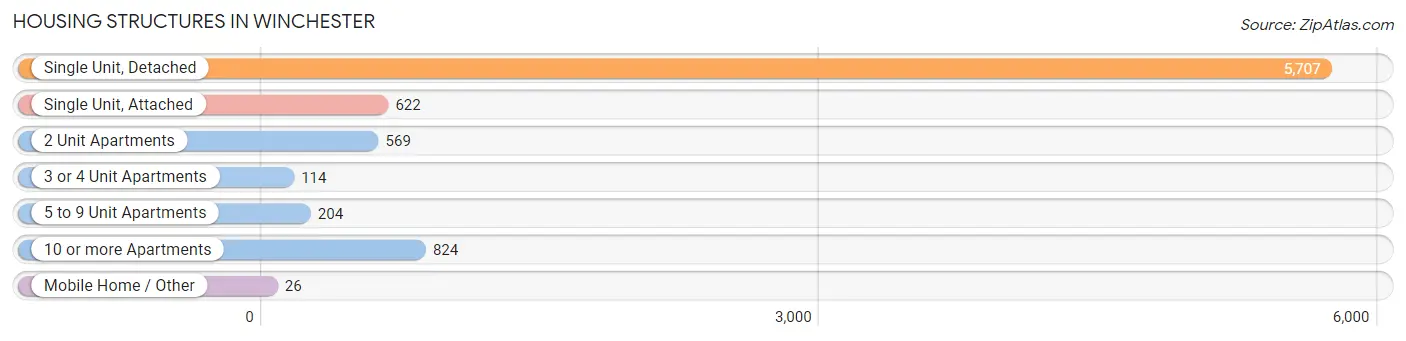
| Structure Type | # Housing Units | % Housing Units |
| Single Unit, Detached | 5,707 | 70.8% |
| Single Unit, Attached | 622 | 7.7% |
| 2 Unit Apartments | 569 | 7.0% |
| 3 or 4 Unit Apartments | 114 | 1.4% |
| 5 to 9 Unit Apartments | 204 | 2.5% |
| 10 or more Apartments | 824 | 10.2% |
| Mobile Home / Other | 26 | 0.3% |
| Total | 8,066 | 100.0% |
Housing Structures by Occupancy in Winchester
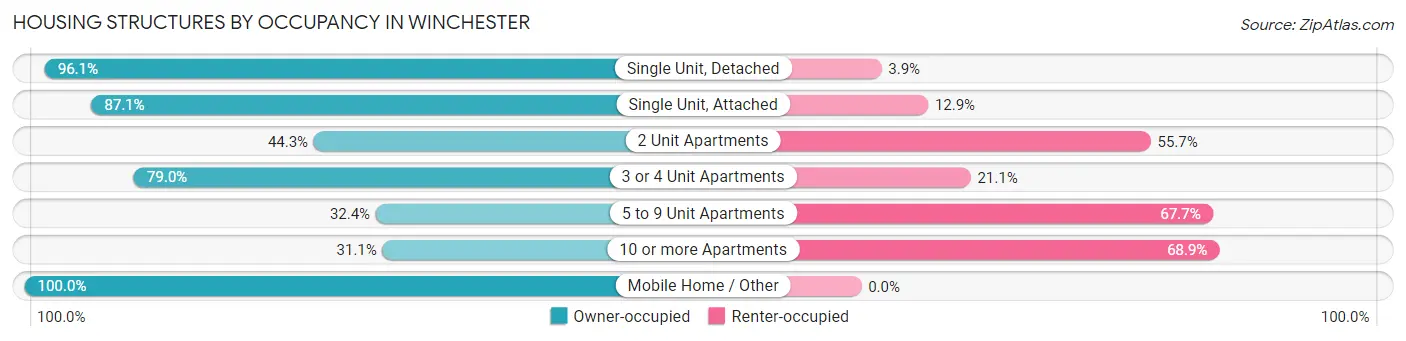
| Structure Type | Owner-occupied | Renter-occupied |
| Single Unit, Detached | 5,485 (96.1%) | 222 (3.9%) |
| Single Unit, Attached | 542 (87.1%) | 80 (12.9%) |
| 2 Unit Apartments | 252 (44.3%) | 317 (55.7%) |
| 3 or 4 Unit Apartments | 90 (78.9%) | 24 (21.0%) |
| 5 to 9 Unit Apartments | 66 (32.4%) | 138 (67.6%) |
| 10 or more Apartments | 256 (31.1%) | 568 (68.9%) |
| Mobile Home / Other | 26 (100.0%) | 0 (0.0%) |
| Total | 6,717 (83.3%) | 1,349 (16.7%) |
Housing Structures by Number of Rooms in Winchester
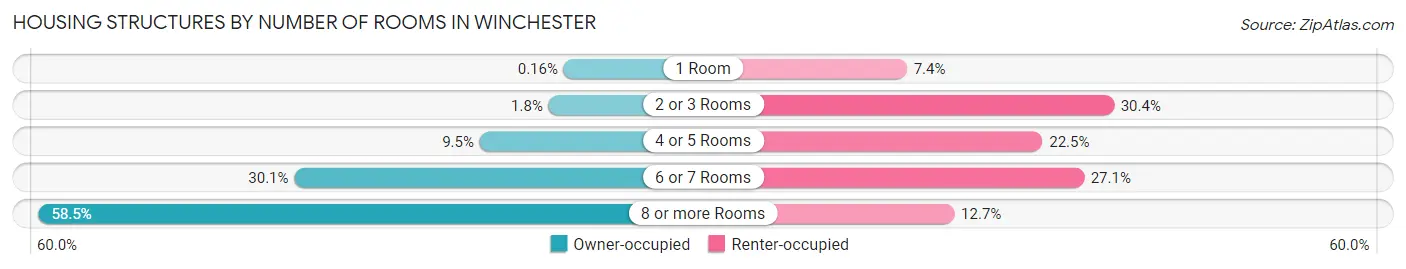
| Number of Rooms | Owner-occupied | Renter-occupied |
| 1 Room | 11 (0.2%) | 100 (7.4%) |
| 2 or 3 Rooms | 123 (1.8%) | 410 (30.4%) |
| 4 or 5 Rooms | 637 (9.5%) | 303 (22.5%) |
| 6 or 7 Rooms | 2,019 (30.1%) | 365 (27.1%) |
| 8 or more Rooms | 3,927 (58.5%) | 171 (12.7%) |
| Total | 6,717 (100.0%) | 1,349 (100.0%) |
Housing Structure by Heating Type in Winchester
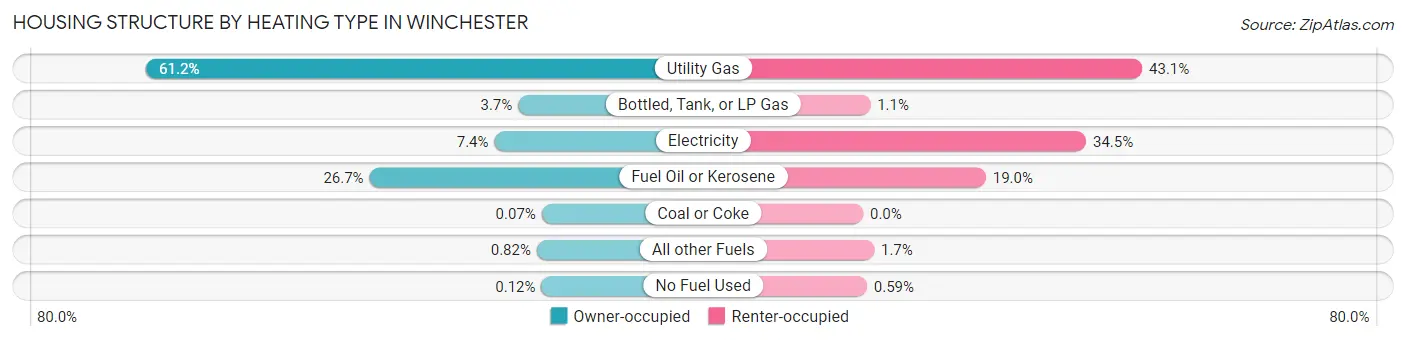
| Heating Type | Owner-occupied | Renter-occupied |
| Utility Gas | 4,111 (61.2%) | 582 (43.1%) |
| Bottled, Tank, or LP Gas | 249 (3.7%) | 15 (1.1%) |
| Electricity | 496 (7.4%) | 465 (34.5%) |
| Fuel Oil or Kerosene | 1,793 (26.7%) | 256 (19.0%) |
| Coal or Coke | 5 (0.1%) | 0 (0.0%) |
| All other Fuels | 55 (0.8%) | 23 (1.7%) |
| No Fuel Used | 8 (0.1%) | 8 (0.6%) |
| Total | 6,717 (100.0%) | 1,349 (100.0%) |
Household Vehicle Usage in Winchester
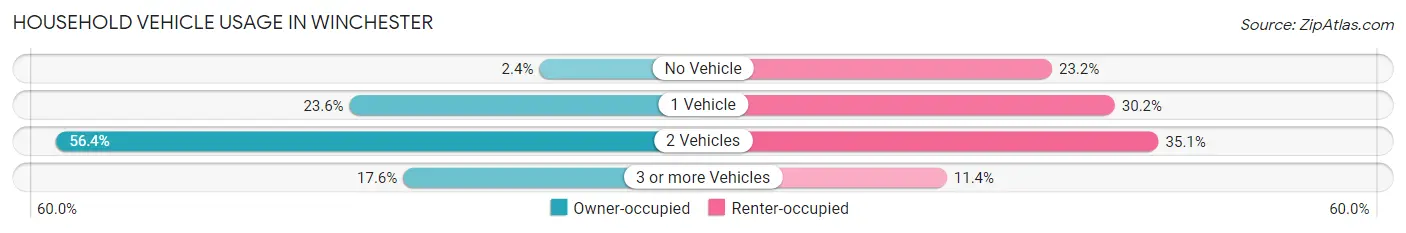
| Vehicles per Household | Owner-occupied | Renter-occupied |
| No Vehicle | 158 (2.4%) | 313 (23.2%) |
| 1 Vehicle | 1,586 (23.6%) | 408 (30.2%) |
| 2 Vehicles | 3,791 (56.4%) | 474 (35.1%) |
| 3 or more Vehicles | 1,182 (17.6%) | 154 (11.4%) |
| Total | 6,717 (100.0%) | 1,349 (100.0%) |
Real Estate & Mortgages in Winchester
Real Estate and Mortgage Overview in Winchester
| Characteristic | Without Mortgage | With Mortgage |
| Housing Units | 2,235 | 4,482 |
| Median Property Value | $1,020,400 | $1,233,000 |
| Median Household Income | $149,795 | $3,637 |
| Monthly Housing Costs | $1,501 | $3,675 |
| Real Estate Taxes | $10,001 | $26 |
Property Value by Mortgage Status in Winchester
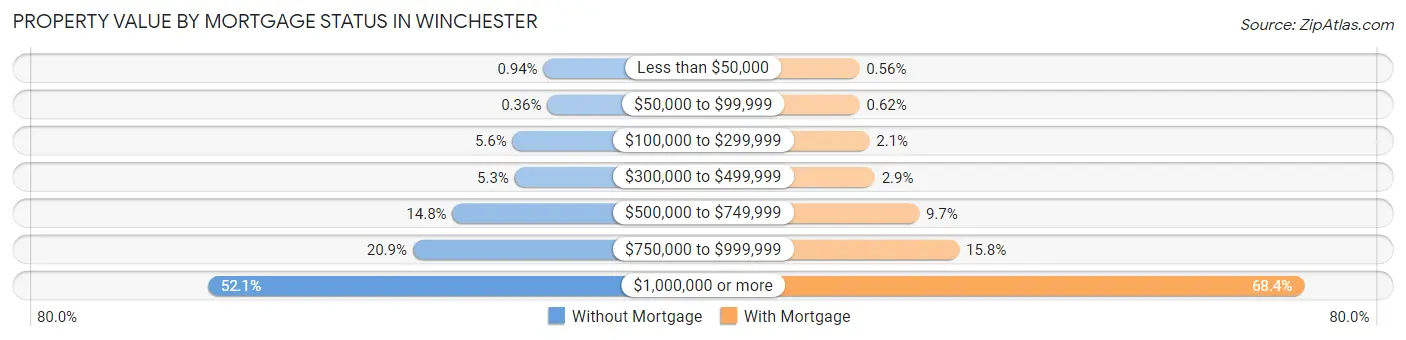
| Property Value | Without Mortgage | With Mortgage |
| Less than $50,000 | 21 (0.9%) | 25 (0.6%) |
| $50,000 to $99,999 | 8 (0.4%) | 28 (0.6%) |
| $100,000 to $299,999 | 126 (5.6%) | 94 (2.1%) |
| $300,000 to $499,999 | 119 (5.3%) | 131 (2.9%) |
| $500,000 to $749,999 | 331 (14.8%) | 433 (9.7%) |
| $750,000 to $999,999 | 466 (20.8%) | 707 (15.8%) |
| $1,000,000 or more | 1,164 (52.1%) | 3,064 (68.4%) |
| Total | 2,235 (100.0%) | 4,482 (100.0%) |
Household Income by Mortgage Status in Winchester
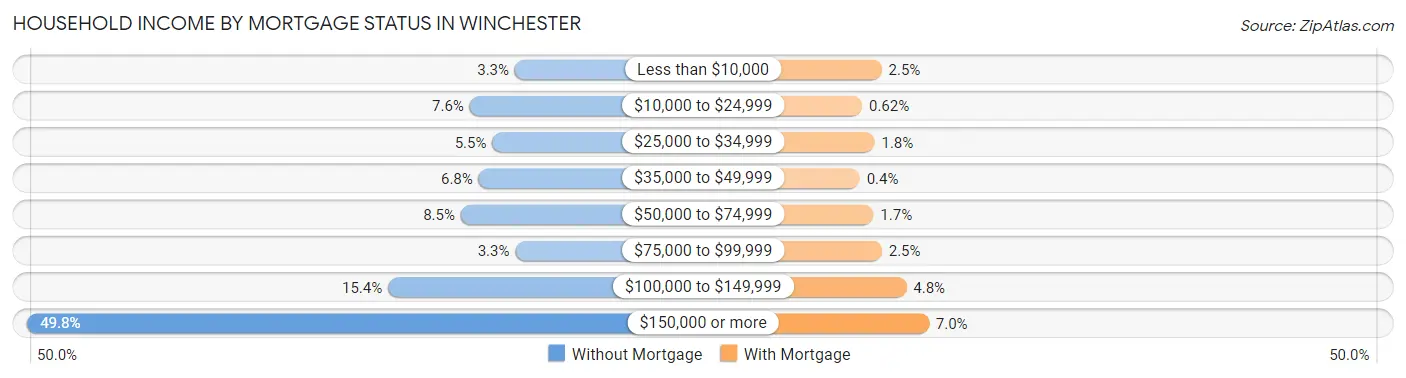
| Household Income | Without Mortgage | With Mortgage |
| Less than $10,000 | 74 (3.3%) | 111 (2.5%) |
| $10,000 to $24,999 | 170 (7.6%) | 28 (0.6%) |
| $25,000 to $34,999 | 122 (5.5%) | 81 (1.8%) |
| $35,000 to $49,999 | 151 (6.8%) | 18 (0.4%) |
| $50,000 to $74,999 | 189 (8.5%) | 76 (1.7%) |
| $75,000 to $99,999 | 73 (3.3%) | 112 (2.5%) |
| $100,000 to $149,999 | 344 (15.4%) | 217 (4.8%) |
| $150,000 or more | 1,112 (49.7%) | 313 (7.0%) |
| Total | 2,235 (100.0%) | 4,482 (100.0%) |
Property Value to Household Income Ratio in Winchester
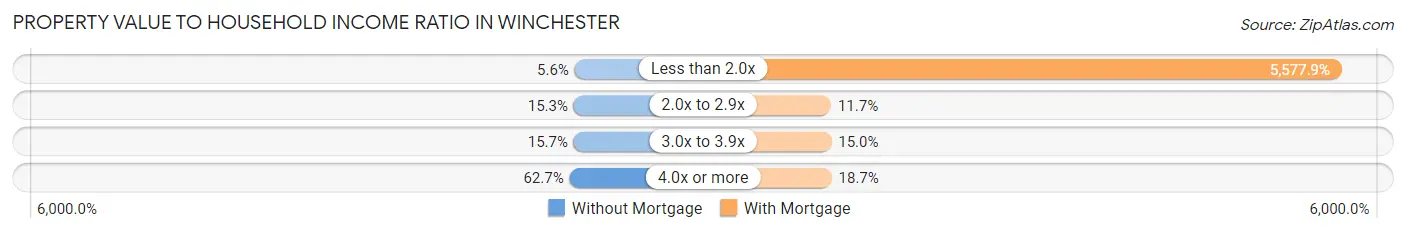
| Value-to-Income Ratio | Without Mortgage | With Mortgage |
| Less than 2.0x | 126 (5.6%) | 250,001 (5,577.9%) |
| 2.0x to 2.9x | 341 (15.3%) | 525 (11.7%) |
| 3.0x to 3.9x | 351 (15.7%) | 671 (15.0%) |
| 4.0x or more | 1,401 (62.7%) | 839 (18.7%) |
| Total | 2,235 (100.0%) | 4,482 (100.0%) |
Real Estate Taxes by Mortgage Status in Winchester
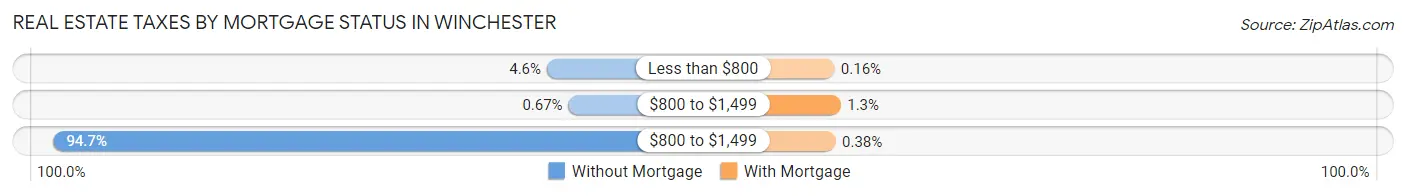
| Property Taxes | Without Mortgage | With Mortgage |
| Less than $800 | 103 (4.6%) | 7 (0.2%) |
| $800 to $1,499 | 15 (0.7%) | 59 (1.3%) |
| $800 to $1,499 | 2,117 (94.7%) | 17 (0.4%) |
| Total | 2,235 (100.0%) | 4,482 (100.0%) |
Health & Disability in Winchester
Health Insurance Coverage by Age in Winchester
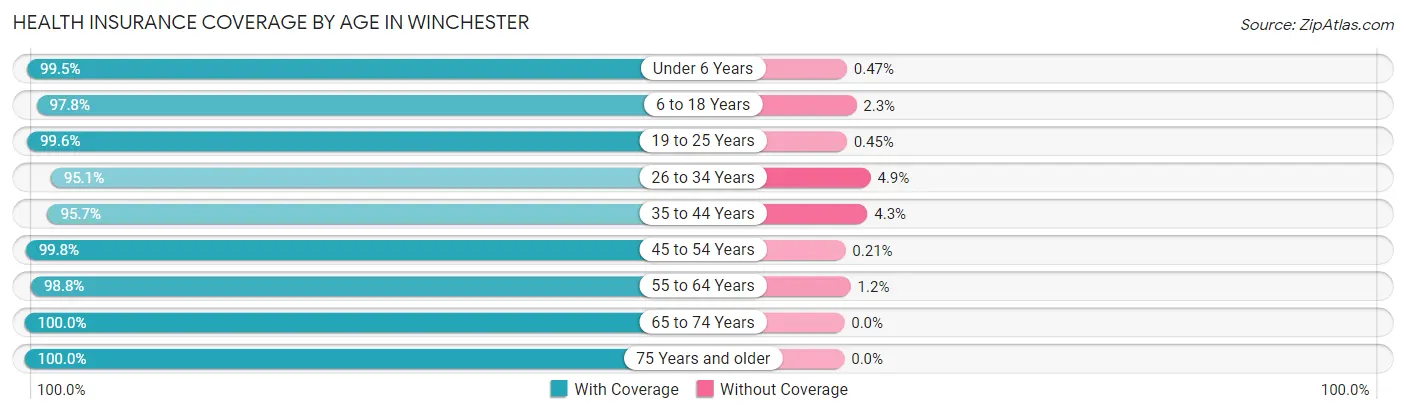
| Age Bracket | With Coverage | Without Coverage |
| Under 6 Years | 1,892 (99.5%) | 9 (0.5%) |
| 6 to 18 Years | 4,511 (97.8%) | 104 (2.2%) |
| 19 to 25 Years | 1,098 (99.6%) | 5 (0.4%) |
| 26 to 34 Years | 1,303 (95.1%) | 67 (4.9%) |
| 35 to 44 Years | 2,957 (95.7%) | 133 (4.3%) |
| 45 to 54 Years | 3,864 (99.8%) | 8 (0.2%) |
| 55 to 64 Years | 2,741 (98.8%) | 33 (1.2%) |
| 65 to 74 Years | 2,066 (100.0%) | 0 (0.0%) |
| 75 Years and older | 1,743 (100.0%) | 0 (0.0%) |
| Total | 22,175 (98.4%) | 359 (1.6%) |
Health Insurance Coverage by Citizenship Status in Winchester
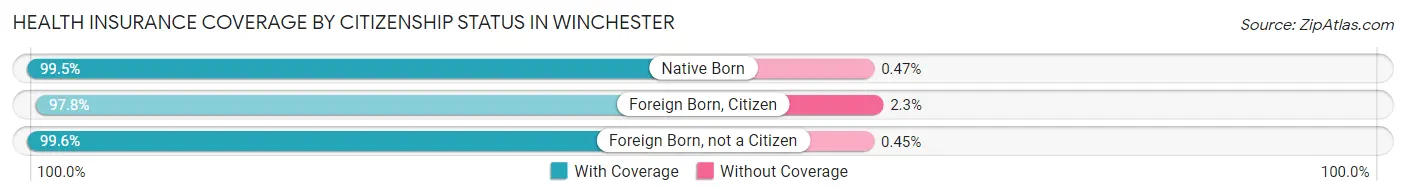
| Citizenship Status | With Coverage | Without Coverage |
| Native Born | 1,892 (99.5%) | 9 (0.5%) |
| Foreign Born, Citizen | 4,511 (97.8%) | 104 (2.2%) |
| Foreign Born, not a Citizen | 1,098 (99.6%) | 5 (0.4%) |
Health Insurance Coverage by Household Income in Winchester
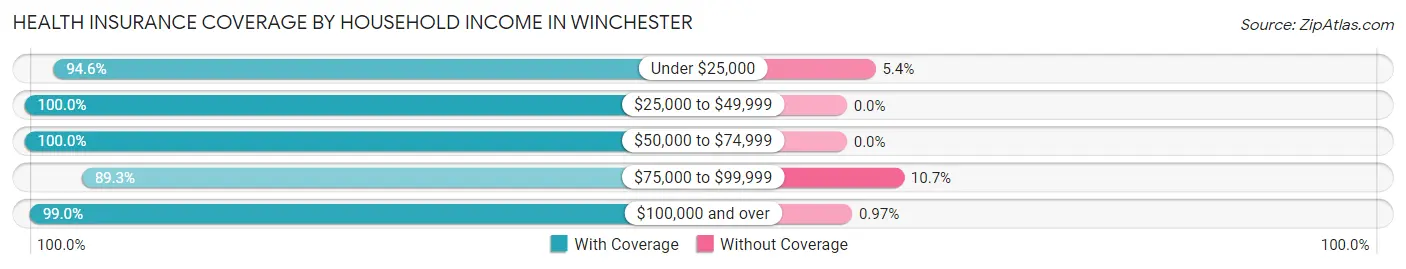
| Household Income | With Coverage | Without Coverage |
| Under $25,000 | 829 (94.6%) | 47 (5.4%) |
| $25,000 to $49,999 | 751 (100.0%) | 0 (0.0%) |
| $50,000 to $74,999 | 596 (100.0%) | 0 (0.0%) |
| $75,000 to $99,999 | 1,010 (89.3%) | 121 (10.7%) |
| $100,000 and over | 18,955 (99.0%) | 186 (1.0%) |
Public vs Private Health Insurance Coverage by Age in Winchester
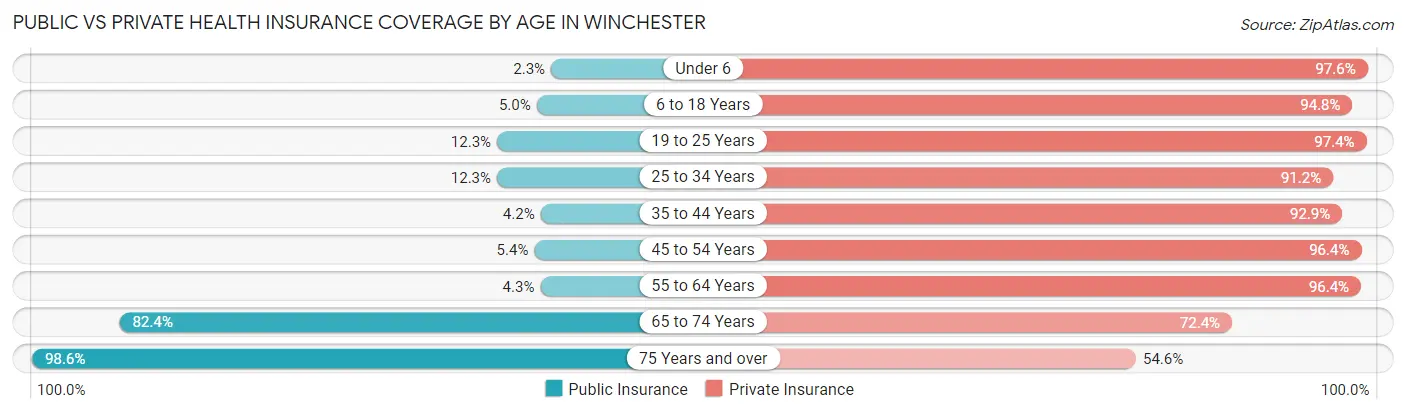
| Age Bracket | Public Insurance | Private Insurance |
| Under 6 | 44 (2.3%) | 1,855 (97.6%) |
| 6 to 18 Years | 230 (5.0%) | 4,373 (94.8%) |
| 19 to 25 Years | 136 (12.3%) | 1,074 (97.4%) |
| 25 to 34 Years | 169 (12.3%) | 1,249 (91.2%) |
| 35 to 44 Years | 131 (4.2%) | 2,869 (92.8%) |
| 45 to 54 Years | 209 (5.4%) | 3,733 (96.4%) |
| 55 to 64 Years | 119 (4.3%) | 2,673 (96.4%) |
| 65 to 74 Years | 1,702 (82.4%) | 1,496 (72.4%) |
| 75 Years and over | 1,719 (98.6%) | 952 (54.6%) |
| Total | 4,459 (19.8%) | 20,274 (90.0%) |
Disability Status by Sex by Age in Winchester
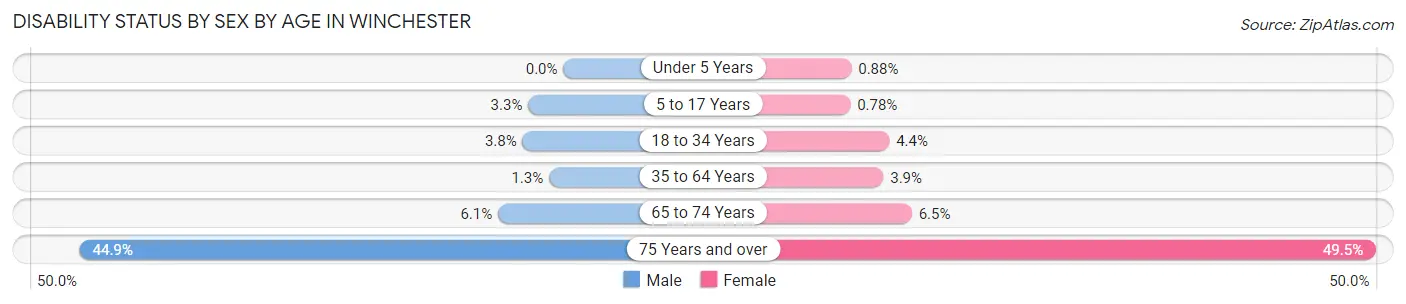
| Age Bracket | Male | Female |
| Under 5 Years | 0 (0.0%) | 7 (0.9%) |
| 5 to 17 Years | 77 (3.3%) | 20 (0.8%) |
| 18 to 34 Years | 54 (3.8%) | 57 (4.4%) |
| 35 to 64 Years | 62 (1.3%) | 195 (3.8%) |
| 65 to 74 Years | 58 (6.1%) | 72 (6.5%) |
| 75 Years and over | 268 (44.9%) | 567 (49.5%) |
Disability Class by Sex by Age in Winchester
Disability Class: Hearing Difficulty
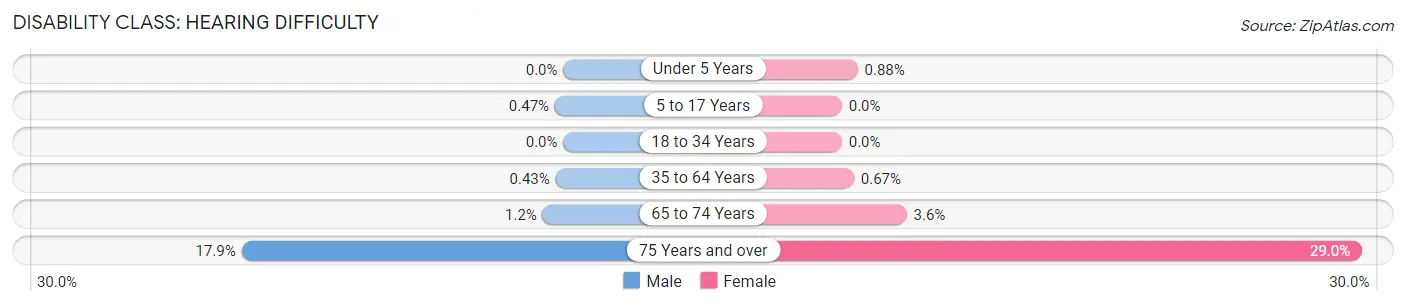
| Age Bracket | Male | Female |
| Under 5 Years | 0 (0.0%) | 7 (0.9%) |
| 5 to 17 Years | 11 (0.5%) | 0 (0.0%) |
| 18 to 34 Years | 0 (0.0%) | 0 (0.0%) |
| 35 to 64 Years | 20 (0.4%) | 34 (0.7%) |
| 65 to 74 Years | 11 (1.1%) | 40 (3.6%) |
| 75 Years and over | 107 (17.9%) | 332 (29.0%) |
Disability Class: Vision Difficulty
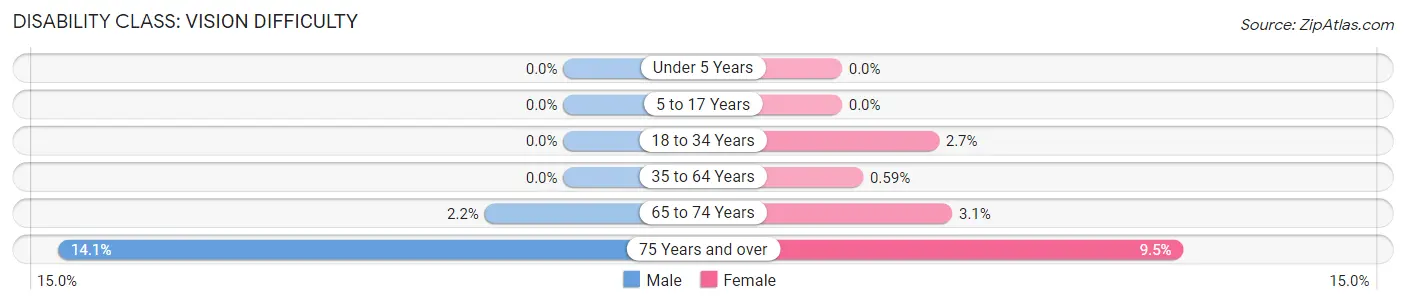
| Age Bracket | Male | Female |
| Under 5 Years | 0 (0.0%) | 0 (0.0%) |
| 5 to 17 Years | 0 (0.0%) | 0 (0.0%) |
| 18 to 34 Years | 0 (0.0%) | 35 (2.7%) |
| 35 to 64 Years | 0 (0.0%) | 30 (0.6%) |
| 65 to 74 Years | 21 (2.2%) | 34 (3.1%) |
| 75 Years and over | 84 (14.1%) | 109 (9.5%) |
Disability Class: Cognitive Difficulty

| Age Bracket | Male | Female |
| 5 to 17 Years | 66 (2.8%) | 20 (0.8%) |
| 18 to 34 Years | 9 (0.6%) | 46 (3.5%) |
| 35 to 64 Years | 8 (0.2%) | 46 (0.9%) |
| 65 to 74 Years | 0 (0.0%) | 17 (1.5%) |
| 75 Years and over | 26 (4.4%) | 104 (9.1%) |
Disability Class: Ambulatory Difficulty
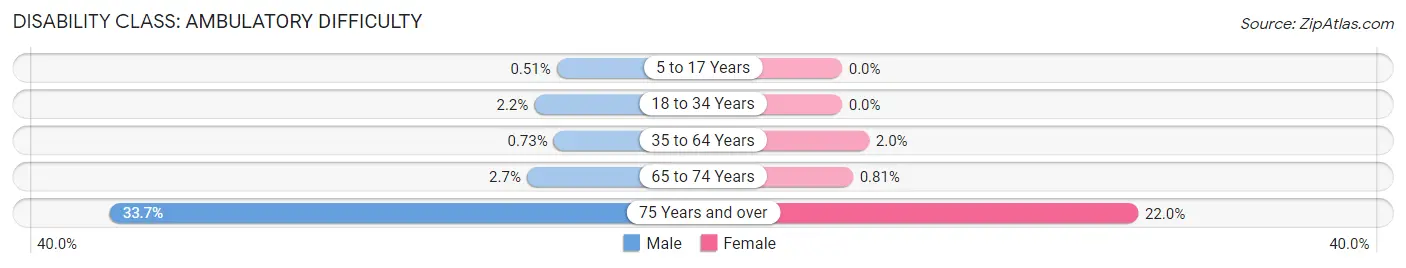
| Age Bracket | Male | Female |
| 5 to 17 Years | 12 (0.5%) | 0 (0.0%) |
| 18 to 34 Years | 31 (2.2%) | 0 (0.0%) |
| 35 to 64 Years | 34 (0.7%) | 102 (2.0%) |
| 65 to 74 Years | 26 (2.7%) | 9 (0.8%) |
| 75 Years and over | 201 (33.7%) | 252 (22.0%) |
Disability Class: Self-Care Difficulty
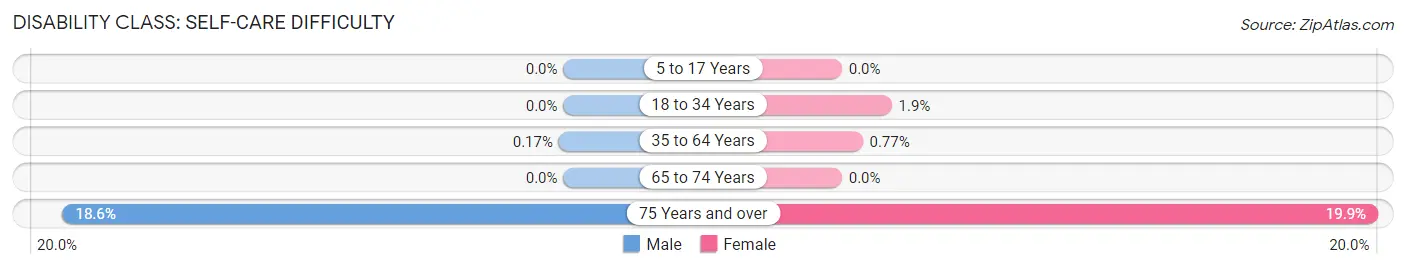
| Age Bracket | Male | Female |
| 5 to 17 Years | 0 (0.0%) | 0 (0.0%) |
| 18 to 34 Years | 0 (0.0%) | 24 (1.8%) |
| 35 to 64 Years | 8 (0.2%) | 39 (0.8%) |
| 65 to 74 Years | 0 (0.0%) | 0 (0.0%) |
| 75 Years and over | 111 (18.6%) | 228 (19.9%) |
Technology Access in Winchester
Computing Device Access in Winchester
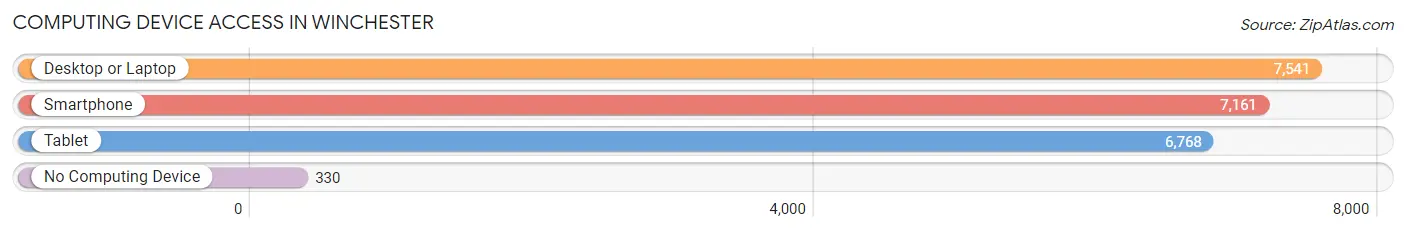
| Device Type | # Households | % Households |
| Desktop or Laptop | 7,541 | 93.5% |
| Smartphone | 7,161 | 88.8% |
| Tablet | 6,768 | 83.9% |
| No Computing Device | 330 | 4.1% |
| Total | 8,066 | 100.0% |
Internet Access in Winchester
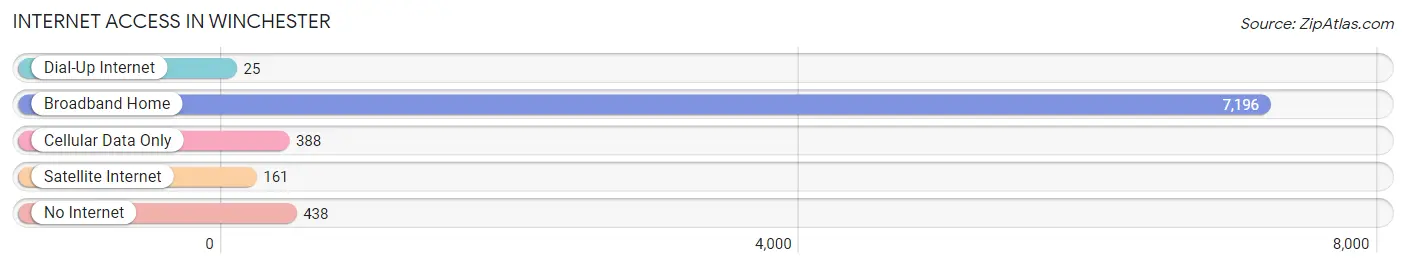
| Internet Type | # Households | % Households |
| Dial-Up Internet | 25 | 0.3% |
| Broadband Home | 7,196 | 89.2% |
| Cellular Data Only | 388 | 4.8% |
| Satellite Internet | 161 | 2.0% |
| No Internet | 438 | 5.4% |
| Total | 8,066 | 100.0% |
Winchester Summary
Winchester, Massachusetts is a small town located in Middlesex County, about 8 miles north of Boston. It is a suburb of the city and is part of the Greater Boston metropolitan area. The town has a population of approximately 21,000 people and is known for its historic homes, excellent schools, and vibrant downtown.
History
Winchester was first settled in 1639 by settlers from Watertown, Massachusetts. The town was originally part of Charlestown, but was incorporated as its own town in 1850. The town was named after Winchester, England, and was originally an agricultural community. In the late 19th century, Winchester became a popular summer resort for wealthy Bostonians, and many of the town’s grand Victorian homes were built during this time.
Geography
Winchester is located in Middlesex County, about 8 miles north of Boston. It is bordered by Woburn to the north, Medford to the east, Arlington to the south, and Lexington to the west. The town is situated on the Mystic River, and is home to the Mystic Lakes, which are popular for swimming, fishing, and boating. The town is also home to the Middlesex Fells Reservation, a 2,500-acre park with hiking trails, picnic areas, and scenic views.
Economy
Winchester is a primarily residential community, and the town’s economy is largely based on the service industry. The town is home to several large employers, including the Winchester Hospital, the Winchester Public Schools, and the Winchester Country Club. The town is also home to several small businesses, including restaurants, retail stores, and professional services.
Demographics
As of the 2010 census, Winchester had a population of 21,374 people. The median household income was $128,867, and the median age was 43. The town is predominantly white (90.2%), with small percentages of Asian (3.7%), African American (2.2%), and Hispanic (2.1%) residents.
Winchester is a vibrant and diverse community, and is known for its excellent schools, historic homes, and vibrant downtown. The town is a popular destination for families and professionals alike, and is a great place to live, work, and play.
Common Questions
What is Per Capita Income in Winchester?
Per Capita income in Winchester is $100,383.
What is the Median Family Income in Winchester?
Median Family Income in Winchester is $250,001.
What is the Median Household income in Winchester?
Median Household Income in Winchester is $208,531.
What is Income or Wage Gap in Winchester?
Income or Wage Gap in Winchester is 40.0%.
Women in Winchester earn 60.0 cents for every dollar earned by a man.
What is Inequality or Gini Index in Winchester?
Inequality or Gini Index in Winchester is 0.47.
What is the Total Population of Winchester?
Total Population of Winchester is 22,809.
What is the Total Male Population of Winchester?
Total Male Population of Winchester is 10,614.
What is the Total Female Population of Winchester?
Total Female Population of Winchester is 12,195.
What is the Ratio of Males per 100 Females in Winchester?
There are 87.04 Males per 100 Females in Winchester.
What is the Ratio of Females per 100 Males in Winchester?
There are 114.90 Females per 100 Males in Winchester.
What is the Median Population Age in Winchester?
Median Population Age in Winchester is 42.3 Years.
What is the Average Family Size in Winchester
Average Family Size in Winchester is 3.3 People.
What is the Average Household Size in Winchester
Average Household Size in Winchester is 2.8 People.
How Large is the Labor Force in Winchester?
There are 11,734 People in the Labor Forcein in Winchester.
What is the Percentage of People in the Labor Force in Winchester?
67.7% of People are in the Labor Force in Winchester.
What is the Unemployment Rate in Winchester?
Unemployment Rate in Winchester is 3.4%.