Huntley, IL Map & Demographics
Huntley Map
Huntley Overview
$43,852
PER CAPITA INCOME
$109,783
AVG FAMILY INCOME
$83,357
AVG HOUSEHOLD INCOME
34.2%
WAGE / INCOME GAP [ % ]
65.8¢/ $1
WAGE / INCOME GAP [ $ ]
$6,676
FAMILY INCOME DEFICIT
0.43
INEQUALITY / GINI INDEX
27,652
TOTAL POPULATION
13,137
MALE POPULATION
14,515
FEMALE POPULATION
90.51
MALES / 100 FEMALES
110.49
FEMALES / 100 MALES
49.1
MEDIAN AGE
3.0
AVG FAMILY SIZE
2.3
AVG HOUSEHOLD SIZE
11,743
LABOR FORCE [ PEOPLE ]
52.2%
PERCENT IN LABOR FORCE
3.3%
UNEMPLOYMENT RATE
Huntley Zip Codes
Income in Huntley
Income Overview in Huntley
Per Capita Income in Huntley is $43,852, while median incomes of families and households are $109,783 and $83,357 respectively.
| Characteristic | Number | Measure |
| Per Capita Income | 27,652 | $43,852 |
| Median Family Income | 7,406 | $109,783 |
| Mean Family Income | 7,406 | $131,255 |
| Median Household Income | 12,128 | $83,357 |
| Mean Household Income | 12,128 | $100,466 |
| Income Deficit | 7,406 | $6,676 |
| Wage / Income Gap (%) | 27,652 | 34.15% |
| Wage / Income Gap ($) | 27,652 | 65.85¢ per $1 |
| Gini / Inequality Index | 27,652 | 0.43 |
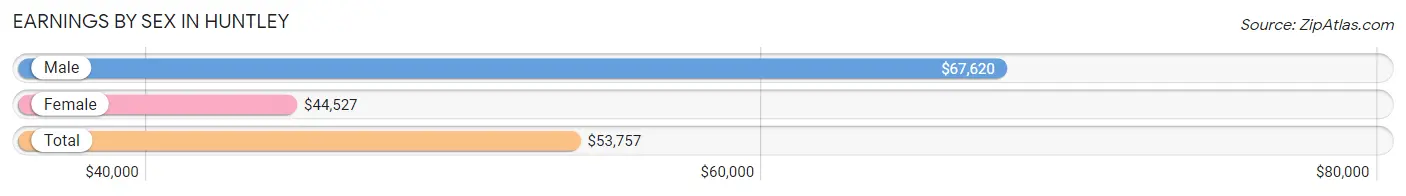
Earnings by Sex in Huntley
Average Earnings in Huntley are $53,757, $67,620 for men and $44,527 for women, a difference of 34.2%.
| Sex | Number | Average Earnings |
| Male | 6,530 (52.7%) | $67,620 |
| Female | 5,851 (47.3%) | $44,527 |
| Total | 12,381 (100.0%) | $53,757 |
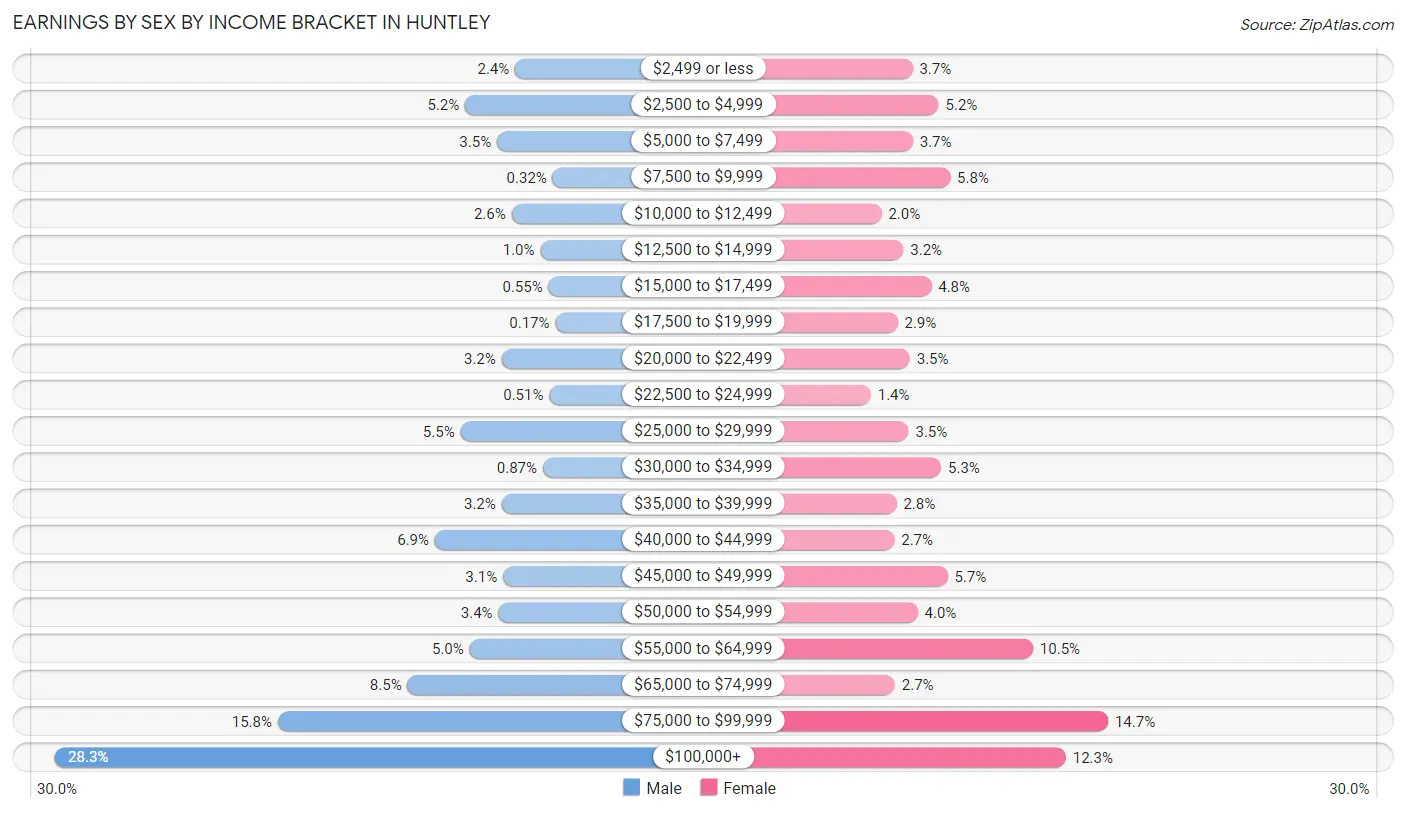
Earnings by Sex by Income Bracket in Huntley
The most common earnings brackets in Huntley are $100,000+ for men (1,847 | 28.3%) and $75,000 to $99,999 for women (859 | 14.7%).
| Income | Male | Female |
| $2,499 or less | 159 (2.4%) | 216 (3.7%) |
| $2,500 to $4,999 | 342 (5.2%) | 302 (5.2%) |
| $5,000 to $7,499 | 225 (3.5%) | 217 (3.7%) |
| $7,500 to $9,999 | 21 (0.3%) | 340 (5.8%) |
| $10,000 to $12,499 | 172 (2.6%) | 114 (1.9%) |
| $12,500 to $14,999 | 66 (1.0%) | 186 (3.2%) |
| $15,000 to $17,499 | 36 (0.5%) | 278 (4.8%) |
| $17,500 to $19,999 | 11 (0.2%) | 167 (2.9%) |
| $20,000 to $22,499 | 208 (3.2%) | 207 (3.5%) |
| $22,500 to $24,999 | 33 (0.5%) | 79 (1.3%) |
| $25,000 to $29,999 | 359 (5.5%) | 203 (3.5%) |
| $30,000 to $34,999 | 57 (0.9%) | 310 (5.3%) |
| $35,000 to $39,999 | 208 (3.2%) | 163 (2.8%) |
| $40,000 to $44,999 | 453 (6.9%) | 156 (2.7%) |
| $45,000 to $49,999 | 203 (3.1%) | 331 (5.7%) |
| $50,000 to $54,999 | 220 (3.4%) | 233 (4.0%) |
| $55,000 to $64,999 | 326 (5.0%) | 612 (10.5%) |
| $65,000 to $74,999 | 554 (8.5%) | 158 (2.7%) |
| $75,000 to $99,999 | 1,030 (15.8%) | 859 (14.7%) |
| $100,000+ | 1,847 (28.3%) | 720 (12.3%) |
| Total | 6,530 (100.0%) | 5,851 (100.0%) |
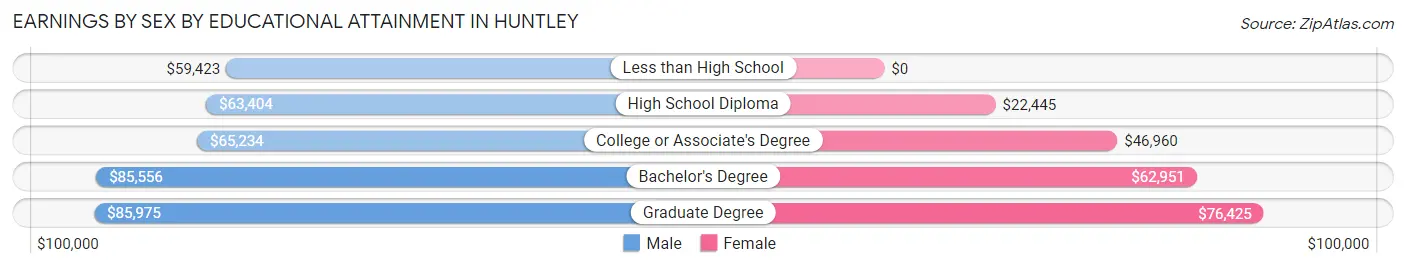
Earnings by Sex by Educational Attainment in Huntley
Average earnings in Huntley are $71,757 for men and $47,323 for women, a difference of 34.1%. Men with an educational attainment of graduate degree enjoy the highest average annual earnings of $85,975, while those with less than high school education earn the least with $59,423. Women with an educational attainment of graduate degree earn the most with the average annual earnings of $76,425, while those with high school diploma education have the smallest earnings of $22,445.
| Educational Attainment | Male Income | Female Income |
| Less than High School | $59,423 | $0 |
| High School Diploma | $63,404 | $22,445 |
| College or Associate's Degree | $65,234 | $46,960 |
| Bachelor's Degree | $85,556 | $62,951 |
| Graduate Degree | $85,975 | $76,425 |
| Total | $71,757 | $47,323 |
Family Income in Huntley
Family Income Brackets in Huntley
According to the Huntley family income data, there are 1,533 families falling into the $150,000 to $199,999 income range, which is the most common income bracket and makes up 20.7% of all families. Conversely, the less than $10,000 income bracket is the least frequent group with only 22 families (0.3%) belonging to this category.
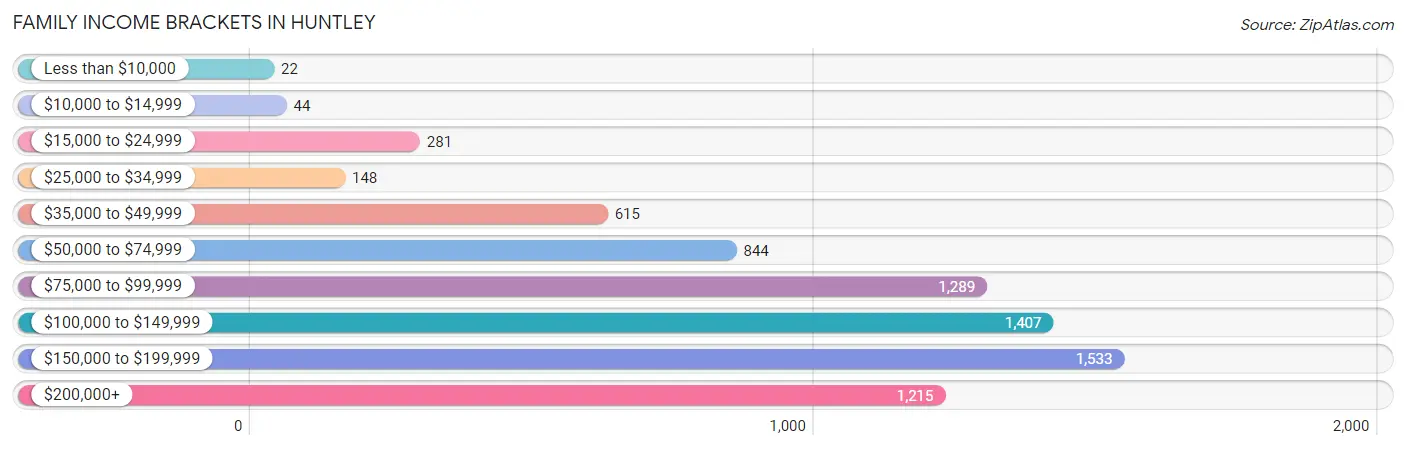
| Income Bracket | # Families | % Families |
| Less than $10,000 | 22 | 0.3% |
| $10,000 to $14,999 | 44 | 0.6% |
| $15,000 to $24,999 | 281 | 3.8% |
| $25,000 to $34,999 | 148 | 2.0% |
| $35,000 to $49,999 | 615 | 8.3% |
| $50,000 to $74,999 | 844 | 11.4% |
| $75,000 to $99,999 | 1,289 | 17.4% |
| $100,000 to $149,999 | 1,407 | 19.0% |
| $150,000 to $199,999 | 1,533 | 20.7% |
| $200,000+ | 1,215 | 16.4% |
Family Income by Famaliy Size in Huntley
7+ person families (170 | 2.3%) account for the highest median family income in Huntley with $250,001 per family, while 2-person families (3,500 | 47.3%) have the highest median income of $43,910 per family member.
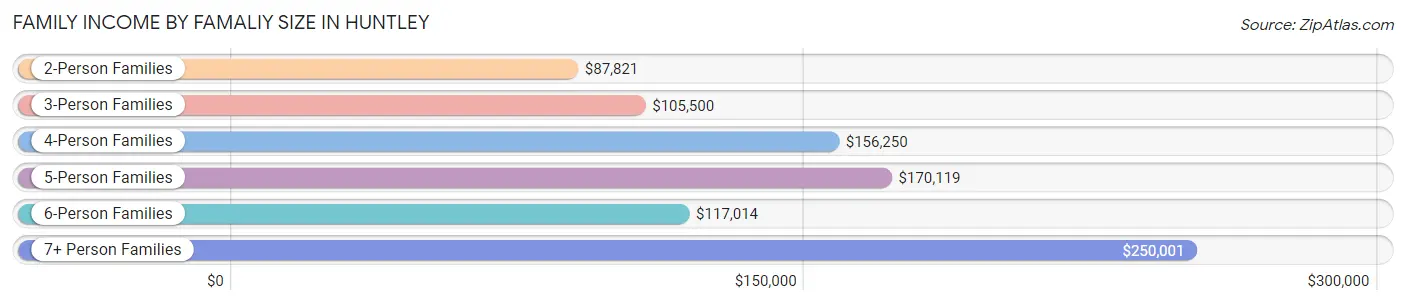
| Income Bracket | # Families | Median Income |
| 2-Person Families | 3,500 (47.3%) | $87,821 |
| 3-Person Families | 1,630 (22.0%) | $105,500 |
| 4-Person Families | 1,241 (16.8%) | $156,250 |
| 5-Person Families | 800 (10.8%) | $170,119 |
| 6-Person Families | 65 (0.9%) | $117,014 |
| 7+ Person Families | 170 (2.3%) | $250,001 |
| Total | 7,406 (100.0%) | $109,783 |
Family Income by Number of Earners in Huntley
The median family income in Huntley is $109,783, with families comprising 3+ earners (1,059) having the highest median family income of $203,641, while families with no earners (1,750) have the lowest median family income of $74,939, accounting for 14.3% and 23.6% of families, respectively.
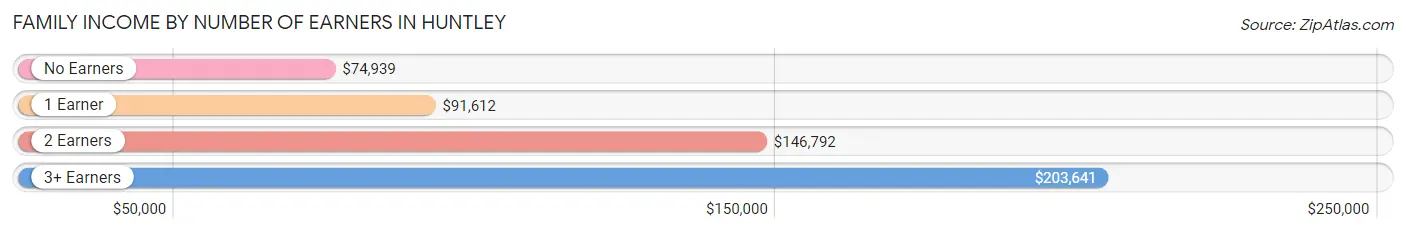
| Number of Earners | # Families | Median Income |
| No Earners | 1,750 (23.6%) | $74,939 |
| 1 Earner | 1,988 (26.8%) | $91,612 |
| 2 Earners | 2,609 (35.2%) | $146,792 |
| 3+ Earners | 1,059 (14.3%) | $203,641 |
| Total | 7,406 (100.0%) | $109,783 |
Household Income in Huntley
Household Income Brackets in Huntley
With 1,977 households falling in the category, the $75,000 to $99,999 income range is the most frequent in Huntley, accounting for 16.3% of all households. In contrast, only 182 households (1.5%) fall into the $10,000 to $14,999 income bracket, making it the least populous group.
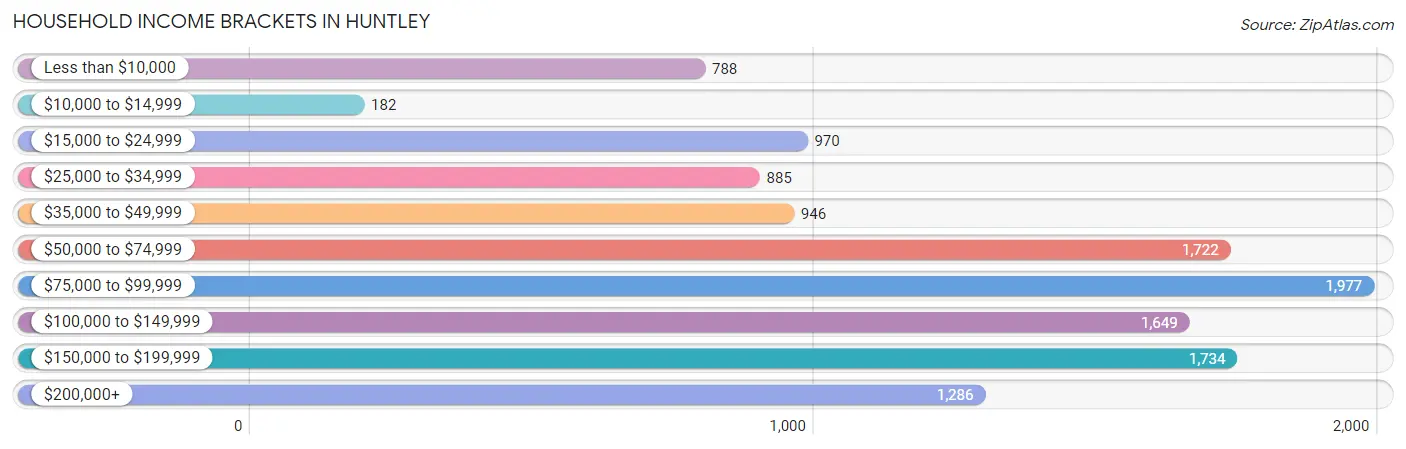
| Income Bracket | # Households | % Households |
| Less than $10,000 | 788 | 6.5% |
| $10,000 to $14,999 | 182 | 1.5% |
| $15,000 to $24,999 | 970 | 8.0% |
| $25,000 to $34,999 | 885 | 7.3% |
| $35,000 to $49,999 | 946 | 7.8% |
| $50,000 to $74,999 | 1,722 | 14.2% |
| $75,000 to $99,999 | 1,977 | 16.3% |
| $100,000 to $149,999 | 1,649 | 13.6% |
| $150,000 to $199,999 | 1,734 | 14.3% |
| $200,000+ | 1,286 | 10.6% |
Household Income by Householder Age in Huntley
The median household income in Huntley is $83,357, with the highest median household income of $129,085 found in the 45 to 64 years age bracket for the primary householder. A total of 3,243 households (26.7%) fall into this category.
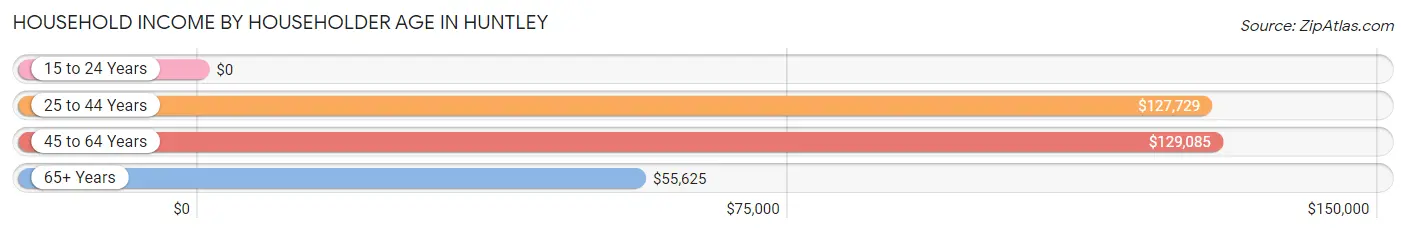
| Income Bracket | # Households | Median Income |
| 15 to 24 Years | 0 (0.0%) | $0 |
| 25 to 44 Years | 2,377 (19.6%) | $127,729 |
| 45 to 64 Years | 3,243 (26.7%) | $129,085 |
| 65+ Years | 6,508 (53.7%) | $55,625 |
| Total | 12,128 (100.0%) | $83,357 |
Poverty in Huntley
Income Below Poverty by Sex and Age in Huntley
With 4.3% poverty level for males and 10.3% for females among the residents of Huntley, 5 year old males and 75 year old and over females are the most vulnerable to poverty, with 105 males (29.7%) and 720 females (20.7%) in their respective age groups living below the poverty level.
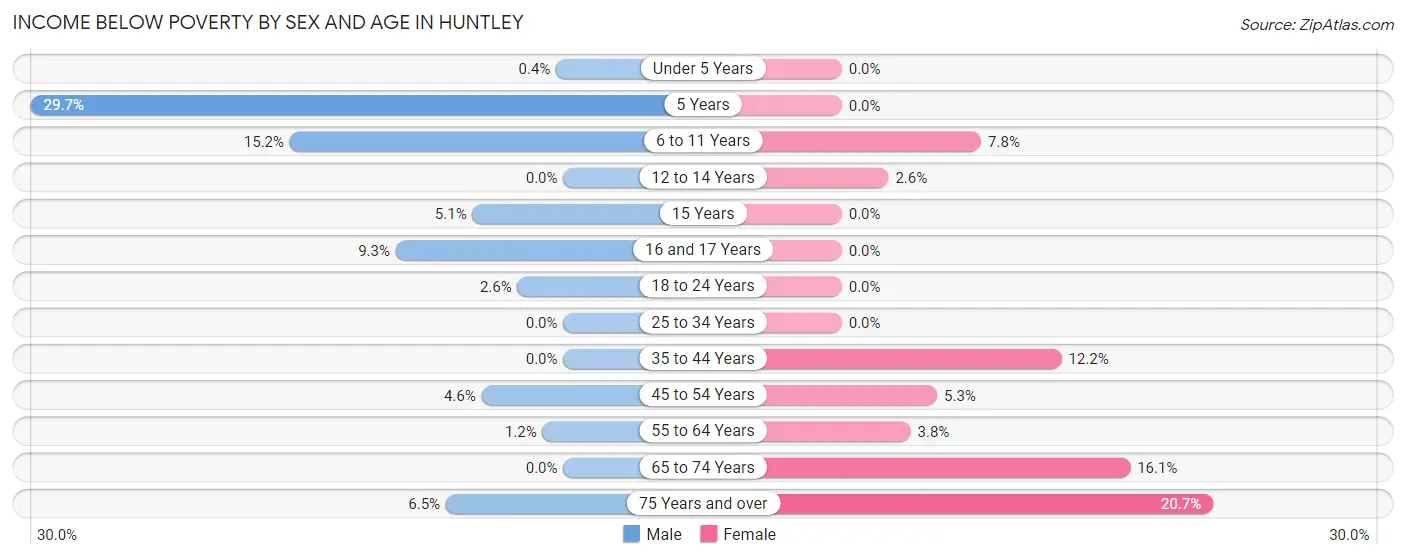
| Age Bracket | Male | Female |
| Under 5 Years | 2 (0.4%) | 0 (0.0%) |
| 5 Years | 105 (29.7%) | 0 (0.0%) |
| 6 to 11 Years | 141 (15.2%) | 86 (7.8%) |
| 12 to 14 Years | 0 (0.0%) | 9 (2.6%) |
| 15 Years | 8 (5.1%) | 0 (0.0%) |
| 16 and 17 Years | 43 (9.3%) | 0 (0.0%) |
| 18 to 24 Years | 17 (2.5%) | 0 (0.0%) |
| 25 to 34 Years | 0 (0.0%) | 0 (0.0%) |
| 35 to 44 Years | 0 (0.0%) | 203 (12.2%) |
| 45 to 54 Years | 80 (4.5%) | 86 (5.3%) |
| 55 to 64 Years | 14 (1.2%) | 49 (3.8%) |
| 65 to 74 Years | 0 (0.0%) | 337 (16.1%) |
| 75 Years and over | 147 (6.5%) | 720 (20.7%) |
| Total | 557 (4.3%) | 1,490 (10.3%) |
Income Above Poverty by Sex and Age in Huntley
According to the poverty statistics in Huntley, males aged 12 to 14 years and females aged under 5 years are the age groups that are most secure financially, with 100.0% of males and 100.0% of females in these age groups living above the poverty line.
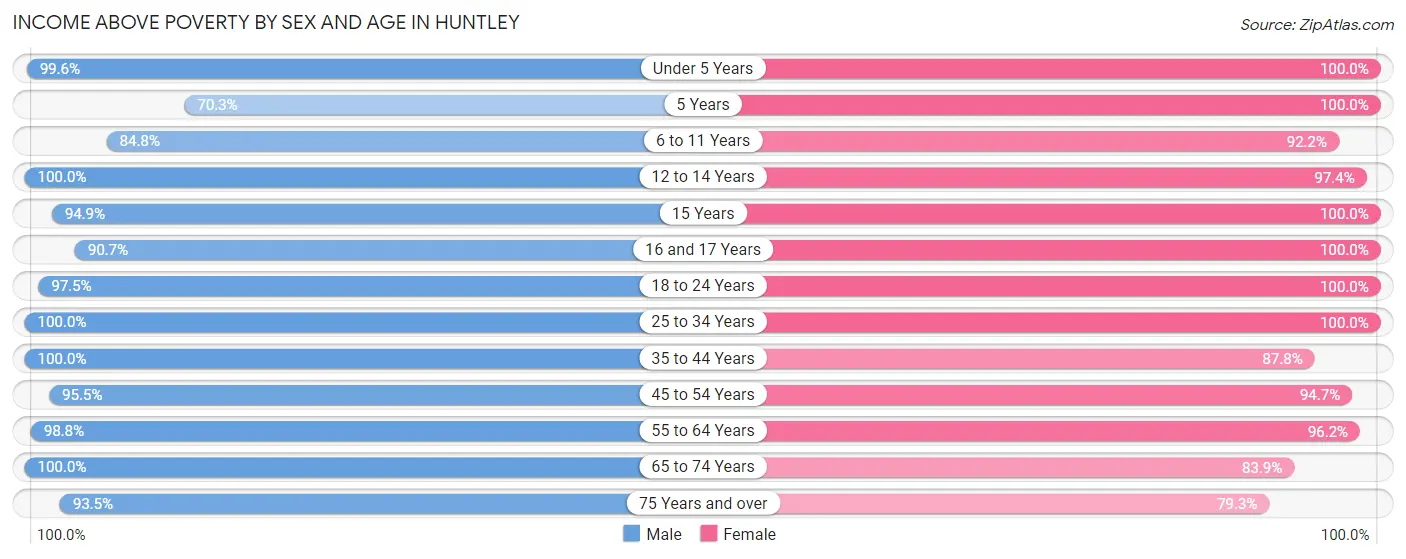
| Age Bracket | Male | Female |
| Under 5 Years | 503 (99.6%) | 648 (100.0%) |
| 5 Years | 249 (70.3%) | 175 (100.0%) |
| 6 to 11 Years | 785 (84.8%) | 1,022 (92.2%) |
| 12 to 14 Years | 459 (100.0%) | 337 (97.4%) |
| 15 Years | 150 (94.9%) | 447 (100.0%) |
| 16 and 17 Years | 418 (90.7%) | 230 (100.0%) |
| 18 to 24 Years | 649 (97.5%) | 694 (100.0%) |
| 25 to 34 Years | 1,212 (100.0%) | 726 (100.0%) |
| 35 to 44 Years | 1,421 (100.0%) | 1,455 (87.8%) |
| 45 to 54 Years | 1,680 (95.5%) | 1,534 (94.7%) |
| 55 to 64 Years | 1,198 (98.8%) | 1,232 (96.2%) |
| 65 to 74 Years | 1,719 (100.0%) | 1,762 (83.9%) |
| 75 Years and over | 2,099 (93.5%) | 2,763 (79.3%) |
| Total | 12,542 (95.8%) | 13,025 (89.7%) |
Income Below Poverty Among Married-Couple Families in Huntley
The poverty statistics for married-couple families in Huntley show that 1.3% or 83 of the total 6,202 families live below the poverty line. Families with no children have the highest poverty rate of 2.1%, comprising of 83 families. On the other hand, families with 1 or 2 children have the lowest poverty rate of 0.0%, which includes 0 families.
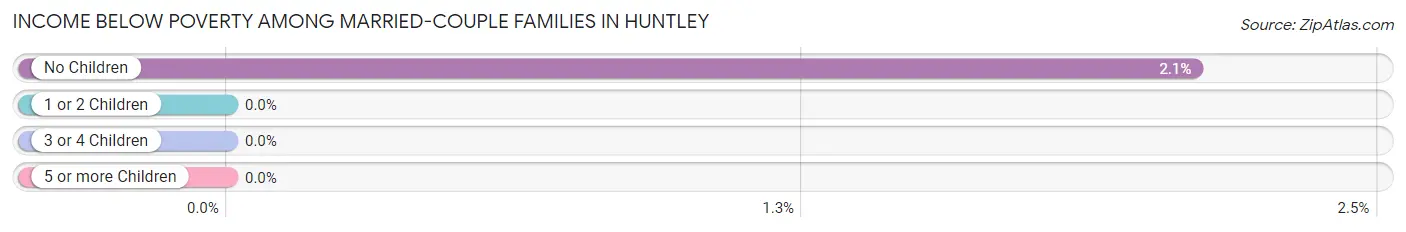
| Children | Above Poverty | Below Poverty |
| No Children | 3,863 (97.9%) | 83 (2.1%) |
| 1 or 2 Children | 1,584 (100.0%) | 0 (0.0%) |
| 3 or 4 Children | 672 (100.0%) | 0 (0.0%) |
| 5 or more Children | 0 (0.0%) | 0 (0.0%) |
| Total | 6,119 (98.7%) | 83 (1.3%) |
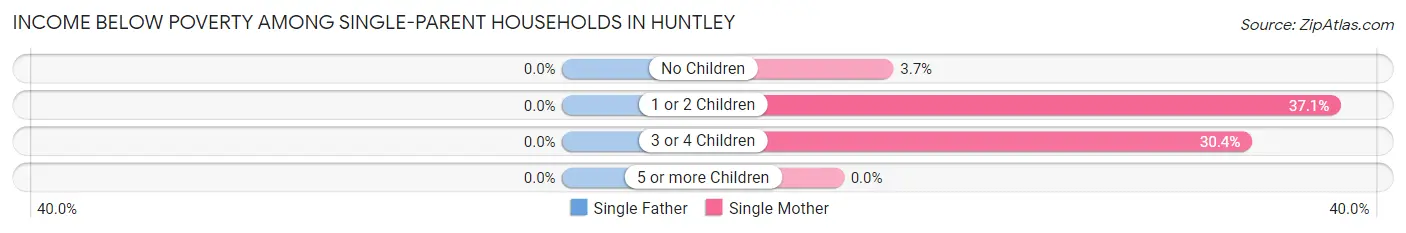
Income Below Poverty Among Single-Parent Households in Huntley
| Children | Single Father | Single Mother |
| No Children | 0 (0.0%) | 12 (3.7%) |
| 1 or 2 Children | 0 (0.0%) | 252 (37.1%) |
| 3 or 4 Children | 0 (0.0%) | 7 (30.4%) |
| 5 or more Children | 0 (0.0%) | 0 (0.0%) |
| Total | 0 (0.0%) | 271 (26.4%) |
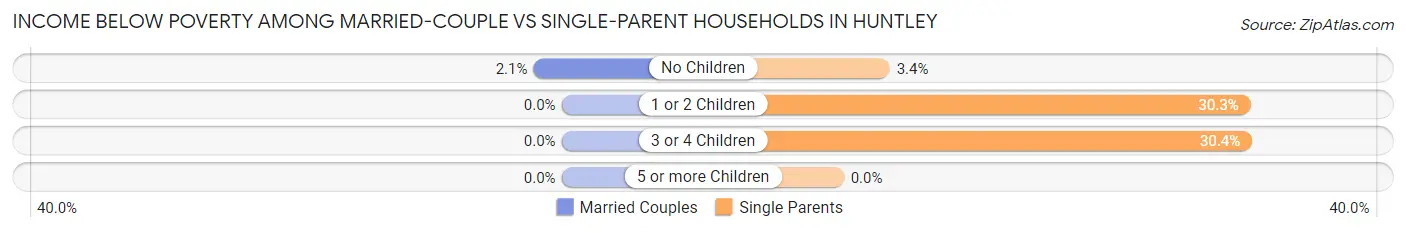
Income Below Poverty Among Married-Couple vs Single-Parent Households in Huntley
The poverty data for Huntley shows that 83 of the married-couple family households (1.3%) and 271 of the single-parent households (22.5%) are living below the poverty level. Within the married-couple family households, those with no children have the highest poverty rate, with 83 households (2.1%) falling below the poverty line. Among the single-parent households, those with 3 or 4 children have the highest poverty rate, with 7 household (30.4%) living below poverty.
| Children | Married-Couple Families | Single-Parent Households |
| No Children | 83 (2.1%) | 12 (3.4%) |
| 1 or 2 Children | 0 (0.0%) | 252 (30.3%) |
| 3 or 4 Children | 0 (0.0%) | 7 (30.4%) |
| 5 or more Children | 0 (0.0%) | 0 (0.0%) |
| Total | 83 (1.3%) | 271 (22.5%) |
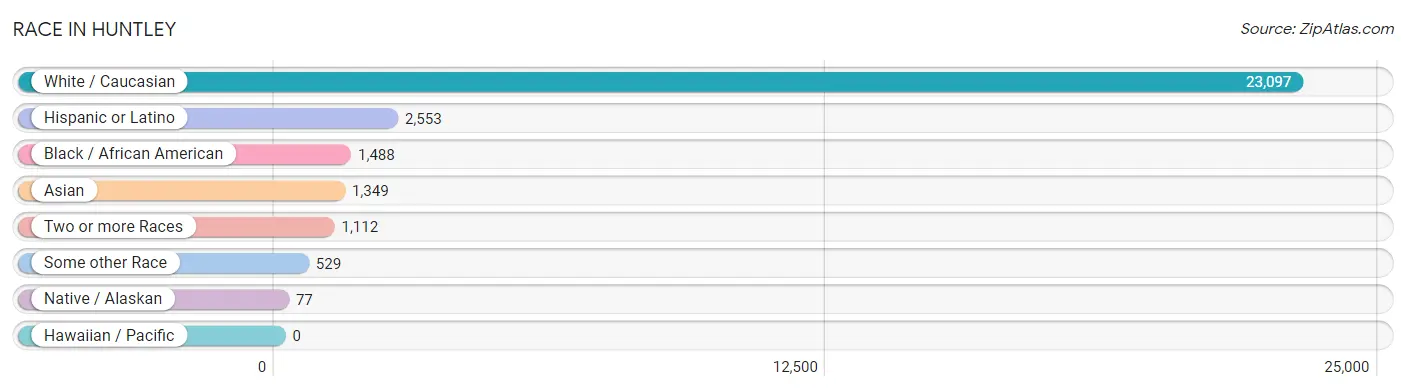
Race in Huntley
The most populous races in Huntley are White / Caucasian (23,097 | 83.5%), Hispanic or Latino (2,553 | 9.2%), and Black / African American (1,488 | 5.4%).
| Race | # Population | % Population |
| Asian | 1,349 | 4.9% |
| Black / African American | 1,488 | 5.4% |
| Hawaiian / Pacific | 0 | 0.0% |
| Hispanic or Latino | 2,553 | 9.2% |
| Native / Alaskan | 77 | 0.3% |
| White / Caucasian | 23,097 | 83.5% |
| Two or more Races | 1,112 | 4.0% |
| Some other Race | 529 | 1.9% |
| Total | 27,652 | 100.0% |
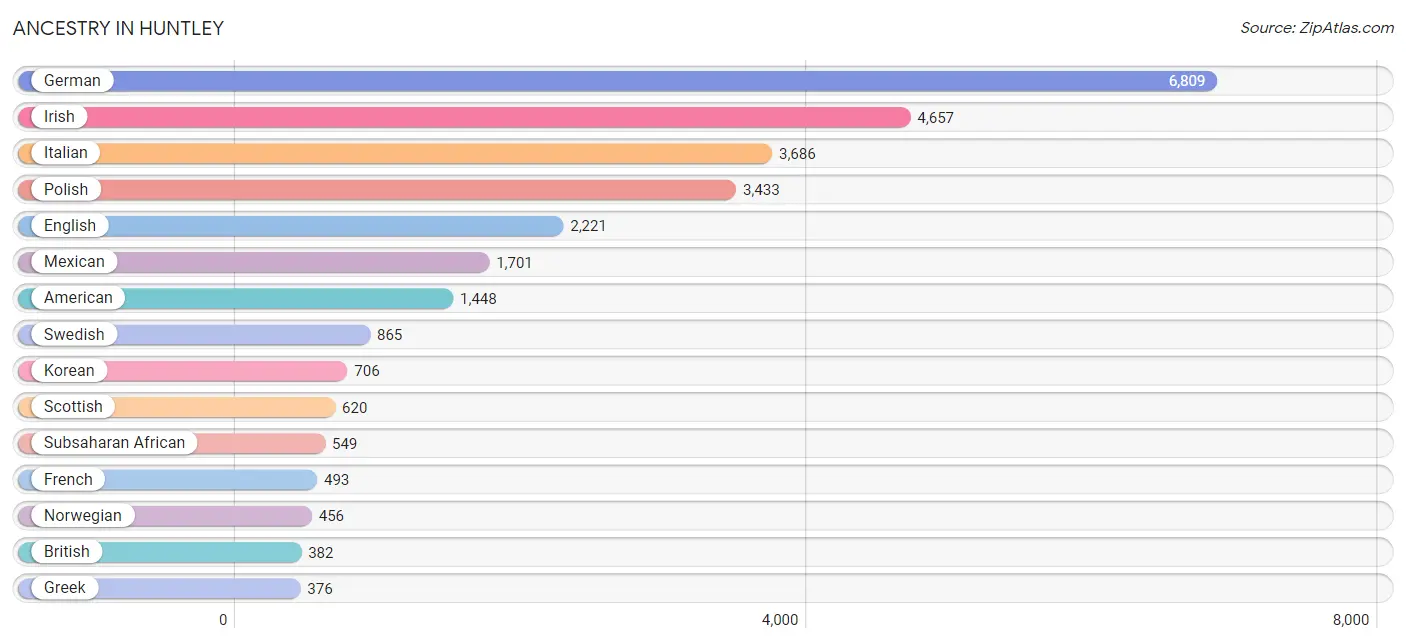
Ancestry in Huntley
The most populous ancestries reported in Huntley are German (6,809 | 24.6%), Irish (4,657 | 16.8%), Italian (3,686 | 13.3%), Polish (3,433 | 12.4%), and English (2,221 | 8.0%), together accounting for 75.2% of all Huntley residents.
| Ancestry | # Population | % Population |
| African | 166 | 0.6% |
| Albanian | 11 | 0.0% |
| American | 1,448 | 5.2% |
| Arab | 54 | 0.2% |
| Argentinean | 60 | 0.2% |
| Assyrian / Chaldean / Syriac | 30 | 0.1% |
| Austrian | 50 | 0.2% |
| Bhutanese | 171 | 0.6% |
| Bolivian | 17 | 0.1% |
| British | 382 | 1.4% |
| Burmese | 330 | 1.2% |
| Central American | 80 | 0.3% |
| Central American Indian | 25 | 0.1% |
| Cherokee | 19 | 0.1% |
| Chilean | 63 | 0.2% |
| Croatian | 63 | 0.2% |
| Cuban | 94 | 0.3% |
| Czech | 204 | 0.7% |
| Danish | 185 | 0.7% |
| Dutch | 294 | 1.1% |
| Eastern European | 197 | 0.7% |
| Ecuadorian | 142 | 0.5% |
| Egyptian | 15 | 0.1% |
| English | 2,221 | 8.0% |
| European | 250 | 0.9% |
| Filipino | 22 | 0.1% |
| Finnish | 126 | 0.5% |
| French | 493 | 1.8% |
| French Canadian | 333 | 1.2% |
| German | 6,809 | 24.6% |
| Greek | 376 | 1.4% |
| Guatemalan | 43 | 0.2% |
| Hungarian | 78 | 0.3% |
| Indian (Asian) | 38 | 0.1% |
| Irish | 4,657 | 16.8% |
| Italian | 3,686 | 13.3% |
| Jamaican | 105 | 0.4% |
| Korean | 706 | 2.5% |
| Lithuanian | 187 | 0.7% |
| Mexican | 1,701 | 6.1% |
| Moroccan | 11 | 0.0% |
| Nigerian | 342 | 1.2% |
| Northern European | 97 | 0.4% |
| Norwegian | 456 | 1.7% |
| Pakistani | 96 | 0.4% |
| Peruvian | 73 | 0.3% |
| Polish | 3,433 | 12.4% |
| Puerto Rican | 162 | 0.6% |
| Romanian | 38 | 0.1% |
| Russian | 161 | 0.6% |
| Salvadoran | 37 | 0.1% |
| Scandinavian | 32 | 0.1% |
| Scotch-Irish | 19 | 0.1% |
| Scottish | 620 | 2.2% |
| Slavic | 30 | 0.1% |
| Slovene | 130 | 0.5% |
| South American | 355 | 1.3% |
| Spaniard | 84 | 0.3% |
| Spanish | 77 | 0.3% |
| Subsaharan African | 549 | 2.0% |
| Swedish | 865 | 3.1% |
| Swiss | 31 | 0.1% |
| Thai | 306 | 1.1% |
| Ukrainian | 45 | 0.2% |
| Welsh | 112 | 0.4% |
| Yugoslavian | 8 | 0.0% | View All 66 Rows |
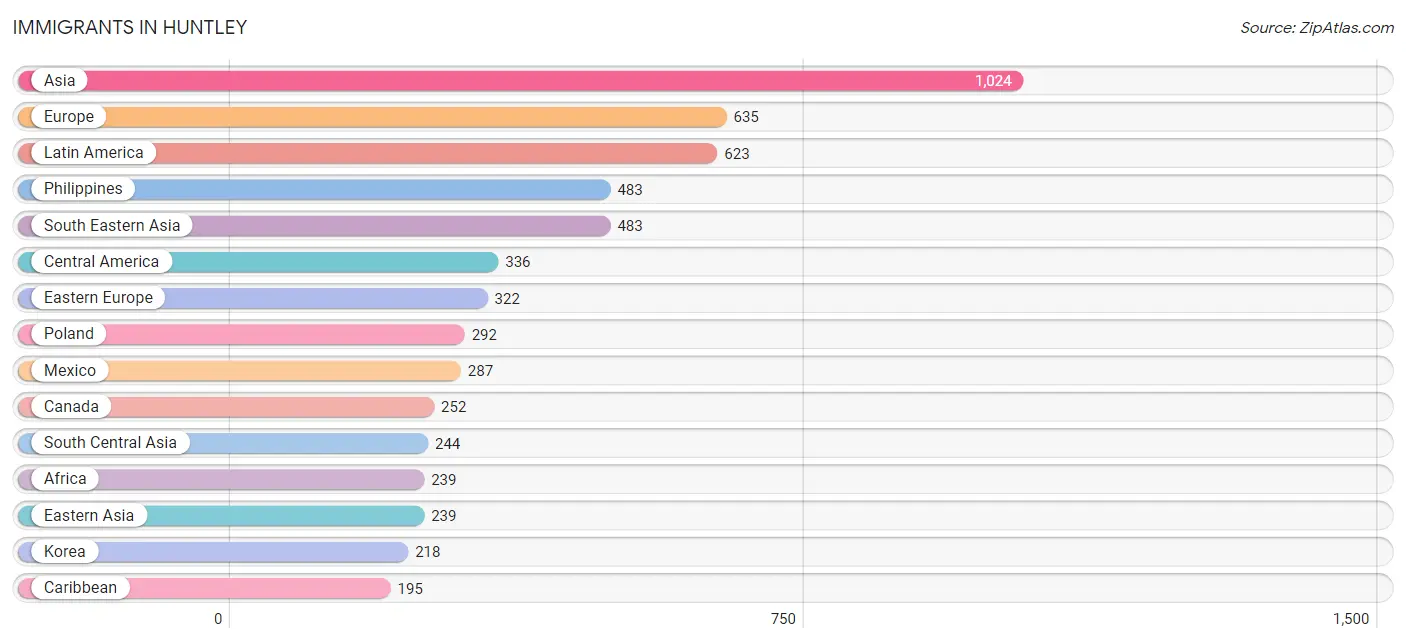
Immigrants in Huntley
The most numerous immigrant groups reported in Huntley came from Asia (1,024 | 3.7%), Europe (635 | 2.3%), Latin America (623 | 2.2%), Philippines (483 | 1.8%), and South Eastern Asia (483 | 1.8%), together accounting for 11.7% of all Huntley residents.
| Immigration Origin | # Population | % Population |
| Africa | 239 | 0.9% |
| Asia | 1,024 | 3.7% |
| Barbados | 67 | 0.2% |
| Bolivia | 17 | 0.1% |
| Canada | 252 | 0.9% |
| Caribbean | 195 | 0.7% |
| Central America | 336 | 1.2% |
| Chile | 17 | 0.1% |
| Cuba | 23 | 0.1% |
| Czechoslovakia | 19 | 0.1% |
| Eastern Africa | 41 | 0.2% |
| Eastern Asia | 239 | 0.9% |
| Eastern Europe | 322 | 1.2% |
| Ecuador | 21 | 0.1% |
| Egypt | 23 | 0.1% |
| El Salvador | 6 | 0.0% |
| England | 21 | 0.1% |
| Europe | 635 | 2.3% |
| Germany | 126 | 0.5% |
| Greece | 118 | 0.4% |
| Guatemala | 43 | 0.2% |
| India | 176 | 0.6% |
| Iraq | 13 | 0.1% |
| Ireland | 26 | 0.1% |
| Italy | 22 | 0.1% |
| Jamaica | 105 | 0.4% |
| Japan | 21 | 0.1% |
| Korea | 218 | 0.8% |
| Latin America | 623 | 2.2% |
| Mexico | 287 | 1.0% |
| Morocco | 11 | 0.0% |
| Nigeria | 164 | 0.6% |
| North Macedonia | 11 | 0.0% |
| Northern Africa | 34 | 0.1% |
| Northern Europe | 47 | 0.2% |
| Pakistan | 68 | 0.3% |
| Peru | 37 | 0.1% |
| Philippines | 483 | 1.8% |
| Poland | 292 | 1.1% |
| South America | 92 | 0.3% |
| South Central Asia | 244 | 0.9% |
| South Eastern Asia | 483 | 1.8% |
| Southern Europe | 140 | 0.5% |
| Syria | 45 | 0.2% |
| Western Africa | 164 | 0.6% |
| Western Asia | 58 | 0.2% |
| Western Europe | 126 | 0.5% | View All 47 Rows |
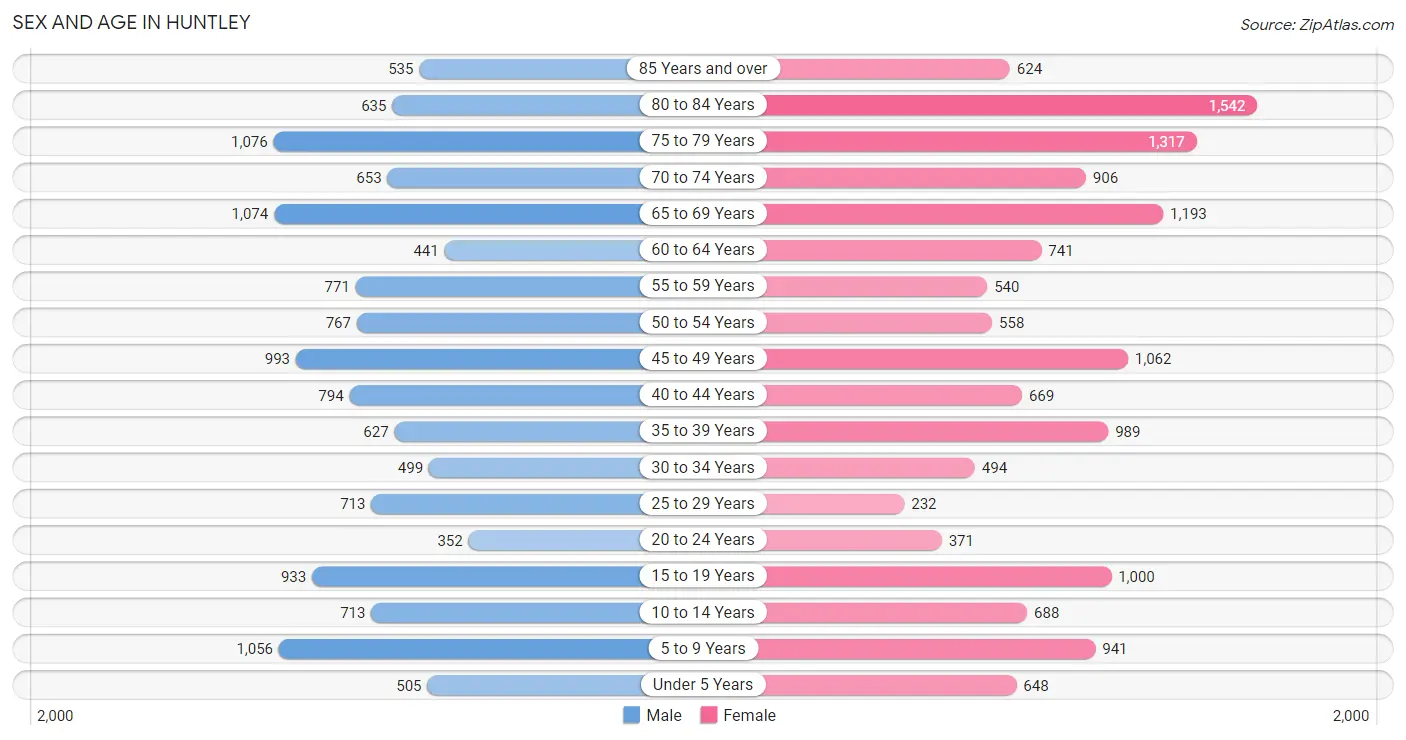
Sex and Age in Huntley
Sex and Age in Huntley
The most populous age groups in Huntley are 75 to 79 Years (1,076 | 8.2%) for men and 80 to 84 Years (1,542 | 10.6%) for women.
| Age Bracket | Male | Female |
| Under 5 Years | 505 (3.8%) | 648 (4.5%) |
| 5 to 9 Years | 1,056 (8.0%) | 941 (6.5%) |
| 10 to 14 Years | 713 (5.4%) | 688 (4.7%) |
| 15 to 19 Years | 933 (7.1%) | 1,000 (6.9%) |
| 20 to 24 Years | 352 (2.7%) | 371 (2.6%) |
| 25 to 29 Years | 713 (5.4%) | 232 (1.6%) |
| 30 to 34 Years | 499 (3.8%) | 494 (3.4%) |
| 35 to 39 Years | 627 (4.8%) | 989 (6.8%) |
| 40 to 44 Years | 794 (6.0%) | 669 (4.6%) |
| 45 to 49 Years | 993 (7.6%) | 1,062 (7.3%) |
| 50 to 54 Years | 767 (5.8%) | 558 (3.8%) |
| 55 to 59 Years | 771 (5.9%) | 540 (3.7%) |
| 60 to 64 Years | 441 (3.4%) | 741 (5.1%) |
| 65 to 69 Years | 1,074 (8.2%) | 1,193 (8.2%) |
| 70 to 74 Years | 653 (5.0%) | 906 (6.2%) |
| 75 to 79 Years | 1,076 (8.2%) | 1,317 (9.1%) |
| 80 to 84 Years | 635 (4.8%) | 1,542 (10.6%) |
| 85 Years and over | 535 (4.1%) | 624 (4.3%) |
| Total | 13,137 (100.0%) | 14,515 (100.0%) |
Families and Households in Huntley
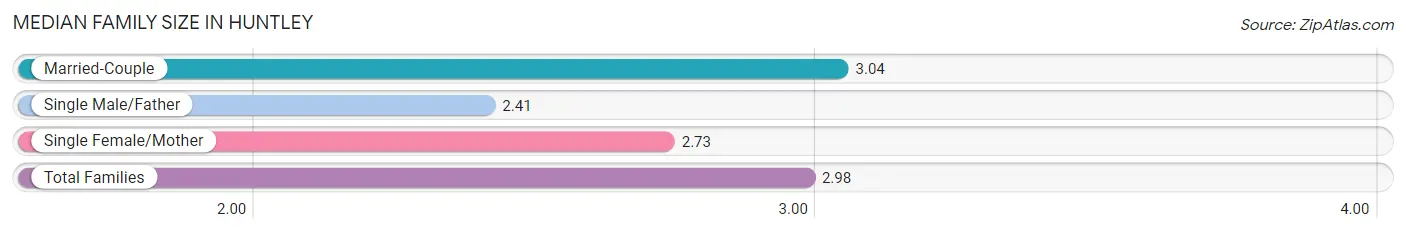
Median Family Size in Huntley
The median family size in Huntley is 2.98 persons per family, with married-couple families (6,202 | 83.7%) accounting for the largest median family size of 3.04 persons per family. On the other hand, single male/father families (177 | 2.4%) represent the smallest median family size with 2.41 persons per family.
| Family Type | # Families | Family Size |
| Married-Couple | 6,202 (83.7%) | 3.04 |
| Single Male/Father | 177 (2.4%) | 2.41 |
| Single Female/Mother | 1,027 (13.9%) | 2.73 |
| Total Families | 7,406 (100.0%) | 2.98 |
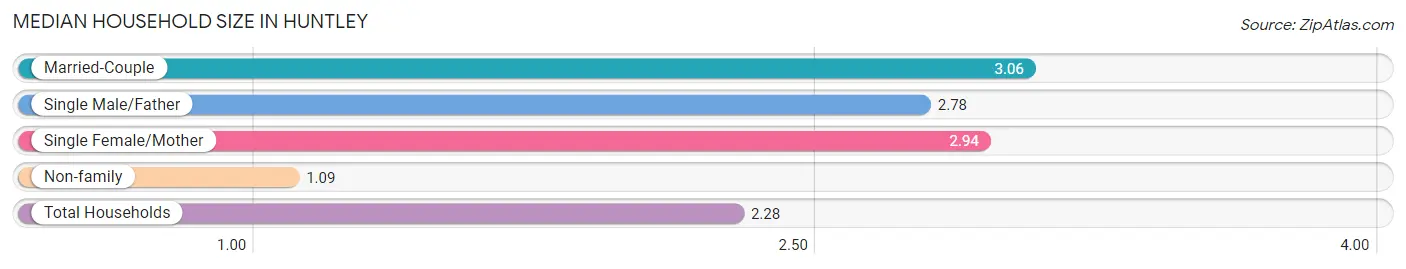
Median Household Size in Huntley
The median household size in Huntley is 2.28 persons per household, with married-couple households (6,202 | 51.1%) accounting for the largest median household size of 3.06 persons per household. non-family households (4,722 | 38.9%) represent the smallest median household size with 1.09 persons per household.
| Household Type | # Households | Household Size |
| Married-Couple | 6,202 (51.1%) | 3.06 |
| Single Male/Father | 177 (1.5%) | 2.78 |
| Single Female/Mother | 1,027 (8.5%) | 2.94 |
| Non-family | 4,722 (38.9%) | 1.09 |
| Total Households | 12,128 (100.0%) | 2.28 |
Household Size by Marriage Status in Huntley
Out of a total of 12,128 households in Huntley, 7,406 (61.1%) are family households, while 4,722 (38.9%) are nonfamily households. The most numerous type of family households are 2-person households, comprising 3,473, and the most common type of nonfamily households are 1-person households, comprising 4,471.
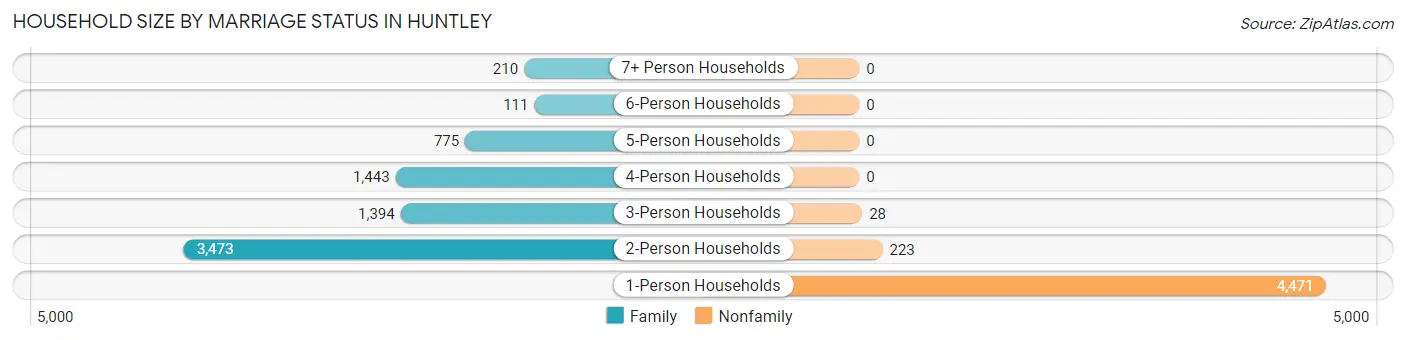
| Household Size | Family Households | Nonfamily Households |
| 1-Person Households | - | 4,471 (36.9%) |
| 2-Person Households | 3,473 (28.6%) | 223 (1.8%) |
| 3-Person Households | 1,394 (11.5%) | 28 (0.2%) |
| 4-Person Households | 1,443 (11.9%) | 0 (0.0%) |
| 5-Person Households | 775 (6.4%) | 0 (0.0%) |
| 6-Person Households | 111 (0.9%) | 0 (0.0%) |
| 7+ Person Households | 210 (1.7%) | 0 (0.0%) |
| Total | 7,406 (61.1%) | 4,722 (38.9%) |
Female Fertility in Huntley
Fertility by Age in Huntley
Average fertility rate in Huntley is 37.0 births per 1,000 women. Women in the age bracket of 20 to 34 years have the highest fertility rate with 98.0 births per 1,000 women. Women in the age bracket of 20 to 34 years acount for 57.5% of all women with births.
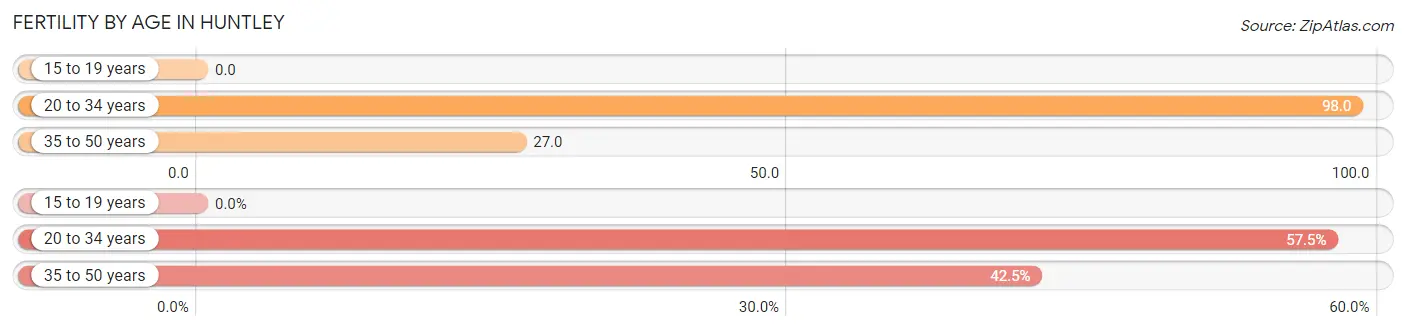
| Age Bracket | Women with Births | Births / 1,000 Women |
| 15 to 19 years | 0 (0.0%) | 0.0 |
| 20 to 34 years | 107 (57.5%) | 98.0 |
| 35 to 50 years | 79 (42.5%) | 27.0 |
| Total | 186 (100.0%) | 37.0 |
Fertility by Age by Marriage Status in Huntley
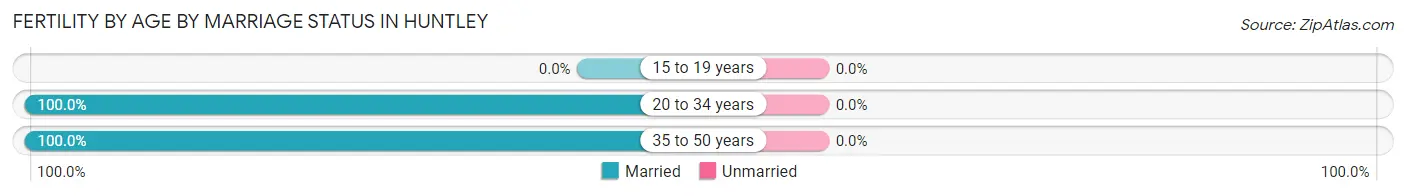
| Age Bracket | Married | Unmarried |
| 15 to 19 years | 0 (0.0%) | 0 (0.0%) |
| 20 to 34 years | 107 (100.0%) | 0 (0.0%) |
| 35 to 50 years | 79 (100.0%) | 0 (0.0%) |
| Total | 186 (100.0%) | 0 (0.0%) |
Fertility by Education in Huntley
Average fertility rate in Huntley is 37.0 births per 1,000 women. Women with the education attainment of college or associate's degree have the highest fertility rate of 92.0 births per 1,000 women, while women with the education attainment of less than high school have the lowest fertility at 5.0 births per 1,000 women. Women with the education attainment of college or associate's degree represent 67.7% of all women with births.
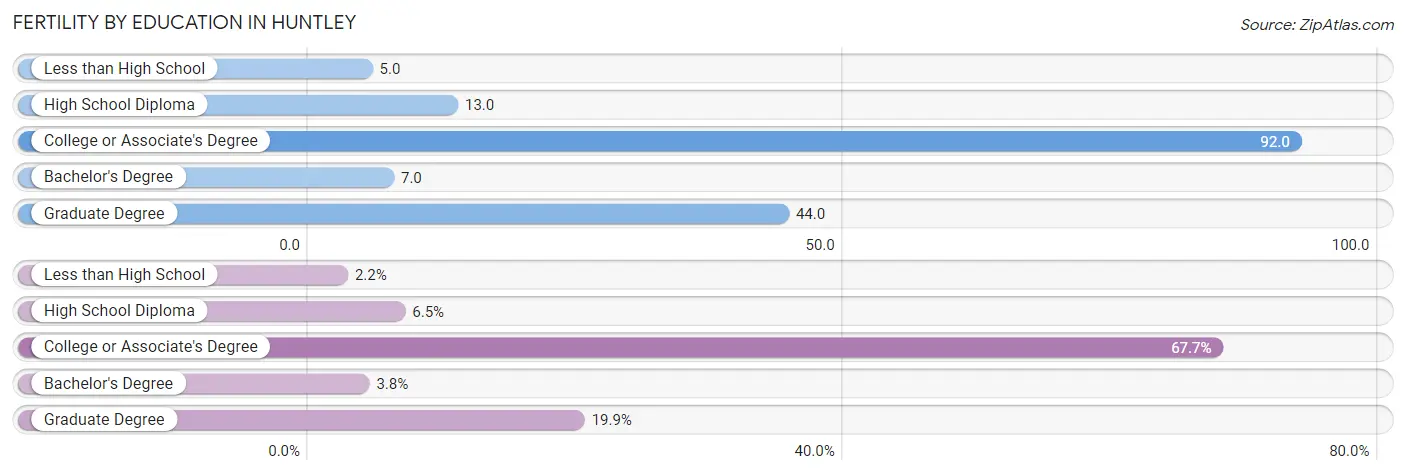
| Educational Attainment | Women with Births | Births / 1,000 Women |
| Less than High School | 4 (2.1%) | 5.0 |
| High School Diploma | 12 (6.5%) | 13.0 |
| College or Associate's Degree | 126 (67.7%) | 92.0 |
| Bachelor's Degree | 7 (3.8%) | 7.0 |
| Graduate Degree | 37 (19.9%) | 44.0 |
| Total | 186 (100.0%) | 37.0 |
Fertility by Education by Marriage Status in Huntley
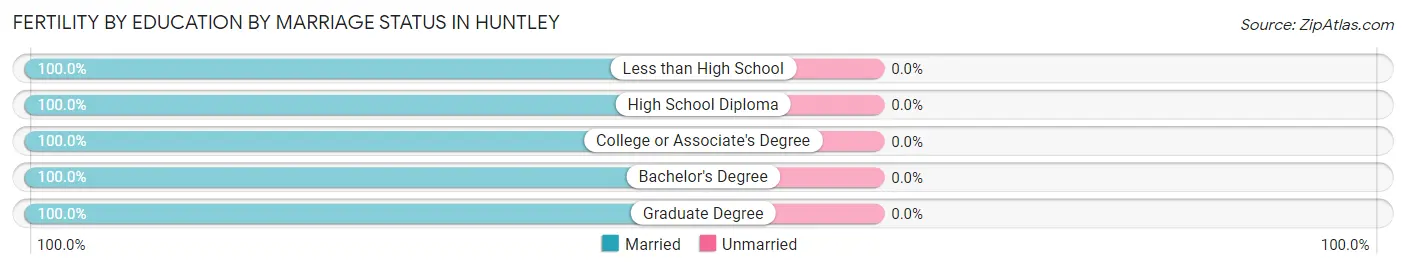
| Educational Attainment | Married | Unmarried |
| Less than High School | 4 (100.0%) | 0 (0.0%) |
| High School Diploma | 12 (100.0%) | 0 (0.0%) |
| College or Associate's Degree | 126 (100.0%) | 0 (0.0%) |
| Bachelor's Degree | 7 (100.0%) | 0 (0.0%) |
| Graduate Degree | 37 (100.0%) | 0 (0.0%) |
| Total | 186 (100.0%) | 0 (0.0%) |
Employment Characteristics in Huntley
Employment by Class of Employer in Huntley
Among the 11,131 employed individuals in Huntley, private company employees (7,761 | 69.7%), local government employees (1,415 | 12.7%), and not-for-profit organizations (737 | 6.6%) make up the most common classes of employment.
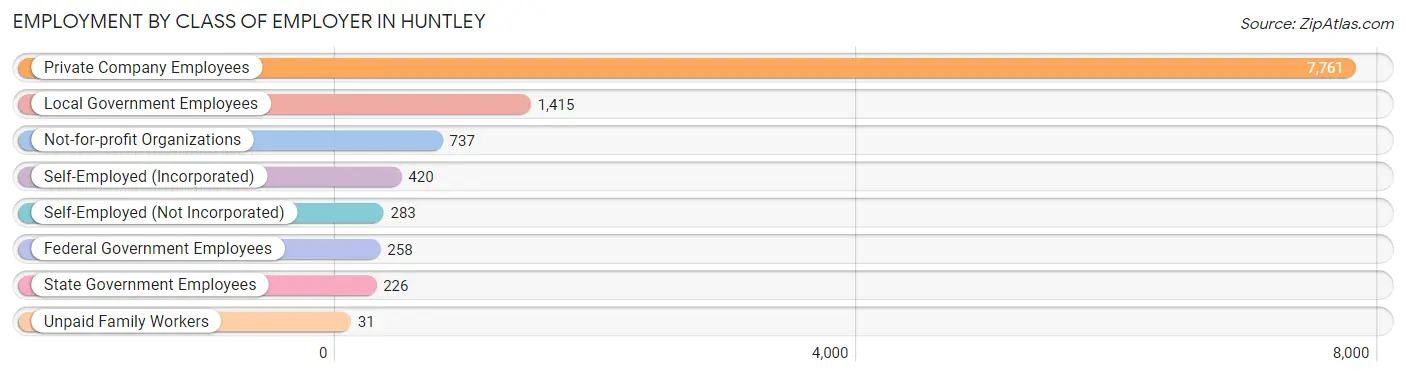
| Employer Class | # Employees | % Employees |
| Private Company Employees | 7,761 | 69.7% |
| Self-Employed (Incorporated) | 420 | 3.8% |
| Self-Employed (Not Incorporated) | 283 | 2.5% |
| Not-for-profit Organizations | 737 | 6.6% |
| Local Government Employees | 1,415 | 12.7% |
| State Government Employees | 226 | 2.0% |
| Federal Government Employees | 258 | 2.3% |
| Unpaid Family Workers | 31 | 0.3% |
| Total | 11,131 | 100.0% |
Employment Status by Age in Huntley
According to the labor force statistics for Huntley, out of the total population over 16 years of age (22,496), 52.2% or 11,743 individuals are in the labor force, with 3.3% or 388 of them unemployed. The age group with the highest labor force participation rate is 25 to 29 years, with 99.0% or 936 individuals in the labor force. Within the labor force, the 16 to 19 years age range has the highest percentage of unemployed individuals, with 14.5% or 96 of them being unemployed.
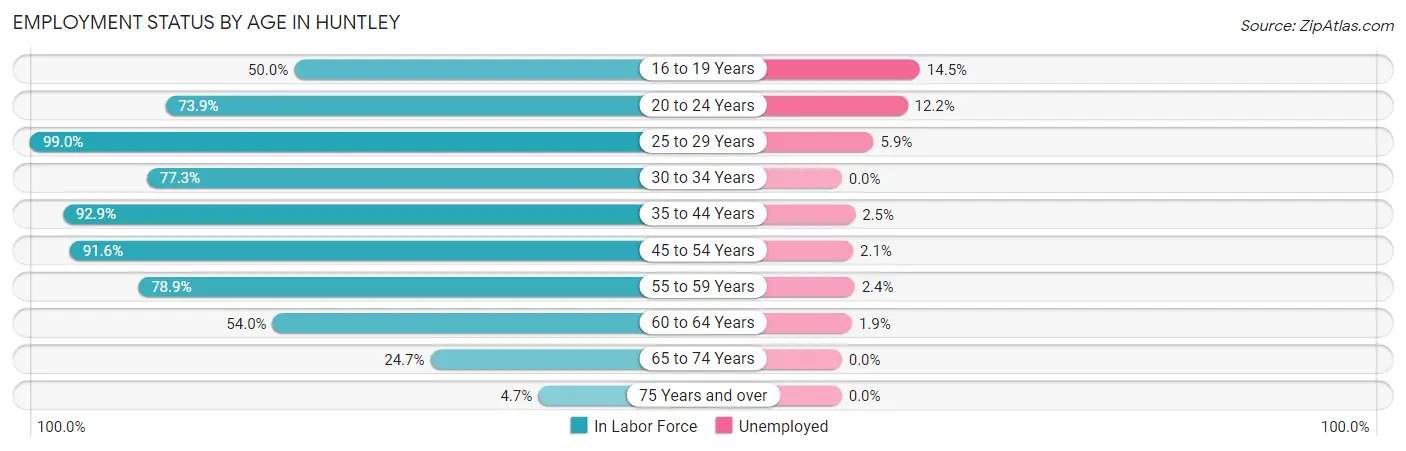
| Age Bracket | In Labor Force | Unemployed |
| 16 to 19 Years | 664 (50.0%) | 96 (14.5%) |
| 20 to 24 Years | 534 (73.9%) | 65 (12.2%) |
| 25 to 29 Years | 936 (99.0%) | 55 (5.9%) |
| 30 to 34 Years | 768 (77.3%) | 0 (0.0%) |
| 35 to 44 Years | 2,860 (92.9%) | 72 (2.5%) |
| 45 to 54 Years | 3,096 (91.6%) | 65 (2.1%) |
| 55 to 59 Years | 1,034 (78.9%) | 25 (2.4%) |
| 60 to 64 Years | 638 (54.0%) | 12 (1.9%) |
| 65 to 74 Years | 945 (24.7%) | 0 (0.0%) |
| 75 Years and over | 269 (4.7%) | 0 (0.0%) |
| Total | 11,743 (52.2%) | 388 (3.3%) |
Employment Status by Educational Attainment in Huntley
According to labor force statistics for Huntley, 85.7% of individuals (9,333) out of the total population between 25 and 64 years of age (10,890) are in the labor force, with 2.5% or 233 of them being unemployed. The group with the highest labor force participation rate are those with the educational attainment of bachelor's degree or higher, with 90.5% or 4,462 individuals in the labor force. Within the labor force, individuals with less than high school education have the highest percentage of unemployment, with 4.5% or 14 of them being unemployed.
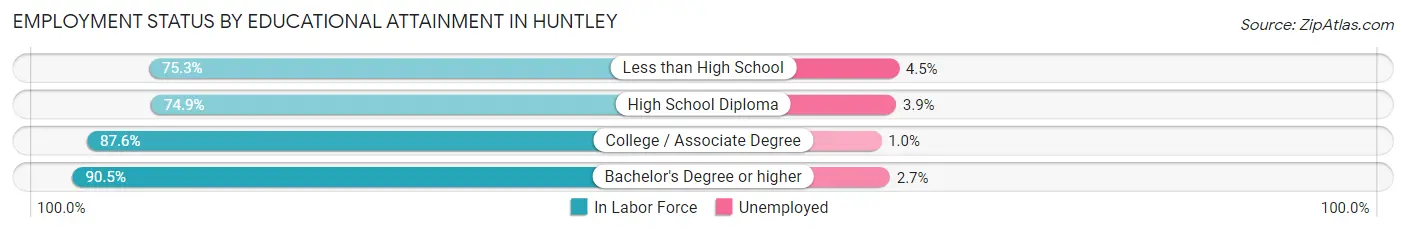
| Educational Attainment | In Labor Force | Unemployed |
| Less than High School | 314 (75.3%) | 19 (4.5%) |
| High School Diploma | 1,752 (74.9%) | 91 (3.9%) |
| College / Associate Degree | 2,807 (87.6%) | 32 (1.0%) |
| Bachelor's Degree or higher | 4,462 (90.5%) | 133 (2.7%) |
| Total | 9,333 (85.7%) | 272 (2.5%) |
Employment Occupations by Sex in Huntley
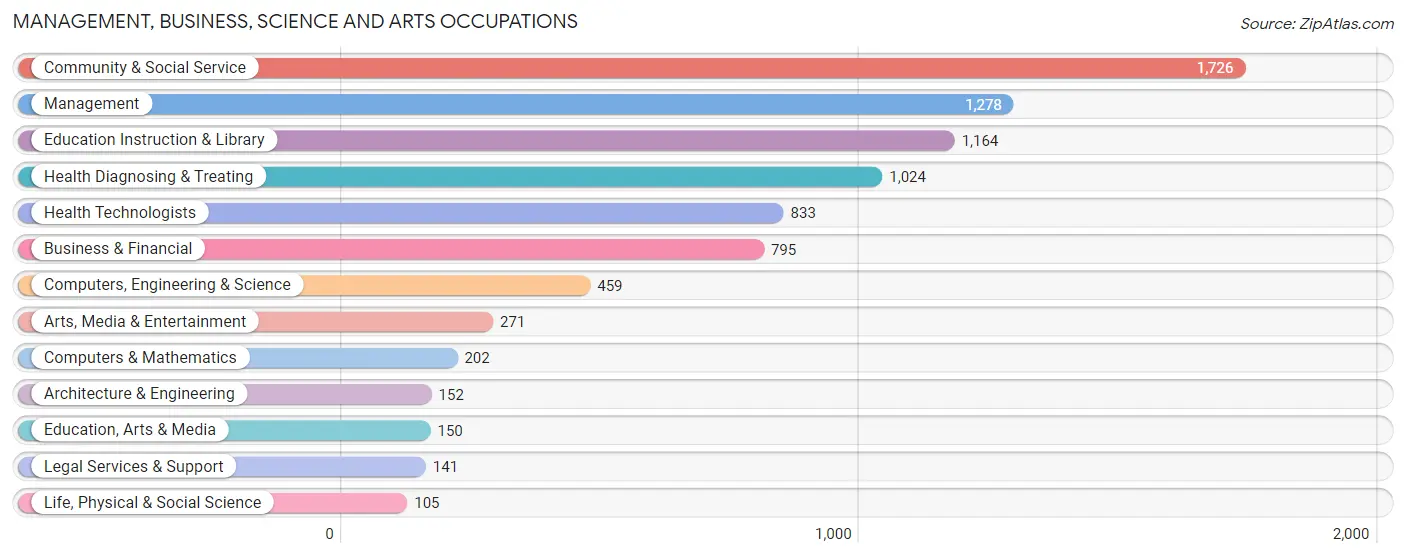
Management, Business, Science and Arts Occupations
The most common Management, Business, Science and Arts occupations in Huntley are Community & Social Service (1,726 | 15.2%), Management (1,278 | 11.3%), Education Instruction & Library (1,164 | 10.2%), Health Diagnosing & Treating (1,024 | 9.0%), and Health Technologists (833 | 7.3%).
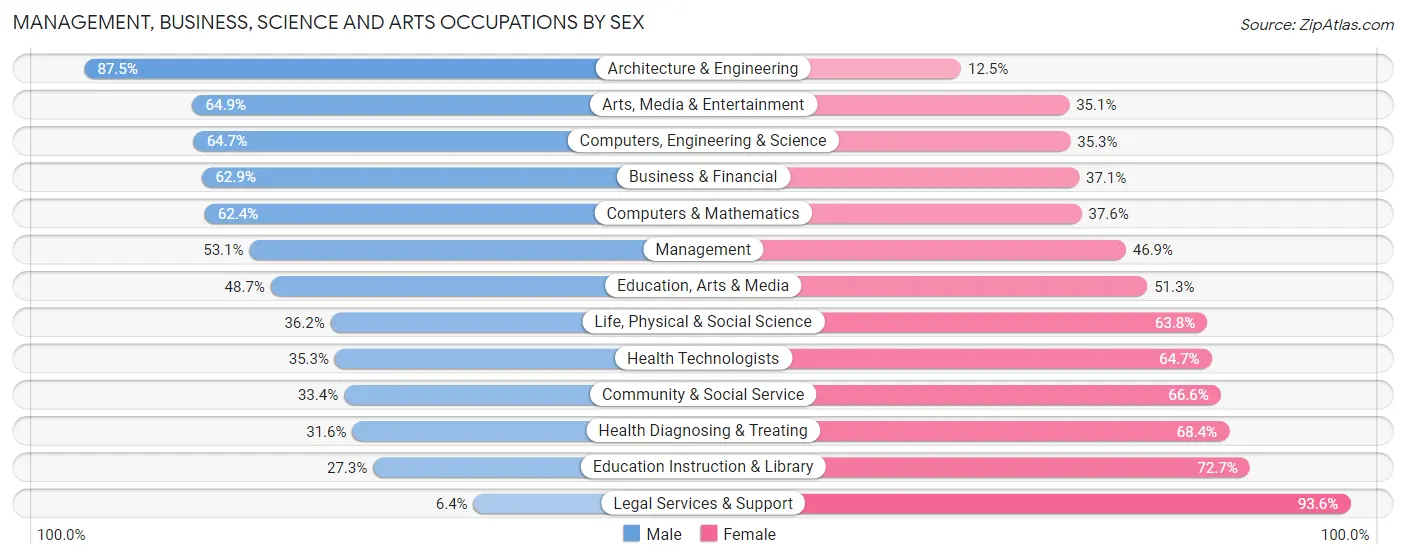
Management, Business, Science and Arts Occupations by Sex
Within the Management, Business, Science and Arts occupations in Huntley, the most male-oriented occupations are Architecture & Engineering (87.5%), Arts, Media & Entertainment (64.9%), and Computers, Engineering & Science (64.7%), while the most female-oriented occupations are Legal Services & Support (93.6%), Education Instruction & Library (72.7%), and Health Diagnosing & Treating (68.4%).
| Occupation | Male | Female |
| Management | 679 (53.1%) | 599 (46.9%) |
| Business & Financial | 500 (62.9%) | 295 (37.1%) |
| Computers, Engineering & Science | 297 (64.7%) | 162 (35.3%) |
| Computers & Mathematics | 126 (62.4%) | 76 (37.6%) |
| Architecture & Engineering | 133 (87.5%) | 19 (12.5%) |
| Life, Physical & Social Science | 38 (36.2%) | 67 (63.8%) |
| Community & Social Service | 576 (33.4%) | 1,150 (66.6%) |
| Education, Arts & Media | 73 (48.7%) | 77 (51.3%) |
| Legal Services & Support | 9 (6.4%) | 132 (93.6%) |
| Education Instruction & Library | 318 (27.3%) | 846 (72.7%) |
| Arts, Media & Entertainment | 176 (64.9%) | 95 (35.1%) |
| Health Diagnosing & Treating | 324 (31.6%) | 700 (68.4%) |
| Health Technologists | 294 (35.3%) | 539 (64.7%) |
| Total (Category) | 2,376 (45.0%) | 2,906 (55.0%) |
| Total (Overall) | 5,992 (52.8%) | 5,363 (47.2%) |
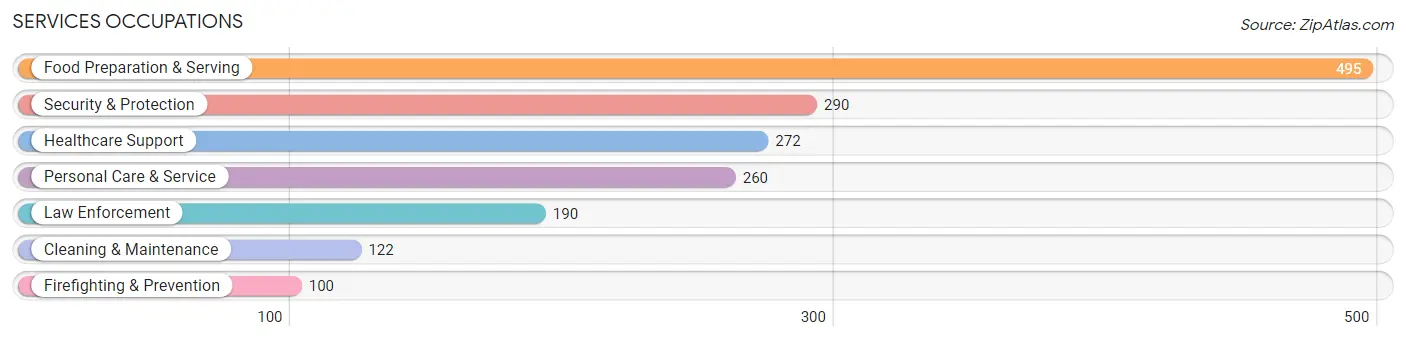
Services Occupations
The most common Services occupations in Huntley are Food Preparation & Serving (495 | 4.4%), Security & Protection (290 | 2.5%), Healthcare Support (272 | 2.4%), Personal Care & Service (260 | 2.3%), and Law Enforcement (190 | 1.7%).
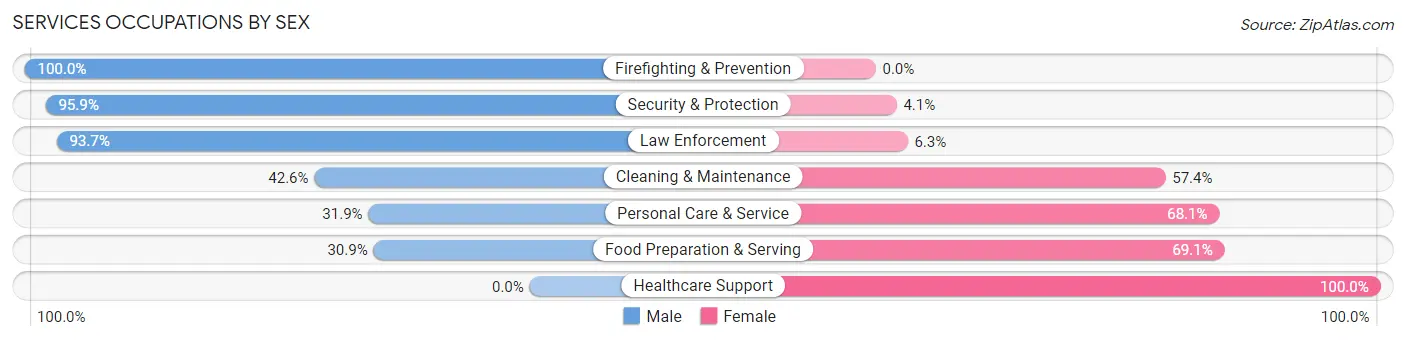
Services Occupations by Sex
Within the Services occupations in Huntley, the most male-oriented occupations are Firefighting & Prevention (100.0%), Security & Protection (95.9%), and Law Enforcement (93.7%), while the most female-oriented occupations are Healthcare Support (100.0%), Food Preparation & Serving (69.1%), and Personal Care & Service (68.1%).
| Occupation | Male | Female |
| Healthcare Support | 0 (0.0%) | 272 (100.0%) |
| Security & Protection | 278 (95.9%) | 12 (4.1%) |
| Firefighting & Prevention | 100 (100.0%) | 0 (0.0%) |
| Law Enforcement | 178 (93.7%) | 12 (6.3%) |
| Food Preparation & Serving | 153 (30.9%) | 342 (69.1%) |
| Cleaning & Maintenance | 52 (42.6%) | 70 (57.4%) |
| Personal Care & Service | 83 (31.9%) | 177 (68.1%) |
| Total (Category) | 566 (39.3%) | 873 (60.7%) |
| Total (Overall) | 5,992 (52.8%) | 5,363 (47.2%) |
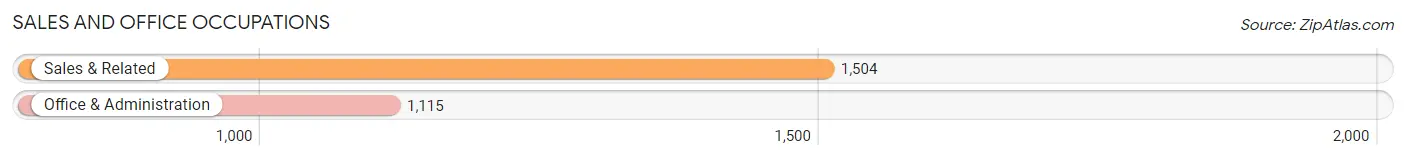
Sales and Office Occupations
The most common Sales and Office occupations in Huntley are Sales & Related (1,504 | 13.3%), and Office & Administration (1,115 | 9.8%).
Sales and Office Occupations by Sex
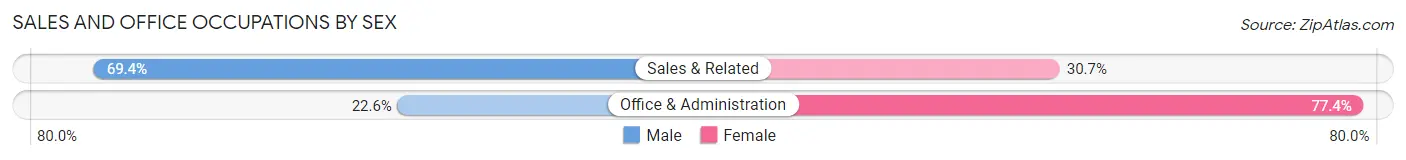
| Occupation | Male | Female |
| Sales & Related | 1,043 (69.4%) | 461 (30.6%) |
| Office & Administration | 252 (22.6%) | 863 (77.4%) |
| Total (Category) | 1,295 (49.4%) | 1,324 (50.5%) |
| Total (Overall) | 5,992 (52.8%) | 5,363 (47.2%) |
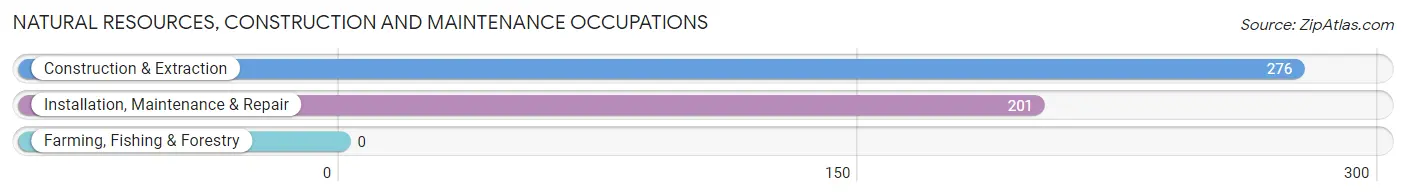
Natural Resources, Construction and Maintenance Occupations
The most common Natural Resources, Construction and Maintenance occupations in Huntley are Construction & Extraction (276 | 2.4%), and Installation, Maintenance & Repair (201 | 1.8%).
Natural Resources, Construction and Maintenance Occupations by Sex
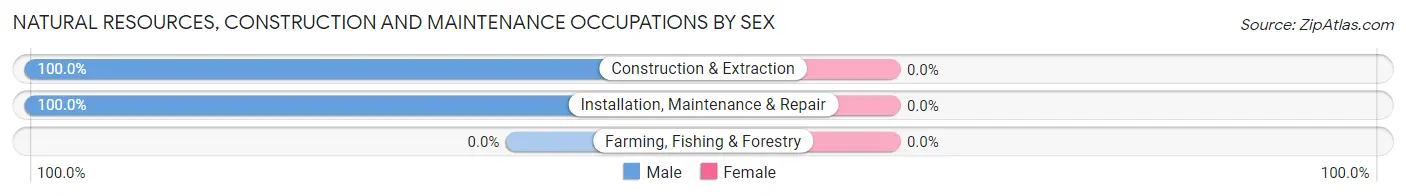
| Occupation | Male | Female |
| Farming, Fishing & Forestry | 0 (0.0%) | 0 (0.0%) |
| Construction & Extraction | 276 (100.0%) | 0 (0.0%) |
| Installation, Maintenance & Repair | 201 (100.0%) | 0 (0.0%) |
| Total (Category) | 477 (100.0%) | 0 (0.0%) |
| Total (Overall) | 5,992 (52.8%) | 5,363 (47.2%) |
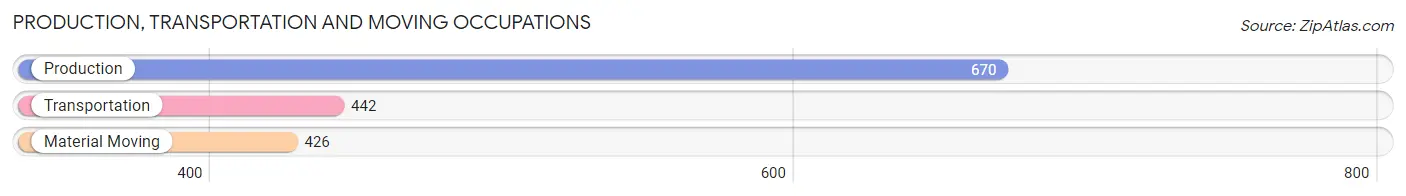
Production, Transportation and Moving Occupations
The most common Production, Transportation and Moving occupations in Huntley are Production (670 | 5.9%), Transportation (442 | 3.9%), and Material Moving (426 | 3.7%).
Production, Transportation and Moving Occupations by Sex
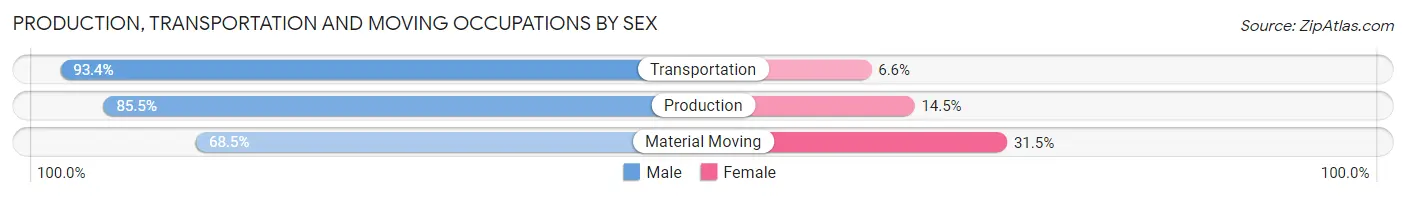
| Occupation | Male | Female |
| Production | 573 (85.5%) | 97 (14.5%) |
| Transportation | 413 (93.4%) | 29 (6.6%) |
| Material Moving | 292 (68.5%) | 134 (31.5%) |
| Total (Category) | 1,278 (83.1%) | 260 (16.9%) |
| Total (Overall) | 5,992 (52.8%) | 5,363 (47.2%) |
Employment Industries by Sex in Huntley
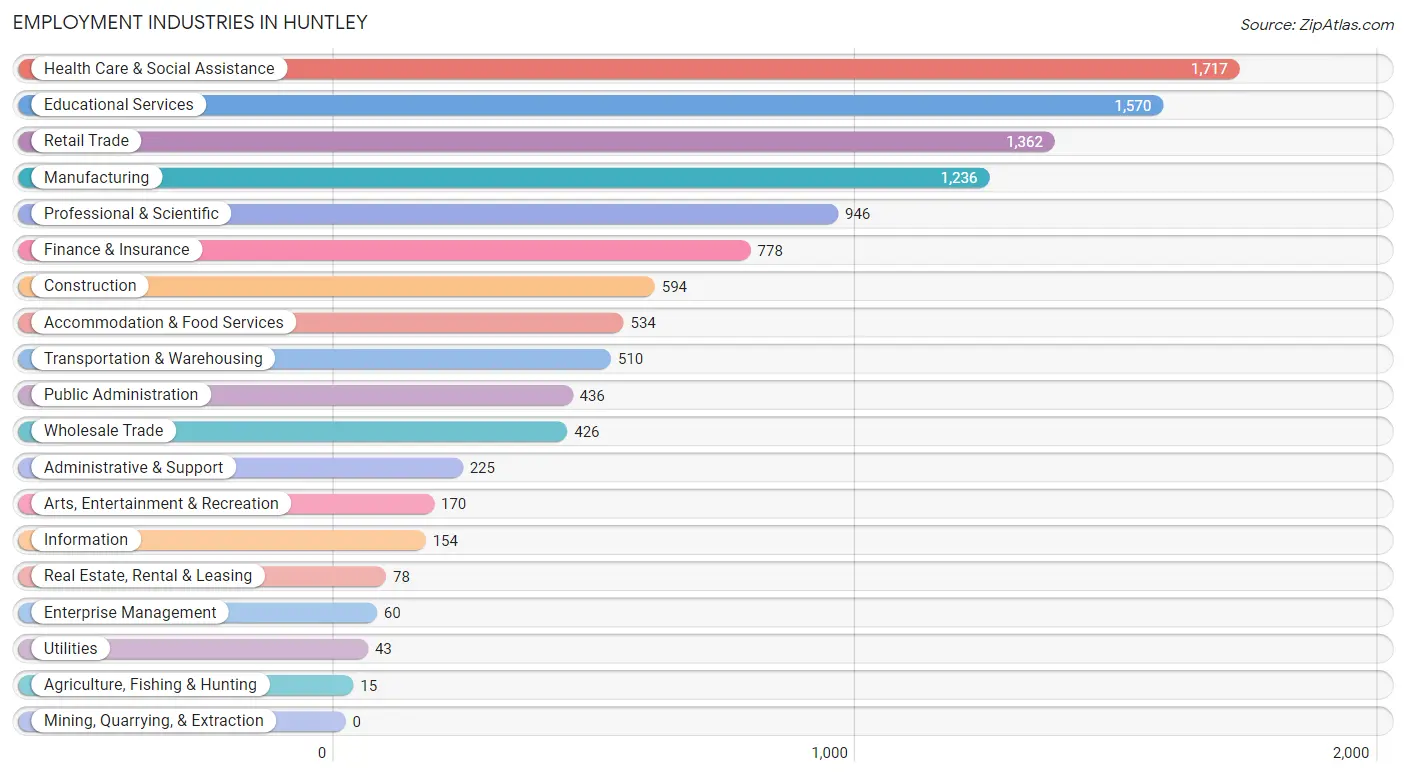
Employment Industries in Huntley
The major employment industries in Huntley include Health Care & Social Assistance (1,717 | 15.1%), Educational Services (1,570 | 13.8%), Retail Trade (1,362 | 12.0%), Manufacturing (1,236 | 10.9%), and Professional & Scientific (946 | 8.3%).
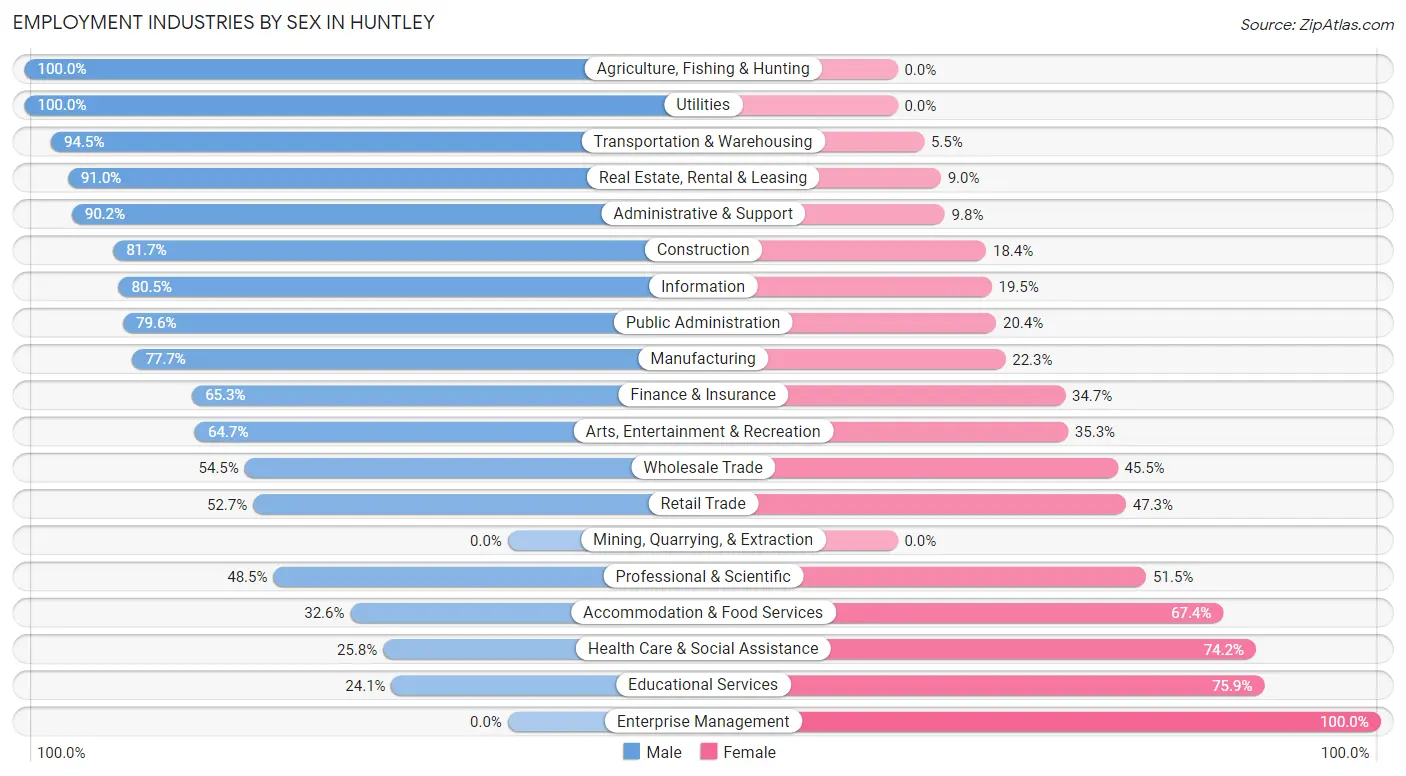
Employment Industries by Sex in Huntley
The Huntley industries that see more men than women are Agriculture, Fishing & Hunting (100.0%), Utilities (100.0%), and Transportation & Warehousing (94.5%), whereas the industries that tend to have a higher number of women are Enterprise Management (100.0%), Educational Services (75.9%), and Health Care & Social Assistance (74.2%).
| Industry | Male | Female |
| Agriculture, Fishing & Hunting | 15 (100.0%) | 0 (0.0%) |
| Mining, Quarrying, & Extraction | 0 (0.0%) | 0 (0.0%) |
| Construction | 485 (81.7%) | 109 (18.3%) |
| Manufacturing | 960 (77.7%) | 276 (22.3%) |
| Wholesale Trade | 232 (54.5%) | 194 (45.5%) |
| Retail Trade | 718 (52.7%) | 644 (47.3%) |
| Transportation & Warehousing | 482 (94.5%) | 28 (5.5%) |
| Utilities | 43 (100.0%) | 0 (0.0%) |
| Information | 124 (80.5%) | 30 (19.5%) |
| Finance & Insurance | 508 (65.3%) | 270 (34.7%) |
| Real Estate, Rental & Leasing | 71 (91.0%) | 7 (9.0%) |
| Professional & Scientific | 459 (48.5%) | 487 (51.5%) |
| Enterprise Management | 0 (0.0%) | 60 (100.0%) |
| Administrative & Support | 203 (90.2%) | 22 (9.8%) |
| Educational Services | 378 (24.1%) | 1,192 (75.9%) |
| Health Care & Social Assistance | 443 (25.8%) | 1,274 (74.2%) |
| Arts, Entertainment & Recreation | 110 (64.7%) | 60 (35.3%) |
| Accommodation & Food Services | 174 (32.6%) | 360 (67.4%) |
| Public Administration | 347 (79.6%) | 89 (20.4%) |
| Total | 5,992 (52.8%) | 5,363 (47.2%) |
Education in Huntley
School Enrollment in Huntley
The most common levels of schooling among the 5,885 students in Huntley are high school (1,489 | 25.3%), elementary school (1,381 | 23.5%), and middle school (1,190 | 20.2%).
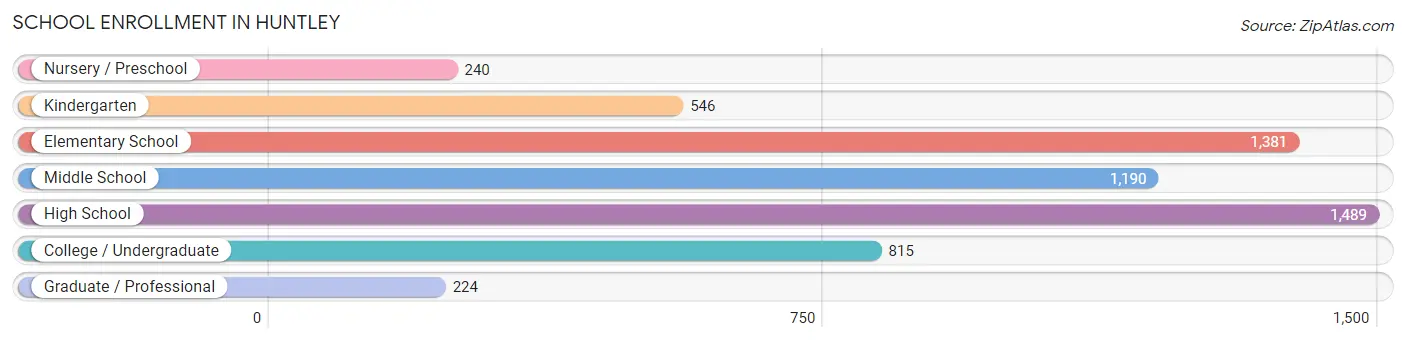
| School Level | # Students | % Students |
| Nursery / Preschool | 240 | 4.1% |
| Kindergarten | 546 | 9.3% |
| Elementary School | 1,381 | 23.5% |
| Middle School | 1,190 | 20.2% |
| High School | 1,489 | 25.3% |
| College / Undergraduate | 815 | 13.9% |
| Graduate / Professional | 224 | 3.8% |
| Total | 5,885 | 100.0% |
School Enrollment by Age by Funding Source in Huntley
Out of a total of 5,885 students who are enrolled in schools in Huntley, 524 (8.9%) attend a private institution, while the remaining 5,361 (91.1%) are enrolled in public schools. The age group of 25 to 34 year olds has the highest likelihood of being enrolled in private schools, with 53 (50.5% in the age bracket) enrolled. Conversely, the age group of 15 to 17 year olds has the lowest likelihood of being enrolled in a private school, with 1,264 (98.4% in the age bracket) attending a public institution.
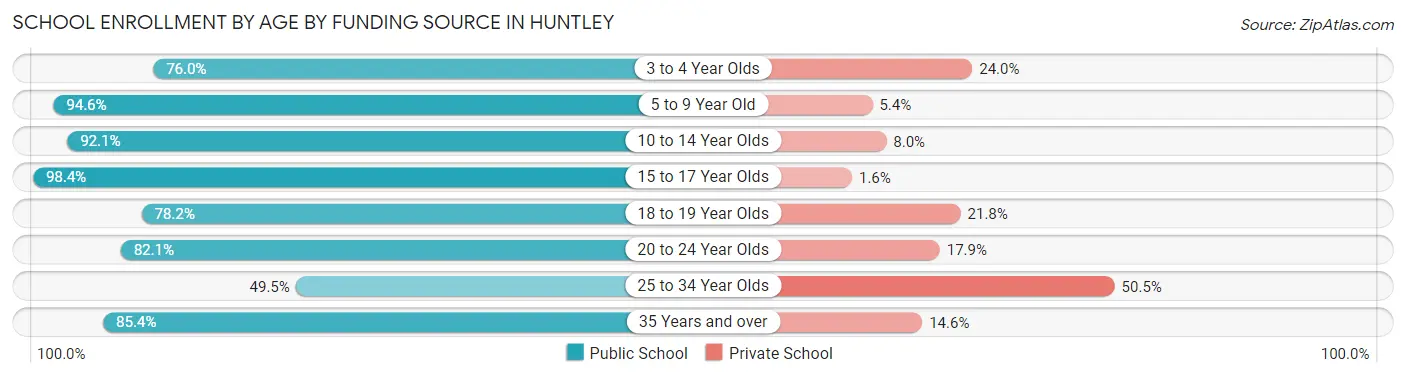
| Age Bracket | Public School | Private School |
| 3 to 4 Year Olds | 146 (76.0%) | 46 (24.0%) |
| 5 to 9 Year Old | 1,785 (94.6%) | 101 (5.4%) |
| 10 to 14 Year Olds | 1,262 (92.0%) | 109 (8.0%) |
| 15 to 17 Year Olds | 1,264 (98.4%) | 20 (1.6%) |
| 18 to 19 Year Olds | 334 (78.2%) | 93 (21.8%) |
| 20 to 24 Year Olds | 307 (82.1%) | 67 (17.9%) |
| 25 to 34 Year Olds | 52 (49.5%) | 53 (50.5%) |
| 35 Years and over | 210 (85.4%) | 36 (14.6%) |
| Total | 5,361 (91.1%) | 524 (8.9%) |
Educational Attainment by Field of Study in Huntley
Education (1,748 | 20.4%), business (1,715 | 20.1%), science & technology (727 | 8.5%), literature & languages (648 | 7.6%), and arts & humanities (502 | 5.9%) are the most common fields of study among 8,551 individuals in Huntley who have obtained a bachelor's degree or higher.
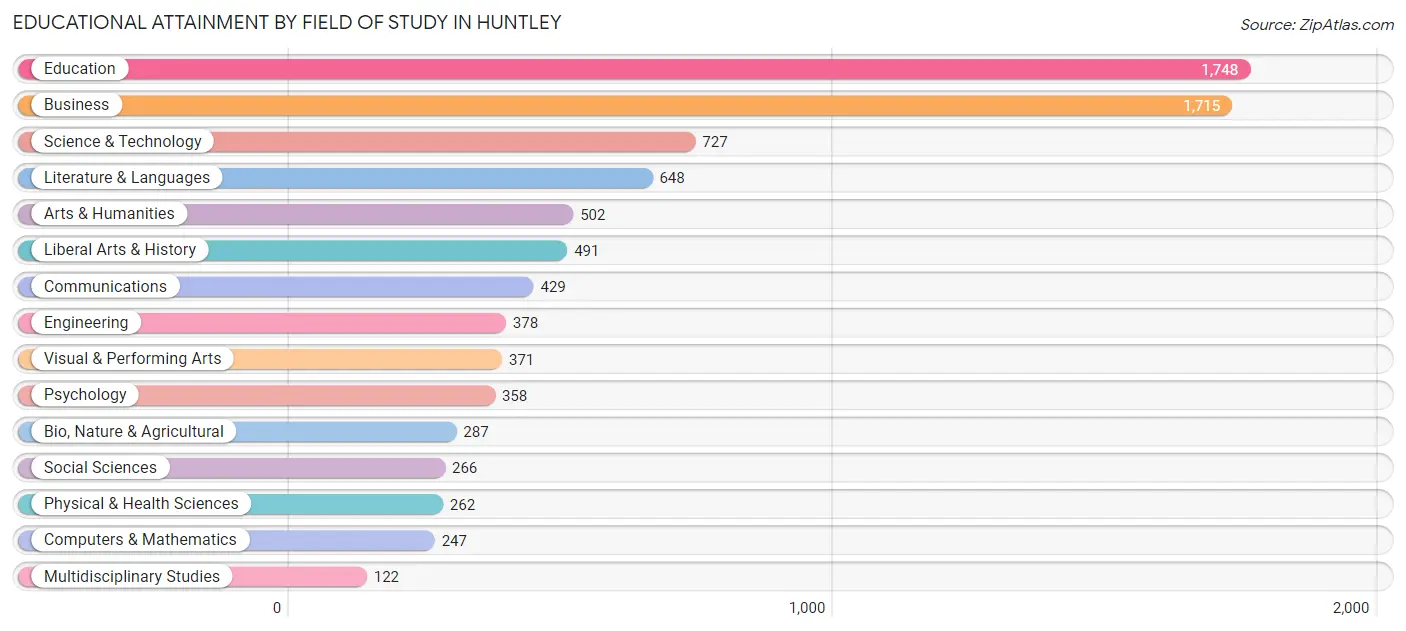
| Field of Study | # Graduates | % Graduates |
| Computers & Mathematics | 247 | 2.9% |
| Bio, Nature & Agricultural | 287 | 3.4% |
| Physical & Health Sciences | 262 | 3.1% |
| Psychology | 358 | 4.2% |
| Social Sciences | 266 | 3.1% |
| Engineering | 378 | 4.4% |
| Multidisciplinary Studies | 122 | 1.4% |
| Science & Technology | 727 | 8.5% |
| Business | 1,715 | 20.1% |
| Education | 1,748 | 20.4% |
| Literature & Languages | 648 | 7.6% |
| Liberal Arts & History | 491 | 5.7% |
| Visual & Performing Arts | 371 | 4.3% |
| Communications | 429 | 5.0% |
| Arts & Humanities | 502 | 5.9% |
| Total | 8,551 | 100.0% |
Transportation & Commute in Huntley
Vehicle Availability by Sex in Huntley
The most prevalent vehicle ownership categories in Huntley are males with 2 vehicles (2,760, accounting for 46.8%) and females with 2 vehicles (2,214, making up 52.8%).
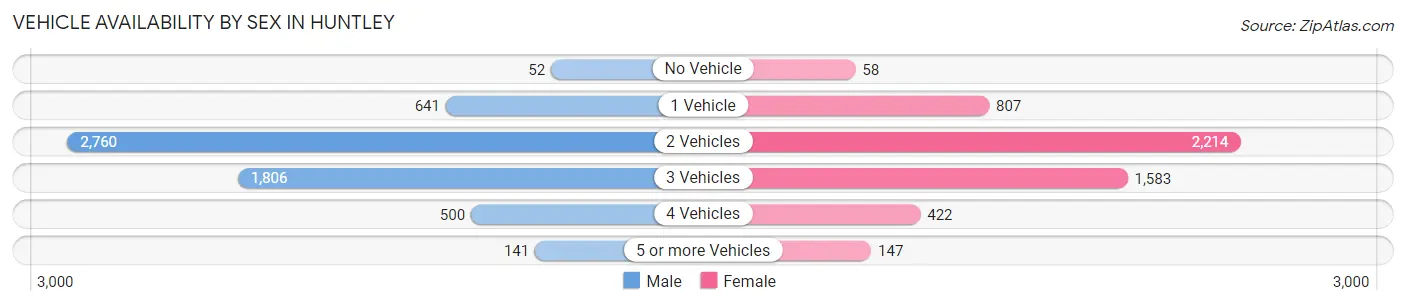
| Vehicles Available | Male | Female |
| No Vehicle | 52 (0.9%) | 58 (1.1%) |
| 1 Vehicle | 641 (10.9%) | 807 (15.4%) |
| 2 Vehicles | 2,760 (46.8%) | 2,214 (42.3%) |
| 3 Vehicles | 1,806 (30.6%) | 1,583 (30.3%) |
| 4 Vehicles | 500 (8.5%) | 422 (8.1%) |
| 5 or more Vehicles | 141 (2.4%) | 147 (2.8%) |
| Total | 5,900 (100.0%) | 5,231 (100.0%) |
Commute Time in Huntley
The most frequently occuring commute durations in Huntley are 45 to 59 minutes (1,298 commuters, 13.7%), 15 to 19 minutes (1,292 commuters, 13.6%), and 25 to 29 minutes (1,170 commuters, 12.3%).
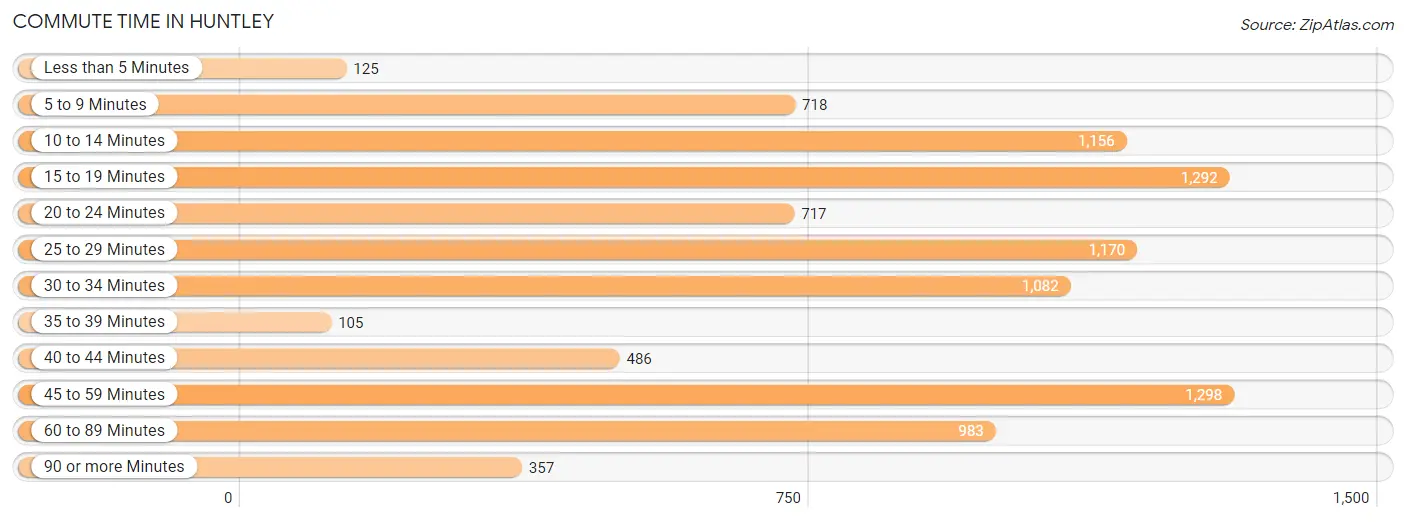
| Commute Time | # Commuters | % Commuters |
| Less than 5 Minutes | 125 | 1.3% |
| 5 to 9 Minutes | 718 | 7.6% |
| 10 to 14 Minutes | 1,156 | 12.2% |
| 15 to 19 Minutes | 1,292 | 13.6% |
| 20 to 24 Minutes | 717 | 7.6% |
| 25 to 29 Minutes | 1,170 | 12.3% |
| 30 to 34 Minutes | 1,082 | 11.4% |
| 35 to 39 Minutes | 105 | 1.1% |
| 40 to 44 Minutes | 486 | 5.1% |
| 45 to 59 Minutes | 1,298 | 13.7% |
| 60 to 89 Minutes | 983 | 10.4% |
| 90 or more Minutes | 357 | 3.8% |
Commute Time by Sex in Huntley
The most common commute times in Huntley are 45 to 59 minutes (966 commuters, 18.8%) for males and 25 to 29 minutes (779 commuters, 17.9%) for females.
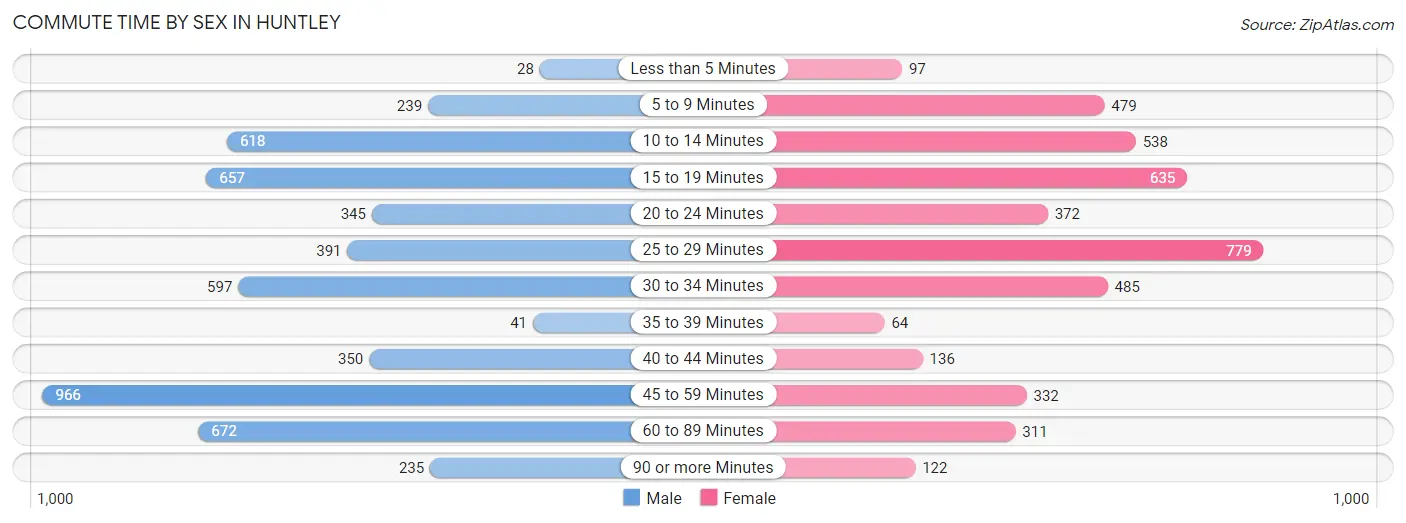
| Commute Time | Male | Female |
| Less than 5 Minutes | 28 (0.5%) | 97 (2.2%) |
| 5 to 9 Minutes | 239 (4.6%) | 479 (11.0%) |
| 10 to 14 Minutes | 618 (12.0%) | 538 (12.4%) |
| 15 to 19 Minutes | 657 (12.8%) | 635 (14.6%) |
| 20 to 24 Minutes | 345 (6.7%) | 372 (8.6%) |
| 25 to 29 Minutes | 391 (7.6%) | 779 (17.9%) |
| 30 to 34 Minutes | 597 (11.6%) | 485 (11.2%) |
| 35 to 39 Minutes | 41 (0.8%) | 64 (1.5%) |
| 40 to 44 Minutes | 350 (6.8%) | 136 (3.1%) |
| 45 to 59 Minutes | 966 (18.8%) | 332 (7.6%) |
| 60 to 89 Minutes | 672 (13.1%) | 311 (7.1%) |
| 90 or more Minutes | 235 (4.6%) | 122 (2.8%) |
Time of Departure to Work by Sex in Huntley
The most frequent times of departure to work in Huntley are 6:00 AM to 6:29 AM (599, 11.7%) for males and 7:00 AM to 7:29 AM (916, 21.1%) for females.
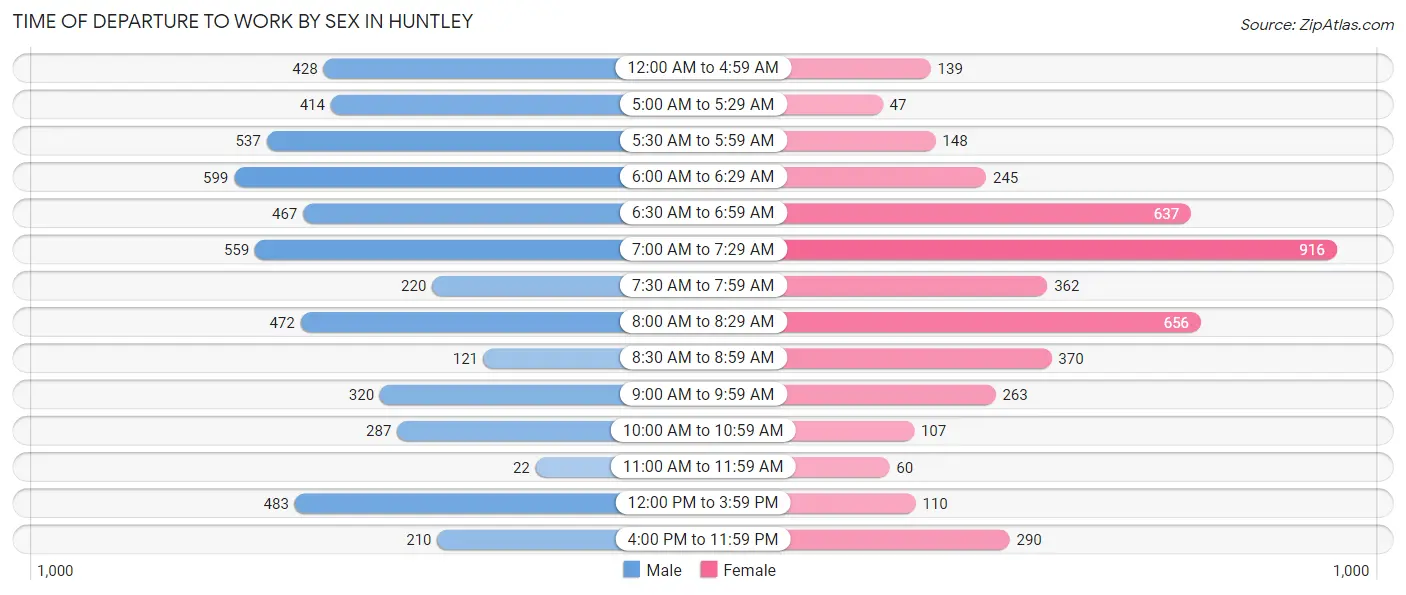
| Time of Departure | Male | Female |
| 12:00 AM to 4:59 AM | 428 (8.3%) | 139 (3.2%) |
| 5:00 AM to 5:29 AM | 414 (8.1%) | 47 (1.1%) |
| 5:30 AM to 5:59 AM | 537 (10.4%) | 148 (3.4%) |
| 6:00 AM to 6:29 AM | 599 (11.7%) | 245 (5.6%) |
| 6:30 AM to 6:59 AM | 467 (9.1%) | 637 (14.6%) |
| 7:00 AM to 7:29 AM | 559 (10.9%) | 916 (21.1%) |
| 7:30 AM to 7:59 AM | 220 (4.3%) | 362 (8.3%) |
| 8:00 AM to 8:29 AM | 472 (9.2%) | 656 (15.1%) |
| 8:30 AM to 8:59 AM | 121 (2.4%) | 370 (8.5%) |
| 9:00 AM to 9:59 AM | 320 (6.2%) | 263 (6.0%) |
| 10:00 AM to 10:59 AM | 287 (5.6%) | 107 (2.5%) |
| 11:00 AM to 11:59 AM | 22 (0.4%) | 60 (1.4%) |
| 12:00 PM to 3:59 PM | 483 (9.4%) | 110 (2.5%) |
| 4:00 PM to 11:59 PM | 210 (4.1%) | 290 (6.7%) |
| Total | 5,139 (100.0%) | 4,350 (100.0%) |
Housing Occupancy in Huntley
Occupancy by Ownership in Huntley
Of the total 12,128 dwellings in Huntley, owner-occupied units account for 10,841 (89.4%), while renter-occupied units make up 1,287 (10.6%).
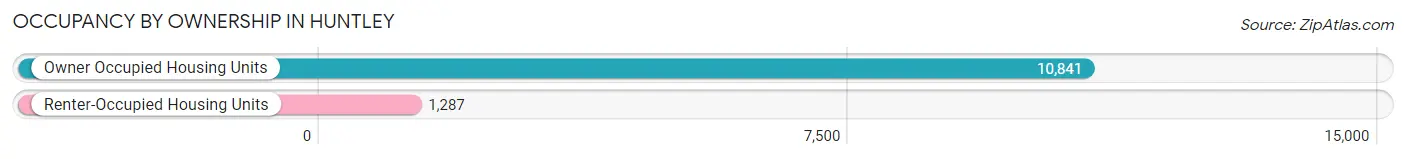
| Occupancy | # Housing Units | % Housing Units |
| Owner Occupied Housing Units | 10,841 | 89.4% |
| Renter-Occupied Housing Units | 1,287 | 10.6% |
| Total Occupied Housing Units | 12,128 | 100.0% |
Occupancy by Household Size in Huntley
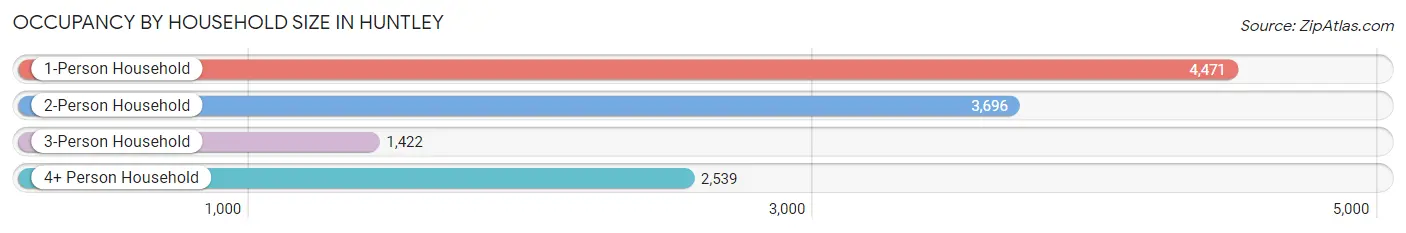
| Household Size | # Housing Units | % Housing Units |
| 1-Person Household | 4,471 | 36.9% |
| 2-Person Household | 3,696 | 30.5% |
| 3-Person Household | 1,422 | 11.7% |
| 4+ Person Household | 2,539 | 20.9% |
| Total Housing Units | 12,128 | 100.0% |
Occupancy by Ownership by Household Size in Huntley
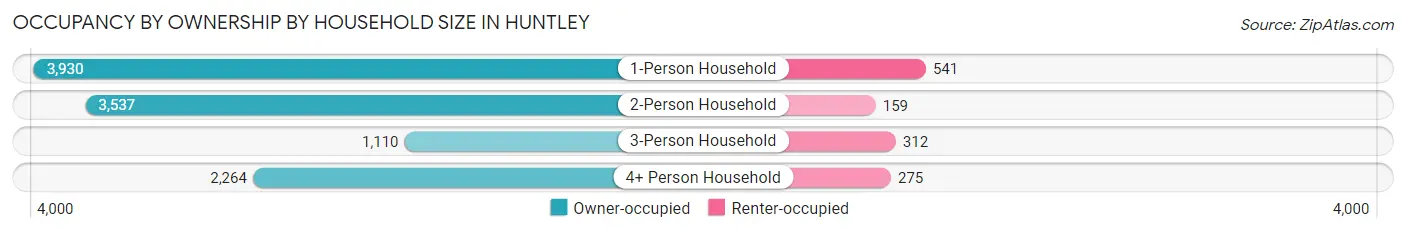
| Household Size | Owner-occupied | Renter-occupied |
| 1-Person Household | 3,930 (87.9%) | 541 (12.1%) |
| 2-Person Household | 3,537 (95.7%) | 159 (4.3%) |
| 3-Person Household | 1,110 (78.1%) | 312 (21.9%) |
| 4+ Person Household | 2,264 (89.2%) | 275 (10.8%) |
| Total Housing Units | 10,841 (89.4%) | 1,287 (10.6%) |
Occupancy by Educational Attainment in Huntley
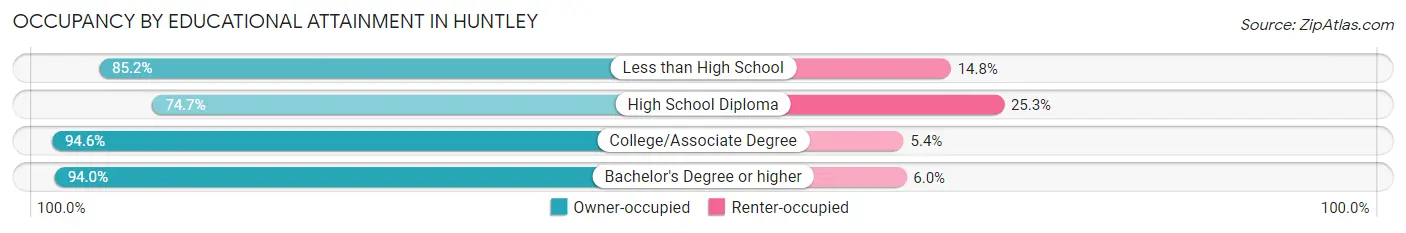
| Household Size | Owner-occupied | Renter-occupied |
| Less than High School | 392 (85.2%) | 68 (14.8%) |
| High School Diploma | 2,096 (74.7%) | 711 (25.3%) |
| College/Associate Degree | 3,759 (94.6%) | 216 (5.4%) |
| Bachelor's Degree or higher | 4,594 (94.0%) | 292 (6.0%) |
Occupancy by Age of Householder in Huntley
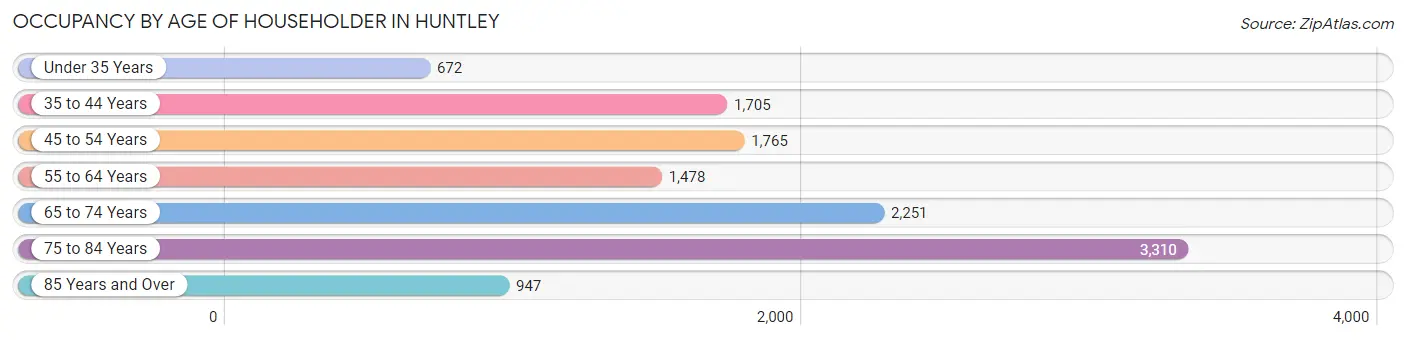
| Age Bracket | # Households | % Households |
| Under 35 Years | 672 | 5.5% |
| 35 to 44 Years | 1,705 | 14.1% |
| 45 to 54 Years | 1,765 | 14.5% |
| 55 to 64 Years | 1,478 | 12.2% |
| 65 to 74 Years | 2,251 | 18.6% |
| 75 to 84 Years | 3,310 | 27.3% |
| 85 Years and Over | 947 | 7.8% |
| Total | 12,128 | 100.0% |
Housing Finances in Huntley
Median Income by Occupancy in Huntley
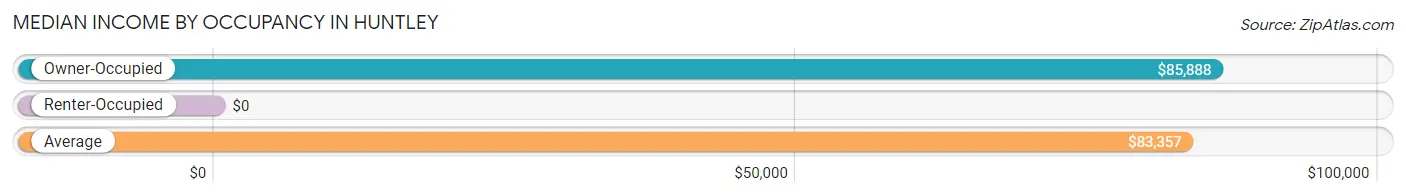
| Occupancy Type | # Households | Median Income |
| Owner-Occupied | 10,841 (89.4%) | $85,888 |
| Renter-Occupied | 1,287 (10.6%) | $0 |
| Average | 12,128 (100.0%) | $83,357 |
Occupancy by Householder Income Bracket in Huntley
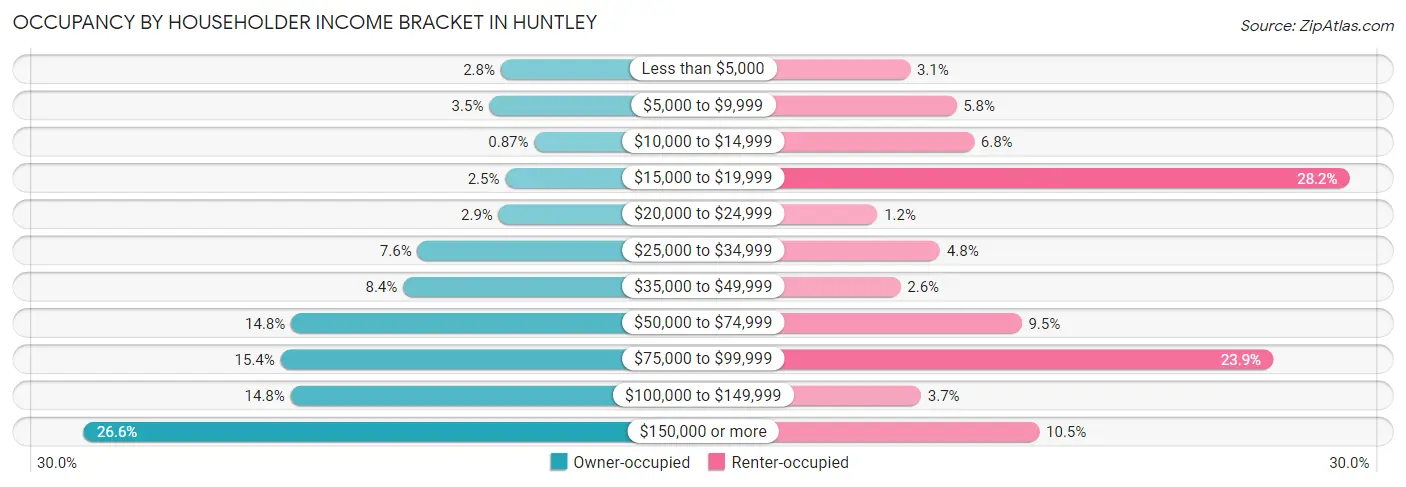
| Income Bracket | Owner-occupied | Renter-occupied |
| Less than $5,000 | 302 (2.8%) | 40 (3.1%) |
| $5,000 to $9,999 | 374 (3.5%) | 74 (5.8%) |
| $10,000 to $14,999 | 94 (0.9%) | 87 (6.8%) |
| $15,000 to $19,999 | 274 (2.5%) | 363 (28.2%) |
| $20,000 to $24,999 | 315 (2.9%) | 16 (1.2%) |
| $25,000 to $34,999 | 818 (7.5%) | 62 (4.8%) |
| $35,000 to $49,999 | 907 (8.4%) | 33 (2.6%) |
| $50,000 to $74,999 | 1,601 (14.8%) | 122 (9.5%) |
| $75,000 to $99,999 | 1,666 (15.4%) | 307 (23.8%) |
| $100,000 to $149,999 | 1,605 (14.8%) | 48 (3.7%) |
| $150,000 or more | 2,885 (26.6%) | 135 (10.5%) |
| Total | 10,841 (100.0%) | 1,287 (100.0%) |
Monthly Housing Cost Tiers in Huntley
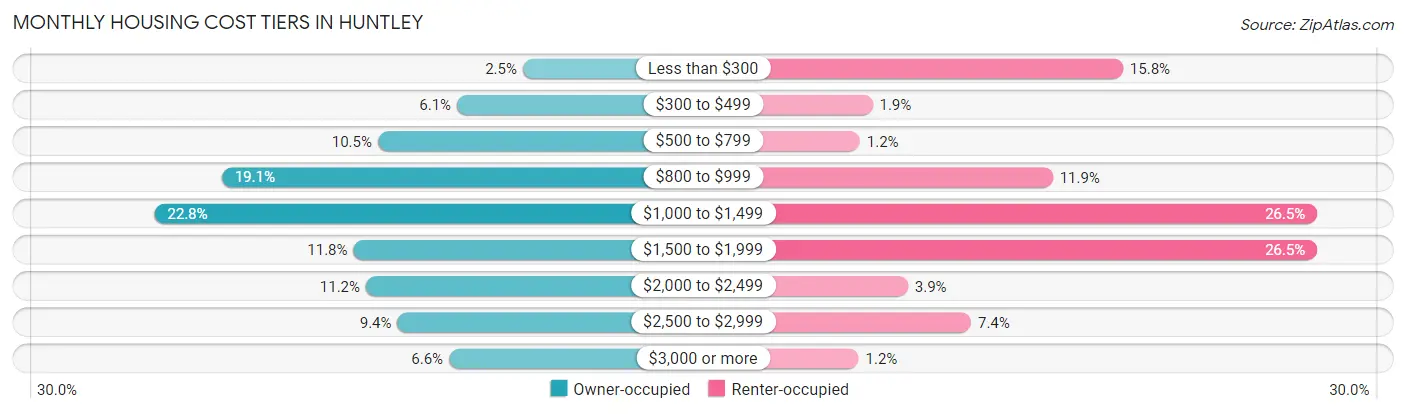
| Monthly Cost | Owner-occupied | Renter-occupied |
| Less than $300 | 269 (2.5%) | 203 (15.8%) |
| $300 to $499 | 664 (6.1%) | 25 (1.9%) |
| $500 to $799 | 1,137 (10.5%) | 16 (1.2%) |
| $800 to $999 | 2,072 (19.1%) | 153 (11.9%) |
| $1,000 to $1,499 | 2,475 (22.8%) | 341 (26.5%) |
| $1,500 to $1,999 | 1,284 (11.8%) | 341 (26.5%) |
| $2,000 to $2,499 | 1,209 (11.2%) | 50 (3.9%) |
| $2,500 to $2,999 | 1,020 (9.4%) | 95 (7.4%) |
| $3,000 or more | 711 (6.6%) | 15 (1.2%) |
| Total | 10,841 (100.0%) | 1,287 (100.0%) |
Physical Housing Characteristics in Huntley
Housing Structures in Huntley
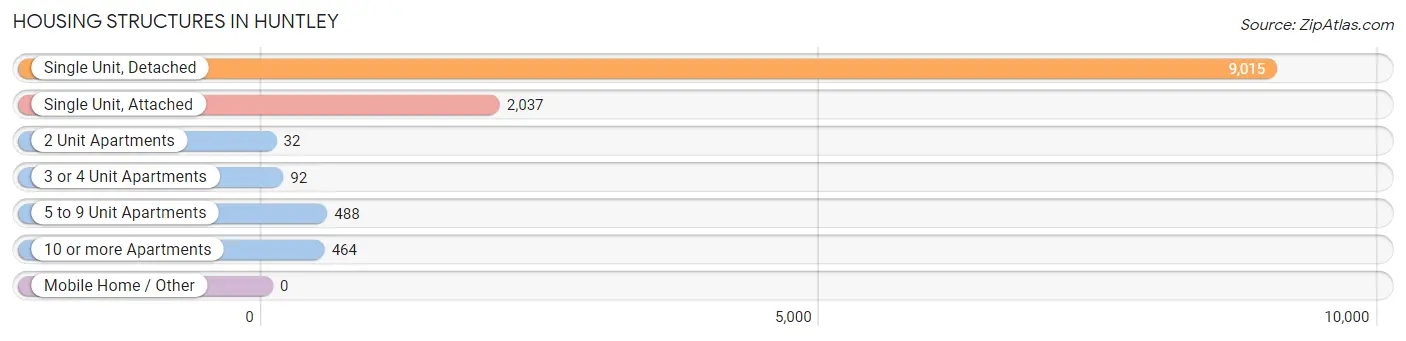
| Structure Type | # Housing Units | % Housing Units |
| Single Unit, Detached | 9,015 | 74.3% |
| Single Unit, Attached | 2,037 | 16.8% |
| 2 Unit Apartments | 32 | 0.3% |
| 3 or 4 Unit Apartments | 92 | 0.8% |
| 5 to 9 Unit Apartments | 488 | 4.0% |
| 10 or more Apartments | 464 | 3.8% |
| Mobile Home / Other | 0 | 0.0% |
| Total | 12,128 | 100.0% |
Housing Structures by Occupancy in Huntley
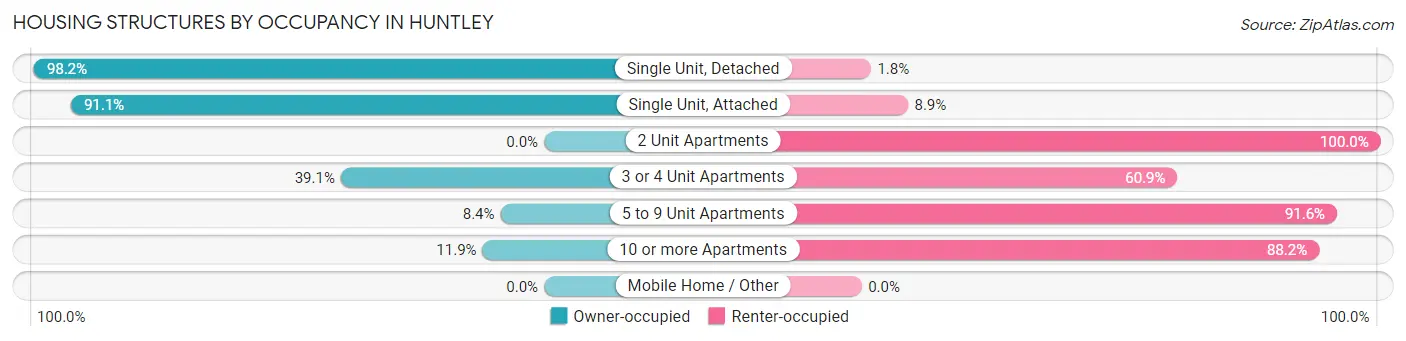
| Structure Type | Owner-occupied | Renter-occupied |
| Single Unit, Detached | 8,854 (98.2%) | 161 (1.8%) |
| Single Unit, Attached | 1,855 (91.1%) | 182 (8.9%) |
| 2 Unit Apartments | 0 (0.0%) | 32 (100.0%) |
| 3 or 4 Unit Apartments | 36 (39.1%) | 56 (60.9%) |
| 5 to 9 Unit Apartments | 41 (8.4%) | 447 (91.6%) |
| 10 or more Apartments | 55 (11.8%) | 409 (88.1%) |
| Mobile Home / Other | 0 (0.0%) | 0 (0.0%) |
| Total | 10,841 (89.4%) | 1,287 (10.6%) |
Housing Structures by Number of Rooms in Huntley
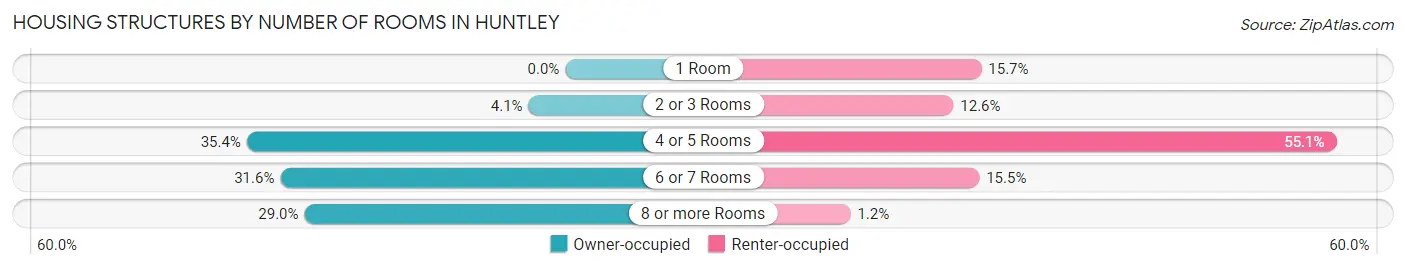
| Number of Rooms | Owner-occupied | Renter-occupied |
| 1 Room | 0 (0.0%) | 202 (15.7%) |
| 2 or 3 Rooms | 442 (4.1%) | 162 (12.6%) |
| 4 or 5 Rooms | 3,832 (35.3%) | 709 (55.1%) |
| 6 or 7 Rooms | 3,429 (31.6%) | 199 (15.5%) |
| 8 or more Rooms | 3,138 (28.9%) | 15 (1.2%) |
| Total | 10,841 (100.0%) | 1,287 (100.0%) |
Housing Structure by Heating Type in Huntley
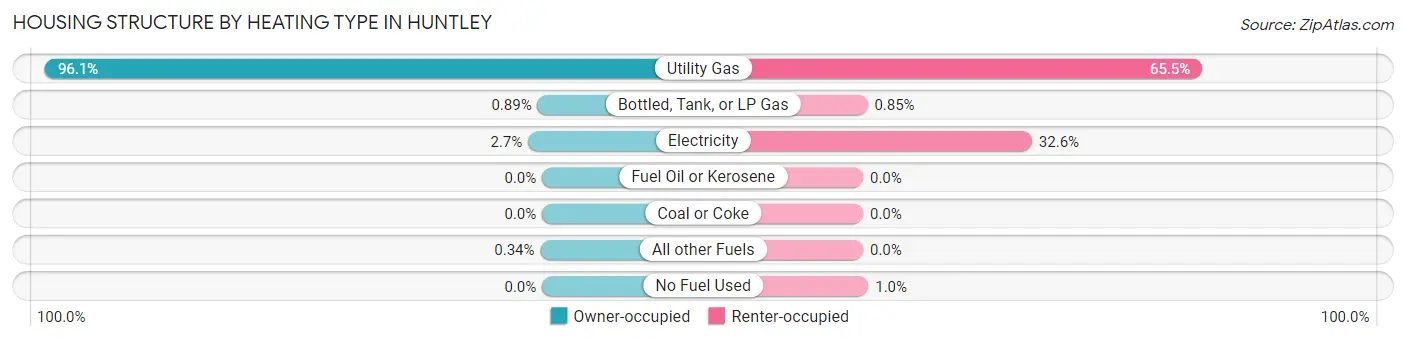
| Heating Type | Owner-occupied | Renter-occupied |
| Utility Gas | 10,414 (96.1%) | 843 (65.5%) |
| Bottled, Tank, or LP Gas | 97 (0.9%) | 11 (0.9%) |
| Electricity | 293 (2.7%) | 420 (32.6%) |
| Fuel Oil or Kerosene | 0 (0.0%) | 0 (0.0%) |
| Coal or Coke | 0 (0.0%) | 0 (0.0%) |
| All other Fuels | 37 (0.3%) | 0 (0.0%) |
| No Fuel Used | 0 (0.0%) | 13 (1.0%) |
| Total | 10,841 (100.0%) | 1,287 (100.0%) |
Household Vehicle Usage in Huntley
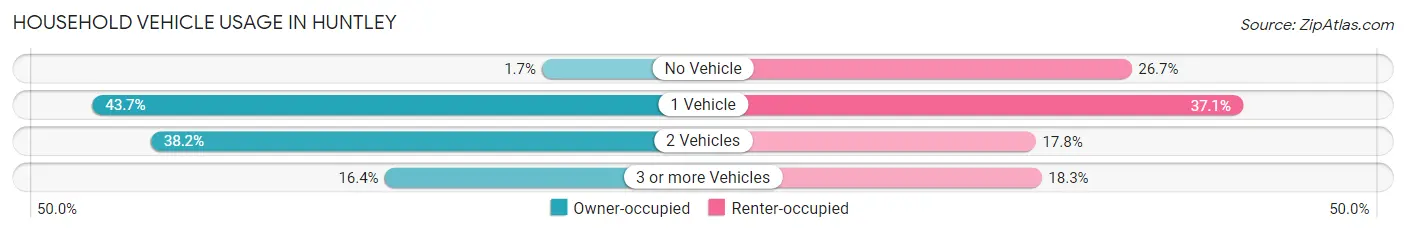
| Vehicles per Household | Owner-occupied | Renter-occupied |
| No Vehicle | 186 (1.7%) | 344 (26.7%) |
| 1 Vehicle | 4,734 (43.7%) | 478 (37.1%) |
| 2 Vehicles | 4,142 (38.2%) | 229 (17.8%) |
| 3 or more Vehicles | 1,779 (16.4%) | 236 (18.3%) |
| Total | 10,841 (100.0%) | 1,287 (100.0%) |
Real Estate & Mortgages in Huntley
Real Estate and Mortgage Overview in Huntley
| Characteristic | Without Mortgage | With Mortgage |
| Housing Units | 5,176 | 5,665 |
| Median Property Value | $304,800 | $295,800 |
| Median Household Income | $54,306 | $2,230 |
| Monthly Housing Costs | $866 | $695 |
| Real Estate Taxes | $6,517 | $37 |
Property Value by Mortgage Status in Huntley
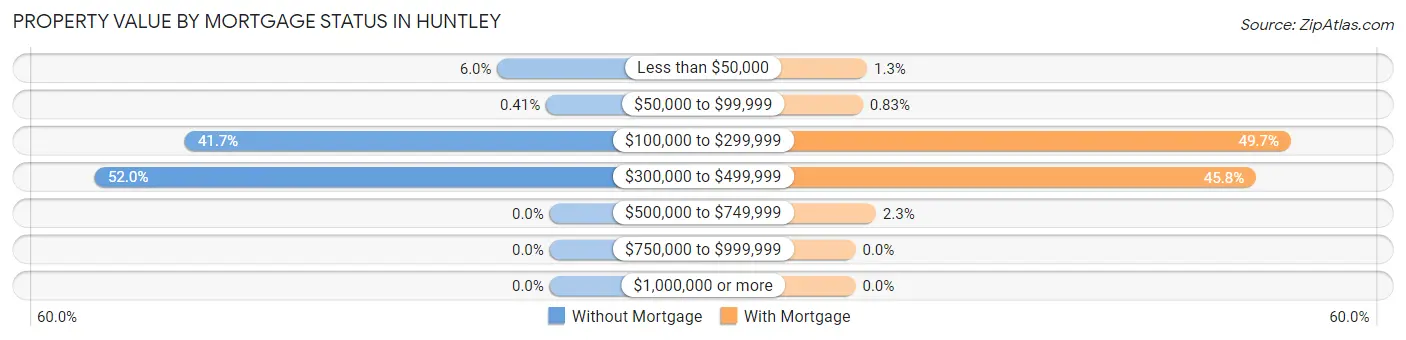
| Property Value | Without Mortgage | With Mortgage |
| Less than $50,000 | 309 (6.0%) | 75 (1.3%) |
| $50,000 to $99,999 | 21 (0.4%) | 47 (0.8%) |
| $100,000 to $299,999 | 2,157 (41.7%) | 2,818 (49.7%) |
| $300,000 to $499,999 | 2,689 (51.9%) | 2,593 (45.8%) |
| $500,000 to $749,999 | 0 (0.0%) | 132 (2.3%) |
| $750,000 to $999,999 | 0 (0.0%) | 0 (0.0%) |
| $1,000,000 or more | 0 (0.0%) | 0 (0.0%) |
| Total | 5,176 (100.0%) | 5,665 (100.0%) |
Household Income by Mortgage Status in Huntley
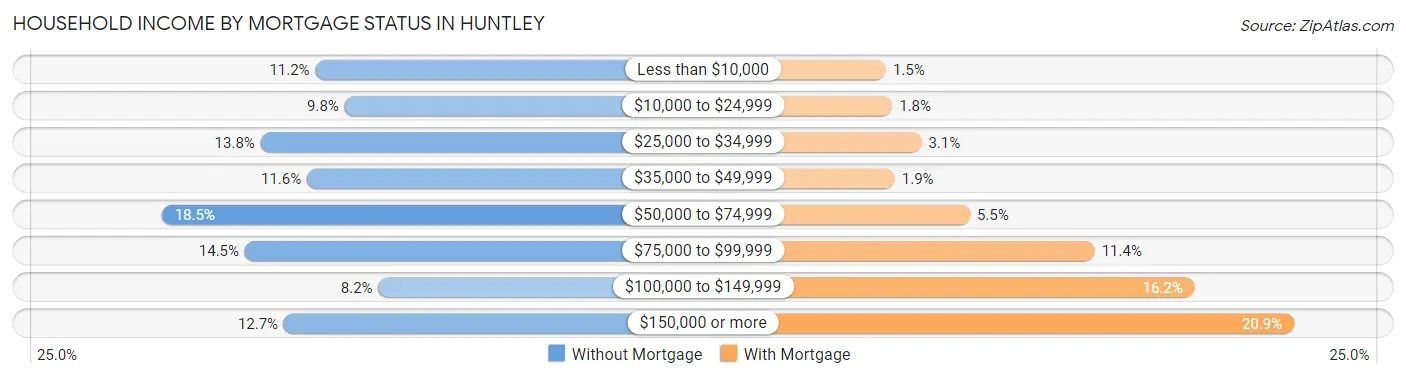
| Household Income | Without Mortgage | With Mortgage |
| Less than $10,000 | 577 (11.2%) | 82 (1.5%) |
| $10,000 to $24,999 | 505 (9.8%) | 99 (1.8%) |
| $25,000 to $34,999 | 712 (13.8%) | 178 (3.1%) |
| $35,000 to $49,999 | 598 (11.6%) | 106 (1.9%) |
| $50,000 to $74,999 | 956 (18.5%) | 309 (5.4%) |
| $75,000 to $99,999 | 751 (14.5%) | 645 (11.4%) |
| $100,000 to $149,999 | 422 (8.2%) | 915 (16.2%) |
| $150,000 or more | 655 (12.7%) | 1,183 (20.9%) |
| Total | 5,176 (100.0%) | 5,665 (100.0%) |
Property Value to Household Income Ratio in Huntley
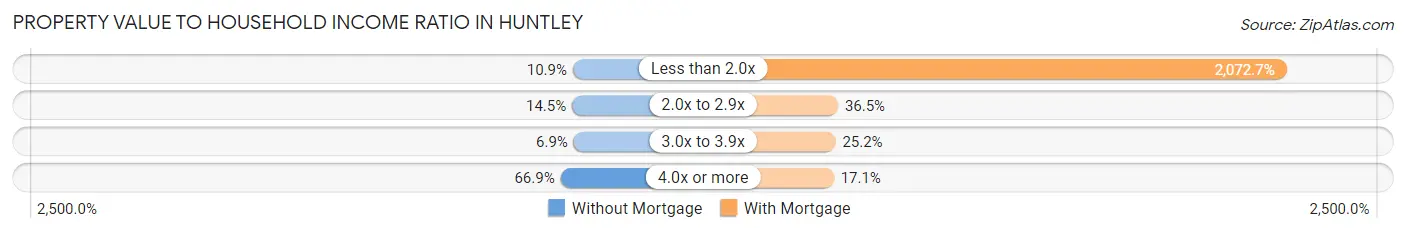
| Value-to-Income Ratio | Without Mortgage | With Mortgage |
| Less than 2.0x | 564 (10.9%) | 117,417 (2,072.7%) |
| 2.0x to 2.9x | 749 (14.5%) | 2,066 (36.5%) |
| 3.0x to 3.9x | 356 (6.9%) | 1,426 (25.2%) |
| 4.0x or more | 3,463 (66.9%) | 971 (17.1%) |
| Total | 5,176 (100.0%) | 5,665 (100.0%) |
Real Estate Taxes by Mortgage Status in Huntley
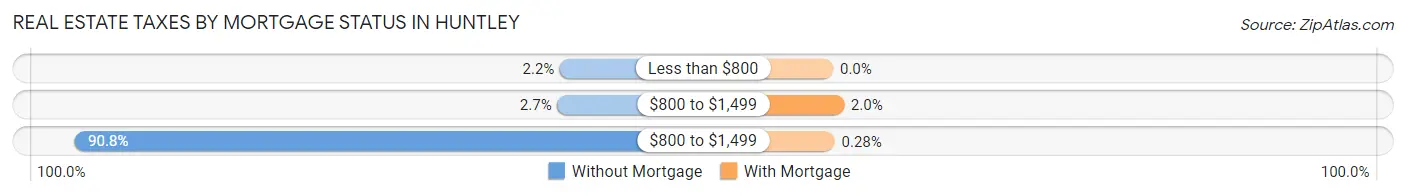
| Property Taxes | Without Mortgage | With Mortgage |
| Less than $800 | 113 (2.2%) | 0 (0.0%) |
| $800 to $1,499 | 138 (2.7%) | 112 (2.0%) |
| $800 to $1,499 | 4,698 (90.8%) | 16 (0.3%) |
| Total | 5,176 (100.0%) | 5,665 (100.0%) |
Health & Disability in Huntley
Health Insurance Coverage by Age in Huntley
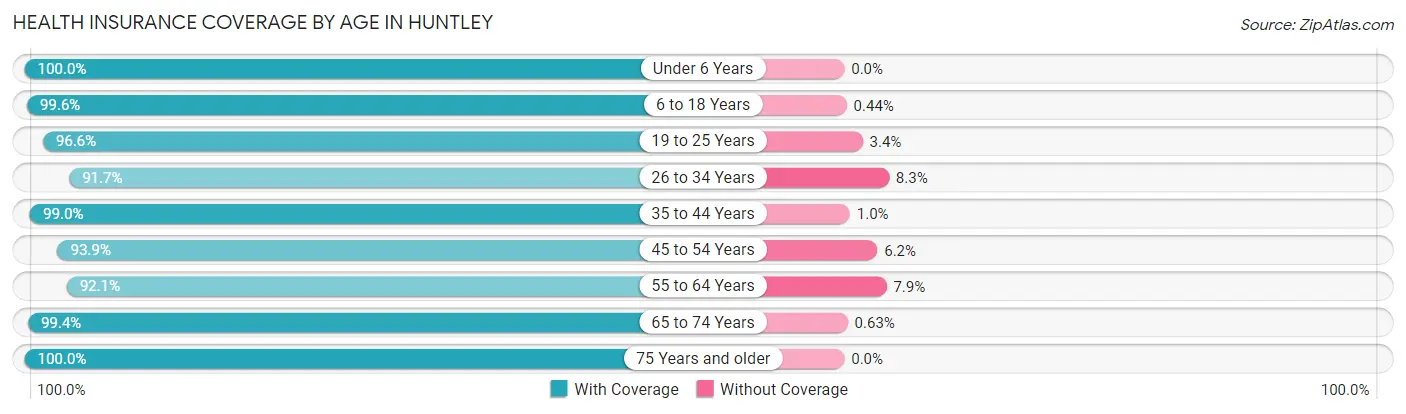
| Age Bracket | With Coverage | Without Coverage |
| Under 6 Years | 1,682 (100.0%) | 0 (0.0%) |
| 6 to 18 Years | 4,505 (99.6%) | 20 (0.4%) |
| 19 to 25 Years | 1,189 (96.6%) | 42 (3.4%) |
| 26 to 34 Years | 1,565 (91.7%) | 142 (8.3%) |
| 35 to 44 Years | 3,047 (99.0%) | 32 (1.0%) |
| 45 to 54 Years | 3,172 (93.9%) | 208 (6.1%) |
| 55 to 64 Years | 2,297 (92.1%) | 196 (7.9%) |
| 65 to 74 Years | 3,794 (99.4%) | 24 (0.6%) |
| 75 Years and older | 5,729 (100.0%) | 0 (0.0%) |
| Total | 26,980 (97.6%) | 664 (2.4%) |
Health Insurance Coverage by Citizenship Status in Huntley
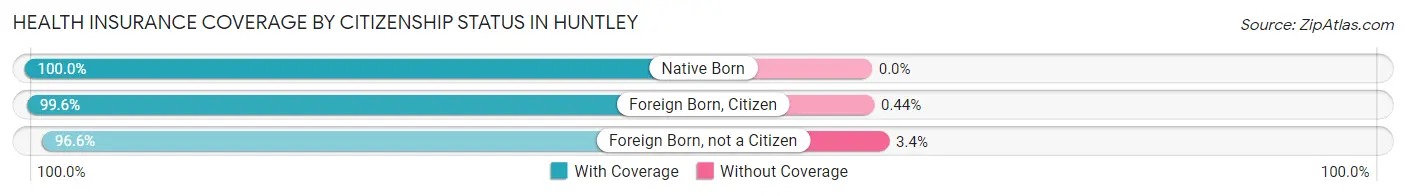
| Citizenship Status | With Coverage | Without Coverage |
| Native Born | 1,682 (100.0%) | 0 (0.0%) |
| Foreign Born, Citizen | 4,505 (99.6%) | 20 (0.4%) |
| Foreign Born, not a Citizen | 1,189 (96.6%) | 42 (3.4%) |
Health Insurance Coverage by Household Income in Huntley
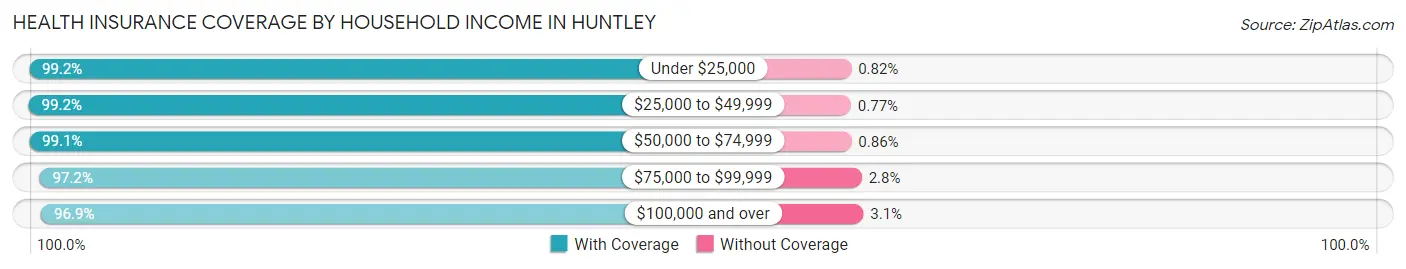
| Household Income | With Coverage | Without Coverage |
| Under $25,000 | 2,410 (99.2%) | 20 (0.8%) |
| $25,000 to $49,999 | 2,591 (99.2%) | 20 (0.8%) |
| $50,000 to $74,999 | 2,770 (99.1%) | 24 (0.9%) |
| $75,000 to $99,999 | 4,546 (97.2%) | 131 (2.8%) |
| $100,000 and over | 14,663 (96.9%) | 469 (3.1%) |
Public vs Private Health Insurance Coverage by Age in Huntley
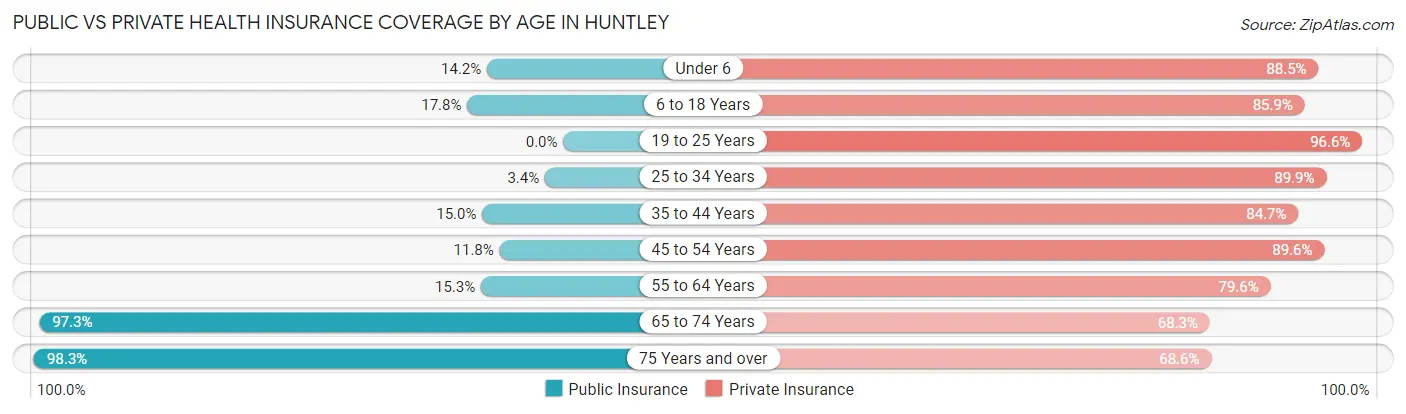
| Age Bracket | Public Insurance | Private Insurance |
| Under 6 | 238 (14.1%) | 1,488 (88.5%) |
| 6 to 18 Years | 807 (17.8%) | 3,888 (85.9%) |
| 19 to 25 Years | 0 (0.0%) | 1,189 (96.6%) |
| 25 to 34 Years | 58 (3.4%) | 1,535 (89.9%) |
| 35 to 44 Years | 463 (15.0%) | 2,609 (84.7%) |
| 45 to 54 Years | 400 (11.8%) | 3,027 (89.6%) |
| 55 to 64 Years | 381 (15.3%) | 1,984 (79.6%) |
| 65 to 74 Years | 3,714 (97.3%) | 2,608 (68.3%) |
| 75 Years and over | 5,630 (98.3%) | 3,929 (68.6%) |
| Total | 11,691 (42.3%) | 22,257 (80.5%) |
Disability Status by Sex by Age in Huntley
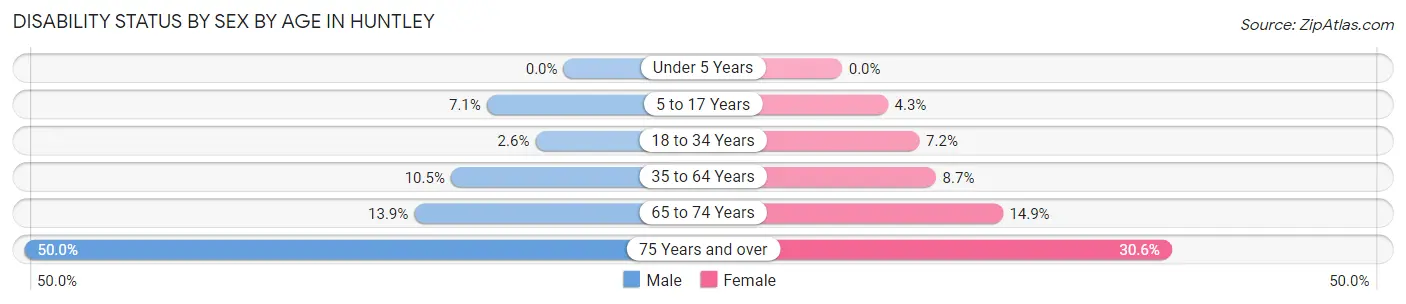
| Age Bracket | Male | Female |
| Under 5 Years | 0 (0.0%) | 0 (0.0%) |
| 5 to 17 Years | 170 (7.1%) | 98 (4.3%) |
| 18 to 34 Years | 49 (2.6%) | 102 (7.2%) |
| 35 to 64 Years | 459 (10.4%) | 397 (8.7%) |
| 65 to 74 Years | 238 (13.9%) | 313 (14.9%) |
| 75 Years and over | 1,123 (50.0%) | 1,066 (30.6%) |
Disability Class by Sex by Age in Huntley
Disability Class: Hearing Difficulty
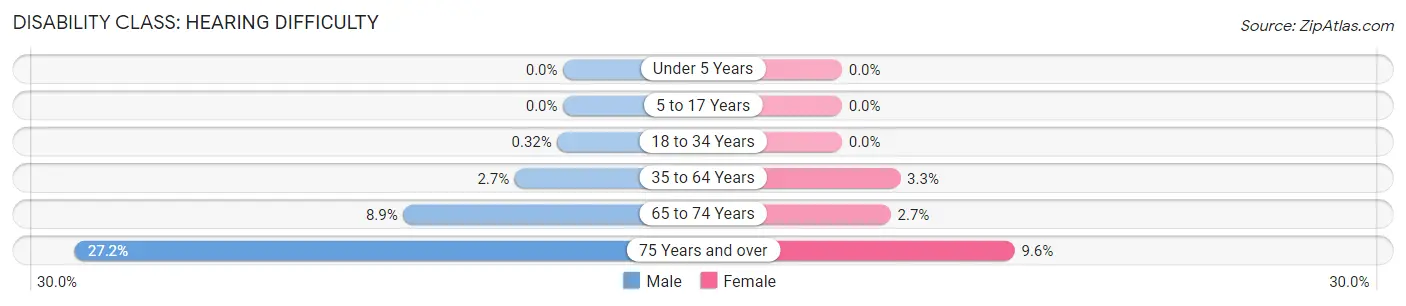
| Age Bracket | Male | Female |
| Under 5 Years | 0 (0.0%) | 0 (0.0%) |
| 5 to 17 Years | 0 (0.0%) | 0 (0.0%) |
| 18 to 34 Years | 6 (0.3%) | 0 (0.0%) |
| 35 to 64 Years | 118 (2.7%) | 148 (3.3%) |
| 65 to 74 Years | 153 (8.9%) | 57 (2.7%) |
| 75 Years and over | 611 (27.2%) | 335 (9.6%) |
Disability Class: Vision Difficulty
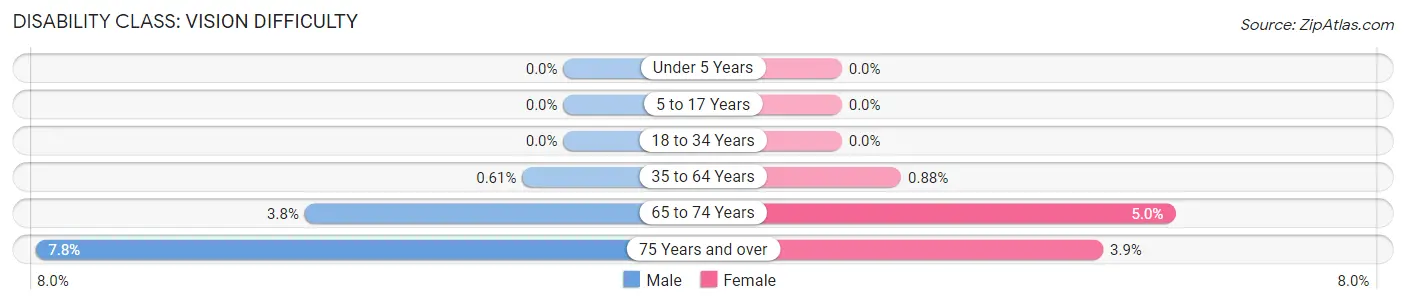
| Age Bracket | Male | Female |
| Under 5 Years | 0 (0.0%) | 0 (0.0%) |
| 5 to 17 Years | 0 (0.0%) | 0 (0.0%) |
| 18 to 34 Years | 0 (0.0%) | 0 (0.0%) |
| 35 to 64 Years | 27 (0.6%) | 40 (0.9%) |
| 65 to 74 Years | 66 (3.8%) | 104 (5.0%) |
| 75 Years and over | 176 (7.8%) | 135 (3.9%) |
Disability Class: Cognitive Difficulty
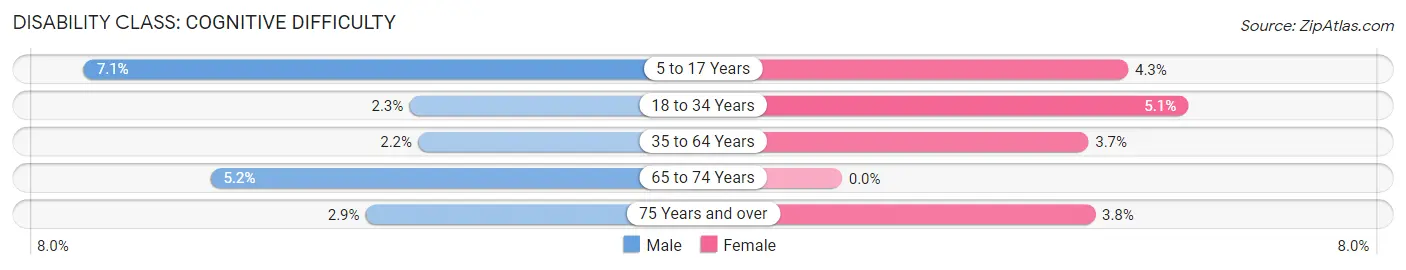
| Age Bracket | Male | Female |
| 5 to 17 Years | 170 (7.1%) | 98 (4.3%) |
| 18 to 34 Years | 43 (2.3%) | 73 (5.1%) |
| 35 to 64 Years | 95 (2.2%) | 167 (3.7%) |
| 65 to 74 Years | 90 (5.2%) | 0 (0.0%) |
| 75 Years and over | 66 (2.9%) | 131 (3.8%) |
Disability Class: Ambulatory Difficulty
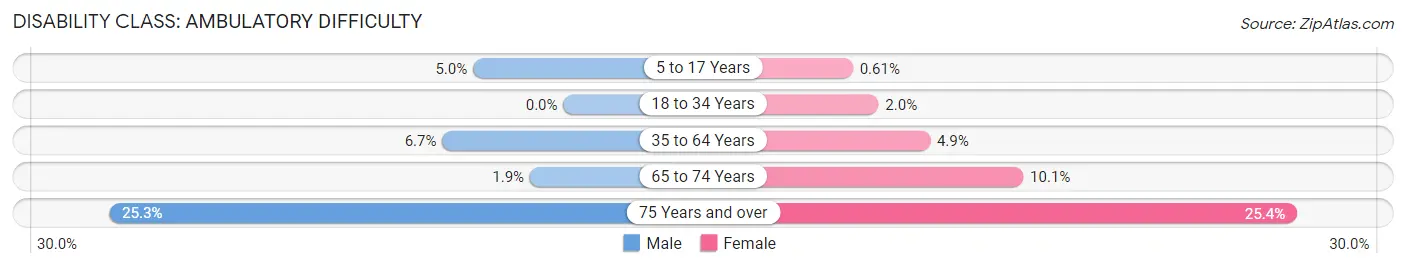
| Age Bracket | Male | Female |
| 5 to 17 Years | 120 (5.0%) | 14 (0.6%) |
| 18 to 34 Years | 0 (0.0%) | 29 (2.0%) |
| 35 to 64 Years | 296 (6.7%) | 224 (4.9%) |
| 65 to 74 Years | 32 (1.9%) | 212 (10.1%) |
| 75 Years and over | 568 (25.3%) | 883 (25.4%) |
Disability Class: Self-Care Difficulty
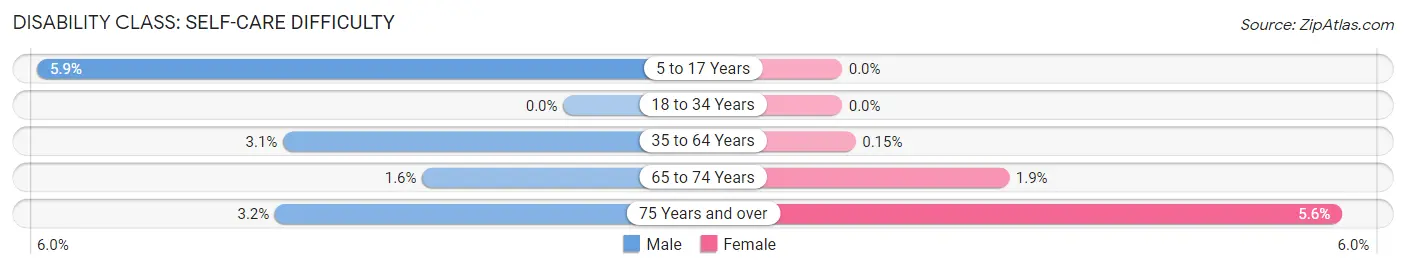
| Age Bracket | Male | Female |
| 5 to 17 Years | 140 (5.9%) | 0 (0.0%) |
| 18 to 34 Years | 0 (0.0%) | 0 (0.0%) |
| 35 to 64 Years | 137 (3.1%) | 7 (0.2%) |
| 65 to 74 Years | 27 (1.6%) | 39 (1.9%) |
| 75 Years and over | 72 (3.2%) | 194 (5.6%) |
Technology Access in Huntley
Computing Device Access in Huntley
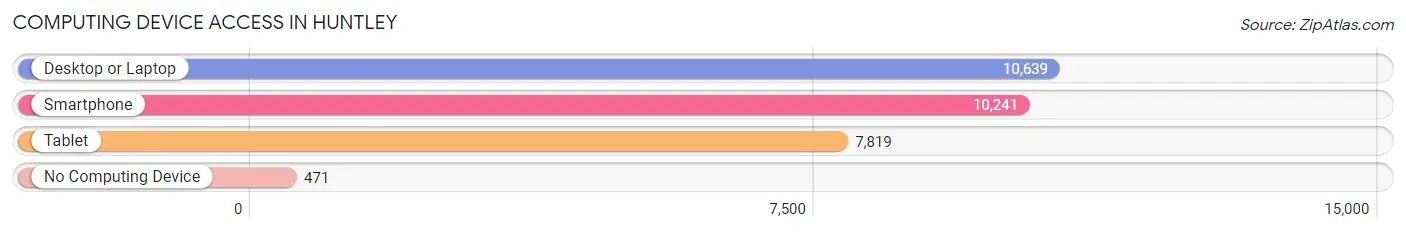
| Device Type | # Households | % Households |
| Desktop or Laptop | 10,639 | 87.7% |
| Smartphone | 10,241 | 84.4% |
| Tablet | 7,819 | 64.5% |
| No Computing Device | 471 | 3.9% |
| Total | 12,128 | 100.0% |
Internet Access in Huntley
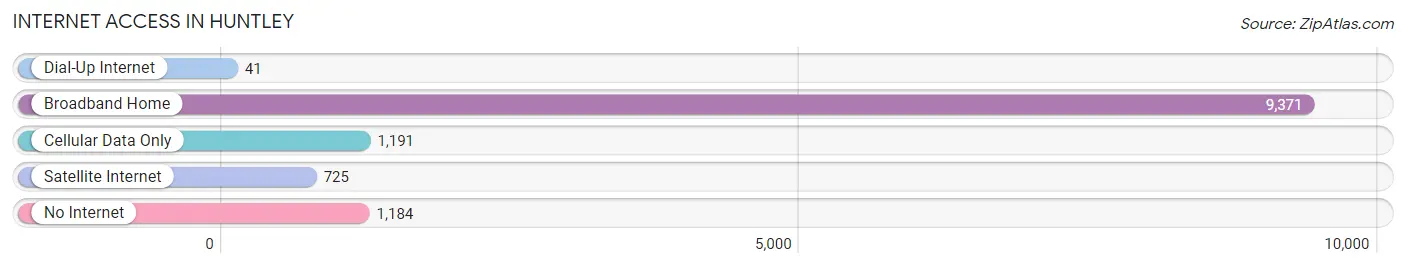
| Internet Type | # Households | % Households |
| Dial-Up Internet | 41 | 0.3% |
| Broadband Home | 9,371 | 77.3% |
| Cellular Data Only | 1,191 | 9.8% |
| Satellite Internet | 725 | 6.0% |
| No Internet | 1,184 | 9.8% |
| Total | 12,128 | 100.0% |
Huntley Summary
Huntley, Illinois is a village located in McHenry and Kane counties in the northern part of the state. It is a part of the Chicago metropolitan area and is located about 40 miles northwest of the city. The village has a population of 24,291 as of the 2010 census, making it the largest village in McHenry County.
History
The area that is now Huntley was first settled in the early 1830s by settlers from New England. The village was originally known as Huntley Station, named after the railroad station that was built in the area in 1851. The village was officially incorporated in 1872.
In the late 19th century, Huntley was a major center for the dairy industry, with several large farms in the area. The village also had a large brickyard and several other industries.
Geography
Huntley is located in northern Illinois, about 40 miles northwest of Chicago. It is situated in both McHenry and Kane counties, with the majority of the village located in McHenry County. The village is located on the Fox River, which forms the eastern boundary of the village.
The village has a total area of 8.3 square miles, of which 8.2 square miles is land and 0.1 square miles is water. The village is located in the Fox River Valley, with the Fox River forming the eastern boundary of the village.
Economy
Huntley is a major center for the manufacturing industry in northern Illinois. The village is home to several large manufacturing companies, including Huntley Industries, a manufacturer of automotive parts, and Huntley Plastics, a manufacturer of plastic products.
The village is also home to several retail stores, including a Walmart Supercenter, a Target, and a Home Depot. The village also has several restaurants, including a McDonald's, a Subway, and a Burger King.
Demographics
As of the 2010 census, Huntley had a population of 24,291. The racial makeup of the village was 87.3% White, 4.2% African American, 0.3% Native American, 3.2% Asian, 0.1% Pacific Islander, 2.7% from other races, and 2.4% from two or more races. Hispanic or Latino of any race were 8.2% of the population.
The median income for a household in the village was $76,945, and the median income for a family was $86,945. The per capita income for the village was $31,945. About 4.2% of families and 5.2% of the population were below the poverty line, including 6.2% of those under age 18 and 4.2% of those age 65 or over.
Common Questions
What is Per Capita Income in Huntley?
Per Capita income in Huntley is $43,852.
What is the Median Family Income in Huntley?
Median Family Income in Huntley is $109,783.
What is the Median Household income in Huntley?
Median Household Income in Huntley is $83,357.
What is Income or Wage Gap in Huntley?
Income or Wage Gap in Huntley is 34.2%.
Women in Huntley earn 65.8 cents for every dollar earned by a man.
What is Family Income Deficit in Huntley?
Family Income Deficit in Huntley is $6,676.
Families that are below poverty line in Huntley earn $6,676 less on average than the poverty threshold level.
What is Inequality or Gini Index in Huntley?
Inequality or Gini Index in Huntley is 0.43.
What is the Total Population of Huntley?
Total Population of Huntley is 27,652.
What is the Total Male Population of Huntley?
Total Male Population of Huntley is 13,137.
What is the Total Female Population of Huntley?
Total Female Population of Huntley is 14,515.
What is the Ratio of Males per 100 Females in Huntley?
There are 90.51 Males per 100 Females in Huntley.
What is the Ratio of Females per 100 Males in Huntley?
There are 110.49 Females per 100 Males in Huntley.
What is the Median Population Age in Huntley?
Median Population Age in Huntley is 49.1 Years.
What is the Average Family Size in Huntley
Average Family Size in Huntley is 3.0 People.
What is the Average Household Size in Huntley
Average Household Size in Huntley is 2.3 People.
How Large is the Labor Force in Huntley?
There are 11,743 People in the Labor Forcein in Huntley.
What is the Percentage of People in the Labor Force in Huntley?
52.2% of People are in the Labor Force in Huntley.
What is the Unemployment Rate in Huntley?
Unemployment Rate in Huntley is 3.3%.