Vidor, TX Map & Demographics
Vidor Map
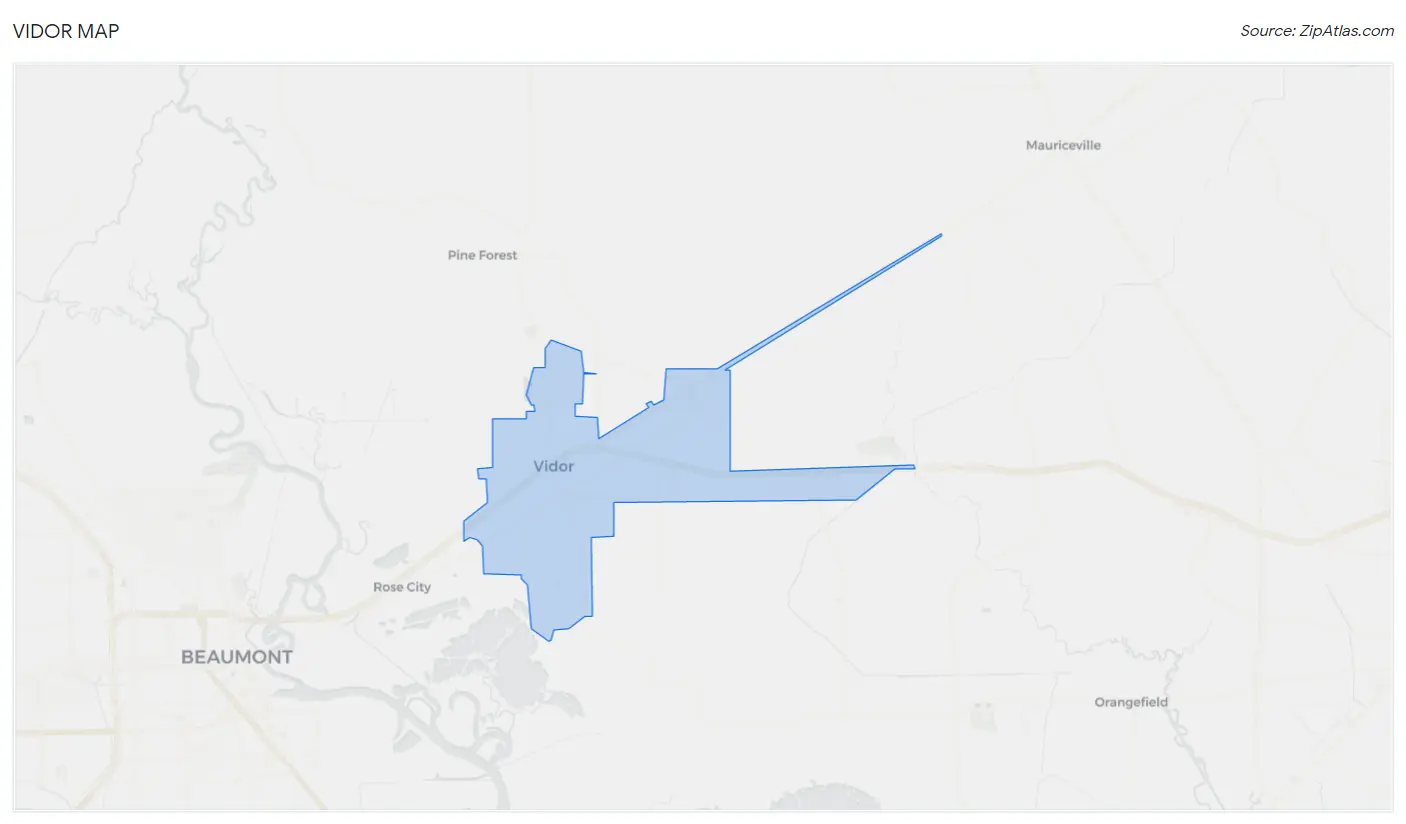
Vidor Overview
$31,081
PER CAPITA INCOME
$81,940
AVG FAMILY INCOME
$56,866
AVG HOUSEHOLD INCOME
45.8%
WAGE / INCOME GAP [ % ]
54.2¢/ $1
WAGE / INCOME GAP [ $ ]
0.46
INEQUALITY / GINI INDEX
9,806
TOTAL POPULATION
4,626
MALE POPULATION
5,180
FEMALE POPULATION
89.31
MALES / 100 FEMALES
111.98
FEMALES / 100 MALES
40.7
MEDIAN AGE
3.2
AVG FAMILY SIZE
2.5
AVG HOUSEHOLD SIZE
4,742
LABOR FORCE [ PEOPLE ]
59.8%
PERCENT IN LABOR FORCE
7.1%
UNEMPLOYMENT RATE
Vidor Zip Codes
Vidor Area Codes
Income in Vidor
Income Overview in Vidor
Per Capita Income in Vidor is $31,081, while median incomes of families and households are $81,940 and $56,866 respectively.
| Characteristic | Number | Measure |
| Per Capita Income | 9,806 | $31,081 |
| Median Family Income | 2,391 | $81,940 |
| Mean Family Income | 2,391 | $99,550 |
| Median Household Income | 3,851 | $56,866 |
| Mean Household Income | 3,851 | $76,373 |
| Income Deficit | 2,391 | $0 |
| Wage / Income Gap (%) | 9,806 | 45.80% |
| Wage / Income Gap ($) | 9,806 | 54.20¢ per $1 |
| Gini / Inequality Index | 9,806 | 0.46 |
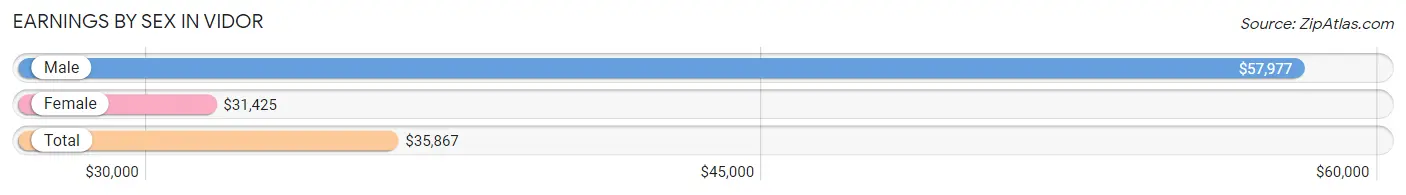
Earnings by Sex in Vidor
Average Earnings in Vidor are $35,867, $57,977 for men and $31,425 for women, a difference of 45.8%.
| Sex | Number | Average Earnings |
| Male | 2,253 (49.3%) | $57,977 |
| Female | 2,312 (50.6%) | $31,425 |
| Total | 4,565 (100.0%) | $35,867 |
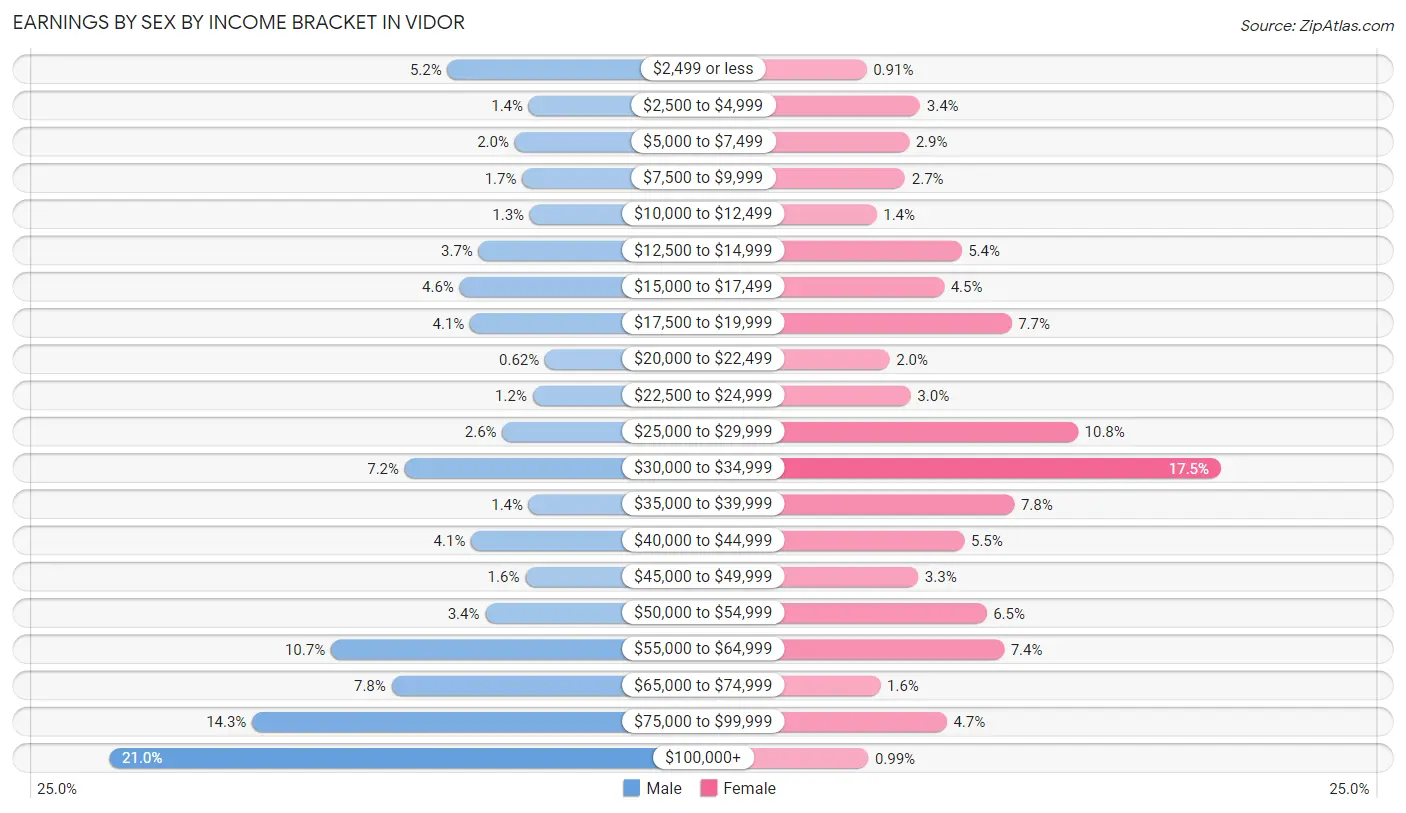
Earnings by Sex by Income Bracket in Vidor
The most common earnings brackets in Vidor are $100,000+ for men (474 | 21.0%) and $30,000 to $34,999 for women (405 | 17.5%).
| Income | Male | Female |
| $2,499 or less | 117 (5.2%) | 21 (0.9%) |
| $2,500 to $4,999 | 31 (1.4%) | 79 (3.4%) |
| $5,000 to $7,499 | 46 (2.0%) | 67 (2.9%) |
| $7,500 to $9,999 | 38 (1.7%) | 63 (2.7%) |
| $10,000 to $12,499 | 30 (1.3%) | 32 (1.4%) |
| $12,500 to $14,999 | 84 (3.7%) | 124 (5.4%) |
| $15,000 to $17,499 | 104 (4.6%) | 105 (4.5%) |
| $17,500 to $19,999 | 93 (4.1%) | 178 (7.7%) |
| $20,000 to $22,499 | 14 (0.6%) | 46 (2.0%) |
| $22,500 to $24,999 | 27 (1.2%) | 69 (3.0%) |
| $25,000 to $29,999 | 59 (2.6%) | 250 (10.8%) |
| $30,000 to $34,999 | 162 (7.2%) | 405 (17.5%) |
| $35,000 to $39,999 | 31 (1.4%) | 181 (7.8%) |
| $40,000 to $44,999 | 92 (4.1%) | 127 (5.5%) |
| $45,000 to $49,999 | 35 (1.5%) | 77 (3.3%) |
| $50,000 to $54,999 | 77 (3.4%) | 151 (6.5%) |
| $55,000 to $64,999 | 240 (10.6%) | 170 (7.3%) |
| $65,000 to $74,999 | 176 (7.8%) | 36 (1.6%) |
| $75,000 to $99,999 | 323 (14.3%) | 108 (4.7%) |
| $100,000+ | 474 (21.0%) | 23 (1.0%) |
| Total | 2,253 (100.0%) | 2,312 (100.0%) |
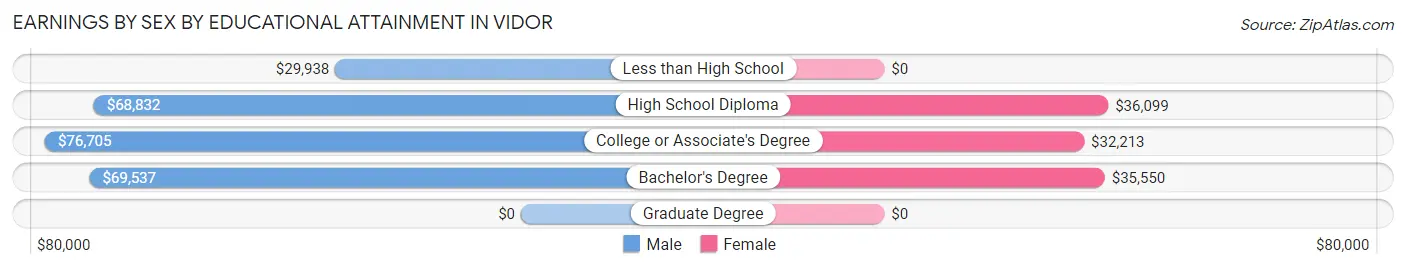
Earnings by Sex by Educational Attainment in Vidor
Average earnings in Vidor are $62,083 for men and $32,651 for women, a difference of 47.4%. Men with an educational attainment of college or associate's degree enjoy the highest average annual earnings of $76,705, while those with less than high school education earn the least with $29,938. Women with an educational attainment of high school diploma earn the most with the average annual earnings of $36,099, while those with college or associate's degree education have the smallest earnings of $32,213.
| Educational Attainment | Male Income | Female Income |
| Less than High School | $29,938 | $0 |
| High School Diploma | $68,832 | $36,099 |
| College or Associate's Degree | $76,705 | $32,213 |
| Bachelor's Degree | $69,537 | $35,550 |
| Graduate Degree | - | - |
| Total | $62,083 | $32,651 |
Family Income in Vidor
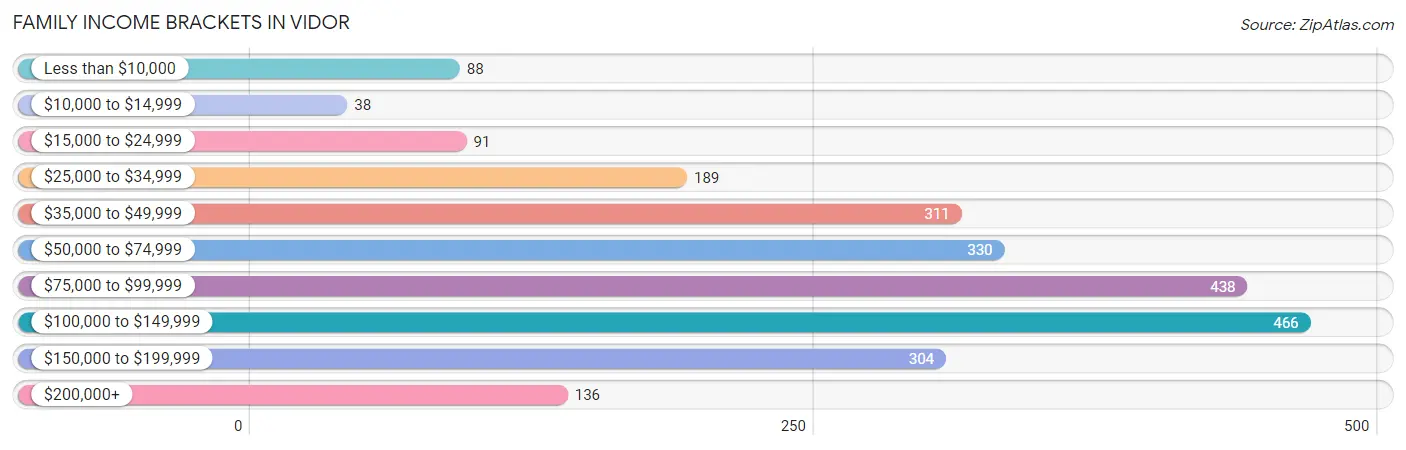
Family Income Brackets in Vidor
According to the Vidor family income data, there are 466 families falling into the $100,000 to $149,999 income range, which is the most common income bracket and makes up 19.5% of all families. Conversely, the $10,000 to $14,999 income bracket is the least frequent group with only 38 families (1.6%) belonging to this category.
| Income Bracket | # Families | % Families |
| Less than $10,000 | 88 | 3.7% |
| $10,000 to $14,999 | 38 | 1.6% |
| $15,000 to $24,999 | 91 | 3.8% |
| $25,000 to $34,999 | 189 | 7.9% |
| $35,000 to $49,999 | 311 | 13.0% |
| $50,000 to $74,999 | 330 | 13.8% |
| $75,000 to $99,999 | 438 | 18.3% |
| $100,000 to $149,999 | 466 | 19.5% |
| $150,000 to $199,999 | 304 | 12.7% |
| $200,000+ | 136 | 5.7% |
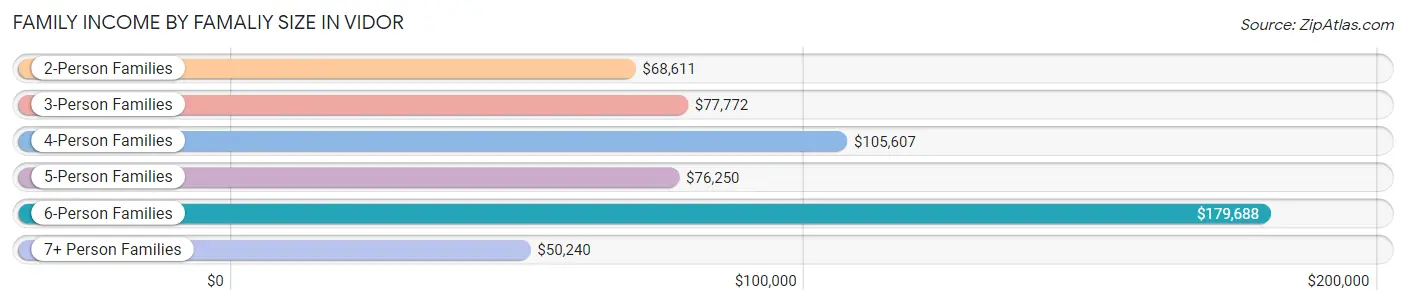
Family Income by Famaliy Size in Vidor
6-person families (70 | 2.9%) account for the highest median family income in Vidor with $179,688 per family, while 2-person families (990 | 41.4%) have the highest median income of $34,306 per family member.
| Income Bracket | # Families | Median Income |
| 2-Person Families | 990 (41.4%) | $68,611 |
| 3-Person Families | 601 (25.1%) | $77,772 |
| 4-Person Families | 473 (19.8%) | $105,607 |
| 5-Person Families | 200 (8.4%) | $76,250 |
| 6-Person Families | 70 (2.9%) | $179,688 |
| 7+ Person Families | 57 (2.4%) | $50,240 |
| Total | 2,391 (100.0%) | $81,940 |
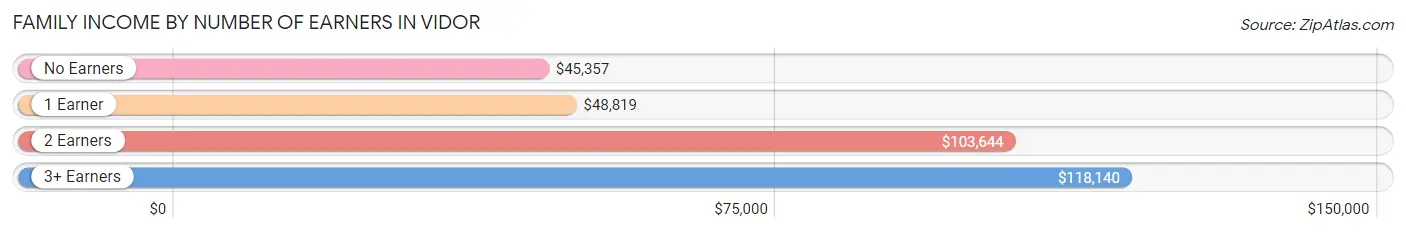
Family Income by Number of Earners in Vidor
The median family income in Vidor is $81,940, with families comprising 3+ earners (235) having the highest median family income of $118,140, while families with no earners (378) have the lowest median family income of $45,357, accounting for 9.8% and 15.8% of families, respectively.
| Number of Earners | # Families | Median Income |
| No Earners | 378 (15.8%) | $45,357 |
| 1 Earner | 734 (30.7%) | $48,819 |
| 2 Earners | 1,044 (43.7%) | $103,644 |
| 3+ Earners | 235 (9.8%) | $118,140 |
| Total | 2,391 (100.0%) | $81,940 |
Household Income in Vidor
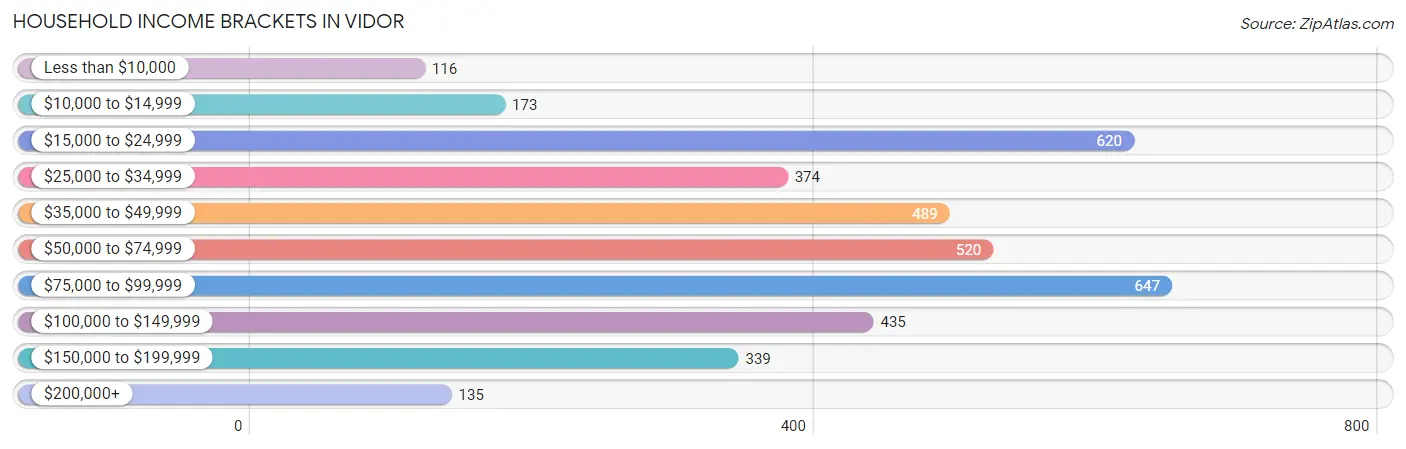
Household Income Brackets in Vidor
With 647 households falling in the category, the $75,000 to $99,999 income range is the most frequent in Vidor, accounting for 16.8% of all households. In contrast, only 116 households (3.0%) fall into the less than $10,000 income bracket, making it the least populous group.
| Income Bracket | # Households | % Households |
| Less than $10,000 | 116 | 3.0% |
| $10,000 to $14,999 | 173 | 4.5% |
| $15,000 to $24,999 | 620 | 16.1% |
| $25,000 to $34,999 | 374 | 9.7% |
| $35,000 to $49,999 | 489 | 12.7% |
| $50,000 to $74,999 | 520 | 13.5% |
| $75,000 to $99,999 | 647 | 16.8% |
| $100,000 to $149,999 | 435 | 11.3% |
| $150,000 to $199,999 | 339 | 8.8% |
| $200,000+ | 135 | 3.5% |
Household Income by Householder Age in Vidor
The median household income in Vidor is $56,866, with the highest median household income of $80,469 found in the 25 to 44 years age bracket for the primary householder. A total of 1,119 households (29.1%) fall into this category. Meanwhile, the 15 to 24 years age bracket for the primary householder has the lowest median household income of $41,211, with 120 households (3.1%) in this group.
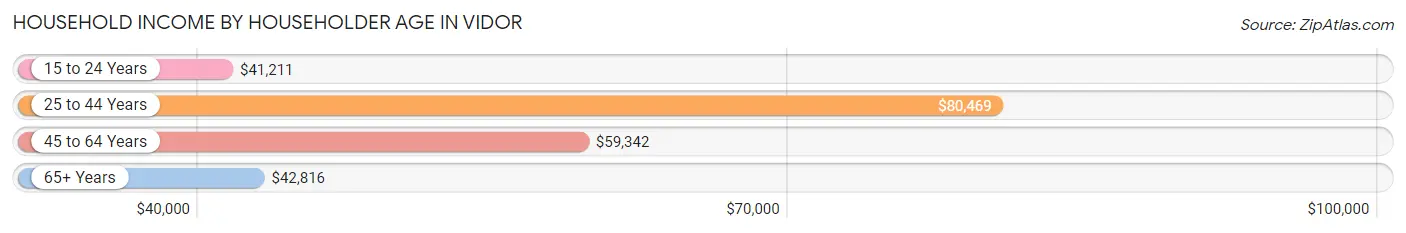
| Income Bracket | # Households | Median Income |
| 15 to 24 Years | 120 (3.1%) | $41,211 |
| 25 to 44 Years | 1,119 (29.1%) | $80,469 |
| 45 to 64 Years | 1,438 (37.3%) | $59,342 |
| 65+ Years | 1,174 (30.5%) | $42,816 |
| Total | 3,851 (100.0%) | $56,866 |
Poverty in Vidor
Income Below Poverty by Sex and Age in Vidor
With 9.5% poverty level for males and 6.5% for females among the residents of Vidor, 18 to 24 year old males and 45 to 54 year old females are the most vulnerable to poverty, with 67 males (19.3%) and 132 females (19.9%) in their respective age groups living below the poverty level.
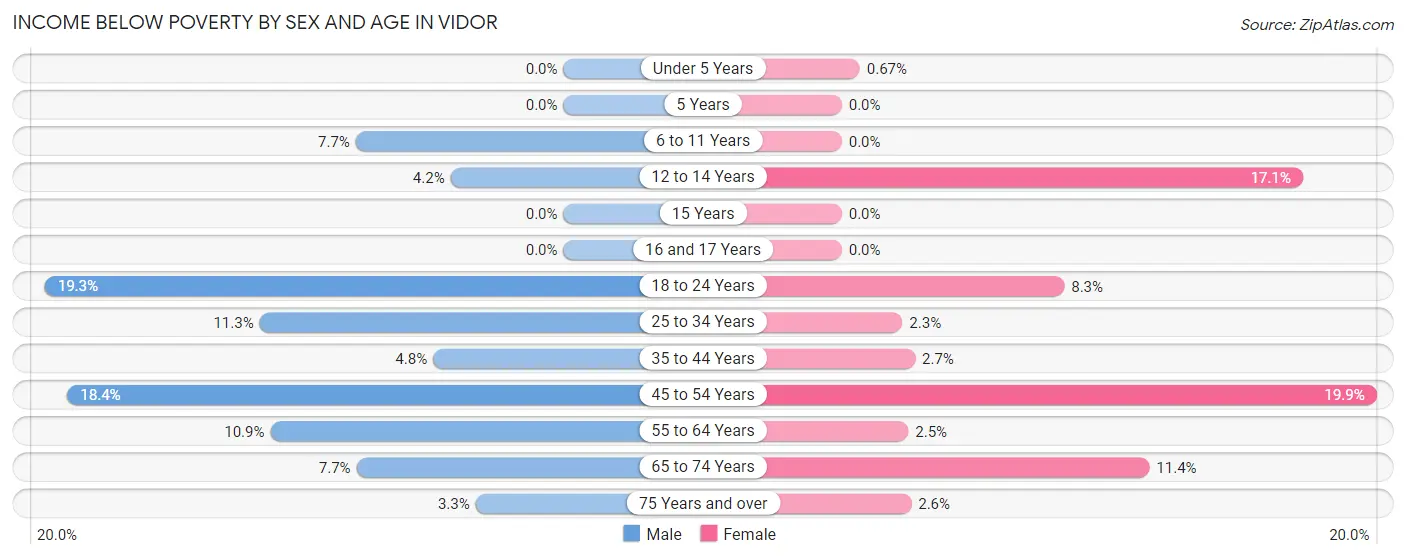
| Age Bracket | Male | Female |
| Under 5 Years | 0 (0.0%) | 1 (0.7%) |
| 5 Years | 0 (0.0%) | 0 (0.0%) |
| 6 to 11 Years | 30 (7.7%) | 0 (0.0%) |
| 12 to 14 Years | 9 (4.2%) | 26 (17.1%) |
| 15 Years | 0 (0.0%) | 0 (0.0%) |
| 16 and 17 Years | 0 (0.0%) | 0 (0.0%) |
| 18 to 24 Years | 67 (19.3%) | 28 (8.3%) |
| 25 to 34 Years | 75 (11.3%) | 17 (2.2%) |
| 35 to 44 Years | 25 (4.8%) | 15 (2.7%) |
| 45 to 54 Years | 137 (18.4%) | 132 (19.9%) |
| 55 to 64 Years | 48 (10.9%) | 19 (2.5%) |
| 65 to 74 Years | 37 (7.7%) | 77 (11.4%) |
| 75 Years and over | 6 (3.3%) | 11 (2.6%) |
| Total | 434 (9.5%) | 326 (6.5%) |
Income Above Poverty by Sex and Age in Vidor
According to the poverty statistics in Vidor, males aged under 5 years and females aged 5 years are the age groups that are most secure financially, with 100.0% of males and 100.0% of females in these age groups living above the poverty line.
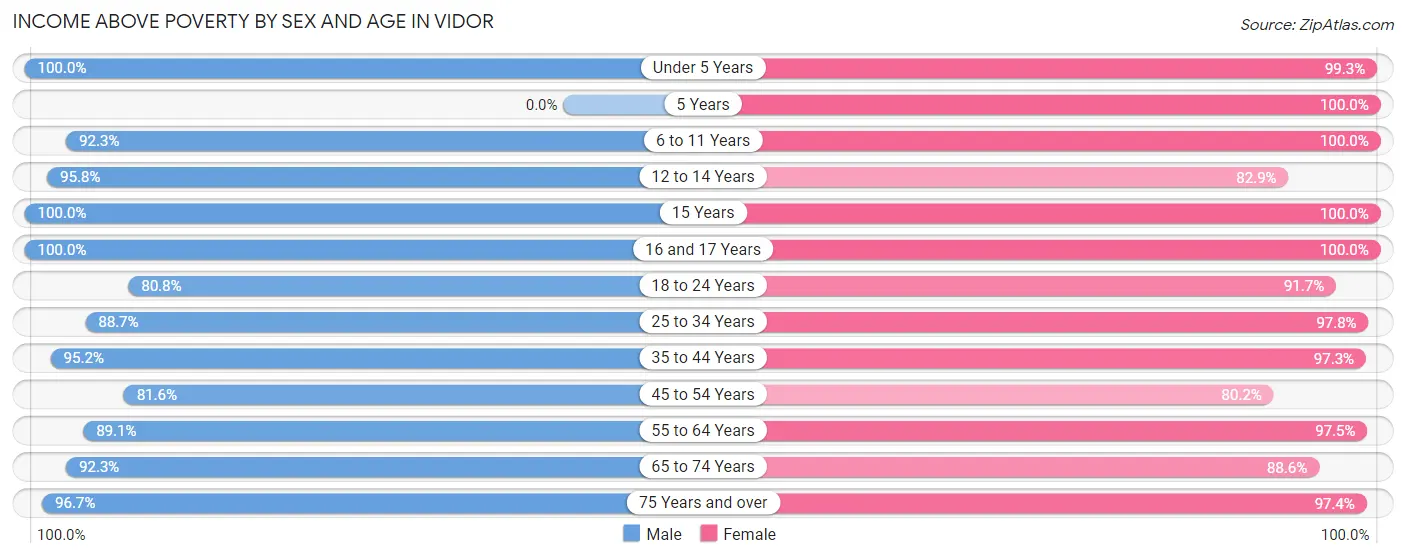
| Age Bracket | Male | Female |
| Under 5 Years | 327 (100.0%) | 149 (99.3%) |
| 5 Years | 0 (0.0%) | 16 (100.0%) |
| 6 to 11 Years | 359 (92.3%) | 330 (100.0%) |
| 12 to 14 Years | 206 (95.8%) | 126 (82.9%) |
| 15 Years | 201 (100.0%) | 61 (100.0%) |
| 16 and 17 Years | 66 (100.0%) | 113 (100.0%) |
| 18 to 24 Years | 281 (80.7%) | 311 (91.7%) |
| 25 to 34 Years | 590 (88.7%) | 740 (97.8%) |
| 35 to 44 Years | 492 (95.2%) | 537 (97.3%) |
| 45 to 54 Years | 607 (81.6%) | 533 (80.1%) |
| 55 to 64 Years | 393 (89.1%) | 751 (97.5%) |
| 65 to 74 Years | 445 (92.3%) | 597 (88.6%) |
| 75 Years and over | 178 (96.7%) | 415 (97.4%) |
| Total | 4,145 (90.5%) | 4,679 (93.5%) |
Income Below Poverty Among Married-Couple Families in Vidor
The poverty statistics for married-couple families in Vidor show that 4.6% or 80 of the total 1,747 families live below the poverty line. Families with 3 or 4 children have the highest poverty rate of 13.2%, comprising of 20 families. On the other hand, families with 1 or 2 children have the lowest poverty rate of 0.0%, which includes 0 families.
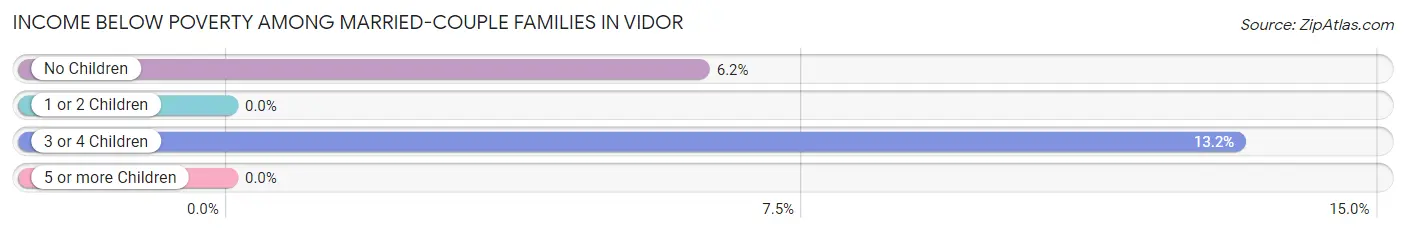
| Children | Above Poverty | Below Poverty |
| No Children | 914 (93.8%) | 60 (6.2%) |
| 1 or 2 Children | 595 (100.0%) | 0 (0.0%) |
| 3 or 4 Children | 132 (86.8%) | 20 (13.2%) |
| 5 or more Children | 26 (100.0%) | 0 (0.0%) |
| Total | 1,667 (95.4%) | 80 (4.6%) |
Income Below Poverty Among Single-Parent Households in Vidor
According to the poverty data in Vidor, 7.3% or 9 single-father households and 18.2% or 95 single-mother households are living below the poverty line. Among single-father households, those with no children have the highest poverty rate, with 9 households (17.3%) experiencing poverty. Likewise, among single-mother households, those with no children have the highest poverty rate, with 84 households (30.8%) falling below the poverty line.
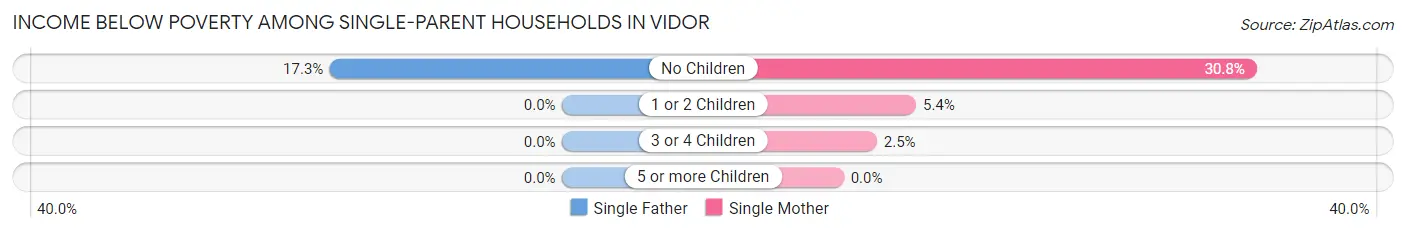
| Children | Single Father | Single Mother |
| No Children | 9 (17.3%) | 84 (30.8%) |
| 1 or 2 Children | 0 (0.0%) | 9 (5.4%) |
| 3 or 4 Children | 0 (0.0%) | 2 (2.5%) |
| 5 or more Children | 0 (0.0%) | 0 (0.0%) |
| Total | 9 (7.3%) | 95 (18.2%) |
Income Below Poverty Among Married-Couple vs Single-Parent Households in Vidor
The poverty data for Vidor shows that 80 of the married-couple family households (4.6%) and 104 of the single-parent households (16.2%) are living below the poverty level. Within the married-couple family households, those with 3 or 4 children have the highest poverty rate, with 20 households (13.2%) falling below the poverty line. Among the single-parent households, those with no children have the highest poverty rate, with 93 household (28.6%) living below poverty.
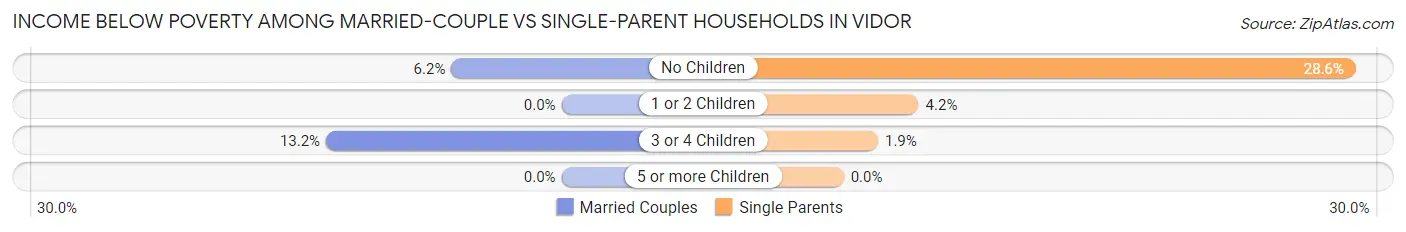
| Children | Married-Couple Families | Single-Parent Households |
| No Children | 60 (6.2%) | 93 (28.6%) |
| 1 or 2 Children | 0 (0.0%) | 9 (4.2%) |
| 3 or 4 Children | 20 (13.2%) | 2 (1.9%) |
| 5 or more Children | 0 (0.0%) | 0 (0.0%) |
| Total | 80 (4.6%) | 104 (16.2%) |
Race in Vidor
The most populous races in Vidor are White / Caucasian (9,287 | 94.7%), Hispanic or Latino (1,057 | 10.8%), and Two or more Races (380 | 3.9%).
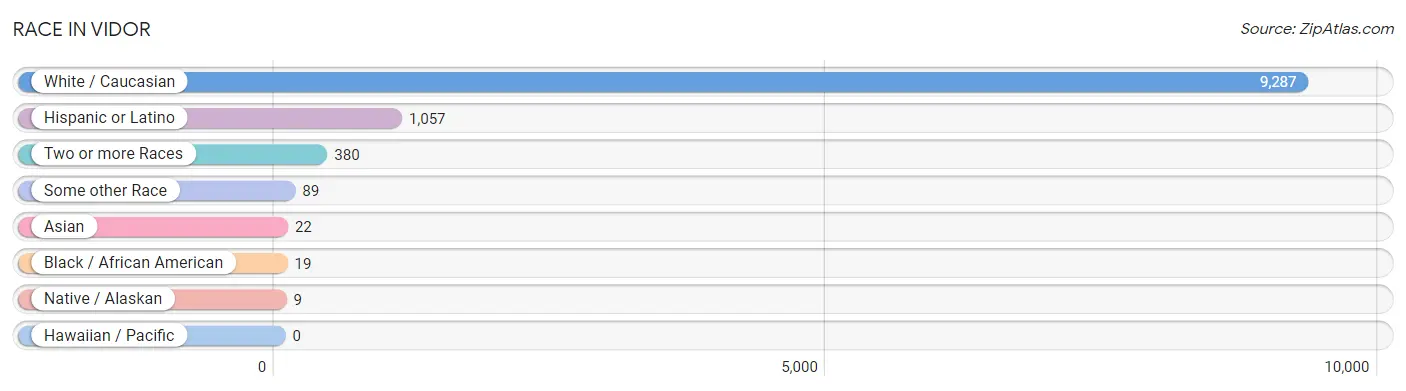
| Race | # Population | % Population |
| Asian | 22 | 0.2% |
| Black / African American | 19 | 0.2% |
| Hawaiian / Pacific | 0 | 0.0% |
| Hispanic or Latino | 1,057 | 10.8% |
| Native / Alaskan | 9 | 0.1% |
| White / Caucasian | 9,287 | 94.7% |
| Two or more Races | 380 | 3.9% |
| Some other Race | 89 | 0.9% |
| Total | 9,806 | 100.0% |
Ancestry in Vidor
The most populous ancestries reported in Vidor are German (1,777 | 18.1%), Irish (1,215 | 12.4%), French (1,109 | 11.3%), Mexican (874 | 8.9%), and English (780 | 8.0%), together accounting for 58.7% of all Vidor residents.
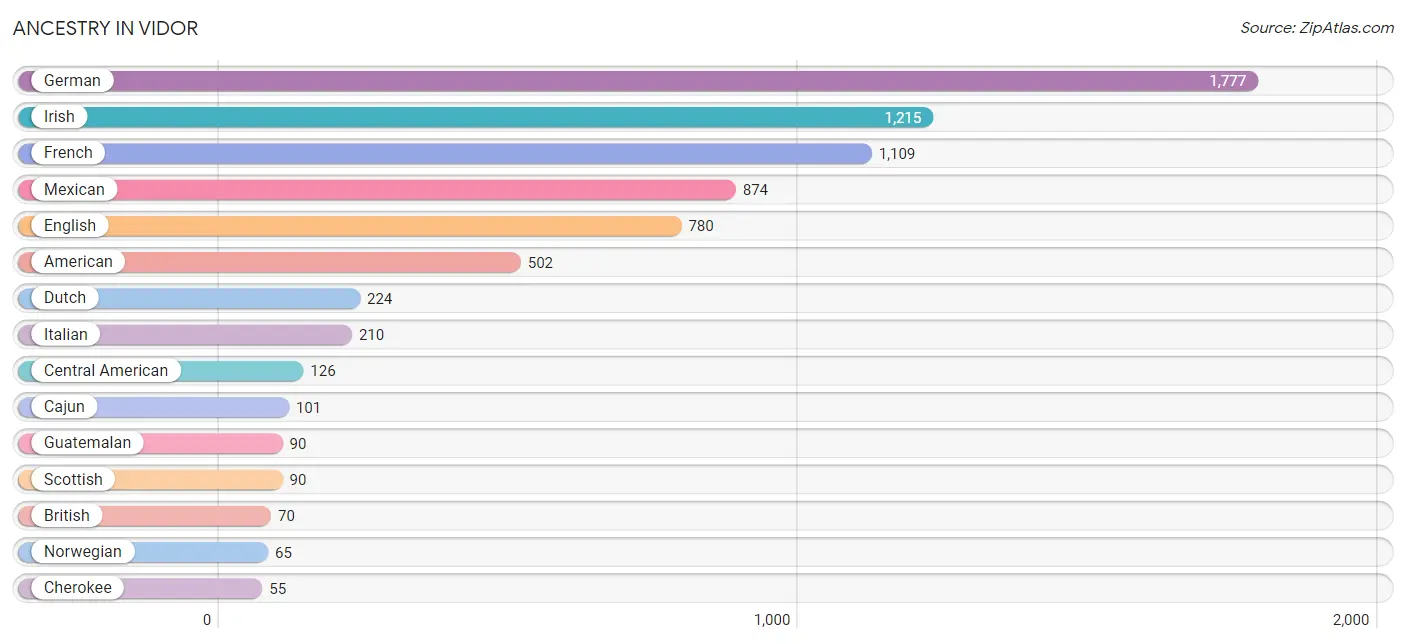
| Ancestry | # Population | % Population |
| American | 502 | 5.1% |
| British | 70 | 0.7% |
| Cajun | 101 | 1.0% |
| Canadian | 12 | 0.1% |
| Central American | 126 | 1.3% |
| Cherokee | 55 | 0.6% |
| Choctaw | 30 | 0.3% |
| Creek | 9 | 0.1% |
| Cuban | 12 | 0.1% |
| Czech | 32 | 0.3% |
| Dutch | 224 | 2.3% |
| Eastern European | 27 | 0.3% |
| English | 780 | 8.0% |
| European | 46 | 0.5% |
| French | 1,109 | 11.3% |
| French Canadian | 41 | 0.4% |
| German | 1,777 | 18.1% |
| Guatemalan | 90 | 0.9% |
| Irish | 1,215 | 12.4% |
| Italian | 210 | 2.1% |
| Mexican | 874 | 8.9% |
| Northern European | 27 | 0.3% |
| Norwegian | 65 | 0.7% |
| Osage | 9 | 0.1% |
| Panamanian | 30 | 0.3% |
| Polish | 46 | 0.5% |
| Salvadoran | 6 | 0.1% |
| Scandinavian | 10 | 0.1% |
| Scotch-Irish | 33 | 0.3% |
| Scottish | 90 | 0.9% |
| Spanish | 23 | 0.2% |
| Swedish | 5 | 0.1% |
| Thai | 22 | 0.2% |
| Welsh | 20 | 0.2% | View All 34 Rows |
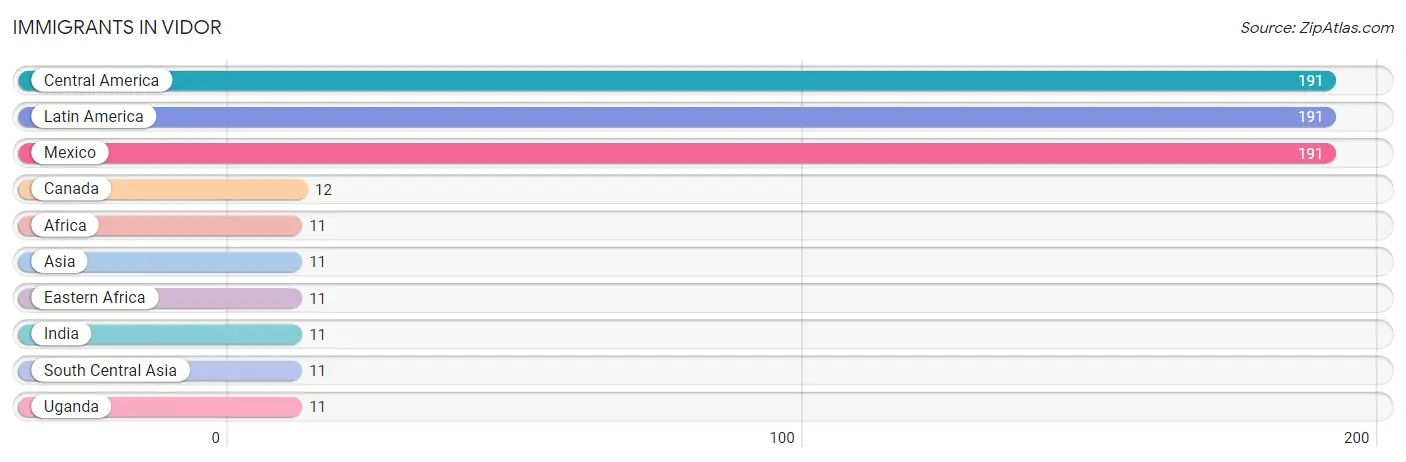
Immigrants in Vidor
The most numerous immigrant groups reported in Vidor came from Central America (191 | 1.9%), Latin America (191 | 1.9%), Mexico (191 | 1.9%), Canada (12 | 0.1%), and Africa (11 | 0.1%), together accounting for 6.1% of all Vidor residents.
| Immigration Origin | # Population | % Population |
| Africa | 11 | 0.1% |
| Asia | 11 | 0.1% |
| Canada | 12 | 0.1% |
| Central America | 191 | 1.9% |
| Eastern Africa | 11 | 0.1% |
| India | 11 | 0.1% |
| Latin America | 191 | 1.9% |
| Mexico | 191 | 1.9% |
| South Central Asia | 11 | 0.1% |
| Uganda | 11 | 0.1% | View All 10 Rows |
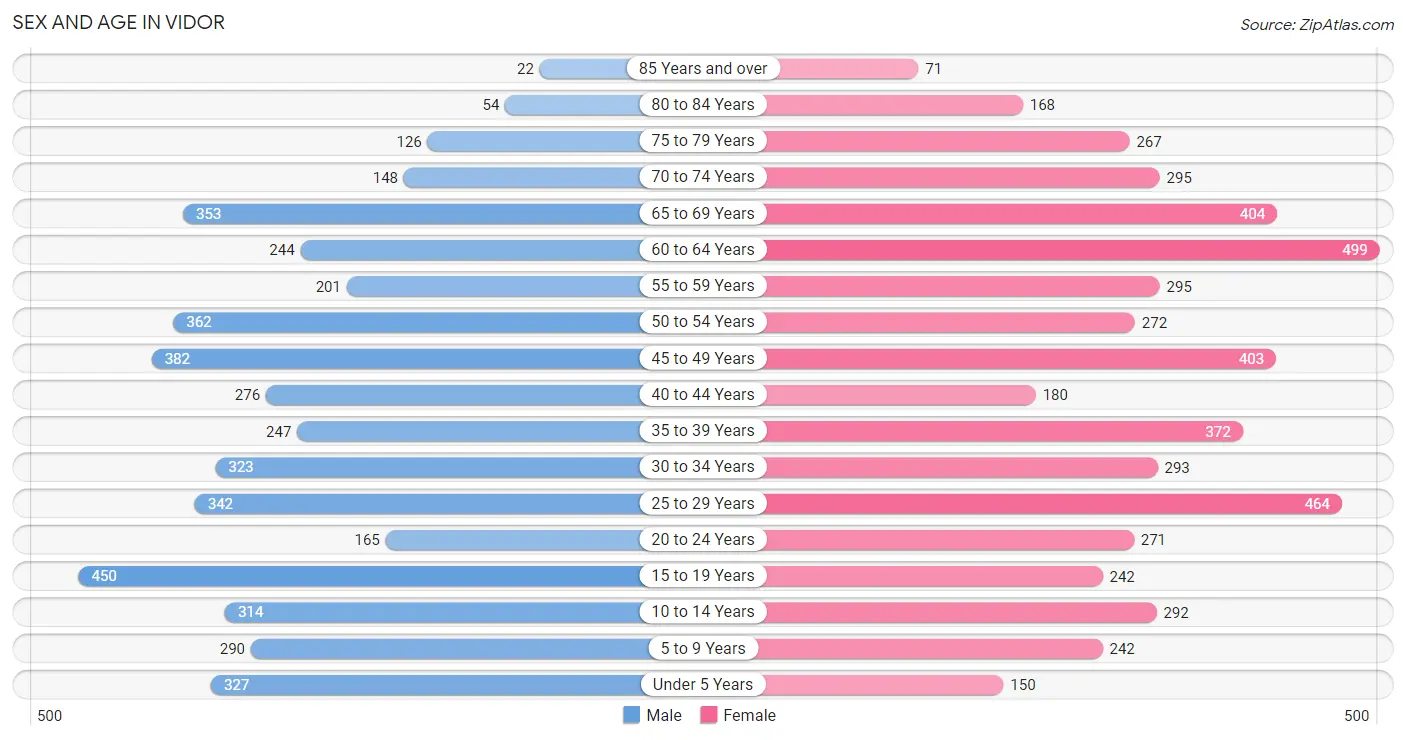
Sex and Age in Vidor
Sex and Age in Vidor
The most populous age groups in Vidor are 15 to 19 Years (450 | 9.7%) for men and 60 to 64 Years (499 | 9.6%) for women.
| Age Bracket | Male | Female |
| Under 5 Years | 327 (7.1%) | 150 (2.9%) |
| 5 to 9 Years | 290 (6.3%) | 242 (4.7%) |
| 10 to 14 Years | 314 (6.8%) | 292 (5.6%) |
| 15 to 19 Years | 450 (9.7%) | 242 (4.7%) |
| 20 to 24 Years | 165 (3.6%) | 271 (5.2%) |
| 25 to 29 Years | 342 (7.4%) | 464 (9.0%) |
| 30 to 34 Years | 323 (7.0%) | 293 (5.7%) |
| 35 to 39 Years | 247 (5.3%) | 372 (7.2%) |
| 40 to 44 Years | 276 (6.0%) | 180 (3.5%) |
| 45 to 49 Years | 382 (8.3%) | 403 (7.8%) |
| 50 to 54 Years | 362 (7.8%) | 272 (5.2%) |
| 55 to 59 Years | 201 (4.3%) | 295 (5.7%) |
| 60 to 64 Years | 244 (5.3%) | 499 (9.6%) |
| 65 to 69 Years | 353 (7.6%) | 404 (7.8%) |
| 70 to 74 Years | 148 (3.2%) | 295 (5.7%) |
| 75 to 79 Years | 126 (2.7%) | 267 (5.1%) |
| 80 to 84 Years | 54 (1.2%) | 168 (3.2%) |
| 85 Years and over | 22 (0.5%) | 71 (1.4%) |
| Total | 4,626 (100.0%) | 5,180 (100.0%) |
Families and Households in Vidor
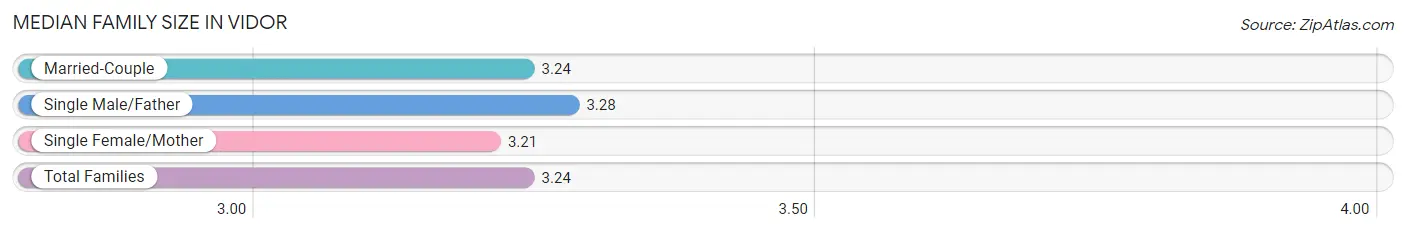
Median Family Size in Vidor
The median family size in Vidor is 3.24 persons per family, with single male/father families (123 | 5.1%) accounting for the largest median family size of 3.28 persons per family. On the other hand, single female/mother families (521 | 21.8%) represent the smallest median family size with 3.21 persons per family.
| Family Type | # Families | Family Size |
| Married-Couple | 1,747 (73.1%) | 3.24 |
| Single Male/Father | 123 (5.1%) | 3.28 |
| Single Female/Mother | 521 (21.8%) | 3.21 |
| Total Families | 2,391 (100.0%) | 3.24 |
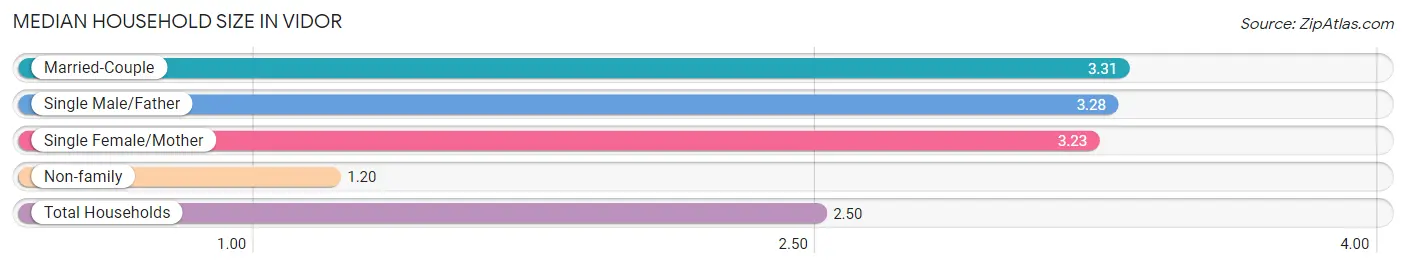
Median Household Size in Vidor
The median household size in Vidor is 2.50 persons per household, with married-couple households (1,747 | 45.4%) accounting for the largest median household size of 3.31 persons per household. non-family households (1,460 | 37.9%) represent the smallest median household size with 1.20 persons per household.
| Household Type | # Households | Household Size |
| Married-Couple | 1,747 (45.4%) | 3.31 |
| Single Male/Father | 123 (3.2%) | 3.28 |
| Single Female/Mother | 521 (13.5%) | 3.23 |
| Non-family | 1,460 (37.9%) | 1.20 |
| Total Households | 3,851 (100.0%) | 2.50 |
Household Size by Marriage Status in Vidor
Out of a total of 3,851 households in Vidor, 2,391 (62.1%) are family households, while 1,460 (37.9%) are nonfamily households. The most numerous type of family households are 2-person households, comprising 989, and the most common type of nonfamily households are 1-person households, comprising 1,254.
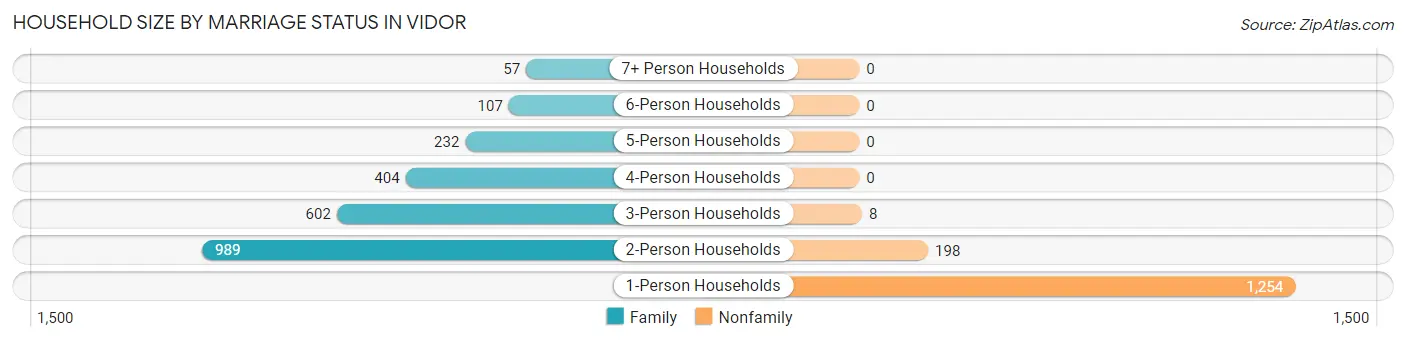
| Household Size | Family Households | Nonfamily Households |
| 1-Person Households | - | 1,254 (32.6%) |
| 2-Person Households | 989 (25.7%) | 198 (5.1%) |
| 3-Person Households | 602 (15.6%) | 8 (0.2%) |
| 4-Person Households | 404 (10.5%) | 0 (0.0%) |
| 5-Person Households | 232 (6.0%) | 0 (0.0%) |
| 6-Person Households | 107 (2.8%) | 0 (0.0%) |
| 7+ Person Households | 57 (1.5%) | 0 (0.0%) |
| Total | 2,391 (62.1%) | 1,460 (37.9%) |
Female Fertility in Vidor
Fertility by Age in Vidor
Average fertility rate in Vidor is 35.0 births per 1,000 women. Women in the age bracket of 35 to 50 years have the highest fertility rate with 53.0 births per 1,000 women. Women in the age bracket of 35 to 50 years acount for 68.8% of all women with births.
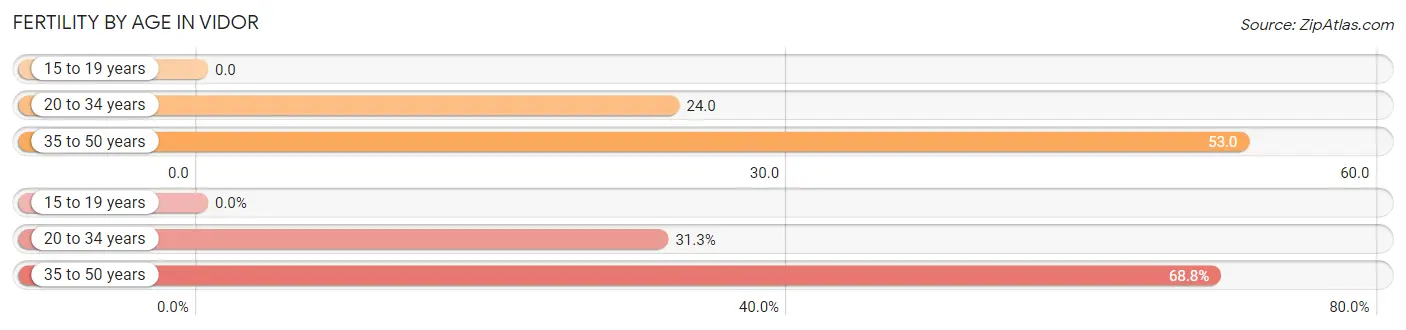
| Age Bracket | Women with Births | Births / 1,000 Women |
| 15 to 19 years | 0 (0.0%) | 0.0 |
| 20 to 34 years | 25 (31.2%) | 24.0 |
| 35 to 50 years | 55 (68.8%) | 53.0 |
| Total | 80 (100.0%) | 35.0 |
Fertility by Age by Marriage Status in Vidor
97.5% of women with births (80) in Vidor are married. The highest percentage of unmarried women with births falls into 35 to 50 years age bracket with 3.6% of them unmarried at the time of birth, while the lowest percentage of unmarried women with births belong to 20 to 34 years age bracket with 0.0% of them unmarried.
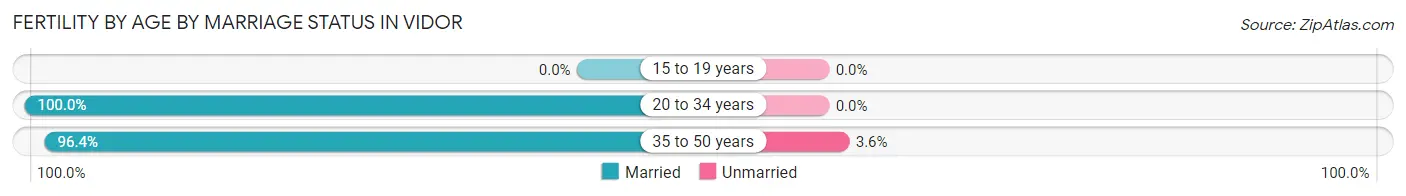
| Age Bracket | Married | Unmarried |
| 15 to 19 years | 0 (0.0%) | 0 (0.0%) |
| 20 to 34 years | 25 (100.0%) | 0 (0.0%) |
| 35 to 50 years | 53 (96.4%) | 2 (3.6%) |
| Total | 78 (97.5%) | 2 (2.5%) |
Fertility by Education in Vidor
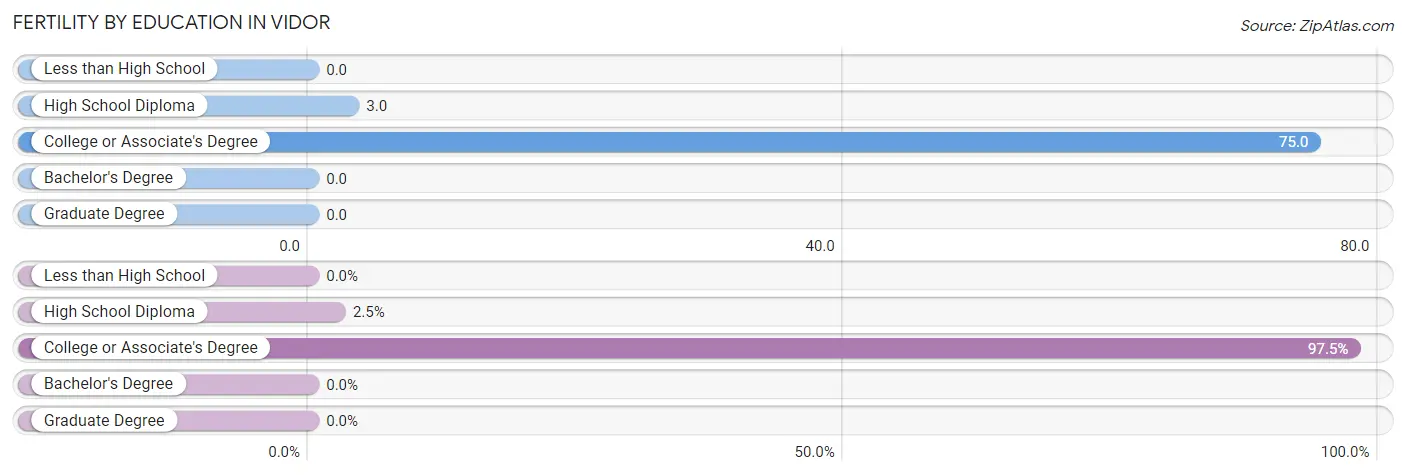
| Educational Attainment | Women with Births | Births / 1,000 Women |
| Less than High School | 0 (0.0%) | 0.0 |
| High School Diploma | 2 (2.5%) | 3.0 |
| College or Associate's Degree | 78 (97.5%) | 75.0 |
| Bachelor's Degree | 0 (0.0%) | 0.0 |
| Graduate Degree | 0 (0.0%) | 0.0 |
| Total | 80 (100.0%) | 35.0 |
Fertility by Education by Marriage Status in Vidor
2.5% of women with births in Vidor are unmarried. Women with the educational attainment of college or associate's degree are most likely to be married with 100.0% of them married at childbirth, while women with the educational attainment of high school diploma are least likely to be married with 100.0% of them unmarried at childbirth.
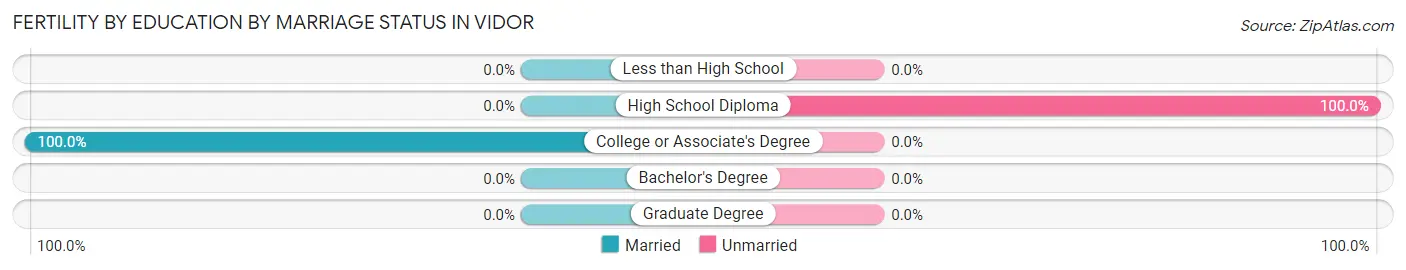
| Educational Attainment | Married | Unmarried |
| Less than High School | 0 (0.0%) | 0 (0.0%) |
| High School Diploma | 0 (0.0%) | 2 (100.0%) |
| College or Associate's Degree | 78 (100.0%) | 0 (0.0%) |
| Bachelor's Degree | 0 (0.0%) | 0 (0.0%) |
| Graduate Degree | 0 (0.0%) | 0 (0.0%) |
| Total | 78 (97.5%) | 2 (2.5%) |
Employment Characteristics in Vidor
Employment by Class of Employer in Vidor
Among the 4,392 employed individuals in Vidor, private company employees (2,928 | 66.7%), self-employed (not incorporated) (473 | 10.8%), and local government employees (364 | 8.3%) make up the most common classes of employment.
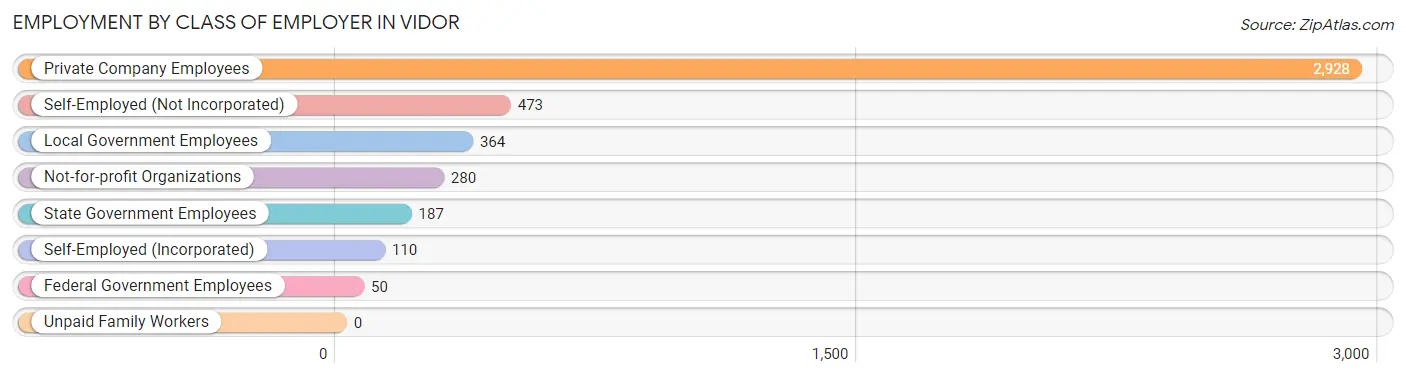
| Employer Class | # Employees | % Employees |
| Private Company Employees | 2,928 | 66.7% |
| Self-Employed (Incorporated) | 110 | 2.5% |
| Self-Employed (Not Incorporated) | 473 | 10.8% |
| Not-for-profit Organizations | 280 | 6.4% |
| Local Government Employees | 364 | 8.3% |
| State Government Employees | 187 | 4.3% |
| Federal Government Employees | 50 | 1.1% |
| Unpaid Family Workers | 0 | 0.0% |
| Total | 4,392 | 100.0% |
Employment Status by Age in Vidor
According to the labor force statistics for Vidor, out of the total population over 16 years of age (7,929), 59.8% or 4,742 individuals are in the labor force, with 7.1% or 337 of them unemployed. The age group with the highest labor force participation rate is 30 to 34 years, with 87.3% or 538 individuals in the labor force. Within the labor force, the 16 to 19 years age range has the highest percentage of unemployed individuals, with 26.5% or 71 of them being unemployed.
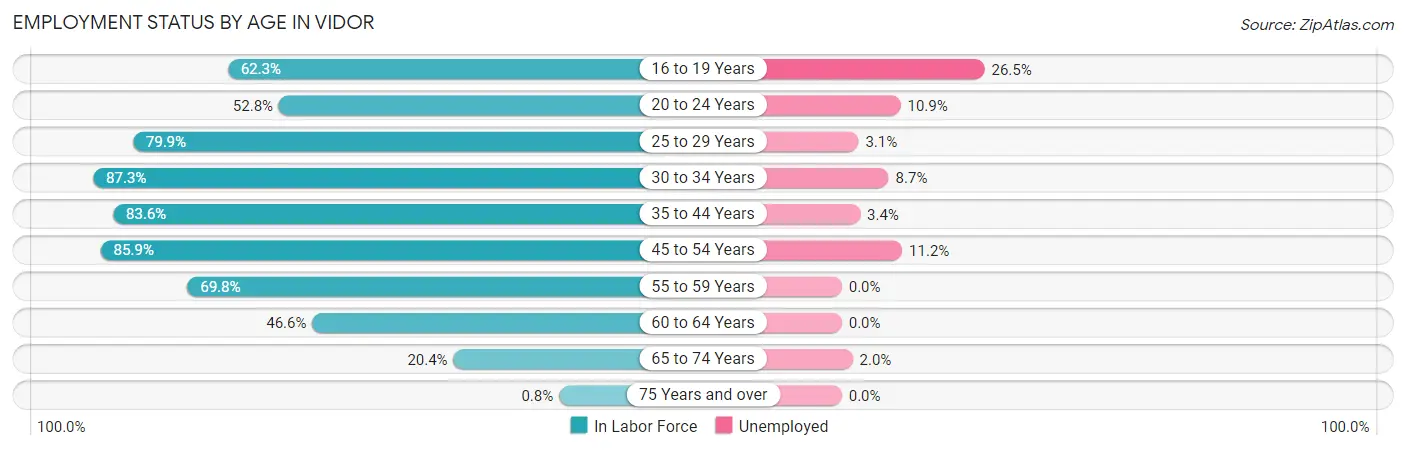
| Age Bracket | In Labor Force | Unemployed |
| 16 to 19 Years | 268 (62.3%) | 71 (26.5%) |
| 20 to 24 Years | 230 (52.8%) | 25 (10.9%) |
| 25 to 29 Years | 644 (79.9%) | 20 (3.1%) |
| 30 to 34 Years | 538 (87.3%) | 47 (8.7%) |
| 35 to 44 Years | 899 (83.6%) | 31 (3.4%) |
| 45 to 54 Years | 1,219 (85.9%) | 137 (11.2%) |
| 55 to 59 Years | 346 (69.8%) | 0 (0.0%) |
| 60 to 64 Years | 346 (46.6%) | 0 (0.0%) |
| 65 to 74 Years | 245 (20.4%) | 5 (2.0%) |
| 75 Years and over | 6 (0.8%) | 0 (0.0%) |
| Total | 4,742 (59.8%) | 337 (7.1%) |
Employment Status by Educational Attainment in Vidor
According to labor force statistics for Vidor, 77.4% of individuals (3,990) out of the total population between 25 and 64 years of age (5,155) are in the labor force, with 5.9% or 235 of them being unemployed. The group with the highest labor force participation rate are those with the educational attainment of bachelor's degree or higher, with 96.8% or 553 individuals in the labor force. Within the labor force, individuals with high school diploma education have the highest percentage of unemployment, with 8.1% or 115 of them being unemployed.
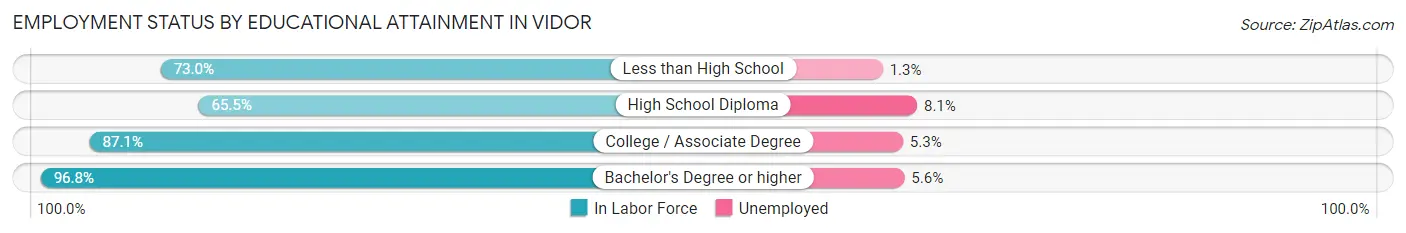
| Educational Attainment | In Labor Force | Unemployed |
| Less than High School | 449 (73.0%) | 8 (1.3%) |
| High School Diploma | 1,416 (65.5%) | 175 (8.1%) |
| College / Associate Degree | 1,574 (87.1%) | 96 (5.3%) |
| Bachelor's Degree or higher | 553 (96.8%) | 32 (5.6%) |
| Total | 3,990 (77.4%) | 304 (5.9%) |
Employment Occupations by Sex in Vidor
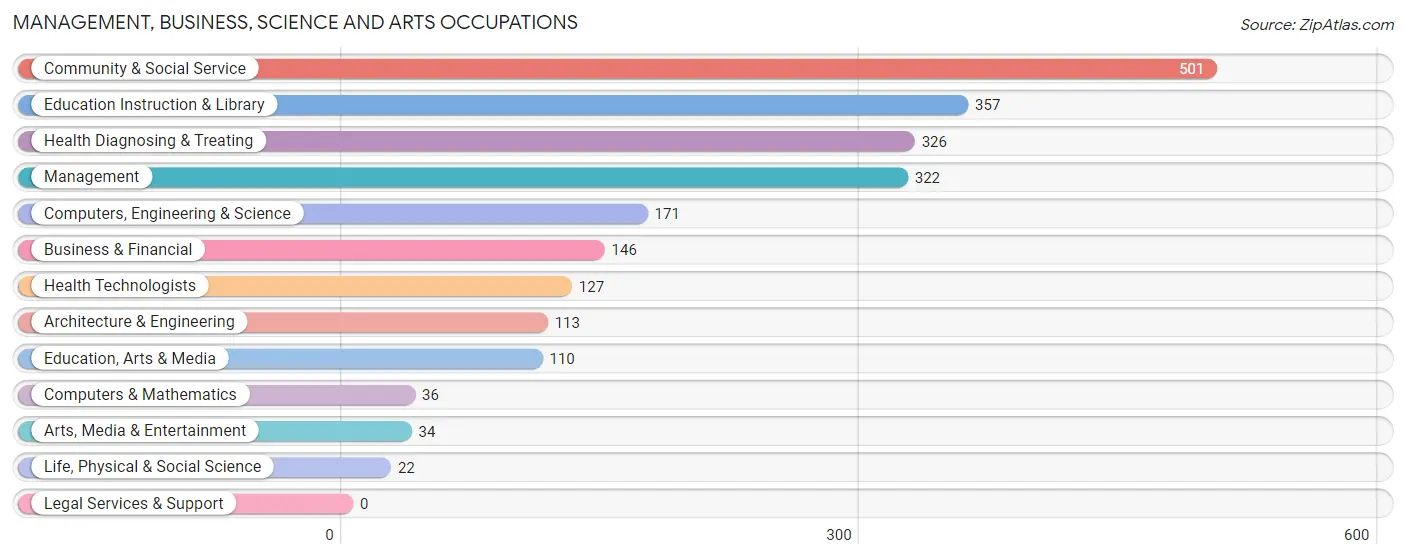
Management, Business, Science and Arts Occupations
The most common Management, Business, Science and Arts occupations in Vidor are Community & Social Service (501 | 11.4%), Education Instruction & Library (357 | 8.1%), Health Diagnosing & Treating (326 | 7.4%), Management (322 | 7.3%), and Computers, Engineering & Science (171 | 3.9%).
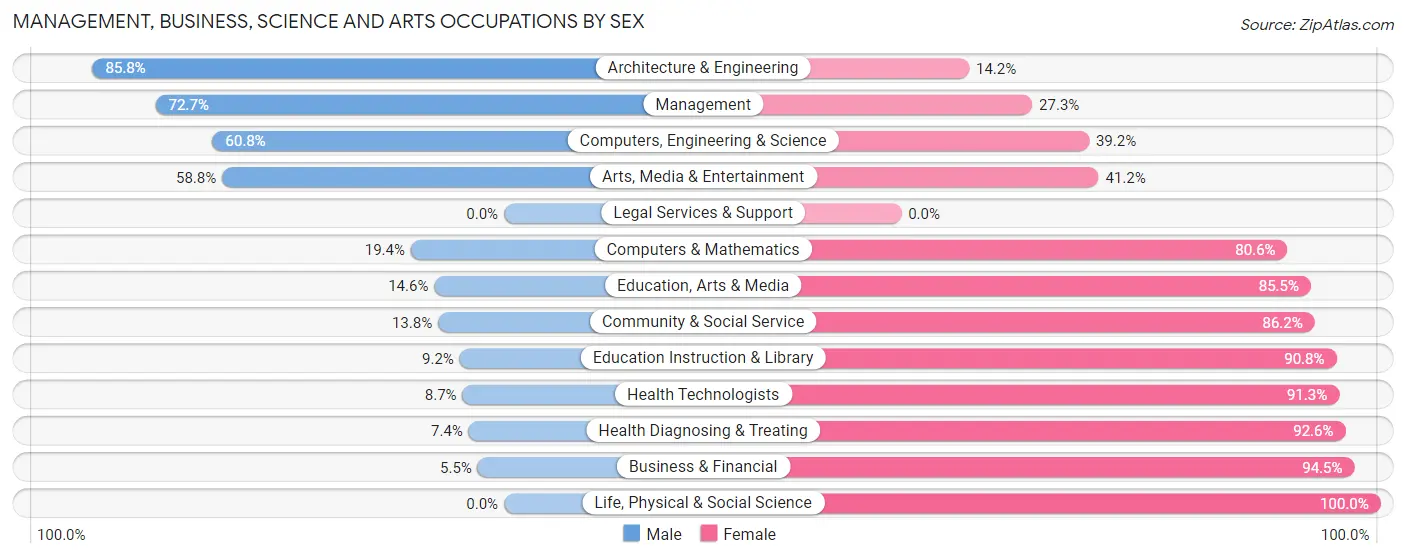
Management, Business, Science and Arts Occupations by Sex
Within the Management, Business, Science and Arts occupations in Vidor, the most male-oriented occupations are Architecture & Engineering (85.8%), Management (72.7%), and Computers, Engineering & Science (60.8%), while the most female-oriented occupations are Life, Physical & Social Science (100.0%), Business & Financial (94.5%), and Health Diagnosing & Treating (92.6%).
| Occupation | Male | Female |
| Management | 234 (72.7%) | 88 (27.3%) |
| Business & Financial | 8 (5.5%) | 138 (94.5%) |
| Computers, Engineering & Science | 104 (60.8%) | 67 (39.2%) |
| Computers & Mathematics | 7 (19.4%) | 29 (80.6%) |
| Architecture & Engineering | 97 (85.8%) | 16 (14.2%) |
| Life, Physical & Social Science | 0 (0.0%) | 22 (100.0%) |
| Community & Social Service | 69 (13.8%) | 432 (86.2%) |
| Education, Arts & Media | 16 (14.5%) | 94 (85.5%) |
| Legal Services & Support | 0 (0.0%) | 0 (0.0%) |
| Education Instruction & Library | 33 (9.2%) | 324 (90.8%) |
| Arts, Media & Entertainment | 20 (58.8%) | 14 (41.2%) |
| Health Diagnosing & Treating | 24 (7.4%) | 302 (92.6%) |
| Health Technologists | 11 (8.7%) | 116 (91.3%) |
| Total (Category) | 439 (29.9%) | 1,027 (70.1%) |
| Total (Overall) | 2,130 (48.3%) | 2,276 (51.7%) |
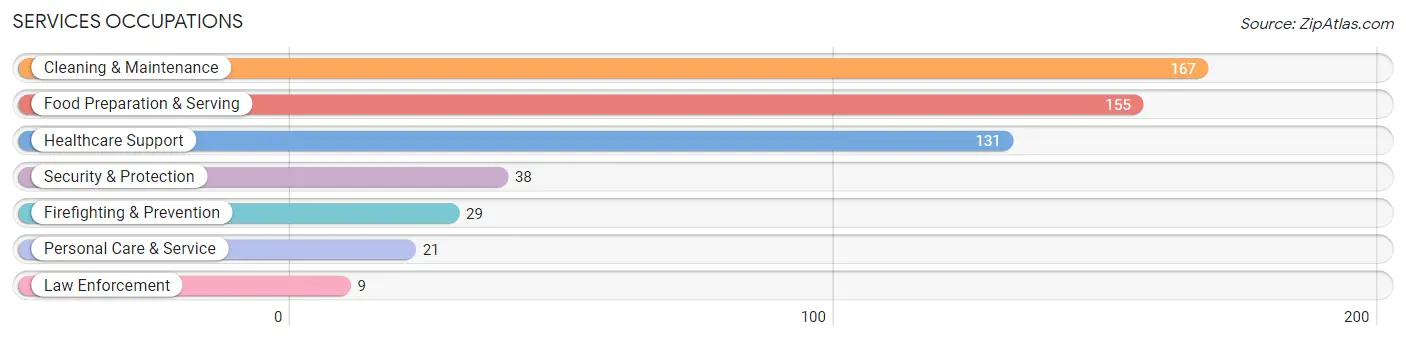
Services Occupations
The most common Services occupations in Vidor are Cleaning & Maintenance (167 | 3.8%), Food Preparation & Serving (155 | 3.5%), Healthcare Support (131 | 3.0%), Security & Protection (38 | 0.9%), and Firefighting & Prevention (29 | 0.7%).
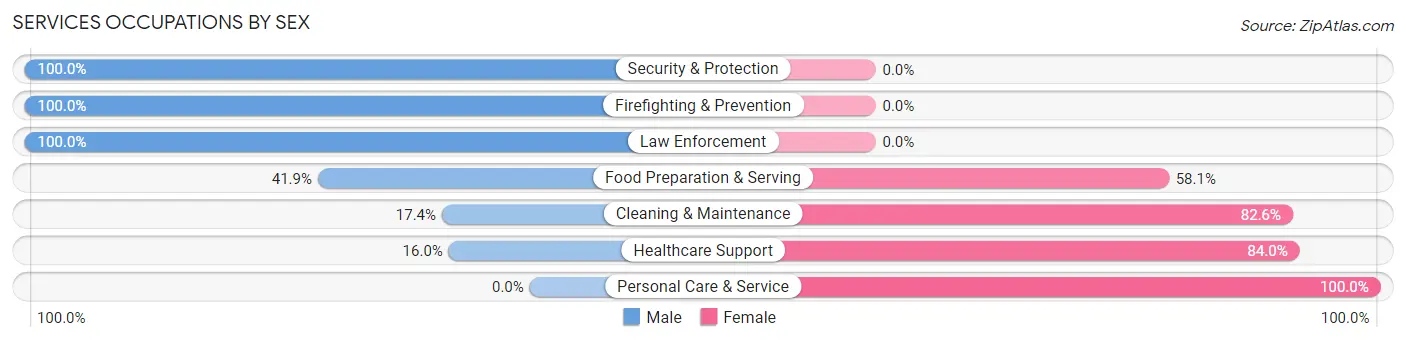
Services Occupations by Sex
Within the Services occupations in Vidor, the most male-oriented occupations are Security & Protection (100.0%), Firefighting & Prevention (100.0%), and Law Enforcement (100.0%), while the most female-oriented occupations are Personal Care & Service (100.0%), Healthcare Support (84.0%), and Cleaning & Maintenance (82.6%).
| Occupation | Male | Female |
| Healthcare Support | 21 (16.0%) | 110 (84.0%) |
| Security & Protection | 38 (100.0%) | 0 (0.0%) |
| Firefighting & Prevention | 29 (100.0%) | 0 (0.0%) |
| Law Enforcement | 9 (100.0%) | 0 (0.0%) |
| Food Preparation & Serving | 65 (41.9%) | 90 (58.1%) |
| Cleaning & Maintenance | 29 (17.4%) | 138 (82.6%) |
| Personal Care & Service | 0 (0.0%) | 21 (100.0%) |
| Total (Category) | 153 (29.9%) | 359 (70.1%) |
| Total (Overall) | 2,130 (48.3%) | 2,276 (51.7%) |
Sales and Office Occupations
The most common Sales and Office occupations in Vidor are Sales & Related (533 | 12.1%), and Office & Administration (523 | 11.9%).
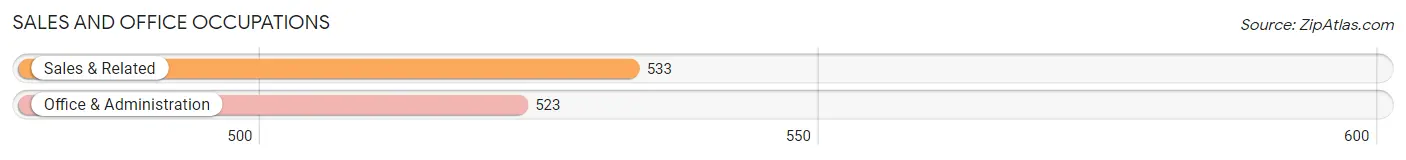
Sales and Office Occupations by Sex

| Occupation | Male | Female |
| Sales & Related | 236 (44.3%) | 297 (55.7%) |
| Office & Administration | 74 (14.1%) | 449 (85.9%) |
| Total (Category) | 310 (29.4%) | 746 (70.6%) |
| Total (Overall) | 2,130 (48.3%) | 2,276 (51.7%) |
Natural Resources, Construction and Maintenance Occupations
The most common Natural Resources, Construction and Maintenance occupations in Vidor are Construction & Extraction (466 | 10.6%), and Installation, Maintenance & Repair (336 | 7.6%).
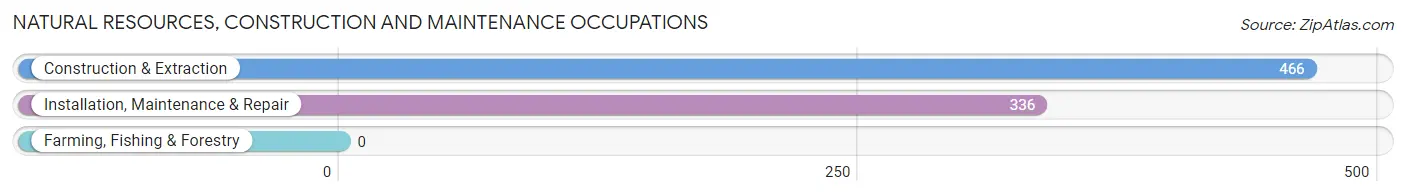
Natural Resources, Construction and Maintenance Occupations by Sex
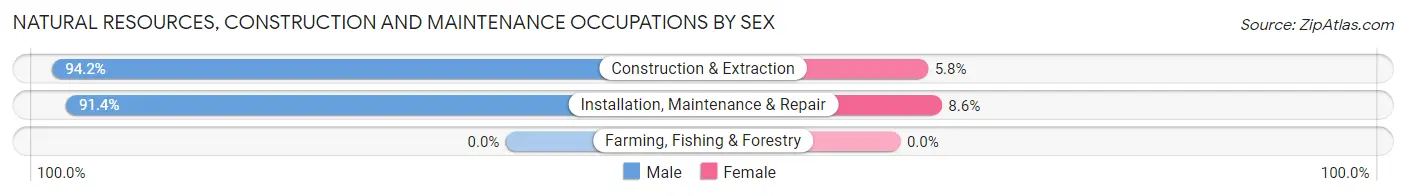
| Occupation | Male | Female |
| Farming, Fishing & Forestry | 0 (0.0%) | 0 (0.0%) |
| Construction & Extraction | 439 (94.2%) | 27 (5.8%) |
| Installation, Maintenance & Repair | 307 (91.4%) | 29 (8.6%) |
| Total (Category) | 746 (93.0%) | 56 (7.0%) |
| Total (Overall) | 2,130 (48.3%) | 2,276 (51.7%) |
Production, Transportation and Moving Occupations
The most common Production, Transportation and Moving occupations in Vidor are Production (253 | 5.7%), Transportation (200 | 4.5%), and Material Moving (117 | 2.7%).
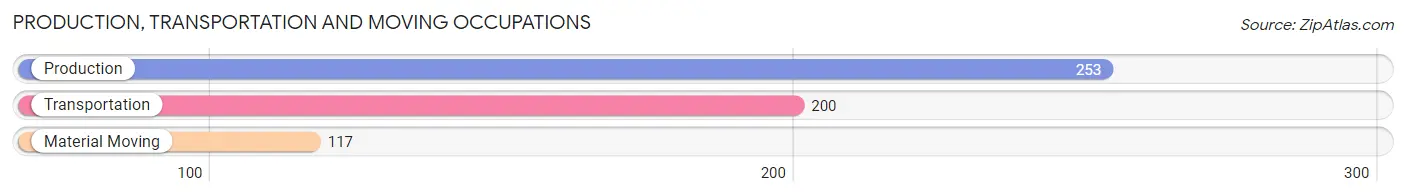
Production, Transportation and Moving Occupations by Sex
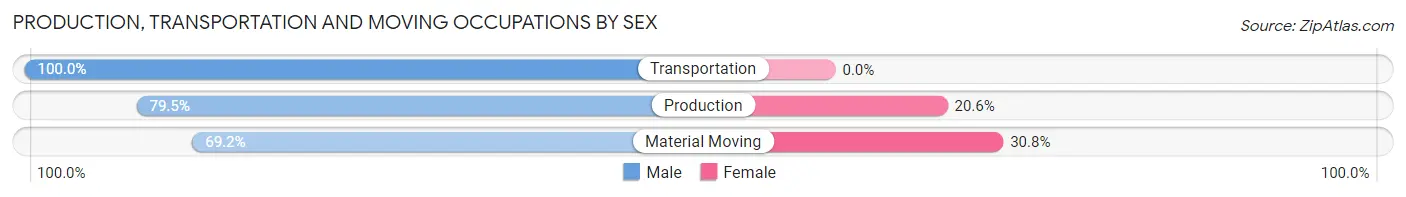
| Occupation | Male | Female |
| Production | 201 (79.4%) | 52 (20.5%) |
| Transportation | 200 (100.0%) | 0 (0.0%) |
| Material Moving | 81 (69.2%) | 36 (30.8%) |
| Total (Category) | 482 (84.6%) | 88 (15.4%) |
| Total (Overall) | 2,130 (48.3%) | 2,276 (51.7%) |
Employment Industries by Sex in Vidor
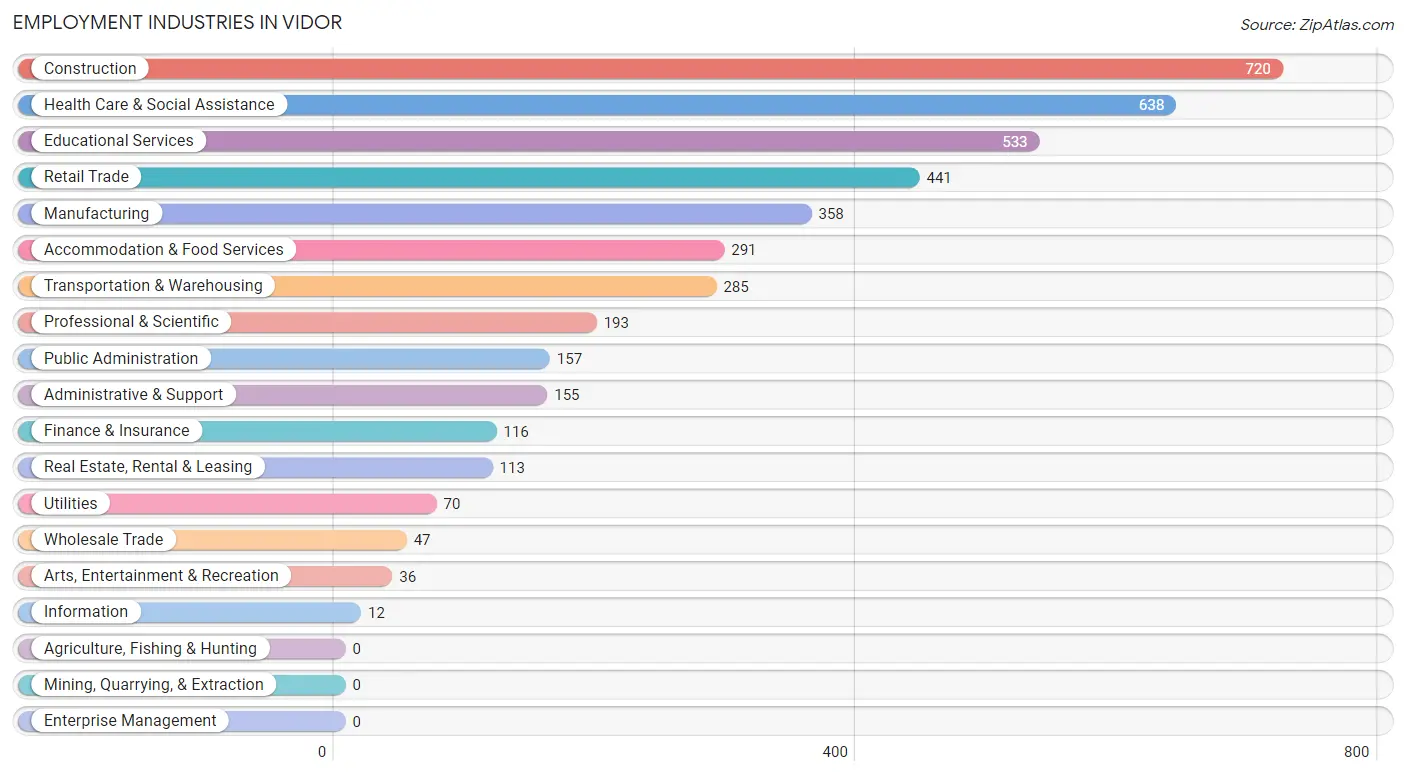
Employment Industries in Vidor
The major employment industries in Vidor include Construction (720 | 16.3%), Health Care & Social Assistance (638 | 14.5%), Educational Services (533 | 12.1%), Retail Trade (441 | 10.0%), and Manufacturing (358 | 8.1%).
Employment Industries by Sex in Vidor
The Vidor industries that see more men than women are Wholesale Trade (100.0%), Transportation & Warehousing (100.0%), and Arts, Entertainment & Recreation (100.0%), whereas the industries that tend to have a higher number of women are Utilities (100.0%), Information (100.0%), and Finance & Insurance (100.0%).
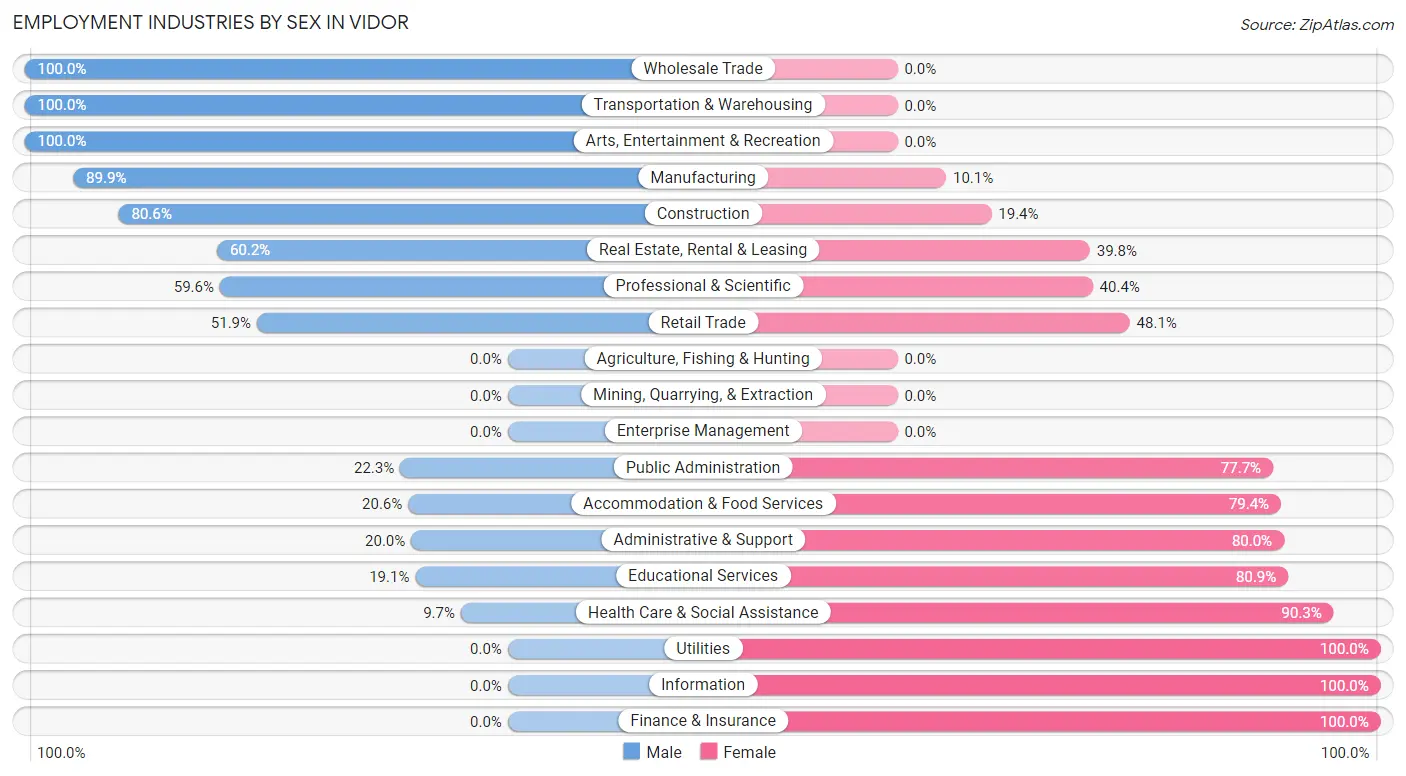
| Industry | Male | Female |
| Agriculture, Fishing & Hunting | 0 (0.0%) | 0 (0.0%) |
| Mining, Quarrying, & Extraction | 0 (0.0%) | 0 (0.0%) |
| Construction | 580 (80.6%) | 140 (19.4%) |
| Manufacturing | 322 (89.9%) | 36 (10.1%) |
| Wholesale Trade | 47 (100.0%) | 0 (0.0%) |
| Retail Trade | 229 (51.9%) | 212 (48.1%) |
| Transportation & Warehousing | 285 (100.0%) | 0 (0.0%) |
| Utilities | 0 (0.0%) | 70 (100.0%) |
| Information | 0 (0.0%) | 12 (100.0%) |
| Finance & Insurance | 0 (0.0%) | 116 (100.0%) |
| Real Estate, Rental & Leasing | 68 (60.2%) | 45 (39.8%) |
| Professional & Scientific | 115 (59.6%) | 78 (40.4%) |
| Enterprise Management | 0 (0.0%) | 0 (0.0%) |
| Administrative & Support | 31 (20.0%) | 124 (80.0%) |
| Educational Services | 102 (19.1%) | 431 (80.9%) |
| Health Care & Social Assistance | 62 (9.7%) | 576 (90.3%) |
| Arts, Entertainment & Recreation | 36 (100.0%) | 0 (0.0%) |
| Accommodation & Food Services | 60 (20.6%) | 231 (79.4%) |
| Public Administration | 35 (22.3%) | 122 (77.7%) |
| Total | 2,130 (48.3%) | 2,276 (51.7%) |
Education in Vidor
School Enrollment in Vidor
The most common levels of schooling among the 2,345 students in Vidor are college / undergraduate (624 | 26.6%), middle school (533 | 22.7%), and high school (507 | 21.6%).
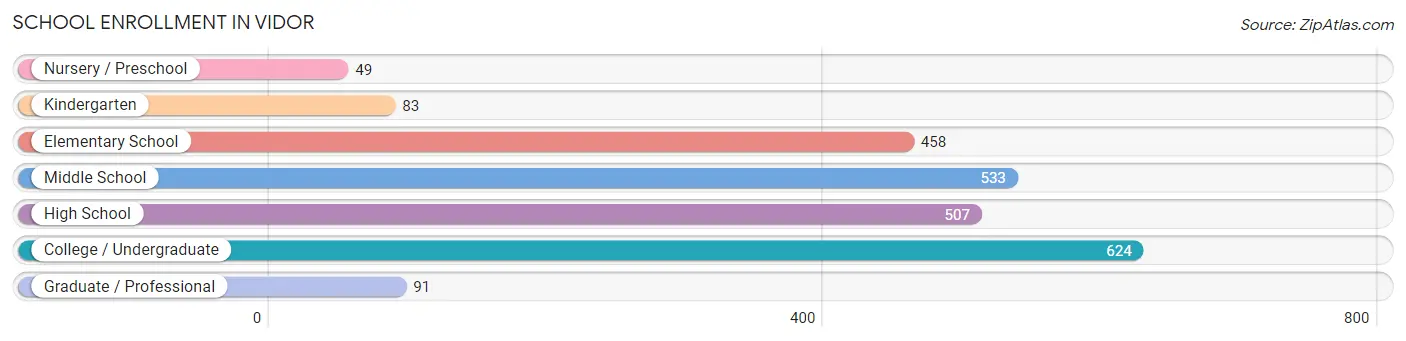
| School Level | # Students | % Students |
| Nursery / Preschool | 49 | 2.1% |
| Kindergarten | 83 | 3.5% |
| Elementary School | 458 | 19.5% |
| Middle School | 533 | 22.7% |
| High School | 507 | 21.6% |
| College / Undergraduate | 624 | 26.6% |
| Graduate / Professional | 91 | 3.9% |
| Total | 2,345 | 100.0% |
School Enrollment by Age by Funding Source in Vidor
Out of a total of 2,345 students who are enrolled in schools in Vidor, 143 (6.1%) attend a private institution, while the remaining 2,202 (93.9%) are enrolled in public schools. The age group of 3 to 4 year olds has the highest likelihood of being enrolled in private schools, with 18 (36.7% in the age bracket) enrolled. Conversely, the age group of 15 to 17 year olds has the lowest likelihood of being enrolled in a private school, with 441 (100.0% in the age bracket) attending a public institution.
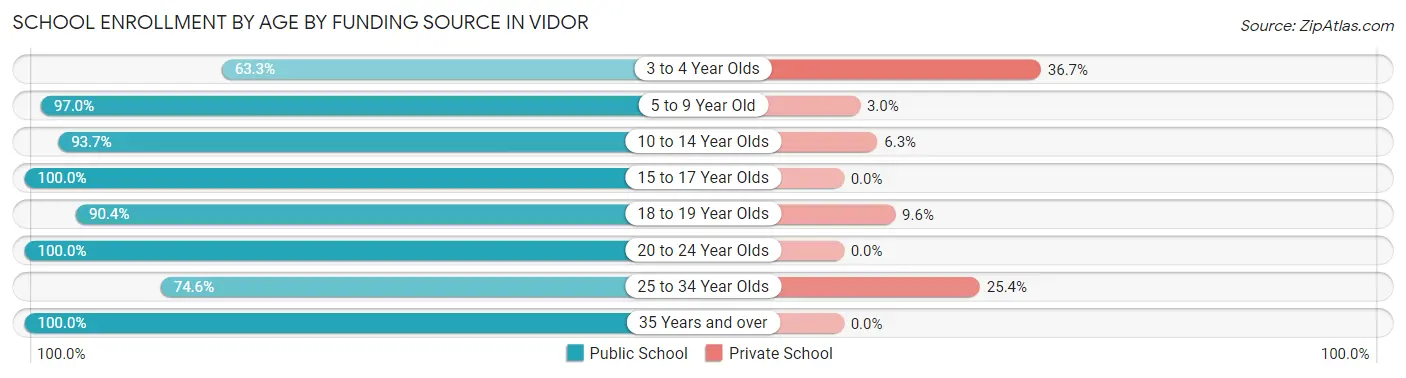
| Age Bracket | Public School | Private School |
| 3 to 4 Year Olds | 31 (63.3%) | 18 (36.7%) |
| 5 to 9 Year Old | 446 (97.0%) | 14 (3.0%) |
| 10 to 14 Year Olds | 568 (93.7%) | 38 (6.3%) |
| 15 to 17 Year Olds | 441 (100.0%) | 0 (0.0%) |
| 18 to 19 Year Olds | 198 (90.4%) | 21 (9.6%) |
| 20 to 24 Year Olds | 268 (100.0%) | 0 (0.0%) |
| 25 to 34 Year Olds | 153 (74.6%) | 52 (25.4%) |
| 35 Years and over | 97 (100.0%) | 0 (0.0%) |
| Total | 2,202 (93.9%) | 143 (6.1%) |
Educational Attainment by Field of Study in Vidor
Arts & humanities (120 | 17.0%), liberal arts & history (100 | 14.1%), science & technology (77 | 10.9%), communications (74 | 10.4%), and psychology (65 | 9.2%) are the most common fields of study among 708 individuals in Vidor who have obtained a bachelor's degree or higher.
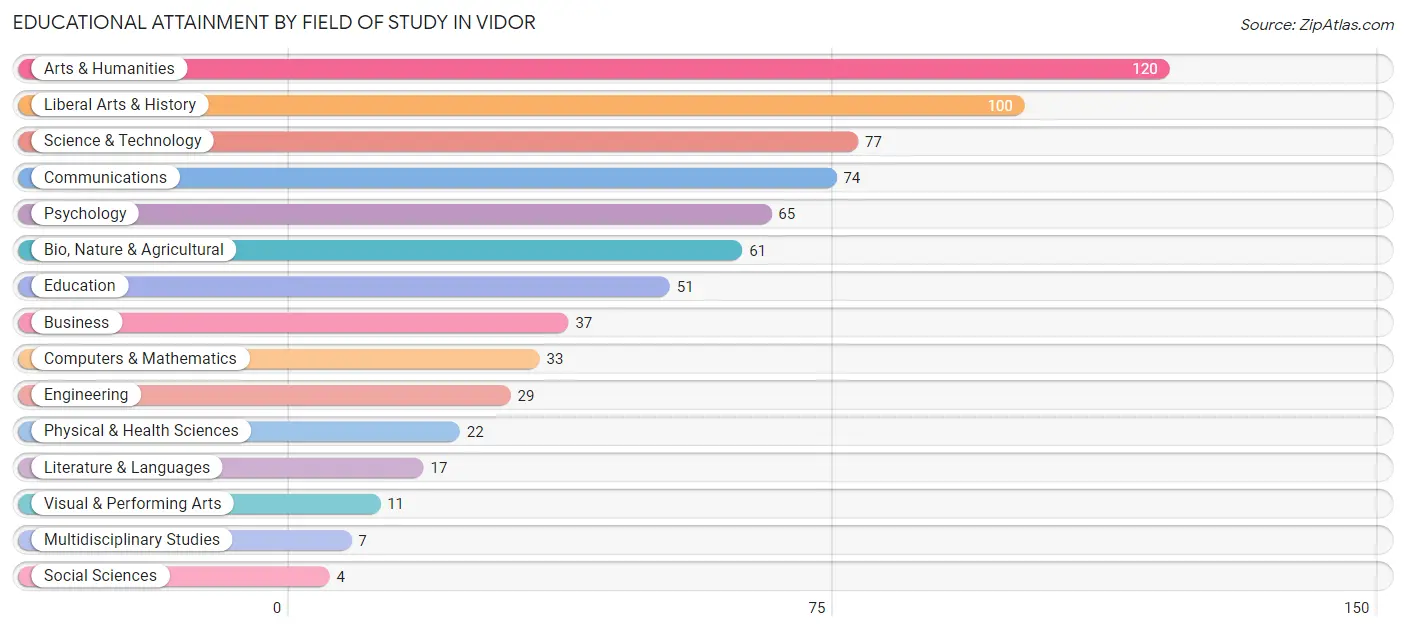
| Field of Study | # Graduates | % Graduates |
| Computers & Mathematics | 33 | 4.7% |
| Bio, Nature & Agricultural | 61 | 8.6% |
| Physical & Health Sciences | 22 | 3.1% |
| Psychology | 65 | 9.2% |
| Social Sciences | 4 | 0.6% |
| Engineering | 29 | 4.1% |
| Multidisciplinary Studies | 7 | 1.0% |
| Science & Technology | 77 | 10.9% |
| Business | 37 | 5.2% |
| Education | 51 | 7.2% |
| Literature & Languages | 17 | 2.4% |
| Liberal Arts & History | 100 | 14.1% |
| Visual & Performing Arts | 11 | 1.5% |
| Communications | 74 | 10.4% |
| Arts & Humanities | 120 | 17.0% |
| Total | 708 | 100.0% |
Transportation & Commute in Vidor
Vehicle Availability by Sex in Vidor
The most prevalent vehicle ownership categories in Vidor are males with 2 vehicles (1,066, accounting for 50.1%) and females with 2 vehicles (1,185, making up 47.1%).
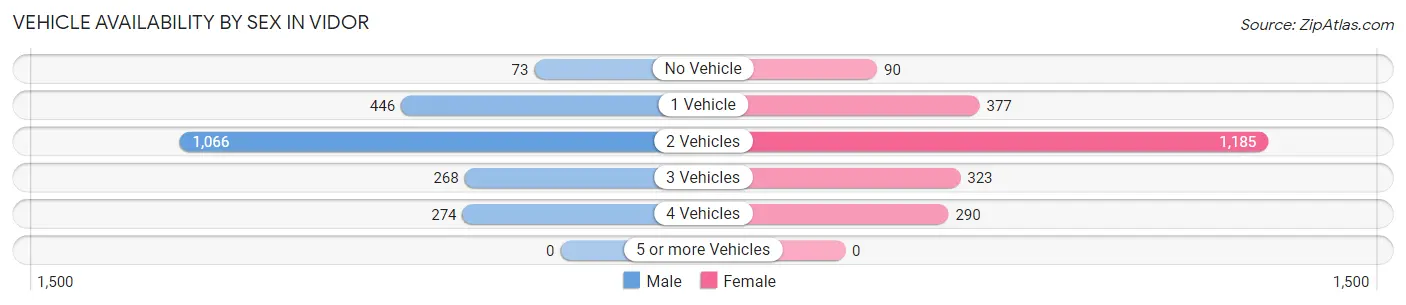
| Vehicles Available | Male | Female |
| No Vehicle | 73 (3.4%) | 90 (4.0%) |
| 1 Vehicle | 446 (21.0%) | 377 (16.6%) |
| 2 Vehicles | 1,066 (50.1%) | 1,185 (52.3%) |
| 3 Vehicles | 268 (12.6%) | 323 (14.3%) |
| 4 Vehicles | 274 (12.9%) | 290 (12.8%) |
| 5 or more Vehicles | 0 (0.0%) | 0 (0.0%) |
| Total | 2,127 (100.0%) | 2,265 (100.0%) |
Commute Time in Vidor
The most frequently occuring commute durations in Vidor are 20 to 24 minutes (795 commuters, 18.6%), 15 to 19 minutes (782 commuters, 18.3%), and 10 to 14 minutes (586 commuters, 13.7%).
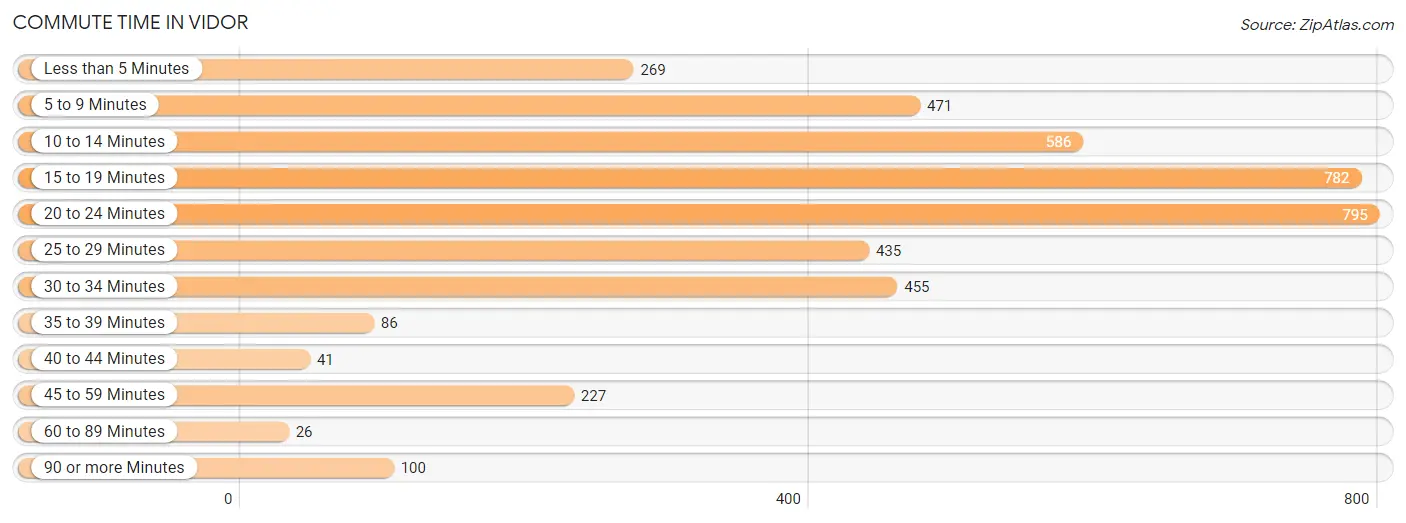
| Commute Time | # Commuters | % Commuters |
| Less than 5 Minutes | 269 | 6.3% |
| 5 to 9 Minutes | 471 | 11.0% |
| 10 to 14 Minutes | 586 | 13.7% |
| 15 to 19 Minutes | 782 | 18.3% |
| 20 to 24 Minutes | 795 | 18.6% |
| 25 to 29 Minutes | 435 | 10.2% |
| 30 to 34 Minutes | 455 | 10.6% |
| 35 to 39 Minutes | 86 | 2.0% |
| 40 to 44 Minutes | 41 | 1.0% |
| 45 to 59 Minutes | 227 | 5.3% |
| 60 to 89 Minutes | 26 | 0.6% |
| 90 or more Minutes | 100 | 2.3% |
Commute Time by Sex in Vidor
The most common commute times in Vidor are 20 to 24 minutes (419 commuters, 20.0%) for males and 15 to 19 minutes (519 commuters, 23.8%) for females.
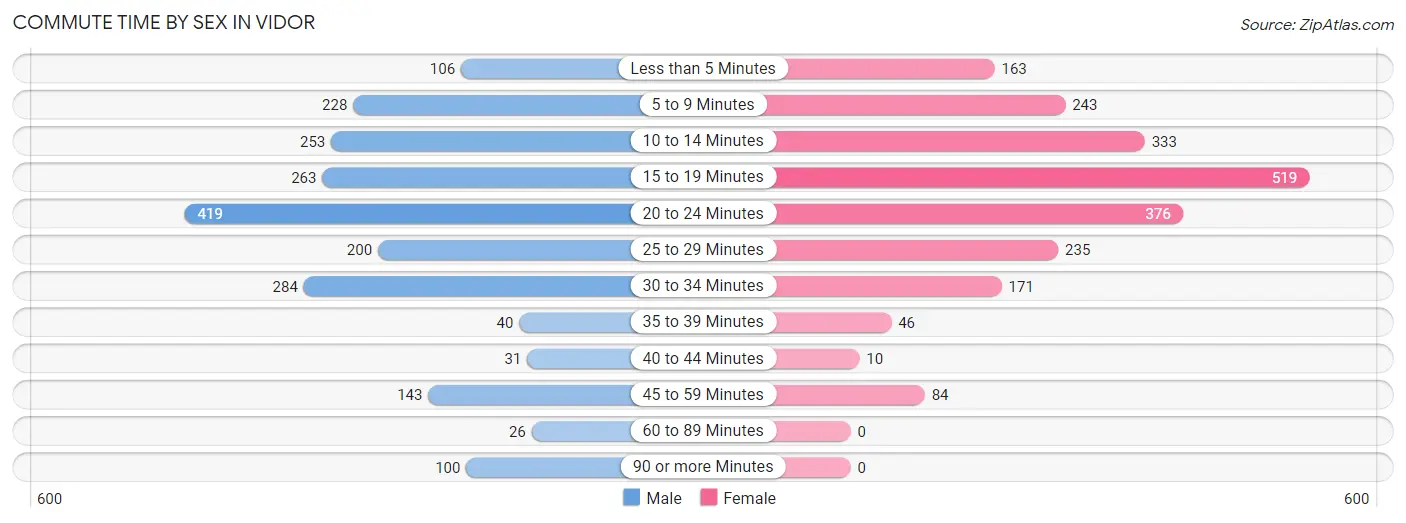
| Commute Time | Male | Female |
| Less than 5 Minutes | 106 (5.1%) | 163 (7.5%) |
| 5 to 9 Minutes | 228 (10.9%) | 243 (11.2%) |
| 10 to 14 Minutes | 253 (12.1%) | 333 (15.3%) |
| 15 to 19 Minutes | 263 (12.6%) | 519 (23.8%) |
| 20 to 24 Minutes | 419 (20.0%) | 376 (17.2%) |
| 25 to 29 Minutes | 200 (9.6%) | 235 (10.8%) |
| 30 to 34 Minutes | 284 (13.6%) | 171 (7.8%) |
| 35 to 39 Minutes | 40 (1.9%) | 46 (2.1%) |
| 40 to 44 Minutes | 31 (1.5%) | 10 (0.5%) |
| 45 to 59 Minutes | 143 (6.8%) | 84 (3.8%) |
| 60 to 89 Minutes | 26 (1.2%) | 0 (0.0%) |
| 90 or more Minutes | 100 (4.8%) | 0 (0.0%) |
Time of Departure to Work by Sex in Vidor
The most frequent times of departure to work in Vidor are 7:00 AM to 7:29 AM (398, 19.0%) for males and 6:30 AM to 6:59 AM (543, 24.9%) for females.
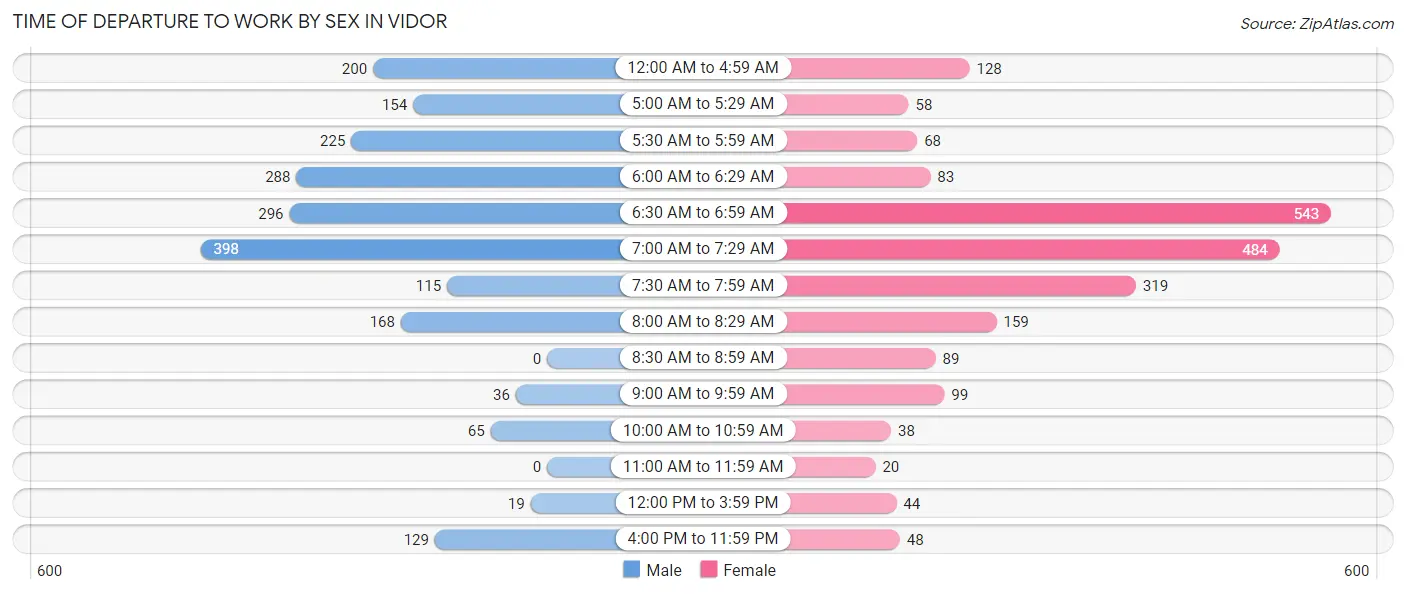
| Time of Departure | Male | Female |
| 12:00 AM to 4:59 AM | 200 (9.6%) | 128 (5.9%) |
| 5:00 AM to 5:29 AM | 154 (7.4%) | 58 (2.7%) |
| 5:30 AM to 5:59 AM | 225 (10.7%) | 68 (3.1%) |
| 6:00 AM to 6:29 AM | 288 (13.8%) | 83 (3.8%) |
| 6:30 AM to 6:59 AM | 296 (14.1%) | 543 (24.9%) |
| 7:00 AM to 7:29 AM | 398 (19.0%) | 484 (22.2%) |
| 7:30 AM to 7:59 AM | 115 (5.5%) | 319 (14.6%) |
| 8:00 AM to 8:29 AM | 168 (8.0%) | 159 (7.3%) |
| 8:30 AM to 8:59 AM | 0 (0.0%) | 89 (4.1%) |
| 9:00 AM to 9:59 AM | 36 (1.7%) | 99 (4.5%) |
| 10:00 AM to 10:59 AM | 65 (3.1%) | 38 (1.7%) |
| 11:00 AM to 11:59 AM | 0 (0.0%) | 20 (0.9%) |
| 12:00 PM to 3:59 PM | 19 (0.9%) | 44 (2.0%) |
| 4:00 PM to 11:59 PM | 129 (6.2%) | 48 (2.2%) |
| Total | 2,093 (100.0%) | 2,180 (100.0%) |
Housing Occupancy in Vidor
Occupancy by Ownership in Vidor
Of the total 3,851 dwellings in Vidor, owner-occupied units account for 2,843 (73.8%), while renter-occupied units make up 1,008 (26.2%).
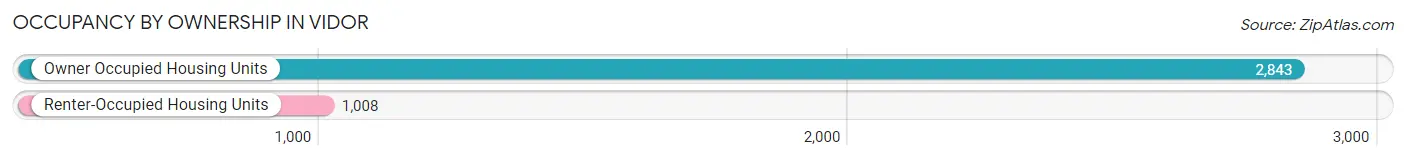
| Occupancy | # Housing Units | % Housing Units |
| Owner Occupied Housing Units | 2,843 | 73.8% |
| Renter-Occupied Housing Units | 1,008 | 26.2% |
| Total Occupied Housing Units | 3,851 | 100.0% |
Occupancy by Household Size in Vidor
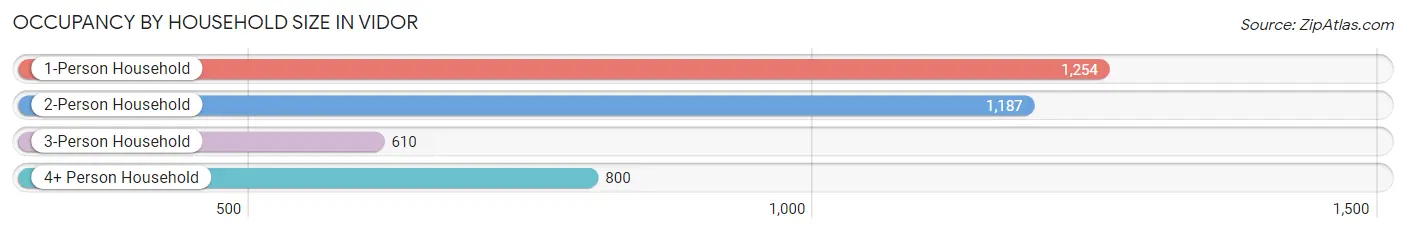
| Household Size | # Housing Units | % Housing Units |
| 1-Person Household | 1,254 | 32.6% |
| 2-Person Household | 1,187 | 30.8% |
| 3-Person Household | 610 | 15.8% |
| 4+ Person Household | 800 | 20.8% |
| Total Housing Units | 3,851 | 100.0% |
Occupancy by Ownership by Household Size in Vidor
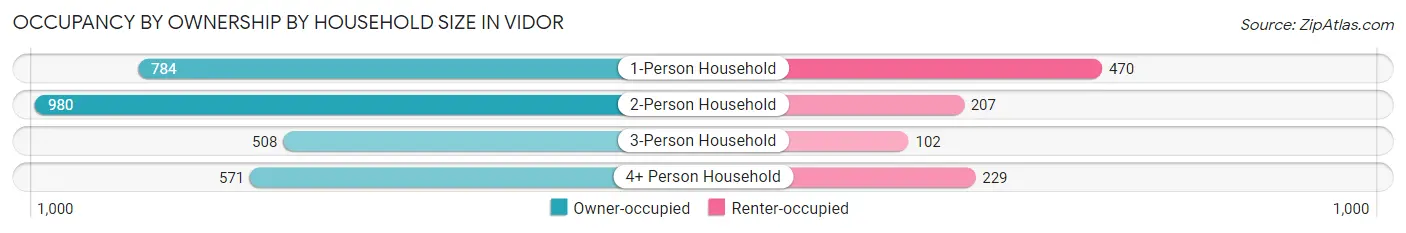
| Household Size | Owner-occupied | Renter-occupied |
| 1-Person Household | 784 (62.5%) | 470 (37.5%) |
| 2-Person Household | 980 (82.6%) | 207 (17.4%) |
| 3-Person Household | 508 (83.3%) | 102 (16.7%) |
| 4+ Person Household | 571 (71.4%) | 229 (28.6%) |
| Total Housing Units | 2,843 (73.8%) | 1,008 (26.2%) |
Occupancy by Educational Attainment in Vidor
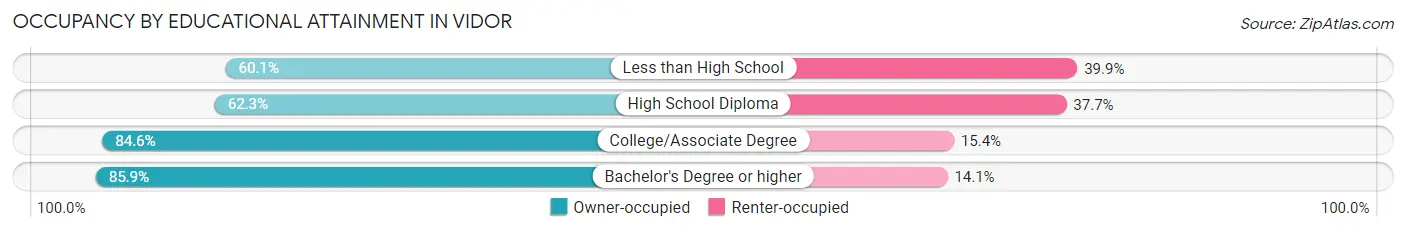
| Household Size | Owner-occupied | Renter-occupied |
| Less than High School | 264 (60.1%) | 175 (39.9%) |
| High School Diploma | 870 (62.3%) | 527 (37.7%) |
| College/Associate Degree | 1,393 (84.6%) | 254 (15.4%) |
| Bachelor's Degree or higher | 316 (85.9%) | 52 (14.1%) |
Occupancy by Age of Householder in Vidor
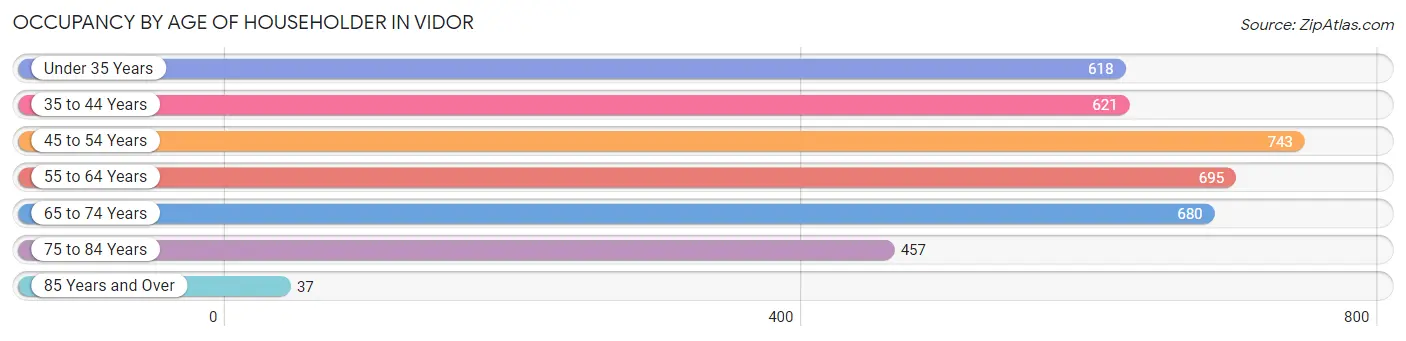
| Age Bracket | # Households | % Households |
| Under 35 Years | 618 | 16.1% |
| 35 to 44 Years | 621 | 16.1% |
| 45 to 54 Years | 743 | 19.3% |
| 55 to 64 Years | 695 | 18.0% |
| 65 to 74 Years | 680 | 17.7% |
| 75 to 84 Years | 457 | 11.9% |
| 85 Years and Over | 37 | 1.0% |
| Total | 3,851 | 100.0% |
Housing Finances in Vidor
Median Income by Occupancy in Vidor
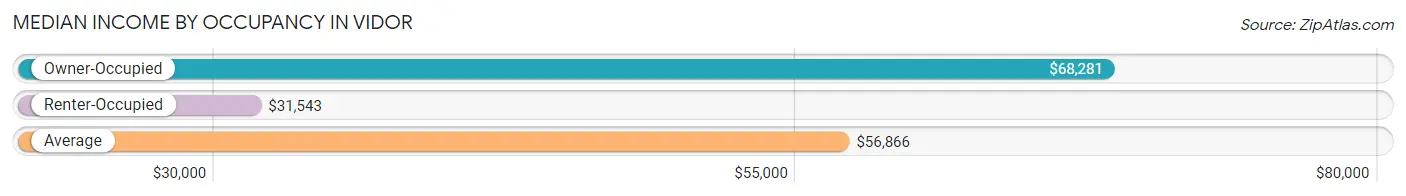
| Occupancy Type | # Households | Median Income |
| Owner-Occupied | 2,843 (73.8%) | $68,281 |
| Renter-Occupied | 1,008 (26.2%) | $31,543 |
| Average | 3,851 (100.0%) | $56,866 |
Occupancy by Householder Income Bracket in Vidor
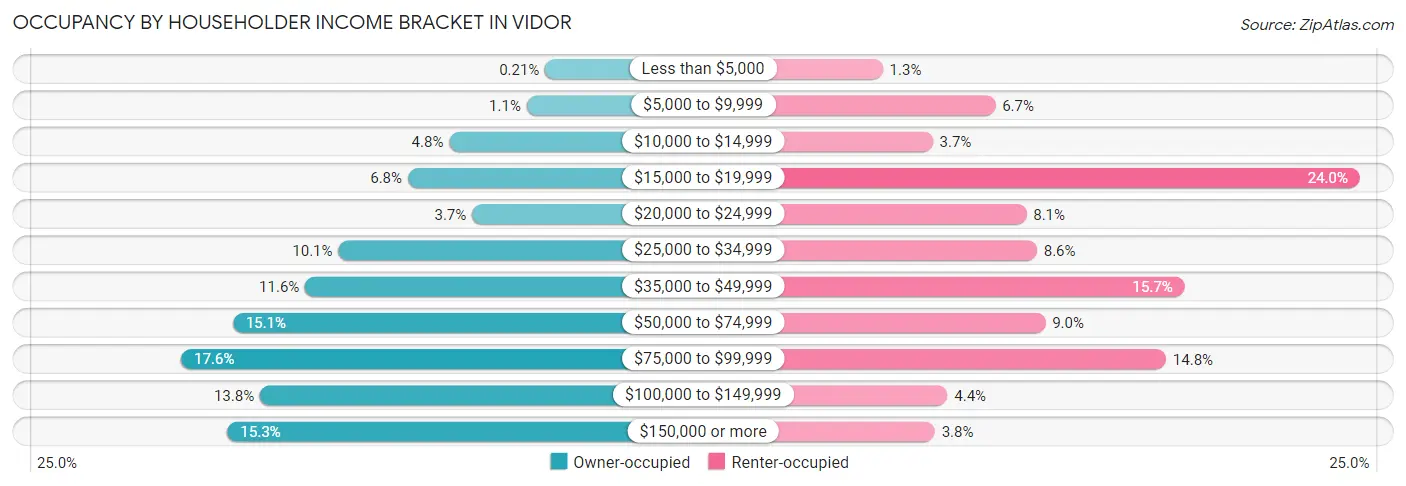
| Income Bracket | Owner-occupied | Renter-occupied |
| Less than $5,000 | 6 (0.2%) | 13 (1.3%) |
| $5,000 to $9,999 | 31 (1.1%) | 67 (6.7%) |
| $10,000 to $14,999 | 136 (4.8%) | 37 (3.7%) |
| $15,000 to $19,999 | 192 (6.8%) | 242 (24.0%) |
| $20,000 to $24,999 | 105 (3.7%) | 82 (8.1%) |
| $25,000 to $34,999 | 286 (10.1%) | 87 (8.6%) |
| $35,000 to $49,999 | 331 (11.6%) | 158 (15.7%) |
| $50,000 to $74,999 | 429 (15.1%) | 91 (9.0%) |
| $75,000 to $99,999 | 499 (17.5%) | 149 (14.8%) |
| $100,000 to $149,999 | 392 (13.8%) | 44 (4.4%) |
| $150,000 or more | 436 (15.3%) | 38 (3.8%) |
| Total | 2,843 (100.0%) | 1,008 (100.0%) |
Monthly Housing Cost Tiers in Vidor
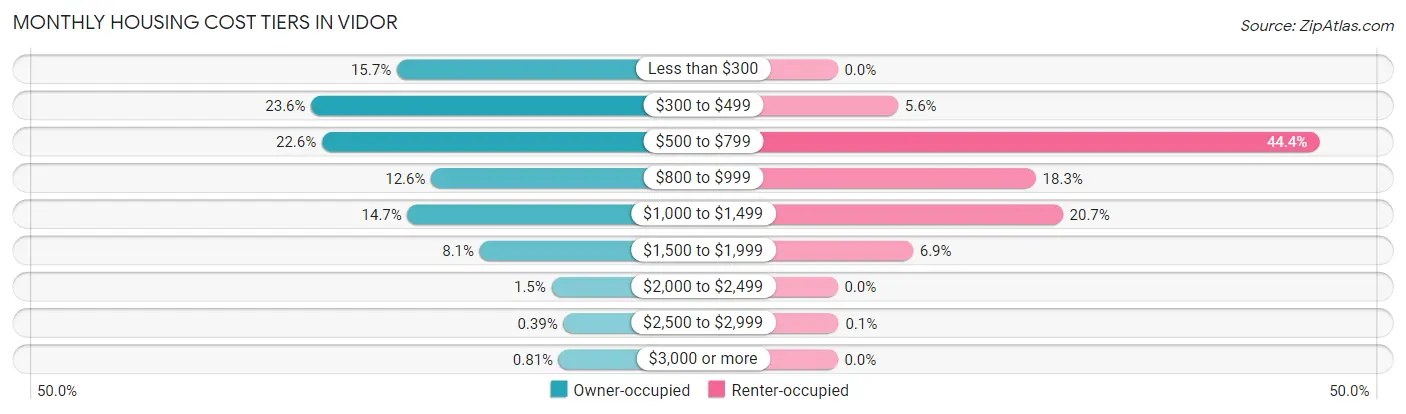
| Monthly Cost | Owner-occupied | Renter-occupied |
| Less than $300 | 447 (15.7%) | 0 (0.0%) |
| $300 to $499 | 671 (23.6%) | 56 (5.6%) |
| $500 to $799 | 643 (22.6%) | 447 (44.4%) |
| $800 to $999 | 357 (12.6%) | 184 (18.2%) |
| $1,000 to $1,499 | 419 (14.7%) | 209 (20.7%) |
| $1,500 to $1,999 | 230 (8.1%) | 70 (6.9%) |
| $2,000 to $2,499 | 42 (1.5%) | 0 (0.0%) |
| $2,500 to $2,999 | 11 (0.4%) | 1 (0.1%) |
| $3,000 or more | 23 (0.8%) | 0 (0.0%) |
| Total | 2,843 (100.0%) | 1,008 (100.0%) |
Physical Housing Characteristics in Vidor
Housing Structures in Vidor
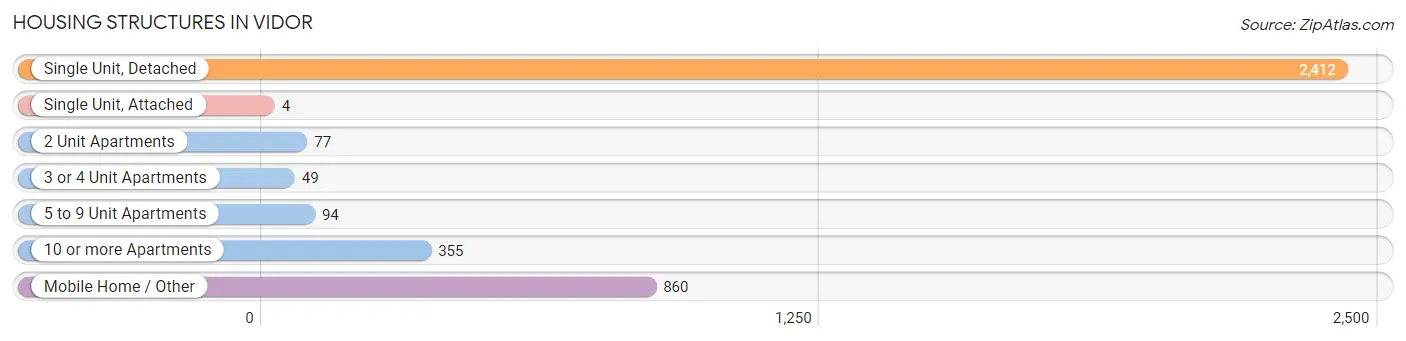
| Structure Type | # Housing Units | % Housing Units |
| Single Unit, Detached | 2,412 | 62.6% |
| Single Unit, Attached | 4 | 0.1% |
| 2 Unit Apartments | 77 | 2.0% |
| 3 or 4 Unit Apartments | 49 | 1.3% |
| 5 to 9 Unit Apartments | 94 | 2.4% |
| 10 or more Apartments | 355 | 9.2% |
| Mobile Home / Other | 860 | 22.3% |
| Total | 3,851 | 100.0% |
Housing Structures by Occupancy in Vidor
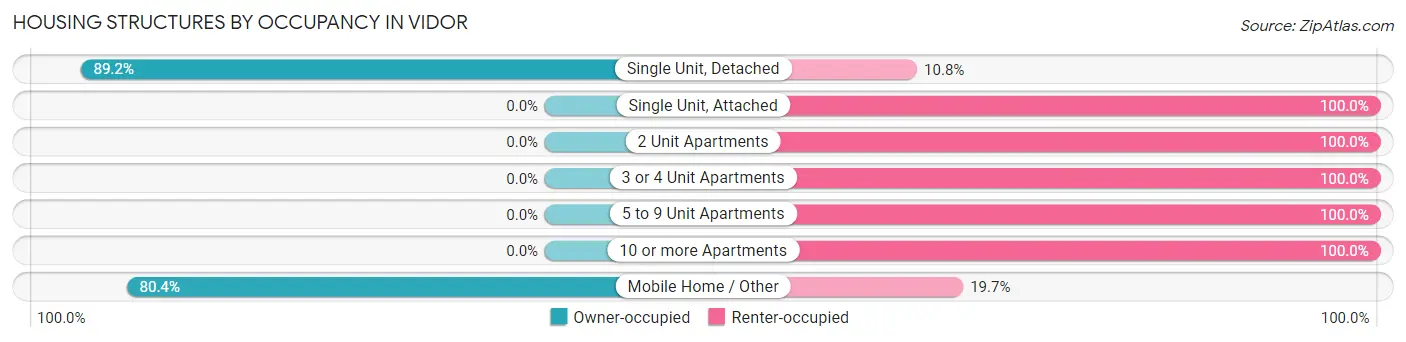
| Structure Type | Owner-occupied | Renter-occupied |
| Single Unit, Detached | 2,152 (89.2%) | 260 (10.8%) |
| Single Unit, Attached | 0 (0.0%) | 4 (100.0%) |
| 2 Unit Apartments | 0 (0.0%) | 77 (100.0%) |
| 3 or 4 Unit Apartments | 0 (0.0%) | 49 (100.0%) |
| 5 to 9 Unit Apartments | 0 (0.0%) | 94 (100.0%) |
| 10 or more Apartments | 0 (0.0%) | 355 (100.0%) |
| Mobile Home / Other | 691 (80.3%) | 169 (19.7%) |
| Total | 2,843 (73.8%) | 1,008 (26.2%) |
Housing Structures by Number of Rooms in Vidor
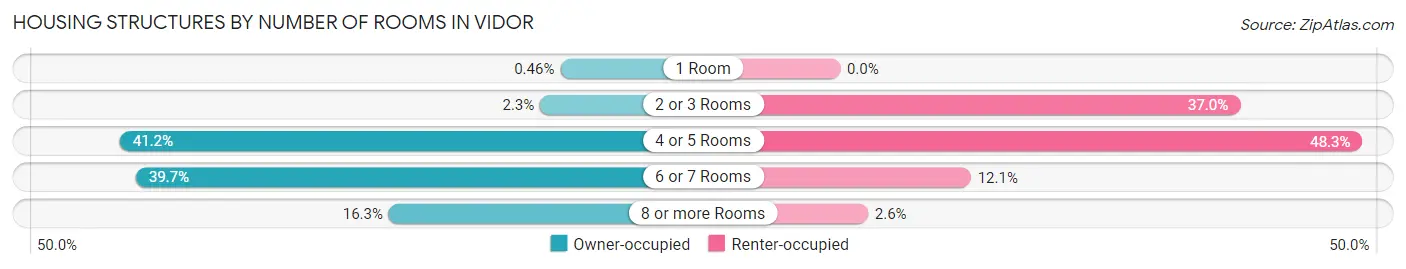
| Number of Rooms | Owner-occupied | Renter-occupied |
| 1 Room | 13 (0.5%) | 0 (0.0%) |
| 2 or 3 Rooms | 66 (2.3%) | 373 (37.0%) |
| 4 or 5 Rooms | 1,171 (41.2%) | 487 (48.3%) |
| 6 or 7 Rooms | 1,129 (39.7%) | 122 (12.1%) |
| 8 or more Rooms | 464 (16.3%) | 26 (2.6%) |
| Total | 2,843 (100.0%) | 1,008 (100.0%) |
Housing Structure by Heating Type in Vidor
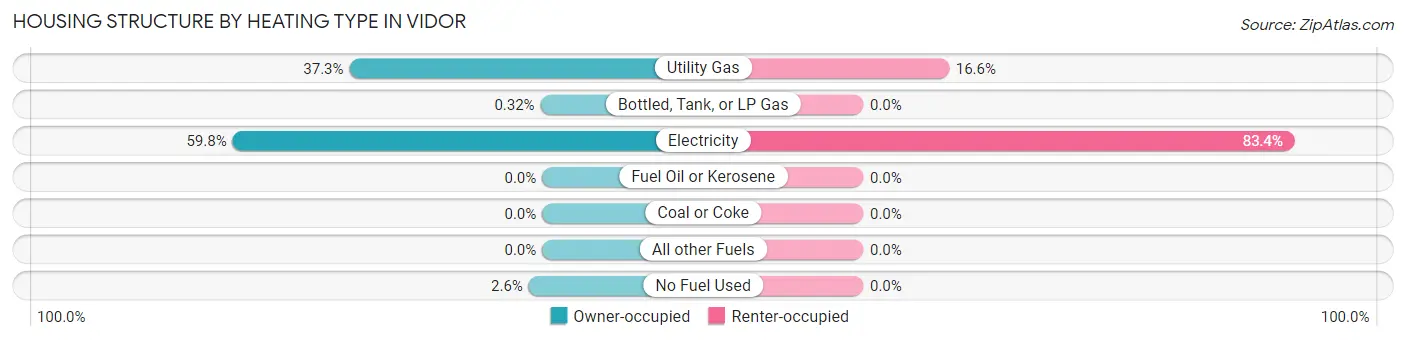
| Heating Type | Owner-occupied | Renter-occupied |
| Utility Gas | 1,059 (37.2%) | 167 (16.6%) |
| Bottled, Tank, or LP Gas | 9 (0.3%) | 0 (0.0%) |
| Electricity | 1,701 (59.8%) | 841 (83.4%) |
| Fuel Oil or Kerosene | 0 (0.0%) | 0 (0.0%) |
| Coal or Coke | 0 (0.0%) | 0 (0.0%) |
| All other Fuels | 0 (0.0%) | 0 (0.0%) |
| No Fuel Used | 74 (2.6%) | 0 (0.0%) |
| Total | 2,843 (100.0%) | 1,008 (100.0%) |
Household Vehicle Usage in Vidor
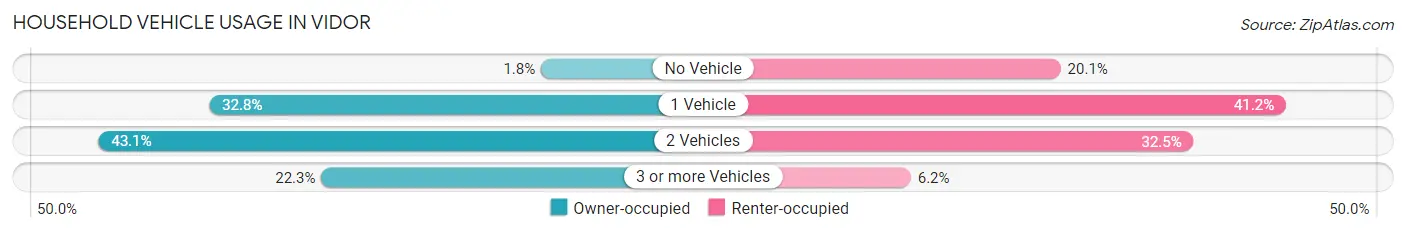
| Vehicles per Household | Owner-occupied | Renter-occupied |
| No Vehicle | 51 (1.8%) | 203 (20.1%) |
| 1 Vehicle | 932 (32.8%) | 415 (41.2%) |
| 2 Vehicles | 1,226 (43.1%) | 328 (32.5%) |
| 3 or more Vehicles | 634 (22.3%) | 62 (6.1%) |
| Total | 2,843 (100.0%) | 1,008 (100.0%) |
Real Estate & Mortgages in Vidor
Real Estate and Mortgage Overview in Vidor
| Characteristic | Without Mortgage | With Mortgage |
| Housing Units | 1,899 | 944 |
| Median Property Value | $88,600 | $121,000 |
| Median Household Income | $49,132 | $281 |
| Monthly Housing Costs | $452 | $23 |
| Real Estate Taxes | $886 | $25 |
Property Value by Mortgage Status in Vidor
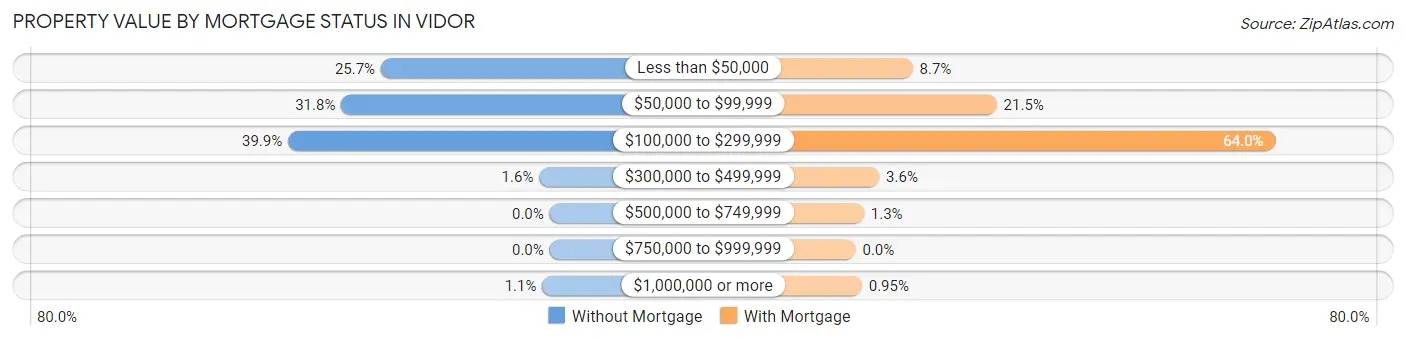
| Property Value | Without Mortgage | With Mortgage |
| Less than $50,000 | 488 (25.7%) | 82 (8.7%) |
| $50,000 to $99,999 | 603 (31.8%) | 203 (21.5%) |
| $100,000 to $299,999 | 757 (39.9%) | 604 (64.0%) |
| $300,000 to $499,999 | 30 (1.6%) | 34 (3.6%) |
| $500,000 to $749,999 | 0 (0.0%) | 12 (1.3%) |
| $750,000 to $999,999 | 0 (0.0%) | 0 (0.0%) |
| $1,000,000 or more | 21 (1.1%) | 9 (0.9%) |
| Total | 1,899 (100.0%) | 944 (100.0%) |
Household Income by Mortgage Status in Vidor
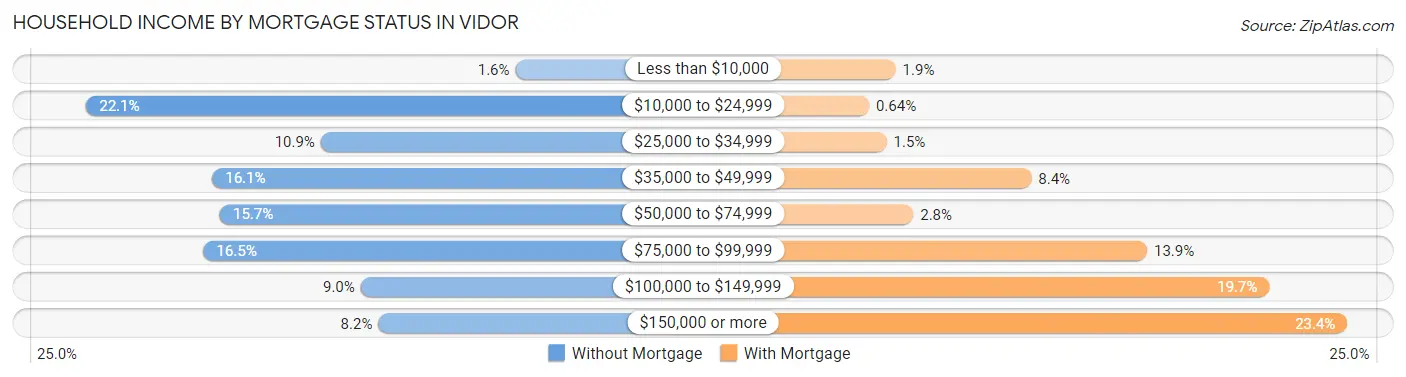
| Household Income | Without Mortgage | With Mortgage |
| Less than $10,000 | 31 (1.6%) | 18 (1.9%) |
| $10,000 to $24,999 | 419 (22.1%) | 6 (0.6%) |
| $25,000 to $34,999 | 207 (10.9%) | 14 (1.5%) |
| $35,000 to $49,999 | 305 (16.1%) | 79 (8.4%) |
| $50,000 to $74,999 | 298 (15.7%) | 26 (2.8%) |
| $75,000 to $99,999 | 313 (16.5%) | 131 (13.9%) |
| $100,000 to $149,999 | 171 (9.0%) | 186 (19.7%) |
| $150,000 or more | 155 (8.2%) | 221 (23.4%) |
| Total | 1,899 (100.0%) | 944 (100.0%) |
Property Value to Household Income Ratio in Vidor
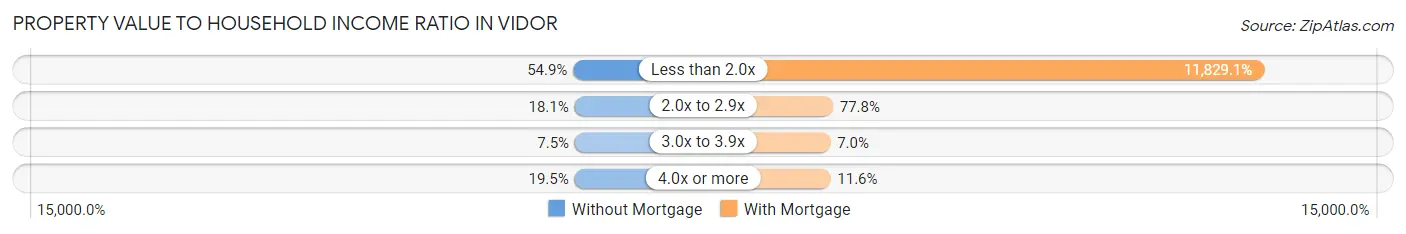
| Value-to-Income Ratio | Without Mortgage | With Mortgage |
| Less than 2.0x | 1,042 (54.9%) | 111,667 (11,829.1%) |
| 2.0x to 2.9x | 344 (18.1%) | 734 (77.7%) |
| 3.0x to 3.9x | 142 (7.5%) | 66 (7.0%) |
| 4.0x or more | 371 (19.5%) | 109 (11.6%) |
| Total | 1,899 (100.0%) | 944 (100.0%) |
Real Estate Taxes by Mortgage Status in Vidor
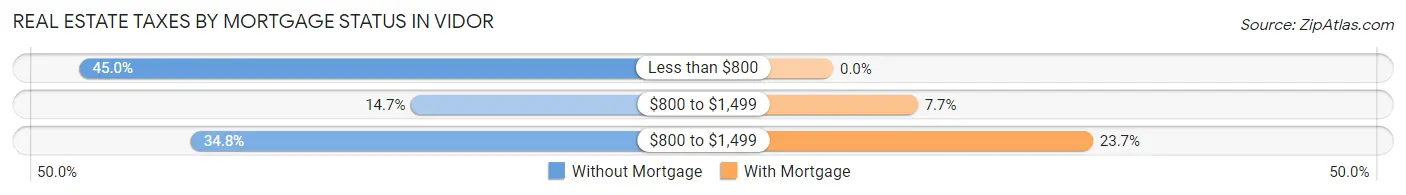
| Property Taxes | Without Mortgage | With Mortgage |
| Less than $800 | 854 (45.0%) | 0 (0.0%) |
| $800 to $1,499 | 279 (14.7%) | 73 (7.7%) |
| $800 to $1,499 | 661 (34.8%) | 224 (23.7%) |
| Total | 1,899 (100.0%) | 944 (100.0%) |
Health & Disability in Vidor
Health Insurance Coverage by Age in Vidor
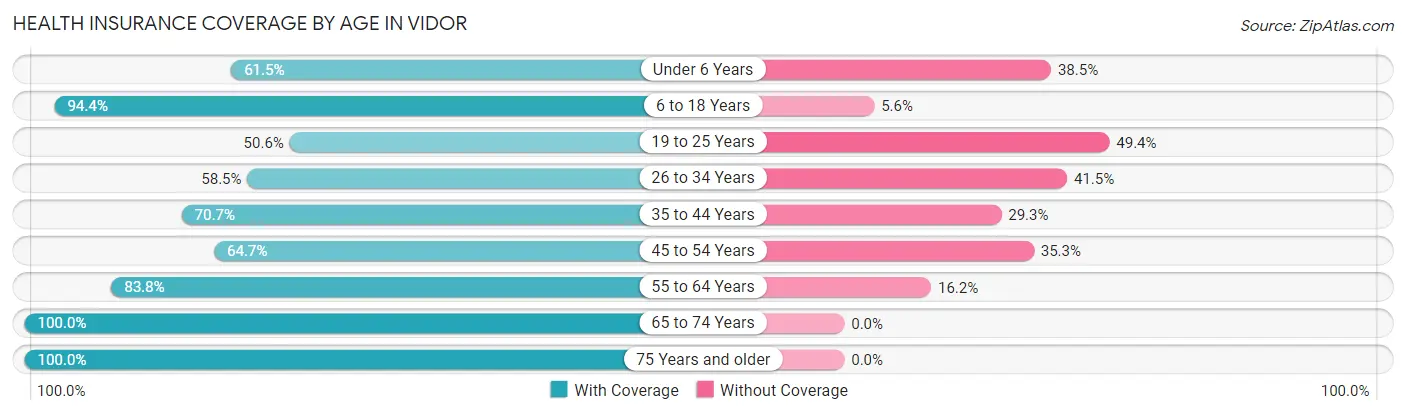
| Age Bracket | With Coverage | Without Coverage |
| Under 6 Years | 303 (61.5%) | 190 (38.5%) |
| 6 to 18 Years | 1,642 (94.4%) | 97 (5.6%) |
| 19 to 25 Years | 353 (50.6%) | 345 (49.4%) |
| 26 to 34 Years | 722 (58.5%) | 513 (41.5%) |
| 35 to 44 Years | 756 (70.7%) | 313 (29.3%) |
| 45 to 54 Years | 911 (64.7%) | 498 (35.3%) |
| 55 to 64 Years | 1,015 (83.8%) | 196 (16.2%) |
| 65 to 74 Years | 1,156 (100.0%) | 0 (0.0%) |
| 75 Years and older | 610 (100.0%) | 0 (0.0%) |
| Total | 7,468 (77.6%) | 2,152 (22.4%) |
Health Insurance Coverage by Citizenship Status in Vidor
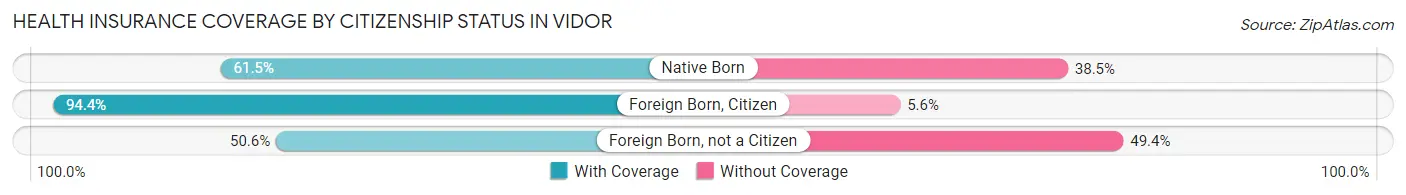
| Citizenship Status | With Coverage | Without Coverage |
| Native Born | 303 (61.5%) | 190 (38.5%) |
| Foreign Born, Citizen | 1,642 (94.4%) | 97 (5.6%) |
| Foreign Born, not a Citizen | 353 (50.6%) | 345 (49.4%) |
Health Insurance Coverage by Household Income in Vidor
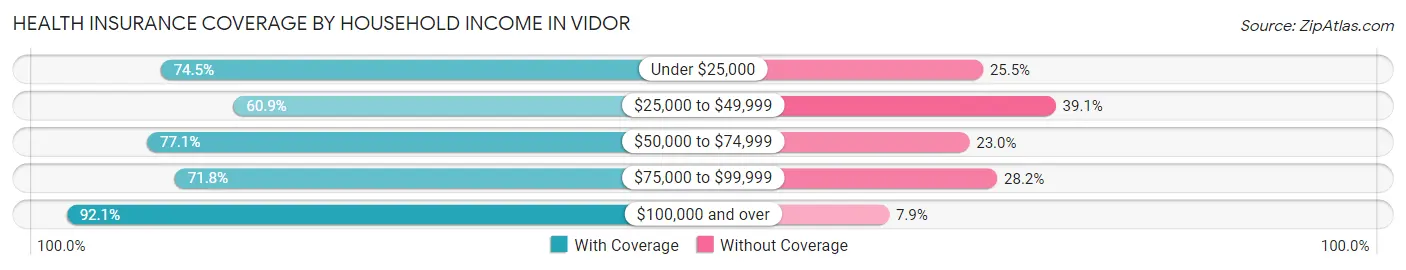
| Household Income | With Coverage | Without Coverage |
| Under $25,000 | 882 (74.5%) | 302 (25.5%) |
| $25,000 to $49,999 | 1,190 (60.9%) | 765 (39.1%) |
| $50,000 to $74,999 | 1,128 (77.0%) | 336 (23.0%) |
| $75,000 to $99,999 | 1,250 (71.8%) | 490 (28.2%) |
| $100,000 and over | 3,018 (92.1%) | 259 (7.9%) |
Public vs Private Health Insurance Coverage by Age in Vidor
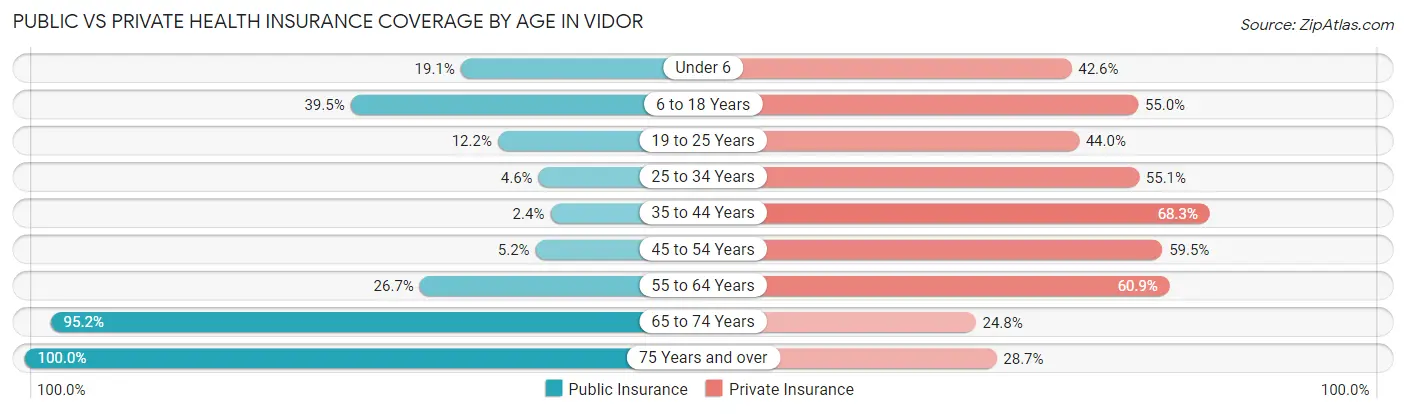
| Age Bracket | Public Insurance | Private Insurance |
| Under 6 | 94 (19.1%) | 210 (42.6%) |
| 6 to 18 Years | 687 (39.5%) | 956 (55.0%) |
| 19 to 25 Years | 85 (12.2%) | 307 (44.0%) |
| 25 to 34 Years | 57 (4.6%) | 681 (55.1%) |
| 35 to 44 Years | 26 (2.4%) | 730 (68.3%) |
| 45 to 54 Years | 73 (5.2%) | 838 (59.5%) |
| 55 to 64 Years | 323 (26.7%) | 737 (60.9%) |
| 65 to 74 Years | 1,100 (95.2%) | 287 (24.8%) |
| 75 Years and over | 610 (100.0%) | 175 (28.7%) |
| Total | 3,055 (31.8%) | 4,921 (51.1%) |
Disability Status by Sex by Age in Vidor
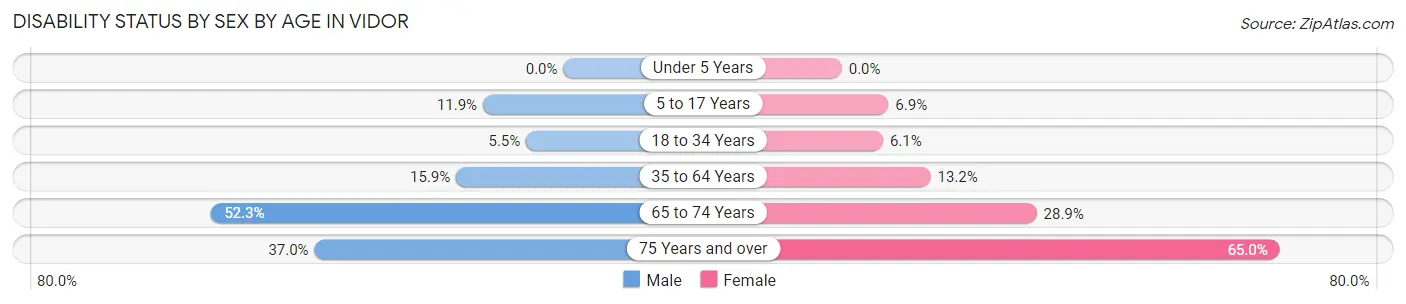
| Age Bracket | Male | Female |
| Under 5 Years | 0 (0.0%) | 0 (0.0%) |
| 5 to 17 Years | 104 (11.9%) | 49 (6.9%) |
| 18 to 34 Years | 56 (5.5%) | 67 (6.1%) |
| 35 to 64 Years | 271 (15.9%) | 262 (13.2%) |
| 65 to 74 Years | 252 (52.3%) | 195 (28.9%) |
| 75 Years and over | 68 (37.0%) | 277 (65.0%) |
Disability Class by Sex by Age in Vidor
Disability Class: Hearing Difficulty
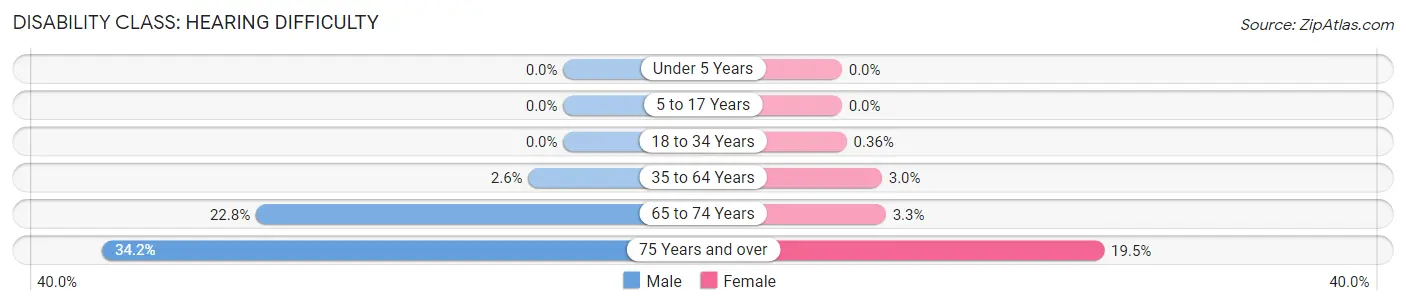
| Age Bracket | Male | Female |
| Under 5 Years | 0 (0.0%) | 0 (0.0%) |
| 5 to 17 Years | 0 (0.0%) | 0 (0.0%) |
| 18 to 34 Years | 0 (0.0%) | 4 (0.4%) |
| 35 to 64 Years | 44 (2.6%) | 59 (3.0%) |
| 65 to 74 Years | 110 (22.8%) | 22 (3.3%) |
| 75 Years and over | 63 (34.2%) | 83 (19.5%) |
Disability Class: Vision Difficulty
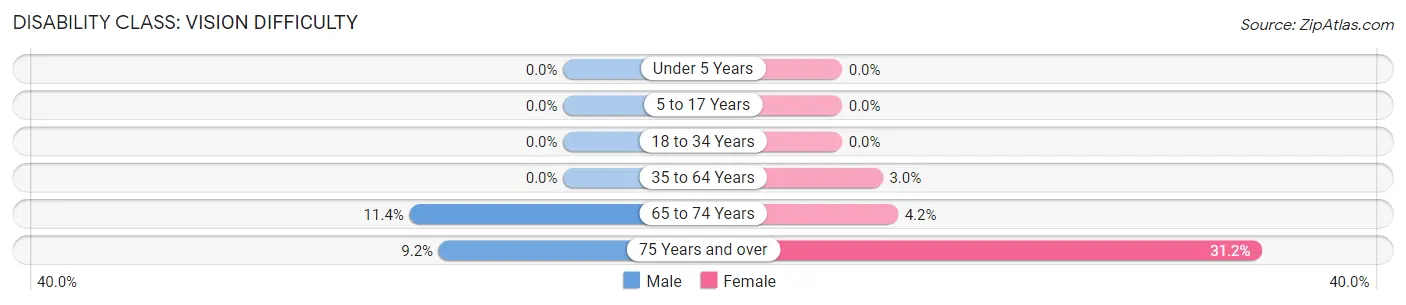
| Age Bracket | Male | Female |
| Under 5 Years | 0 (0.0%) | 0 (0.0%) |
| 5 to 17 Years | 0 (0.0%) | 0 (0.0%) |
| 18 to 34 Years | 0 (0.0%) | 0 (0.0%) |
| 35 to 64 Years | 0 (0.0%) | 60 (3.0%) |
| 65 to 74 Years | 55 (11.4%) | 28 (4.2%) |
| 75 Years and over | 17 (9.2%) | 133 (31.2%) |
Disability Class: Cognitive Difficulty
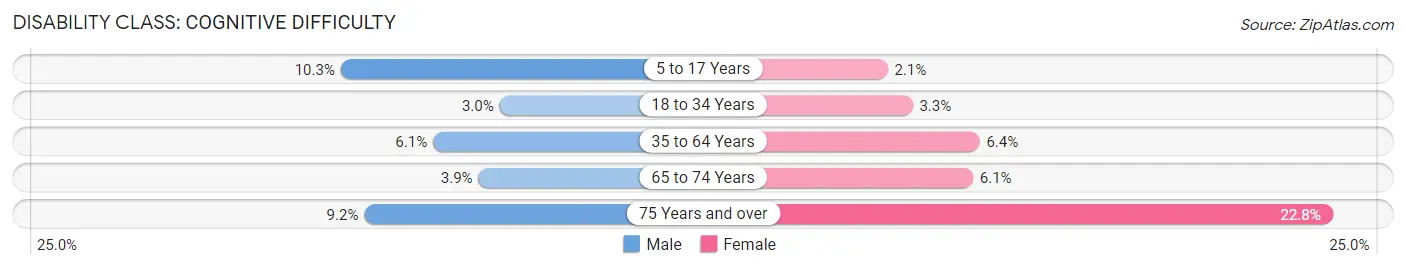
| Age Bracket | Male | Female |
| 5 to 17 Years | 90 (10.3%) | 15 (2.1%) |
| 18 to 34 Years | 30 (3.0%) | 36 (3.3%) |
| 35 to 64 Years | 103 (6.0%) | 127 (6.4%) |
| 65 to 74 Years | 19 (3.9%) | 41 (6.1%) |
| 75 Years and over | 17 (9.2%) | 97 (22.8%) |
Disability Class: Ambulatory Difficulty
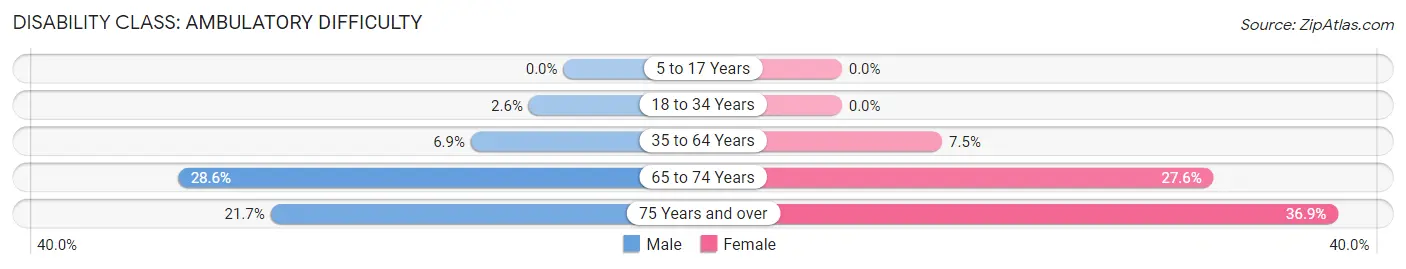
| Age Bracket | Male | Female |
| 5 to 17 Years | 0 (0.0%) | 0 (0.0%) |
| 18 to 34 Years | 26 (2.6%) | 0 (0.0%) |
| 35 to 64 Years | 117 (6.9%) | 148 (7.4%) |
| 65 to 74 Years | 138 (28.6%) | 186 (27.6%) |
| 75 Years and over | 40 (21.7%) | 157 (36.8%) |
Disability Class: Self-Care Difficulty
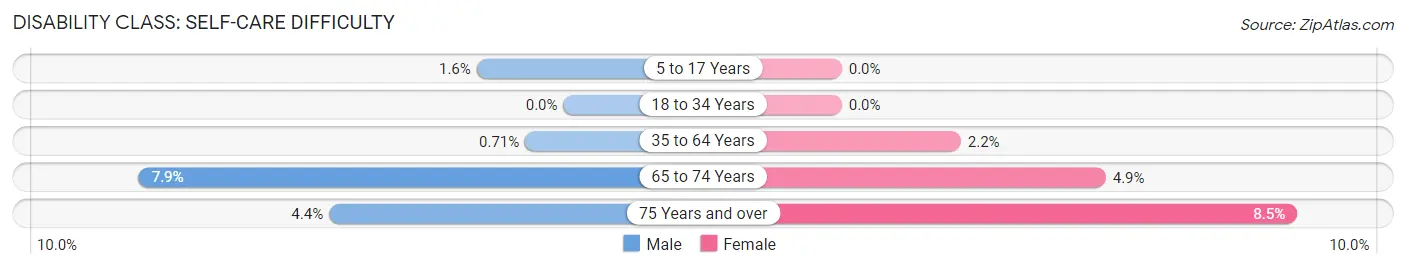
| Age Bracket | Male | Female |
| 5 to 17 Years | 14 (1.6%) | 0 (0.0%) |
| 18 to 34 Years | 0 (0.0%) | 0 (0.0%) |
| 35 to 64 Years | 12 (0.7%) | 44 (2.2%) |
| 65 to 74 Years | 38 (7.9%) | 33 (4.9%) |
| 75 Years and over | 8 (4.3%) | 36 (8.5%) |
Technology Access in Vidor
Computing Device Access in Vidor
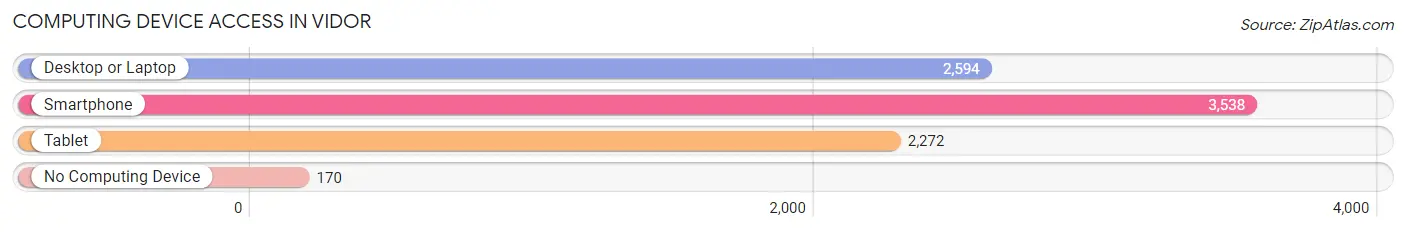
| Device Type | # Households | % Households |
| Desktop or Laptop | 2,594 | 67.4% |
| Smartphone | 3,538 | 91.9% |
| Tablet | 2,272 | 59.0% |
| No Computing Device | 170 | 4.4% |
| Total | 3,851 | 100.0% |
Internet Access in Vidor
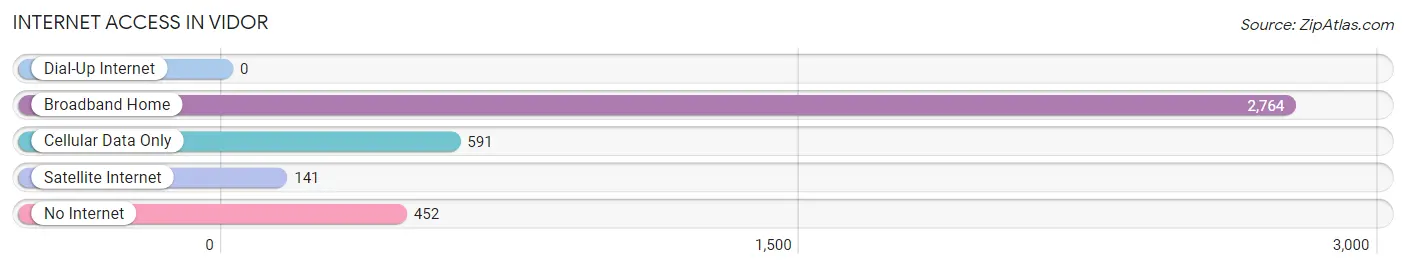
| Internet Type | # Households | % Households |
| Dial-Up Internet | 0 | 0.0% |
| Broadband Home | 2,764 | 71.8% |
| Cellular Data Only | 591 | 15.3% |
| Satellite Internet | 141 | 3.7% |
| No Internet | 452 | 11.7% |
| Total | 3,851 | 100.0% |
Vidor Summary
Vidor, Texas is a small city located in Orange County, Texas, United States. It is situated on the Sabine River, about 25 miles east of Beaumont. The city has a population of 10,579 as of the 2010 census.
History
Vidor was founded in 1895 by the Southern Pacific Railroad. The city was named after railroad engineer, John Henry Vidor. The city was incorporated in 1914 and has since grown to become a thriving community.
Vidor was the site of a major civil rights struggle in the 1950s and 1960s. The city was the first in the state to desegregate its public schools in 1956. The city was also the site of a major Ku Klux Klan rally in 1964.
Geography
Vidor is located at 30°51'25" North, 94°0'25" West (30.856944, -94.006944). It is situated on the Sabine River, about 25 miles east of Beaumont. The city has a total area of 8.2 square miles, all of which is land.
Economy
Vidor's economy is largely based on the oil and gas industry. The city is home to several oil and gas companies, including Chevron, ExxonMobil, and Shell. The city also has a strong manufacturing sector, with several companies producing products such as furniture, clothing, and electronics.
Demographics
As of the 2010 census, Vidor had a population of 10,579. The racial makeup of the city was 79.3% White, 15.2% African American, 0.7% Native American, 0.7% Asian, 0.1% Pacific Islander, 2.2% from other races, and 2.0% from two or more races. Hispanic or Latino of any race were 6.7% of the population.
The median income for a household in the city was $37,917, and the median income for a family was $45,917. Males had a median income of $37,917 versus $25,917 for females. The per capita income for the city was $17,917. About 11.7% of families and 14.2% of the population were below the poverty line, including 19.2% of those under age 18 and 11.7% of those age 65 or over.
Common Questions
What is Per Capita Income in Vidor?
Per Capita income in Vidor is $31,081.
What is the Median Family Income in Vidor?
Median Family Income in Vidor is $81,940.
What is the Median Household income in Vidor?
Median Household Income in Vidor is $56,866.
What is Income or Wage Gap in Vidor?
Income or Wage Gap in Vidor is 45.8%.
Women in Vidor earn 54.2 cents for every dollar earned by a man.
What is Inequality or Gini Index in Vidor?
Inequality or Gini Index in Vidor is 0.46.
What is the Total Population of Vidor?
Total Population of Vidor is 9,806.
What is the Total Male Population of Vidor?
Total Male Population of Vidor is 4,626.
What is the Total Female Population of Vidor?
Total Female Population of Vidor is 5,180.
What is the Ratio of Males per 100 Females in Vidor?
There are 89.31 Males per 100 Females in Vidor.
What is the Ratio of Females per 100 Males in Vidor?
There are 111.98 Females per 100 Males in Vidor.
What is the Median Population Age in Vidor?
Median Population Age in Vidor is 40.7 Years.
What is the Average Family Size in Vidor
Average Family Size in Vidor is 3.2 People.
What is the Average Household Size in Vidor
Average Household Size in Vidor is 2.5 People.
How Large is the Labor Force in Vidor?
There are 4,742 People in the Labor Forcein in Vidor.
What is the Percentage of People in the Labor Force in Vidor?
59.8% of People are in the Labor Force in Vidor.
What is the Unemployment Rate in Vidor?
Unemployment Rate in Vidor is 7.1%.