Hudson, WI Map & Demographics
Hudson Map
Hudson Overview
$46,181
PER CAPITA INCOME
$109,375
AVG FAMILY INCOME
$90,250
AVG HOUSEHOLD INCOME
23.9%
WAGE / INCOME GAP [ % ]
76.1¢/ $1
WAGE / INCOME GAP [ $ ]
0.41
INEQUALITY / GINI INDEX
14,763
TOTAL POPULATION
7,231
MALE POPULATION
7,532
FEMALE POPULATION
96.00
MALES / 100 FEMALES
104.16
FEMALES / 100 MALES
39.8
MEDIAN AGE
3.0
AVG FAMILY SIZE
2.3
AVG HOUSEHOLD SIZE
8,365
LABOR FORCE [ PEOPLE ]
68.7%
PERCENT IN LABOR FORCE
0.9%
UNEMPLOYMENT RATE
Hudson Zip Codes
Hudson Area Codes
Income in Hudson
Income Overview in Hudson
Per Capita Income in Hudson is $46,181, while median incomes of families and households are $109,375 and $90,250 respectively.
| Characteristic | Number | Measure |
| Per Capita Income | 14,763 | $46,181 |
| Median Family Income | 3,726 | $109,375 |
| Mean Family Income | 3,726 | $124,214 |
| Median Household Income | 6,409 | $90,250 |
| Mean Household Income | 6,409 | $102,963 |
| Income Deficit | 3,726 | $0 |
| Wage / Income Gap (%) | 14,763 | 23.95% |
| Wage / Income Gap ($) | 14,763 | 76.05¢ per $1 |
| Gini / Inequality Index | 14,763 | 0.41 |
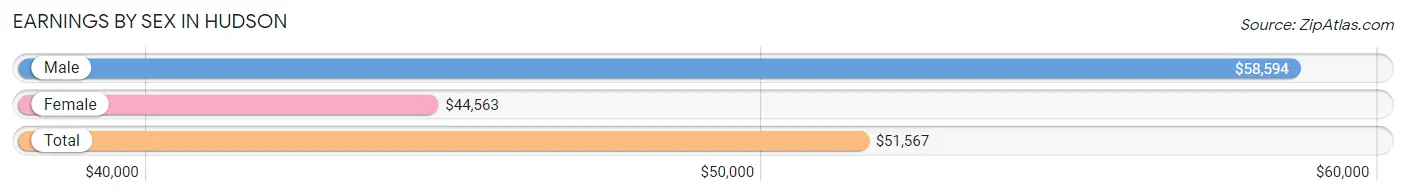
Earnings by Sex in Hudson
Average Earnings in Hudson are $51,567, $58,594 for men and $44,563 for women, a difference of 23.9%.
| Sex | Number | Average Earnings |
| Male | 4,580 (52.6%) | $58,594 |
| Female | 4,130 (47.4%) | $44,563 |
| Total | 8,710 (100.0%) | $51,567 |
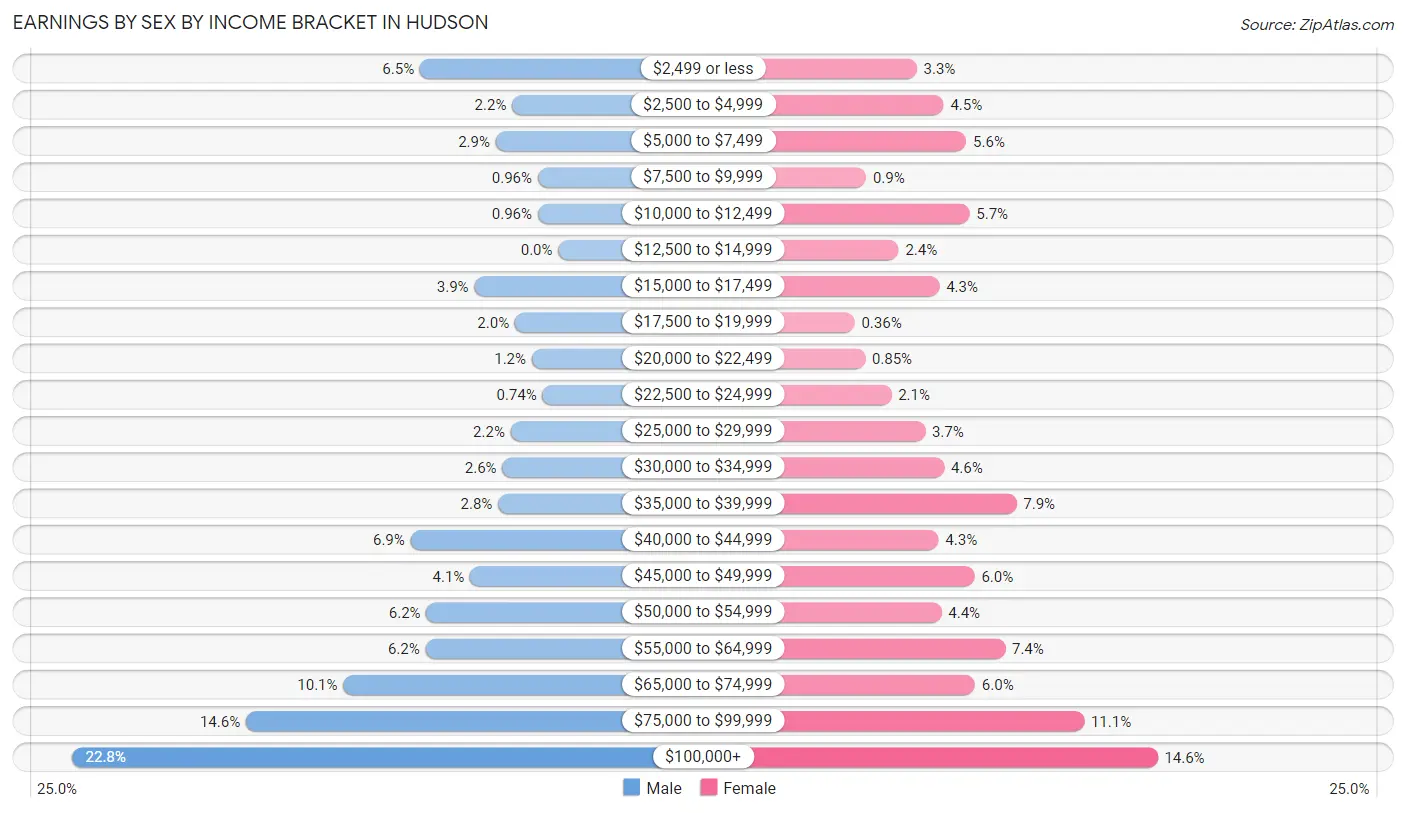
Earnings by Sex by Income Bracket in Hudson
The most common earnings brackets in Hudson are $100,000+ for men (1,042 | 22.8%) and $100,000+ for women (601 | 14.5%).
| Income | Male | Female |
| $2,499 or less | 297 (6.5%) | 135 (3.3%) |
| $2,500 to $4,999 | 99 (2.2%) | 187 (4.5%) |
| $5,000 to $7,499 | 134 (2.9%) | 231 (5.6%) |
| $7,500 to $9,999 | 44 (1.0%) | 37 (0.9%) |
| $10,000 to $12,499 | 44 (1.0%) | 237 (5.7%) |
| $12,500 to $14,999 | 0 (0.0%) | 100 (2.4%) |
| $15,000 to $17,499 | 180 (3.9%) | 179 (4.3%) |
| $17,500 to $19,999 | 93 (2.0%) | 15 (0.4%) |
| $20,000 to $22,499 | 57 (1.2%) | 35 (0.9%) |
| $22,500 to $24,999 | 34 (0.7%) | 86 (2.1%) |
| $25,000 to $29,999 | 102 (2.2%) | 151 (3.7%) |
| $30,000 to $34,999 | 120 (2.6%) | 188 (4.5%) |
| $35,000 to $39,999 | 129 (2.8%) | 328 (7.9%) |
| $40,000 to $44,999 | 317 (6.9%) | 177 (4.3%) |
| $45,000 to $49,999 | 189 (4.1%) | 247 (6.0%) |
| $50,000 to $54,999 | 283 (6.2%) | 183 (4.4%) |
| $55,000 to $64,999 | 285 (6.2%) | 306 (7.4%) |
| $65,000 to $74,999 | 461 (10.1%) | 248 (6.0%) |
| $75,000 to $99,999 | 670 (14.6%) | 459 (11.1%) |
| $100,000+ | 1,042 (22.8%) | 601 (14.5%) |
| Total | 4,580 (100.0%) | 4,130 (100.0%) |
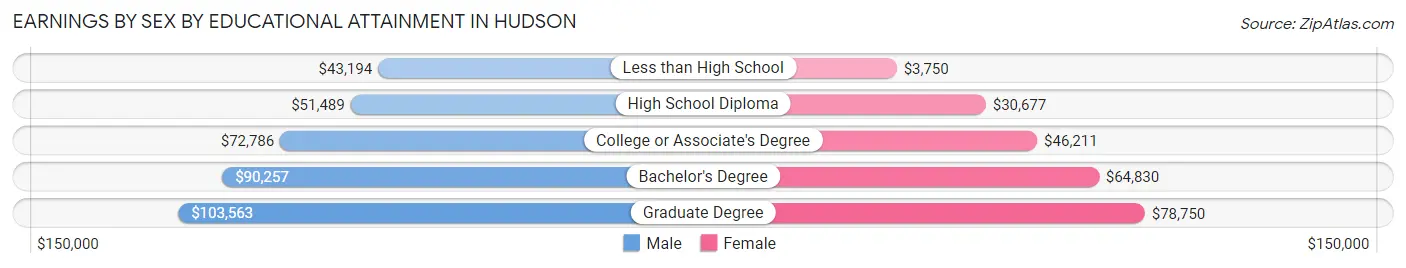
Earnings by Sex by Educational Attainment in Hudson
Average earnings in Hudson are $69,976 for men and $50,996 for women, a difference of 27.1%. Men with an educational attainment of graduate degree enjoy the highest average annual earnings of $103,563, while those with less than high school education earn the least with $43,194. Women with an educational attainment of graduate degree earn the most with the average annual earnings of $78,750, while those with less than high school education have the smallest earnings of $3,750.
| Educational Attainment | Male Income | Female Income |
| Less than High School | $43,194 | $3,750 |
| High School Diploma | $51,489 | $30,677 |
| College or Associate's Degree | $72,786 | $46,211 |
| Bachelor's Degree | $90,257 | $64,830 |
| Graduate Degree | $103,563 | $78,750 |
| Total | $69,976 | $50,996 |
Family Income in Hudson
Family Income Brackets in Hudson
According to the Hudson family income data, there are 1,036 families falling into the $100,000 to $149,999 income range, which is the most common income bracket and makes up 27.8% of all families. Conversely, the $10,000 to $14,999 income bracket is the least frequent group with only 15 families (0.4%) belonging to this category.
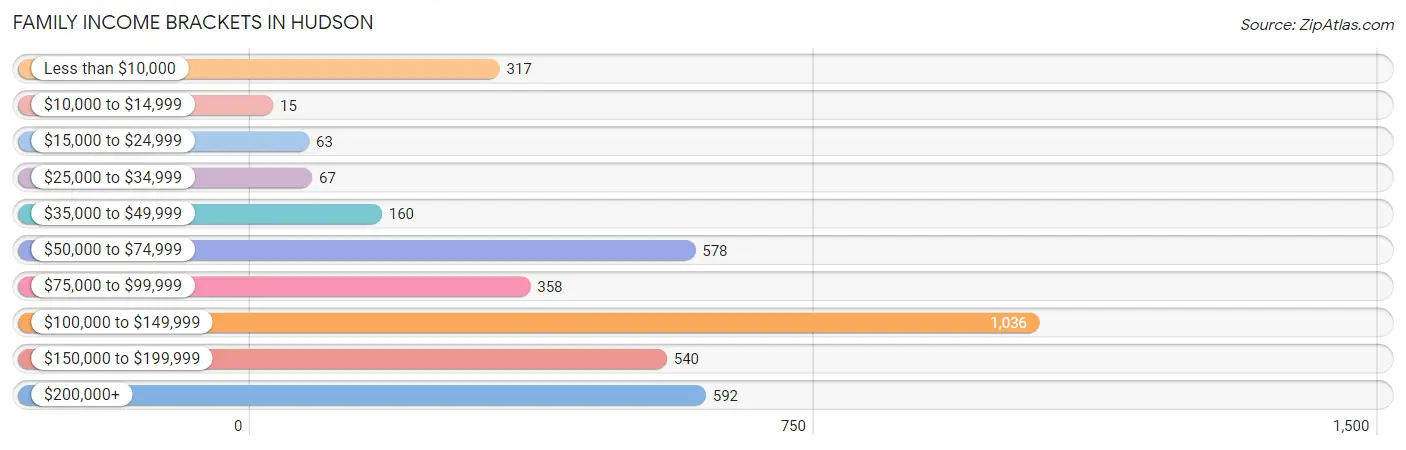
| Income Bracket | # Families | % Families |
| Less than $10,000 | 317 | 8.5% |
| $10,000 to $14,999 | 15 | 0.4% |
| $15,000 to $24,999 | 63 | 1.7% |
| $25,000 to $34,999 | 67 | 1.8% |
| $35,000 to $49,999 | 160 | 4.3% |
| $50,000 to $74,999 | 578 | 15.5% |
| $75,000 to $99,999 | 358 | 9.6% |
| $100,000 to $149,999 | 1,036 | 27.8% |
| $150,000 to $199,999 | 540 | 14.5% |
| $200,000+ | 592 | 15.9% |
Family Income by Famaliy Size in Hudson
4-person families (743 | 19.9%) account for the highest median family income in Hudson with $138,413 per family, while 2-person families (1,864 | 50.0%) have the highest median income of $43,472 per family member.
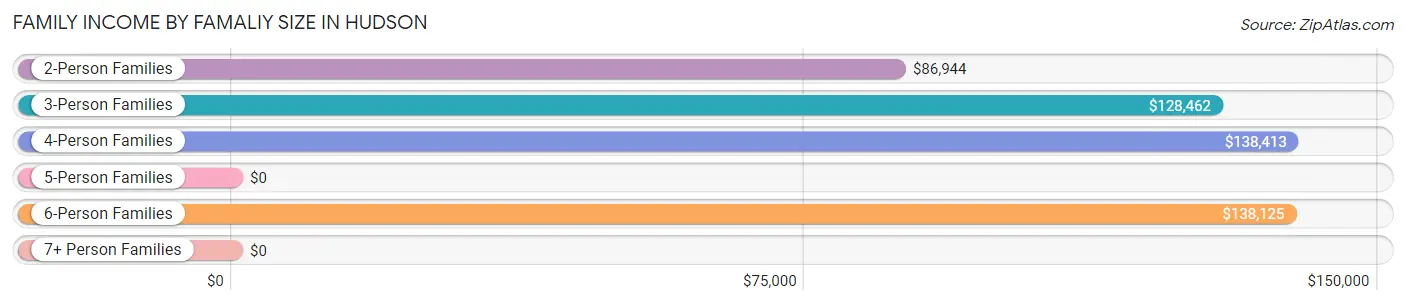
| Income Bracket | # Families | Median Income |
| 2-Person Families | 1,864 (50.0%) | $86,944 |
| 3-Person Families | 770 (20.7%) | $128,462 |
| 4-Person Families | 743 (19.9%) | $138,413 |
| 5-Person Families | 195 (5.2%) | $0 |
| 6-Person Families | 154 (4.1%) | $138,125 |
| 7+ Person Families | 0 (0.0%) | $0 |
| Total | 3,726 (100.0%) | $109,375 |
Family Income by Number of Earners in Hudson
The median family income in Hudson is $109,375, with families comprising 3+ earners (466) having the highest median family income of $191,136, while families with 1 earner (1,117) have the lowest median family income of $55,221, accounting for 12.5% and 30.0% of families, respectively.
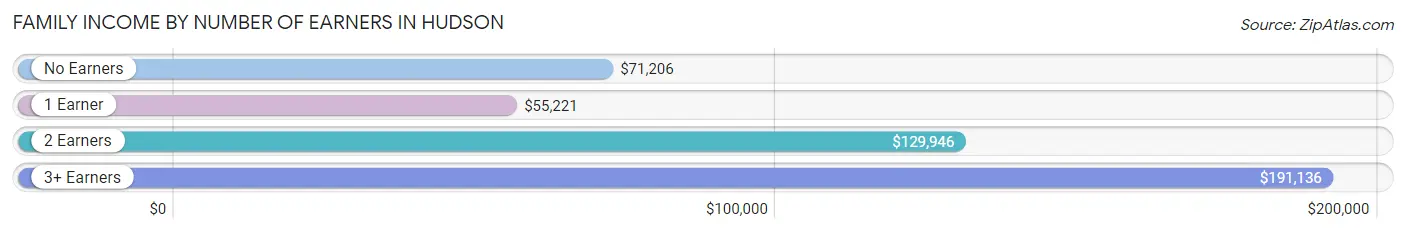
| Number of Earners | # Families | Median Income |
| No Earners | 525 (14.1%) | $71,206 |
| 1 Earner | 1,117 (30.0%) | $55,221 |
| 2 Earners | 1,618 (43.4%) | $129,946 |
| 3+ Earners | 466 (12.5%) | $191,136 |
| Total | 3,726 (100.0%) | $109,375 |
Household Income in Hudson
Household Income Brackets in Hudson
With 1,602 households falling in the category, the $100,000 to $149,999 income range is the most frequent in Hudson, accounting for 25.0% of all households. In contrast, only 103 households (1.6%) fall into the $10,000 to $14,999 income bracket, making it the least populous group.
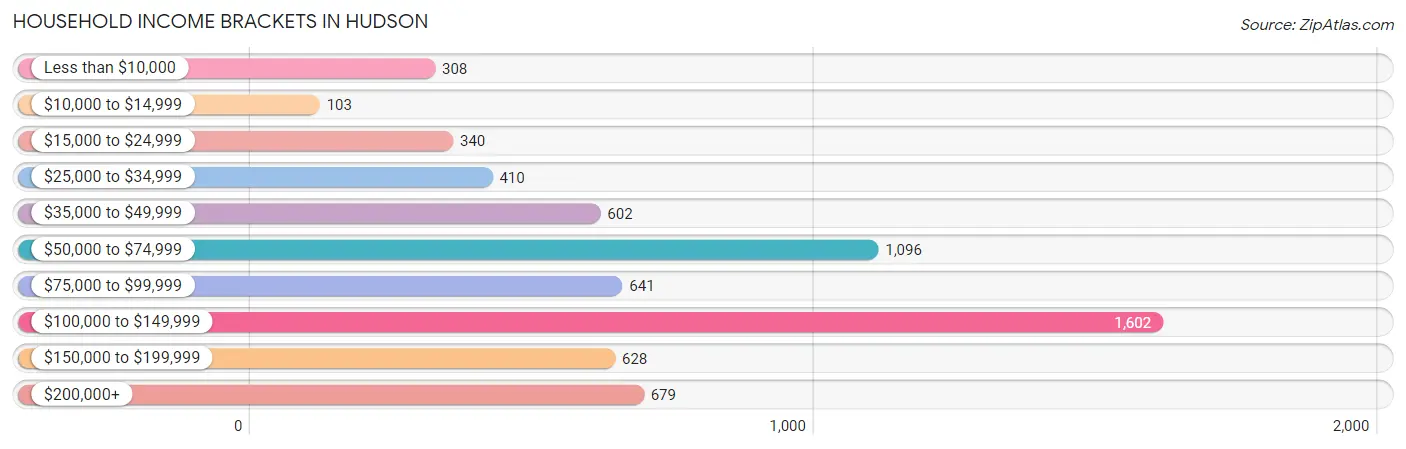
| Income Bracket | # Households | % Households |
| Less than $10,000 | 308 | 4.8% |
| $10,000 to $14,999 | 103 | 1.6% |
| $15,000 to $24,999 | 340 | 5.3% |
| $25,000 to $34,999 | 410 | 6.4% |
| $35,000 to $49,999 | 602 | 9.4% |
| $50,000 to $74,999 | 1,096 | 17.1% |
| $75,000 to $99,999 | 641 | 10.0% |
| $100,000 to $149,999 | 1,602 | 25.0% |
| $150,000 to $199,999 | 628 | 9.8% |
| $200,000+ | 679 | 10.6% |
Household Income by Householder Age in Hudson
The median household income in Hudson is $90,250, with the highest median household income of $106,250 found in the 45 to 64 years age bracket for the primary householder. A total of 2,214 households (34.5%) fall into this category. Meanwhile, the 15 to 24 years age bracket for the primary householder has the lowest median household income of $47,083, with 117 households (1.8%) in this group.
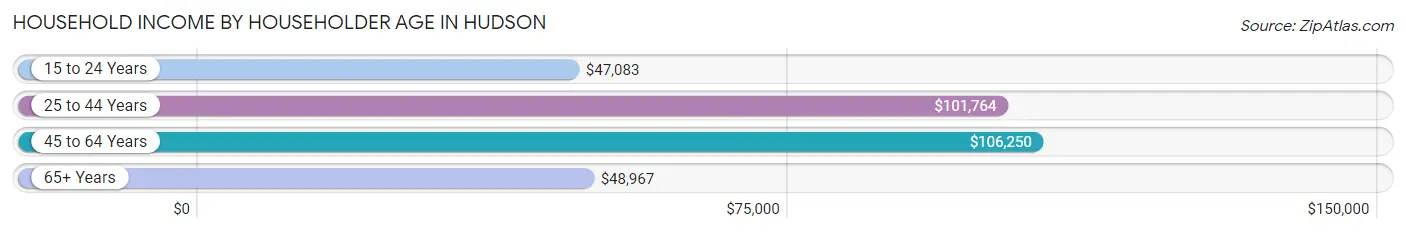
| Income Bracket | # Households | Median Income |
| 15 to 24 Years | 117 (1.8%) | $47,083 |
| 25 to 44 Years | 2,398 (37.4%) | $101,764 |
| 45 to 64 Years | 2,214 (34.5%) | $106,250 |
| 65+ Years | 1,680 (26.2%) | $48,967 |
| Total | 6,409 (100.0%) | $90,250 |
Poverty in Hudson
Income Below Poverty by Sex and Age in Hudson
With 7.0% poverty level for males and 7.7% for females among the residents of Hudson, 55 to 64 year old males and 16 and 17 year old females are the most vulnerable to poverty, with 186 males (21.5%) and 44 females (25.1%) in their respective age groups living below the poverty level.
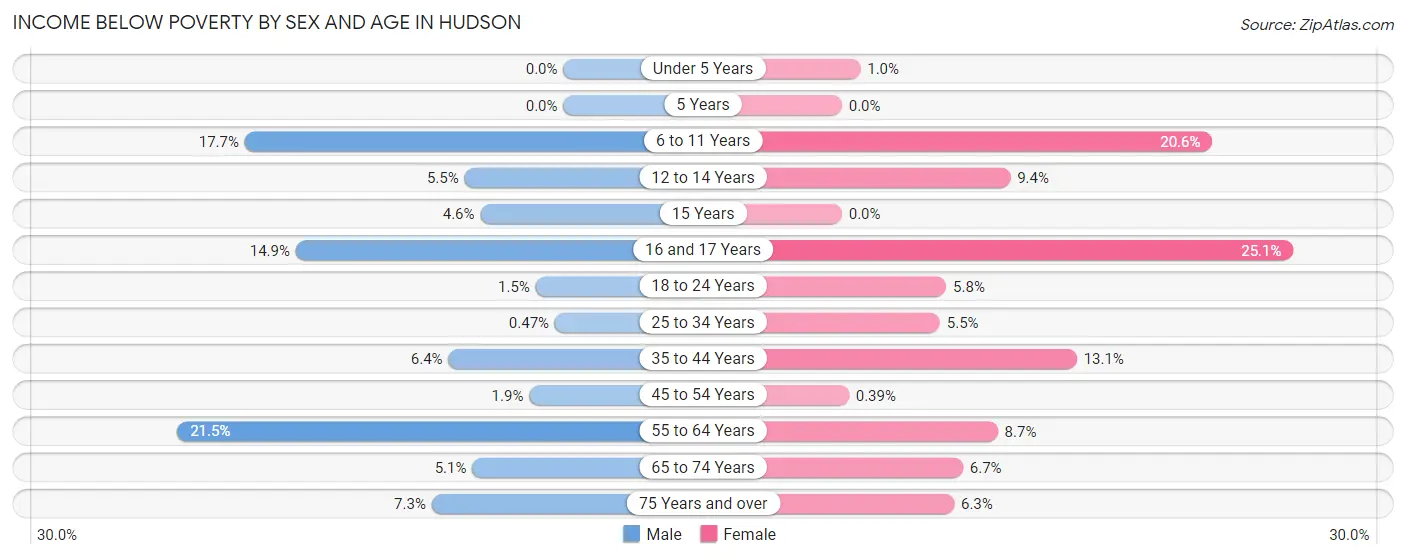
| Age Bracket | Male | Female |
| Under 5 Years | 0 (0.0%) | 4 (1.0%) |
| 5 Years | 0 (0.0%) | 0 (0.0%) |
| 6 to 11 Years | 88 (17.7%) | 85 (20.6%) |
| 12 to 14 Years | 16 (5.5%) | 18 (9.4%) |
| 15 Years | 6 (4.6%) | 0 (0.0%) |
| 16 and 17 Years | 31 (14.9%) | 44 (25.1%) |
| 18 to 24 Years | 9 (1.5%) | 35 (5.8%) |
| 25 to 34 Years | 5 (0.5%) | 50 (5.5%) |
| 35 to 44 Years | 77 (6.4%) | 156 (13.1%) |
| 45 to 54 Years | 18 (1.9%) | 3 (0.4%) |
| 55 to 64 Years | 186 (21.5%) | 82 (8.7%) |
| 65 to 74 Years | 27 (5.1%) | 61 (6.7%) |
| 75 Years and over | 30 (7.3%) | 41 (6.2%) |
| Total | 493 (7.0%) | 579 (7.7%) |
Income Above Poverty by Sex and Age in Hudson
According to the poverty statistics in Hudson, males aged under 5 years and females aged 5 years are the age groups that are most secure financially, with 100.0% of males and 100.0% of females in these age groups living above the poverty line.
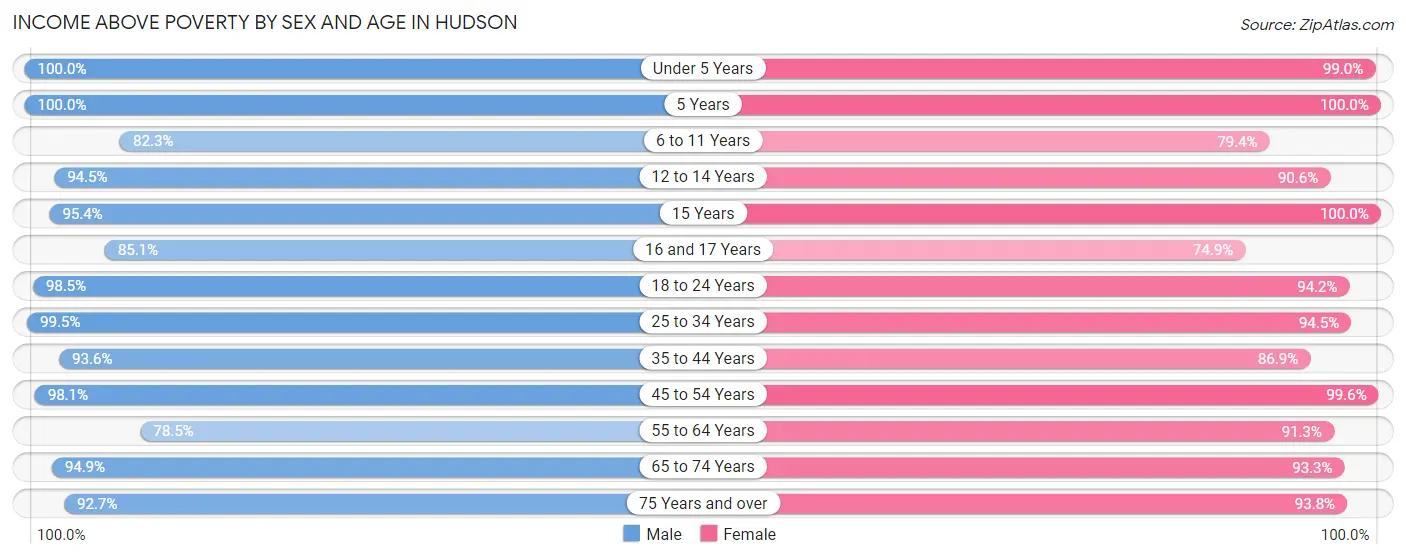
| Age Bracket | Male | Female |
| Under 5 Years | 307 (100.0%) | 383 (99.0%) |
| 5 Years | 48 (100.0%) | 96 (100.0%) |
| 6 to 11 Years | 408 (82.3%) | 327 (79.4%) |
| 12 to 14 Years | 275 (94.5%) | 174 (90.6%) |
| 15 Years | 124 (95.4%) | 228 (100.0%) |
| 16 and 17 Years | 177 (85.1%) | 131 (74.9%) |
| 18 to 24 Years | 575 (98.5%) | 567 (94.2%) |
| 25 to 34 Years | 1,050 (99.5%) | 865 (94.5%) |
| 35 to 44 Years | 1,127 (93.6%) | 1,037 (86.9%) |
| 45 to 54 Years | 929 (98.1%) | 761 (99.6%) |
| 55 to 64 Years | 679 (78.5%) | 863 (91.3%) |
| 65 to 74 Years | 506 (94.9%) | 844 (93.3%) |
| 75 Years and over | 379 (92.7%) | 615 (93.8%) |
| Total | 6,584 (93.0%) | 6,891 (92.2%) |
Income Below Poverty Among Married-Couple Families in Hudson
The poverty statistics for married-couple families in Hudson show that 6.4% or 180 of the total 2,823 families live below the poverty line. Families with no children have the highest poverty rate of 10.5%, comprising of 180 families. On the other hand, families with 1 or 2 children have the lowest poverty rate of 0.0%, which includes 0 families.
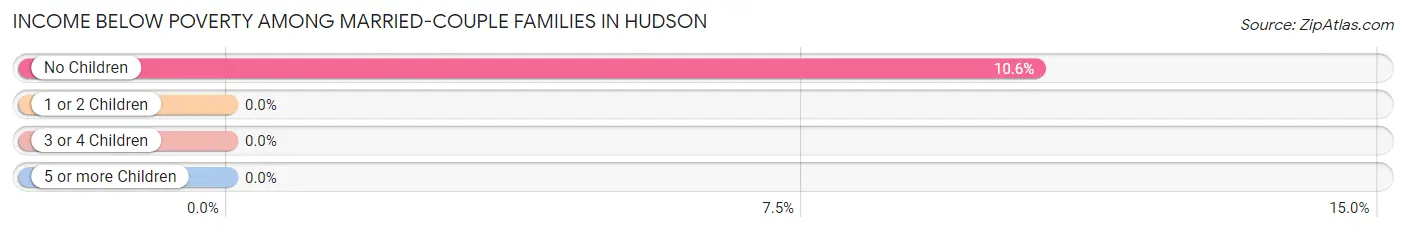
| Children | Above Poverty | Below Poverty |
| No Children | 1,526 (89.4%) | 180 (10.5%) |
| 1 or 2 Children | 836 (100.0%) | 0 (0.0%) |
| 3 or 4 Children | 281 (100.0%) | 0 (0.0%) |
| 5 or more Children | 0 (0.0%) | 0 (0.0%) |
| Total | 2,643 (93.6%) | 180 (6.4%) |
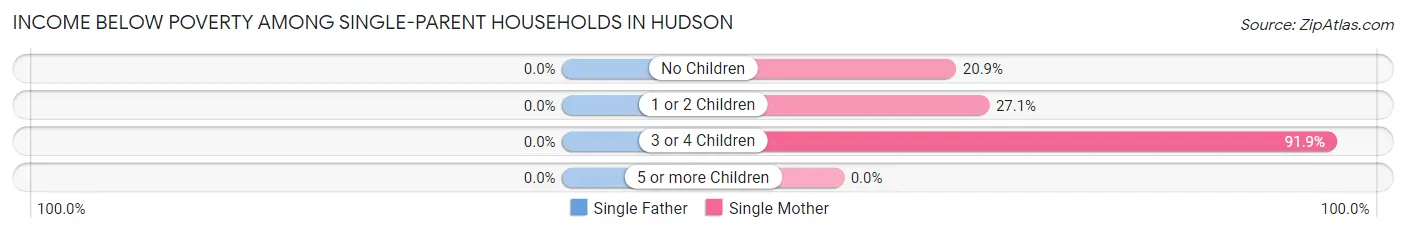
Income Below Poverty Among Single-Parent Households in Hudson
| Children | Single Father | Single Mother |
| No Children | 0 (0.0%) | 28 (20.9%) |
| 1 or 2 Children | 0 (0.0%) | 92 (27.1%) |
| 3 or 4 Children | 0 (0.0%) | 79 (91.9%) |
| 5 or more Children | 0 (0.0%) | 0 (0.0%) |
| Total | 0 (0.0%) | 199 (35.5%) |
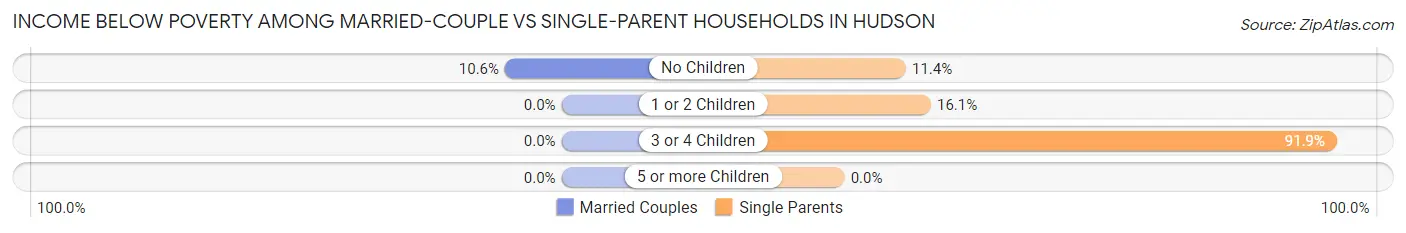
Income Below Poverty Among Married-Couple vs Single-Parent Households in Hudson
The poverty data for Hudson shows that 180 of the married-couple family households (6.4%) and 199 of the single-parent households (22.0%) are living below the poverty level. Within the married-couple family households, those with no children have the highest poverty rate, with 180 households (10.5%) falling below the poverty line. Among the single-parent households, those with 3 or 4 children have the highest poverty rate, with 79 household (91.9%) living below poverty.
| Children | Married-Couple Families | Single-Parent Households |
| No Children | 180 (10.5%) | 28 (11.4%) |
| 1 or 2 Children | 0 (0.0%) | 92 (16.1%) |
| 3 or 4 Children | 0 (0.0%) | 79 (91.9%) |
| 5 or more Children | 0 (0.0%) | 0 (0.0%) |
| Total | 180 (6.4%) | 199 (22.0%) |
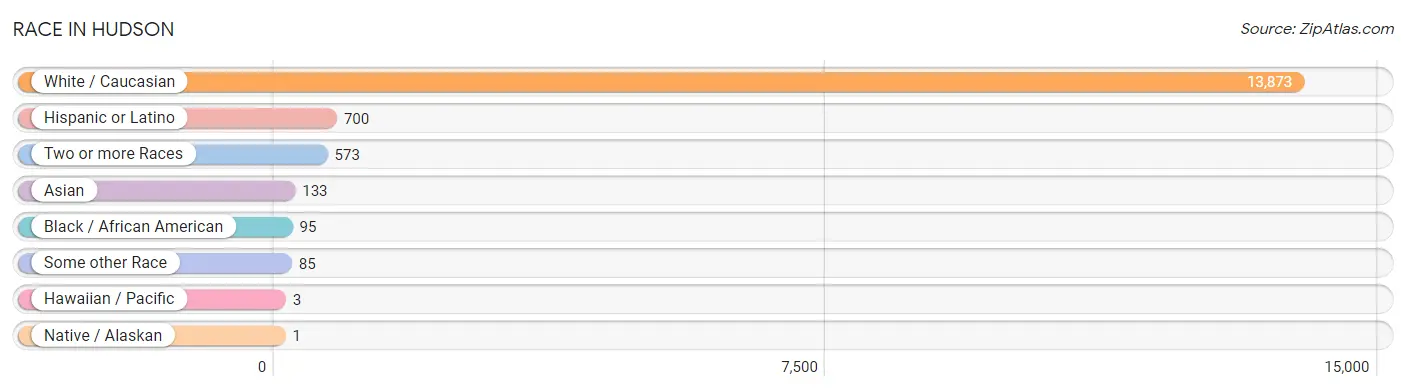
Race in Hudson
The most populous races in Hudson are White / Caucasian (13,873 | 94.0%), Hispanic or Latino (700 | 4.7%), and Two or more Races (573 | 3.9%).
| Race | # Population | % Population |
| Asian | 133 | 0.9% |
| Black / African American | 95 | 0.6% |
| Hawaiian / Pacific | 3 | 0.0% |
| Hispanic or Latino | 700 | 4.7% |
| Native / Alaskan | 1 | 0.0% |
| White / Caucasian | 13,873 | 94.0% |
| Two or more Races | 573 | 3.9% |
| Some other Race | 85 | 0.6% |
| Total | 14,763 | 100.0% |
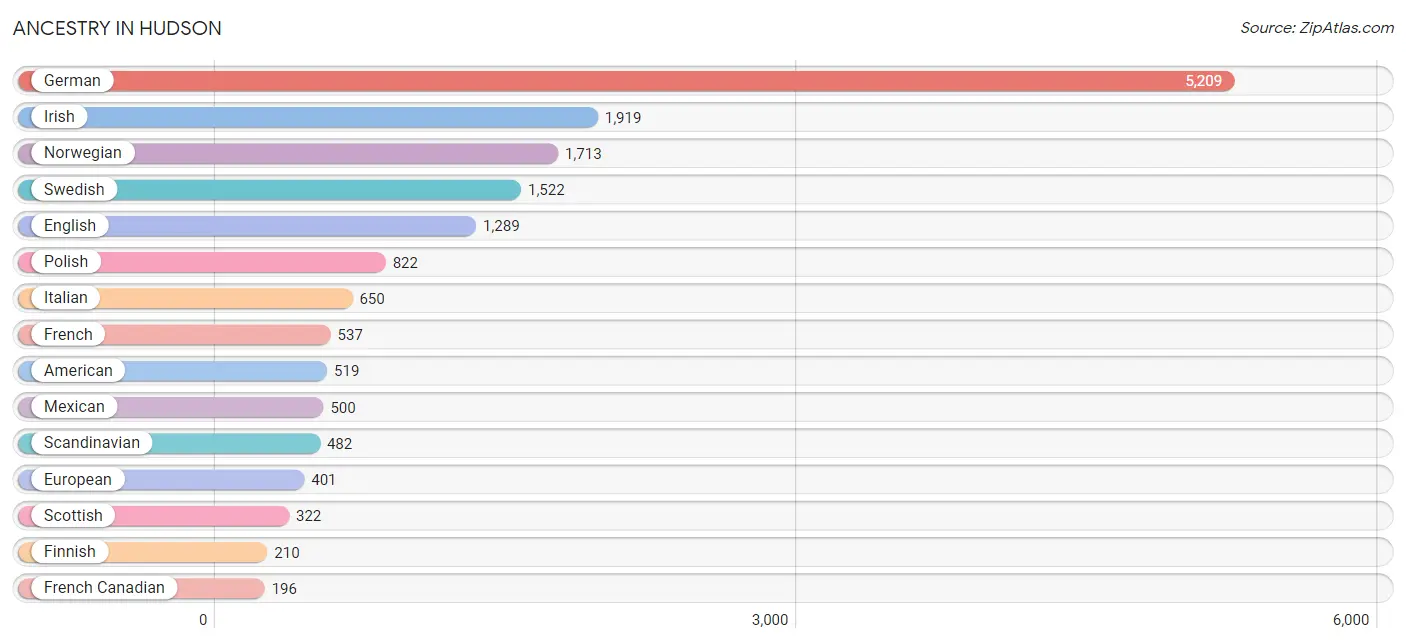
Ancestry in Hudson
The most populous ancestries reported in Hudson are German (5,209 | 35.3%), Irish (1,919 | 13.0%), Norwegian (1,713 | 11.6%), Swedish (1,522 | 10.3%), and English (1,289 | 8.7%), together accounting for 78.9% of all Hudson residents.
| Ancestry | # Population | % Population |
| American | 519 | 3.5% |
| Arab | 12 | 0.1% |
| Australian | 22 | 0.2% |
| Austrian | 23 | 0.2% |
| Bangladeshi | 67 | 0.4% |
| Belgian | 19 | 0.1% |
| Blackfeet | 1 | 0.0% |
| British | 71 | 0.5% |
| Burmese | 25 | 0.2% |
| Central American | 57 | 0.4% |
| Cherokee | 1 | 0.0% |
| Chilean | 14 | 0.1% |
| Chippewa | 2 | 0.0% |
| Colombian | 44 | 0.3% |
| Cuban | 26 | 0.2% |
| Czech | 111 | 0.7% |
| Czechoslovakian | 3 | 0.0% |
| Danish | 91 | 0.6% |
| Dutch | 170 | 1.1% |
| Eastern European | 72 | 0.5% |
| Egyptian | 1 | 0.0% |
| English | 1,289 | 8.7% |
| European | 401 | 2.7% |
| Finnish | 210 | 1.4% |
| French | 537 | 3.6% |
| French Canadian | 196 | 1.3% |
| German | 5,209 | 35.3% |
| Greek | 13 | 0.1% |
| Hungarian | 33 | 0.2% |
| Icelander | 16 | 0.1% |
| Indian (Asian) | 17 | 0.1% |
| Irish | 1,919 | 13.0% |
| Iroquois | 10 | 0.1% |
| Italian | 650 | 4.4% |
| Korean | 138 | 0.9% |
| Lebanese | 4 | 0.0% |
| Lithuanian | 52 | 0.4% |
| Mexican | 500 | 3.4% |
| Mexican American Indian | 36 | 0.2% |
| Native Hawaiian | 3 | 0.0% |
| Northern European | 57 | 0.4% |
| Norwegian | 1,713 | 11.6% |
| Polish | 822 | 5.6% |
| Portuguese | 22 | 0.2% |
| Puerto Rican | 7 | 0.1% |
| Russian | 100 | 0.7% |
| Salvadoran | 57 | 0.4% |
| Scandinavian | 482 | 3.3% |
| Scotch-Irish | 6 | 0.0% |
| Scottish | 322 | 2.2% |
| Serbian | 151 | 1.0% |
| Slovak | 2 | 0.0% |
| Slovene | 50 | 0.3% |
| South American | 81 | 0.5% |
| Spanish American | 25 | 0.2% |
| Subsaharan African | 1 | 0.0% |
| Sudanese | 1 | 0.0% |
| Swedish | 1,522 | 10.3% |
| Swiss | 42 | 0.3% |
| Syrian | 7 | 0.1% |
| Thai | 19 | 0.1% |
| Ukrainian | 96 | 0.6% |
| Uruguayan | 23 | 0.2% |
| Welsh | 100 | 0.7% | View All 64 Rows |
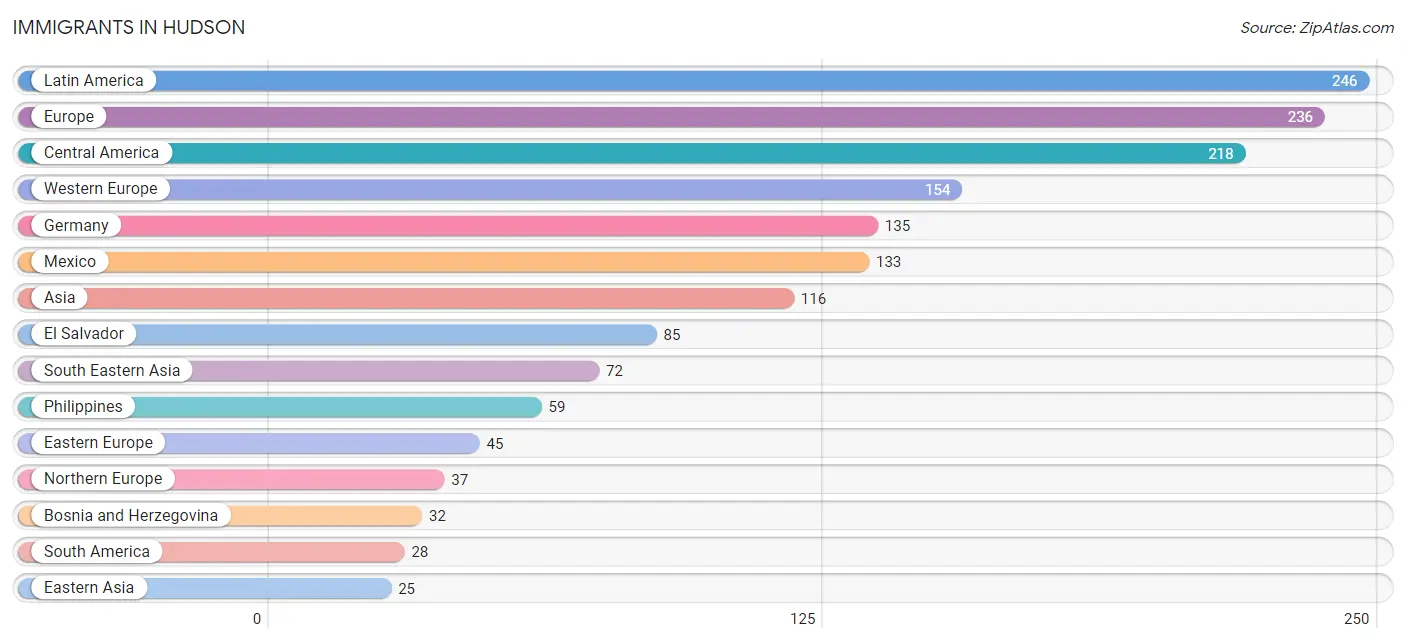
Immigrants in Hudson
The most numerous immigrant groups reported in Hudson came from Latin America (246 | 1.7%), Europe (236 | 1.6%), Central America (218 | 1.5%), Western Europe (154 | 1.0%), and Germany (135 | 0.9%), together accounting for 6.7% of all Hudson residents.
| Immigration Origin | # Population | % Population |
| Africa | 1 | 0.0% |
| Asia | 116 | 0.8% |
| Australia | 6 | 0.0% |
| Bosnia and Herzegovina | 32 | 0.2% |
| Canada | 16 | 0.1% |
| Central America | 218 | 1.5% |
| Chile | 14 | 0.1% |
| Colombia | 14 | 0.1% |
| Denmark | 15 | 0.1% |
| Eastern Asia | 25 | 0.2% |
| Eastern Europe | 45 | 0.3% |
| El Salvador | 85 | 0.6% |
| Europe | 236 | 1.6% |
| France | 19 | 0.1% |
| Germany | 135 | 0.9% |
| India | 19 | 0.1% |
| Ireland | 22 | 0.2% |
| Korea | 25 | 0.2% |
| Laos | 13 | 0.1% |
| Latin America | 246 | 1.7% |
| Mexico | 133 | 0.9% |
| Northern Africa | 1 | 0.0% |
| Northern Europe | 37 | 0.3% |
| Oceania | 6 | 0.0% |
| Philippines | 59 | 0.4% |
| South America | 28 | 0.2% |
| South Central Asia | 19 | 0.1% |
| South Eastern Asia | 72 | 0.5% |
| Sudan | 1 | 0.0% |
| Ukraine | 13 | 0.1% |
| Western Europe | 154 | 1.0% | View All 31 Rows |
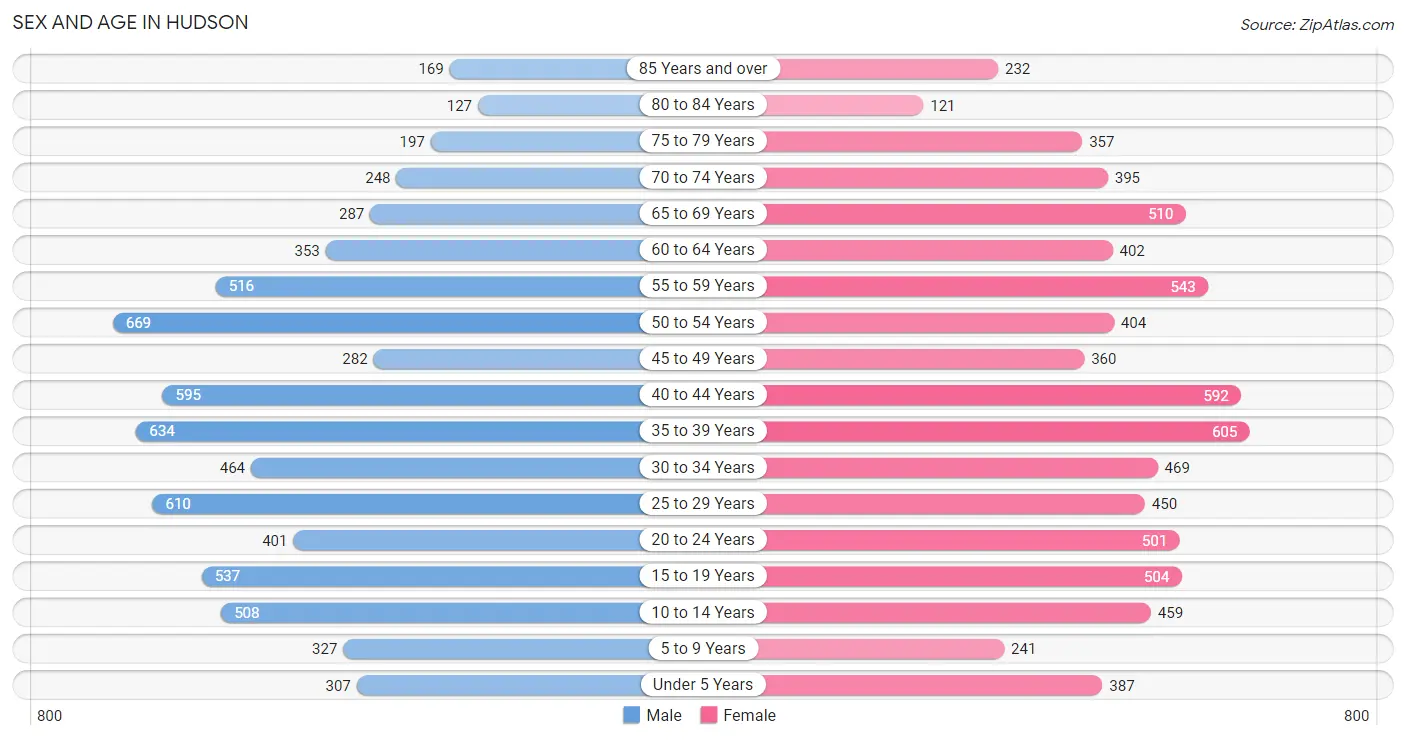
Sex and Age in Hudson
Sex and Age in Hudson
The most populous age groups in Hudson are 50 to 54 Years (669 | 9.2%) for men and 35 to 39 Years (605 | 8.0%) for women.
| Age Bracket | Male | Female |
| Under 5 Years | 307 (4.3%) | 387 (5.1%) |
| 5 to 9 Years | 327 (4.5%) | 241 (3.2%) |
| 10 to 14 Years | 508 (7.0%) | 459 (6.1%) |
| 15 to 19 Years | 537 (7.4%) | 504 (6.7%) |
| 20 to 24 Years | 401 (5.6%) | 501 (6.7%) |
| 25 to 29 Years | 610 (8.4%) | 450 (6.0%) |
| 30 to 34 Years | 464 (6.4%) | 469 (6.2%) |
| 35 to 39 Years | 634 (8.8%) | 605 (8.0%) |
| 40 to 44 Years | 595 (8.2%) | 592 (7.9%) |
| 45 to 49 Years | 282 (3.9%) | 360 (4.8%) |
| 50 to 54 Years | 669 (9.2%) | 404 (5.4%) |
| 55 to 59 Years | 516 (7.1%) | 543 (7.2%) |
| 60 to 64 Years | 353 (4.9%) | 402 (5.3%) |
| 65 to 69 Years | 287 (4.0%) | 510 (6.8%) |
| 70 to 74 Years | 248 (3.4%) | 395 (5.2%) |
| 75 to 79 Years | 197 (2.7%) | 357 (4.7%) |
| 80 to 84 Years | 127 (1.8%) | 121 (1.6%) |
| 85 Years and over | 169 (2.3%) | 232 (3.1%) |
| Total | 7,231 (100.0%) | 7,532 (100.0%) |
Families and Households in Hudson
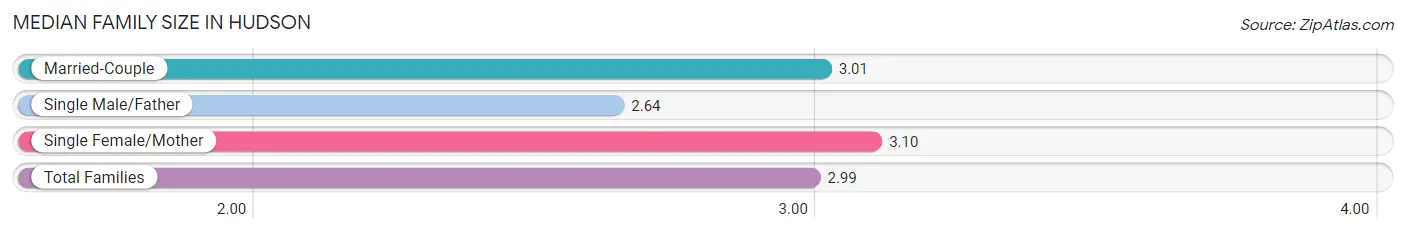
Median Family Size in Hudson
The median family size in Hudson is 2.99 persons per family, with single female/mother families (560 | 15.0%) accounting for the largest median family size of 3.1 persons per family. On the other hand, single male/father families (343 | 9.2%) represent the smallest median family size with 2.64 persons per family.
| Family Type | # Families | Family Size |
| Married-Couple | 2,823 (75.8%) | 3.01 |
| Single Male/Father | 343 (9.2%) | 2.64 |
| Single Female/Mother | 560 (15.0%) | 3.10 |
| Total Families | 3,726 (100.0%) | 2.99 |
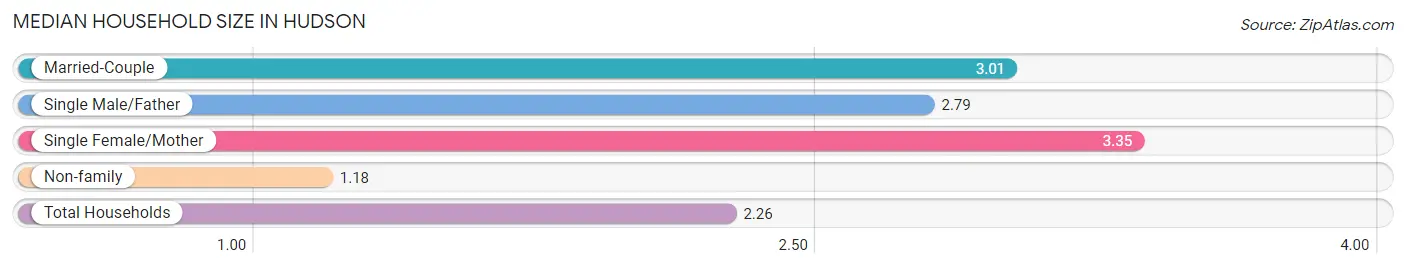
Median Household Size in Hudson
The median household size in Hudson is 2.26 persons per household, with single female/mother households (560 | 8.7%) accounting for the largest median household size of 3.35 persons per household. non-family households (2,683 | 41.9%) represent the smallest median household size with 1.18 persons per household.
| Household Type | # Households | Household Size |
| Married-Couple | 2,823 (44.1%) | 3.01 |
| Single Male/Father | 343 (5.3%) | 2.79 |
| Single Female/Mother | 560 (8.7%) | 3.35 |
| Non-family | 2,683 (41.9%) | 1.18 |
| Total Households | 6,409 (100.0%) | 2.26 |
Household Size by Marriage Status in Hudson
Out of a total of 6,409 households in Hudson, 3,726 (58.1%) are family households, while 2,683 (41.9%) are nonfamily households. The most numerous type of family households are 2-person households, comprising 1,755, and the most common type of nonfamily households are 1-person households, comprising 2,212.
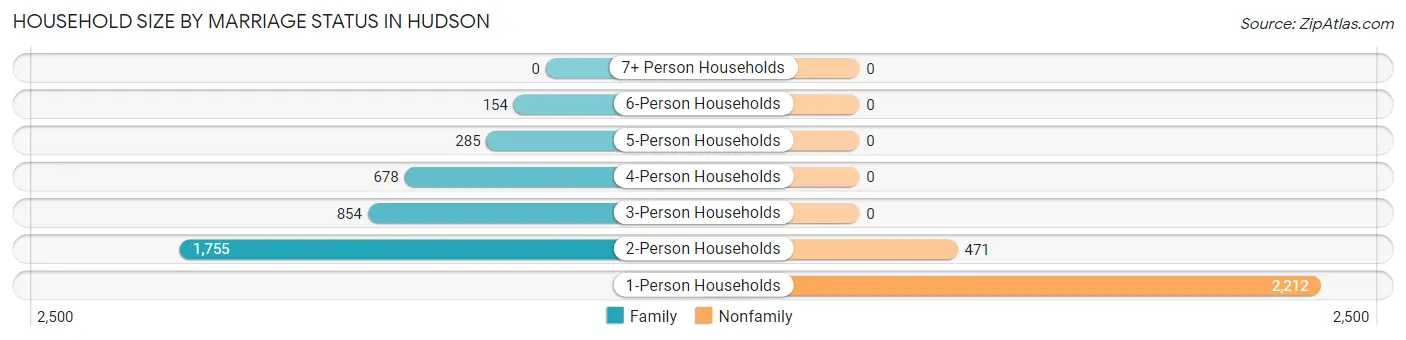
| Household Size | Family Households | Nonfamily Households |
| 1-Person Households | - | 2,212 (34.5%) |
| 2-Person Households | 1,755 (27.4%) | 471 (7.3%) |
| 3-Person Households | 854 (13.3%) | 0 (0.0%) |
| 4-Person Households | 678 (10.6%) | 0 (0.0%) |
| 5-Person Households | 285 (4.4%) | 0 (0.0%) |
| 6-Person Households | 154 (2.4%) | 0 (0.0%) |
| 7+ Person Households | 0 (0.0%) | 0 (0.0%) |
| Total | 3,726 (58.1%) | 2,683 (41.9%) |
Female Fertility in Hudson
Fertility by Age in Hudson
Average fertility rate in Hudson is 36.0 births per 1,000 women. Women in the age bracket of 20 to 34 years have the highest fertility rate with 89.0 births per 1,000 women. Women in the age bracket of 20 to 34 years acount for 100.0% of all women with births.
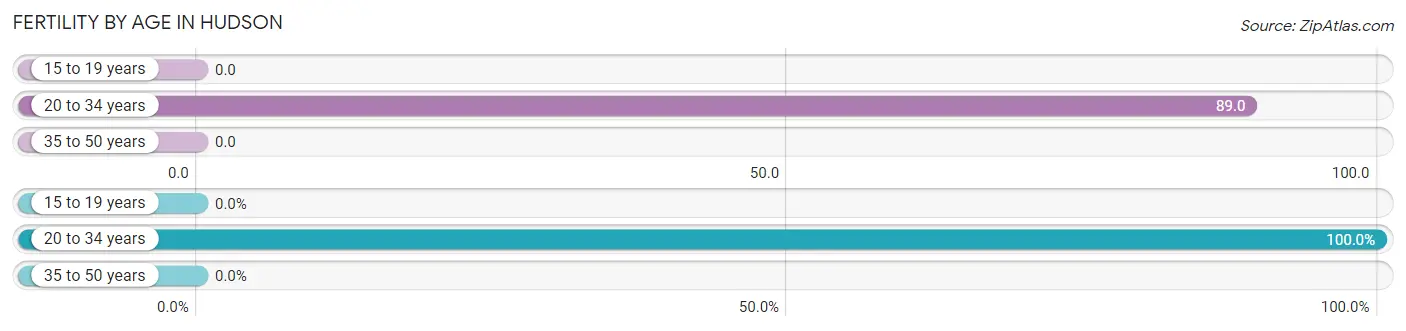
| Age Bracket | Women with Births | Births / 1,000 Women |
| 15 to 19 years | 0 (0.0%) | 0.0 |
| 20 to 34 years | 126 (100.0%) | 89.0 |
| 35 to 50 years | 0 (0.0%) | 0.0 |
| Total | 126 (100.0%) | 36.0 |
Fertility by Age by Marriage Status in Hudson
72.2% of women with births (126) in Hudson are married. The highest percentage of unmarried women with births falls into 20 to 34 years age bracket with 27.8% of them unmarried at the time of birth, while the lowest percentage of unmarried women with births belong to 20 to 34 years age bracket with 27.8% of them unmarried.
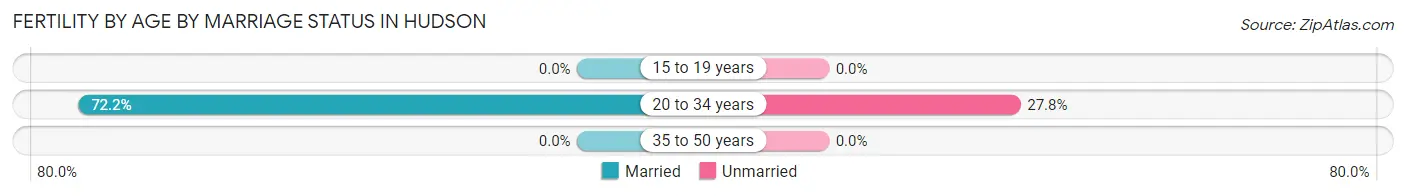
| Age Bracket | Married | Unmarried |
| 15 to 19 years | 0 (0.0%) | 0 (0.0%) |
| 20 to 34 years | 91 (72.2%) | 35 (27.8%) |
| 35 to 50 years | 0 (0.0%) | 0 (0.0%) |
| Total | 91 (72.2%) | 35 (27.8%) |
Fertility by Education in Hudson
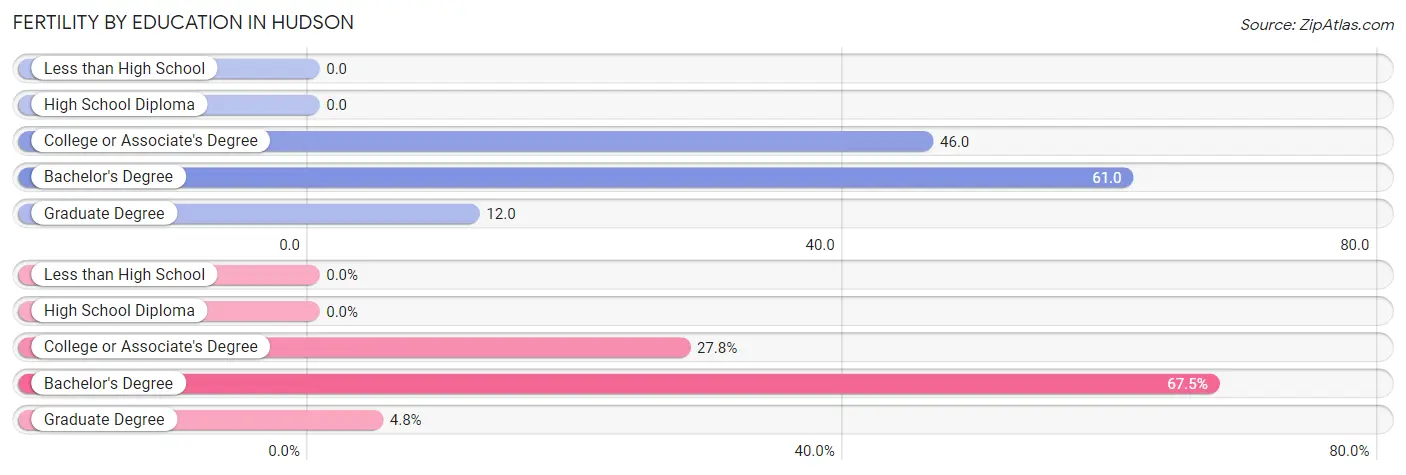
| Educational Attainment | Women with Births | Births / 1,000 Women |
| Less than High School | 0 (0.0%) | 0.0 |
| High School Diploma | 0 (0.0%) | 0.0 |
| College or Associate's Degree | 35 (27.8%) | 46.0 |
| Bachelor's Degree | 85 (67.5%) | 61.0 |
| Graduate Degree | 6 (4.8%) | 12.0 |
| Total | 126 (100.0%) | 36.0 |
Fertility by Education by Marriage Status in Hudson
27.8% of women with births in Hudson are unmarried. Women with the educational attainment of bachelor's degree are most likely to be married with 100.0% of them married at childbirth, while women with the educational attainment of college or associate's degree are least likely to be married with 100.0% of them unmarried at childbirth.
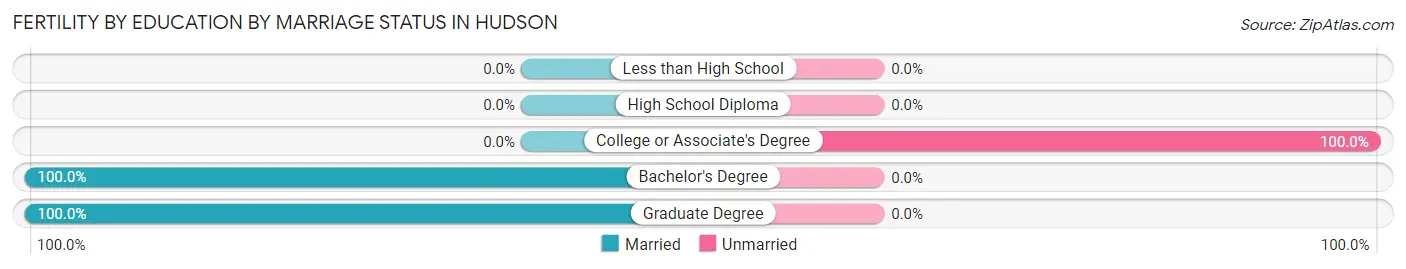
| Educational Attainment | Married | Unmarried |
| Less than High School | 0 (0.0%) | 0 (0.0%) |
| High School Diploma | 0 (0.0%) | 0 (0.0%) |
| College or Associate's Degree | 0 (0.0%) | 35 (100.0%) |
| Bachelor's Degree | 85 (100.0%) | 0 (0.0%) |
| Graduate Degree | 6 (100.0%) | 0 (0.0%) |
| Total | 91 (72.2%) | 35 (27.8%) |
Employment Characteristics in Hudson
Employment by Class of Employer in Hudson
Among the 8,205 employed individuals in Hudson, private company employees (5,709 | 69.6%), not-for-profit organizations (722 | 8.8%), and self-employed (not incorporated) (716 | 8.7%) make up the most common classes of employment.
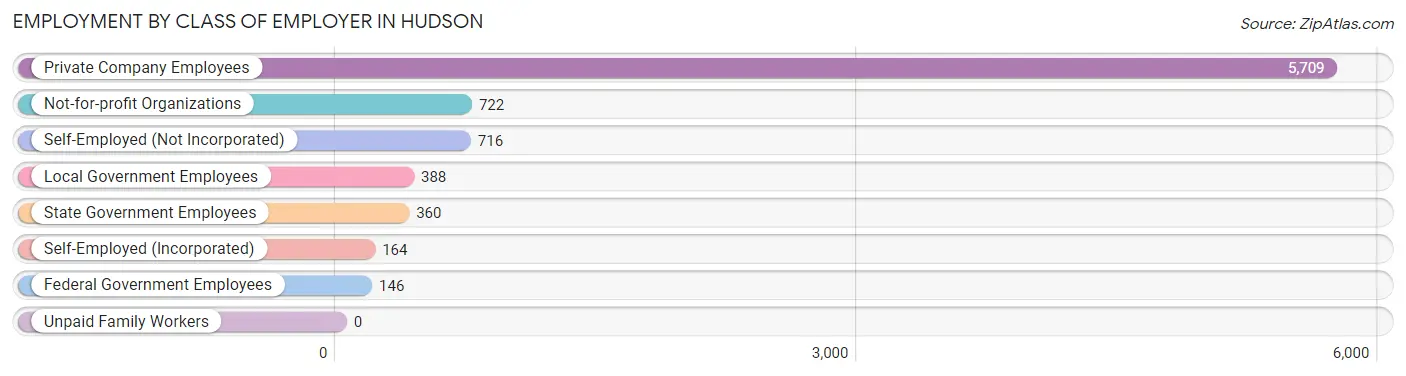
| Employer Class | # Employees | % Employees |
| Private Company Employees | 5,709 | 69.6% |
| Self-Employed (Incorporated) | 164 | 2.0% |
| Self-Employed (Not Incorporated) | 716 | 8.7% |
| Not-for-profit Organizations | 722 | 8.8% |
| Local Government Employees | 388 | 4.7% |
| State Government Employees | 360 | 4.4% |
| Federal Government Employees | 146 | 1.8% |
| Unpaid Family Workers | 0 | 0.0% |
| Total | 8,205 | 100.0% |
Employment Status by Age in Hudson
According to the labor force statistics for Hudson, out of the total population over 16 years of age (12,176), 68.7% or 8,365 individuals are in the labor force, with 0.9% or 75 of them unemployed. The age group with the highest labor force participation rate is 25 to 29 years, with 97.6% or 1,035 individuals in the labor force. Within the labor force, the 35 to 44 years age range has the highest percentage of unemployed individuals, with 2.6% or 57 of them being unemployed.
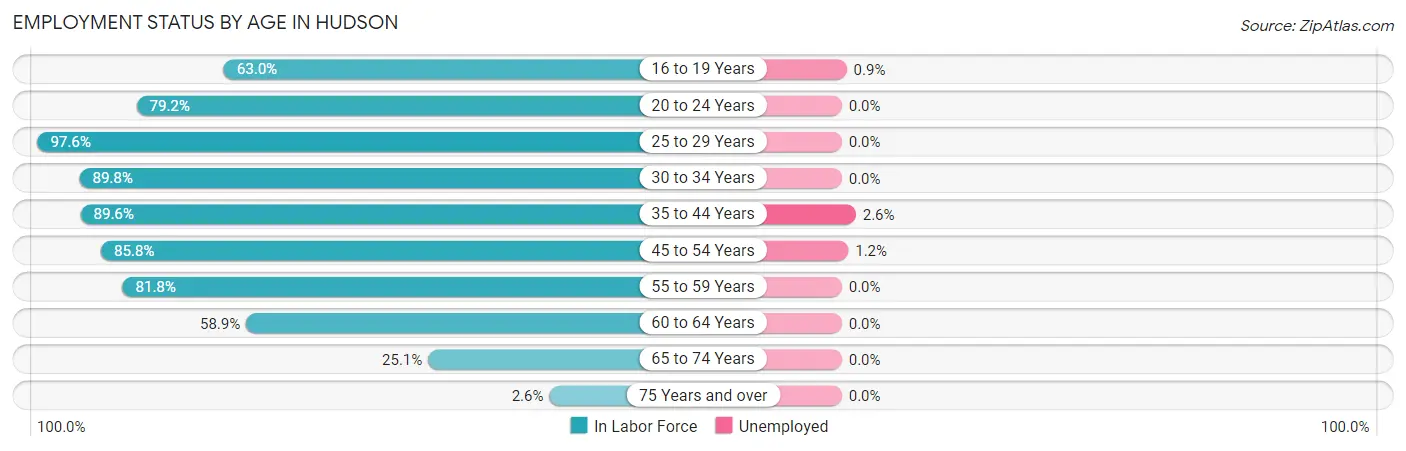
| Age Bracket | In Labor Force | Unemployed |
| 16 to 19 Years | 430 (63.0%) | 4 (0.9%) |
| 20 to 24 Years | 714 (79.2%) | 0 (0.0%) |
| 25 to 29 Years | 1,035 (97.6%) | 0 (0.0%) |
| 30 to 34 Years | 838 (89.8%) | 0 (0.0%) |
| 35 to 44 Years | 2,174 (89.6%) | 57 (2.6%) |
| 45 to 54 Years | 1,471 (85.8%) | 18 (1.2%) |
| 55 to 59 Years | 866 (81.8%) | 0 (0.0%) |
| 60 to 64 Years | 445 (58.9%) | 0 (0.0%) |
| 65 to 74 Years | 361 (25.1%) | 0 (0.0%) |
| 75 Years and over | 31 (2.6%) | 0 (0.0%) |
| Total | 8,365 (68.7%) | 75 (0.9%) |
Employment Status by Educational Attainment in Hudson
According to labor force statistics for Hudson, 85.9% of individuals (6,827) out of the total population between 25 and 64 years of age (7,948) are in the labor force, with 1.1% or 75 of them being unemployed. The group with the highest labor force participation rate are those with the educational attainment of bachelor's degree or higher, with 88.6% or 3,329 individuals in the labor force. Within the labor force, individuals with less than high school education have the highest percentage of unemployment, with 15.3% or 56 of them being unemployed.
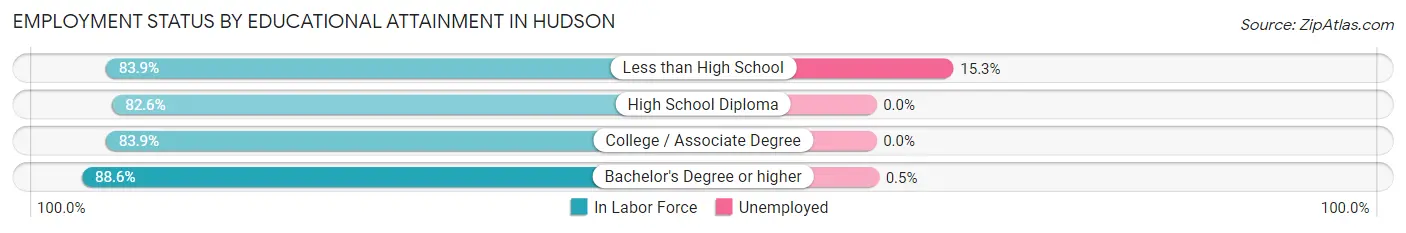
| Educational Attainment | In Labor Force | Unemployed |
| Less than High School | 365 (83.9%) | 67 (15.3%) |
| High School Diploma | 1,123 (82.6%) | 0 (0.0%) |
| College / Associate Degree | 2,011 (83.9%) | 0 (0.0%) |
| Bachelor's Degree or higher | 3,329 (88.6%) | 19 (0.5%) |
| Total | 6,827 (85.9%) | 87 (1.1%) |
Employment Occupations by Sex in Hudson
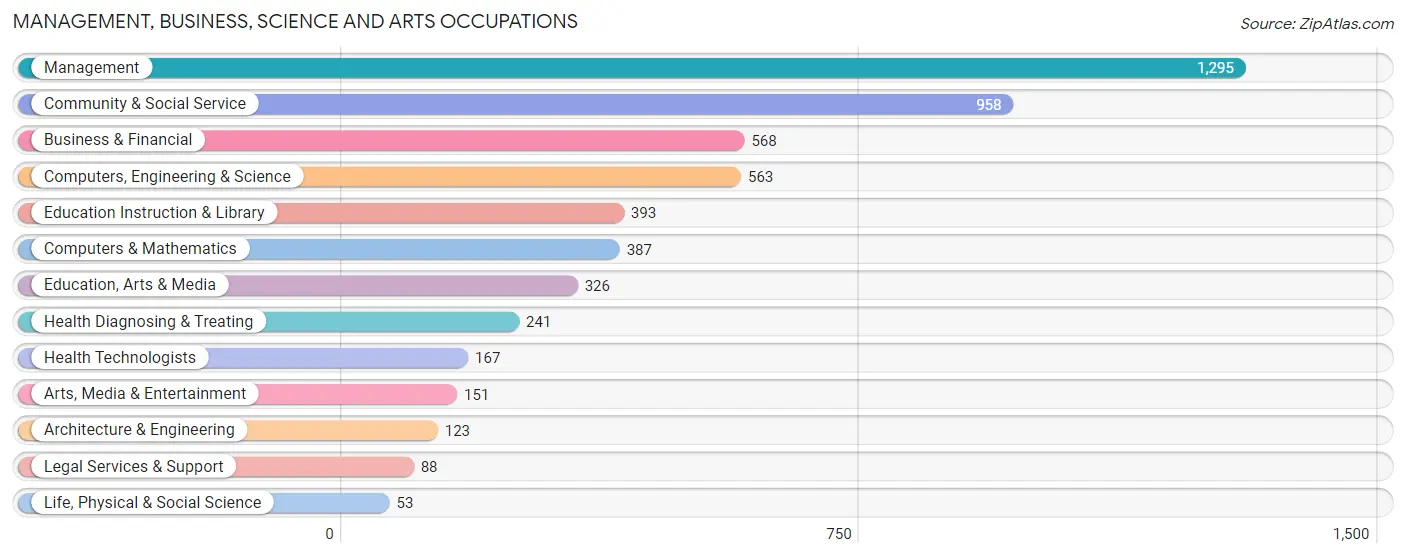
Management, Business, Science and Arts Occupations
The most common Management, Business, Science and Arts occupations in Hudson are Management (1,295 | 15.6%), Community & Social Service (958 | 11.6%), Business & Financial (568 | 6.9%), Computers, Engineering & Science (563 | 6.8%), and Education Instruction & Library (393 | 4.7%).
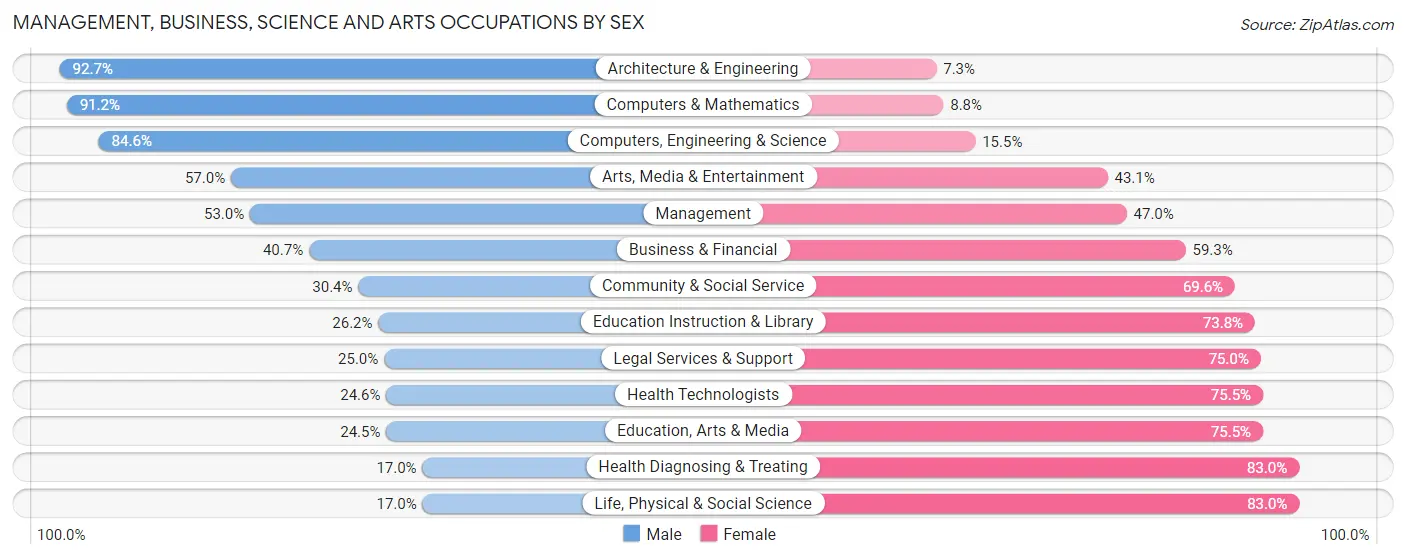
Management, Business, Science and Arts Occupations by Sex
Within the Management, Business, Science and Arts occupations in Hudson, the most male-oriented occupations are Architecture & Engineering (92.7%), Computers & Mathematics (91.2%), and Computers, Engineering & Science (84.6%), while the most female-oriented occupations are Life, Physical & Social Science (83.0%), Health Diagnosing & Treating (83.0%), and Education, Arts & Media (75.5%).
| Occupation | Male | Female |
| Management | 686 (53.0%) | 609 (47.0%) |
| Business & Financial | 231 (40.7%) | 337 (59.3%) |
| Computers, Engineering & Science | 476 (84.6%) | 87 (15.4%) |
| Computers & Mathematics | 353 (91.2%) | 34 (8.8%) |
| Architecture & Engineering | 114 (92.7%) | 9 (7.3%) |
| Life, Physical & Social Science | 9 (17.0%) | 44 (83.0%) |
| Community & Social Service | 291 (30.4%) | 667 (69.6%) |
| Education, Arts & Media | 80 (24.5%) | 246 (75.5%) |
| Legal Services & Support | 22 (25.0%) | 66 (75.0%) |
| Education Instruction & Library | 103 (26.2%) | 290 (73.8%) |
| Arts, Media & Entertainment | 86 (57.0%) | 65 (43.0%) |
| Health Diagnosing & Treating | 41 (17.0%) | 200 (83.0%) |
| Health Technologists | 41 (24.5%) | 126 (75.4%) |
| Total (Category) | 1,725 (47.6%) | 1,900 (52.4%) |
| Total (Overall) | 4,432 (53.5%) | 3,855 (46.5%) |
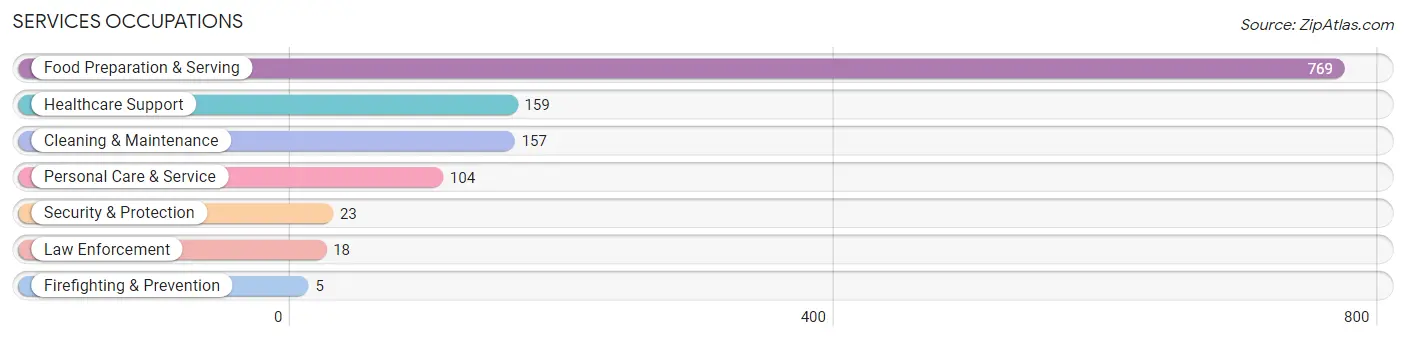
Services Occupations
The most common Services occupations in Hudson are Food Preparation & Serving (769 | 9.3%), Healthcare Support (159 | 1.9%), Cleaning & Maintenance (157 | 1.9%), Personal Care & Service (104 | 1.3%), and Security & Protection (23 | 0.3%).
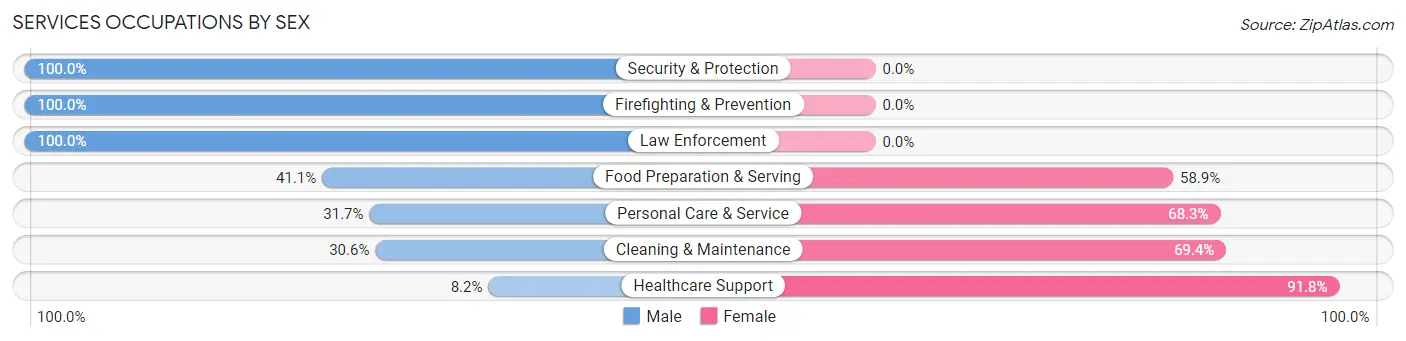
Services Occupations by Sex
Within the Services occupations in Hudson, the most male-oriented occupations are Security & Protection (100.0%), Firefighting & Prevention (100.0%), and Law Enforcement (100.0%), while the most female-oriented occupations are Healthcare Support (91.8%), Cleaning & Maintenance (69.4%), and Personal Care & Service (68.3%).
| Occupation | Male | Female |
| Healthcare Support | 13 (8.2%) | 146 (91.8%) |
| Security & Protection | 23 (100.0%) | 0 (0.0%) |
| Firefighting & Prevention | 5 (100.0%) | 0 (0.0%) |
| Law Enforcement | 18 (100.0%) | 0 (0.0%) |
| Food Preparation & Serving | 316 (41.1%) | 453 (58.9%) |
| Cleaning & Maintenance | 48 (30.6%) | 109 (69.4%) |
| Personal Care & Service | 33 (31.7%) | 71 (68.3%) |
| Total (Category) | 433 (35.7%) | 779 (64.3%) |
| Total (Overall) | 4,432 (53.5%) | 3,855 (46.5%) |
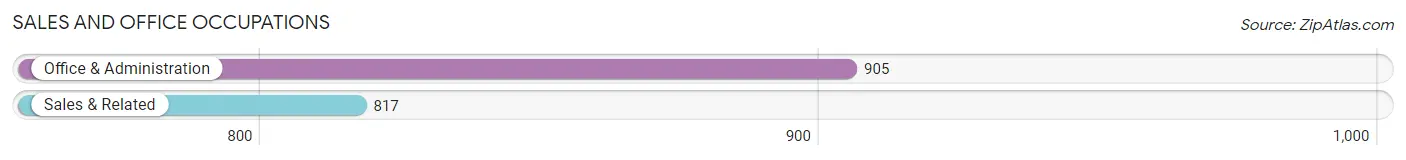
Sales and Office Occupations
The most common Sales and Office occupations in Hudson are Office & Administration (905 | 10.9%), and Sales & Related (817 | 9.9%).
Sales and Office Occupations by Sex
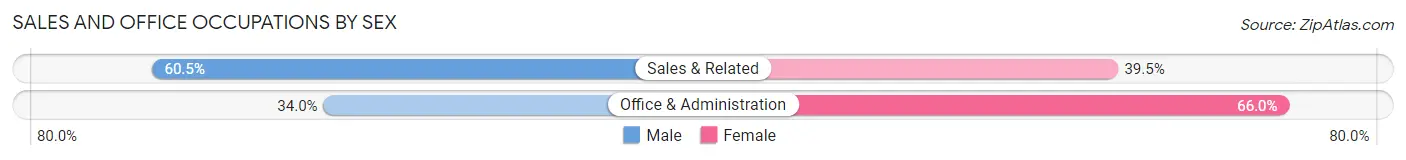
| Occupation | Male | Female |
| Sales & Related | 494 (60.5%) | 323 (39.5%) |
| Office & Administration | 308 (34.0%) | 597 (66.0%) |
| Total (Category) | 802 (46.6%) | 920 (53.4%) |
| Total (Overall) | 4,432 (53.5%) | 3,855 (46.5%) |
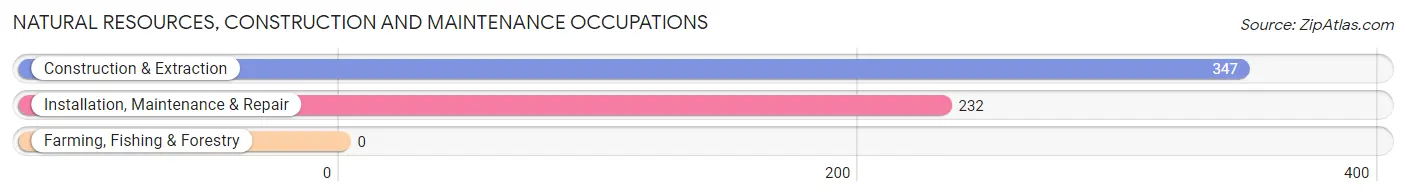
Natural Resources, Construction and Maintenance Occupations
The most common Natural Resources, Construction and Maintenance occupations in Hudson are Construction & Extraction (347 | 4.2%), and Installation, Maintenance & Repair (232 | 2.8%).
Natural Resources, Construction and Maintenance Occupations by Sex
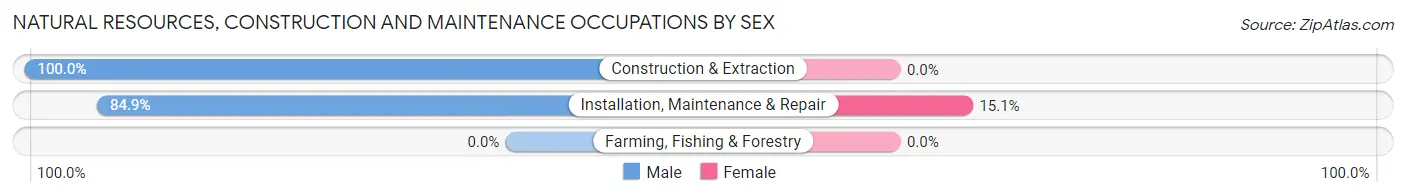
| Occupation | Male | Female |
| Farming, Fishing & Forestry | 0 (0.0%) | 0 (0.0%) |
| Construction & Extraction | 347 (100.0%) | 0 (0.0%) |
| Installation, Maintenance & Repair | 197 (84.9%) | 35 (15.1%) |
| Total (Category) | 544 (94.0%) | 35 (6.0%) |
| Total (Overall) | 4,432 (53.5%) | 3,855 (46.5%) |
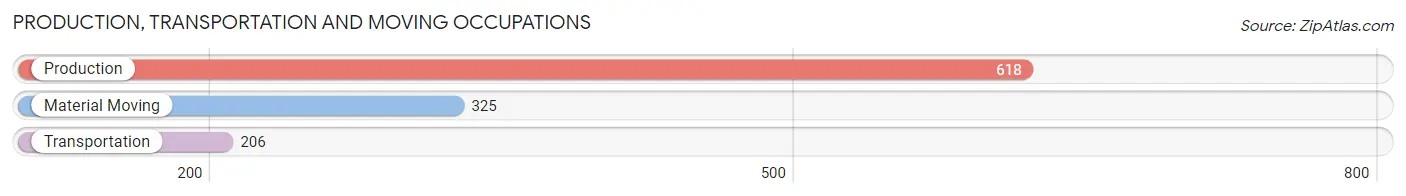
Production, Transportation and Moving Occupations
The most common Production, Transportation and Moving occupations in Hudson are Production (618 | 7.5%), Material Moving (325 | 3.9%), and Transportation (206 | 2.5%).
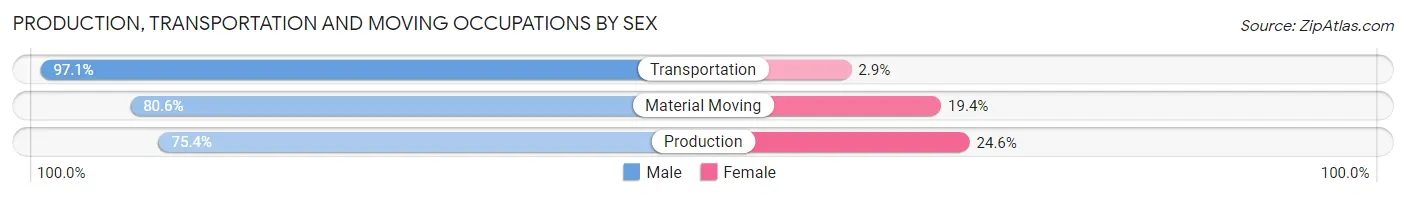
Production, Transportation and Moving Occupations by Sex
| Occupation | Male | Female |
| Production | 466 (75.4%) | 152 (24.6%) |
| Transportation | 200 (97.1%) | 6 (2.9%) |
| Material Moving | 262 (80.6%) | 63 (19.4%) |
| Total (Category) | 928 (80.8%) | 221 (19.2%) |
| Total (Overall) | 4,432 (53.5%) | 3,855 (46.5%) |
Employment Industries by Sex in Hudson
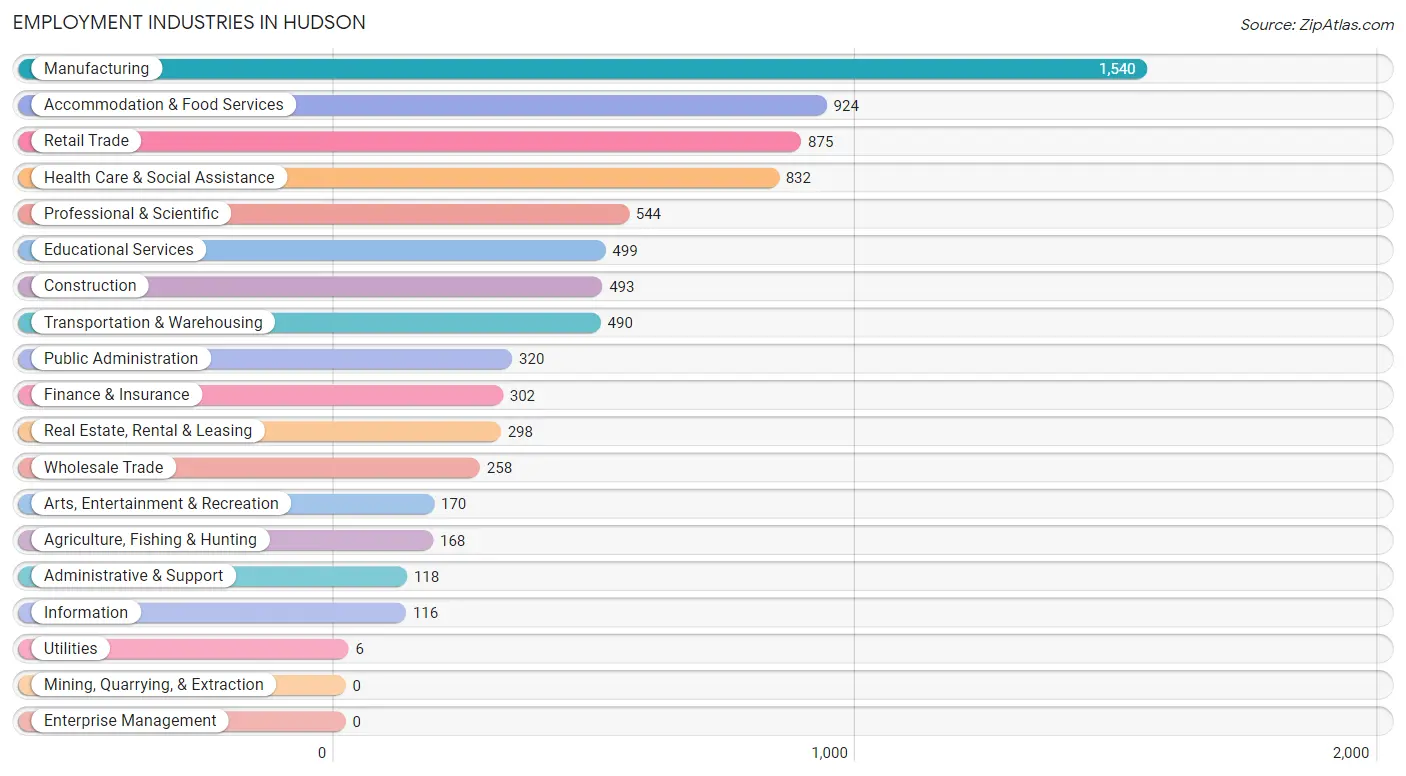
Employment Industries in Hudson
The major employment industries in Hudson include Manufacturing (1,540 | 18.6%), Accommodation & Food Services (924 | 11.2%), Retail Trade (875 | 10.6%), Health Care & Social Assistance (832 | 10.0%), and Professional & Scientific (544 | 6.6%).
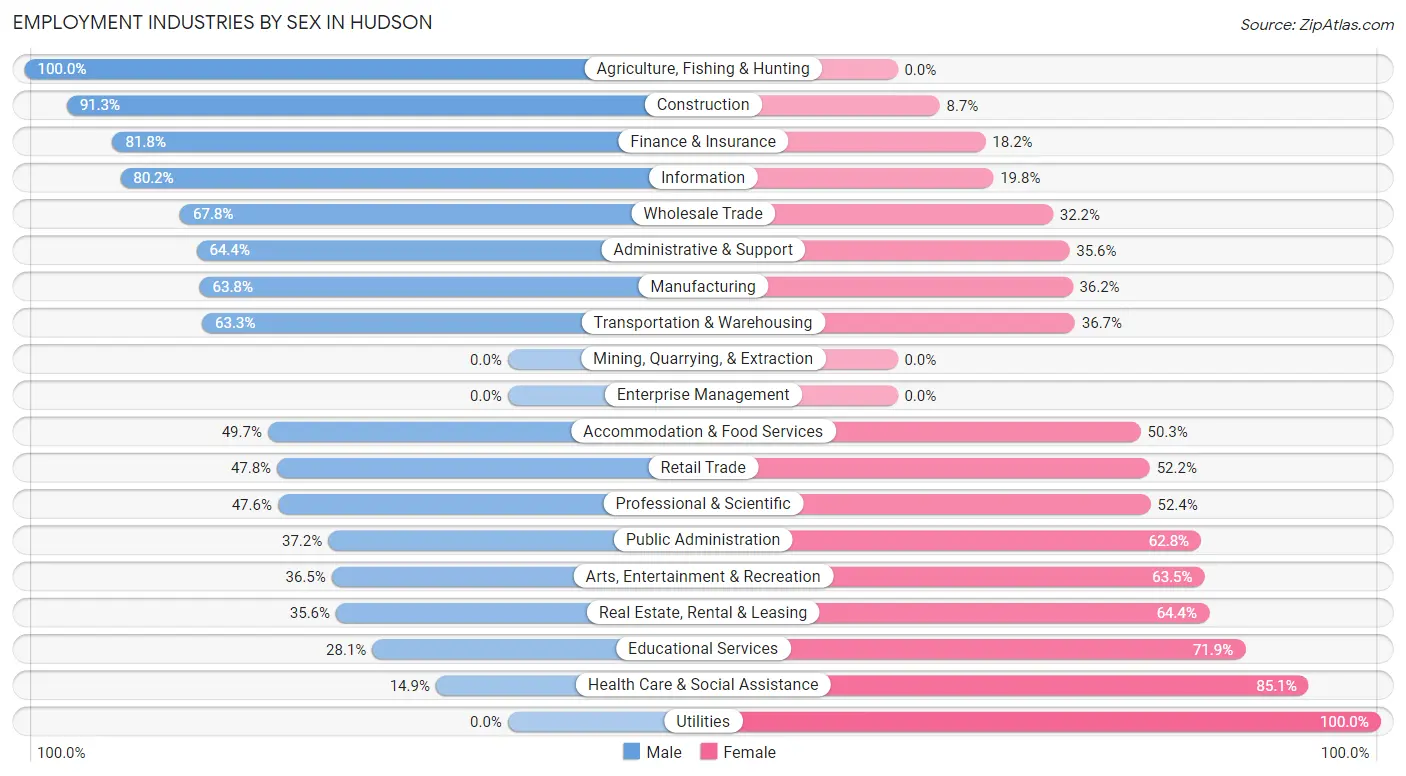
Employment Industries by Sex in Hudson
The Hudson industries that see more men than women are Agriculture, Fishing & Hunting (100.0%), Construction (91.3%), and Finance & Insurance (81.8%), whereas the industries that tend to have a higher number of women are Utilities (100.0%), Health Care & Social Assistance (85.1%), and Educational Services (71.9%).
| Industry | Male | Female |
| Agriculture, Fishing & Hunting | 168 (100.0%) | 0 (0.0%) |
| Mining, Quarrying, & Extraction | 0 (0.0%) | 0 (0.0%) |
| Construction | 450 (91.3%) | 43 (8.7%) |
| Manufacturing | 982 (63.8%) | 558 (36.2%) |
| Wholesale Trade | 175 (67.8%) | 83 (32.2%) |
| Retail Trade | 418 (47.8%) | 457 (52.2%) |
| Transportation & Warehousing | 310 (63.3%) | 180 (36.7%) |
| Utilities | 0 (0.0%) | 6 (100.0%) |
| Information | 93 (80.2%) | 23 (19.8%) |
| Finance & Insurance | 247 (81.8%) | 55 (18.2%) |
| Real Estate, Rental & Leasing | 106 (35.6%) | 192 (64.4%) |
| Professional & Scientific | 259 (47.6%) | 285 (52.4%) |
| Enterprise Management | 0 (0.0%) | 0 (0.0%) |
| Administrative & Support | 76 (64.4%) | 42 (35.6%) |
| Educational Services | 140 (28.1%) | 359 (71.9%) |
| Health Care & Social Assistance | 124 (14.9%) | 708 (85.1%) |
| Arts, Entertainment & Recreation | 62 (36.5%) | 108 (63.5%) |
| Accommodation & Food Services | 459 (49.7%) | 465 (50.3%) |
| Public Administration | 119 (37.2%) | 201 (62.8%) |
| Total | 4,432 (53.5%) | 3,855 (46.5%) |
Education in Hudson
School Enrollment in Hudson
The most common levels of schooling among the 3,307 students in Hudson are high school (896 | 27.1%), middle school (823 | 24.9%), and college / undergraduate (608 | 18.4%).
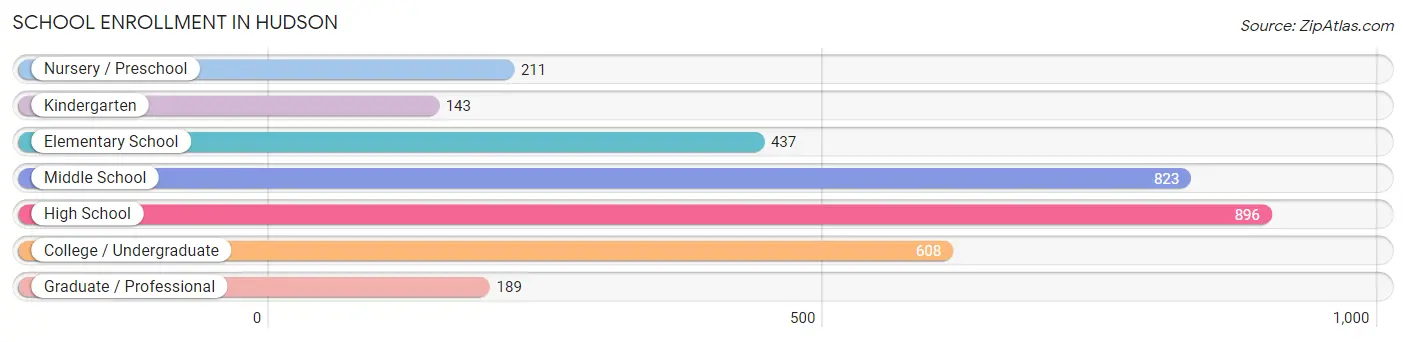
| School Level | # Students | % Students |
| Nursery / Preschool | 211 | 6.4% |
| Kindergarten | 143 | 4.3% |
| Elementary School | 437 | 13.2% |
| Middle School | 823 | 24.9% |
| High School | 896 | 27.1% |
| College / Undergraduate | 608 | 18.4% |
| Graduate / Professional | 189 | 5.7% |
| Total | 3,307 | 100.0% |
School Enrollment by Age by Funding Source in Hudson
Out of a total of 3,307 students who are enrolled in schools in Hudson, 351 (10.6%) attend a private institution, while the remaining 2,956 (89.4%) are enrolled in public schools. The age group of 3 to 4 year olds has the highest likelihood of being enrolled in private schools, with 87 (53.4% in the age bracket) enrolled. Conversely, the age group of 18 to 19 year olds has the lowest likelihood of being enrolled in a private school, with 172 (100.0% in the age bracket) attending a public institution.
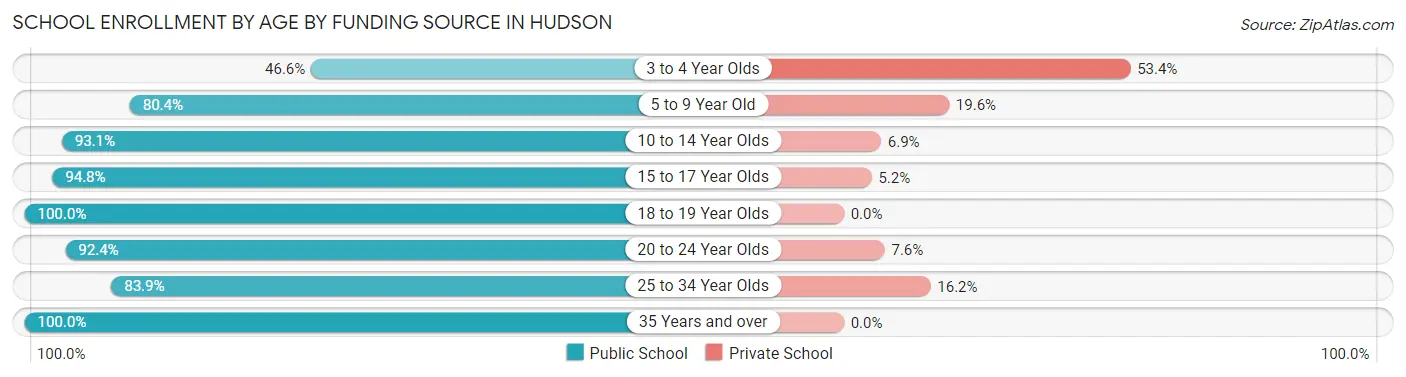
| Age Bracket | Public School | Private School |
| 3 to 4 Year Olds | 76 (46.6%) | 87 (53.4%) |
| 5 to 9 Year Old | 443 (80.4%) | 108 (19.6%) |
| 10 to 14 Year Olds | 900 (93.1%) | 67 (6.9%) |
| 15 to 17 Year Olds | 696 (94.8%) | 38 (5.2%) |
| 18 to 19 Year Olds | 172 (100.0%) | 0 (0.0%) |
| 20 to 24 Year Olds | 352 (92.4%) | 29 (7.6%) |
| 25 to 34 Year Olds | 109 (83.9%) | 21 (16.2%) |
| 35 Years and over | 209 (100.0%) | 0 (0.0%) |
| Total | 2,956 (89.4%) | 351 (10.6%) |
Educational Attainment by Field of Study in Hudson
Business (1,030 | 20.0%), science & technology (516 | 10.0%), education (444 | 8.6%), communications (424 | 8.2%), and social sciences (388 | 7.5%) are the most common fields of study among 5,145 individuals in Hudson who have obtained a bachelor's degree or higher.
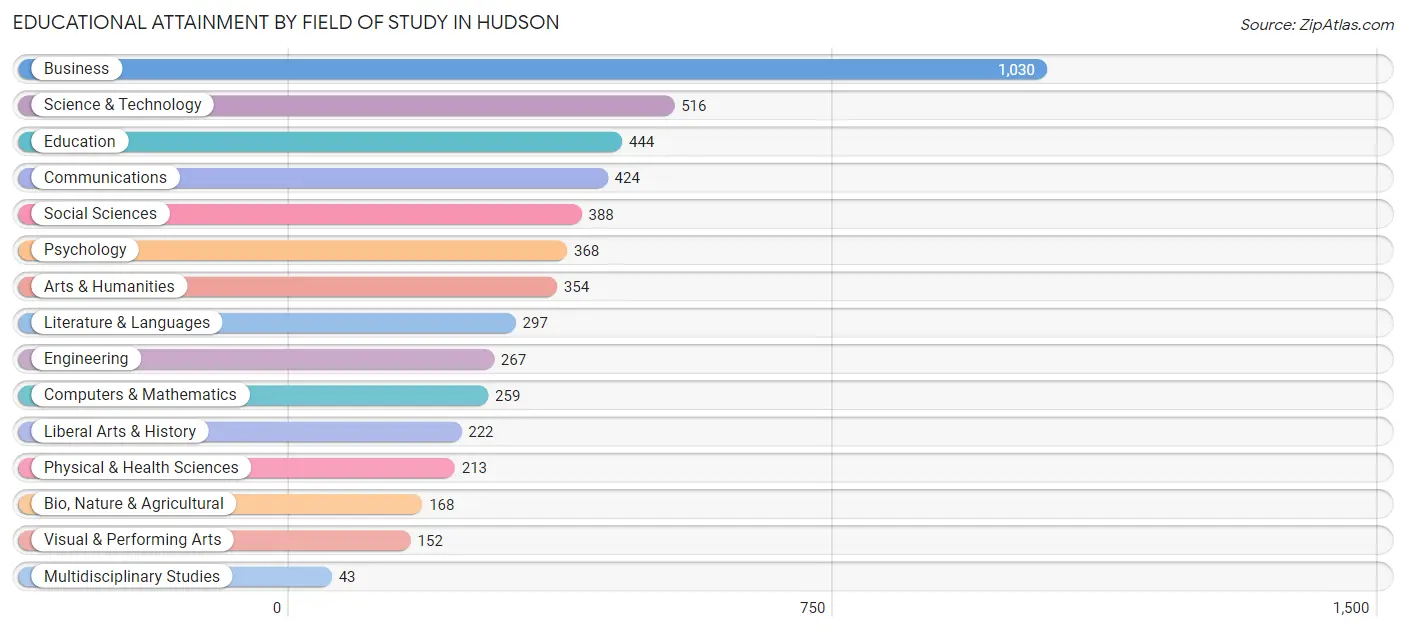
| Field of Study | # Graduates | % Graduates |
| Computers & Mathematics | 259 | 5.0% |
| Bio, Nature & Agricultural | 168 | 3.3% |
| Physical & Health Sciences | 213 | 4.1% |
| Psychology | 368 | 7.1% |
| Social Sciences | 388 | 7.5% |
| Engineering | 267 | 5.2% |
| Multidisciplinary Studies | 43 | 0.8% |
| Science & Technology | 516 | 10.0% |
| Business | 1,030 | 20.0% |
| Education | 444 | 8.6% |
| Literature & Languages | 297 | 5.8% |
| Liberal Arts & History | 222 | 4.3% |
| Visual & Performing Arts | 152 | 2.9% |
| Communications | 424 | 8.2% |
| Arts & Humanities | 354 | 6.9% |
| Total | 5,145 | 100.0% |
Transportation & Commute in Hudson
Vehicle Availability by Sex in Hudson
The most prevalent vehicle ownership categories in Hudson are males with 2 vehicles (2,418, accounting for 55.0%) and females with 2 vehicles (1,850, making up 63.4%).
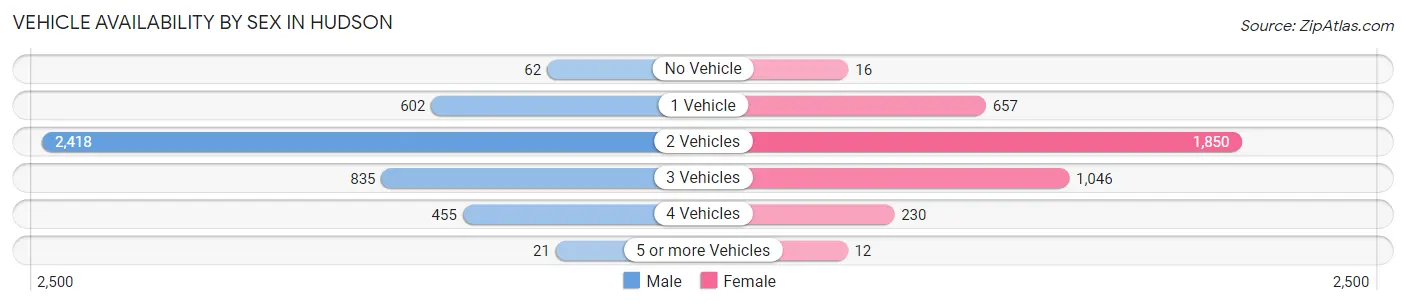
| Vehicles Available | Male | Female |
| No Vehicle | 62 (1.4%) | 16 (0.4%) |
| 1 Vehicle | 602 (13.7%) | 657 (17.2%) |
| 2 Vehicles | 2,418 (55.0%) | 1,850 (48.5%) |
| 3 Vehicles | 835 (19.0%) | 1,046 (27.5%) |
| 4 Vehicles | 455 (10.4%) | 230 (6.0%) |
| 5 or more Vehicles | 21 (0.5%) | 12 (0.3%) |
| Total | 4,393 (100.0%) | 3,811 (100.0%) |
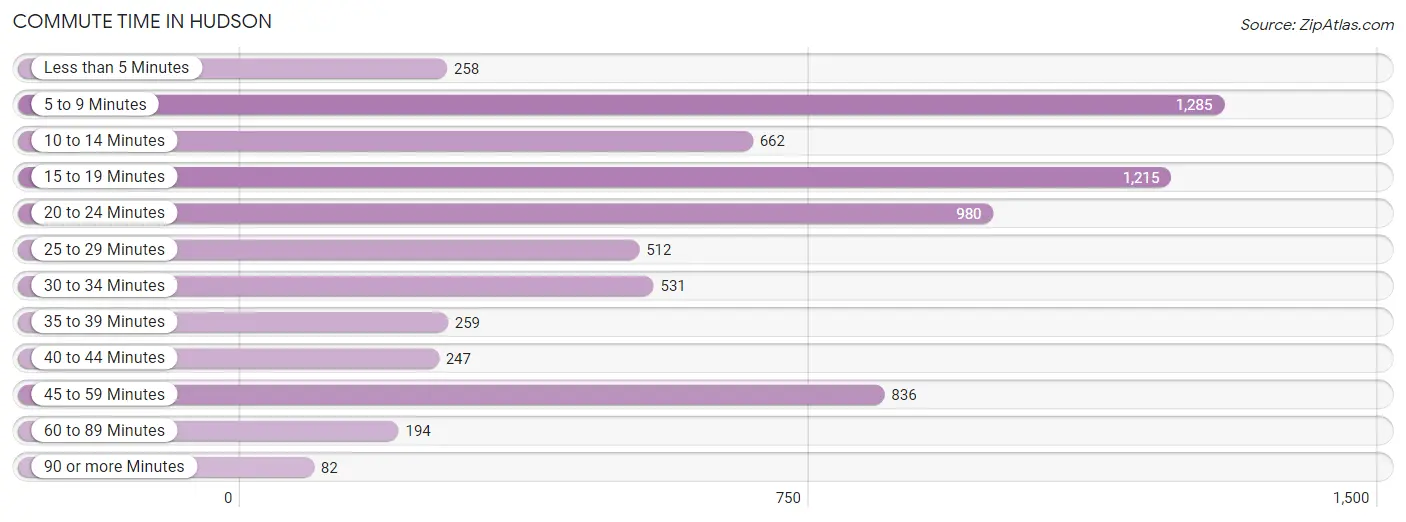
Commute Time in Hudson
The most frequently occuring commute durations in Hudson are 5 to 9 minutes (1,285 commuters, 18.2%), 15 to 19 minutes (1,215 commuters, 17.2%), and 20 to 24 minutes (980 commuters, 13.9%).
| Commute Time | # Commuters | % Commuters |
| Less than 5 Minutes | 258 | 3.6% |
| 5 to 9 Minutes | 1,285 | 18.2% |
| 10 to 14 Minutes | 662 | 9.4% |
| 15 to 19 Minutes | 1,215 | 17.2% |
| 20 to 24 Minutes | 980 | 13.9% |
| 25 to 29 Minutes | 512 | 7.2% |
| 30 to 34 Minutes | 531 | 7.5% |
| 35 to 39 Minutes | 259 | 3.7% |
| 40 to 44 Minutes | 247 | 3.5% |
| 45 to 59 Minutes | 836 | 11.8% |
| 60 to 89 Minutes | 194 | 2.8% |
| 90 or more Minutes | 82 | 1.2% |
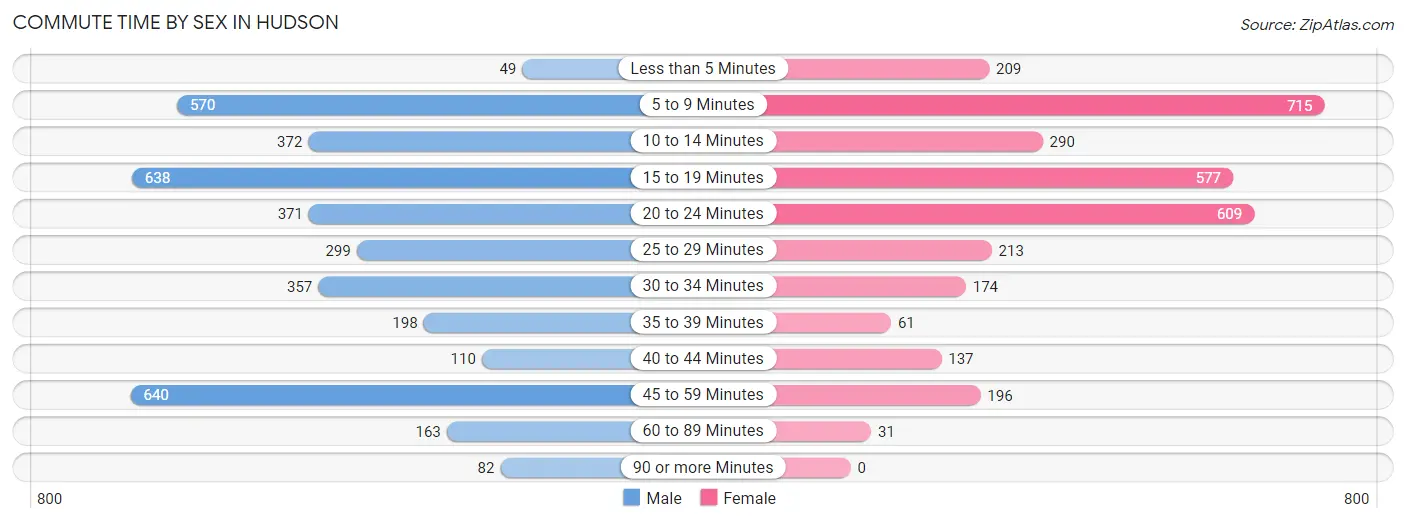
Commute Time by Sex in Hudson
The most common commute times in Hudson are 45 to 59 minutes (640 commuters, 16.6%) for males and 5 to 9 minutes (715 commuters, 22.3%) for females.
| Commute Time | Male | Female |
| Less than 5 Minutes | 49 (1.3%) | 209 (6.5%) |
| 5 to 9 Minutes | 570 (14.8%) | 715 (22.3%) |
| 10 to 14 Minutes | 372 (9.7%) | 290 (9.0%) |
| 15 to 19 Minutes | 638 (16.6%) | 577 (18.0%) |
| 20 to 24 Minutes | 371 (9.6%) | 609 (19.0%) |
| 25 to 29 Minutes | 299 (7.8%) | 213 (6.6%) |
| 30 to 34 Minutes | 357 (9.3%) | 174 (5.4%) |
| 35 to 39 Minutes | 198 (5.1%) | 61 (1.9%) |
| 40 to 44 Minutes | 110 (2.9%) | 137 (4.3%) |
| 45 to 59 Minutes | 640 (16.6%) | 196 (6.1%) |
| 60 to 89 Minutes | 163 (4.2%) | 31 (1.0%) |
| 90 or more Minutes | 82 (2.1%) | 0 (0.0%) |
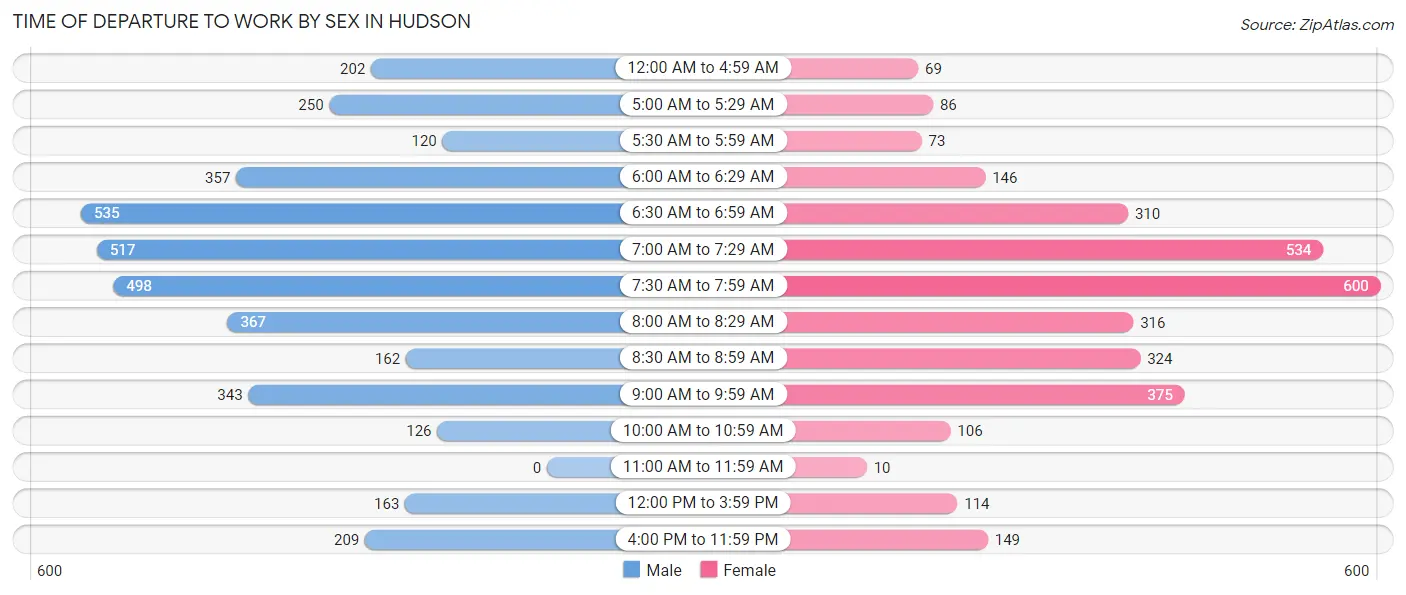
Time of Departure to Work by Sex in Hudson
The most frequent times of departure to work in Hudson are 6:30 AM to 6:59 AM (535, 13.9%) for males and 7:30 AM to 7:59 AM (600, 18.7%) for females.
| Time of Departure | Male | Female |
| 12:00 AM to 4:59 AM | 202 (5.2%) | 69 (2.1%) |
| 5:00 AM to 5:29 AM | 250 (6.5%) | 86 (2.7%) |
| 5:30 AM to 5:59 AM | 120 (3.1%) | 73 (2.3%) |
| 6:00 AM to 6:29 AM | 357 (9.3%) | 146 (4.5%) |
| 6:30 AM to 6:59 AM | 535 (13.9%) | 310 (9.7%) |
| 7:00 AM to 7:29 AM | 517 (13.4%) | 534 (16.6%) |
| 7:30 AM to 7:59 AM | 498 (12.9%) | 600 (18.7%) |
| 8:00 AM to 8:29 AM | 367 (9.5%) | 316 (9.8%) |
| 8:30 AM to 8:59 AM | 162 (4.2%) | 324 (10.1%) |
| 9:00 AM to 9:59 AM | 343 (8.9%) | 375 (11.7%) |
| 10:00 AM to 10:59 AM | 126 (3.3%) | 106 (3.3%) |
| 11:00 AM to 11:59 AM | 0 (0.0%) | 10 (0.3%) |
| 12:00 PM to 3:59 PM | 163 (4.2%) | 114 (3.5%) |
| 4:00 PM to 11:59 PM | 209 (5.4%) | 149 (4.6%) |
| Total | 3,849 (100.0%) | 3,212 (100.0%) |
Housing Occupancy in Hudson
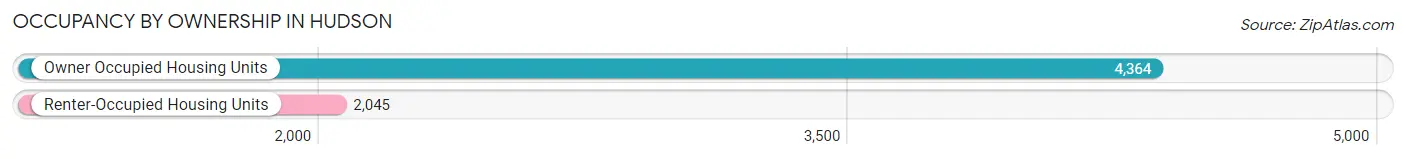
Occupancy by Ownership in Hudson
Of the total 6,409 dwellings in Hudson, owner-occupied units account for 4,364 (68.1%), while renter-occupied units make up 2,045 (31.9%).
| Occupancy | # Housing Units | % Housing Units |
| Owner Occupied Housing Units | 4,364 | 68.1% |
| Renter-Occupied Housing Units | 2,045 | 31.9% |
| Total Occupied Housing Units | 6,409 | 100.0% |
Occupancy by Household Size in Hudson
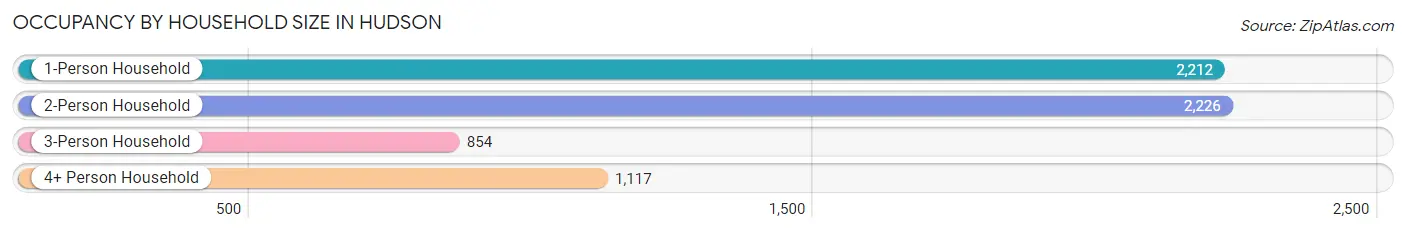
| Household Size | # Housing Units | % Housing Units |
| 1-Person Household | 2,212 | 34.5% |
| 2-Person Household | 2,226 | 34.7% |
| 3-Person Household | 854 | 13.3% |
| 4+ Person Household | 1,117 | 17.4% |
| Total Housing Units | 6,409 | 100.0% |
Occupancy by Ownership by Household Size in Hudson
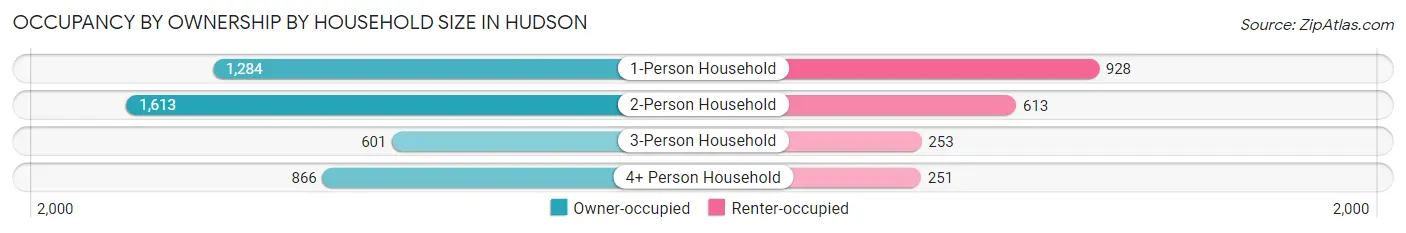
| Household Size | Owner-occupied | Renter-occupied |
| 1-Person Household | 1,284 (58.1%) | 928 (41.9%) |
| 2-Person Household | 1,613 (72.5%) | 613 (27.5%) |
| 3-Person Household | 601 (70.4%) | 253 (29.6%) |
| 4+ Person Household | 866 (77.5%) | 251 (22.5%) |
| Total Housing Units | 4,364 (68.1%) | 2,045 (31.9%) |
Occupancy by Educational Attainment in Hudson
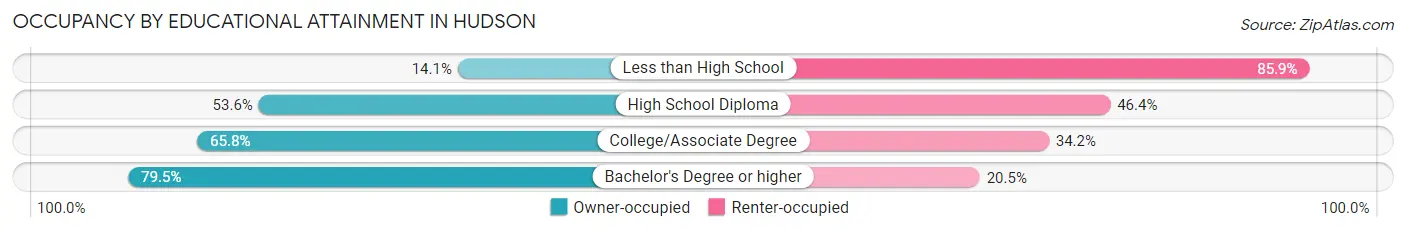
| Household Size | Owner-occupied | Renter-occupied |
| Less than High School | 25 (14.1%) | 152 (85.9%) |
| High School Diploma | 694 (53.6%) | 601 (46.4%) |
| College/Associate Degree | 1,338 (65.8%) | 696 (34.2%) |
| Bachelor's Degree or higher | 2,307 (79.5%) | 596 (20.5%) |
Occupancy by Age of Householder in Hudson
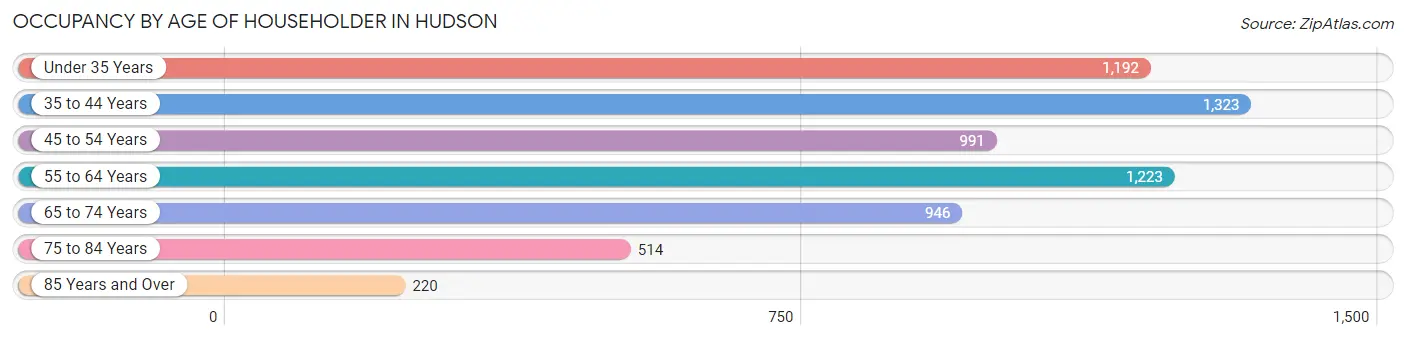
| Age Bracket | # Households | % Households |
| Under 35 Years | 1,192 | 18.6% |
| 35 to 44 Years | 1,323 | 20.6% |
| 45 to 54 Years | 991 | 15.5% |
| 55 to 64 Years | 1,223 | 19.1% |
| 65 to 74 Years | 946 | 14.8% |
| 75 to 84 Years | 514 | 8.0% |
| 85 Years and Over | 220 | 3.4% |
| Total | 6,409 | 100.0% |
Housing Finances in Hudson
Median Income by Occupancy in Hudson
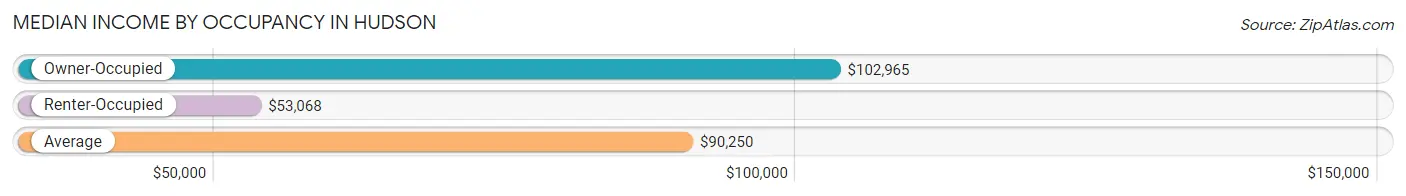
| Occupancy Type | # Households | Median Income |
| Owner-Occupied | 4,364 (68.1%) | $102,965 |
| Renter-Occupied | 2,045 (31.9%) | $53,068 |
| Average | 6,409 (100.0%) | $90,250 |
Occupancy by Householder Income Bracket in Hudson
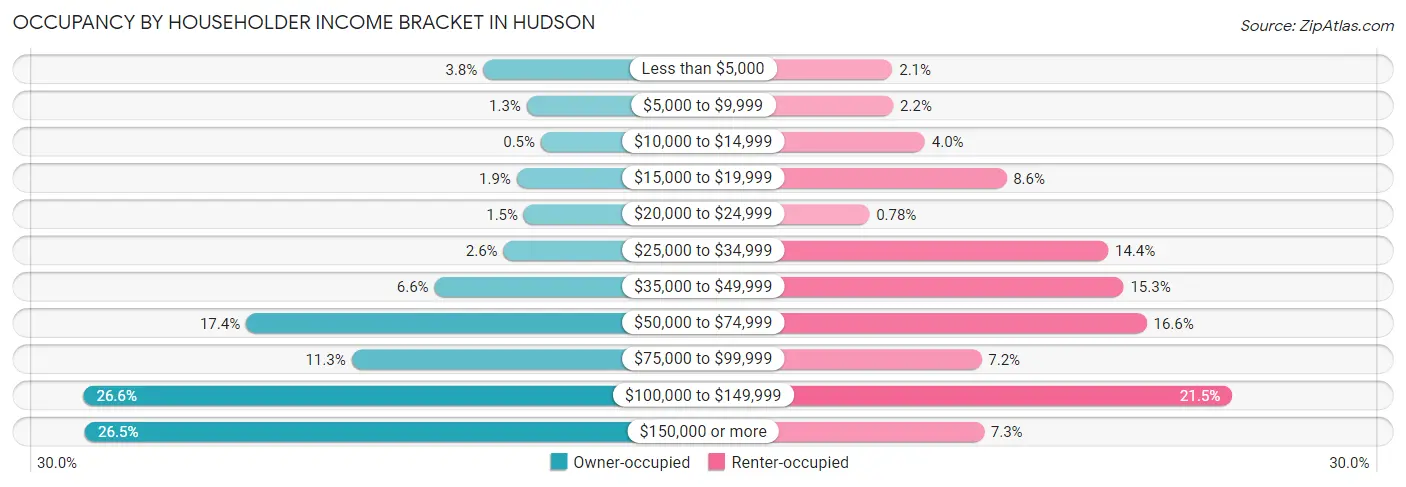
| Income Bracket | Owner-occupied | Renter-occupied |
| Less than $5,000 | 166 (3.8%) | 43 (2.1%) |
| $5,000 to $9,999 | 57 (1.3%) | 44 (2.1%) |
| $10,000 to $14,999 | 22 (0.5%) | 81 (4.0%) |
| $15,000 to $19,999 | 82 (1.9%) | 176 (8.6%) |
| $20,000 to $24,999 | 64 (1.5%) | 16 (0.8%) |
| $25,000 to $34,999 | 115 (2.6%) | 295 (14.4%) |
| $35,000 to $49,999 | 287 (6.6%) | 313 (15.3%) |
| $50,000 to $74,999 | 757 (17.3%) | 340 (16.6%) |
| $75,000 to $99,999 | 494 (11.3%) | 147 (7.2%) |
| $100,000 to $149,999 | 1,162 (26.6%) | 440 (21.5%) |
| $150,000 or more | 1,158 (26.5%) | 150 (7.3%) |
| Total | 4,364 (100.0%) | 2,045 (100.0%) |
Monthly Housing Cost Tiers in Hudson
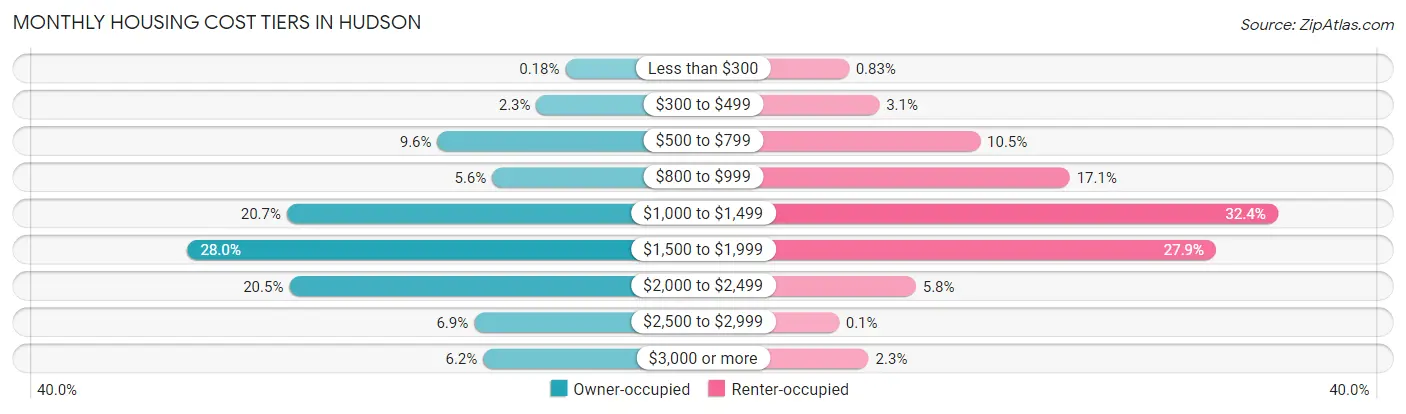
| Monthly Cost | Owner-occupied | Renter-occupied |
| Less than $300 | 8 (0.2%) | 17 (0.8%) |
| $300 to $499 | 101 (2.3%) | 63 (3.1%) |
| $500 to $799 | 419 (9.6%) | 215 (10.5%) |
| $800 to $999 | 243 (5.6%) | 350 (17.1%) |
| $1,000 to $1,499 | 903 (20.7%) | 663 (32.4%) |
| $1,500 to $1,999 | 1,222 (28.0%) | 570 (27.9%) |
| $2,000 to $2,499 | 895 (20.5%) | 118 (5.8%) |
| $2,500 to $2,999 | 301 (6.9%) | 2 (0.1%) |
| $3,000 or more | 272 (6.2%) | 47 (2.3%) |
| Total | 4,364 (100.0%) | 2,045 (100.0%) |
Physical Housing Characteristics in Hudson
Housing Structures in Hudson

| Structure Type | # Housing Units | % Housing Units |
| Single Unit, Detached | 2,973 | 46.4% |
| Single Unit, Attached | 1,689 | 26.4% |
| 2 Unit Apartments | 244 | 3.8% |
| 3 or 4 Unit Apartments | 189 | 2.9% |
| 5 to 9 Unit Apartments | 266 | 4.2% |
| 10 or more Apartments | 1,048 | 16.4% |
| Mobile Home / Other | 0 | 0.0% |
| Total | 6,409 | 100.0% |
Housing Structures by Occupancy in Hudson
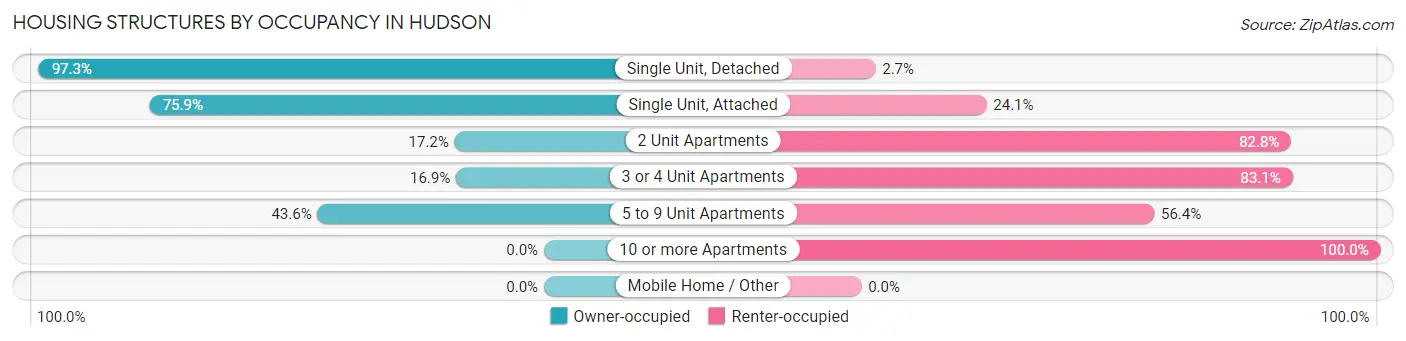
| Structure Type | Owner-occupied | Renter-occupied |
| Single Unit, Detached | 2,892 (97.3%) | 81 (2.7%) |
| Single Unit, Attached | 1,282 (75.9%) | 407 (24.1%) |
| 2 Unit Apartments | 42 (17.2%) | 202 (82.8%) |
| 3 or 4 Unit Apartments | 32 (16.9%) | 157 (83.1%) |
| 5 to 9 Unit Apartments | 116 (43.6%) | 150 (56.4%) |
| 10 or more Apartments | 0 (0.0%) | 1,048 (100.0%) |
| Mobile Home / Other | 0 (0.0%) | 0 (0.0%) |
| Total | 4,364 (68.1%) | 2,045 (31.9%) |
Housing Structures by Number of Rooms in Hudson
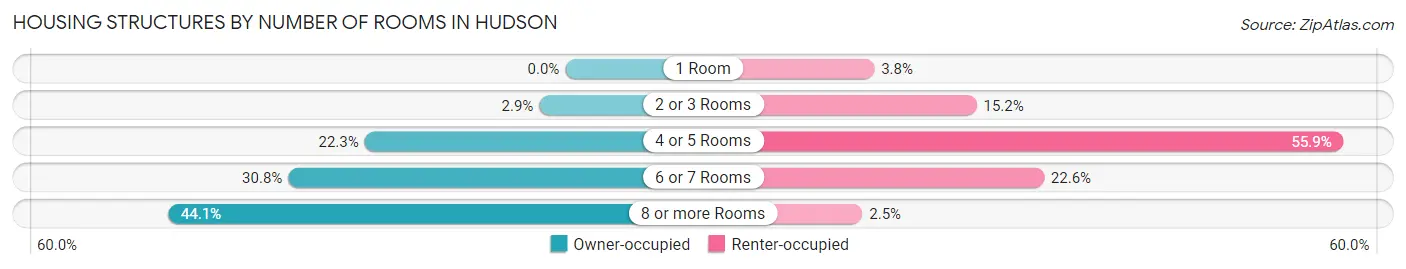
| Number of Rooms | Owner-occupied | Renter-occupied |
| 1 Room | 0 (0.0%) | 78 (3.8%) |
| 2 or 3 Rooms | 126 (2.9%) | 310 (15.2%) |
| 4 or 5 Rooms | 972 (22.3%) | 1,143 (55.9%) |
| 6 or 7 Rooms | 1,342 (30.7%) | 463 (22.6%) |
| 8 or more Rooms | 1,924 (44.1%) | 51 (2.5%) |
| Total | 4,364 (100.0%) | 2,045 (100.0%) |
Housing Structure by Heating Type in Hudson
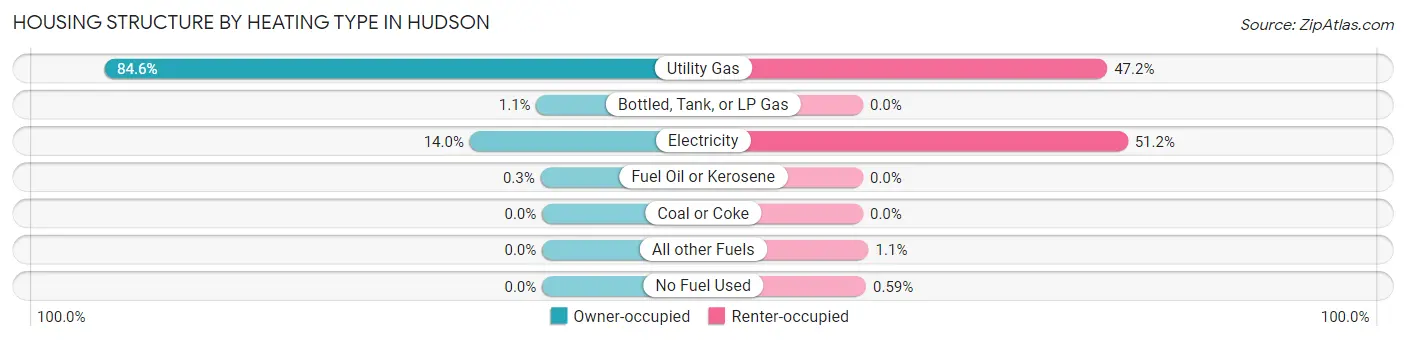
| Heating Type | Owner-occupied | Renter-occupied |
| Utility Gas | 3,693 (84.6%) | 965 (47.2%) |
| Bottled, Tank, or LP Gas | 48 (1.1%) | 0 (0.0%) |
| Electricity | 610 (14.0%) | 1,046 (51.1%) |
| Fuel Oil or Kerosene | 13 (0.3%) | 0 (0.0%) |
| Coal or Coke | 0 (0.0%) | 0 (0.0%) |
| All other Fuels | 0 (0.0%) | 22 (1.1%) |
| No Fuel Used | 0 (0.0%) | 12 (0.6%) |
| Total | 4,364 (100.0%) | 2,045 (100.0%) |
Household Vehicle Usage in Hudson
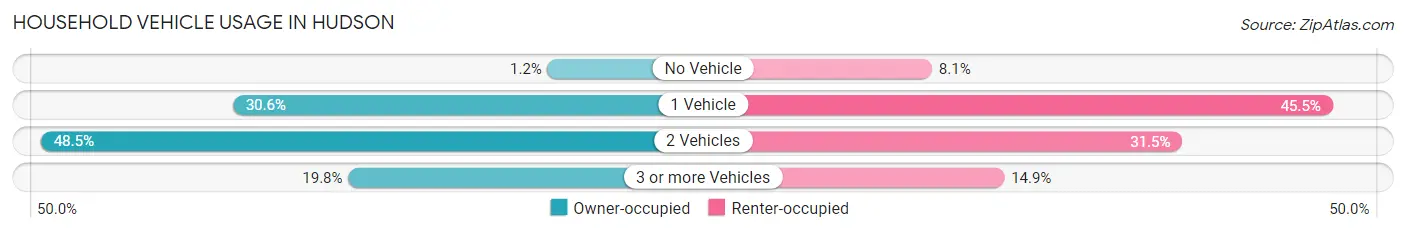
| Vehicles per Household | Owner-occupied | Renter-occupied |
| No Vehicle | 51 (1.2%) | 166 (8.1%) |
| 1 Vehicle | 1,334 (30.6%) | 931 (45.5%) |
| 2 Vehicles | 2,116 (48.5%) | 644 (31.5%) |
| 3 or more Vehicles | 863 (19.8%) | 304 (14.9%) |
| Total | 4,364 (100.0%) | 2,045 (100.0%) |
Real Estate & Mortgages in Hudson
Real Estate and Mortgage Overview in Hudson
| Characteristic | Without Mortgage | With Mortgage |
| Housing Units | 883 | 3,481 |
| Median Property Value | $350,000 | $315,000 |
| Median Household Income | $69,571 | $965 |
| Monthly Housing Costs | $772 | $272 |
| Real Estate Taxes | $5,409 | $17 |
Property Value by Mortgage Status in Hudson
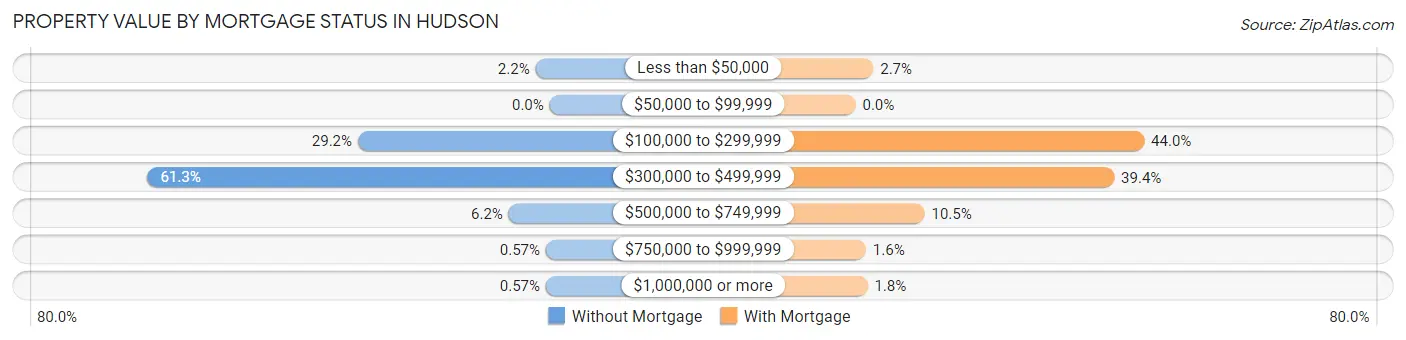
| Property Value | Without Mortgage | With Mortgage |
| Less than $50,000 | 19 (2.1%) | 94 (2.7%) |
| $50,000 to $99,999 | 0 (0.0%) | 0 (0.0%) |
| $100,000 to $299,999 | 258 (29.2%) | 1,531 (44.0%) |
| $300,000 to $499,999 | 541 (61.3%) | 1,372 (39.4%) |
| $500,000 to $749,999 | 55 (6.2%) | 366 (10.5%) |
| $750,000 to $999,999 | 5 (0.6%) | 55 (1.6%) |
| $1,000,000 or more | 5 (0.6%) | 63 (1.8%) |
| Total | 883 (100.0%) | 3,481 (100.0%) |
Household Income by Mortgage Status in Hudson
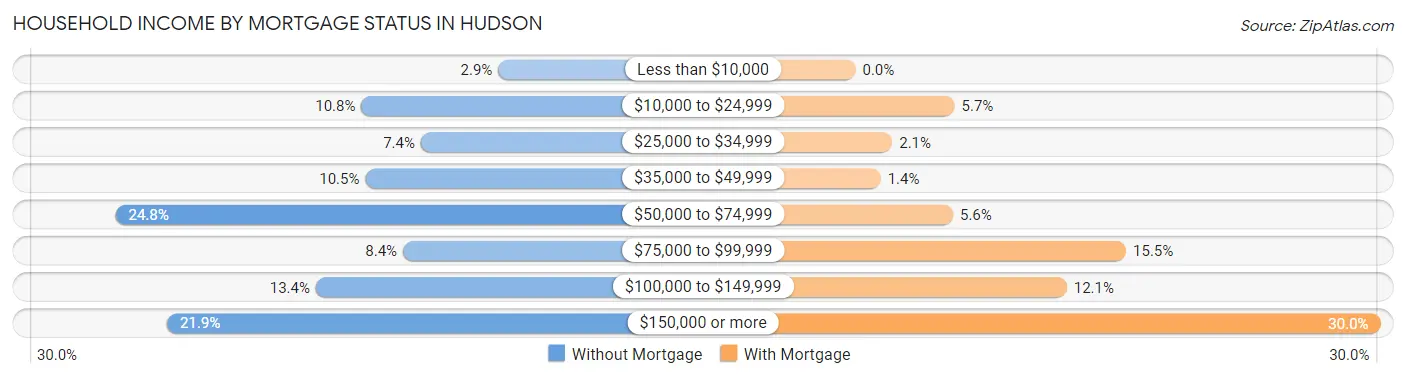
| Household Income | Without Mortgage | With Mortgage |
| Less than $10,000 | 26 (2.9%) | 0 (0.0%) |
| $10,000 to $24,999 | 95 (10.8%) | 197 (5.7%) |
| $25,000 to $34,999 | 65 (7.4%) | 73 (2.1%) |
| $35,000 to $49,999 | 93 (10.5%) | 50 (1.4%) |
| $50,000 to $74,999 | 219 (24.8%) | 194 (5.6%) |
| $75,000 to $99,999 | 74 (8.4%) | 538 (15.5%) |
| $100,000 to $149,999 | 118 (13.4%) | 420 (12.1%) |
| $150,000 or more | 193 (21.9%) | 1,044 (30.0%) |
| Total | 883 (100.0%) | 3,481 (100.0%) |
Property Value to Household Income Ratio in Hudson
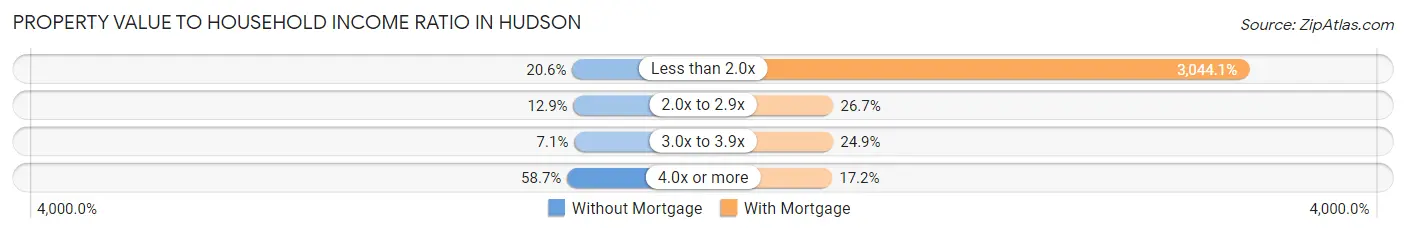
| Value-to-Income Ratio | Without Mortgage | With Mortgage |
| Less than 2.0x | 182 (20.6%) | 105,966 (3,044.1%) |
| 2.0x to 2.9x | 114 (12.9%) | 928 (26.7%) |
| 3.0x to 3.9x | 63 (7.1%) | 865 (24.8%) |
| 4.0x or more | 518 (58.7%) | 599 (17.2%) |
| Total | 883 (100.0%) | 3,481 (100.0%) |
Real Estate Taxes by Mortgage Status in Hudson
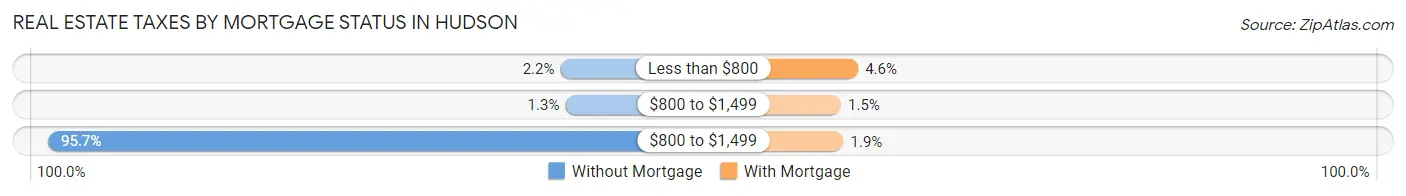
| Property Taxes | Without Mortgage | With Mortgage |
| Less than $800 | 19 (2.1%) | 160 (4.6%) |
| $800 to $1,499 | 11 (1.3%) | 51 (1.5%) |
| $800 to $1,499 | 845 (95.7%) | 67 (1.9%) |
| Total | 883 (100.0%) | 3,481 (100.0%) |
Health & Disability in Hudson
Health Insurance Coverage by Age in Hudson
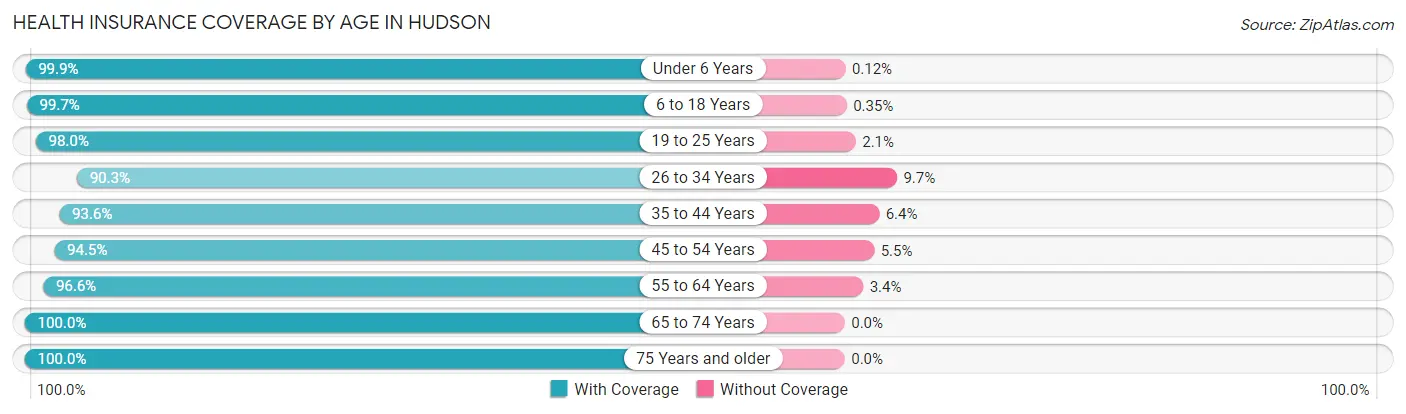
| Age Bracket | With Coverage | Without Coverage |
| Under 6 Years | 837 (99.9%) | 1 (0.1%) |
| 6 to 18 Years | 2,261 (99.7%) | 8 (0.4%) |
| 19 to 25 Years | 1,145 (98.0%) | 24 (2.1%) |
| 26 to 34 Years | 1,670 (90.3%) | 180 (9.7%) |
| 35 to 44 Years | 2,243 (93.6%) | 154 (6.4%) |
| 45 to 54 Years | 1,617 (94.5%) | 94 (5.5%) |
| 55 to 64 Years | 1,748 (96.6%) | 62 (3.4%) |
| 65 to 74 Years | 1,438 (100.0%) | 0 (0.0%) |
| 75 Years and older | 1,065 (100.0%) | 0 (0.0%) |
| Total | 14,024 (96.4%) | 523 (3.6%) |
Health Insurance Coverage by Citizenship Status in Hudson
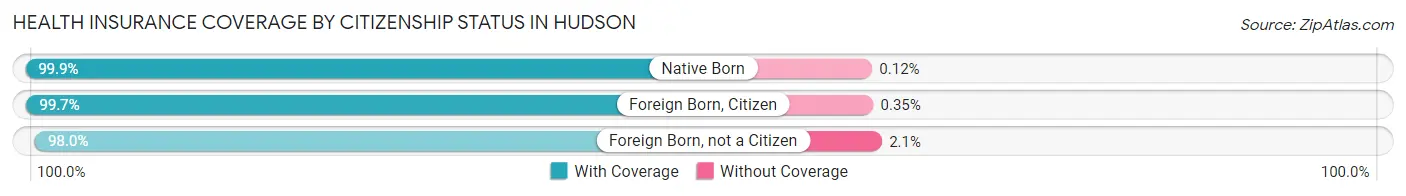
| Citizenship Status | With Coverage | Without Coverage |
| Native Born | 837 (99.9%) | 1 (0.1%) |
| Foreign Born, Citizen | 2,261 (99.7%) | 8 (0.4%) |
| Foreign Born, not a Citizen | 1,145 (98.0%) | 24 (2.1%) |
Health Insurance Coverage by Household Income in Hudson
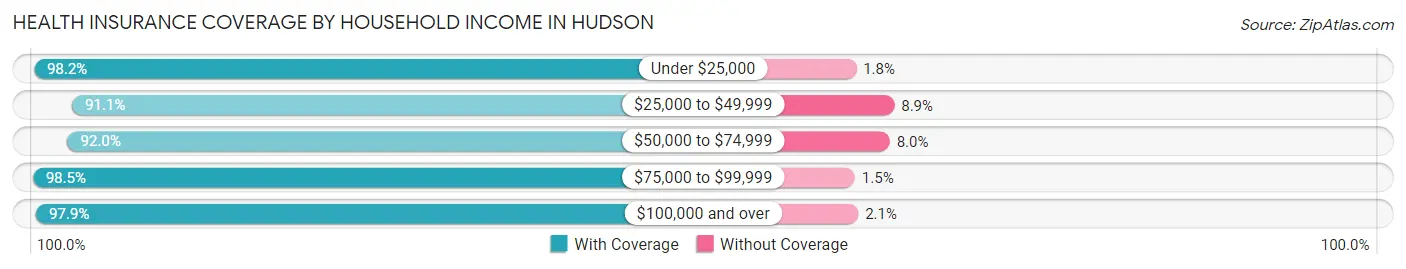
| Household Income | With Coverage | Without Coverage |
| Under $25,000 | 951 (98.2%) | 17 (1.8%) |
| $25,000 to $49,999 | 1,494 (91.1%) | 146 (8.9%) |
| $50,000 to $74,999 | 1,795 (92.0%) | 157 (8.0%) |
| $75,000 to $99,999 | 1,688 (98.5%) | 26 (1.5%) |
| $100,000 and over | 8,066 (97.9%) | 176 (2.1%) |
Public vs Private Health Insurance Coverage by Age in Hudson
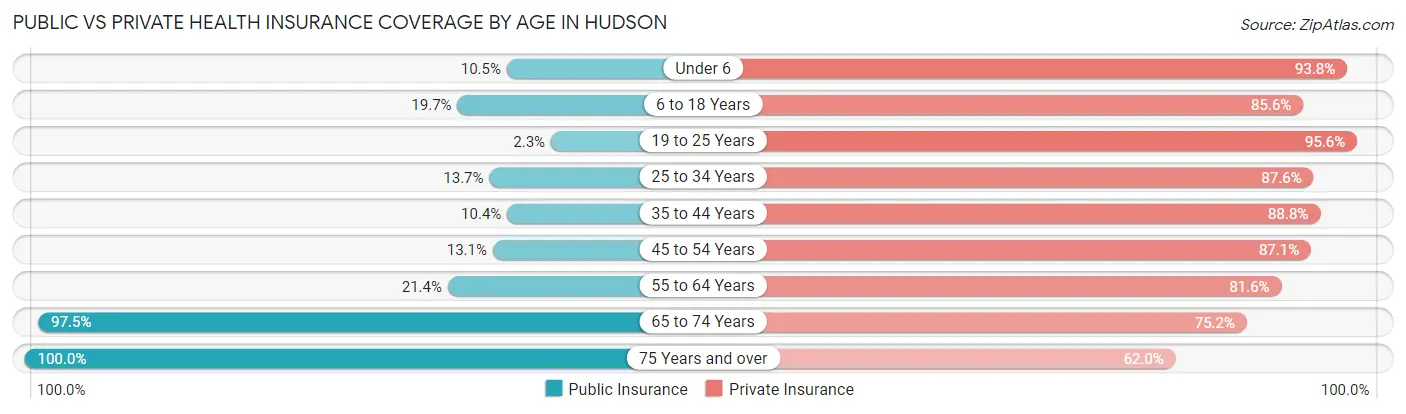
| Age Bracket | Public Insurance | Private Insurance |
| Under 6 | 88 (10.5%) | 786 (93.8%) |
| 6 to 18 Years | 446 (19.7%) | 1,943 (85.6%) |
| 19 to 25 Years | 27 (2.3%) | 1,118 (95.6%) |
| 25 to 34 Years | 254 (13.7%) | 1,620 (87.6%) |
| 35 to 44 Years | 250 (10.4%) | 2,128 (88.8%) |
| 45 to 54 Years | 224 (13.1%) | 1,490 (87.1%) |
| 55 to 64 Years | 388 (21.4%) | 1,477 (81.6%) |
| 65 to 74 Years | 1,402 (97.5%) | 1,081 (75.2%) |
| 75 Years and over | 1,065 (100.0%) | 660 (62.0%) |
| Total | 4,144 (28.5%) | 12,303 (84.6%) |
Disability Status by Sex by Age in Hudson
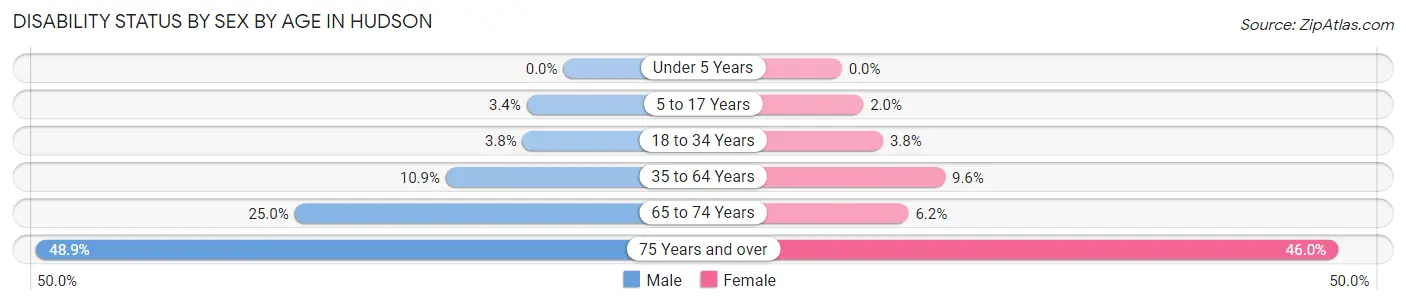
| Age Bracket | Male | Female |
| Under 5 Years | 0 (0.0%) | 0 (0.0%) |
| 5 to 17 Years | 40 (3.4%) | 22 (2.0%) |
| 18 to 34 Years | 62 (3.8%) | 58 (3.8%) |
| 35 to 64 Years | 329 (10.9%) | 278 (9.6%) |
| 65 to 74 Years | 133 (24.9%) | 56 (6.2%) |
| 75 Years and over | 200 (48.9%) | 302 (46.0%) |
Disability Class by Sex by Age in Hudson
Disability Class: Hearing Difficulty
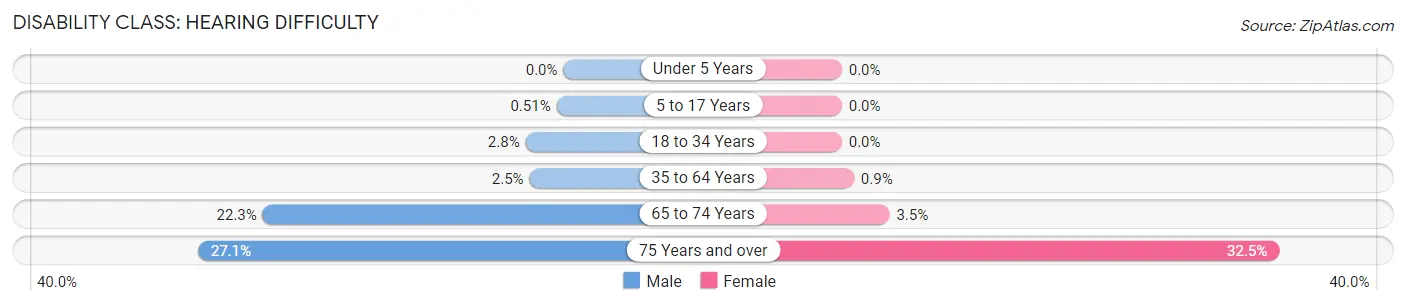
| Age Bracket | Male | Female |
| Under 5 Years | 0 (0.0%) | 0 (0.0%) |
| 5 to 17 Years | 6 (0.5%) | 0 (0.0%) |
| 18 to 34 Years | 46 (2.8%) | 0 (0.0%) |
| 35 to 64 Years | 76 (2.5%) | 26 (0.9%) |
| 65 to 74 Years | 119 (22.3%) | 32 (3.5%) |
| 75 Years and over | 111 (27.1%) | 213 (32.5%) |
Disability Class: Vision Difficulty
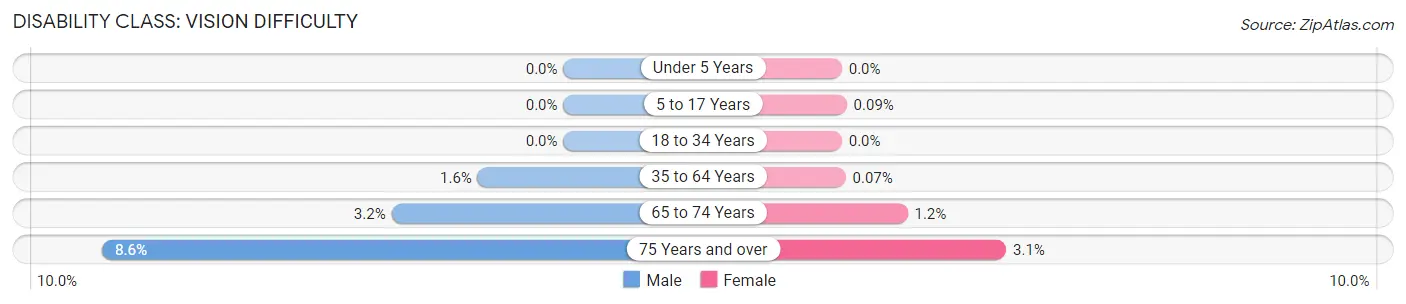
| Age Bracket | Male | Female |
| Under 5 Years | 0 (0.0%) | 0 (0.0%) |
| 5 to 17 Years | 0 (0.0%) | 1 (0.1%) |
| 18 to 34 Years | 0 (0.0%) | 0 (0.0%) |
| 35 to 64 Years | 48 (1.6%) | 2 (0.1%) |
| 65 to 74 Years | 17 (3.2%) | 11 (1.2%) |
| 75 Years and over | 35 (8.6%) | 20 (3.0%) |
Disability Class: Cognitive Difficulty
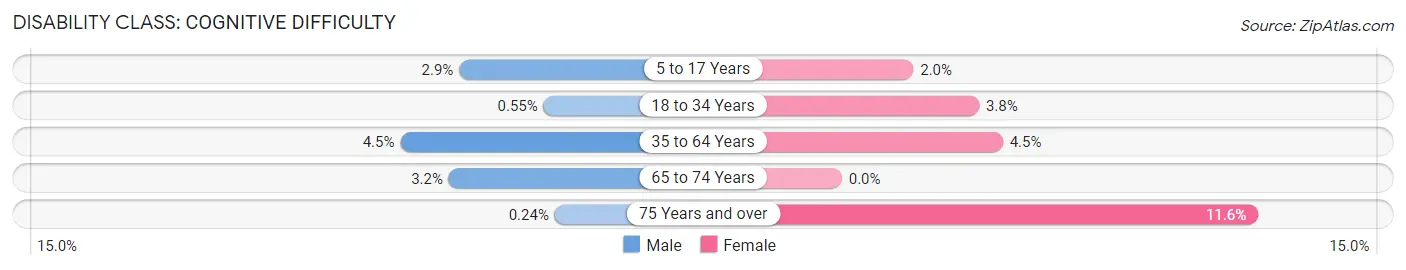
| Age Bracket | Male | Female |
| 5 to 17 Years | 34 (2.9%) | 22 (2.0%) |
| 18 to 34 Years | 9 (0.5%) | 58 (3.8%) |
| 35 to 64 Years | 137 (4.5%) | 130 (4.5%) |
| 65 to 74 Years | 17 (3.2%) | 0 (0.0%) |
| 75 Years and over | 1 (0.2%) | 76 (11.6%) |
Disability Class: Ambulatory Difficulty
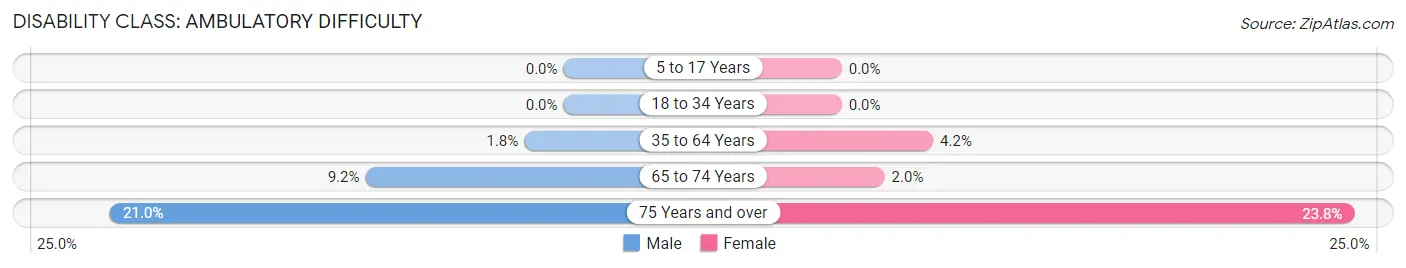
| Age Bracket | Male | Female |
| 5 to 17 Years | 0 (0.0%) | 0 (0.0%) |
| 18 to 34 Years | 0 (0.0%) | 0 (0.0%) |
| 35 to 64 Years | 55 (1.8%) | 123 (4.2%) |
| 65 to 74 Years | 49 (9.2%) | 18 (2.0%) |
| 75 Years and over | 86 (21.0%) | 156 (23.8%) |
Disability Class: Self-Care Difficulty
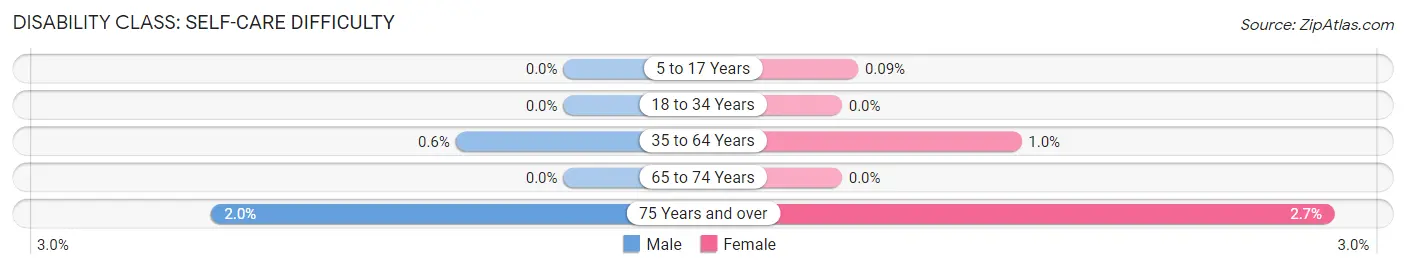
| Age Bracket | Male | Female |
| 5 to 17 Years | 0 (0.0%) | 1 (0.1%) |
| 18 to 34 Years | 0 (0.0%) | 0 (0.0%) |
| 35 to 64 Years | 18 (0.6%) | 29 (1.0%) |
| 65 to 74 Years | 0 (0.0%) | 0 (0.0%) |
| 75 Years and over | 8 (2.0%) | 18 (2.7%) |
Technology Access in Hudson
Computing Device Access in Hudson
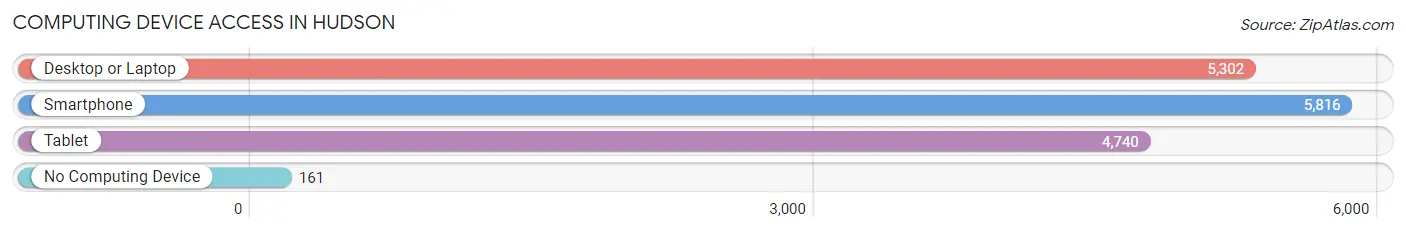
| Device Type | # Households | % Households |
| Desktop or Laptop | 5,302 | 82.7% |
| Smartphone | 5,816 | 90.7% |
| Tablet | 4,740 | 74.0% |
| No Computing Device | 161 | 2.5% |
| Total | 6,409 | 100.0% |
Internet Access in Hudson
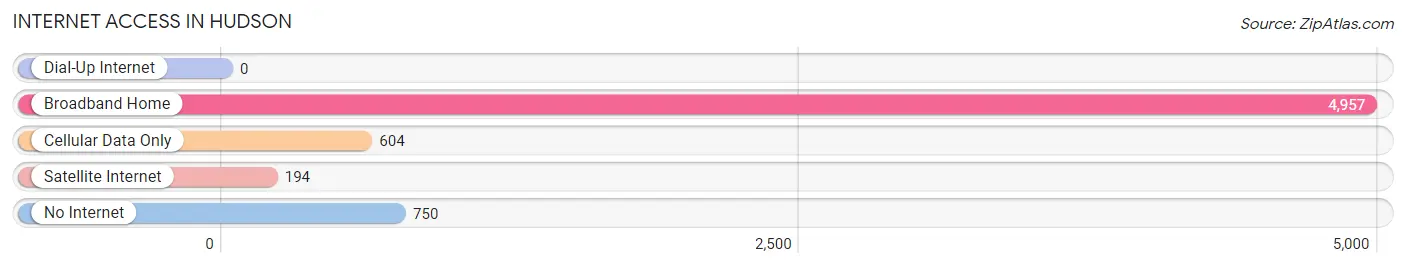
| Internet Type | # Households | % Households |
| Dial-Up Internet | 0 | 0.0% |
| Broadband Home | 4,957 | 77.3% |
| Cellular Data Only | 604 | 9.4% |
| Satellite Internet | 194 | 3.0% |
| No Internet | 750 | 11.7% |
| Total | 6,409 | 100.0% |
Hudson Summary
Hudson, Wisconsin is a city located in St. Croix County, Wisconsin, United States. It is situated along the St. Croix River, which forms the border between Wisconsin and Minnesota. The city is part of the Minneapolis-St. Paul metropolitan area and is located approximately 25 miles east of the Twin Cities. As of the 2010 census, the population of Hudson was 12,719.
History
Hudson was first settled in 1837 by settlers from New England. The city was named after the Hudson River in New York. The city was officially incorporated in 1854. During the late 19th century, Hudson was a major port on the St. Croix River, and the city was home to several lumber mills and other industries.
In the early 20th century, Hudson became a popular tourist destination, and the city was home to several resorts and hotels. The city also became a popular destination for wealthy Minneapolis and St. Paul residents, who built large summer homes along the St. Croix River.
Geography
Hudson is located at 44°59'N 92°45'W (44.983, -92.750). According to the United States Census Bureau, the city has a total area of 11.2 square miles (29.0 km2), of which 10.9 square miles (28.2 km2) is land and 0.3 square miles (0.8 km2) is water.
Economy
Hudson is home to several large employers, including the Hudson Hospital & Clinic, the Hudson School District, and the Hudson Area Chamber of Commerce. The city is also home to several small businesses, including restaurants, retail stores, and professional services.
Demographics
As of the 2010 census, there were 12,719 people, 5,093 households, and 3,323 families residing in the city. The population density was 1,167.2 people per square mile (450.2/km2). There were 5,541 housing units at an average density of 509.3 per square mile (196.7/km2). The racial makeup of the city was 94.2% White, 1.2% African American, 0.3% Native American, 1.7% Asian, 0.1% Pacific Islander, 1.2% from other races, and 1.4% from two or more races. Hispanic or Latino of any race were 3.2% of the population.
There were 5,093 households, out of which 32.2% had children under the age of 18 living with them, 51.2% were married couples living together, 10.2% had a female householder with no husband present, and 34.7% were non-families. 28.3% of all households were made up of individuals, and 11.2% had someone living alone who was 65 years of age or older. The average household size was 2.45 and the average family size was 3.02.
In the city, the population was spread out, with 25.2% under the age of 18, 7.2% from 18 to 24, 28.7% from 25 to 44, 24.2% from 45 to 64, and 14.7% who were 65 years of age or older. The median age was 38 years. For every 100 females, there were 93.2 males. For every 100 females age 18 and over, there were 90.2 males.
The median income for a household in the city was $50,945, and the median income for a family was $62,917. Males had a median income of $41,945 versus $30,917 for females. The per capita income for the city was $25,845. About 4.2% of families and 6.2% of the population were below the poverty line, including 8.2% of those under age 18 and 5.2% of those age 65 or over.
Common Questions
What is Per Capita Income in Hudson?
Per Capita income in Hudson is $46,181.
What is the Median Family Income in Hudson?
Median Family Income in Hudson is $109,375.
What is the Median Household income in Hudson?
Median Household Income in Hudson is $90,250.
What is Income or Wage Gap in Hudson?
Income or Wage Gap in Hudson is 23.9%.
Women in Hudson earn 76.1 cents for every dollar earned by a man.
What is Inequality or Gini Index in Hudson?
Inequality or Gini Index in Hudson is 0.41.
What is the Total Population of Hudson?
Total Population of Hudson is 14,763.
What is the Total Male Population of Hudson?
Total Male Population of Hudson is 7,231.
What is the Total Female Population of Hudson?
Total Female Population of Hudson is 7,532.
What is the Ratio of Males per 100 Females in Hudson?
There are 96.00 Males per 100 Females in Hudson.
What is the Ratio of Females per 100 Males in Hudson?
There are 104.16 Females per 100 Males in Hudson.
What is the Median Population Age in Hudson?
Median Population Age in Hudson is 39.8 Years.
What is the Average Family Size in Hudson
Average Family Size in Hudson is 3.0 People.
What is the Average Household Size in Hudson
Average Household Size in Hudson is 2.3 People.
How Large is the Labor Force in Hudson?
There are 8,365 People in the Labor Forcein in Hudson.
What is the Percentage of People in the Labor Force in Hudson?
68.7% of People are in the Labor Force in Hudson.
What is the Unemployment Rate in Hudson?
Unemployment Rate in Hudson is 0.9%.