Sewickley borough, PA Map & Demographics
Sewickley borough Overview
$65,609
PER CAPITA INCOME
$142,250
AVG FAMILY INCOME
$77,454
AVG HOUSEHOLD INCOME
55.9%
WAGE / INCOME GAP [ % ]
44.1¢/ $1
WAGE / INCOME GAP [ $ ]
0.57
INEQUALITY / GINI INDEX
3,873
TOTAL POPULATION
1,808
MALE POPULATION
2,065
FEMALE POPULATION
87.55
MALES / 100 FEMALES
114.21
FEMALES / 100 MALES
39.5
MEDIAN AGE
3.0
AVG FAMILY SIZE
2.3
AVG HOUSEHOLD SIZE
2,056
LABOR FORCE [ PEOPLE ]
67.3%
PERCENT IN LABOR FORCE
7.4%
UNEMPLOYMENT RATE
Income in Sewickley borough
Income Overview in Sewickley borough
Per Capita Income in Sewickley borough is $65,609, while median incomes of families and households are $142,250 and $77,454 respectively.
| Characteristic | Number | Measure |
| Per Capita Income | 3,873 | $65,609 |
| Median Family Income | 1,002 | $142,250 |
| Mean Family Income | 1,002 | $200,567 |
| Median Household Income | 1,663 | $77,454 |
| Mean Household Income | 1,663 | $151,308 |
| Income Deficit | 1,002 | $0 |
| Wage / Income Gap (%) | 3,873 | 55.92% |
| Wage / Income Gap ($) | 3,873 | 44.08¢ per $1 |
| Gini / Inequality Index | 3,873 | 0.57 |
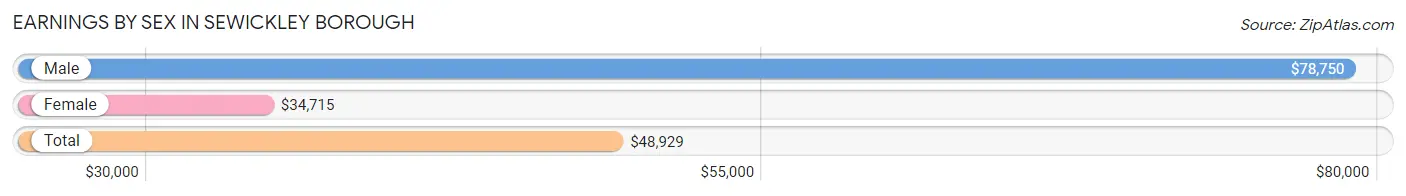
Earnings by Sex in Sewickley borough
Average Earnings in Sewickley borough are $48,929, $78,750 for men and $34,715 for women, a difference of 55.9%.
| Sex | Number | Average Earnings |
| Male | 993 (46.6%) | $78,750 |
| Female | 1,137 (53.4%) | $34,715 |
| Total | 2,130 (100.0%) | $48,929 |
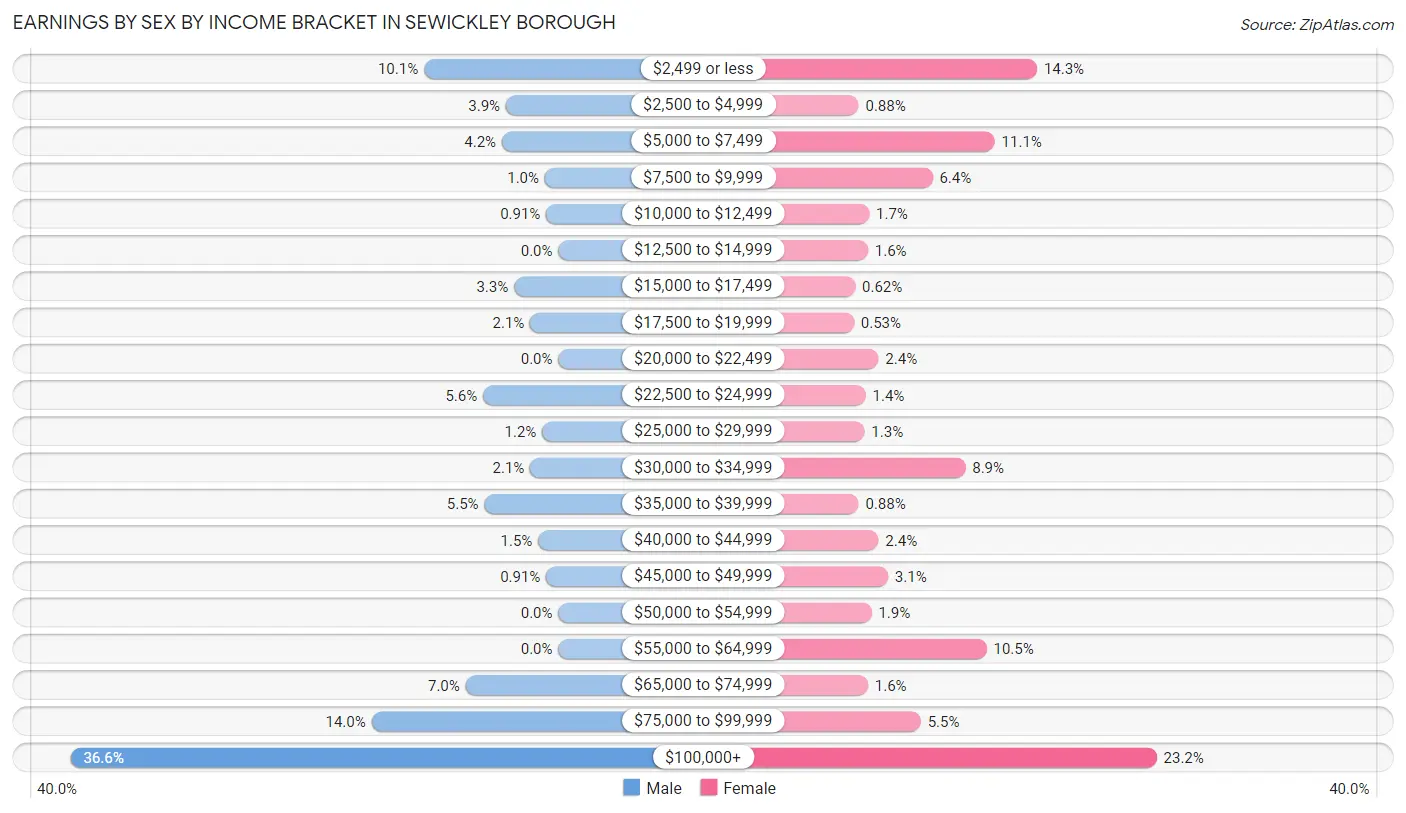
Earnings by Sex by Income Bracket in Sewickley borough
The most common earnings brackets in Sewickley borough are $100,000+ for men (363 | 36.6%) and $100,000+ for women (264 | 23.2%).
| Income | Male | Female |
| $2,499 or less | 100 (10.1%) | 162 (14.2%) |
| $2,500 to $4,999 | 39 (3.9%) | 10 (0.9%) |
| $5,000 to $7,499 | 42 (4.2%) | 126 (11.1%) |
| $7,500 to $9,999 | 10 (1.0%) | 73 (6.4%) |
| $10,000 to $12,499 | 9 (0.9%) | 19 (1.7%) |
| $12,500 to $14,999 | 0 (0.0%) | 18 (1.6%) |
| $15,000 to $17,499 | 33 (3.3%) | 7 (0.6%) |
| $17,500 to $19,999 | 21 (2.1%) | 6 (0.5%) |
| $20,000 to $22,499 | 0 (0.0%) | 27 (2.4%) |
| $22,500 to $24,999 | 56 (5.6%) | 16 (1.4%) |
| $25,000 to $29,999 | 12 (1.2%) | 15 (1.3%) |
| $30,000 to $34,999 | 21 (2.1%) | 101 (8.9%) |
| $35,000 to $39,999 | 55 (5.5%) | 10 (0.9%) |
| $40,000 to $44,999 | 15 (1.5%) | 27 (2.4%) |
| $45,000 to $49,999 | 9 (0.9%) | 35 (3.1%) |
| $50,000 to $54,999 | 0 (0.0%) | 21 (1.8%) |
| $55,000 to $64,999 | 0 (0.0%) | 119 (10.5%) |
| $65,000 to $74,999 | 69 (7.0%) | 18 (1.6%) |
| $75,000 to $99,999 | 139 (14.0%) | 63 (5.5%) |
| $100,000+ | 363 (36.6%) | 264 (23.2%) |
| Total | 993 (100.0%) | 1,137 (100.0%) |
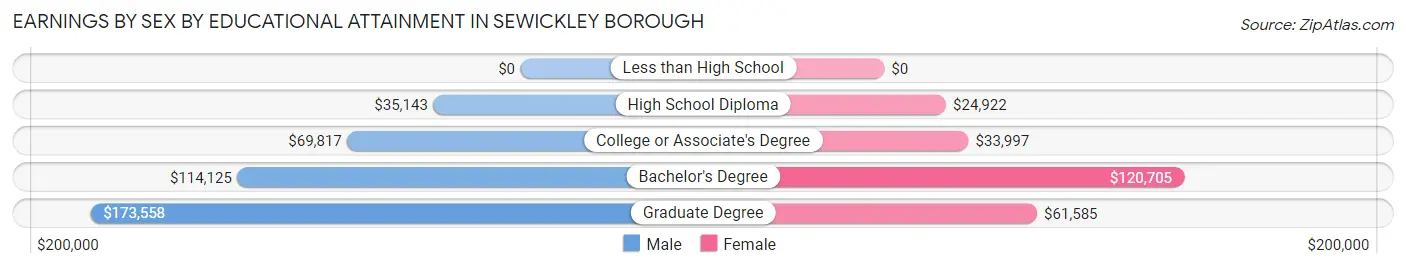
Earnings by Sex by Educational Attainment in Sewickley borough
Average earnings in Sewickley borough are $89,441 for men and $51,131 for women, a difference of 42.8%. Men with an educational attainment of graduate degree enjoy the highest average annual earnings of $173,558, while those with high school diploma education earn the least with $35,143. Women with an educational attainment of bachelor's degree earn the most with the average annual earnings of $120,705, while those with high school diploma education have the smallest earnings of $24,922.
| Educational Attainment | Male Income | Female Income |
| Less than High School | - | - |
| High School Diploma | $35,143 | $24,922 |
| College or Associate's Degree | $69,817 | $33,997 |
| Bachelor's Degree | $114,125 | $120,705 |
| Graduate Degree | $173,558 | $61,585 |
| Total | $89,441 | $51,131 |
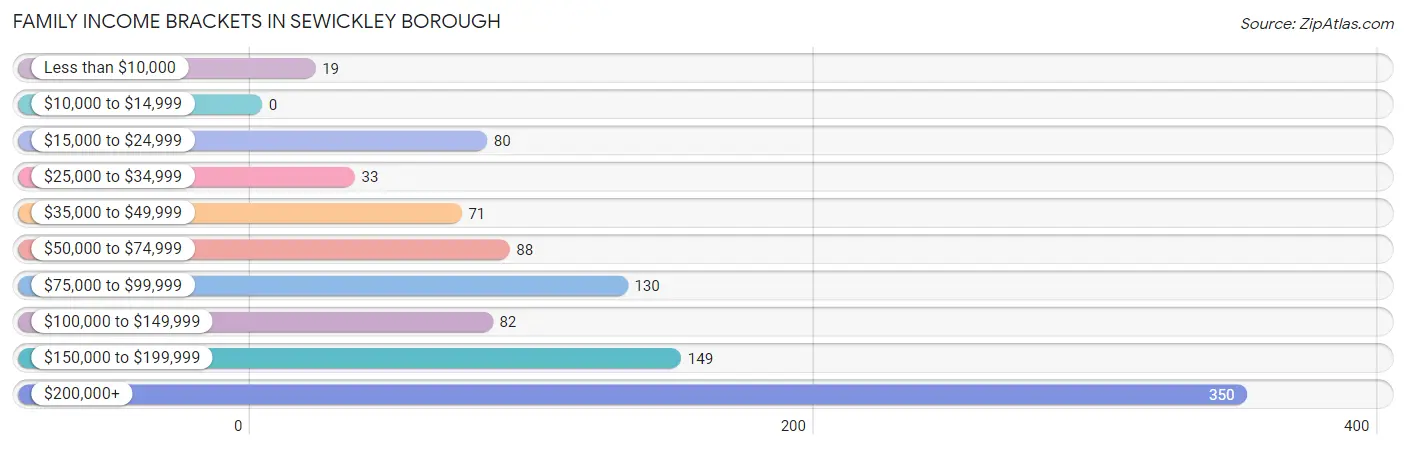
Family Income in Sewickley borough
Family Income Brackets in Sewickley borough
According to the Sewickley borough family income data, there are 350 families falling into the $200,000+ income range, which is the most common income bracket and makes up 34.9% of all families.
| Income Bracket | # Families | % Families |
| Less than $10,000 | 19 | 1.9% |
| $10,000 to $14,999 | 0 | 0.0% |
| $15,000 to $24,999 | 80 | 8.0% |
| $25,000 to $34,999 | 33 | 3.3% |
| $35,000 to $49,999 | 71 | 7.1% |
| $50,000 to $74,999 | 88 | 8.8% |
| $75,000 to $99,999 | 130 | 13.0% |
| $100,000 to $149,999 | 82 | 8.2% |
| $150,000 to $199,999 | 149 | 14.9% |
| $200,000+ | 350 | 34.9% |
Family Income by Famaliy Size in Sewickley borough
5-person families (88 | 8.8%) account for the highest median family income in Sewickley borough with $250,001 per family, while 3-person families (260 | 26.0%) have the highest median income of $52,677 per family member.
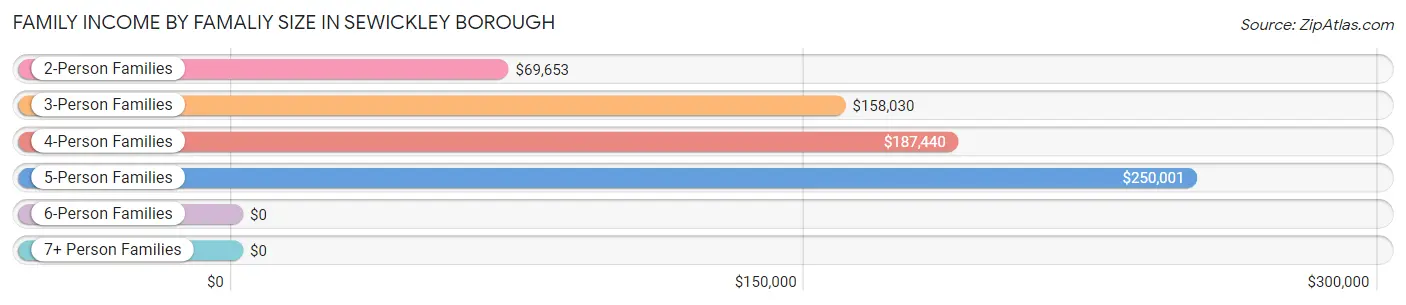
| Income Bracket | # Families | Median Income |
| 2-Person Families | 403 (40.2%) | $69,653 |
| 3-Person Families | 260 (26.0%) | $158,030 |
| 4-Person Families | 233 (23.3%) | $187,440 |
| 5-Person Families | 88 (8.8%) | $250,001 |
| 6-Person Families | 18 (1.8%) | $0 |
| 7+ Person Families | 0 (0.0%) | $0 |
| Total | 1,002 (100.0%) | $142,250 |
Family Income by Number of Earners in Sewickley borough
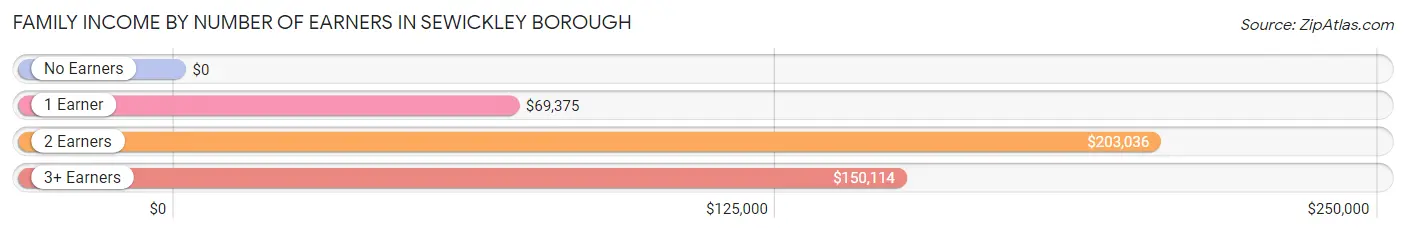
| Number of Earners | # Families | Median Income |
| No Earners | 109 (10.9%) | $0 |
| 1 Earner | 347 (34.6%) | $69,375 |
| 2 Earners | 377 (37.6%) | $203,036 |
| 3+ Earners | 169 (16.9%) | $150,114 |
| Total | 1,002 (100.0%) | $142,250 |
Household Income in Sewickley borough
Household Income Brackets in Sewickley borough
With 411 households falling in the category, the $200,000+ income range is the most frequent in Sewickley borough, accounting for 24.7% of all households. In contrast, only 27 households (1.6%) fall into the $10,000 to $14,999 income bracket, making it the least populous group.
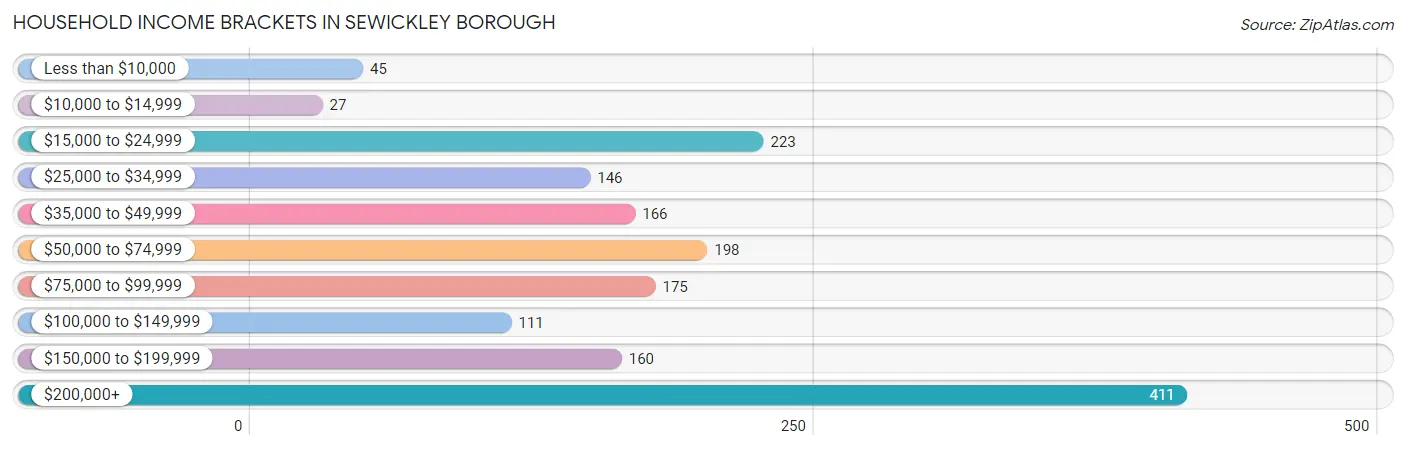
| Income Bracket | # Households | % Households |
| Less than $10,000 | 45 | 2.7% |
| $10,000 to $14,999 | 27 | 1.6% |
| $15,000 to $24,999 | 223 | 13.4% |
| $25,000 to $34,999 | 146 | 8.8% |
| $35,000 to $49,999 | 166 | 10.0% |
| $50,000 to $74,999 | 198 | 11.9% |
| $75,000 to $99,999 | 175 | 10.5% |
| $100,000 to $149,999 | 111 | 6.7% |
| $150,000 to $199,999 | 160 | 9.6% |
| $200,000+ | 411 | 24.7% |
Household Income by Householder Age in Sewickley borough
The median household income in Sewickley borough is $77,454, with the highest median household income of $92,414 found in the 45 to 64 years age bracket for the primary householder. A total of 607 households (36.5%) fall into this category. Meanwhile, the 25 to 44 years age bracket for the primary householder has the lowest median household income of $0, with 485 households (29.2%) in this group.
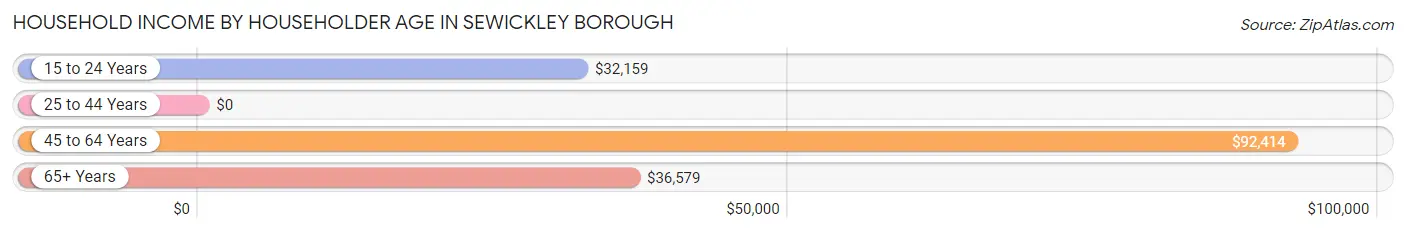
| Income Bracket | # Households | Median Income |
| 15 to 24 Years | 73 (4.4%) | $32,159 |
| 25 to 44 Years | 485 (29.2%) | $0 |
| 45 to 64 Years | 607 (36.5%) | $92,414 |
| 65+ Years | 498 (29.9%) | $36,579 |
| Total | 1,663 (100.0%) | $77,454 |
Poverty in Sewickley borough
Income Below Poverty by Sex and Age in Sewickley borough
With 4.5% poverty level for males and 14.3% for females among the residents of Sewickley borough, 18 to 24 year old males and 18 to 24 year old females are the most vulnerable to poverty, with 29 males (16.7%) and 115 females (68.0%) in their respective age groups living below the poverty level.
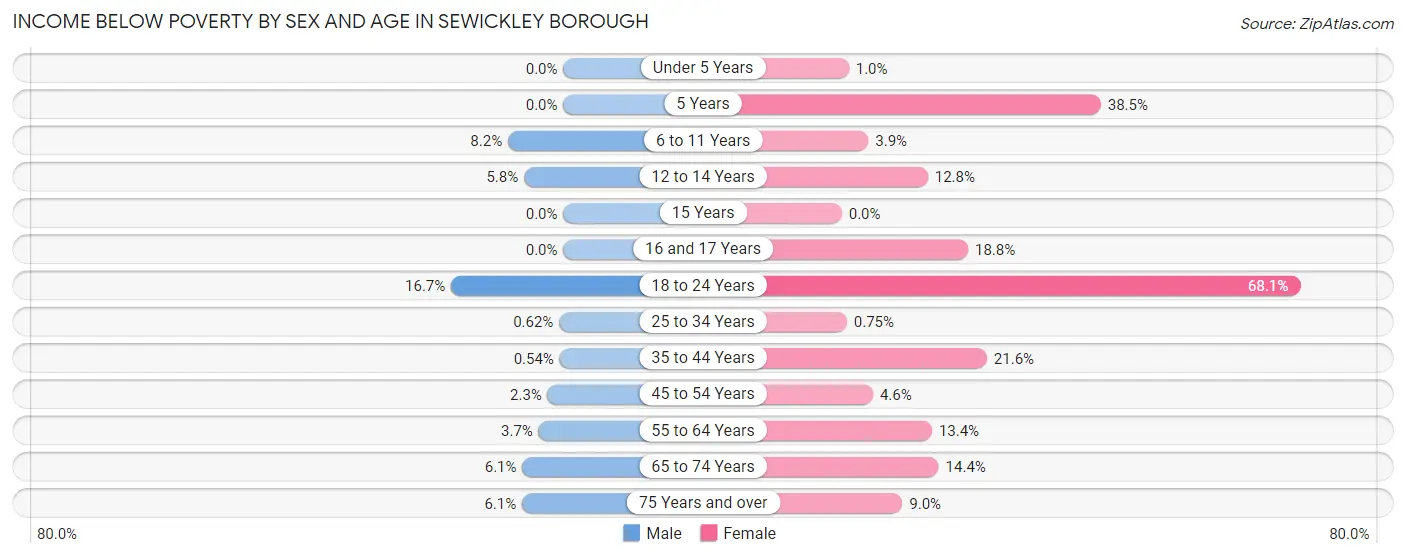
| Age Bracket | Male | Female |
| Under 5 Years | 0 (0.0%) | 1 (1.0%) |
| 5 Years | 0 (0.0%) | 5 (38.5%) |
| 6 to 11 Years | 12 (8.2%) | 8 (3.9%) |
| 12 to 14 Years | 6 (5.8%) | 6 (12.8%) |
| 15 Years | 0 (0.0%) | 0 (0.0%) |
| 16 and 17 Years | 0 (0.0%) | 9 (18.8%) |
| 18 to 24 Years | 29 (16.7%) | 115 (68.0%) |
| 25 to 34 Years | 1 (0.6%) | 2 (0.7%) |
| 35 to 44 Years | 1 (0.5%) | 61 (21.5%) |
| 45 to 54 Years | 6 (2.3%) | 12 (4.6%) |
| 55 to 64 Years | 9 (3.7%) | 30 (13.4%) |
| 65 to 74 Years | 7 (6.1%) | 23 (14.4%) |
| 75 Years and over | 10 (6.1%) | 24 (9.0%) |
| Total | 81 (4.5%) | 296 (14.3%) |
Income Above Poverty by Sex and Age in Sewickley borough
According to the poverty statistics in Sewickley borough, males aged under 5 years and females aged 15 years are the age groups that are most secure financially, with 100.0% of males and 100.0% of females in these age groups living above the poverty line.
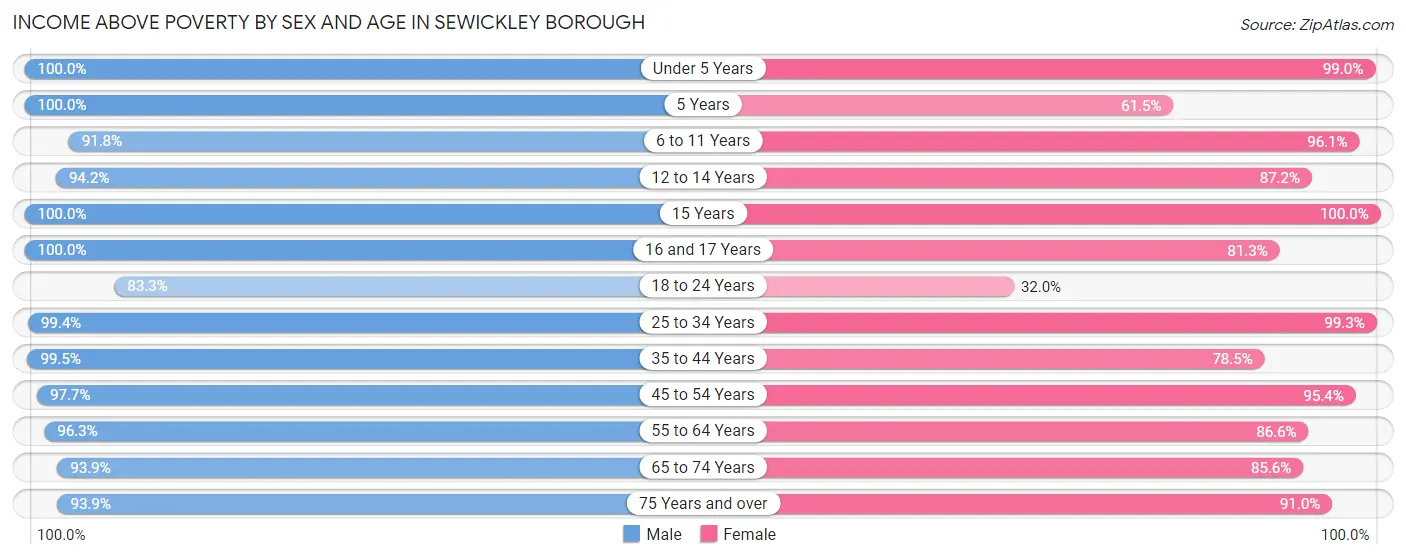
| Age Bracket | Male | Female |
| Under 5 Years | 145 (100.0%) | 95 (99.0%) |
| 5 Years | 28 (100.0%) | 8 (61.5%) |
| 6 to 11 Years | 134 (91.8%) | 195 (96.1%) |
| 12 to 14 Years | 97 (94.2%) | 41 (87.2%) |
| 15 Years | 8 (100.0%) | 29 (100.0%) |
| 16 and 17 Years | 78 (100.0%) | 39 (81.2%) |
| 18 to 24 Years | 145 (83.3%) | 54 (32.0%) |
| 25 to 34 Years | 160 (99.4%) | 265 (99.3%) |
| 35 to 44 Years | 183 (99.5%) | 222 (78.4%) |
| 45 to 54 Years | 251 (97.7%) | 247 (95.4%) |
| 55 to 64 Years | 237 (96.3%) | 194 (86.6%) |
| 65 to 74 Years | 108 (93.9%) | 137 (85.6%) |
| 75 Years and over | 153 (93.9%) | 243 (91.0%) |
| Total | 1,727 (95.5%) | 1,769 (85.7%) |
Income Below Poverty Among Married-Couple Families in Sewickley borough
The poverty statistics for married-couple families in Sewickley borough show that 2.8% or 24 of the total 854 families live below the poverty line. Families with no children have the highest poverty rate of 6.1%, comprising of 24 families. On the other hand, families with 1 or 2 children have the lowest poverty rate of 0.0%, which includes 0 families.
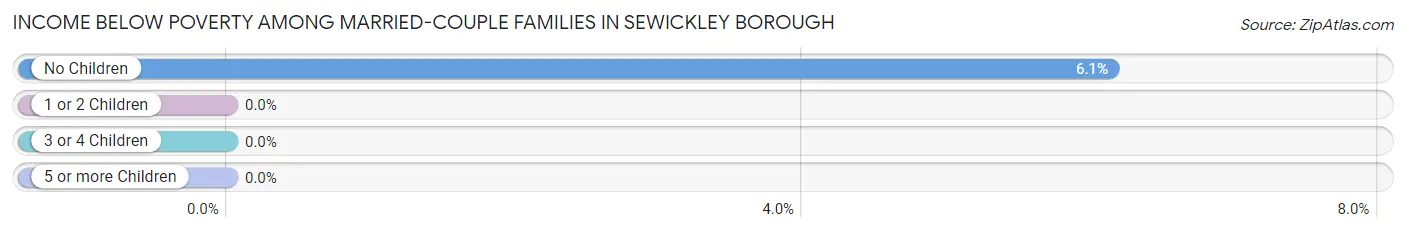
| Children | Above Poverty | Below Poverty |
| No Children | 367 (93.9%) | 24 (6.1%) |
| 1 or 2 Children | 373 (100.0%) | 0 (0.0%) |
| 3 or 4 Children | 90 (100.0%) | 0 (0.0%) |
| 5 or more Children | 0 (0.0%) | 0 (0.0%) |
| Total | 830 (97.2%) | 24 (2.8%) |
Income Below Poverty Among Single-Parent Households in Sewickley borough
According to the poverty data in Sewickley borough, 7.7% or 1 single-father households and 41.5% or 56 single-mother households are living below the poverty line. Among single-father households, those with 1 or 2 children have the highest poverty rate, with 1 households (7.7%) experiencing poverty. Likewise, among single-mother households, those with 3 or 4 children have the highest poverty rate, with 16 households (100.0%) falling below the poverty line.
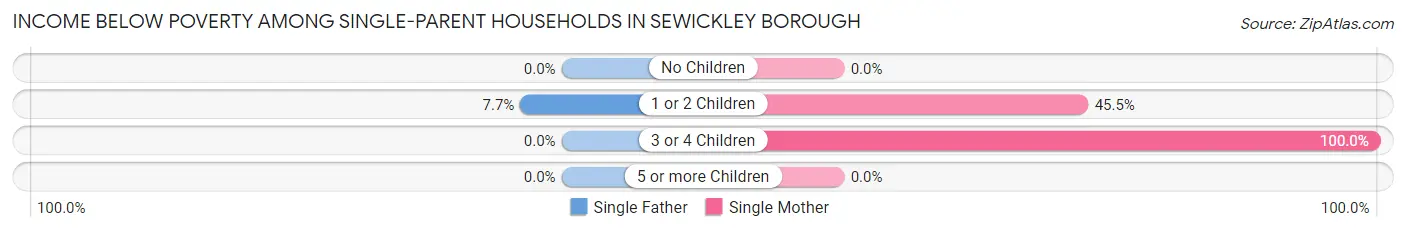
| Children | Single Father | Single Mother |
| No Children | 0 (0.0%) | 0 (0.0%) |
| 1 or 2 Children | 1 (7.7%) | 40 (45.5%) |
| 3 or 4 Children | 0 (0.0%) | 16 (100.0%) |
| 5 or more Children | 0 (0.0%) | 0 (0.0%) |
| Total | 1 (7.7%) | 56 (41.5%) |
Income Below Poverty Among Married-Couple vs Single-Parent Households in Sewickley borough
The poverty data for Sewickley borough shows that 24 of the married-couple family households (2.8%) and 57 of the single-parent households (38.5%) are living below the poverty level. Within the married-couple family households, those with no children have the highest poverty rate, with 24 households (6.1%) falling below the poverty line. Among the single-parent households, those with 3 or 4 children have the highest poverty rate, with 16 household (100.0%) living below poverty.
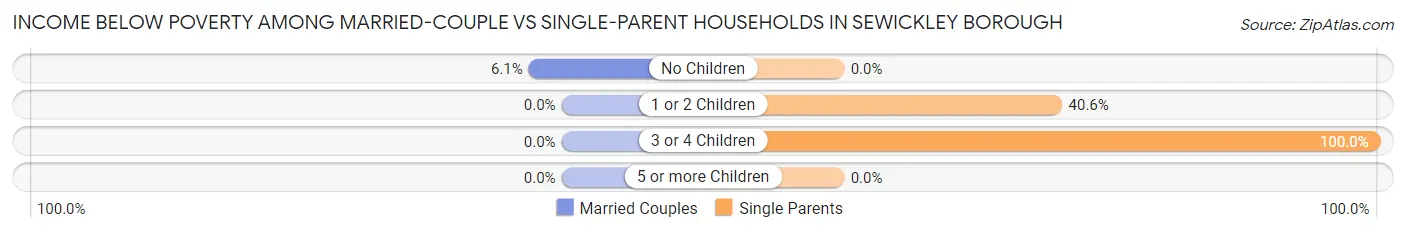
| Children | Married-Couple Families | Single-Parent Households |
| No Children | 24 (6.1%) | 0 (0.0%) |
| 1 or 2 Children | 0 (0.0%) | 41 (40.6%) |
| 3 or 4 Children | 0 (0.0%) | 16 (100.0%) |
| 5 or more Children | 0 (0.0%) | 0 (0.0%) |
| Total | 24 (2.8%) | 57 (38.5%) |
Race in Sewickley borough
The most populous races in Sewickley borough are White / Caucasian (3,227 | 83.3%), Two or more Races (333 | 8.6%), and Black / African American (269 | 7.0%).
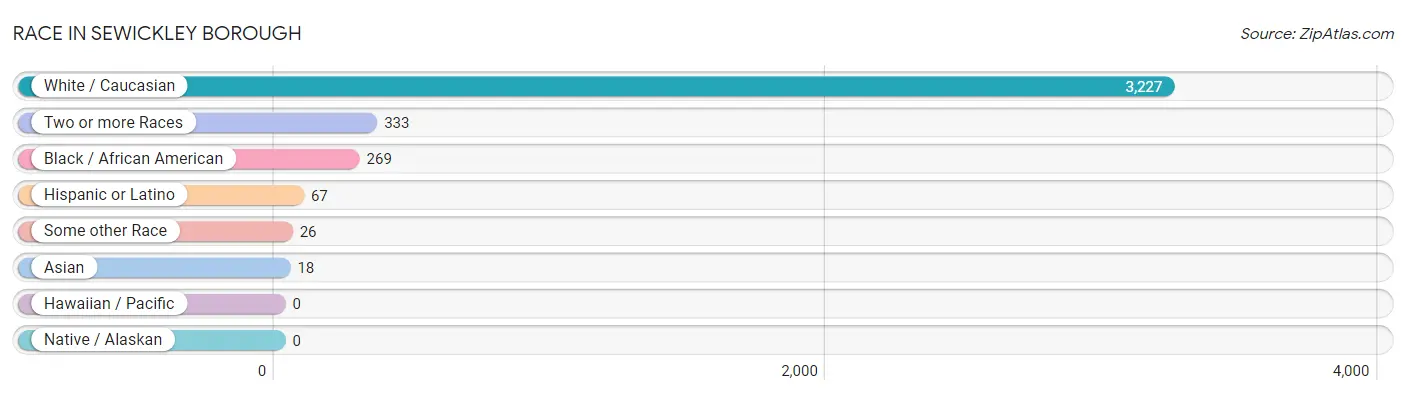
| Race | # Population | % Population |
| Asian | 18 | 0.5% |
| Black / African American | 269 | 7.0% |
| Hawaiian / Pacific | 0 | 0.0% |
| Hispanic or Latino | 67 | 1.7% |
| Native / Alaskan | 0 | 0.0% |
| White / Caucasian | 3,227 | 83.3% |
| Two or more Races | 333 | 8.6% |
| Some other Race | 26 | 0.7% |
| Total | 3,873 | 100.0% |
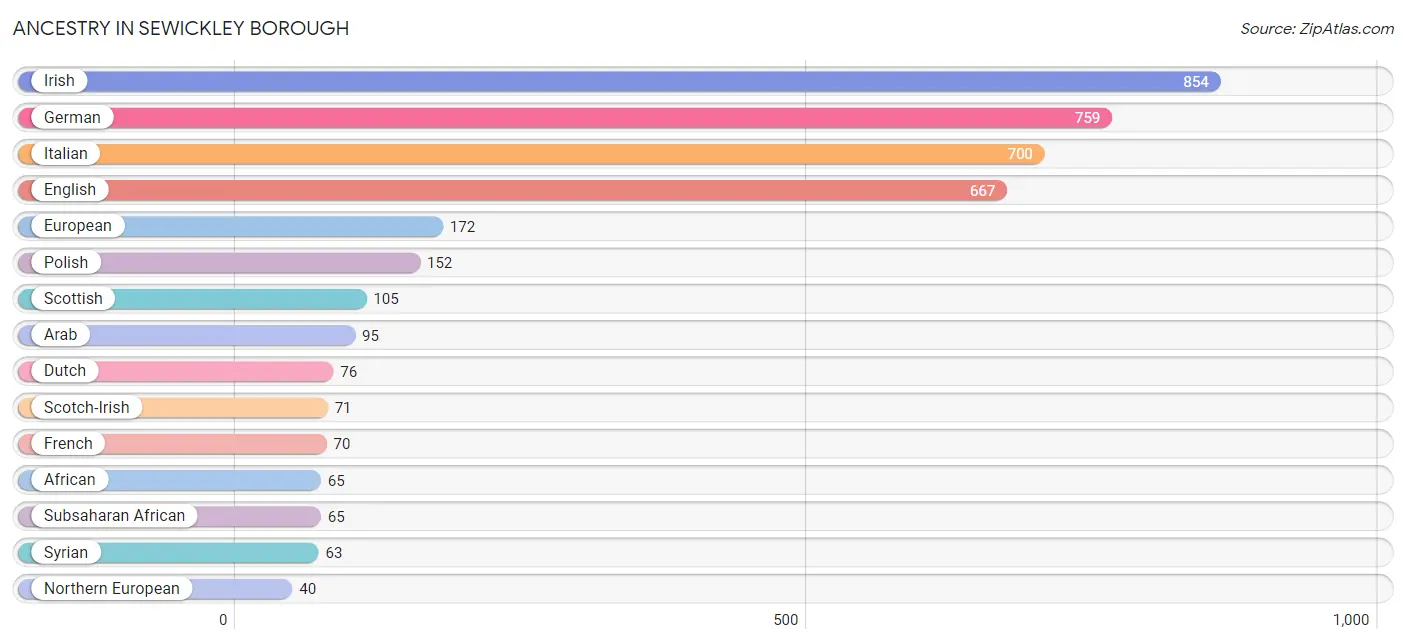
Ancestry in Sewickley borough
The most populous ancestries reported in Sewickley borough are Irish (854 | 22.1%), German (759 | 19.6%), Italian (700 | 18.1%), English (667 | 17.2%), and European (172 | 4.4%), together accounting for 81.4% of all Sewickley borough residents.
| Ancestry | # Population | % Population |
| African | 65 | 1.7% |
| American | 22 | 0.6% |
| Arab | 95 | 2.5% |
| Austrian | 23 | 0.6% |
| British | 1 | 0.0% |
| Burmese | 18 | 0.5% |
| Canadian | 8 | 0.2% |
| Cherokee | 6 | 0.2% |
| Czech | 22 | 0.6% |
| Dutch | 76 | 2.0% |
| Eastern European | 7 | 0.2% |
| English | 667 | 17.2% |
| European | 172 | 4.4% |
| French | 70 | 1.8% |
| German | 759 | 19.6% |
| Greek | 17 | 0.4% |
| Hungarian | 12 | 0.3% |
| Irish | 854 | 22.1% |
| Iroquois | 6 | 0.2% |
| Italian | 700 | 18.1% |
| Lithuanian | 8 | 0.2% |
| Mexican | 29 | 0.7% |
| Northern European | 40 | 1.0% |
| Norwegian | 12 | 0.3% |
| Pennsylvania German | 16 | 0.4% |
| Polish | 152 | 3.9% |
| Puerto Rican | 13 | 0.3% |
| Russian | 13 | 0.3% |
| Scandinavian | 1 | 0.0% |
| Scotch-Irish | 71 | 1.8% |
| Scottish | 105 | 2.7% |
| Serbian | 5 | 0.1% |
| Slovak | 30 | 0.8% |
| Slovene | 5 | 0.1% |
| Spaniard | 25 | 0.6% |
| Subsaharan African | 65 | 1.7% |
| Swedish | 22 | 0.6% |
| Syrian | 63 | 1.6% |
| Thai | 12 | 0.3% |
| Ute | 23 | 0.6% |
| Welsh | 36 | 0.9% | View All 41 Rows |
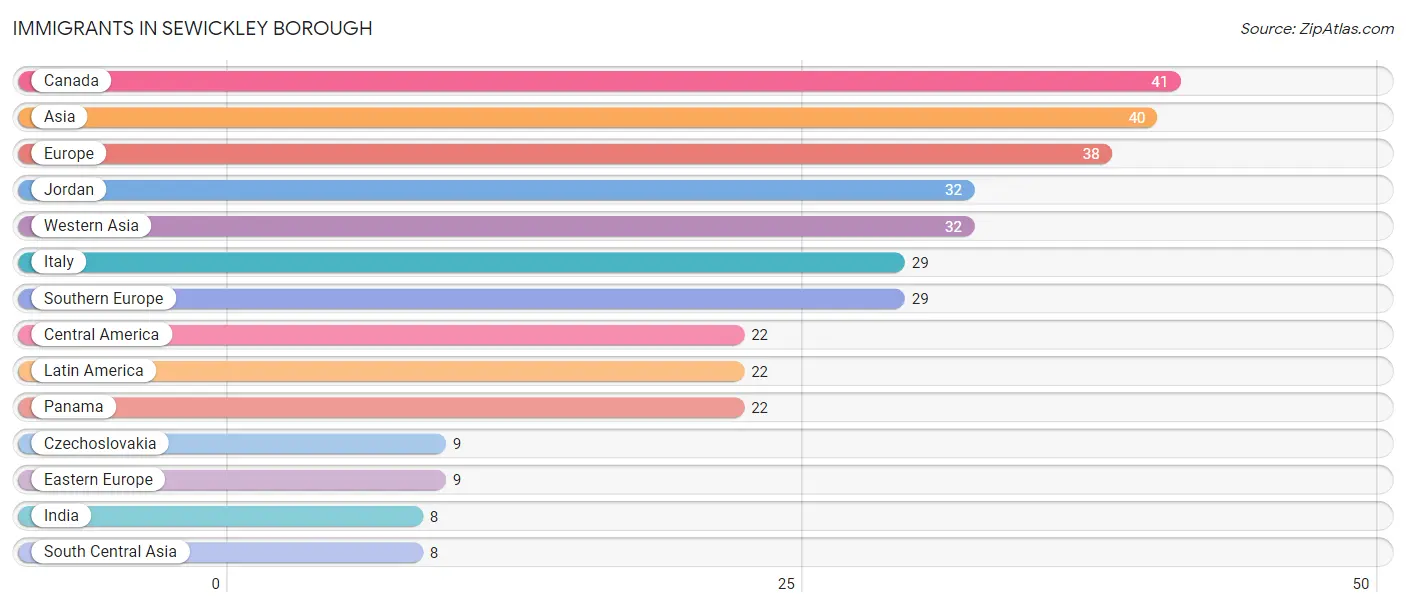
Immigrants in Sewickley borough
The most numerous immigrant groups reported in Sewickley borough came from Canada (41 | 1.1%), Asia (40 | 1.0%), Europe (38 | 1.0%), Jordan (32 | 0.8%), and Western Asia (32 | 0.8%), together accounting for 4.7% of all Sewickley borough residents.
| Immigration Origin | # Population | % Population |
| Asia | 40 | 1.0% |
| Canada | 41 | 1.1% |
| Central America | 22 | 0.6% |
| Czechoslovakia | 9 | 0.2% |
| Eastern Europe | 9 | 0.2% |
| Europe | 38 | 1.0% |
| India | 8 | 0.2% |
| Italy | 29 | 0.7% |
| Jordan | 32 | 0.8% |
| Latin America | 22 | 0.6% |
| Panama | 22 | 0.6% |
| South Central Asia | 8 | 0.2% |
| Southern Europe | 29 | 0.7% |
| Western Asia | 32 | 0.8% | View All 14 Rows |
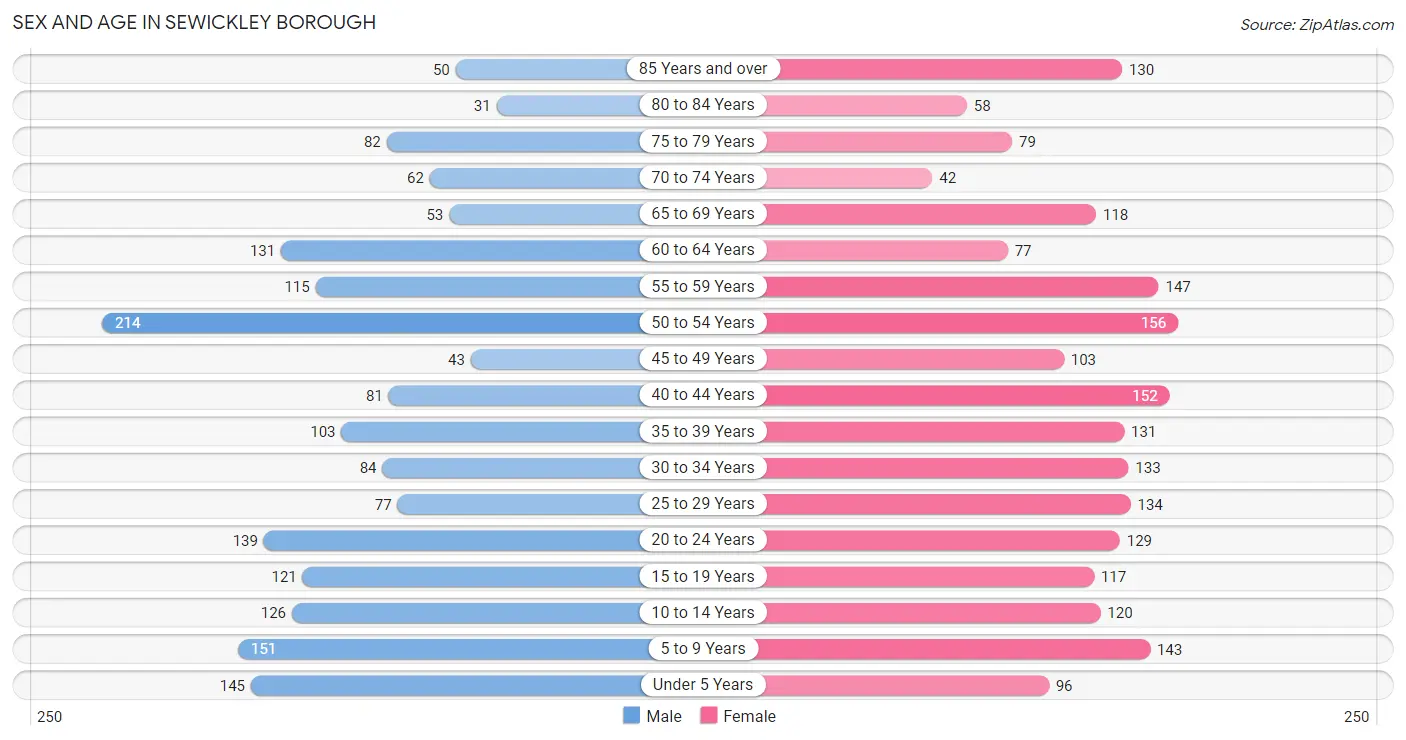
Sex and Age in Sewickley borough
Sex and Age in Sewickley borough
The most populous age groups in Sewickley borough are 50 to 54 Years (214 | 11.8%) for men and 50 to 54 Years (156 | 7.5%) for women.
| Age Bracket | Male | Female |
| Under 5 Years | 145 (8.0%) | 96 (4.6%) |
| 5 to 9 Years | 151 (8.4%) | 143 (6.9%) |
| 10 to 14 Years | 126 (7.0%) | 120 (5.8%) |
| 15 to 19 Years | 121 (6.7%) | 117 (5.7%) |
| 20 to 24 Years | 139 (7.7%) | 129 (6.2%) |
| 25 to 29 Years | 77 (4.3%) | 134 (6.5%) |
| 30 to 34 Years | 84 (4.6%) | 133 (6.4%) |
| 35 to 39 Years | 103 (5.7%) | 131 (6.3%) |
| 40 to 44 Years | 81 (4.5%) | 152 (7.4%) |
| 45 to 49 Years | 43 (2.4%) | 103 (5.0%) |
| 50 to 54 Years | 214 (11.8%) | 156 (7.5%) |
| 55 to 59 Years | 115 (6.4%) | 147 (7.1%) |
| 60 to 64 Years | 131 (7.2%) | 77 (3.7%) |
| 65 to 69 Years | 53 (2.9%) | 118 (5.7%) |
| 70 to 74 Years | 62 (3.4%) | 42 (2.0%) |
| 75 to 79 Years | 82 (4.5%) | 79 (3.8%) |
| 80 to 84 Years | 31 (1.7%) | 58 (2.8%) |
| 85 Years and over | 50 (2.8%) | 130 (6.3%) |
| Total | 1,808 (100.0%) | 2,065 (100.0%) |
Families and Households in Sewickley borough
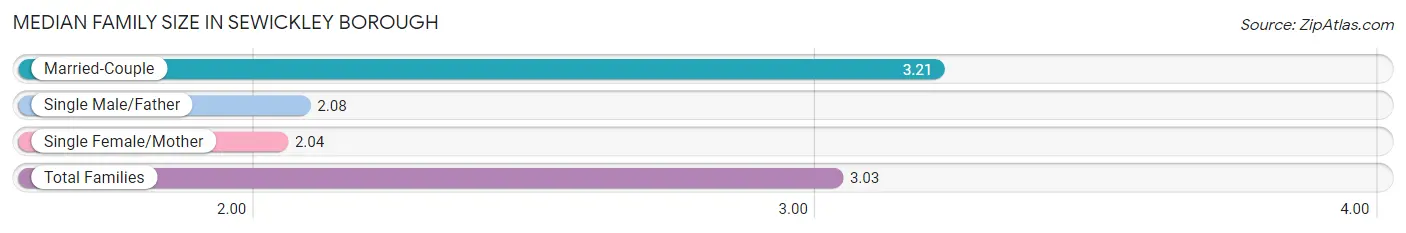
Median Family Size in Sewickley borough
The median family size in Sewickley borough is 3.03 persons per family, with married-couple families (854 | 85.2%) accounting for the largest median family size of 3.21 persons per family. On the other hand, single female/mother families (135 | 13.5%) represent the smallest median family size with 2.04 persons per family.
| Family Type | # Families | Family Size |
| Married-Couple | 854 (85.2%) | 3.21 |
| Single Male/Father | 13 (1.3%) | 2.08 |
| Single Female/Mother | 135 (13.5%) | 2.04 |
| Total Families | 1,002 (100.0%) | 3.03 |
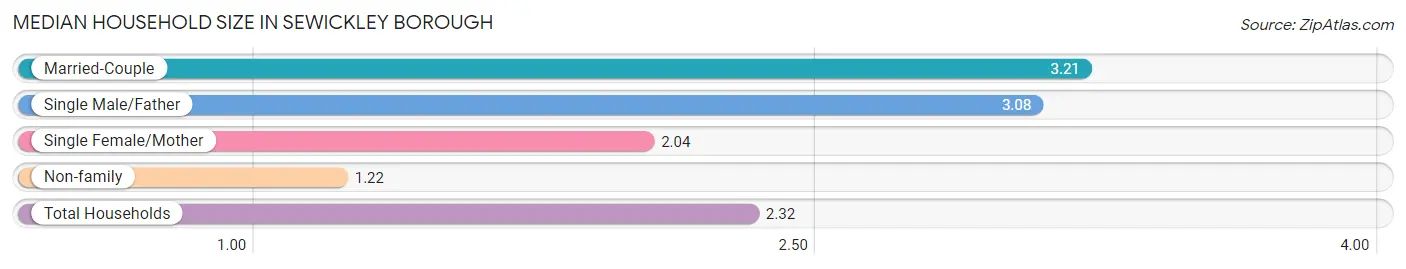
Median Household Size in Sewickley borough
The median household size in Sewickley borough is 2.32 persons per household, with married-couple households (854 | 51.3%) accounting for the largest median household size of 3.21 persons per household. non-family households (661 | 39.8%) represent the smallest median household size with 1.22 persons per household.
| Household Type | # Households | Household Size |
| Married-Couple | 854 (51.3%) | 3.21 |
| Single Male/Father | 13 (0.8%) | 3.08 |
| Single Female/Mother | 135 (8.1%) | 2.04 |
| Non-family | 661 (39.8%) | 1.22 |
| Total Households | 1,663 (100.0%) | 2.32 |
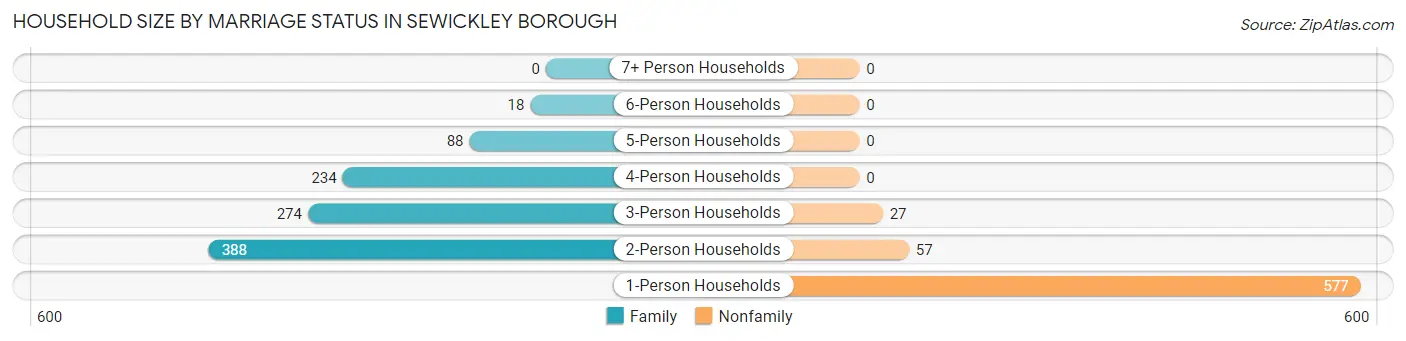
Household Size by Marriage Status in Sewickley borough
Out of a total of 1,663 households in Sewickley borough, 1,002 (60.3%) are family households, while 661 (39.8%) are nonfamily households. The most numerous type of family households are 2-person households, comprising 388, and the most common type of nonfamily households are 1-person households, comprising 577.
| Household Size | Family Households | Nonfamily Households |
| 1-Person Households | - | 577 (34.7%) |
| 2-Person Households | 388 (23.3%) | 57 (3.4%) |
| 3-Person Households | 274 (16.5%) | 27 (1.6%) |
| 4-Person Households | 234 (14.1%) | 0 (0.0%) |
| 5-Person Households | 88 (5.3%) | 0 (0.0%) |
| 6-Person Households | 18 (1.1%) | 0 (0.0%) |
| 7+ Person Households | 0 (0.0%) | 0 (0.0%) |
| Total | 1,002 (60.3%) | 661 (39.8%) |
Female Fertility in Sewickley borough
Fertility by Age in Sewickley borough
Average fertility rate in Sewickley borough is 75.0 births per 1,000 women. Women in the age bracket of 20 to 34 years have the highest fertility rate with 114.0 births per 1,000 women. Women in the age bracket of 20 to 34 years acount for 64.3% of all women with births.
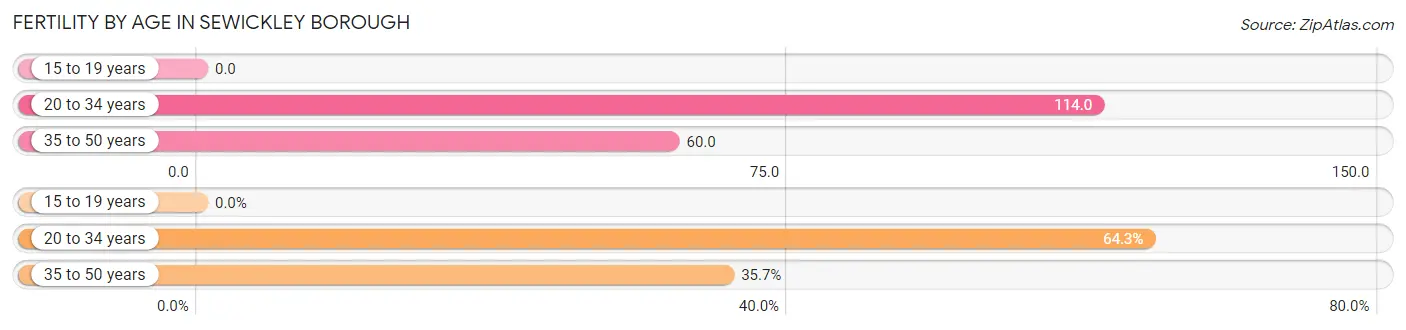
| Age Bracket | Women with Births | Births / 1,000 Women |
| 15 to 19 years | 0 (0.0%) | 0.0 |
| 20 to 34 years | 45 (64.3%) | 114.0 |
| 35 to 50 years | 25 (35.7%) | 60.0 |
| Total | 70 (100.0%) | 75.0 |
Fertility by Age by Marriage Status in Sewickley borough
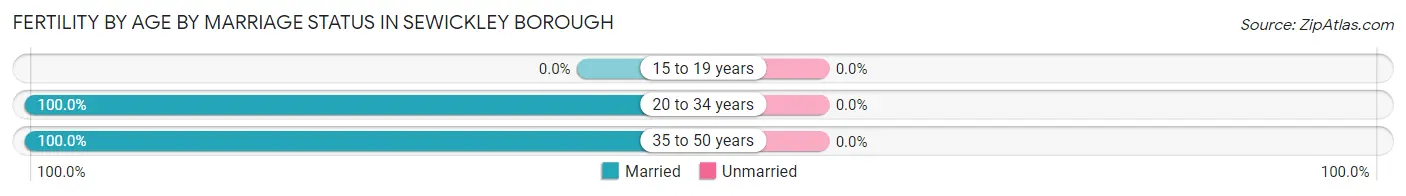
| Age Bracket | Married | Unmarried |
| 15 to 19 years | 0 (0.0%) | 0 (0.0%) |
| 20 to 34 years | 45 (100.0%) | 0 (0.0%) |
| 35 to 50 years | 25 (100.0%) | 0 (0.0%) |
| Total | 70 (100.0%) | 0 (0.0%) |
Fertility by Education in Sewickley borough
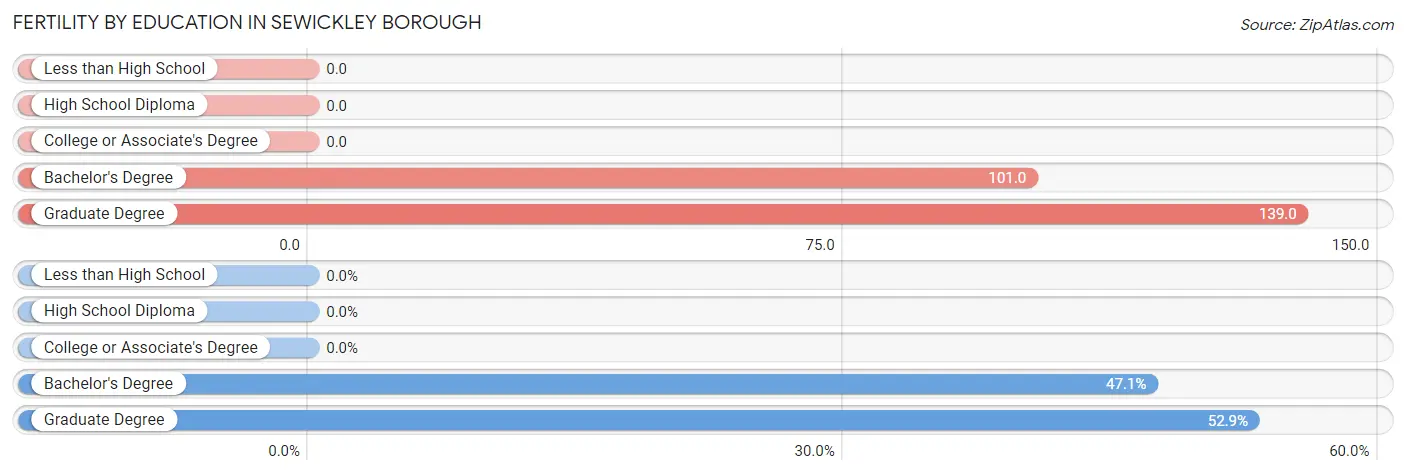
| Educational Attainment | Women with Births | Births / 1,000 Women |
| Less than High School | 0 (0.0%) | 0.0 |
| High School Diploma | 0 (0.0%) | 0.0 |
| College or Associate's Degree | 0 (0.0%) | 0.0 |
| Bachelor's Degree | 33 (47.1%) | 101.0 |
| Graduate Degree | 37 (52.9%) | 139.0 |
| Total | 70 (100.0%) | 75.0 |
Fertility by Education by Marriage Status in Sewickley borough
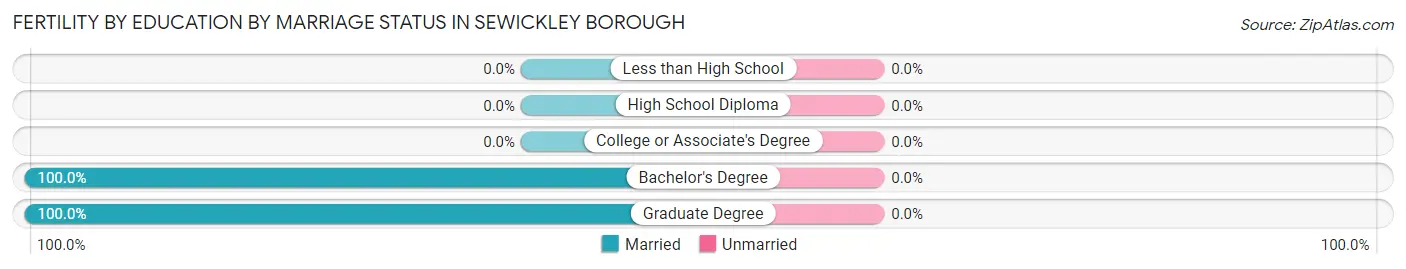
| Educational Attainment | Married | Unmarried |
| Less than High School | 0 (0.0%) | 0 (0.0%) |
| High School Diploma | 0 (0.0%) | 0 (0.0%) |
| College or Associate's Degree | 0 (0.0%) | 0 (0.0%) |
| Bachelor's Degree | 33 (100.0%) | 0 (0.0%) |
| Graduate Degree | 37 (100.0%) | 0 (0.0%) |
| Total | 70 (100.0%) | 0 (0.0%) |
Employment Characteristics in Sewickley borough
Employment by Class of Employer in Sewickley borough
Among the 1,877 employed individuals in Sewickley borough, private company employees (1,486 | 79.2%), not-for-profit organizations (159 | 8.5%), and self-employed (not incorporated) (70 | 3.7%) make up the most common classes of employment.
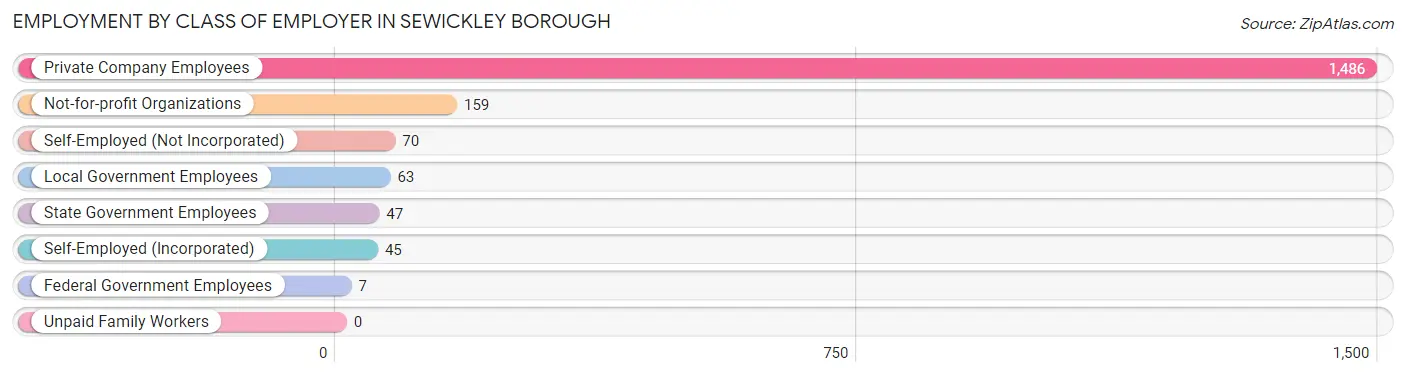
| Employer Class | # Employees | % Employees |
| Private Company Employees | 1,486 | 79.2% |
| Self-Employed (Incorporated) | 45 | 2.4% |
| Self-Employed (Not Incorporated) | 70 | 3.7% |
| Not-for-profit Organizations | 159 | 8.5% |
| Local Government Employees | 63 | 3.4% |
| State Government Employees | 47 | 2.5% |
| Federal Government Employees | 7 | 0.4% |
| Unpaid Family Workers | 0 | 0.0% |
| Total | 1,877 | 100.0% |
Employment Status by Age in Sewickley borough
According to the labor force statistics for Sewickley borough, out of the total population over 16 years of age (3,055), 67.3% or 2,056 individuals are in the labor force, with 7.4% or 152 of them unemployed. The age group with the highest labor force participation rate is 20 to 24 years, with 93.3% or 250 individuals in the labor force. Within the labor force, the 20 to 24 years age range has the highest percentage of unemployed individuals, with 29.2% or 73 of them being unemployed.
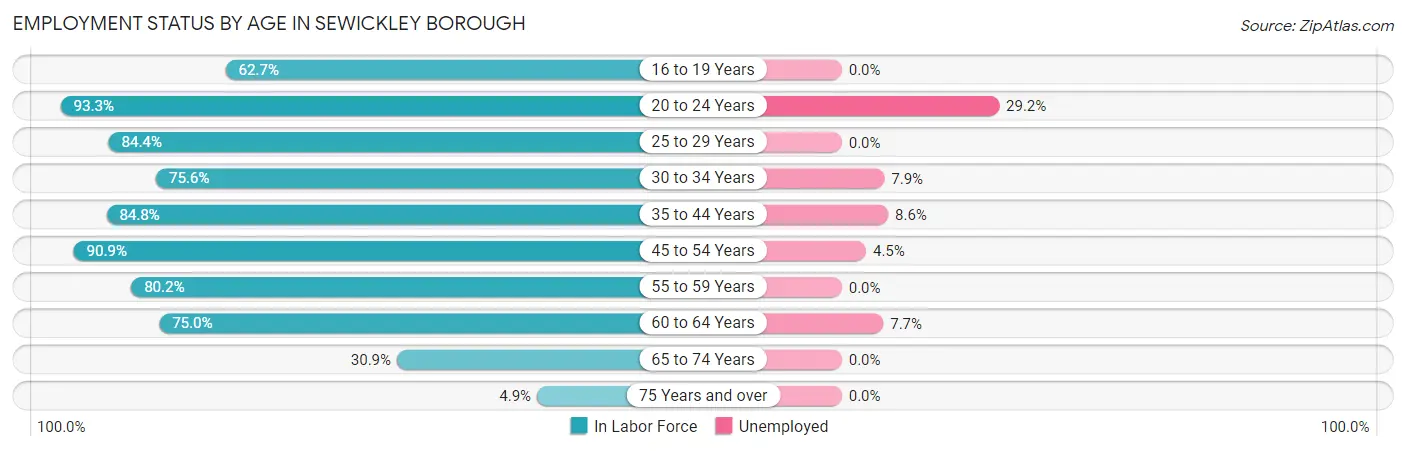
| Age Bracket | In Labor Force | Unemployed |
| 16 to 19 Years | 126 (62.7%) | 0 (0.0%) |
| 20 to 24 Years | 250 (93.3%) | 73 (29.2%) |
| 25 to 29 Years | 178 (84.4%) | 0 (0.0%) |
| 30 to 34 Years | 164 (75.6%) | 13 (7.9%) |
| 35 to 44 Years | 396 (84.8%) | 34 (8.6%) |
| 45 to 54 Years | 469 (90.9%) | 21 (4.5%) |
| 55 to 59 Years | 210 (80.2%) | 0 (0.0%) |
| 60 to 64 Years | 156 (75.0%) | 12 (7.7%) |
| 65 to 74 Years | 85 (30.9%) | 0 (0.0%) |
| 75 Years and over | 21 (4.9%) | 0 (0.0%) |
| Total | 2,056 (67.3%) | 152 (7.4%) |
Employment Status by Educational Attainment in Sewickley borough
According to labor force statistics for Sewickley borough, 83.6% of individuals (1,573) out of the total population between 25 and 64 years of age (1,881) are in the labor force, with 5.1% or 80 of them being unemployed. The group with the highest labor force participation rate are those with the educational attainment of college / associate degree, with 85.8% or 435 individuals in the labor force. Within the labor force, individuals with college / associate degree education have the highest percentage of unemployment, with 18.4% or 80 of them being unemployed.
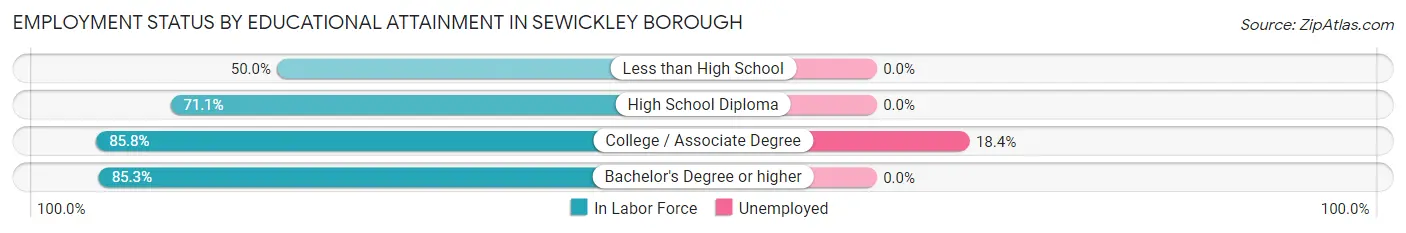
| Educational Attainment | In Labor Force | Unemployed |
| Less than High School | 18 (50.0%) | 0 (0.0%) |
| High School Diploma | 108 (71.1%) | 0 (0.0%) |
| College / Associate Degree | 435 (85.8%) | 93 (18.4%) |
| Bachelor's Degree or higher | 1,012 (85.3%) | 0 (0.0%) |
| Total | 1,573 (83.6%) | 96 (5.1%) |
Employment Occupations by Sex in Sewickley borough
Management, Business, Science and Arts Occupations
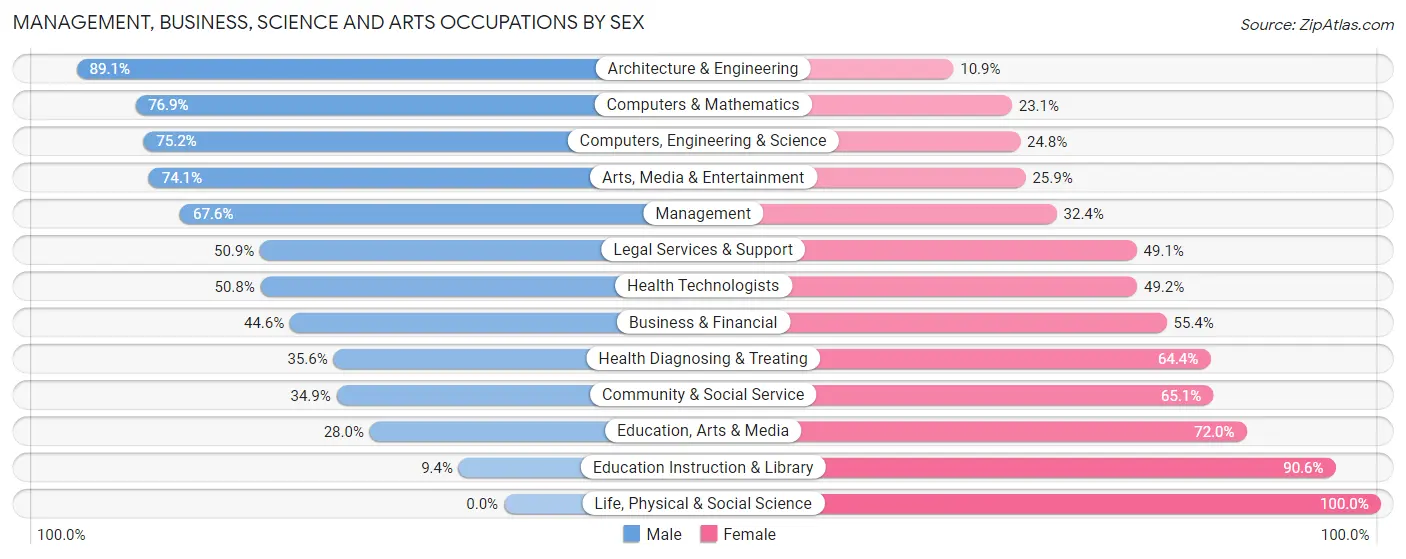
The most common Management, Business, Science and Arts occupations in Sewickley borough are Management (404 | 21.2%), Community & Social Service (272 | 14.3%), Business & Financial (121 | 6.4%), Computers, Engineering & Science (121 | 6.4%), and Legal Services & Support (114 | 6.0%).
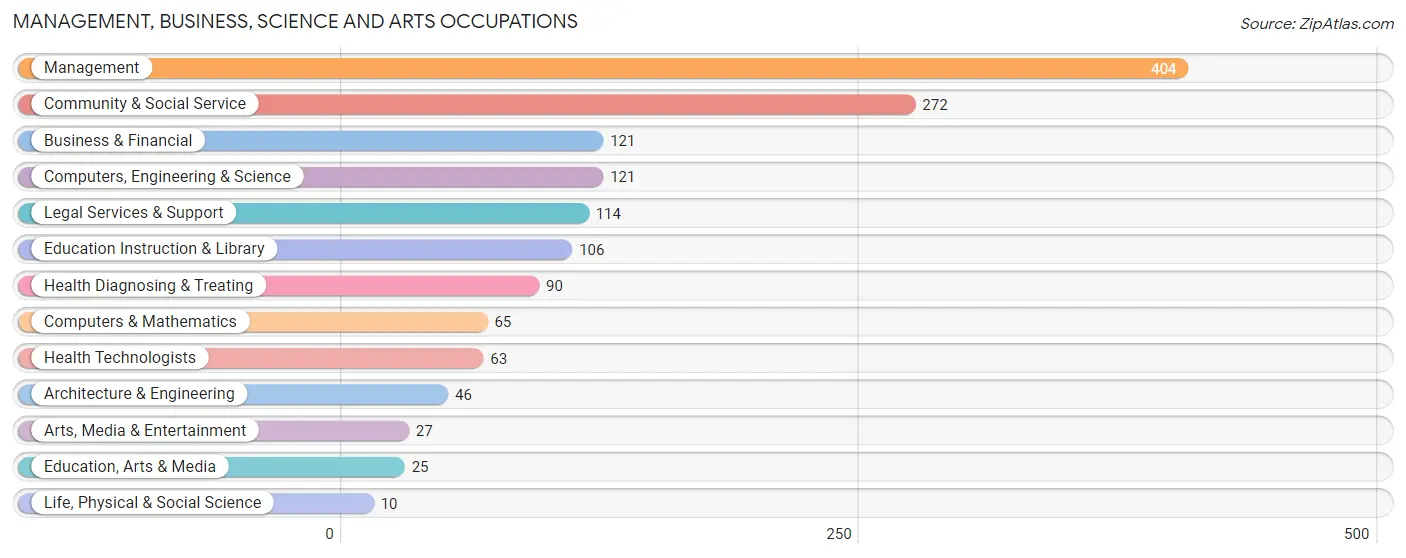
Management, Business, Science and Arts Occupations by Sex
Within the Management, Business, Science and Arts occupations in Sewickley borough, the most male-oriented occupations are Architecture & Engineering (89.1%), Computers & Mathematics (76.9%), and Computers, Engineering & Science (75.2%), while the most female-oriented occupations are Life, Physical & Social Science (100.0%), Education Instruction & Library (90.6%), and Education, Arts & Media (72.0%).
| Occupation | Male | Female |
| Management | 273 (67.6%) | 131 (32.4%) |
| Business & Financial | 54 (44.6%) | 67 (55.4%) |
| Computers, Engineering & Science | 91 (75.2%) | 30 (24.8%) |
| Computers & Mathematics | 50 (76.9%) | 15 (23.1%) |
| Architecture & Engineering | 41 (89.1%) | 5 (10.9%) |
| Life, Physical & Social Science | 0 (0.0%) | 10 (100.0%) |
| Community & Social Service | 95 (34.9%) | 177 (65.1%) |
| Education, Arts & Media | 7 (28.0%) | 18 (72.0%) |
| Legal Services & Support | 58 (50.9%) | 56 (49.1%) |
| Education Instruction & Library | 10 (9.4%) | 96 (90.6%) |
| Arts, Media & Entertainment | 20 (74.1%) | 7 (25.9%) |
| Health Diagnosing & Treating | 32 (35.6%) | 58 (64.4%) |
| Health Technologists | 32 (50.8%) | 31 (49.2%) |
| Total (Category) | 545 (54.1%) | 463 (45.9%) |
| Total (Overall) | 888 (46.7%) | 1,014 (53.3%) |
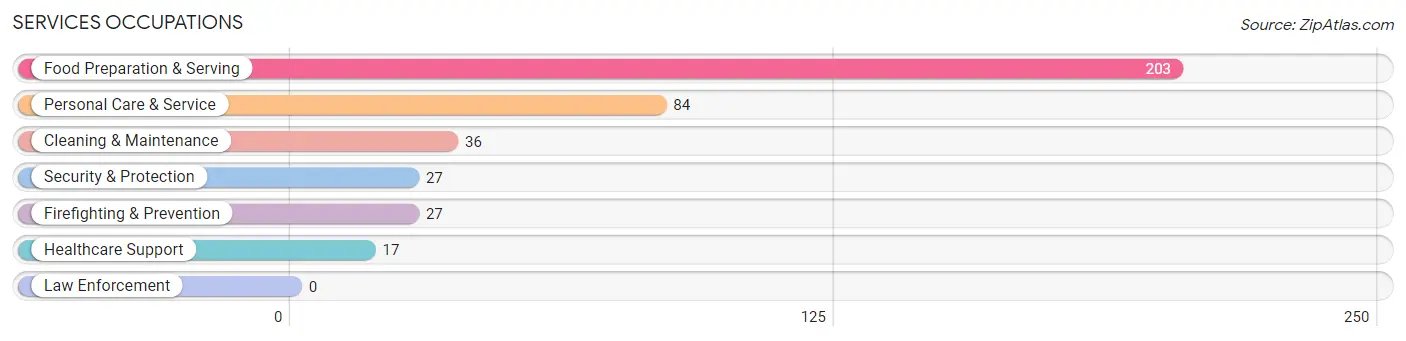
Services Occupations
The most common Services occupations in Sewickley borough are Food Preparation & Serving (203 | 10.7%), Personal Care & Service (84 | 4.4%), Cleaning & Maintenance (36 | 1.9%), Security & Protection (27 | 1.4%), and Firefighting & Prevention (27 | 1.4%).
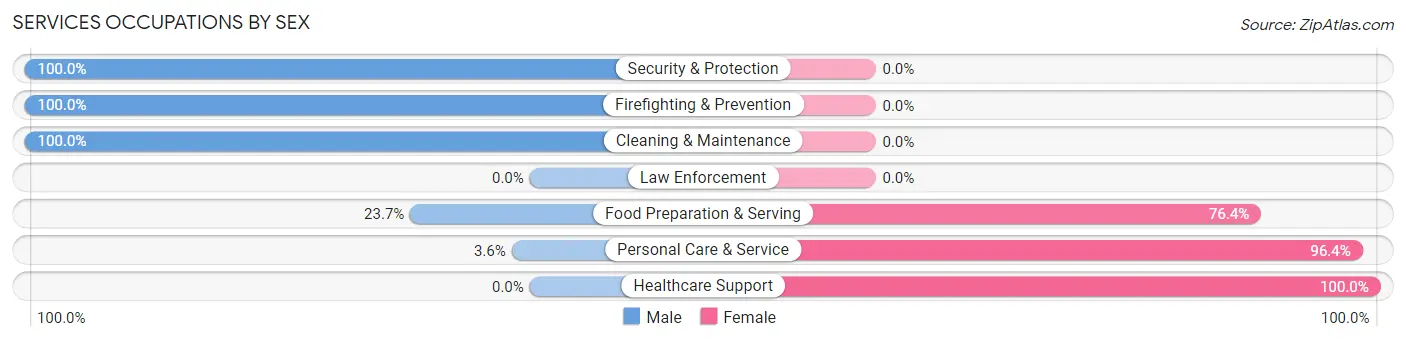
Services Occupations by Sex
Within the Services occupations in Sewickley borough, the most male-oriented occupations are Security & Protection (100.0%), Firefighting & Prevention (100.0%), and Cleaning & Maintenance (100.0%), while the most female-oriented occupations are Healthcare Support (100.0%), Personal Care & Service (96.4%), and Food Preparation & Serving (76.3%).
| Occupation | Male | Female |
| Healthcare Support | 0 (0.0%) | 17 (100.0%) |
| Security & Protection | 27 (100.0%) | 0 (0.0%) |
| Firefighting & Prevention | 27 (100.0%) | 0 (0.0%) |
| Law Enforcement | 0 (0.0%) | 0 (0.0%) |
| Food Preparation & Serving | 48 (23.6%) | 155 (76.3%) |
| Cleaning & Maintenance | 36 (100.0%) | 0 (0.0%) |
| Personal Care & Service | 3 (3.6%) | 81 (96.4%) |
| Total (Category) | 114 (31.1%) | 253 (68.9%) |
| Total (Overall) | 888 (46.7%) | 1,014 (53.3%) |
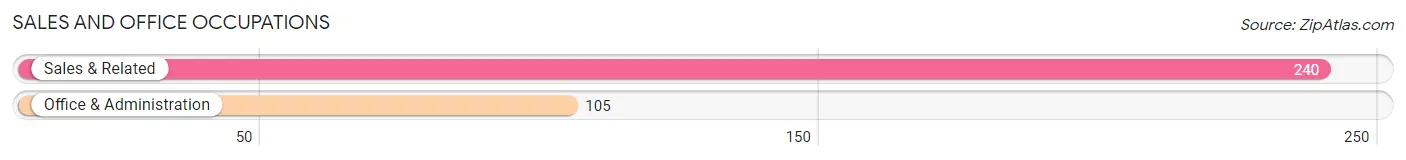
Sales and Office Occupations
The most common Sales and Office occupations in Sewickley borough are Sales & Related (240 | 12.6%), and Office & Administration (105 | 5.5%).
Sales and Office Occupations by Sex
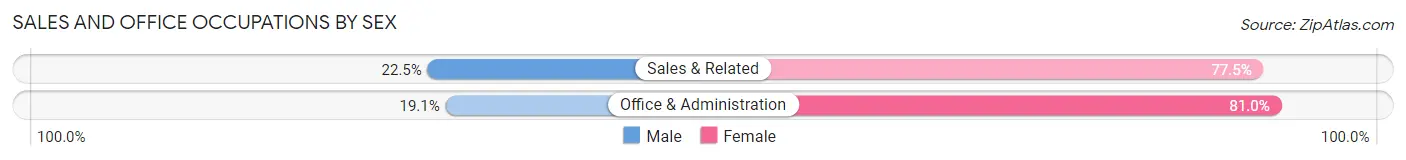
| Occupation | Male | Female |
| Sales & Related | 54 (22.5%) | 186 (77.5%) |
| Office & Administration | 20 (19.1%) | 85 (80.9%) |
| Total (Category) | 74 (21.4%) | 271 (78.5%) |
| Total (Overall) | 888 (46.7%) | 1,014 (53.3%) |
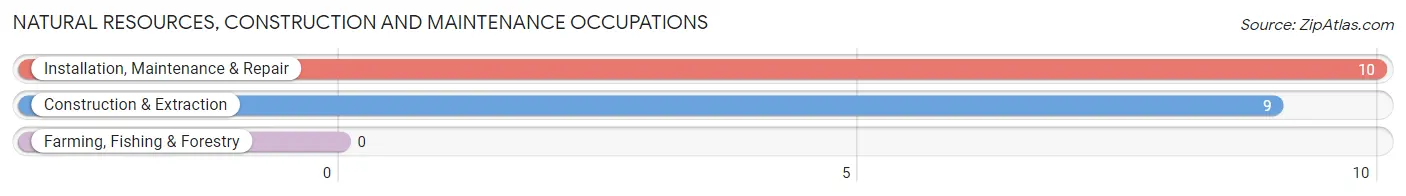
Natural Resources, Construction and Maintenance Occupations
The most common Natural Resources, Construction and Maintenance occupations in Sewickley borough are Installation, Maintenance & Repair (10 | 0.5%), and Construction & Extraction (9 | 0.5%).
Natural Resources, Construction and Maintenance Occupations by Sex
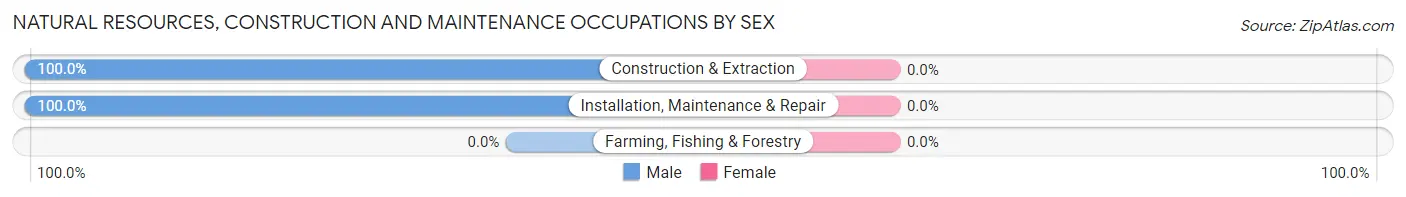
| Occupation | Male | Female |
| Farming, Fishing & Forestry | 0 (0.0%) | 0 (0.0%) |
| Construction & Extraction | 9 (100.0%) | 0 (0.0%) |
| Installation, Maintenance & Repair | 10 (100.0%) | 0 (0.0%) |
| Total (Category) | 19 (100.0%) | 0 (0.0%) |
| Total (Overall) | 888 (46.7%) | 1,014 (53.3%) |
Production, Transportation and Moving Occupations
The most common Production, Transportation and Moving occupations in Sewickley borough are Material Moving (130 | 6.8%), Transportation (25 | 1.3%), and Production (8 | 0.4%).
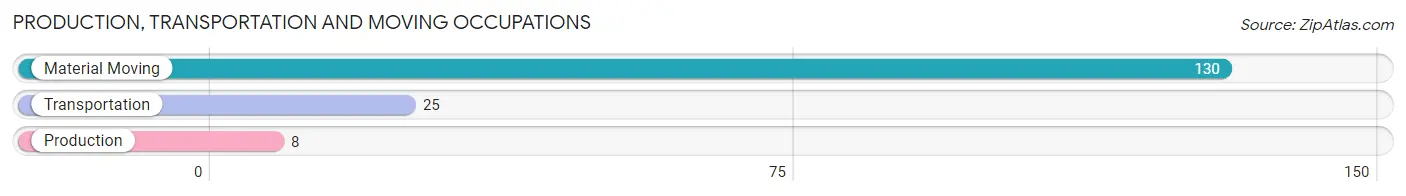
Production, Transportation and Moving Occupations by Sex
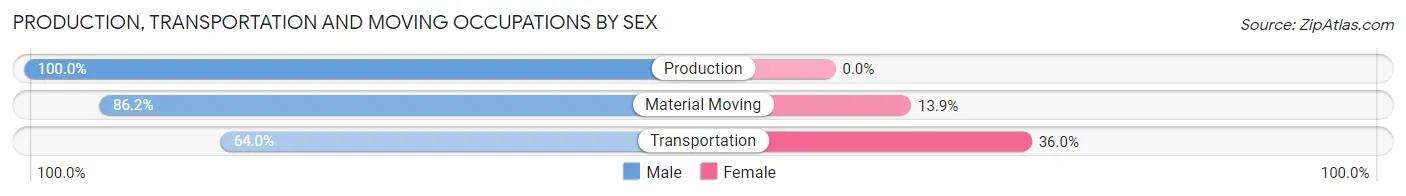
| Occupation | Male | Female |
| Production | 8 (100.0%) | 0 (0.0%) |
| Transportation | 16 (64.0%) | 9 (36.0%) |
| Material Moving | 112 (86.2%) | 18 (13.9%) |
| Total (Category) | 136 (83.4%) | 27 (16.6%) |
| Total (Overall) | 888 (46.7%) | 1,014 (53.3%) |
Employment Industries by Sex in Sewickley borough
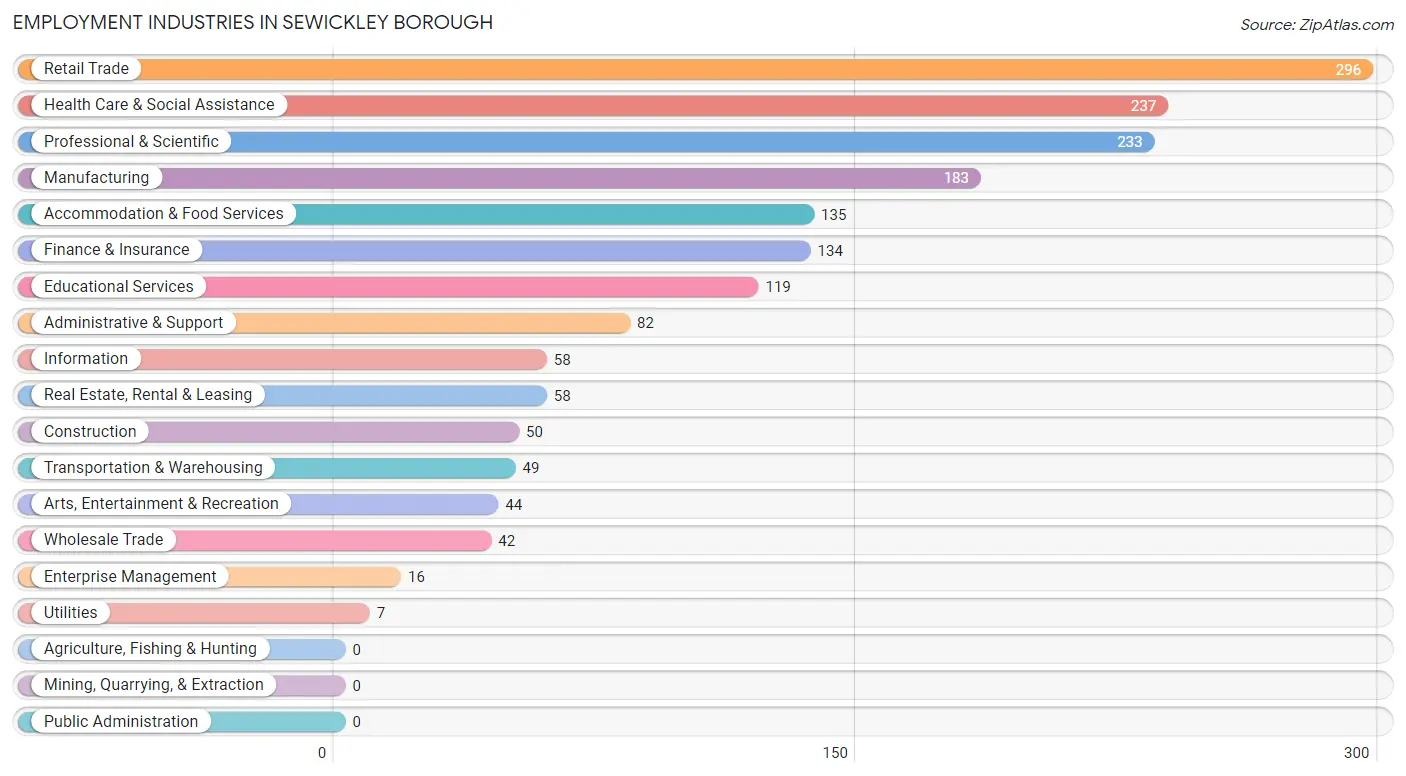
Employment Industries in Sewickley borough
The major employment industries in Sewickley borough include Retail Trade (296 | 15.6%), Health Care & Social Assistance (237 | 12.5%), Professional & Scientific (233 | 12.2%), Manufacturing (183 | 9.6%), and Accommodation & Food Services (135 | 7.1%).
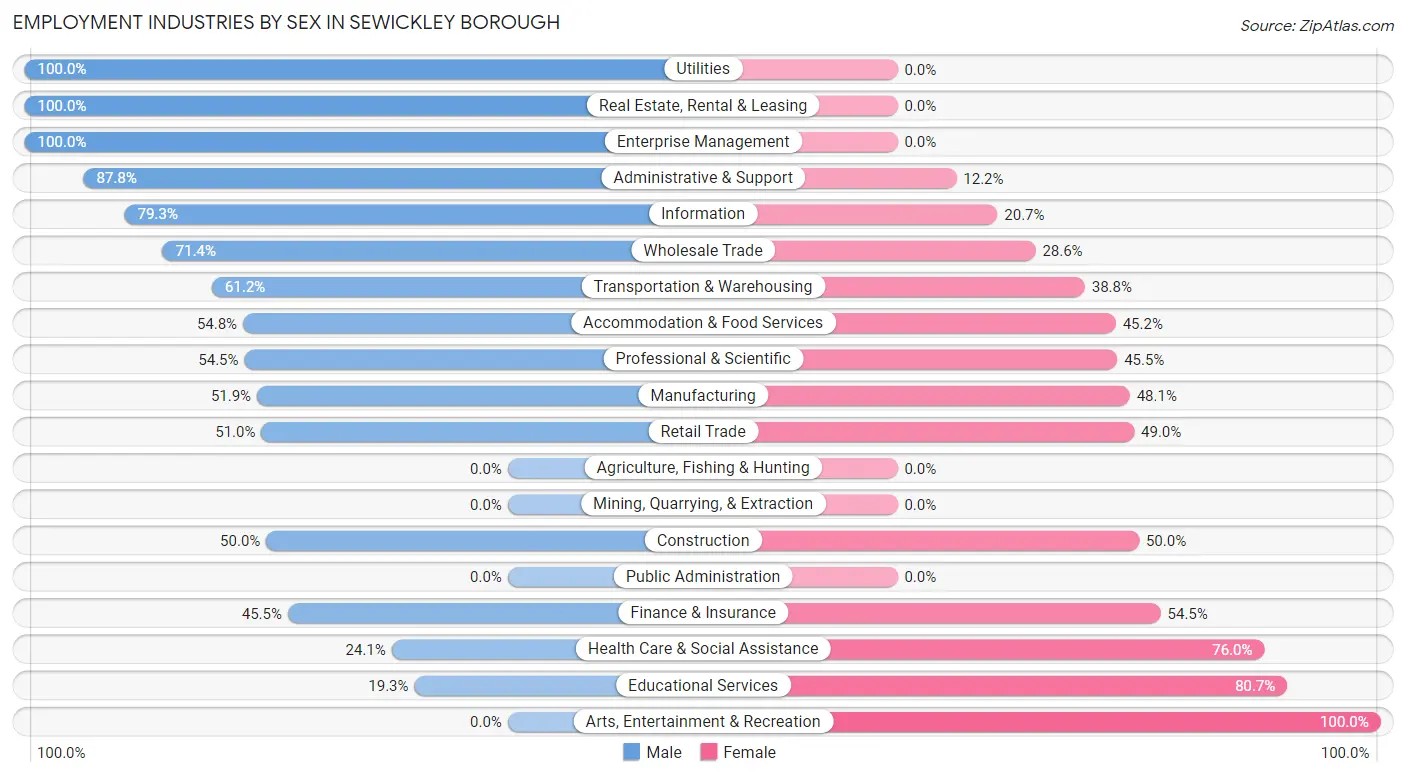
Employment Industries by Sex in Sewickley borough
The Sewickley borough industries that see more men than women are Utilities (100.0%), Real Estate, Rental & Leasing (100.0%), and Enterprise Management (100.0%), whereas the industries that tend to have a higher number of women are Arts, Entertainment & Recreation (100.0%), Educational Services (80.7%), and Health Care & Social Assistance (75.9%).
| Industry | Male | Female |
| Agriculture, Fishing & Hunting | 0 (0.0%) | 0 (0.0%) |
| Mining, Quarrying, & Extraction | 0 (0.0%) | 0 (0.0%) |
| Construction | 25 (50.0%) | 25 (50.0%) |
| Manufacturing | 95 (51.9%) | 88 (48.1%) |
| Wholesale Trade | 30 (71.4%) | 12 (28.6%) |
| Retail Trade | 151 (51.0%) | 145 (49.0%) |
| Transportation & Warehousing | 30 (61.2%) | 19 (38.8%) |
| Utilities | 7 (100.0%) | 0 (0.0%) |
| Information | 46 (79.3%) | 12 (20.7%) |
| Finance & Insurance | 61 (45.5%) | 73 (54.5%) |
| Real Estate, Rental & Leasing | 58 (100.0%) | 0 (0.0%) |
| Professional & Scientific | 127 (54.5%) | 106 (45.5%) |
| Enterprise Management | 16 (100.0%) | 0 (0.0%) |
| Administrative & Support | 72 (87.8%) | 10 (12.2%) |
| Educational Services | 23 (19.3%) | 96 (80.7%) |
| Health Care & Social Assistance | 57 (24.0%) | 180 (75.9%) |
| Arts, Entertainment & Recreation | 0 (0.0%) | 44 (100.0%) |
| Accommodation & Food Services | 74 (54.8%) | 61 (45.2%) |
| Public Administration | 0 (0.0%) | 0 (0.0%) |
| Total | 888 (46.7%) | 1,014 (53.3%) |
Education in Sewickley borough
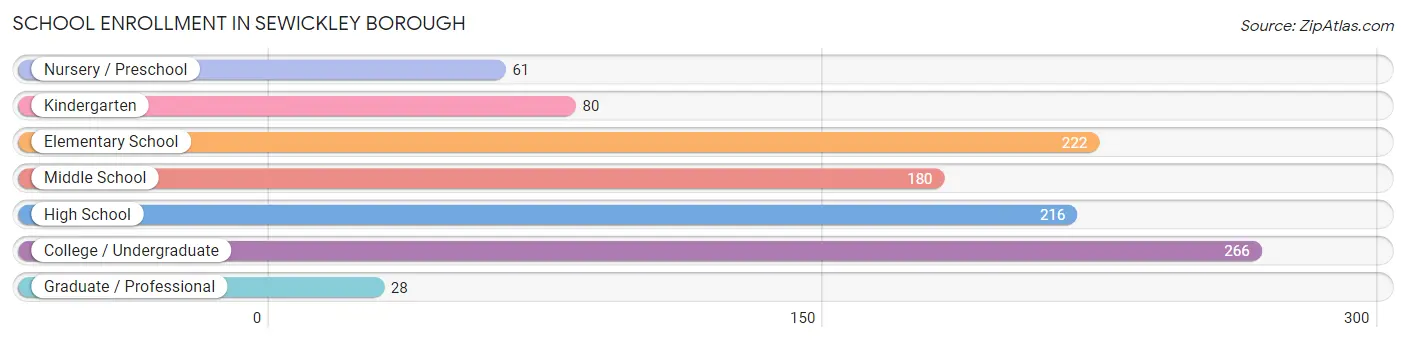
School Enrollment in Sewickley borough
The most common levels of schooling among the 1,053 students in Sewickley borough are college / undergraduate (266 | 25.3%), elementary school (222 | 21.1%), and high school (216 | 20.5%).
| School Level | # Students | % Students |
| Nursery / Preschool | 61 | 5.8% |
| Kindergarten | 80 | 7.6% |
| Elementary School | 222 | 21.1% |
| Middle School | 180 | 17.1% |
| High School | 216 | 20.5% |
| College / Undergraduate | 266 | 25.3% |
| Graduate / Professional | 28 | 2.7% |
| Total | 1,053 | 100.0% |
School Enrollment by Age by Funding Source in Sewickley borough
Out of a total of 1,053 students who are enrolled in schools in Sewickley borough, 210 (19.9%) attend a private institution, while the remaining 843 (80.1%) are enrolled in public schools. The age group of 3 to 4 year olds has the highest likelihood of being enrolled in private schools, with 33 (100.0% in the age bracket) enrolled. Conversely, the age group of 18 to 19 year olds has the lowest likelihood of being enrolled in a private school, with 47 (100.0% in the age bracket) attending a public institution.
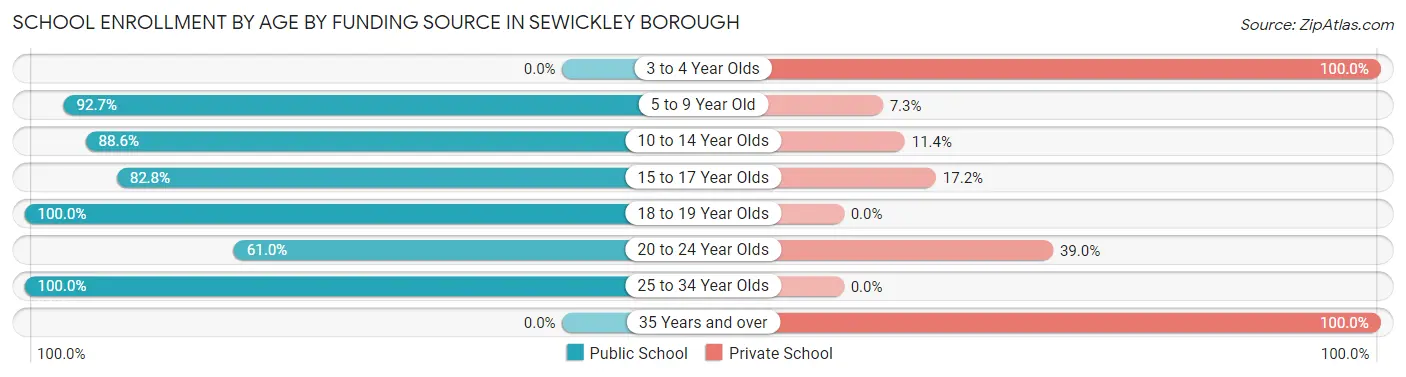
| Age Bracket | Public School | Private School |
| 3 to 4 Year Olds | 0 (0.0%) | 33 (100.0%) |
| 5 to 9 Year Old | 268 (92.7%) | 21 (7.3%) |
| 10 to 14 Year Olds | 218 (88.6%) | 28 (11.4%) |
| 15 to 17 Year Olds | 135 (82.8%) | 28 (17.2%) |
| 18 to 19 Year Olds | 47 (100.0%) | 0 (0.0%) |
| 20 to 24 Year Olds | 133 (61.0%) | 85 (39.0%) |
| 25 to 34 Year Olds | 42 (100.0%) | 0 (0.0%) |
| 35 Years and over | 0 (0.0%) | 15 (100.0%) |
| Total | 843 (80.1%) | 210 (19.9%) |
Educational Attainment by Field of Study in Sewickley borough
Business (373 | 22.7%), social sciences (170 | 10.3%), engineering (153 | 9.3%), psychology (140 | 8.5%), and education (139 | 8.5%) are the most common fields of study among 1,642 individuals in Sewickley borough who have obtained a bachelor's degree or higher.
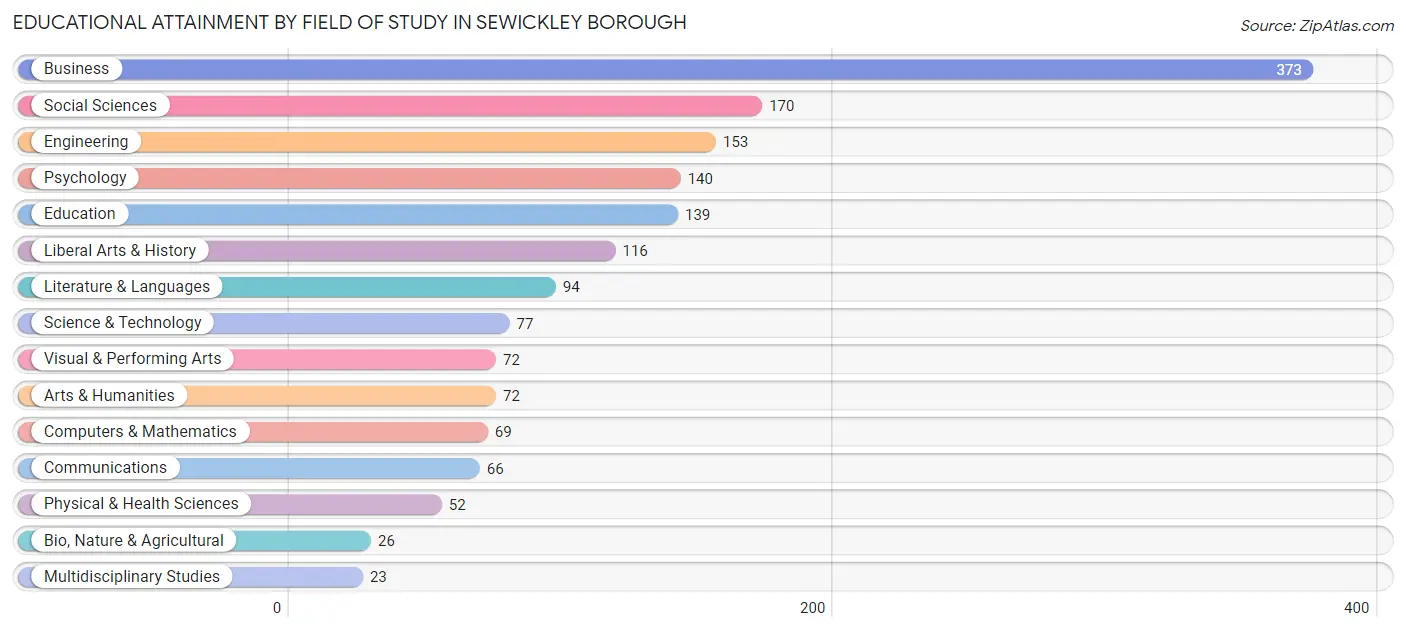
| Field of Study | # Graduates | % Graduates |
| Computers & Mathematics | 69 | 4.2% |
| Bio, Nature & Agricultural | 26 | 1.6% |
| Physical & Health Sciences | 52 | 3.2% |
| Psychology | 140 | 8.5% |
| Social Sciences | 170 | 10.3% |
| Engineering | 153 | 9.3% |
| Multidisciplinary Studies | 23 | 1.4% |
| Science & Technology | 77 | 4.7% |
| Business | 373 | 22.7% |
| Education | 139 | 8.5% |
| Literature & Languages | 94 | 5.7% |
| Liberal Arts & History | 116 | 7.1% |
| Visual & Performing Arts | 72 | 4.4% |
| Communications | 66 | 4.0% |
| Arts & Humanities | 72 | 4.4% |
| Total | 1,642 | 100.0% |
Transportation & Commute in Sewickley borough
Vehicle Availability by Sex in Sewickley borough
The most prevalent vehicle ownership categories in Sewickley borough are males with 2 vehicles (486, accounting for 55.7%) and females with 2 vehicles (390, making up 48.5%).
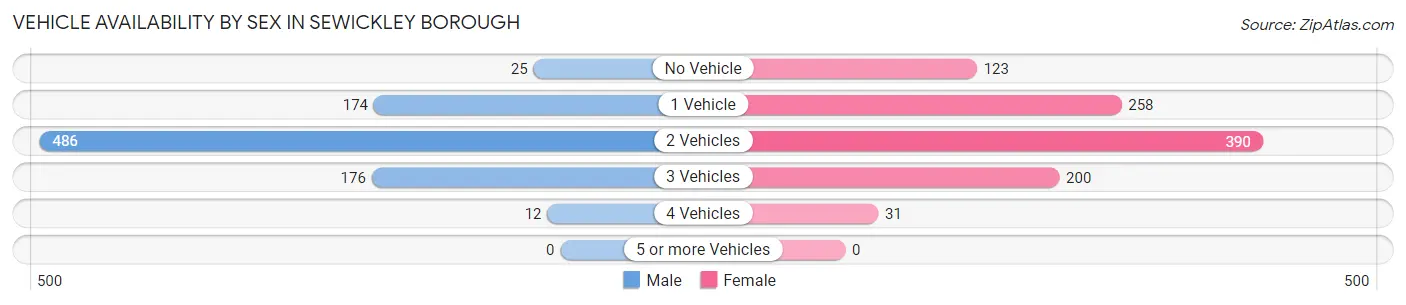
| Vehicles Available | Male | Female |
| No Vehicle | 25 (2.9%) | 123 (12.3%) |
| 1 Vehicle | 174 (19.9%) | 258 (25.8%) |
| 2 Vehicles | 486 (55.7%) | 390 (38.9%) |
| 3 Vehicles | 176 (20.2%) | 200 (20.0%) |
| 4 Vehicles | 12 (1.4%) | 31 (3.1%) |
| 5 or more Vehicles | 0 (0.0%) | 0 (0.0%) |
| Total | 873 (100.0%) | 1,002 (100.0%) |
Commute Time in Sewickley borough
The most frequently occuring commute durations in Sewickley borough are 15 to 19 minutes (251 commuters, 17.7%), 10 to 14 minutes (200 commuters, 14.1%), and 30 to 34 minutes (179 commuters, 12.6%).
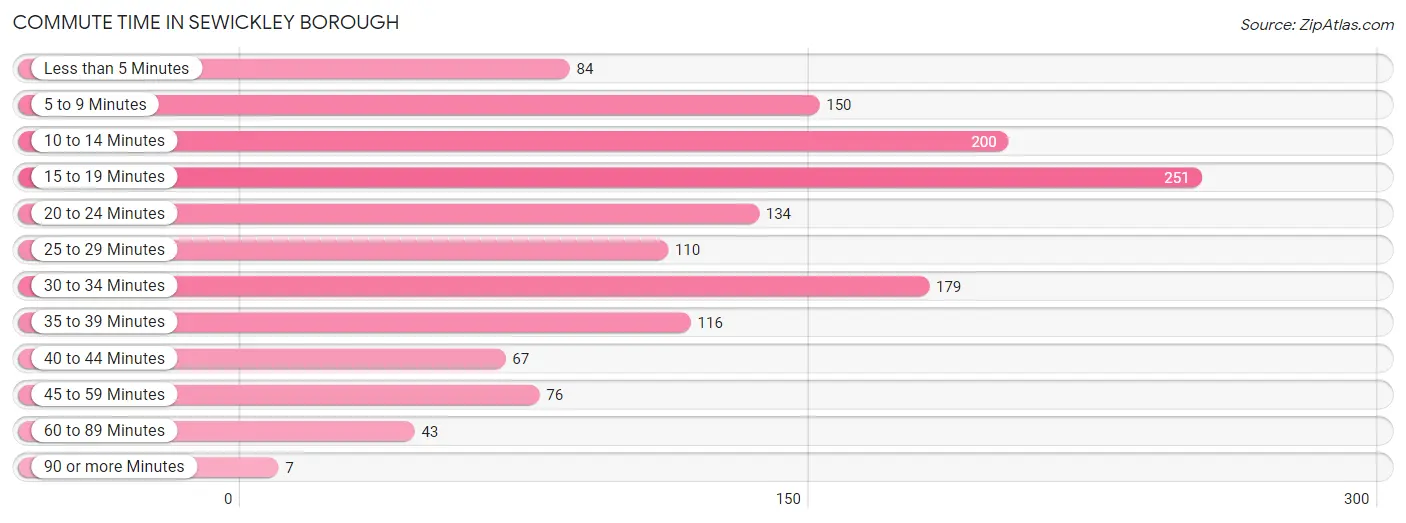
| Commute Time | # Commuters | % Commuters |
| Less than 5 Minutes | 84 | 5.9% |
| 5 to 9 Minutes | 150 | 10.6% |
| 10 to 14 Minutes | 200 | 14.1% |
| 15 to 19 Minutes | 251 | 17.7% |
| 20 to 24 Minutes | 134 | 9.5% |
| 25 to 29 Minutes | 110 | 7.8% |
| 30 to 34 Minutes | 179 | 12.6% |
| 35 to 39 Minutes | 116 | 8.2% |
| 40 to 44 Minutes | 67 | 4.7% |
| 45 to 59 Minutes | 76 | 5.4% |
| 60 to 89 Minutes | 43 | 3.0% |
| 90 or more Minutes | 7 | 0.5% |
Commute Time by Sex in Sewickley borough
The most common commute times in Sewickley borough are 30 to 34 minutes (142 commuters, 21.6%) for males and 15 to 19 minutes (182 commuters, 24.0%) for females.
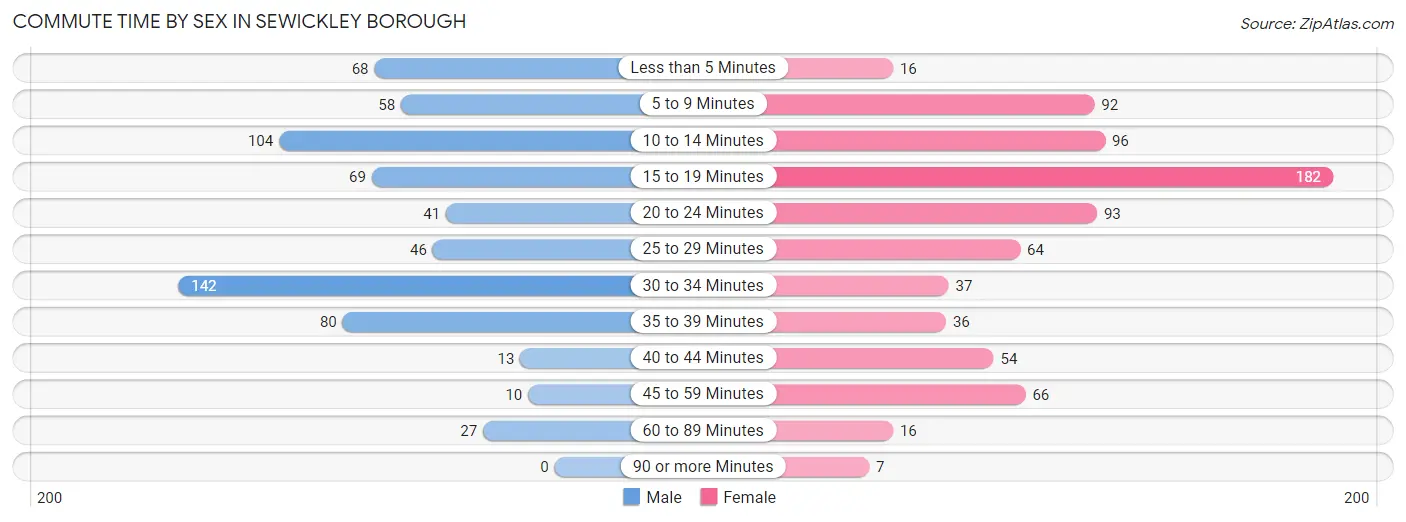
| Commute Time | Male | Female |
| Less than 5 Minutes | 68 (10.3%) | 16 (2.1%) |
| 5 to 9 Minutes | 58 (8.8%) | 92 (12.1%) |
| 10 to 14 Minutes | 104 (15.8%) | 96 (12.7%) |
| 15 to 19 Minutes | 69 (10.5%) | 182 (24.0%) |
| 20 to 24 Minutes | 41 (6.2%) | 93 (12.2%) |
| 25 to 29 Minutes | 46 (7.0%) | 64 (8.4%) |
| 30 to 34 Minutes | 142 (21.6%) | 37 (4.9%) |
| 35 to 39 Minutes | 80 (12.2%) | 36 (4.7%) |
| 40 to 44 Minutes | 13 (2.0%) | 54 (7.1%) |
| 45 to 59 Minutes | 10 (1.5%) | 66 (8.7%) |
| 60 to 89 Minutes | 27 (4.1%) | 16 (2.1%) |
| 90 or more Minutes | 0 (0.0%) | 7 (0.9%) |
Time of Departure to Work by Sex in Sewickley borough
The most frequent times of departure to work in Sewickley borough are 7:00 AM to 7:29 AM (93, 14.1%) for males and 7:00 AM to 7:29 AM (149, 19.6%) for females.
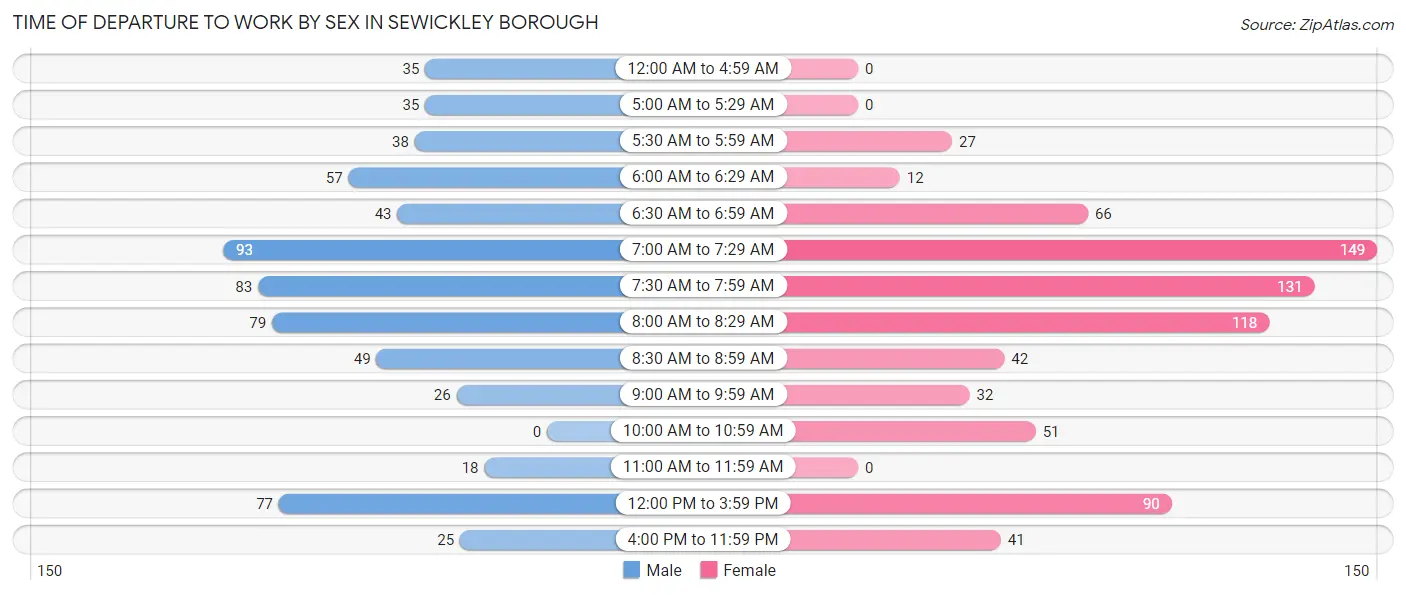
| Time of Departure | Male | Female |
| 12:00 AM to 4:59 AM | 35 (5.3%) | 0 (0.0%) |
| 5:00 AM to 5:29 AM | 35 (5.3%) | 0 (0.0%) |
| 5:30 AM to 5:59 AM | 38 (5.8%) | 27 (3.6%) |
| 6:00 AM to 6:29 AM | 57 (8.7%) | 12 (1.6%) |
| 6:30 AM to 6:59 AM | 43 (6.5%) | 66 (8.7%) |
| 7:00 AM to 7:29 AM | 93 (14.1%) | 149 (19.6%) |
| 7:30 AM to 7:59 AM | 83 (12.6%) | 131 (17.3%) |
| 8:00 AM to 8:29 AM | 79 (12.0%) | 118 (15.5%) |
| 8:30 AM to 8:59 AM | 49 (7.4%) | 42 (5.5%) |
| 9:00 AM to 9:59 AM | 26 (4.0%) | 32 (4.2%) |
| 10:00 AM to 10:59 AM | 0 (0.0%) | 51 (6.7%) |
| 11:00 AM to 11:59 AM | 18 (2.7%) | 0 (0.0%) |
| 12:00 PM to 3:59 PM | 77 (11.7%) | 90 (11.9%) |
| 4:00 PM to 11:59 PM | 25 (3.8%) | 41 (5.4%) |
| Total | 658 (100.0%) | 759 (100.0%) |
Housing Occupancy in Sewickley borough
Occupancy by Ownership in Sewickley borough
Of the total 1,663 dwellings in Sewickley borough, owner-occupied units account for 1,085 (65.2%), while renter-occupied units make up 578 (34.8%).
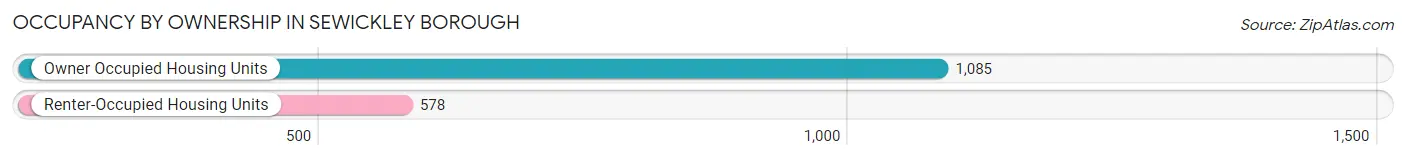
| Occupancy | # Housing Units | % Housing Units |
| Owner Occupied Housing Units | 1,085 | 65.2% |
| Renter-Occupied Housing Units | 578 | 34.8% |
| Total Occupied Housing Units | 1,663 | 100.0% |
Occupancy by Household Size in Sewickley borough
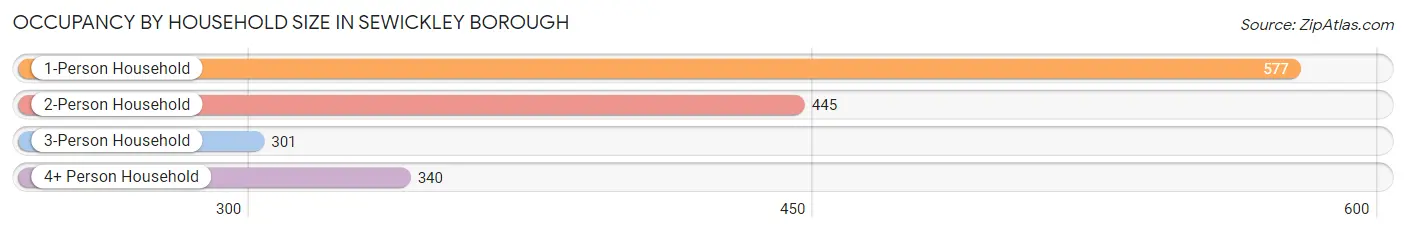
| Household Size | # Housing Units | % Housing Units |
| 1-Person Household | 577 | 34.7% |
| 2-Person Household | 445 | 26.8% |
| 3-Person Household | 301 | 18.1% |
| 4+ Person Household | 340 | 20.4% |
| Total Housing Units | 1,663 | 100.0% |
Occupancy by Ownership by Household Size in Sewickley borough
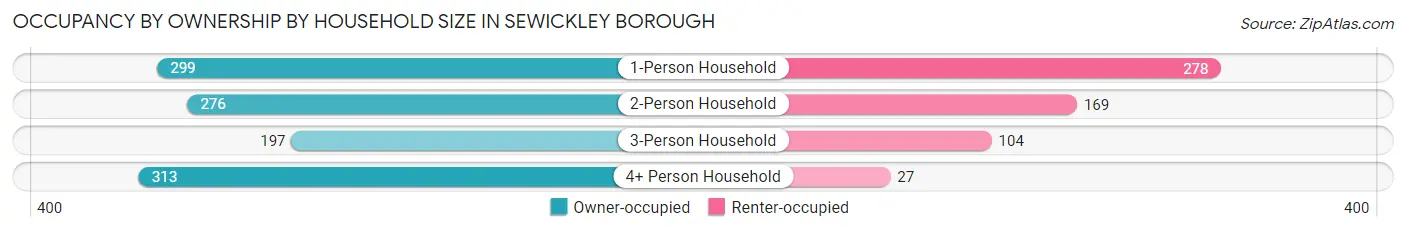
| Household Size | Owner-occupied | Renter-occupied |
| 1-Person Household | 299 (51.8%) | 278 (48.2%) |
| 2-Person Household | 276 (62.0%) | 169 (38.0%) |
| 3-Person Household | 197 (65.4%) | 104 (34.5%) |
| 4+ Person Household | 313 (92.1%) | 27 (7.9%) |
| Total Housing Units | 1,085 (65.2%) | 578 (34.8%) |
Occupancy by Educational Attainment in Sewickley borough
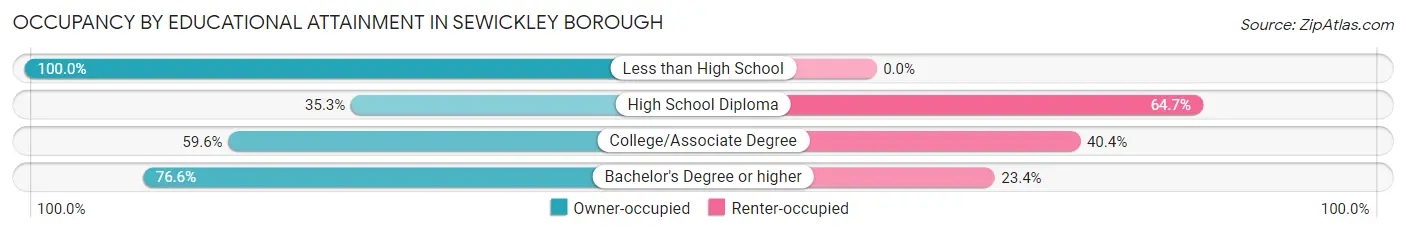
| Household Size | Owner-occupied | Renter-occupied |
| Less than High School | 30 (100.0%) | 0 (0.0%) |
| High School Diploma | 110 (35.3%) | 202 (64.7%) |
| College/Associate Degree | 233 (59.6%) | 158 (40.4%) |
| Bachelor's Degree or higher | 712 (76.6%) | 218 (23.4%) |
Occupancy by Age of Householder in Sewickley borough
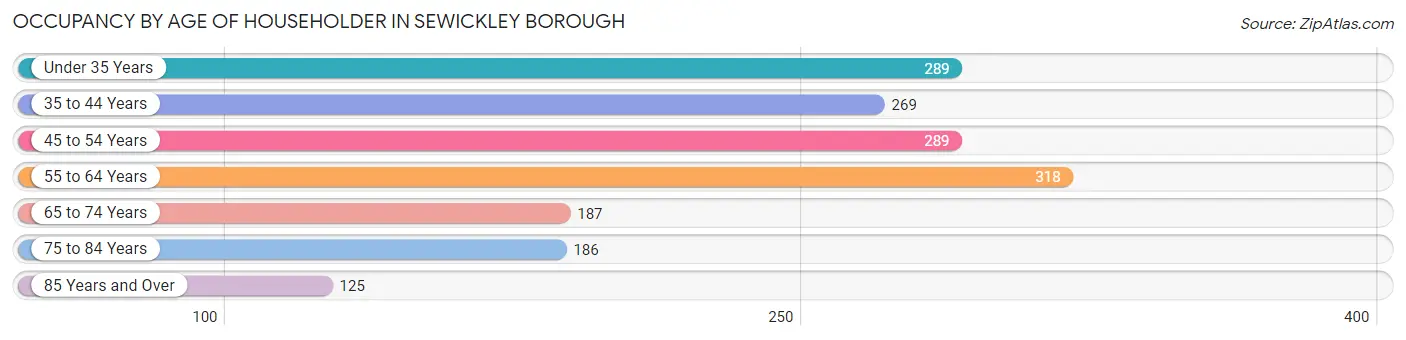
| Age Bracket | # Households | % Households |
| Under 35 Years | 289 | 17.4% |
| 35 to 44 Years | 269 | 16.2% |
| 45 to 54 Years | 289 | 17.4% |
| 55 to 64 Years | 318 | 19.1% |
| 65 to 74 Years | 187 | 11.2% |
| 75 to 84 Years | 186 | 11.2% |
| 85 Years and Over | 125 | 7.5% |
| Total | 1,663 | 100.0% |
Housing Finances in Sewickley borough
Median Income by Occupancy in Sewickley borough
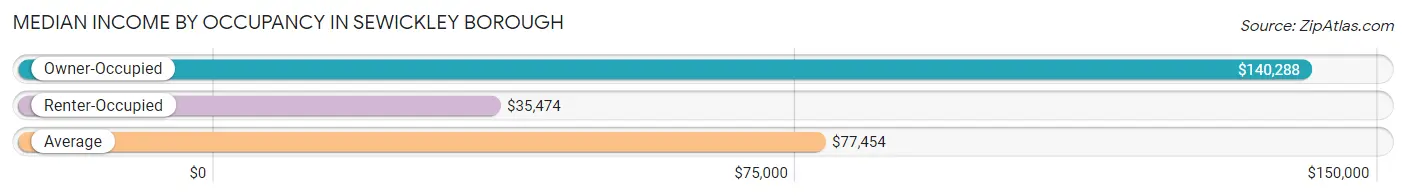
| Occupancy Type | # Households | Median Income |
| Owner-Occupied | 1,085 (65.2%) | $140,288 |
| Renter-Occupied | 578 (34.8%) | $35,474 |
| Average | 1,663 (100.0%) | $77,454 |
Occupancy by Householder Income Bracket in Sewickley borough
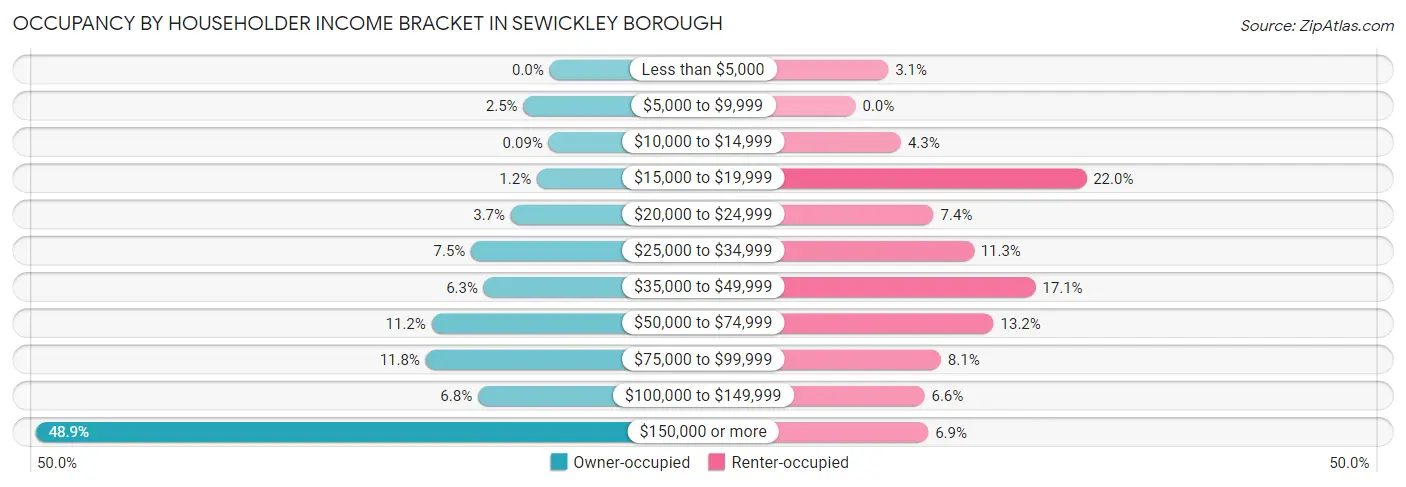
| Income Bracket | Owner-occupied | Renter-occupied |
| Less than $5,000 | 0 (0.0%) | 18 (3.1%) |
| $5,000 to $9,999 | 27 (2.5%) | 0 (0.0%) |
| $10,000 to $14,999 | 1 (0.1%) | 25 (4.3%) |
| $15,000 to $19,999 | 13 (1.2%) | 127 (22.0%) |
| $20,000 to $24,999 | 40 (3.7%) | 43 (7.4%) |
| $25,000 to $34,999 | 81 (7.5%) | 65 (11.3%) |
| $35,000 to $49,999 | 68 (6.3%) | 99 (17.1%) |
| $50,000 to $74,999 | 122 (11.2%) | 76 (13.2%) |
| $75,000 to $99,999 | 128 (11.8%) | 47 (8.1%) |
| $100,000 to $149,999 | 74 (6.8%) | 38 (6.6%) |
| $150,000 or more | 531 (48.9%) | 40 (6.9%) |
| Total | 1,085 (100.0%) | 578 (100.0%) |
Monthly Housing Cost Tiers in Sewickley borough
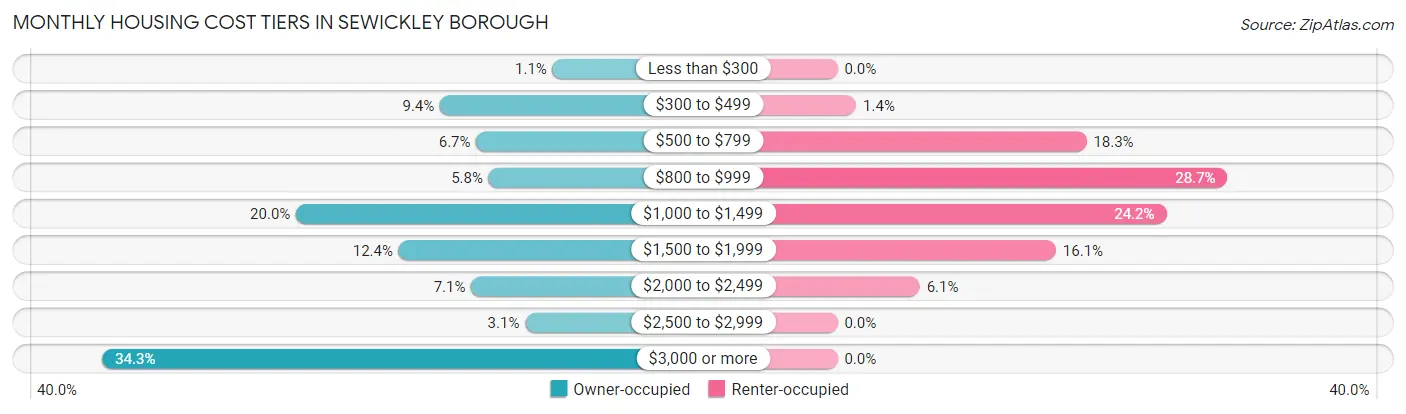
| Monthly Cost | Owner-occupied | Renter-occupied |
| Less than $300 | 12 (1.1%) | 0 (0.0%) |
| $300 to $499 | 102 (9.4%) | 8 (1.4%) |
| $500 to $799 | 73 (6.7%) | 106 (18.3%) |
| $800 to $999 | 63 (5.8%) | 166 (28.7%) |
| $1,000 to $1,499 | 217 (20.0%) | 140 (24.2%) |
| $1,500 to $1,999 | 135 (12.4%) | 93 (16.1%) |
| $2,000 to $2,499 | 77 (7.1%) | 35 (6.1%) |
| $2,500 to $2,999 | 34 (3.1%) | 0 (0.0%) |
| $3,000 or more | 372 (34.3%) | 0 (0.0%) |
| Total | 1,085 (100.0%) | 578 (100.0%) |
Physical Housing Characteristics in Sewickley borough
Housing Structures in Sewickley borough
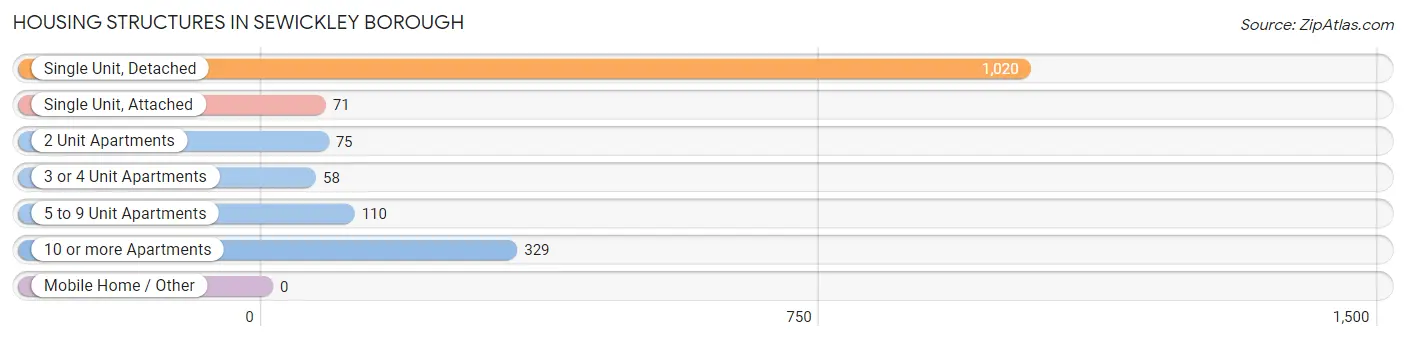
| Structure Type | # Housing Units | % Housing Units |
| Single Unit, Detached | 1,020 | 61.3% |
| Single Unit, Attached | 71 | 4.3% |
| 2 Unit Apartments | 75 | 4.5% |
| 3 or 4 Unit Apartments | 58 | 3.5% |
| 5 to 9 Unit Apartments | 110 | 6.6% |
| 10 or more Apartments | 329 | 19.8% |
| Mobile Home / Other | 0 | 0.0% |
| Total | 1,663 | 100.0% |
Housing Structures by Occupancy in Sewickley borough
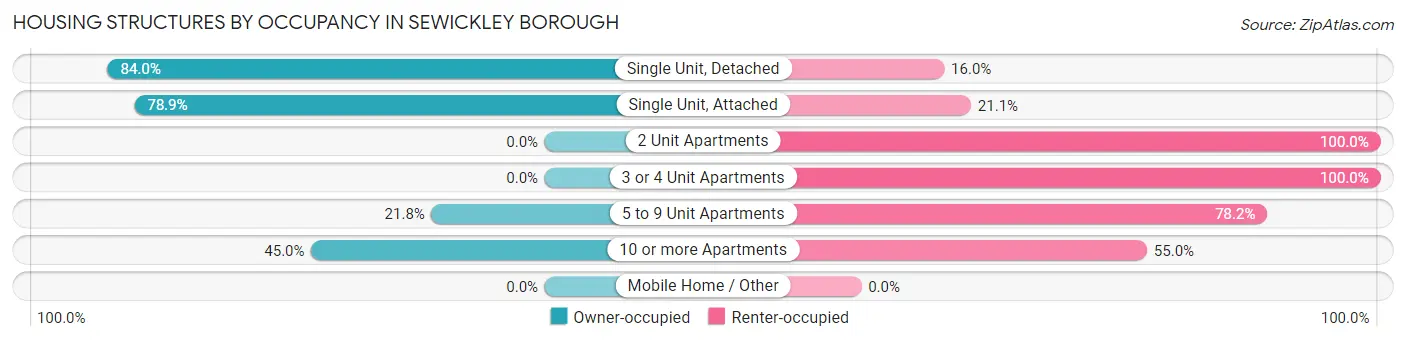
| Structure Type | Owner-occupied | Renter-occupied |
| Single Unit, Detached | 857 (84.0%) | 163 (16.0%) |
| Single Unit, Attached | 56 (78.9%) | 15 (21.1%) |
| 2 Unit Apartments | 0 (0.0%) | 75 (100.0%) |
| 3 or 4 Unit Apartments | 0 (0.0%) | 58 (100.0%) |
| 5 to 9 Unit Apartments | 24 (21.8%) | 86 (78.2%) |
| 10 or more Apartments | 148 (45.0%) | 181 (55.0%) |
| Mobile Home / Other | 0 (0.0%) | 0 (0.0%) |
| Total | 1,085 (65.2%) | 578 (34.8%) |
Housing Structures by Number of Rooms in Sewickley borough
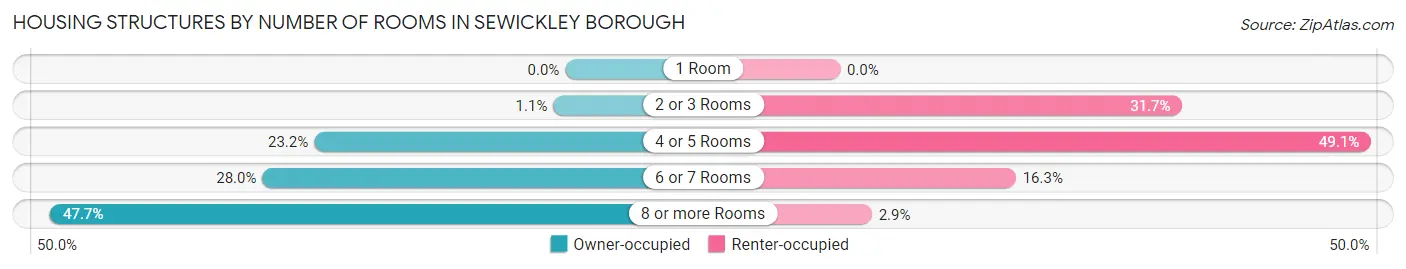
| Number of Rooms | Owner-occupied | Renter-occupied |
| 1 Room | 0 (0.0%) | 0 (0.0%) |
| 2 or 3 Rooms | 12 (1.1%) | 183 (31.7%) |
| 4 or 5 Rooms | 252 (23.2%) | 284 (49.1%) |
| 6 or 7 Rooms | 304 (28.0%) | 94 (16.3%) |
| 8 or more Rooms | 517 (47.6%) | 17 (2.9%) |
| Total | 1,085 (100.0%) | 578 (100.0%) |
Housing Structure by Heating Type in Sewickley borough
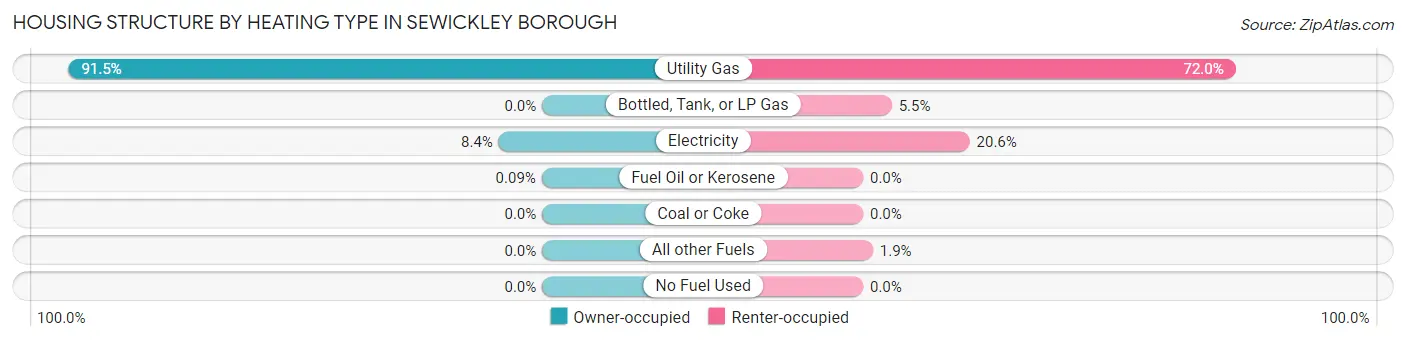
| Heating Type | Owner-occupied | Renter-occupied |
| Utility Gas | 993 (91.5%) | 416 (72.0%) |
| Bottled, Tank, or LP Gas | 0 (0.0%) | 32 (5.5%) |
| Electricity | 91 (8.4%) | 119 (20.6%) |
| Fuel Oil or Kerosene | 1 (0.1%) | 0 (0.0%) |
| Coal or Coke | 0 (0.0%) | 0 (0.0%) |
| All other Fuels | 0 (0.0%) | 11 (1.9%) |
| No Fuel Used | 0 (0.0%) | 0 (0.0%) |
| Total | 1,085 (100.0%) | 578 (100.0%) |
Household Vehicle Usage in Sewickley borough
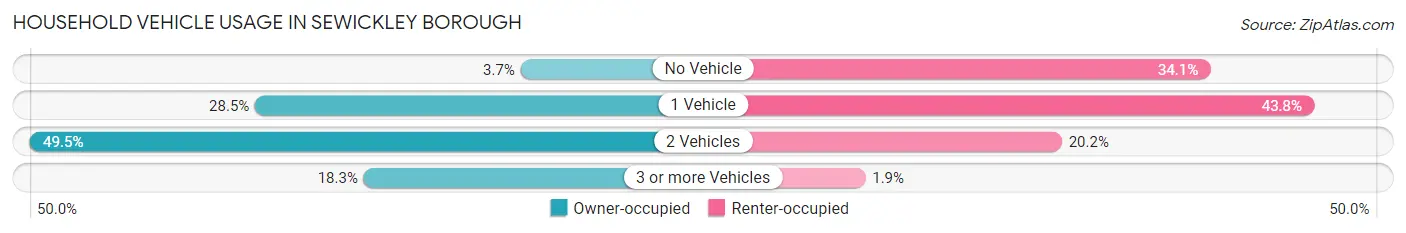
| Vehicles per Household | Owner-occupied | Renter-occupied |
| No Vehicle | 40 (3.7%) | 197 (34.1%) |
| 1 Vehicle | 309 (28.5%) | 253 (43.8%) |
| 2 Vehicles | 537 (49.5%) | 117 (20.2%) |
| 3 or more Vehicles | 199 (18.3%) | 11 (1.9%) |
| Total | 1,085 (100.0%) | 578 (100.0%) |
Real Estate & Mortgages in Sewickley borough
Real Estate and Mortgage Overview in Sewickley borough
| Characteristic | Without Mortgage | With Mortgage |
| Housing Units | 423 | 662 |
| Median Property Value | $325,000 | $580,600 |
| Median Household Income | $69,353 | $401 |
| Monthly Housing Costs | $1,004 | $364 |
| Real Estate Taxes | $3,705 | $8 |
Property Value by Mortgage Status in Sewickley borough
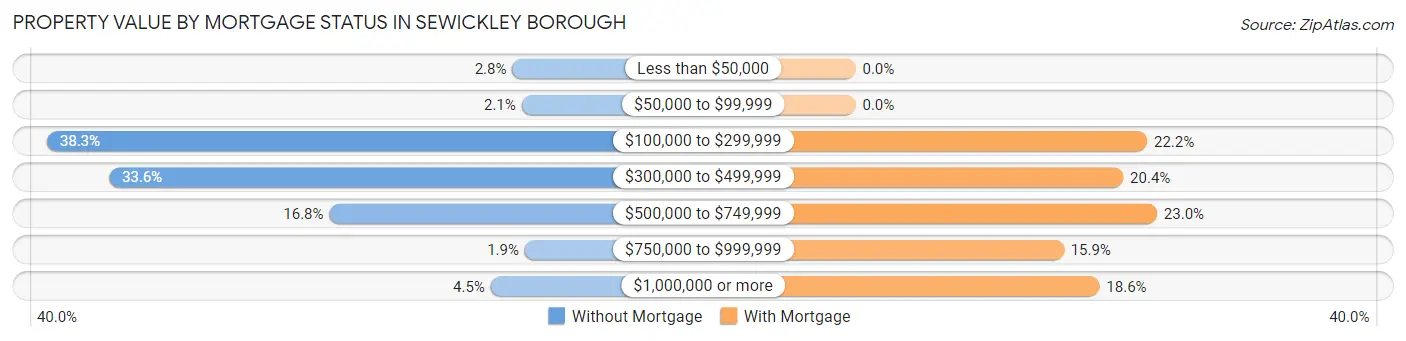
| Property Value | Without Mortgage | With Mortgage |
| Less than $50,000 | 12 (2.8%) | 0 (0.0%) |
| $50,000 to $99,999 | 9 (2.1%) | 0 (0.0%) |
| $100,000 to $299,999 | 162 (38.3%) | 147 (22.2%) |
| $300,000 to $499,999 | 142 (33.6%) | 135 (20.4%) |
| $500,000 to $749,999 | 71 (16.8%) | 152 (23.0%) |
| $750,000 to $999,999 | 8 (1.9%) | 105 (15.9%) |
| $1,000,000 or more | 19 (4.5%) | 123 (18.6%) |
| Total | 423 (100.0%) | 662 (100.0%) |
Household Income by Mortgage Status in Sewickley borough
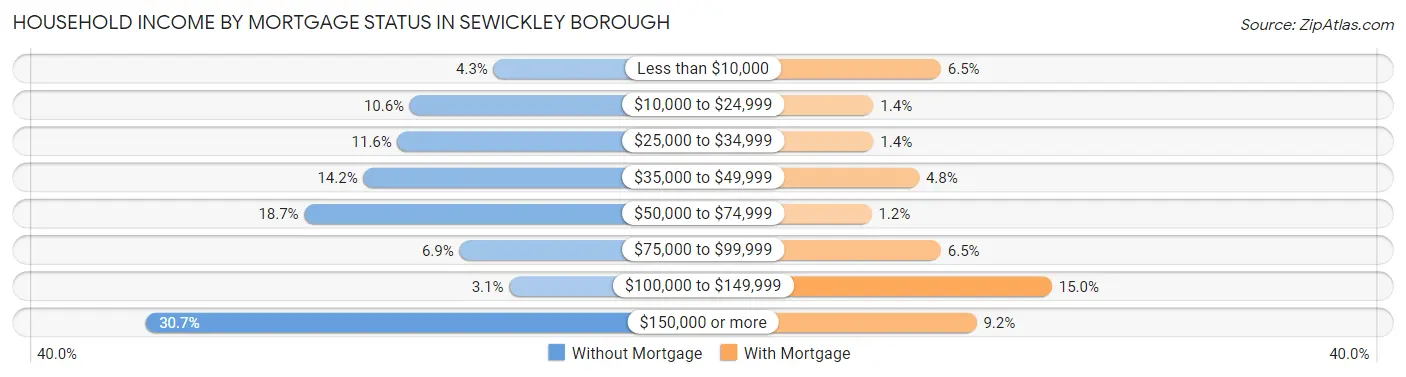
| Household Income | Without Mortgage | With Mortgage |
| Less than $10,000 | 18 (4.3%) | 43 (6.5%) |
| $10,000 to $24,999 | 45 (10.6%) | 9 (1.4%) |
| $25,000 to $34,999 | 49 (11.6%) | 9 (1.4%) |
| $35,000 to $49,999 | 60 (14.2%) | 32 (4.8%) |
| $50,000 to $74,999 | 79 (18.7%) | 8 (1.2%) |
| $75,000 to $99,999 | 29 (6.9%) | 43 (6.5%) |
| $100,000 to $149,999 | 13 (3.1%) | 99 (14.9%) |
| $150,000 or more | 130 (30.7%) | 61 (9.2%) |
| Total | 423 (100.0%) | 662 (100.0%) |
Property Value to Household Income Ratio in Sewickley borough
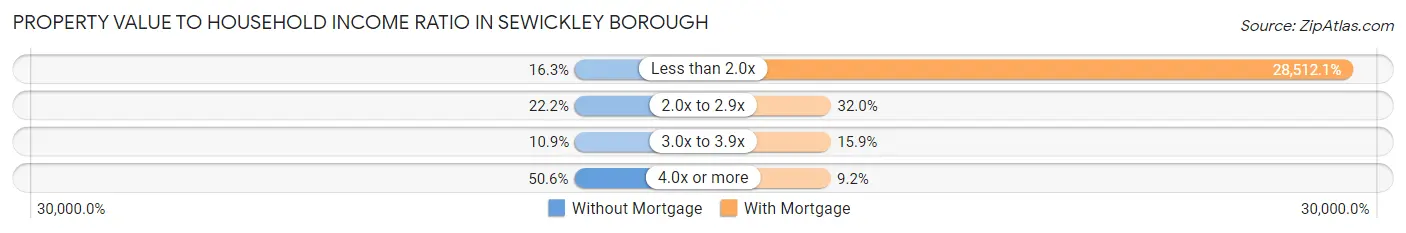
| Value-to-Income Ratio | Without Mortgage | With Mortgage |
| Less than 2.0x | 69 (16.3%) | 188,750 (28,512.1%) |
| 2.0x to 2.9x | 94 (22.2%) | 212 (32.0%) |
| 3.0x to 3.9x | 46 (10.9%) | 105 (15.9%) |
| 4.0x or more | 214 (50.6%) | 61 (9.2%) |
| Total | 423 (100.0%) | 662 (100.0%) |
Real Estate Taxes by Mortgage Status in Sewickley borough
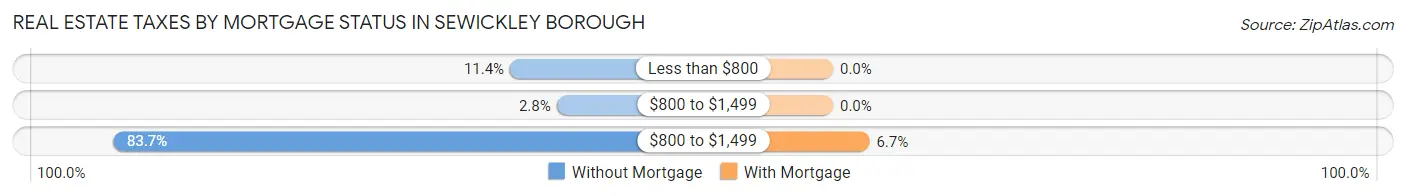
| Property Taxes | Without Mortgage | With Mortgage |
| Less than $800 | 48 (11.4%) | 0 (0.0%) |
| $800 to $1,499 | 12 (2.8%) | 0 (0.0%) |
| $800 to $1,499 | 354 (83.7%) | 44 (6.7%) |
| Total | 423 (100.0%) | 662 (100.0%) |
Health & Disability in Sewickley borough
Health Insurance Coverage by Age in Sewickley borough
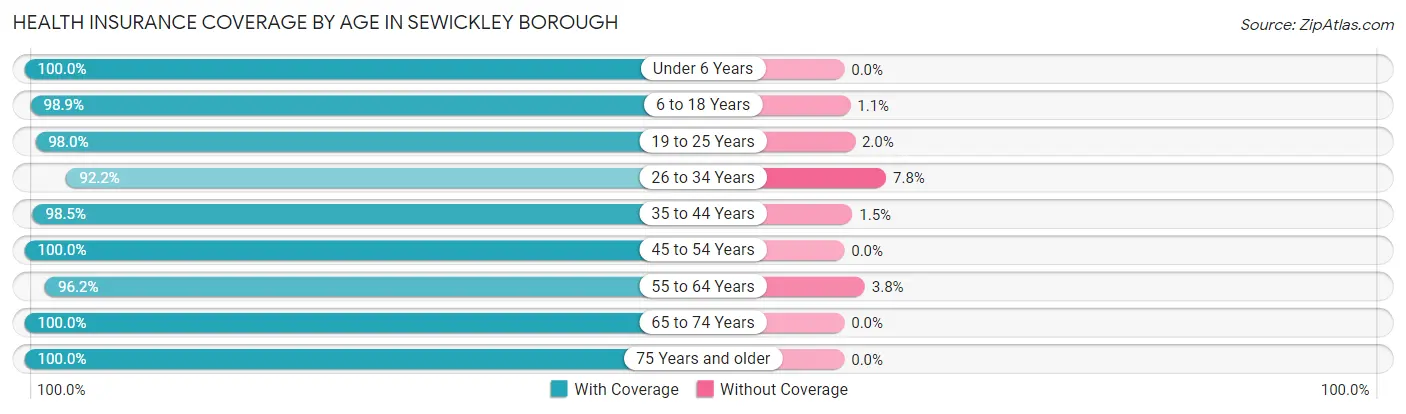
| Age Bracket | With Coverage | Without Coverage |
| Under 6 Years | 282 (100.0%) | 0 (0.0%) |
| 6 to 18 Years | 701 (98.9%) | 8 (1.1%) |
| 19 to 25 Years | 295 (98.0%) | 6 (2.0%) |
| 26 to 34 Years | 390 (92.2%) | 33 (7.8%) |
| 35 to 44 Years | 460 (98.5%) | 7 (1.5%) |
| 45 to 54 Years | 516 (100.0%) | 0 (0.0%) |
| 55 to 64 Years | 452 (96.2%) | 18 (3.8%) |
| 65 to 74 Years | 275 (100.0%) | 0 (0.0%) |
| 75 Years and older | 430 (100.0%) | 0 (0.0%) |
| Total | 3,801 (98.1%) | 72 (1.9%) |
Health Insurance Coverage by Citizenship Status in Sewickley borough
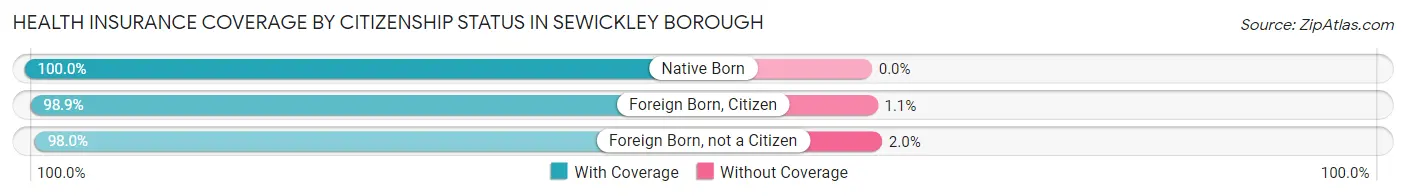
| Citizenship Status | With Coverage | Without Coverage |
| Native Born | 282 (100.0%) | 0 (0.0%) |
| Foreign Born, Citizen | 701 (98.9%) | 8 (1.1%) |
| Foreign Born, not a Citizen | 295 (98.0%) | 6 (2.0%) |
Health Insurance Coverage by Household Income in Sewickley borough
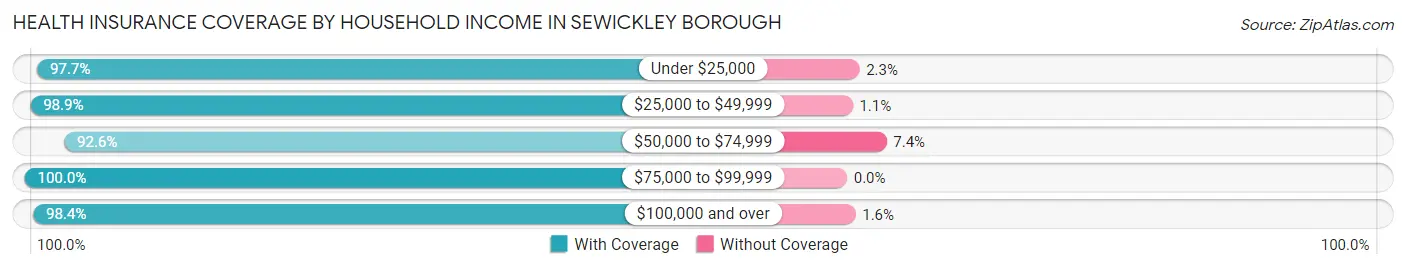
| Household Income | With Coverage | Without Coverage |
| Under $25,000 | 461 (97.7%) | 11 (2.3%) |
| $25,000 to $49,999 | 561 (98.9%) | 6 (1.1%) |
| $50,000 to $74,999 | 275 (92.6%) | 22 (7.4%) |
| $75,000 to $99,999 | 451 (100.0%) | 0 (0.0%) |
| $100,000 and over | 2,046 (98.4%) | 33 (1.6%) |
Public vs Private Health Insurance Coverage by Age in Sewickley borough
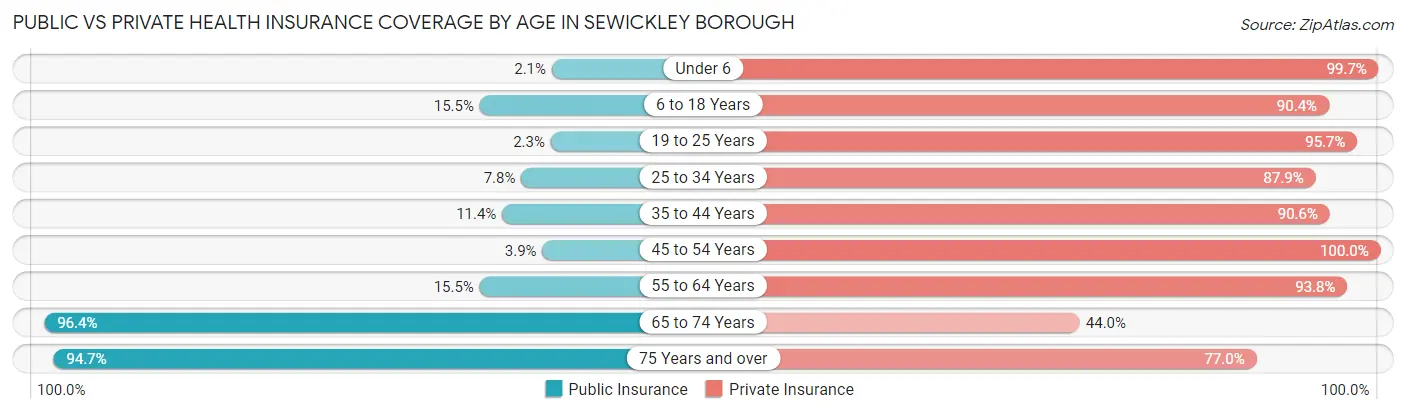
| Age Bracket | Public Insurance | Private Insurance |
| Under 6 | 6 (2.1%) | 281 (99.7%) |
| 6 to 18 Years | 110 (15.5%) | 641 (90.4%) |
| 19 to 25 Years | 7 (2.3%) | 288 (95.7%) |
| 25 to 34 Years | 33 (7.8%) | 372 (87.9%) |
| 35 to 44 Years | 53 (11.4%) | 423 (90.6%) |
| 45 to 54 Years | 20 (3.9%) | 516 (100.0%) |
| 55 to 64 Years | 73 (15.5%) | 441 (93.8%) |
| 65 to 74 Years | 265 (96.4%) | 121 (44.0%) |
| 75 Years and over | 407 (94.7%) | 331 (77.0%) |
| Total | 974 (25.2%) | 3,414 (88.1%) |
Disability Status by Sex by Age in Sewickley borough
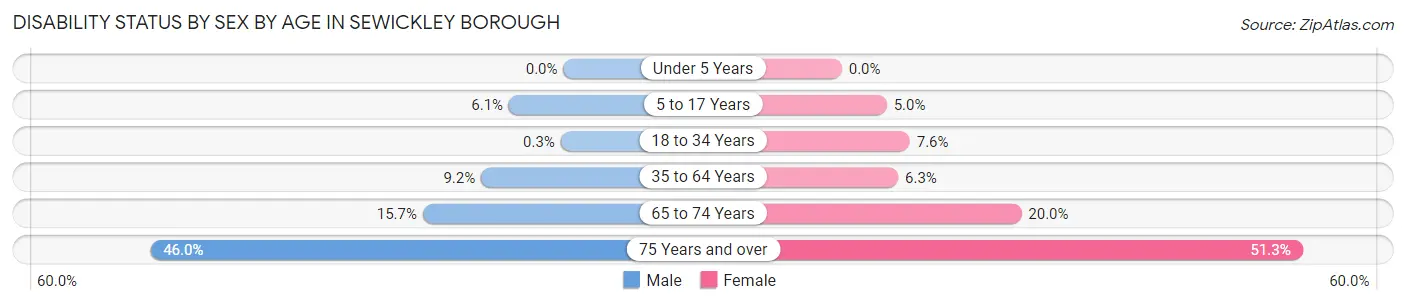
| Age Bracket | Male | Female |
| Under 5 Years | 0 (0.0%) | 0 (0.0%) |
| 5 to 17 Years | 22 (6.1%) | 17 (5.0%) |
| 18 to 34 Years | 1 (0.3%) | 33 (7.6%) |
| 35 to 64 Years | 63 (9.2%) | 48 (6.3%) |
| 65 to 74 Years | 18 (15.7%) | 32 (20.0%) |
| 75 Years and over | 75 (46.0%) | 137 (51.3%) |
Disability Class by Sex by Age in Sewickley borough
Disability Class: Hearing Difficulty
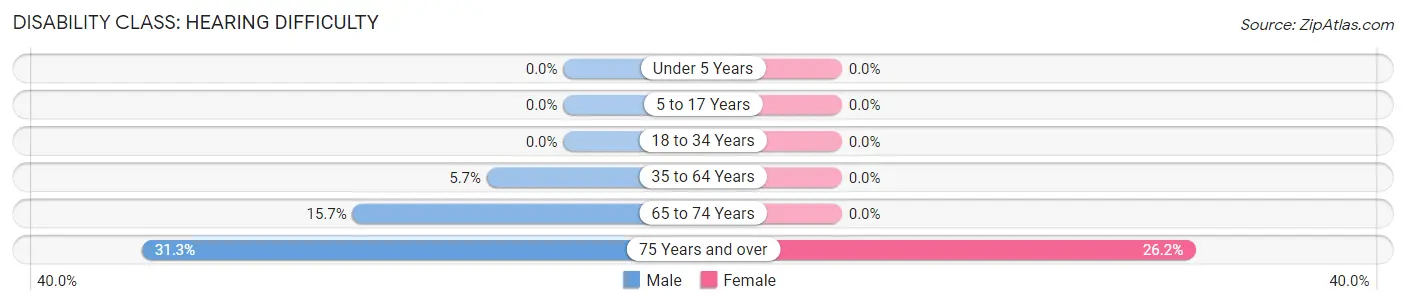
| Age Bracket | Male | Female |
| Under 5 Years | 0 (0.0%) | 0 (0.0%) |
| 5 to 17 Years | 0 (0.0%) | 0 (0.0%) |
| 18 to 34 Years | 0 (0.0%) | 0 (0.0%) |
| 35 to 64 Years | 39 (5.7%) | 0 (0.0%) |
| 65 to 74 Years | 18 (15.7%) | 0 (0.0%) |
| 75 Years and over | 51 (31.3%) | 70 (26.2%) |
Disability Class: Vision Difficulty
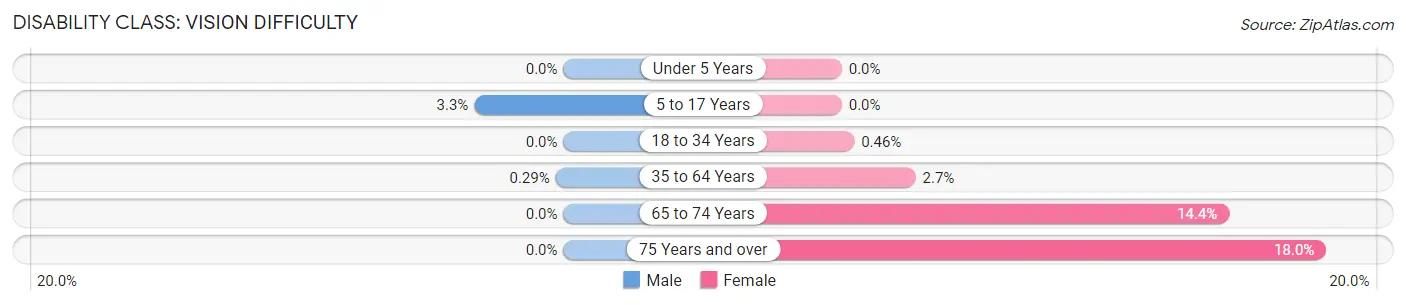
| Age Bracket | Male | Female |
| Under 5 Years | 0 (0.0%) | 0 (0.0%) |
| 5 to 17 Years | 12 (3.3%) | 0 (0.0%) |
| 18 to 34 Years | 0 (0.0%) | 2 (0.5%) |
| 35 to 64 Years | 2 (0.3%) | 21 (2.7%) |
| 65 to 74 Years | 0 (0.0%) | 23 (14.4%) |
| 75 Years and over | 0 (0.0%) | 48 (18.0%) |
Disability Class: Cognitive Difficulty
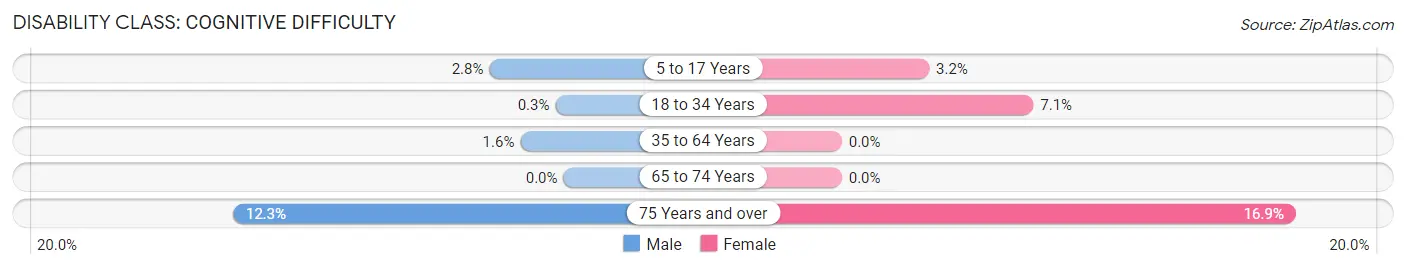
| Age Bracket | Male | Female |
| 5 to 17 Years | 10 (2.8%) | 11 (3.2%) |
| 18 to 34 Years | 1 (0.3%) | 31 (7.1%) |
| 35 to 64 Years | 11 (1.6%) | 0 (0.0%) |
| 65 to 74 Years | 0 (0.0%) | 0 (0.0%) |
| 75 Years and over | 20 (12.3%) | 45 (16.9%) |
Disability Class: Ambulatory Difficulty
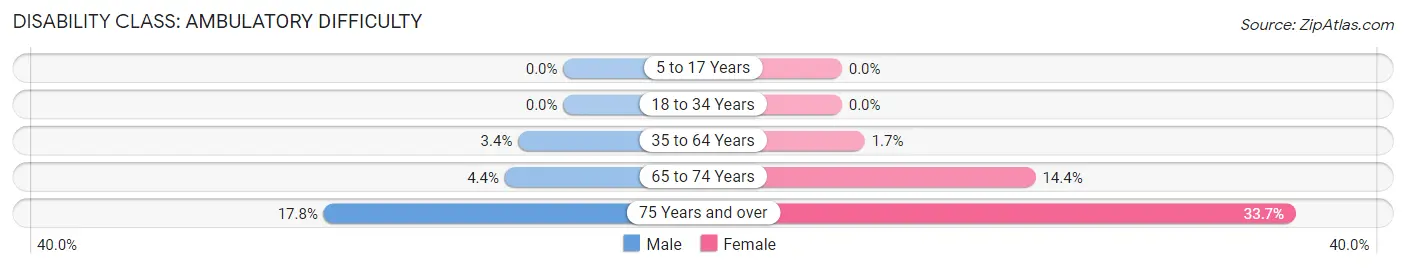
| Age Bracket | Male | Female |
| 5 to 17 Years | 0 (0.0%) | 0 (0.0%) |
| 18 to 34 Years | 0 (0.0%) | 0 (0.0%) |
| 35 to 64 Years | 23 (3.4%) | 13 (1.7%) |
| 65 to 74 Years | 5 (4.3%) | 23 (14.4%) |
| 75 Years and over | 29 (17.8%) | 90 (33.7%) |
Disability Class: Self-Care Difficulty
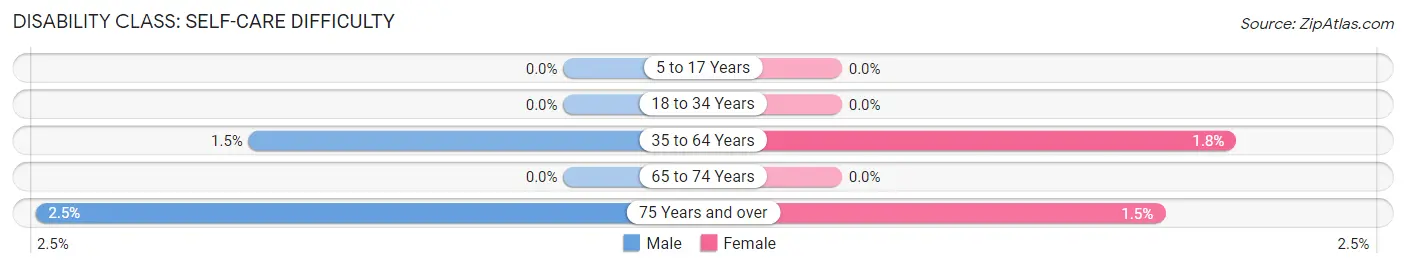
| Age Bracket | Male | Female |
| 5 to 17 Years | 0 (0.0%) | 0 (0.0%) |
| 18 to 34 Years | 0 (0.0%) | 0 (0.0%) |
| 35 to 64 Years | 10 (1.5%) | 14 (1.8%) |
| 65 to 74 Years | 0 (0.0%) | 0 (0.0%) |
| 75 Years and over | 4 (2.5%) | 4 (1.5%) |
Technology Access in Sewickley borough
Computing Device Access in Sewickley borough
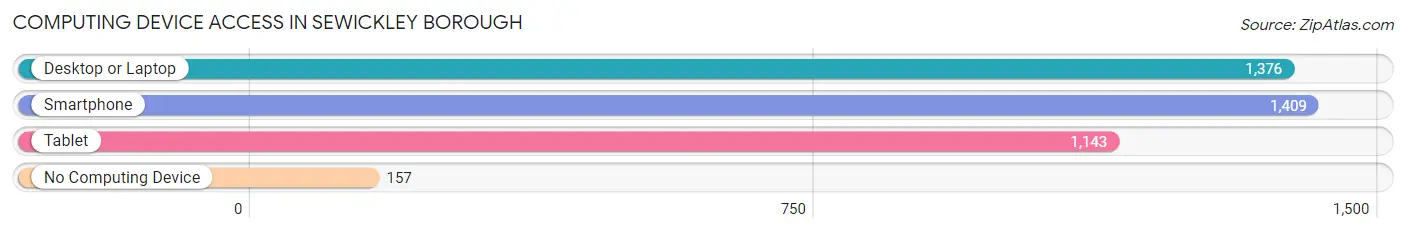
| Device Type | # Households | % Households |
| Desktop or Laptop | 1,376 | 82.7% |
| Smartphone | 1,409 | 84.7% |
| Tablet | 1,143 | 68.7% |
| No Computing Device | 157 | 9.4% |
| Total | 1,663 | 100.0% |
Internet Access in Sewickley borough
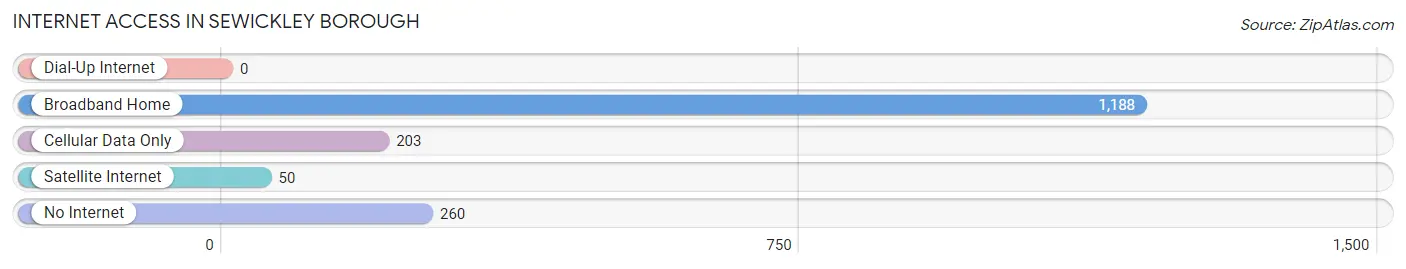
| Internet Type | # Households | % Households |
| Dial-Up Internet | 0 | 0.0% |
| Broadband Home | 1,188 | 71.4% |
| Cellular Data Only | 203 | 12.2% |
| Satellite Internet | 50 | 3.0% |
| No Internet | 260 | 15.6% |
| Total | 1,663 | 100.0% |
Sewickley borough Summary
Sewickley Borough is a small borough located in Allegheny County, Pennsylvania. It is situated along the Ohio River, approximately 15 miles northwest of Pittsburgh. The borough has a population of 3,827 as of the 2010 census, and is part of the Pittsburgh Metropolitan Statistical Area.
History
Sewickley Borough was founded in 1846 by William and Mary Sewickley, who purchased the land from the heirs of William Robinson. The Sewickleys named the area after their family name, which is derived from the German word “sickley”, meaning “willow”. The Sewickleys were Quakers, and the area was originally a farming community.
In the late 19th century, Sewickley began to develop into a residential community. Wealthy Pittsburgh families began to build large homes in the area, and the borough became known as a summer resort for the wealthy. The Sewickley Valley Railroad was built in 1877, connecting the borough to Pittsburgh.
In the early 20th century, Sewickley became a popular destination for wealthy Pittsburgh families. The Sewickley Country Club was founded in 1903, and the Sewickley Yacht Club was founded in 1906. The Sewickley Carnegie Library was built in 1910, and the Sewickley Valley Hospital was built in 1912.
Geography
Sewickley Borough is located in Allegheny County, Pennsylvania. It is situated along the Ohio River, approximately 15 miles northwest of Pittsburgh. The borough has a total area of 1.2 square miles, all of which is land.
The borough is bordered by the boroughs of Edgeworth and Glen Osborne to the north, Sewickley Heights to the east, and Aleppo Township to the south and west. The Ohio River forms the western border of the borough.
Economy
The economy of Sewickley Borough is largely based on the service industry. The borough is home to a variety of restaurants, retail stores, and professional services. The Sewickley Valley Hospital is the largest employer in the borough, employing over 1,000 people.
The borough is also home to a number of small businesses, including art galleries, antique stores, and specialty shops. The Sewickley Valley Chamber of Commerce is a non-profit organization that promotes local businesses and provides resources to business owners.
Demographics
As of the 2010 census, the population of Sewickley Borough was 3,827. The racial makeup of the borough was 94.3% White, 2.2% African American, 0.3% Native American, 1.2% Asian, 0.1% Pacific Islander, 0.7% from other races, and 1.3% from two or more races. Hispanic or Latino of any race were 2.2% of the population.
The median household income in the borough was $90,945, and the median family income was $106,945. The per capita income was $45,945. About 4.3% of families and 5.3% of the population were below the poverty line, including 6.2% of those under age 18 and 4.2% of those age 65 or over.
Common Questions
What is Per Capita Income in Sewickley borough?
Per Capita income in Sewickley borough is $65,609.
What is the Median Family Income in Sewickley borough?
Median Family Income in Sewickley borough is $142,250.
What is the Median Household income in Sewickley borough?
Median Household Income in Sewickley borough is $77,454.
What is Income or Wage Gap in Sewickley borough?
Income or Wage Gap in Sewickley borough is 55.9%.
Women in Sewickley borough earn 44.1 cents for every dollar earned by a man.
What is Inequality or Gini Index in Sewickley borough?
Inequality or Gini Index in Sewickley borough is 0.57.
What is the Total Population of Sewickley borough?
Total Population of Sewickley borough is 3,873.
What is the Total Male Population of Sewickley borough?
Total Male Population of Sewickley borough is 1,808.
What is the Total Female Population of Sewickley borough?
Total Female Population of Sewickley borough is 2,065.
What is the Ratio of Males per 100 Females in Sewickley borough?
There are 87.55 Males per 100 Females in Sewickley borough.
What is the Ratio of Females per 100 Males in Sewickley borough?
There are 114.21 Females per 100 Males in Sewickley borough.
What is the Median Population Age in Sewickley borough?
Median Population Age in Sewickley borough is 39.5 Years.
What is the Average Family Size in Sewickley borough
Average Family Size in Sewickley borough is 3.0 People.
What is the Average Household Size in Sewickley borough
Average Household Size in Sewickley borough is 2.3 People.
How Large is the Labor Force in Sewickley borough?
There are 2,056 People in the Labor Forcein in Sewickley borough.
What is the Percentage of People in the Labor Force in Sewickley borough?
67.3% of People are in the Labor Force in Sewickley borough.
What is the Unemployment Rate in Sewickley borough?
Unemployment Rate in Sewickley borough is 7.4%.