Caney, KS Map & Demographics
Caney Map
Caney Overview
$23,201
PER CAPITA INCOME
$64,327
AVG FAMILY INCOME
$37,404
AVG HOUSEHOLD INCOME
43.7%
WAGE / INCOME GAP [ % ]
56.3¢/ $1
WAGE / INCOME GAP [ $ ]
0.38
INEQUALITY / GINI INDEX
1,543
TOTAL POPULATION
628
MALE POPULATION
915
FEMALE POPULATION
68.63
MALES / 100 FEMALES
145.70
FEMALES / 100 MALES
41.6
MEDIAN AGE
3.4
AVG FAMILY SIZE
2.4
AVG HOUSEHOLD SIZE
578
LABOR FORCE [ PEOPLE ]
50.2%
PERCENT IN LABOR FORCE
5.5%
UNEMPLOYMENT RATE
Caney Zip Codes
Caney Area Codes
Income in Caney
Income Overview in Caney
Per Capita Income in Caney is $23,201, while median incomes of families and households are $64,327 and $37,404 respectively.
| Characteristic | Number | Measure |
| Per Capita Income | 1,543 | $23,201 |
| Median Family Income | 345 | $64,327 |
| Mean Family Income | 345 | $67,188 |
| Median Household Income | 629 | $37,404 |
| Mean Household Income | 629 | $53,511 |
| Income Deficit | 345 | $0 |
| Wage / Income Gap (%) | 1,543 | 43.66% |
| Wage / Income Gap ($) | 1,543 | 56.34¢ per $1 |
| Gini / Inequality Index | 1,543 | 0.38 |
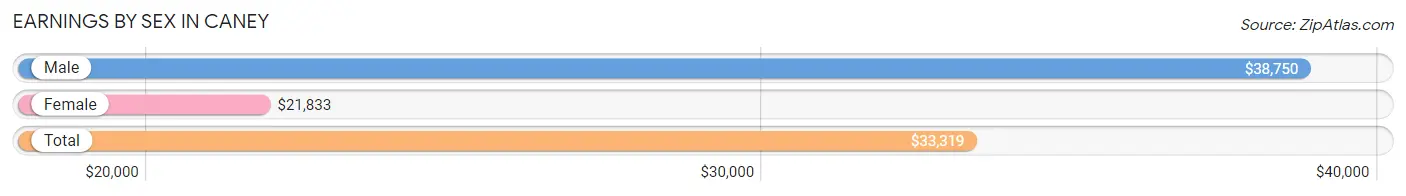
Earnings by Sex in Caney
Average Earnings in Caney are $33,319, $38,750 for men and $21,833 for women, a difference of 43.7%.
| Sex | Number | Average Earnings |
| Male | 303 (50.9%) | $38,750 |
| Female | 292 (49.1%) | $21,833 |
| Total | 595 (100.0%) | $33,319 |
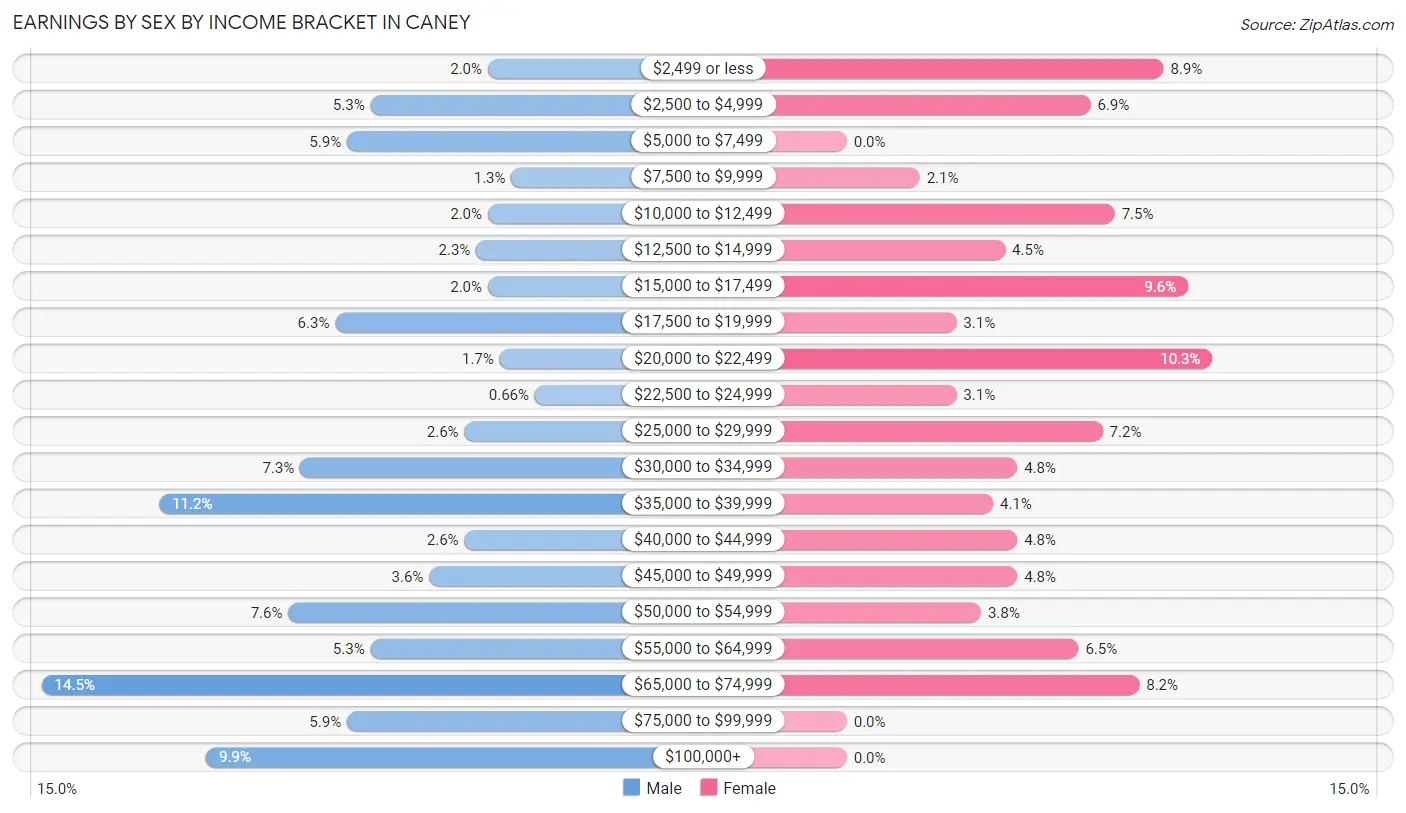
Earnings by Sex by Income Bracket in Caney
The most common earnings brackets in Caney are $65,000 to $74,999 for men (44 | 14.5%) and $20,000 to $22,499 for women (30 | 10.3%).
| Income | Male | Female |
| $2,499 or less | 6 (2.0%) | 26 (8.9%) |
| $2,500 to $4,999 | 16 (5.3%) | 20 (6.9%) |
| $5,000 to $7,499 | 18 (5.9%) | 0 (0.0%) |
| $7,500 to $9,999 | 4 (1.3%) | 6 (2.1%) |
| $10,000 to $12,499 | 6 (2.0%) | 22 (7.5%) |
| $12,500 to $14,999 | 7 (2.3%) | 13 (4.4%) |
| $15,000 to $17,499 | 6 (2.0%) | 28 (9.6%) |
| $17,500 to $19,999 | 19 (6.3%) | 9 (3.1%) |
| $20,000 to $22,499 | 5 (1.7%) | 30 (10.3%) |
| $22,500 to $24,999 | 2 (0.7%) | 9 (3.1%) |
| $25,000 to $29,999 | 8 (2.6%) | 21 (7.2%) |
| $30,000 to $34,999 | 22 (7.3%) | 14 (4.8%) |
| $35,000 to $39,999 | 34 (11.2%) | 12 (4.1%) |
| $40,000 to $44,999 | 8 (2.6%) | 14 (4.8%) |
| $45,000 to $49,999 | 11 (3.6%) | 14 (4.8%) |
| $50,000 to $54,999 | 23 (7.6%) | 11 (3.8%) |
| $55,000 to $64,999 | 16 (5.3%) | 19 (6.5%) |
| $65,000 to $74,999 | 44 (14.5%) | 24 (8.2%) |
| $75,000 to $99,999 | 18 (5.9%) | 0 (0.0%) |
| $100,000+ | 30 (9.9%) | 0 (0.0%) |
| Total | 303 (100.0%) | 292 (100.0%) |
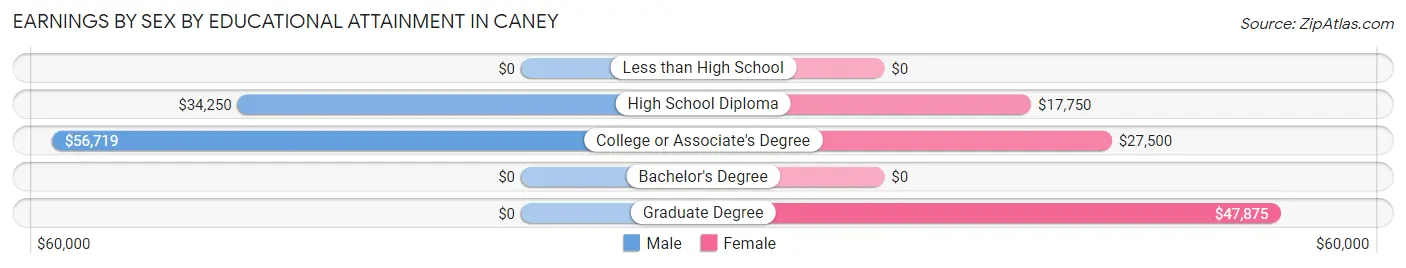
Earnings by Sex by Educational Attainment in Caney
Average earnings in Caney are $50,455 for men and $24,861 for women, a difference of 50.7%. Men with an educational attainment of college or associate's degree enjoy the highest average annual earnings of $56,719, while those with high school diploma education earn the least with $34,250. Women with an educational attainment of graduate degree earn the most with the average annual earnings of $47,875, while those with high school diploma education have the smallest earnings of $17,750.
| Educational Attainment | Male Income | Female Income |
| Less than High School | - | - |
| High School Diploma | $34,250 | $17,750 |
| College or Associate's Degree | $56,719 | $27,500 |
| Bachelor's Degree | - | - |
| Graduate Degree | - | - |
| Total | $50,455 | $24,861 |
Family Income in Caney
Family Income Brackets in Caney
According to the Caney family income data, there are 96 families falling into the $50,000 to $74,999 income range, which is the most common income bracket and makes up 27.8% of all families.
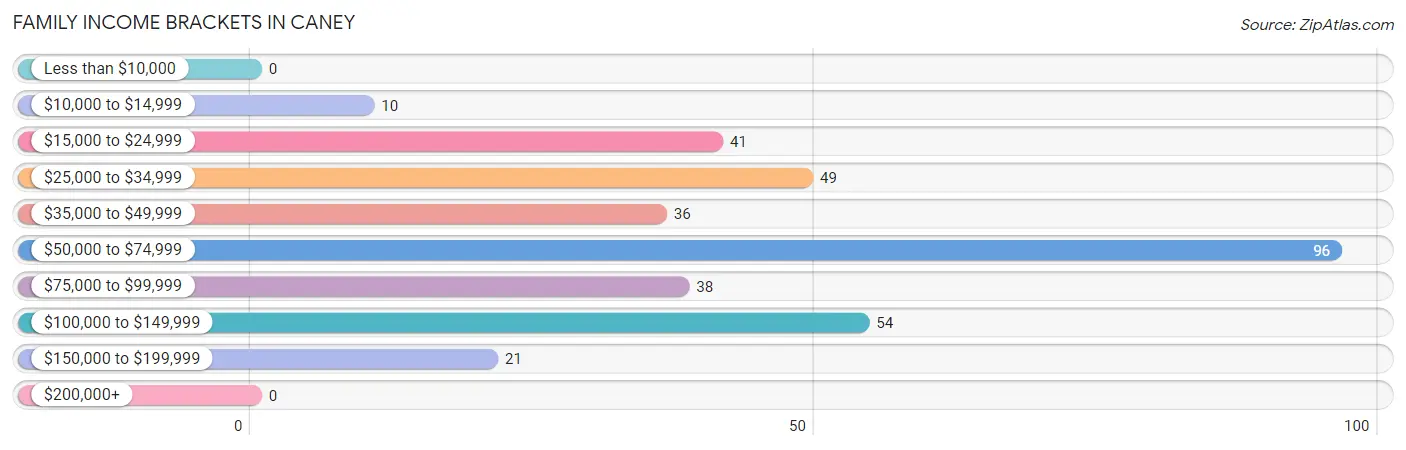
| Income Bracket | # Families | % Families |
| Less than $10,000 | 0 | 0.0% |
| $10,000 to $14,999 | 10 | 2.9% |
| $15,000 to $24,999 | 41 | 11.9% |
| $25,000 to $34,999 | 49 | 14.2% |
| $35,000 to $49,999 | 36 | 10.4% |
| $50,000 to $74,999 | 96 | 27.8% |
| $75,000 to $99,999 | 38 | 11.0% |
| $100,000 to $149,999 | 54 | 15.7% |
| $150,000 to $199,999 | 21 | 6.1% |
| $200,000+ | 0 | 0.0% |
Family Income by Famaliy Size in Caney
4-person families (35 | 10.1%) account for the highest median family income in Caney with $115,250 per family, while 4-person families (35 | 10.1%) have the highest median income of $28,812 per family member.
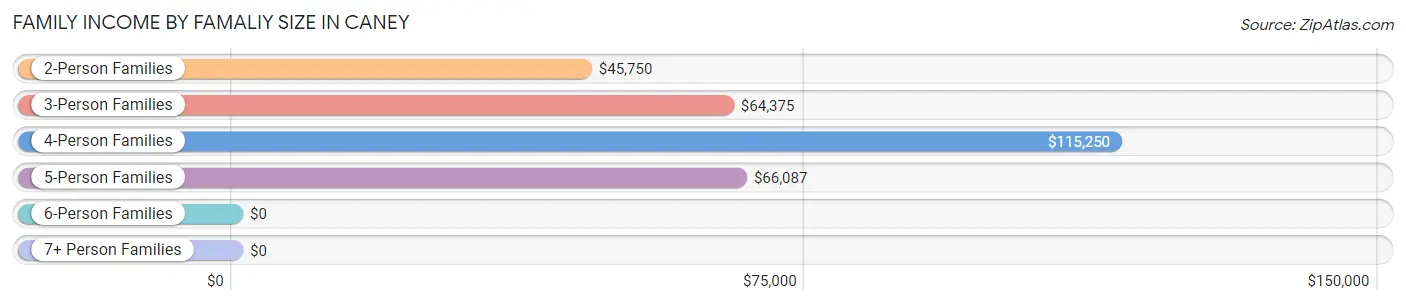
| Income Bracket | # Families | Median Income |
| 2-Person Families | 159 (46.1%) | $45,750 |
| 3-Person Families | 79 (22.9%) | $64,375 |
| 4-Person Families | 35 (10.1%) | $115,250 |
| 5-Person Families | 58 (16.8%) | $66,087 |
| 6-Person Families | 10 (2.9%) | $0 |
| 7+ Person Families | 4 (1.2%) | $0 |
| Total | 345 (100.0%) | $64,327 |
Family Income by Number of Earners in Caney
The median family income in Caney is $64,327, with families comprising 3+ earners (36) having the highest median family income of $150,577, while families with no earners (87) have the lowest median family income of $36,250, accounting for 10.4% and 25.2% of families, respectively.
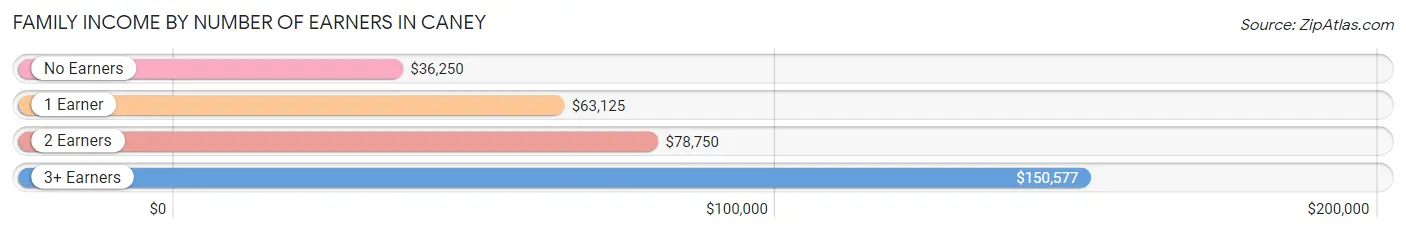
| Number of Earners | # Families | Median Income |
| No Earners | 87 (25.2%) | $36,250 |
| 1 Earner | 115 (33.3%) | $63,125 |
| 2 Earners | 107 (31.0%) | $78,750 |
| 3+ Earners | 36 (10.4%) | $150,577 |
| Total | 345 (100.0%) | $64,327 |
Household Income in Caney
Household Income Brackets in Caney
With 155 households falling in the category, the $25,000 to $34,999 income range is the most frequent in Caney, accounting for 24.6% of all households. In contrast, only 2 households (0.3%) fall into the $200,000+ income bracket, making it the least populous group.
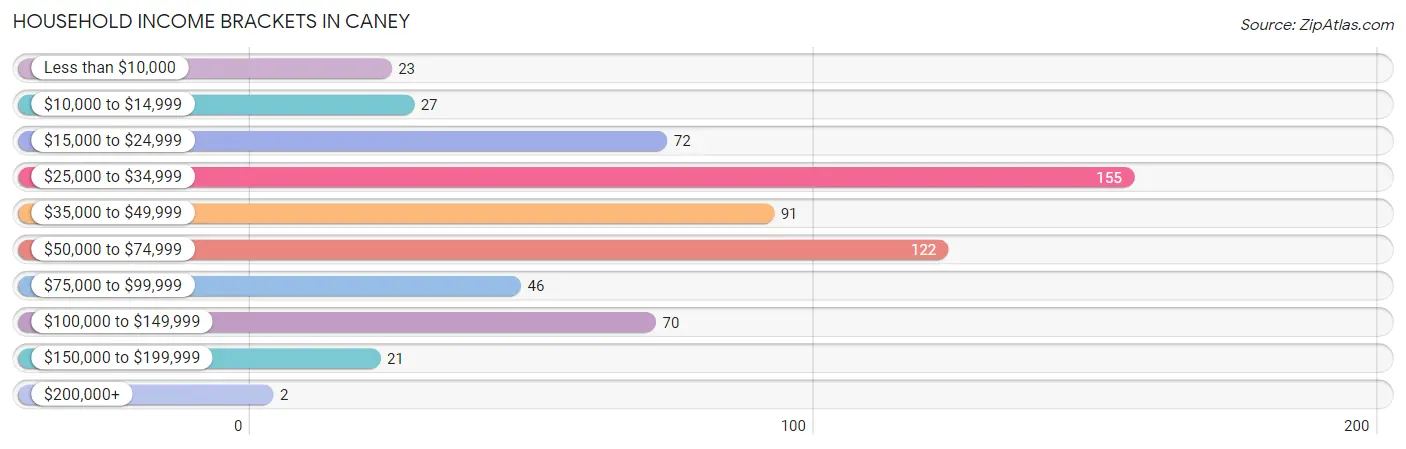
| Income Bracket | # Households | % Households |
| Less than $10,000 | 23 | 3.7% |
| $10,000 to $14,999 | 27 | 4.3% |
| $15,000 to $24,999 | 72 | 11.4% |
| $25,000 to $34,999 | 155 | 24.6% |
| $35,000 to $49,999 | 91 | 14.5% |
| $50,000 to $74,999 | 122 | 19.4% |
| $75,000 to $99,999 | 46 | 7.3% |
| $100,000 to $149,999 | 70 | 11.1% |
| $150,000 to $199,999 | 21 | 3.3% |
| $200,000+ | 2 | 0.3% |
Household Income by Householder Age in Caney
The median household income in Caney is $37,404, with the highest median household income of $69,643 found in the 25 to 44 years age bracket for the primary householder. A total of 164 households (26.1%) fall into this category.
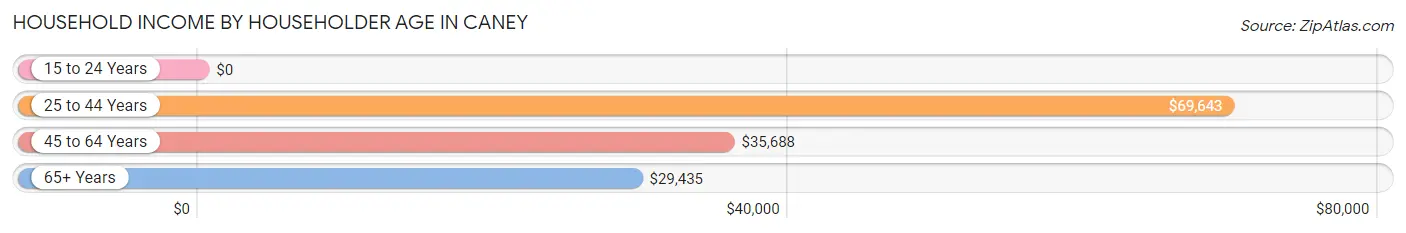
| Income Bracket | # Households | Median Income |
| 15 to 24 Years | 0 (0.0%) | $0 |
| 25 to 44 Years | 164 (26.1%) | $69,643 |
| 45 to 64 Years | 179 (28.5%) | $35,688 |
| 65+ Years | 286 (45.5%) | $29,435 |
| Total | 629 (100.0%) | $37,404 |
Poverty in Caney
Income Below Poverty by Sex and Age in Caney
With 11.2% poverty level for males and 12.0% for females among the residents of Caney, 16 and 17 year old males and 45 to 54 year old females are the most vulnerable to poverty, with 16 males (24.6%) and 16 females (38.1%) in their respective age groups living below the poverty level.
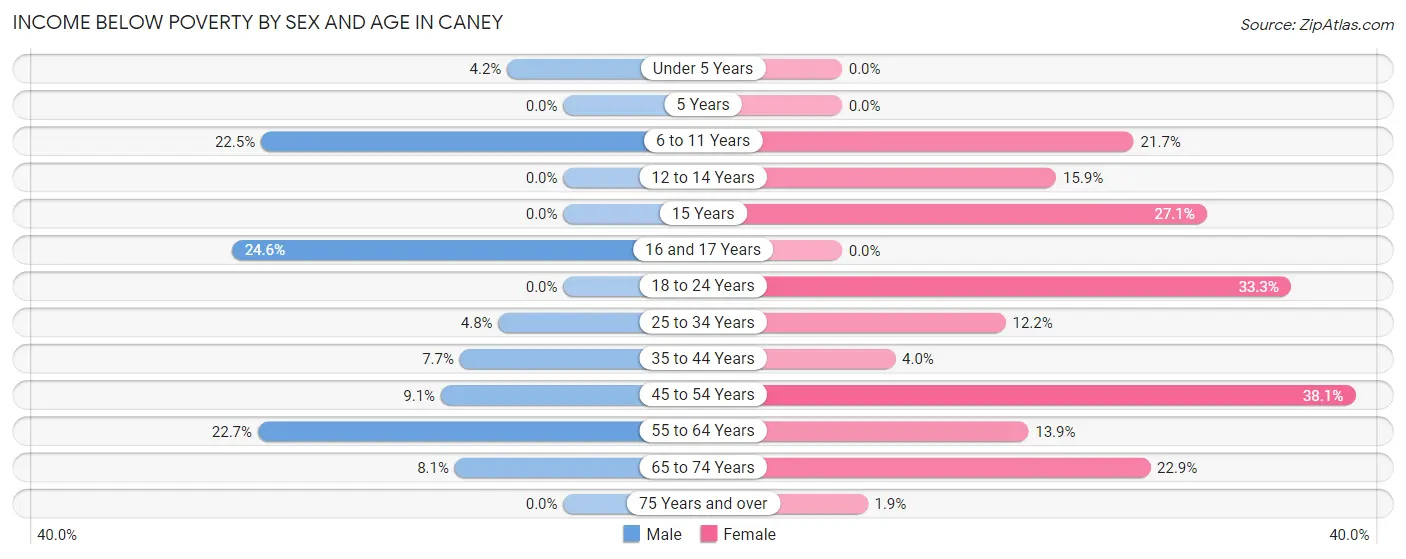
| Age Bracket | Male | Female |
| Under 5 Years | 1 (4.2%) | 0 (0.0%) |
| 5 Years | 0 (0.0%) | 0 (0.0%) |
| 6 to 11 Years | 11 (22.5%) | 13 (21.7%) |
| 12 to 14 Years | 0 (0.0%) | 7 (15.9%) |
| 15 Years | 0 (0.0%) | 13 (27.1%) |
| 16 and 17 Years | 16 (24.6%) | 0 (0.0%) |
| 18 to 24 Years | 0 (0.0%) | 4 (33.3%) |
| 25 to 34 Years | 4 (4.8%) | 9 (12.2%) |
| 35 to 44 Years | 6 (7.7%) | 4 (4.0%) |
| 45 to 54 Years | 5 (9.1%) | 16 (38.1%) |
| 55 to 64 Years | 22 (22.7%) | 18 (13.9%) |
| 65 to 74 Years | 5 (8.1%) | 19 (22.9%) |
| 75 Years and over | 0 (0.0%) | 3 (1.9%) |
| Total | 70 (11.2%) | 106 (12.0%) |
Income Above Poverty by Sex and Age in Caney
According to the poverty statistics in Caney, males aged 5 years and females aged under 5 years are the age groups that are most secure financially, with 100.0% of males and 100.0% of females in these age groups living above the poverty line.
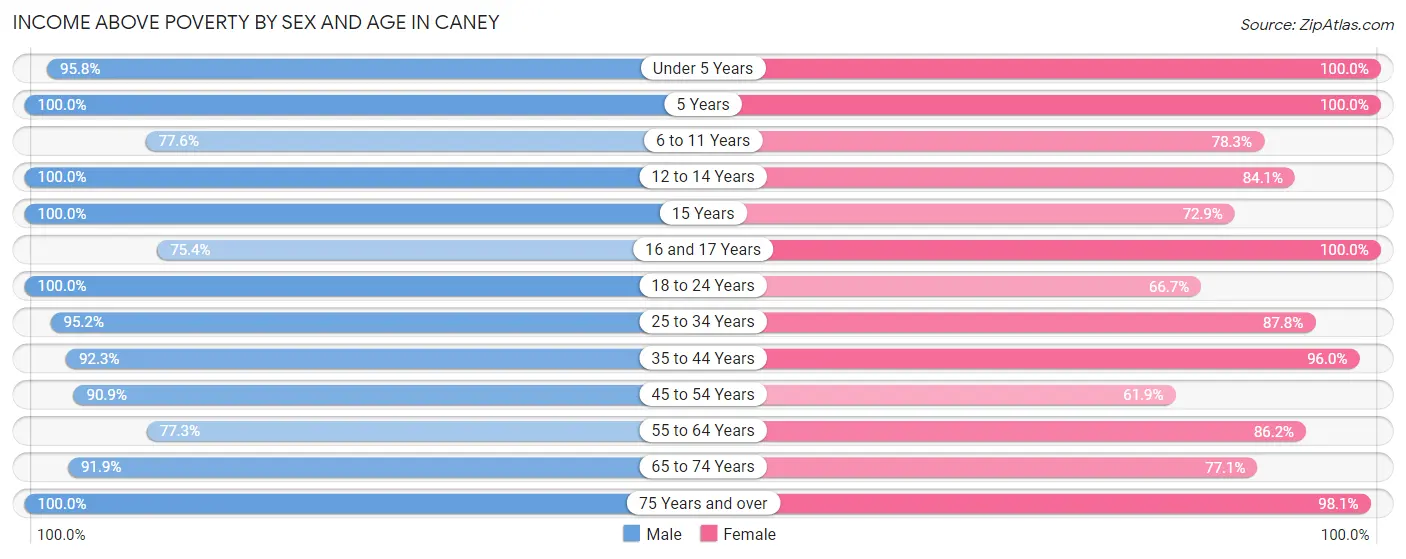
| Age Bracket | Male | Female |
| Under 5 Years | 23 (95.8%) | 80 (100.0%) |
| 5 Years | 13 (100.0%) | 31 (100.0%) |
| 6 to 11 Years | 38 (77.5%) | 47 (78.3%) |
| 12 to 14 Years | 33 (100.0%) | 37 (84.1%) |
| 15 Years | 4 (100.0%) | 35 (72.9%) |
| 16 and 17 Years | 49 (75.4%) | 21 (100.0%) |
| 18 to 24 Years | 18 (100.0%) | 8 (66.7%) |
| 25 to 34 Years | 79 (95.2%) | 65 (87.8%) |
| 35 to 44 Years | 72 (92.3%) | 97 (96.0%) |
| 45 to 54 Years | 50 (90.9%) | 26 (61.9%) |
| 55 to 64 Years | 75 (77.3%) | 112 (86.2%) |
| 65 to 74 Years | 57 (91.9%) | 64 (77.1%) |
| 75 Years and over | 44 (100.0%) | 154 (98.1%) |
| Total | 555 (88.8%) | 777 (88.0%) |
Income Below Poverty Among Married-Couple Families in Caney
The poverty statistics for married-couple families in Caney show that 6.7% or 14 of the total 209 families live below the poverty line. Families with no children have the highest poverty rate of 12.8%, comprising of 14 families. On the other hand, families with 1 or 2 children have the lowest poverty rate of 0.0%, which includes 0 families.
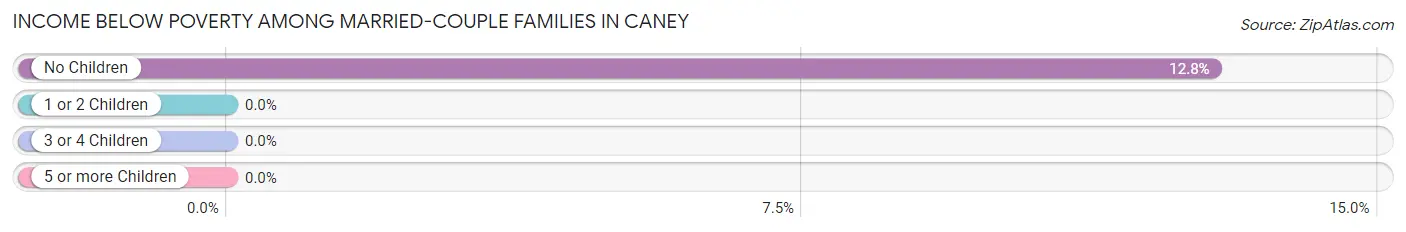
| Children | Above Poverty | Below Poverty |
| No Children | 95 (87.2%) | 14 (12.8%) |
| 1 or 2 Children | 51 (100.0%) | 0 (0.0%) |
| 3 or 4 Children | 49 (100.0%) | 0 (0.0%) |
| 5 or more Children | 0 (0.0%) | 0 (0.0%) |
| Total | 195 (93.3%) | 14 (6.7%) |
Income Below Poverty Among Single-Parent Households in Caney
According to the poverty data in Caney, 21.0% or 4 single-father households and 17.9% or 21 single-mother households are living below the poverty line. Among single-father households, those with 3 or 4 children have the highest poverty rate, with 4 households (100.0%) experiencing poverty. Likewise, among single-mother households, those with 1 or 2 children have the highest poverty rate, with 21 households (39.6%) falling below the poverty line.
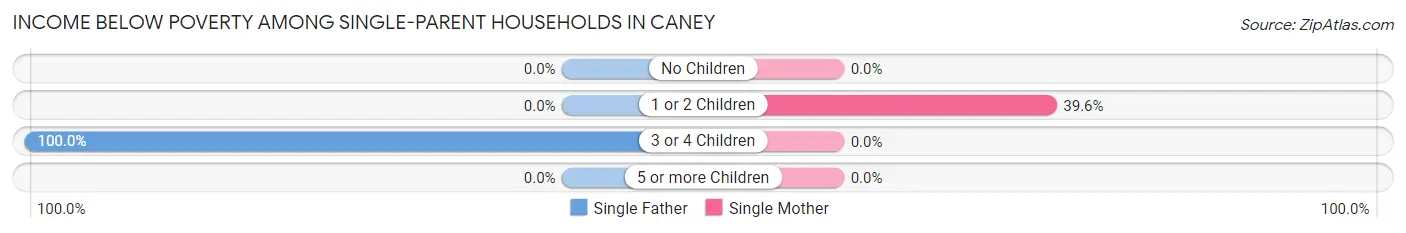
| Children | Single Father | Single Mother |
| No Children | 0 (0.0%) | 0 (0.0%) |
| 1 or 2 Children | 0 (0.0%) | 21 (39.6%) |
| 3 or 4 Children | 4 (100.0%) | 0 (0.0%) |
| 5 or more Children | 0 (0.0%) | 0 (0.0%) |
| Total | 4 (21.0%) | 21 (17.9%) |
Income Below Poverty Among Married-Couple vs Single-Parent Households in Caney
The poverty data for Caney shows that 14 of the married-couple family households (6.7%) and 25 of the single-parent households (18.4%) are living below the poverty level. Within the married-couple family households, those with no children have the highest poverty rate, with 14 households (12.8%) falling below the poverty line. Among the single-parent households, those with 1 or 2 children have the highest poverty rate, with 21 household (36.2%) living below poverty.
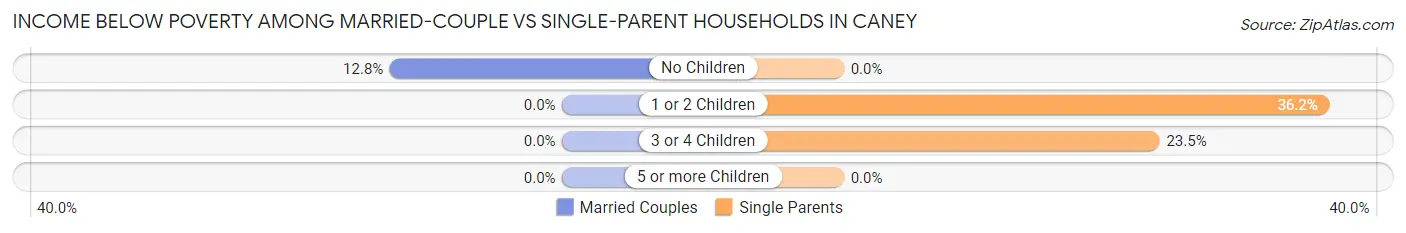
| Children | Married-Couple Families | Single-Parent Households |
| No Children | 14 (12.8%) | 0 (0.0%) |
| 1 or 2 Children | 0 (0.0%) | 21 (36.2%) |
| 3 or 4 Children | 0 (0.0%) | 4 (23.5%) |
| 5 or more Children | 0 (0.0%) | 0 (0.0%) |
| Total | 14 (6.7%) | 25 (18.4%) |
Race in Caney
The most populous races in Caney are White / Caucasian (1,306 | 84.6%), Two or more Races (150 | 9.7%), and Native / Alaskan (37 | 2.4%).
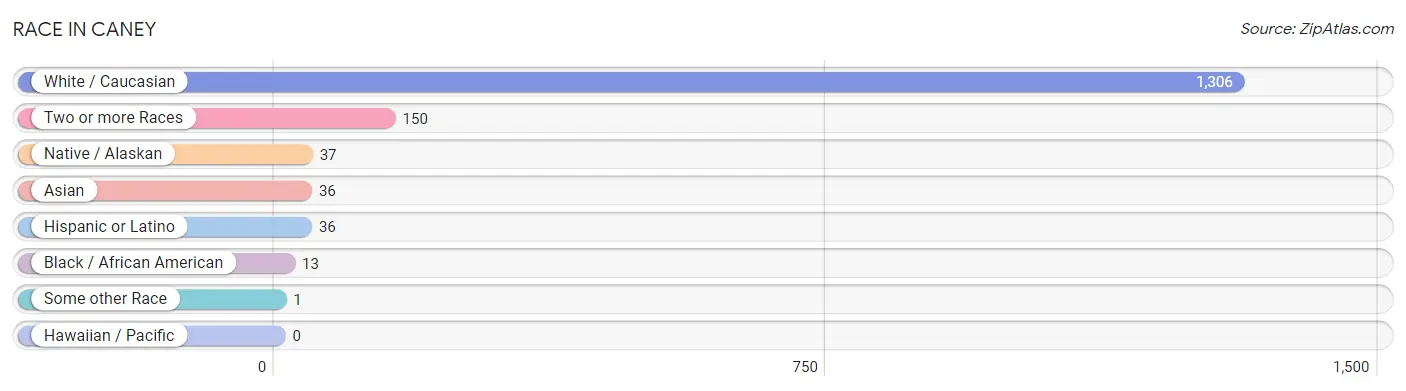
| Race | # Population | % Population |
| Asian | 36 | 2.3% |
| Black / African American | 13 | 0.8% |
| Hawaiian / Pacific | 0 | 0.0% |
| Hispanic or Latino | 36 | 2.3% |
| Native / Alaskan | 37 | 2.4% |
| White / Caucasian | 1,306 | 84.6% |
| Two or more Races | 150 | 9.7% |
| Some other Race | 1 | 0.1% |
| Total | 1,543 | 100.0% |
Ancestry in Caney
The most populous ancestries reported in Caney are English (358 | 23.2%), Irish (212 | 13.7%), American (194 | 12.6%), German (106 | 6.9%), and European (87 | 5.6%), together accounting for 62.0% of all Caney residents.
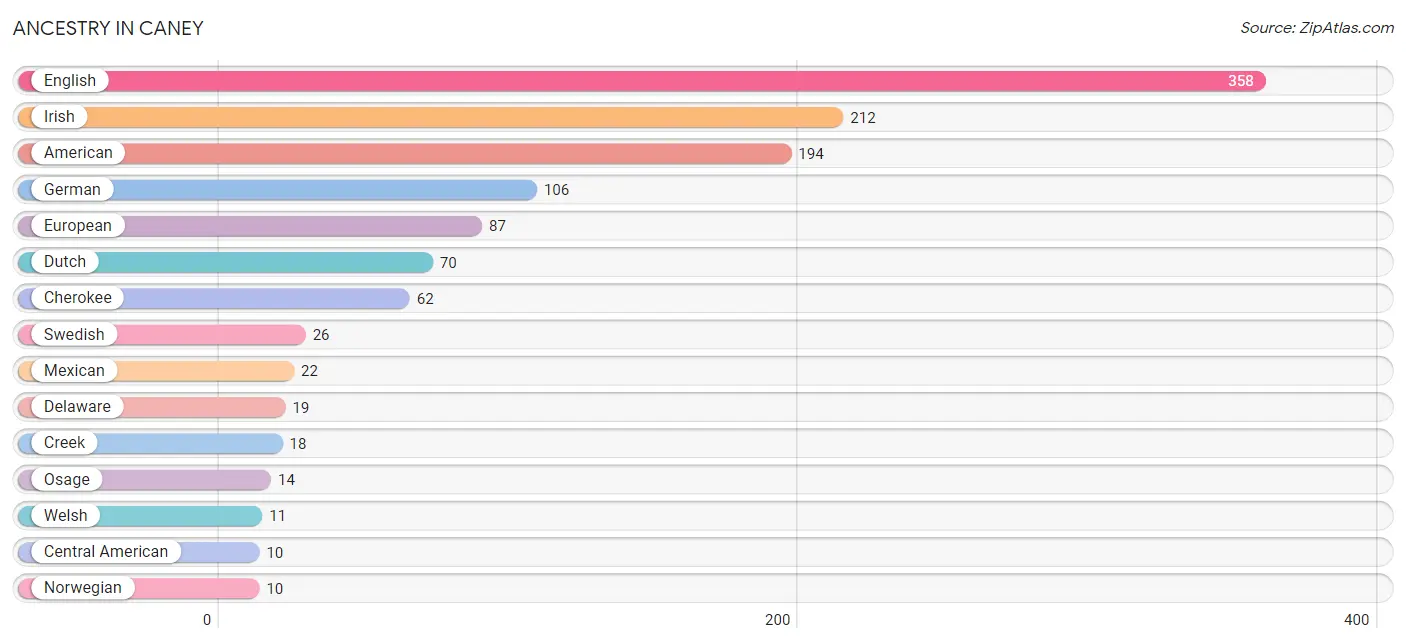
| Ancestry | # Population | % Population |
| American | 194 | 12.6% |
| Apache | 4 | 0.3% |
| Blackfeet | 8 | 0.5% |
| British | 5 | 0.3% |
| Canadian | 5 | 0.3% |
| Central American | 10 | 0.6% |
| Cherokee | 62 | 4.0% |
| Creek | 18 | 1.2% |
| Czech | 5 | 0.3% |
| Delaware | 19 | 1.2% |
| Dutch | 70 | 4.5% |
| English | 358 | 23.2% |
| European | 87 | 5.6% |
| French | 5 | 0.3% |
| German | 106 | 6.9% |
| Irish | 212 | 13.7% |
| Italian | 1 | 0.1% |
| Mexican | 22 | 1.4% |
| Northern European | 5 | 0.3% |
| Norwegian | 10 | 0.6% |
| Osage | 14 | 0.9% |
| Puerto Rican | 4 | 0.3% |
| Salvadoran | 10 | 0.6% |
| Scotch-Irish | 8 | 0.5% |
| Scottish | 6 | 0.4% |
| Shoshone | 3 | 0.2% |
| Swedish | 26 | 1.7% |
| Welsh | 11 | 0.7% | View All 28 Rows |
Immigrants in Caney
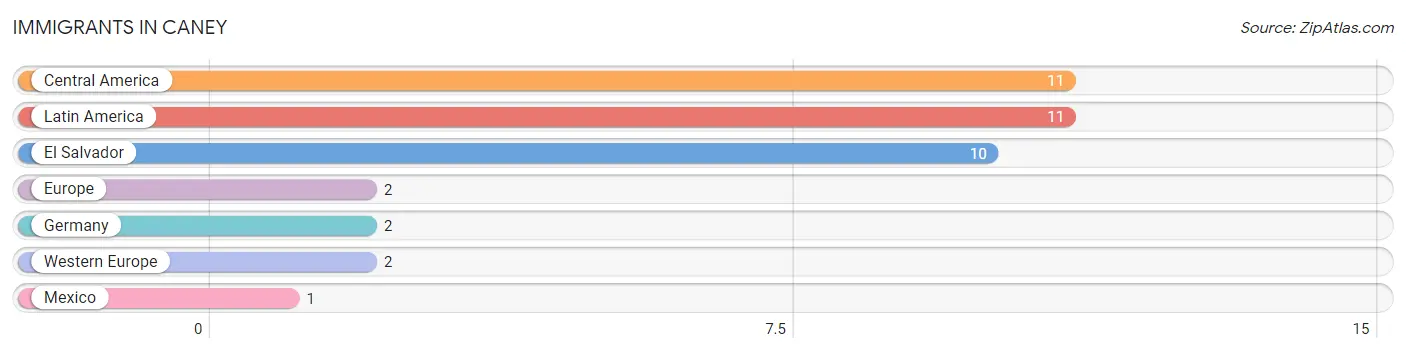
The most numerous immigrant groups reported in Caney came from Central America (11 | 0.7%), Latin America (11 | 0.7%), El Salvador (10 | 0.6%), Europe (2 | 0.1%), and Germany (2 | 0.1%), together accounting for 2.3% of all Caney residents.
| Immigration Origin | # Population | % Population |
| Central America | 11 | 0.7% |
| El Salvador | 10 | 0.6% |
| Europe | 2 | 0.1% |
| Germany | 2 | 0.1% |
| Latin America | 11 | 0.7% |
| Mexico | 1 | 0.1% |
| Western Europe | 2 | 0.1% | View All 7 Rows |
Sex and Age in Caney
Sex and Age in Caney
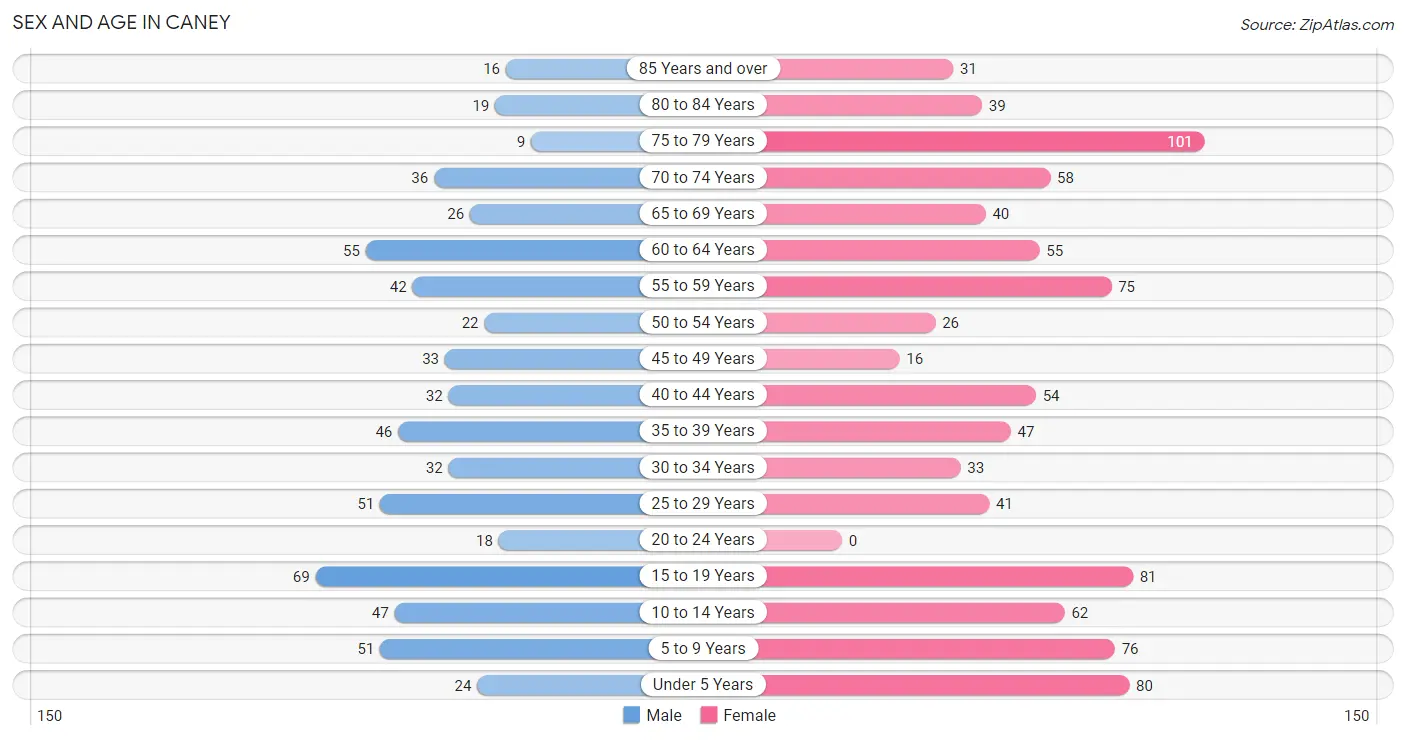
The most populous age groups in Caney are 15 to 19 Years (69 | 11.0%) for men and 75 to 79 Years (101 | 11.0%) for women.
| Age Bracket | Male | Female |
| Under 5 Years | 24 (3.8%) | 80 (8.7%) |
| 5 to 9 Years | 51 (8.1%) | 76 (8.3%) |
| 10 to 14 Years | 47 (7.5%) | 62 (6.8%) |
| 15 to 19 Years | 69 (11.0%) | 81 (8.8%) |
| 20 to 24 Years | 18 (2.9%) | 0 (0.0%) |
| 25 to 29 Years | 51 (8.1%) | 41 (4.5%) |
| 30 to 34 Years | 32 (5.1%) | 33 (3.6%) |
| 35 to 39 Years | 46 (7.3%) | 47 (5.1%) |
| 40 to 44 Years | 32 (5.1%) | 54 (5.9%) |
| 45 to 49 Years | 33 (5.2%) | 16 (1.8%) |
| 50 to 54 Years | 22 (3.5%) | 26 (2.8%) |
| 55 to 59 Years | 42 (6.7%) | 75 (8.2%) |
| 60 to 64 Years | 55 (8.8%) | 55 (6.0%) |
| 65 to 69 Years | 26 (4.1%) | 40 (4.4%) |
| 70 to 74 Years | 36 (5.7%) | 58 (6.3%) |
| 75 to 79 Years | 9 (1.4%) | 101 (11.0%) |
| 80 to 84 Years | 19 (3.0%) | 39 (4.3%) |
| 85 Years and over | 16 (2.5%) | 31 (3.4%) |
| Total | 628 (100.0%) | 915 (100.0%) |
Families and Households in Caney
Median Family Size in Caney
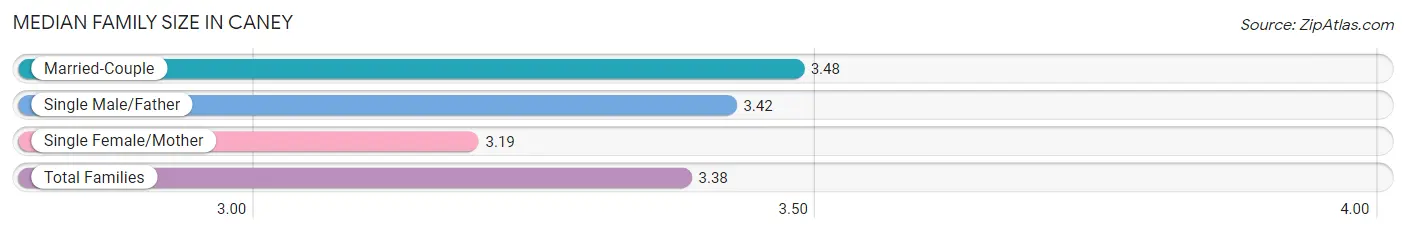
The median family size in Caney is 3.38 persons per family, with married-couple families (209 | 60.6%) accounting for the largest median family size of 3.48 persons per family. On the other hand, single female/mother families (117 | 33.9%) represent the smallest median family size with 3.19 persons per family.
| Family Type | # Families | Family Size |
| Married-Couple | 209 (60.6%) | 3.48 |
| Single Male/Father | 19 (5.5%) | 3.42 |
| Single Female/Mother | 117 (33.9%) | 3.19 |
| Total Families | 345 (100.0%) | 3.38 |
Median Household Size in Caney
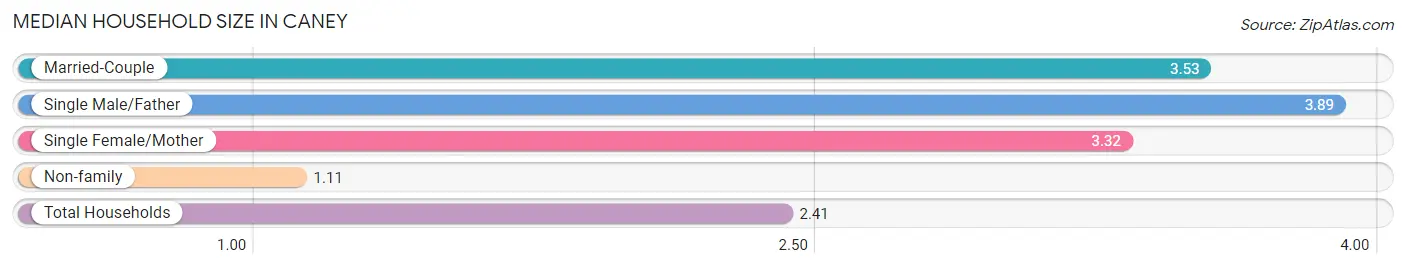
The median household size in Caney is 2.41 persons per household, with single male/father households (19 | 3.0%) accounting for the largest median household size of 3.89 persons per household. non-family households (284 | 45.2%) represent the smallest median household size with 1.11 persons per household.
| Household Type | # Households | Household Size |
| Married-Couple | 209 (33.2%) | 3.53 |
| Single Male/Father | 19 (3.0%) | 3.89 |
| Single Female/Mother | 117 (18.6%) | 3.32 |
| Non-family | 284 (45.2%) | 1.11 |
| Total Households | 629 (100.0%) | 2.41 |
Household Size by Marriage Status in Caney
Out of a total of 629 households in Caney, 345 (54.8%) are family households, while 284 (45.2%) are nonfamily households. The most numerous type of family households are 2-person households, comprising 153, and the most common type of nonfamily households are 1-person households, comprising 261.
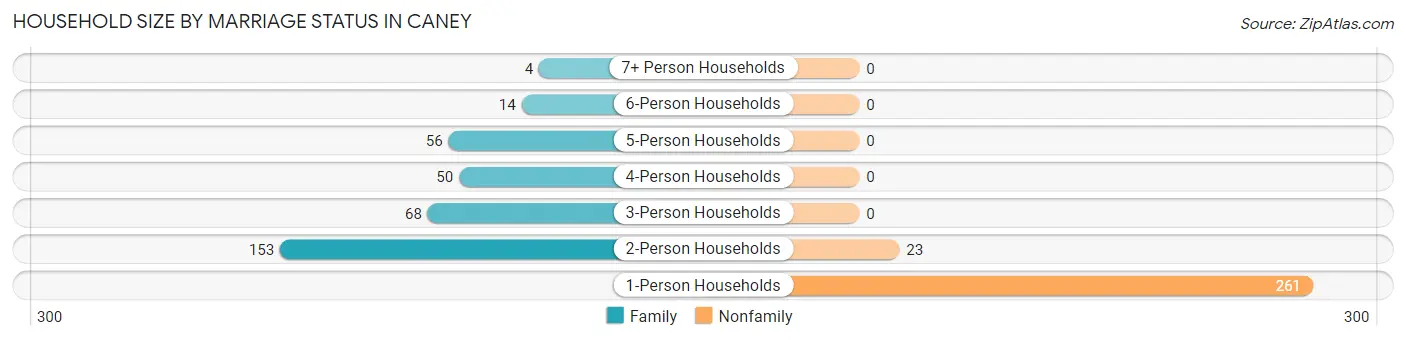
| Household Size | Family Households | Nonfamily Households |
| 1-Person Households | - | 261 (41.5%) |
| 2-Person Households | 153 (24.3%) | 23 (3.7%) |
| 3-Person Households | 68 (10.8%) | 0 (0.0%) |
| 4-Person Households | 50 (8.0%) | 0 (0.0%) |
| 5-Person Households | 56 (8.9%) | 0 (0.0%) |
| 6-Person Households | 14 (2.2%) | 0 (0.0%) |
| 7+ Person Households | 4 (0.6%) | 0 (0.0%) |
| Total | 345 (54.8%) | 284 (45.2%) |
Female Fertility in Caney
Fertility by Age in Caney
Average fertility rate in Caney is 173.0 births per 1,000 women. Women in the age bracket of 20 to 34 years have the highest fertility rate with 514.0 births per 1,000 women. Women in the age bracket of 20 to 34 years acount for 80.8% of all women with births.
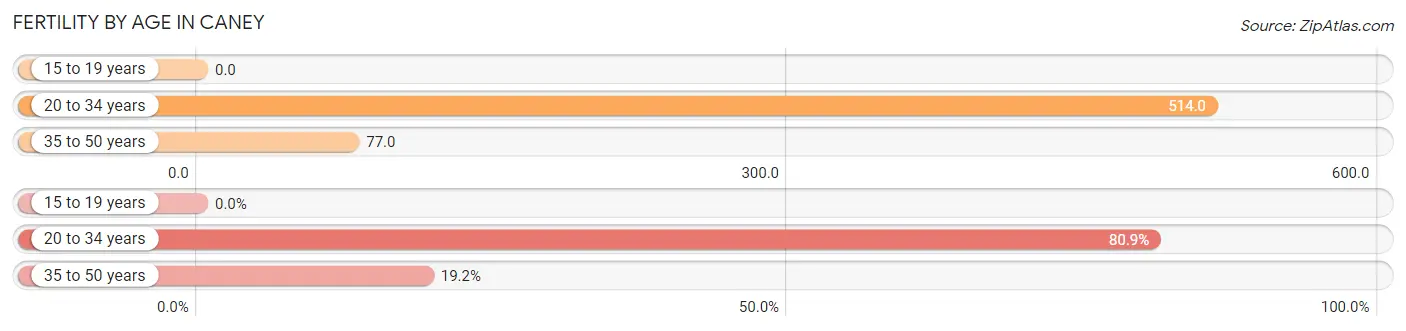
| Age Bracket | Women with Births | Births / 1,000 Women |
| 15 to 19 years | 0 (0.0%) | 0.0 |
| 20 to 34 years | 38 (80.8%) | 514.0 |
| 35 to 50 years | 9 (19.2%) | 77.0 |
| Total | 47 (100.0%) | 173.0 |
Fertility by Age by Marriage Status in Caney
61.7% of women with births (47) in Caney are married. The highest percentage of unmarried women with births falls into 35 to 50 years age bracket with 100.0% of them unmarried at the time of birth, while the lowest percentage of unmarried women with births belong to 20 to 34 years age bracket with 23.7% of them unmarried.
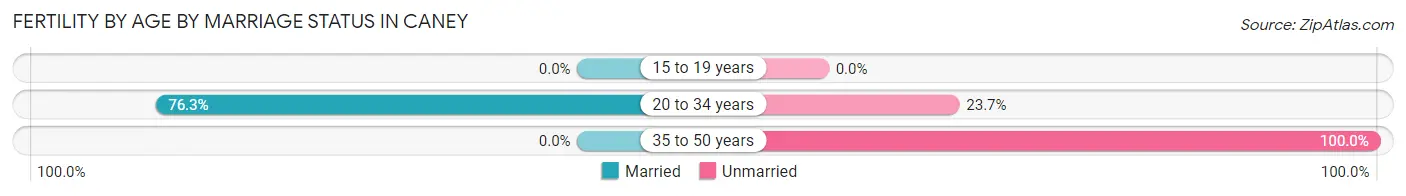
| Age Bracket | Married | Unmarried |
| 15 to 19 years | 0 (0.0%) | 0 (0.0%) |
| 20 to 34 years | 29 (76.3%) | 9 (23.7%) |
| 35 to 50 years | 0 (0.0%) | 9 (100.0%) |
| Total | 29 (61.7%) | 18 (38.3%) |
Fertility by Education in Caney
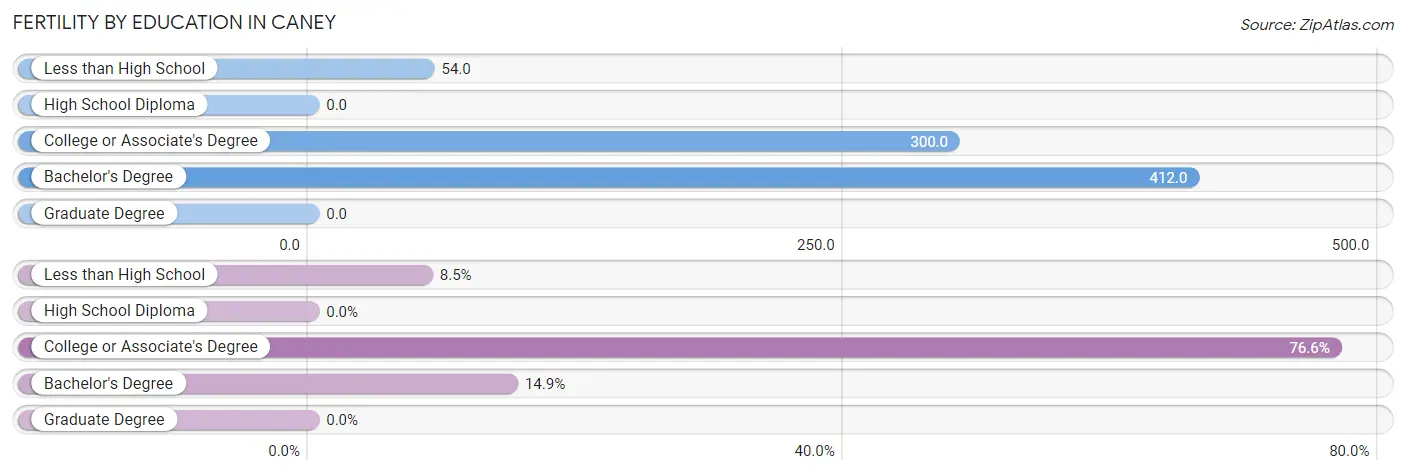
| Educational Attainment | Women with Births | Births / 1,000 Women |
| Less than High School | 4 (8.5%) | 54.0 |
| High School Diploma | 0 (0.0%) | 0.0 |
| College or Associate's Degree | 36 (76.6%) | 300.0 |
| Bachelor's Degree | 7 (14.9%) | 412.0 |
| Graduate Degree | 0 (0.0%) | 0.0 |
| Total | 47 (100.0%) | 173.0 |
Fertility by Education by Marriage Status in Caney
38.3% of women with births in Caney are unmarried. Women with the educational attainment of college or associate's degree are most likely to be married with 75.0% of them married at childbirth, while women with the educational attainment of less than high school are least likely to be married with 100.0% of them unmarried at childbirth.
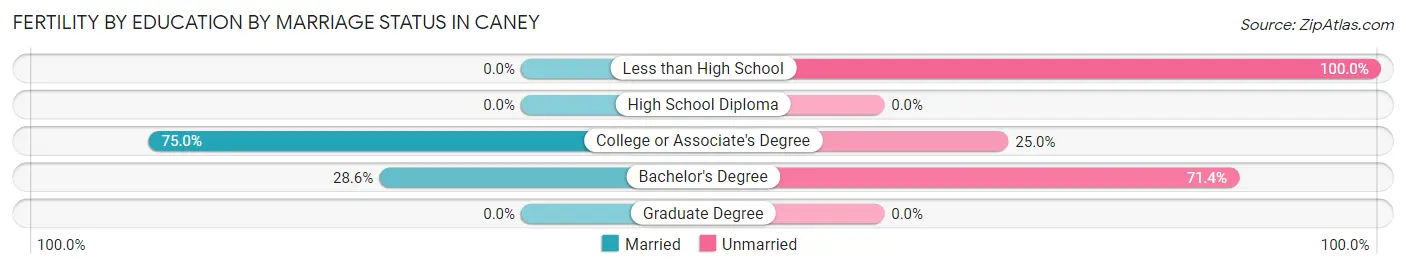
| Educational Attainment | Married | Unmarried |
| Less than High School | 0 (0.0%) | 4 (100.0%) |
| High School Diploma | 0 (0.0%) | 0 (0.0%) |
| College or Associate's Degree | 27 (75.0%) | 9 (25.0%) |
| Bachelor's Degree | 2 (28.6%) | 5 (71.4%) |
| Graduate Degree | 0 (0.0%) | 0 (0.0%) |
| Total | 29 (61.7%) | 18 (38.3%) |
Employment Characteristics in Caney
Employment by Class of Employer in Caney
Among the 546 employed individuals in Caney, private company employees (407 | 74.5%), self-employed (not incorporated) (66 | 12.1%), and not-for-profit organizations (42 | 7.7%) make up the most common classes of employment.
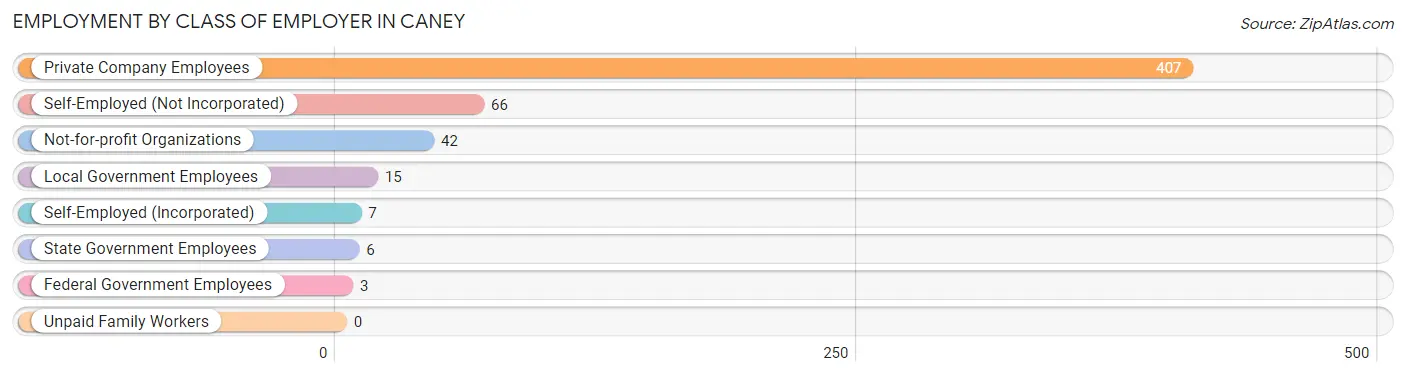
| Employer Class | # Employees | % Employees |
| Private Company Employees | 407 | 74.5% |
| Self-Employed (Incorporated) | 7 | 1.3% |
| Self-Employed (Not Incorporated) | 66 | 12.1% |
| Not-for-profit Organizations | 42 | 7.7% |
| Local Government Employees | 15 | 2.8% |
| State Government Employees | 6 | 1.1% |
| Federal Government Employees | 3 | 0.5% |
| Unpaid Family Workers | 0 | 0.0% |
| Total | 546 | 100.0% |
Employment Status by Age in Caney
According to the labor force statistics for Caney, out of the total population over 16 years of age (1,151), 50.2% or 578 individuals are in the labor force, with 5.5% or 32 of them unemployed. The age group with the highest labor force participation rate is 35 to 44 years, with 92.7% or 166 individuals in the labor force. Within the labor force, the 65 to 74 years age range has the highest percentage of unemployed individuals, with 11.4% or 4 of them being unemployed.
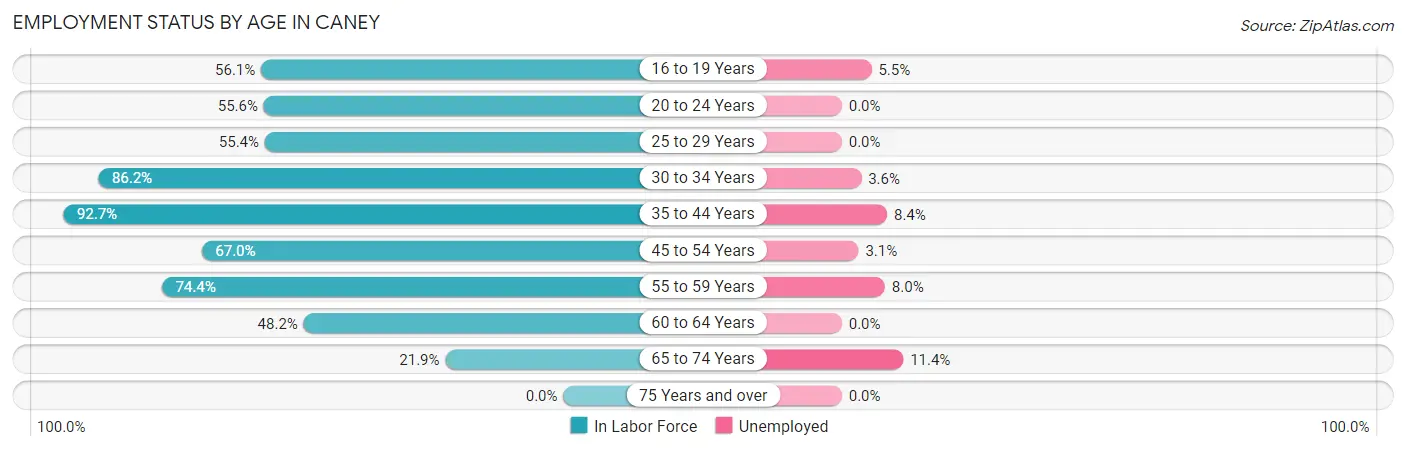
| Age Bracket | In Labor Force | Unemployed |
| 16 to 19 Years | 55 (56.1%) | 3 (5.5%) |
| 20 to 24 Years | 10 (55.6%) | 0 (0.0%) |
| 25 to 29 Years | 51 (55.4%) | 0 (0.0%) |
| 30 to 34 Years | 56 (86.2%) | 2 (3.6%) |
| 35 to 44 Years | 166 (92.7%) | 14 (8.4%) |
| 45 to 54 Years | 65 (67.0%) | 2 (3.1%) |
| 55 to 59 Years | 87 (74.4%) | 7 (8.0%) |
| 60 to 64 Years | 53 (48.2%) | 0 (0.0%) |
| 65 to 74 Years | 35 (21.9%) | 4 (11.4%) |
| 75 Years and over | 0 (0.0%) | 0 (0.0%) |
| Total | 578 (50.2%) | 32 (5.5%) |
Employment Status by Educational Attainment in Caney
According to labor force statistics for Caney, 72.4% of individuals (478) out of the total population between 25 and 64 years of age (660) are in the labor force, with 5.2% or 25 of them being unemployed. The group with the highest labor force participation rate are those with the educational attainment of less than high school, with 82.9% or 29 individuals in the labor force. Within the labor force, individuals with college / associate degree education have the highest percentage of unemployment, with 6.9% or 18 of them being unemployed.
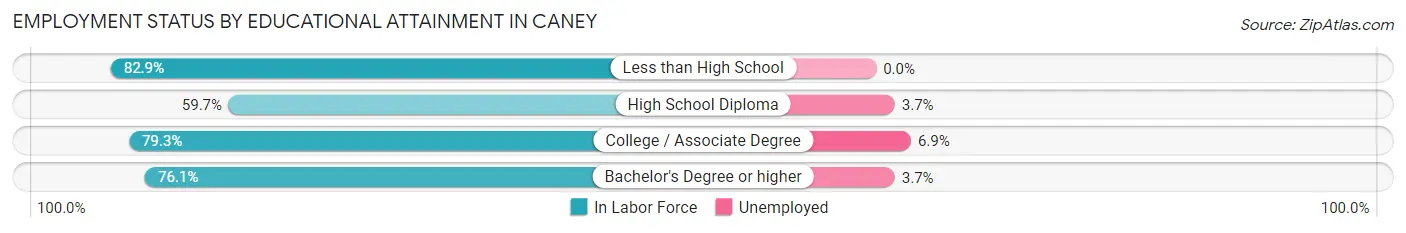
| Educational Attainment | In Labor Force | Unemployed |
| Less than High School | 29 (82.9%) | 0 (0.0%) |
| High School Diploma | 135 (59.7%) | 8 (3.7%) |
| College / Associate Degree | 260 (79.3%) | 23 (6.9%) |
| Bachelor's Degree or higher | 54 (76.1%) | 3 (3.7%) |
| Total | 478 (72.4%) | 34 (5.2%) |
Employment Occupations by Sex in Caney
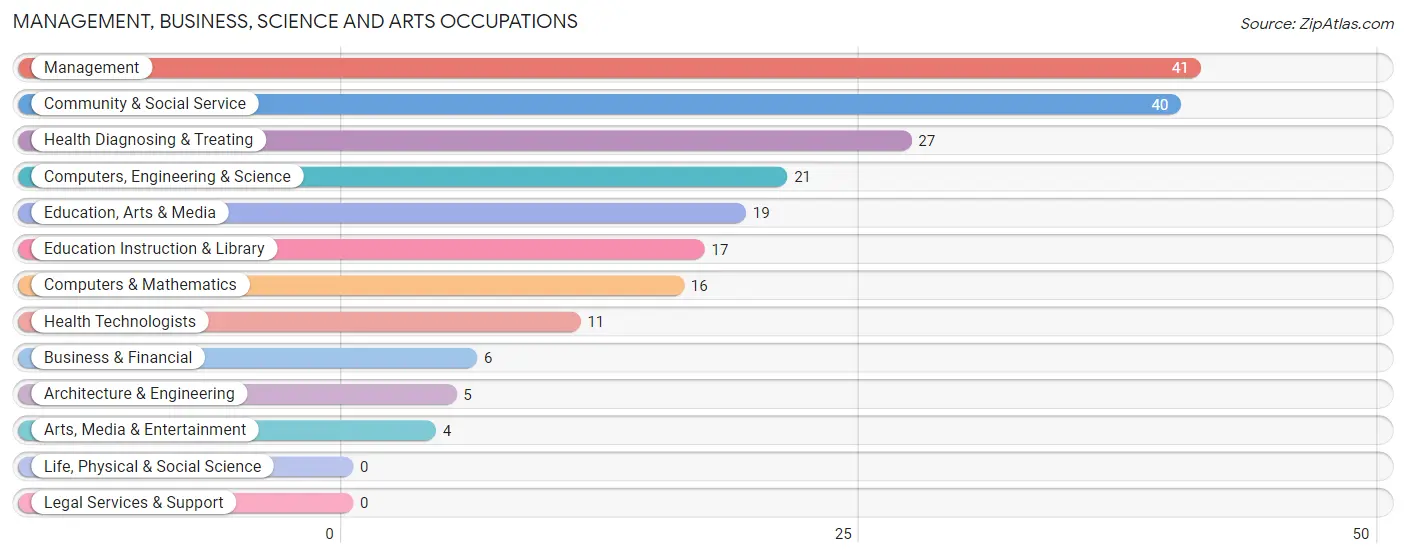
Management, Business, Science and Arts Occupations
The most common Management, Business, Science and Arts occupations in Caney are Management (41 | 7.5%), Community & Social Service (40 | 7.3%), Health Diagnosing & Treating (27 | 5.0%), Computers, Engineering & Science (21 | 3.8%), and Education, Arts & Media (19 | 3.5%).
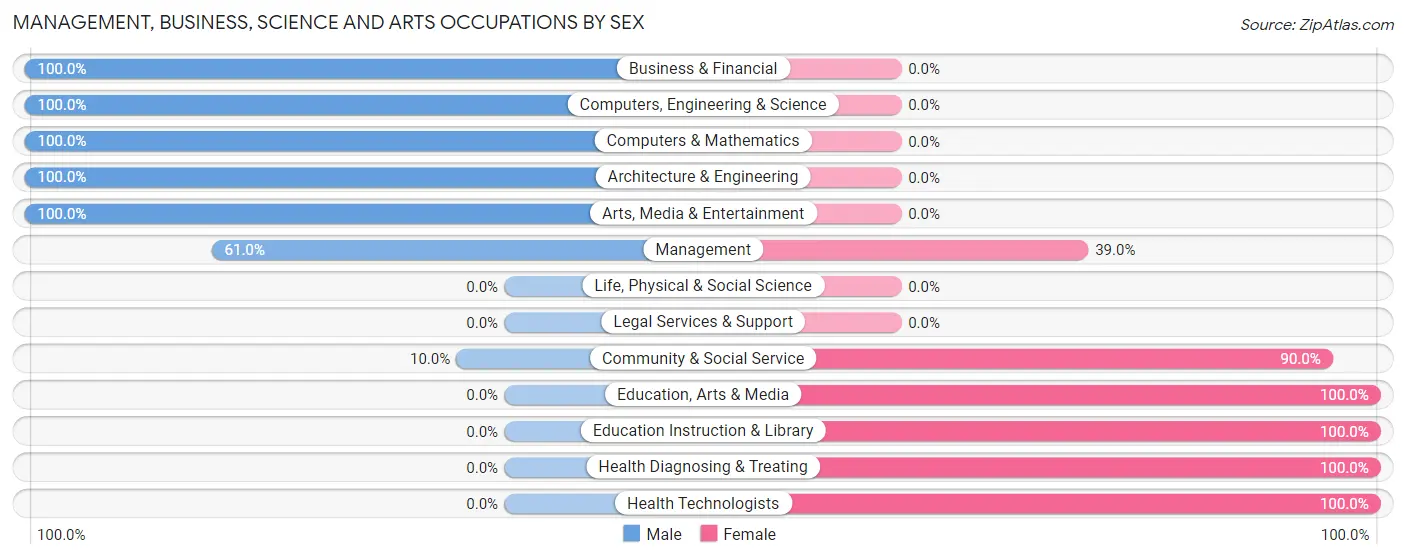
Management, Business, Science and Arts Occupations by Sex
Within the Management, Business, Science and Arts occupations in Caney, the most male-oriented occupations are Business & Financial (100.0%), Computers, Engineering & Science (100.0%), and Computers & Mathematics (100.0%), while the most female-oriented occupations are Education, Arts & Media (100.0%), Education Instruction & Library (100.0%), and Health Diagnosing & Treating (100.0%).
| Occupation | Male | Female |
| Management | 25 (61.0%) | 16 (39.0%) |
| Business & Financial | 6 (100.0%) | 0 (0.0%) |
| Computers, Engineering & Science | 21 (100.0%) | 0 (0.0%) |
| Computers & Mathematics | 16 (100.0%) | 0 (0.0%) |
| Architecture & Engineering | 5 (100.0%) | 0 (0.0%) |
| Life, Physical & Social Science | 0 (0.0%) | 0 (0.0%) |
| Community & Social Service | 4 (10.0%) | 36 (90.0%) |
| Education, Arts & Media | 0 (0.0%) | 19 (100.0%) |
| Legal Services & Support | 0 (0.0%) | 0 (0.0%) |
| Education Instruction & Library | 0 (0.0%) | 17 (100.0%) |
| Arts, Media & Entertainment | 4 (100.0%) | 0 (0.0%) |
| Health Diagnosing & Treating | 0 (0.0%) | 27 (100.0%) |
| Health Technologists | 0 (0.0%) | 11 (100.0%) |
| Total (Category) | 56 (41.5%) | 79 (58.5%) |
| Total (Overall) | 290 (53.1%) | 256 (46.9%) |
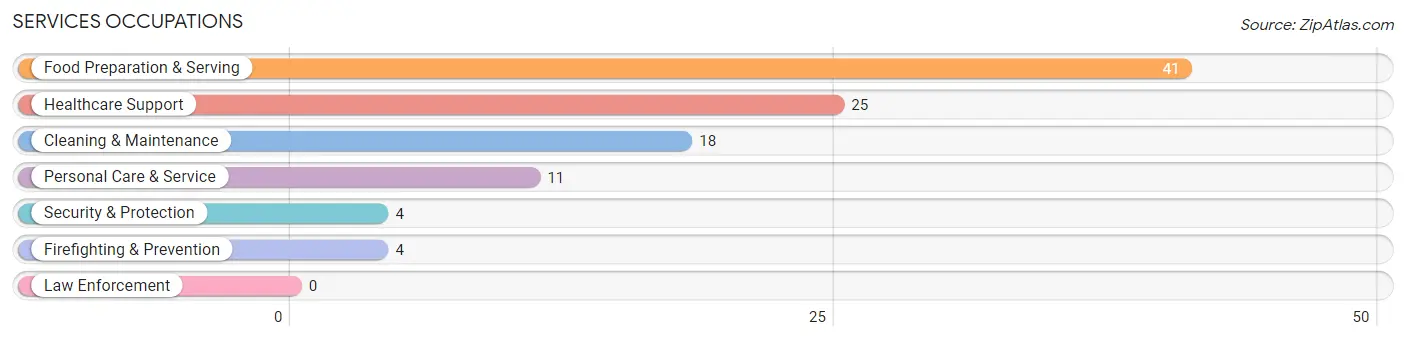
Services Occupations
The most common Services occupations in Caney are Food Preparation & Serving (41 | 7.5%), Healthcare Support (25 | 4.6%), Cleaning & Maintenance (18 | 3.3%), Personal Care & Service (11 | 2.0%), and Security & Protection (4 | 0.7%).
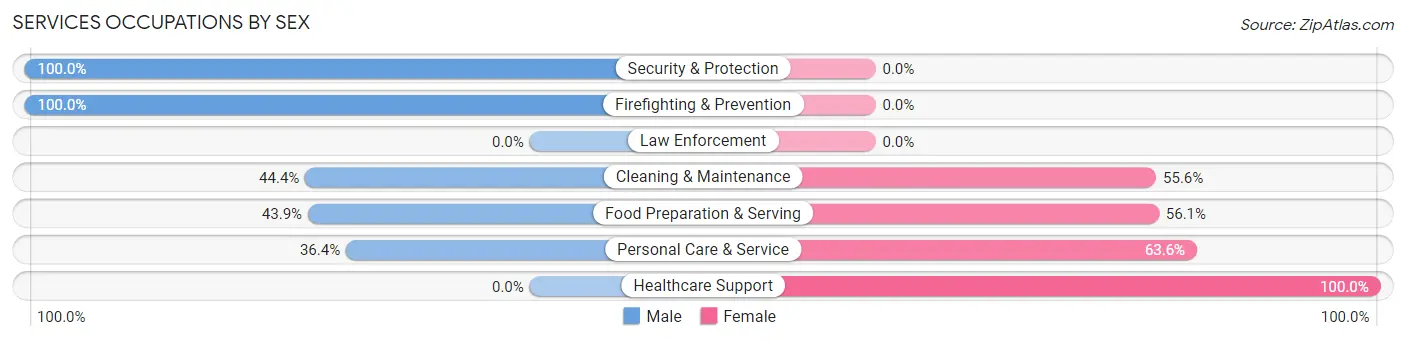
Services Occupations by Sex
Within the Services occupations in Caney, the most male-oriented occupations are Security & Protection (100.0%), Firefighting & Prevention (100.0%), and Cleaning & Maintenance (44.4%), while the most female-oriented occupations are Healthcare Support (100.0%), Personal Care & Service (63.6%), and Food Preparation & Serving (56.1%).
| Occupation | Male | Female |
| Healthcare Support | 0 (0.0%) | 25 (100.0%) |
| Security & Protection | 4 (100.0%) | 0 (0.0%) |
| Firefighting & Prevention | 4 (100.0%) | 0 (0.0%) |
| Law Enforcement | 0 (0.0%) | 0 (0.0%) |
| Food Preparation & Serving | 18 (43.9%) | 23 (56.1%) |
| Cleaning & Maintenance | 8 (44.4%) | 10 (55.6%) |
| Personal Care & Service | 4 (36.4%) | 7 (63.6%) |
| Total (Category) | 34 (34.3%) | 65 (65.7%) |
| Total (Overall) | 290 (53.1%) | 256 (46.9%) |
Sales and Office Occupations
The most common Sales and Office occupations in Caney are Office & Administration (79 | 14.5%), and Sales & Related (41 | 7.5%).
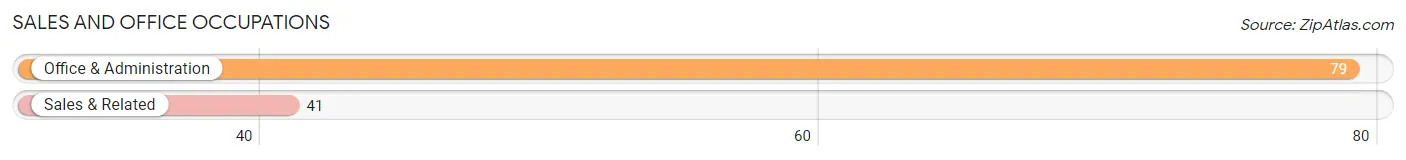
Sales and Office Occupations by Sex
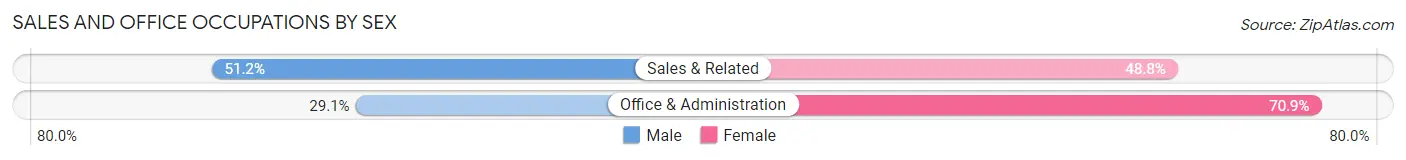
| Occupation | Male | Female |
| Sales & Related | 21 (51.2%) | 20 (48.8%) |
| Office & Administration | 23 (29.1%) | 56 (70.9%) |
| Total (Category) | 44 (36.7%) | 76 (63.3%) |
| Total (Overall) | 290 (53.1%) | 256 (46.9%) |
Natural Resources, Construction and Maintenance Occupations
The most common Natural Resources, Construction and Maintenance occupations in Caney are Construction & Extraction (31 | 5.7%), Installation, Maintenance & Repair (13 | 2.4%), and Farming, Fishing & Forestry (3 | 0.5%).
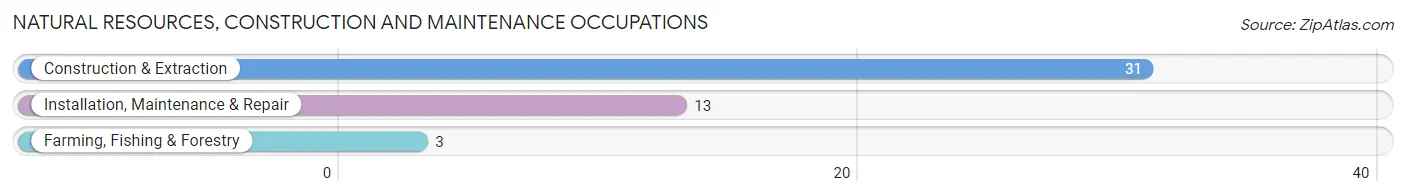
Natural Resources, Construction and Maintenance Occupations by Sex
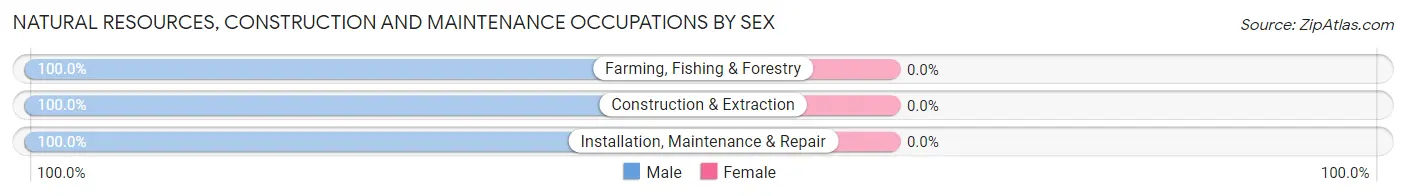
| Occupation | Male | Female |
| Farming, Fishing & Forestry | 3 (100.0%) | 0 (0.0%) |
| Construction & Extraction | 31 (100.0%) | 0 (0.0%) |
| Installation, Maintenance & Repair | 13 (100.0%) | 0 (0.0%) |
| Total (Category) | 47 (100.0%) | 0 (0.0%) |
| Total (Overall) | 290 (53.1%) | 256 (46.9%) |
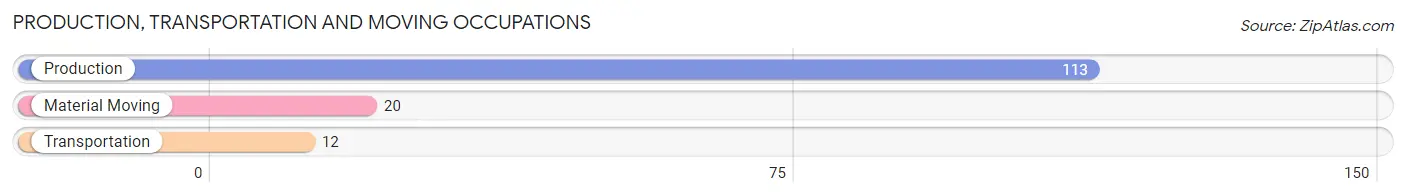
Production, Transportation and Moving Occupations
The most common Production, Transportation and Moving occupations in Caney are Production (113 | 20.7%), Material Moving (20 | 3.7%), and Transportation (12 | 2.2%).
Production, Transportation and Moving Occupations by Sex
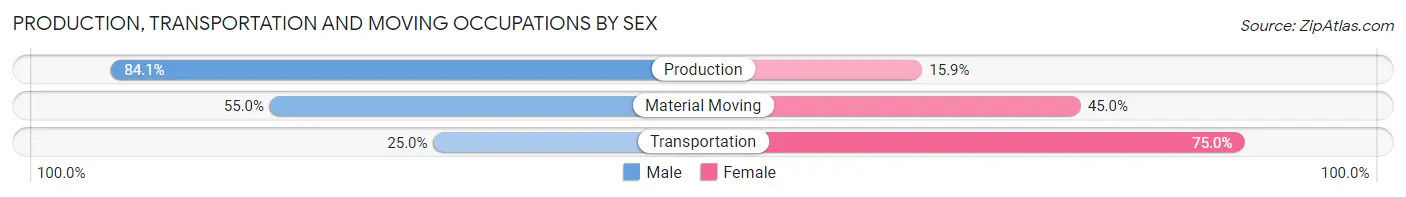
| Occupation | Male | Female |
| Production | 95 (84.1%) | 18 (15.9%) |
| Transportation | 3 (25.0%) | 9 (75.0%) |
| Material Moving | 11 (55.0%) | 9 (45.0%) |
| Total (Category) | 109 (75.2%) | 36 (24.8%) |
| Total (Overall) | 290 (53.1%) | 256 (46.9%) |
Employment Industries by Sex in Caney
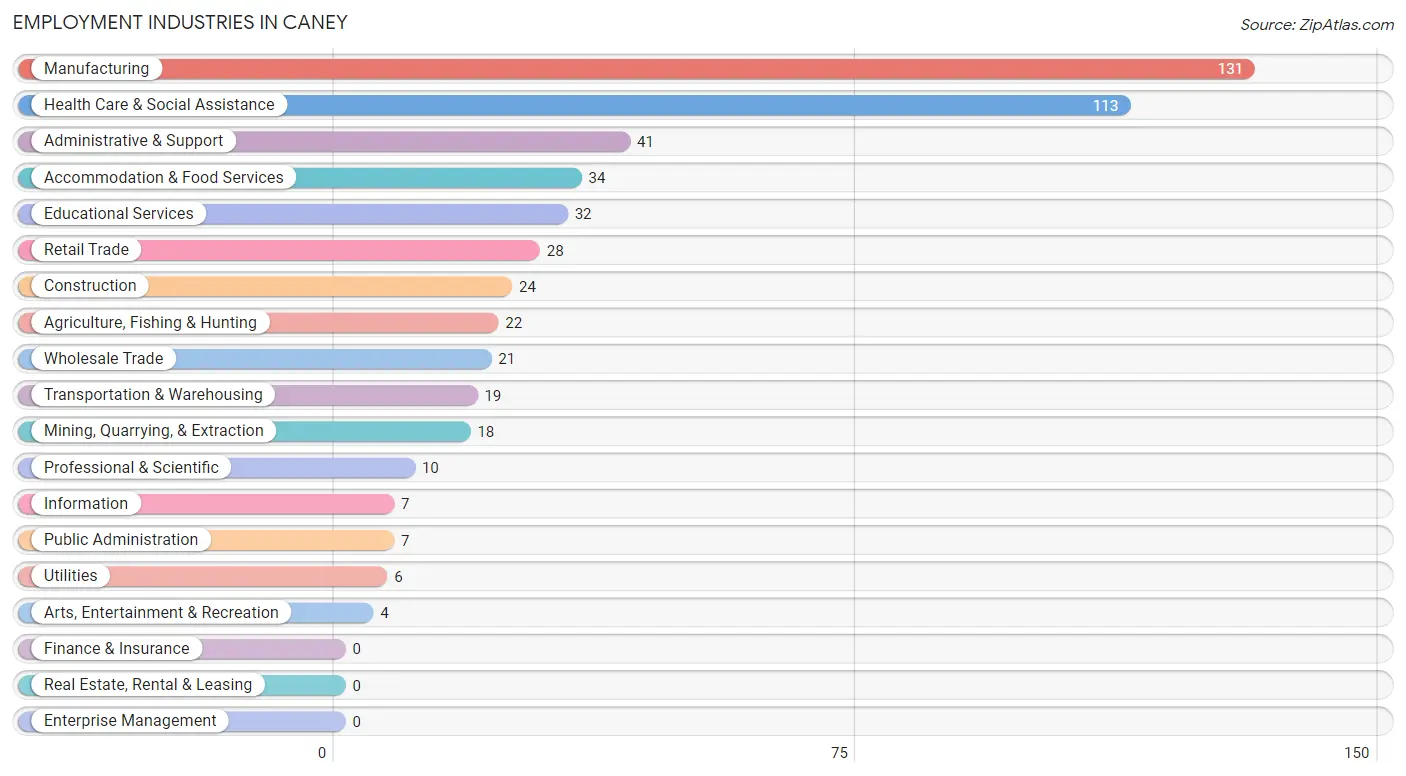
Employment Industries in Caney
The major employment industries in Caney include Manufacturing (131 | 24.0%), Health Care & Social Assistance (113 | 20.7%), Administrative & Support (41 | 7.5%), Accommodation & Food Services (34 | 6.2%), and Educational Services (32 | 5.9%).
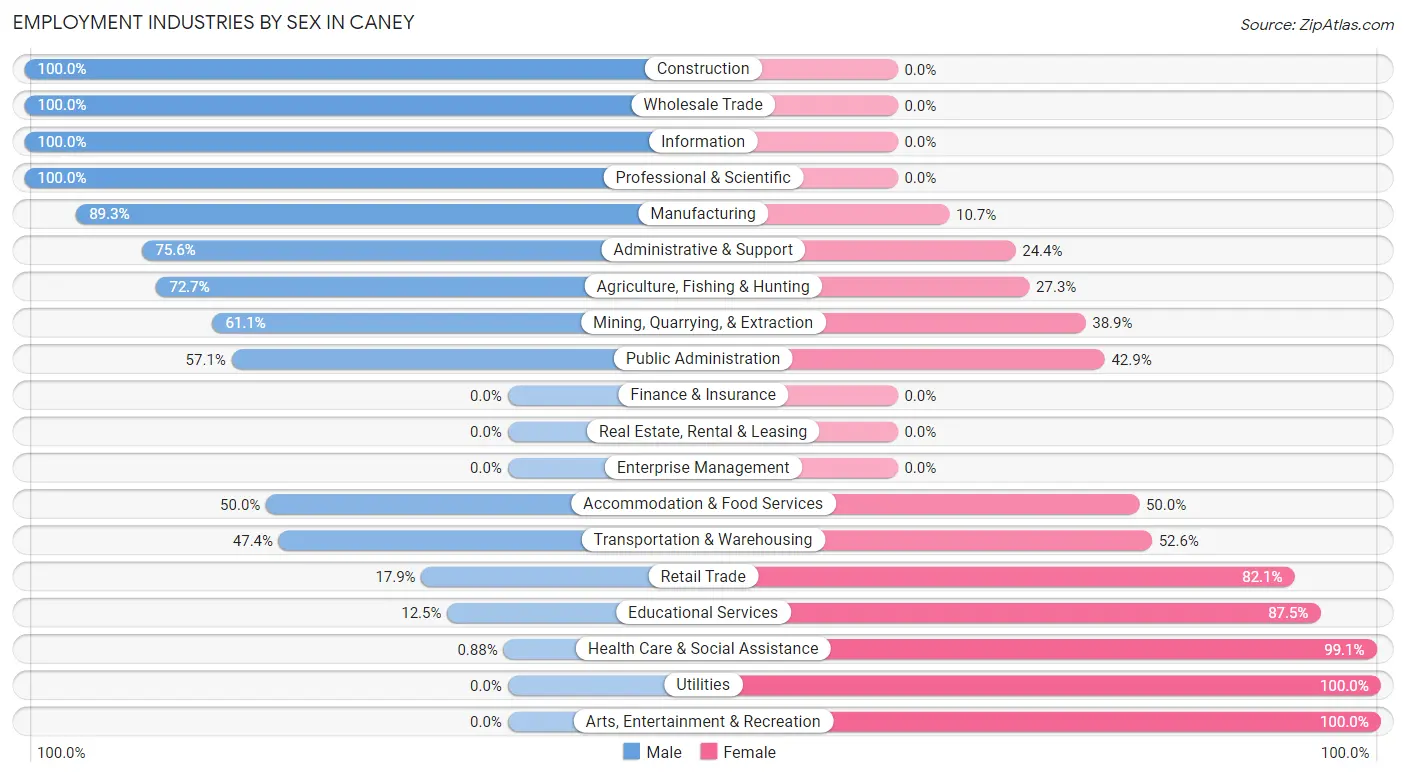
Employment Industries by Sex in Caney
The Caney industries that see more men than women are Construction (100.0%), Wholesale Trade (100.0%), and Information (100.0%), whereas the industries that tend to have a higher number of women are Utilities (100.0%), Arts, Entertainment & Recreation (100.0%), and Health Care & Social Assistance (99.1%).
| Industry | Male | Female |
| Agriculture, Fishing & Hunting | 16 (72.7%) | 6 (27.3%) |
| Mining, Quarrying, & Extraction | 11 (61.1%) | 7 (38.9%) |
| Construction | 24 (100.0%) | 0 (0.0%) |
| Manufacturing | 117 (89.3%) | 14 (10.7%) |
| Wholesale Trade | 21 (100.0%) | 0 (0.0%) |
| Retail Trade | 5 (17.9%) | 23 (82.1%) |
| Transportation & Warehousing | 9 (47.4%) | 10 (52.6%) |
| Utilities | 0 (0.0%) | 6 (100.0%) |
| Information | 7 (100.0%) | 0 (0.0%) |
| Finance & Insurance | 0 (0.0%) | 0 (0.0%) |
| Real Estate, Rental & Leasing | 0 (0.0%) | 0 (0.0%) |
| Professional & Scientific | 10 (100.0%) | 0 (0.0%) |
| Enterprise Management | 0 (0.0%) | 0 (0.0%) |
| Administrative & Support | 31 (75.6%) | 10 (24.4%) |
| Educational Services | 4 (12.5%) | 28 (87.5%) |
| Health Care & Social Assistance | 1 (0.9%) | 112 (99.1%) |
| Arts, Entertainment & Recreation | 0 (0.0%) | 4 (100.0%) |
| Accommodation & Food Services | 17 (50.0%) | 17 (50.0%) |
| Public Administration | 4 (57.1%) | 3 (42.9%) |
| Total | 290 (53.1%) | 256 (46.9%) |
Education in Caney
School Enrollment in Caney
The most common levels of schooling among the 386 students in Caney are high school (139 | 36.0%), middle school (85 | 22.0%), and elementary school (84 | 21.8%).
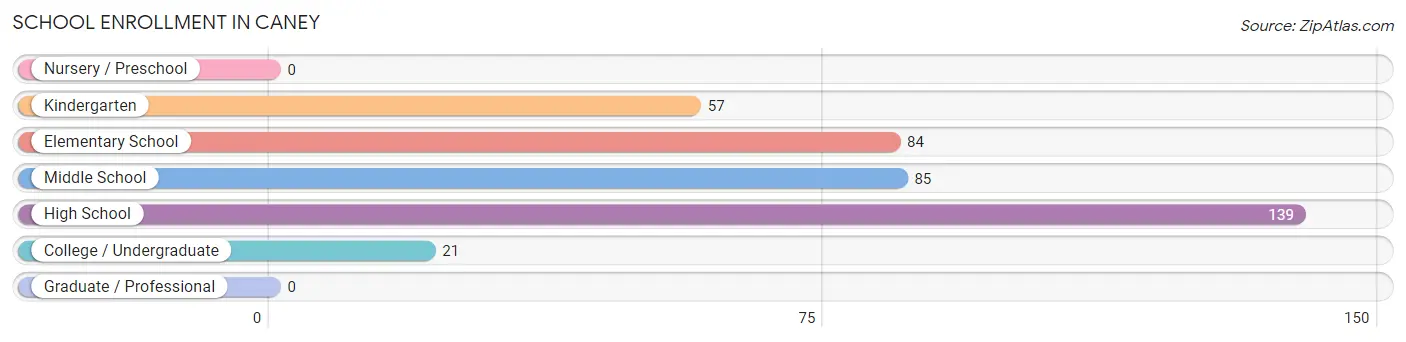
| School Level | # Students | % Students |
| Nursery / Preschool | 0 | 0.0% |
| Kindergarten | 57 | 14.8% |
| Elementary School | 84 | 21.8% |
| Middle School | 85 | 22.0% |
| High School | 139 | 36.0% |
| College / Undergraduate | 21 | 5.4% |
| Graduate / Professional | 0 | 0.0% |
| Total | 386 | 100.0% |
School Enrollment by Age by Funding Source in Caney
Out of a total of 386 students who are enrolled in schools in Caney, 22 (5.7%) attend a private institution, while the remaining 364 (94.3%) are enrolled in public schools. The age group of 35 years and over has the highest likelihood of being enrolled in private schools, with 12 (100.0% in the age bracket) enrolled. Conversely, the age group of 10 to 14 year olds has the lowest likelihood of being enrolled in a private school, with 109 (100.0% in the age bracket) attending a public institution.
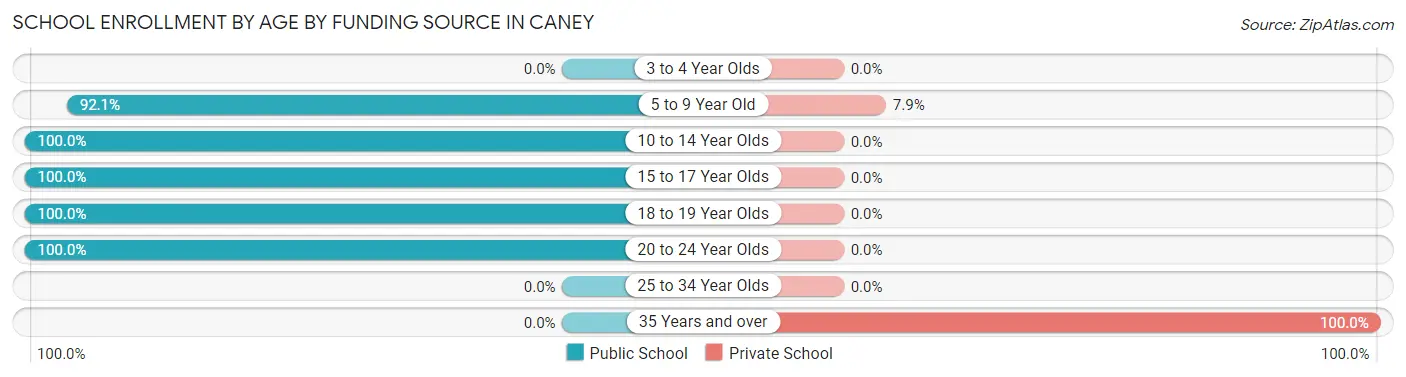
| Age Bracket | Public School | Private School |
| 3 to 4 Year Olds | 0 (0.0%) | 0 (0.0%) |
| 5 to 9 Year Old | 117 (92.1%) | 10 (7.9%) |
| 10 to 14 Year Olds | 109 (100.0%) | 0 (0.0%) |
| 15 to 17 Year Olds | 125 (100.0%) | 0 (0.0%) |
| 18 to 19 Year Olds | 7 (100.0%) | 0 (0.0%) |
| 20 to 24 Year Olds | 6 (100.0%) | 0 (0.0%) |
| 25 to 34 Year Olds | 0 (0.0%) | 0 (0.0%) |
| 35 Years and over | 0 (0.0%) | 12 (100.0%) |
| Total | 364 (94.3%) | 22 (5.7%) |
Educational Attainment by Field of Study in Caney
Education (45 | 29.6%), business (26 | 17.1%), science & technology (20 | 13.2%), communications (13 | 8.6%), and literature & languages (11 | 7.2%) are the most common fields of study among 152 individuals in Caney who have obtained a bachelor's degree or higher.
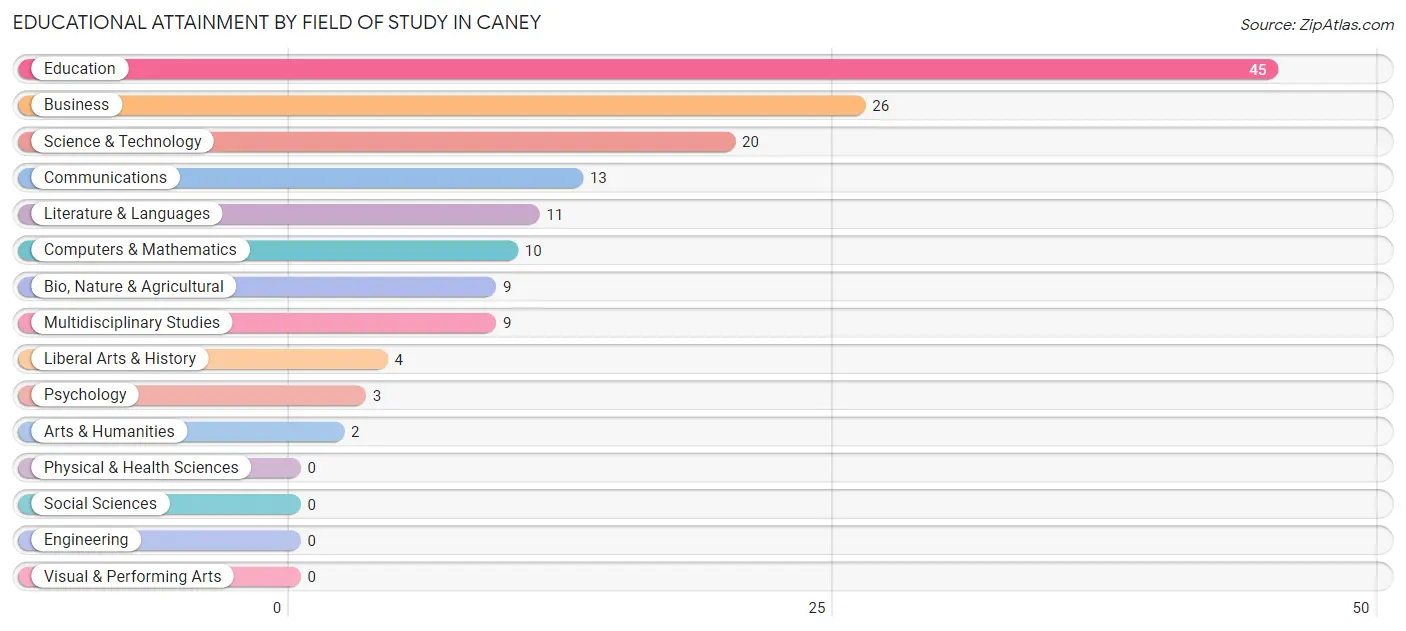
| Field of Study | # Graduates | % Graduates |
| Computers & Mathematics | 10 | 6.6% |
| Bio, Nature & Agricultural | 9 | 5.9% |
| Physical & Health Sciences | 0 | 0.0% |
| Psychology | 3 | 2.0% |
| Social Sciences | 0 | 0.0% |
| Engineering | 0 | 0.0% |
| Multidisciplinary Studies | 9 | 5.9% |
| Science & Technology | 20 | 13.2% |
| Business | 26 | 17.1% |
| Education | 45 | 29.6% |
| Literature & Languages | 11 | 7.2% |
| Liberal Arts & History | 4 | 2.6% |
| Visual & Performing Arts | 0 | 0.0% |
| Communications | 13 | 8.6% |
| Arts & Humanities | 2 | 1.3% |
| Total | 152 | 100.0% |
Transportation & Commute in Caney
Vehicle Availability by Sex in Caney
The most prevalent vehicle ownership categories in Caney are males with 2 vehicles (110, accounting for 37.9%) and females with 2 vehicles (87, making up 43.0%).
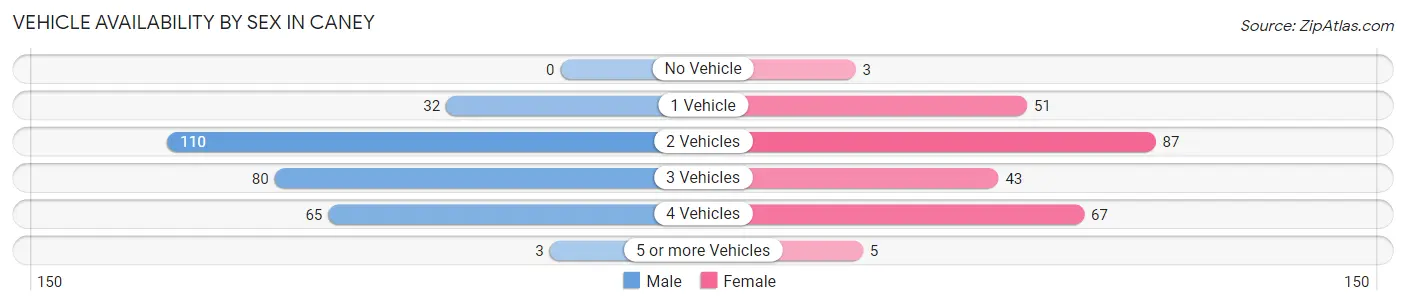
| Vehicles Available | Male | Female |
| No Vehicle | 0 (0.0%) | 3 (1.2%) |
| 1 Vehicle | 32 (11.0%) | 51 (19.9%) |
| 2 Vehicles | 110 (37.9%) | 87 (34.0%) |
| 3 Vehicles | 80 (27.6%) | 43 (16.8%) |
| 4 Vehicles | 65 (22.4%) | 67 (26.2%) |
| 5 or more Vehicles | 3 (1.0%) | 5 (1.9%) |
| Total | 290 (100.0%) | 256 (100.0%) |
Commute Time in Caney
The most frequently occuring commute durations in Caney are 5 to 9 minutes (103 commuters, 19.4%), 20 to 24 minutes (95 commuters, 17.9%), and less than 5 minutes (69 commuters, 13.0%).
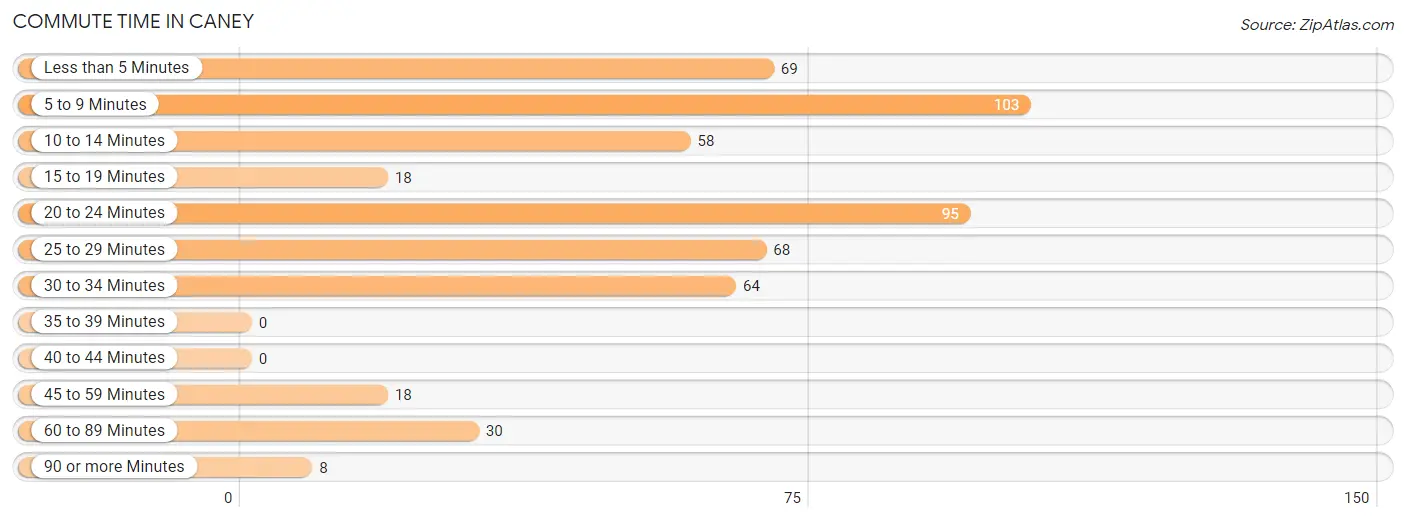
| Commute Time | # Commuters | % Commuters |
| Less than 5 Minutes | 69 | 13.0% |
| 5 to 9 Minutes | 103 | 19.4% |
| 10 to 14 Minutes | 58 | 10.9% |
| 15 to 19 Minutes | 18 | 3.4% |
| 20 to 24 Minutes | 95 | 17.9% |
| 25 to 29 Minutes | 68 | 12.8% |
| 30 to 34 Minutes | 64 | 12.0% |
| 35 to 39 Minutes | 0 | 0.0% |
| 40 to 44 Minutes | 0 | 0.0% |
| 45 to 59 Minutes | 18 | 3.4% |
| 60 to 89 Minutes | 30 | 5.7% |
| 90 or more Minutes | 8 | 1.5% |
Commute Time by Sex in Caney
The most common commute times in Caney are 20 to 24 minutes (61 commuters, 21.6%) for males and 5 to 9 minutes (57 commuters, 22.9%) for females.
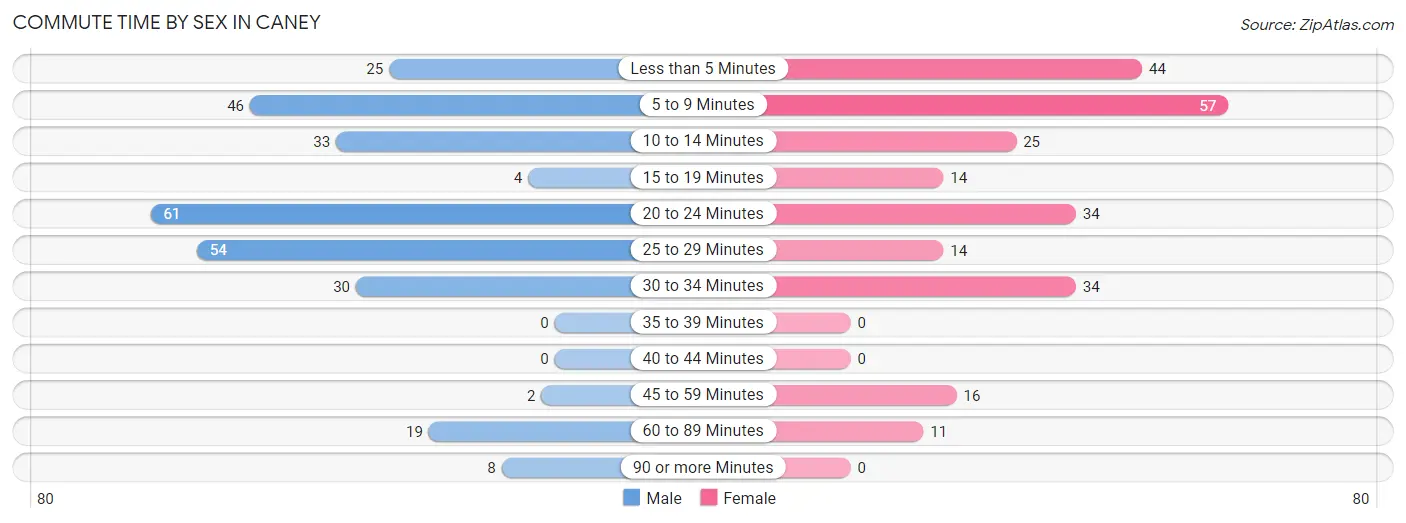
| Commute Time | Male | Female |
| Less than 5 Minutes | 25 (8.9%) | 44 (17.7%) |
| 5 to 9 Minutes | 46 (16.3%) | 57 (22.9%) |
| 10 to 14 Minutes | 33 (11.7%) | 25 (10.0%) |
| 15 to 19 Minutes | 4 (1.4%) | 14 (5.6%) |
| 20 to 24 Minutes | 61 (21.6%) | 34 (13.7%) |
| 25 to 29 Minutes | 54 (19.2%) | 14 (5.6%) |
| 30 to 34 Minutes | 30 (10.6%) | 34 (13.7%) |
| 35 to 39 Minutes | 0 (0.0%) | 0 (0.0%) |
| 40 to 44 Minutes | 0 (0.0%) | 0 (0.0%) |
| 45 to 59 Minutes | 2 (0.7%) | 16 (6.4%) |
| 60 to 89 Minutes | 19 (6.7%) | 11 (4.4%) |
| 90 or more Minutes | 8 (2.8%) | 0 (0.0%) |
Time of Departure to Work by Sex in Caney
The most frequent times of departure to work in Caney are 5:30 AM to 5:59 AM (45, 16.0%) for males and 5:30 AM to 5:59 AM (47, 18.9%) for females.
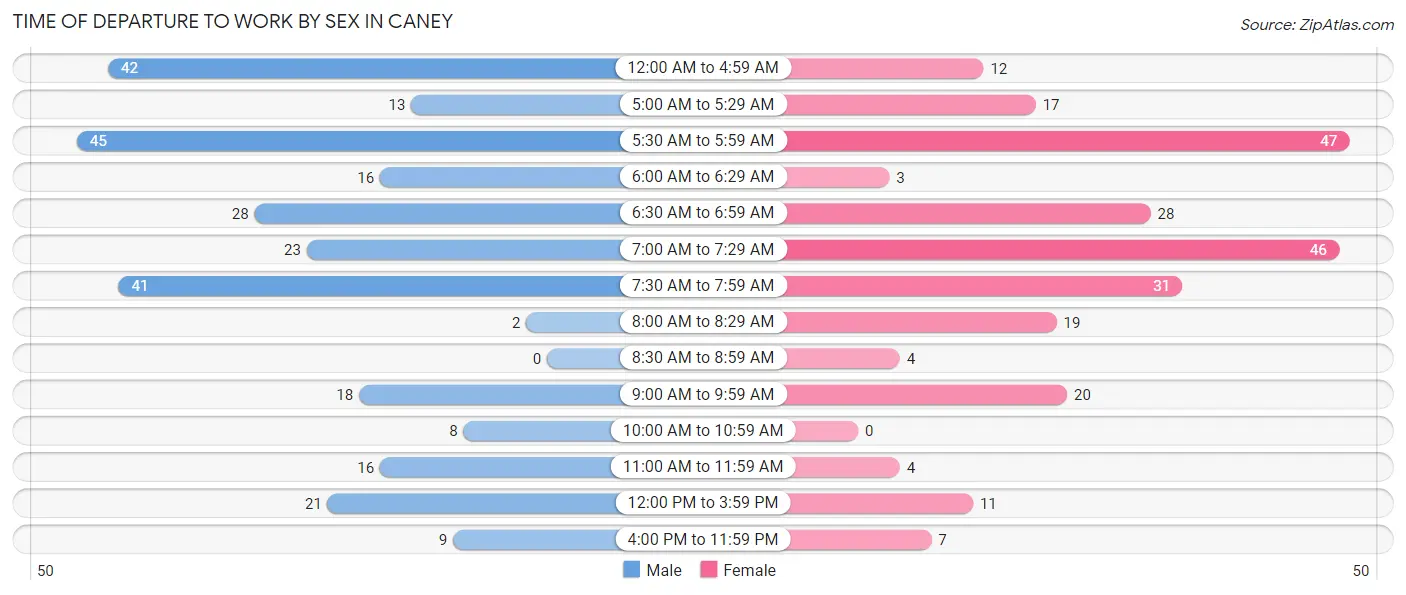
| Time of Departure | Male | Female |
| 12:00 AM to 4:59 AM | 42 (14.9%) | 12 (4.8%) |
| 5:00 AM to 5:29 AM | 13 (4.6%) | 17 (6.8%) |
| 5:30 AM to 5:59 AM | 45 (16.0%) | 47 (18.9%) |
| 6:00 AM to 6:29 AM | 16 (5.7%) | 3 (1.2%) |
| 6:30 AM to 6:59 AM | 28 (9.9%) | 28 (11.2%) |
| 7:00 AM to 7:29 AM | 23 (8.2%) | 46 (18.5%) |
| 7:30 AM to 7:59 AM | 41 (14.5%) | 31 (12.4%) |
| 8:00 AM to 8:29 AM | 2 (0.7%) | 19 (7.6%) |
| 8:30 AM to 8:59 AM | 0 (0.0%) | 4 (1.6%) |
| 9:00 AM to 9:59 AM | 18 (6.4%) | 20 (8.0%) |
| 10:00 AM to 10:59 AM | 8 (2.8%) | 0 (0.0%) |
| 11:00 AM to 11:59 AM | 16 (5.7%) | 4 (1.6%) |
| 12:00 PM to 3:59 PM | 21 (7.4%) | 11 (4.4%) |
| 4:00 PM to 11:59 PM | 9 (3.2%) | 7 (2.8%) |
| Total | 282 (100.0%) | 249 (100.0%) |
Housing Occupancy in Caney
Occupancy by Ownership in Caney
Of the total 629 dwellings in Caney, owner-occupied units account for 414 (65.8%), while renter-occupied units make up 215 (34.2%).
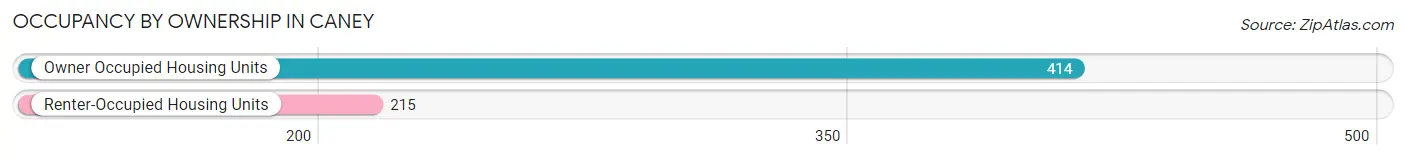
| Occupancy | # Housing Units | % Housing Units |
| Owner Occupied Housing Units | 414 | 65.8% |
| Renter-Occupied Housing Units | 215 | 34.2% |
| Total Occupied Housing Units | 629 | 100.0% |
Occupancy by Household Size in Caney
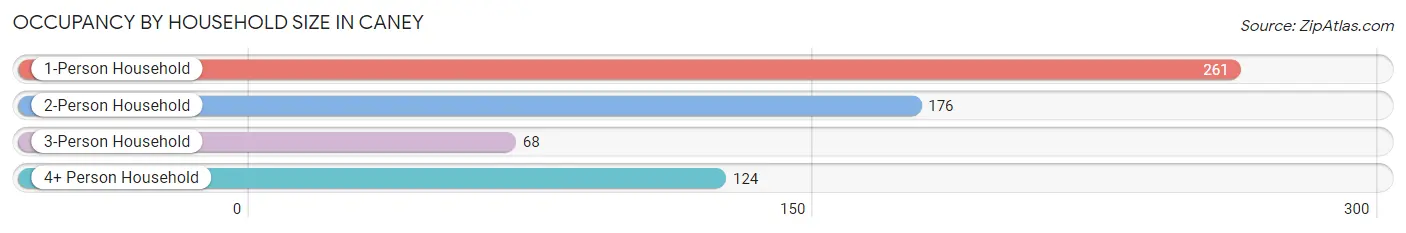
| Household Size | # Housing Units | % Housing Units |
| 1-Person Household | 261 | 41.5% |
| 2-Person Household | 176 | 28.0% |
| 3-Person Household | 68 | 10.8% |
| 4+ Person Household | 124 | 19.7% |
| Total Housing Units | 629 | 100.0% |
Occupancy by Ownership by Household Size in Caney
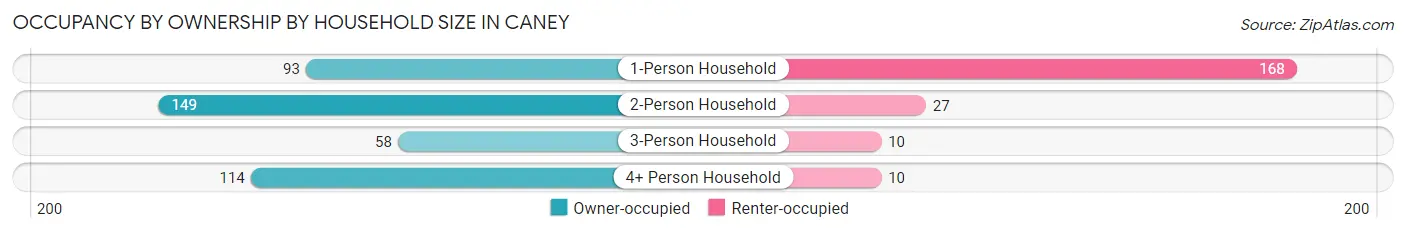
| Household Size | Owner-occupied | Renter-occupied |
| 1-Person Household | 93 (35.6%) | 168 (64.4%) |
| 2-Person Household | 149 (84.7%) | 27 (15.3%) |
| 3-Person Household | 58 (85.3%) | 10 (14.7%) |
| 4+ Person Household | 114 (91.9%) | 10 (8.1%) |
| Total Housing Units | 414 (65.8%) | 215 (34.2%) |
Occupancy by Educational Attainment in Caney
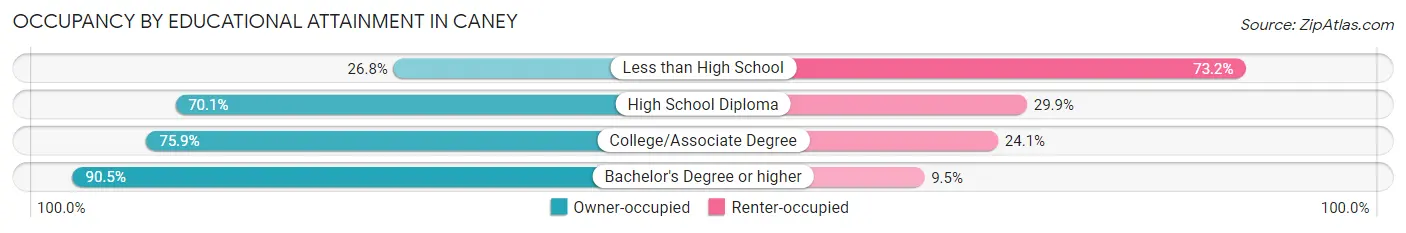
| Household Size | Owner-occupied | Renter-occupied |
| Less than High School | 33 (26.8%) | 90 (73.2%) |
| High School Diploma | 148 (70.1%) | 63 (29.9%) |
| College/Associate Degree | 176 (75.9%) | 56 (24.1%) |
| Bachelor's Degree or higher | 57 (90.5%) | 6 (9.5%) |
Occupancy by Age of Householder in Caney
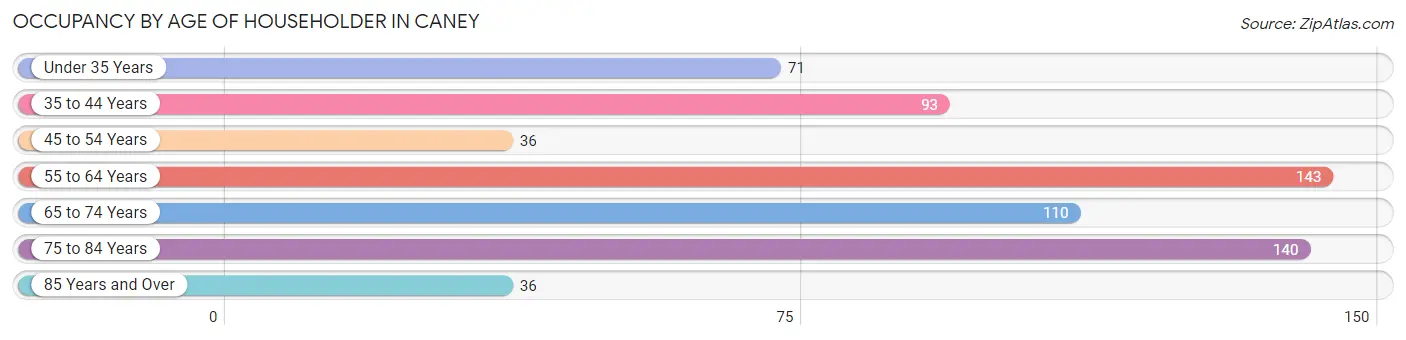
| Age Bracket | # Households | % Households |
| Under 35 Years | 71 | 11.3% |
| 35 to 44 Years | 93 | 14.8% |
| 45 to 54 Years | 36 | 5.7% |
| 55 to 64 Years | 143 | 22.7% |
| 65 to 74 Years | 110 | 17.5% |
| 75 to 84 Years | 140 | 22.3% |
| 85 Years and Over | 36 | 5.7% |
| Total | 629 | 100.0% |
Housing Finances in Caney
Median Income by Occupancy in Caney
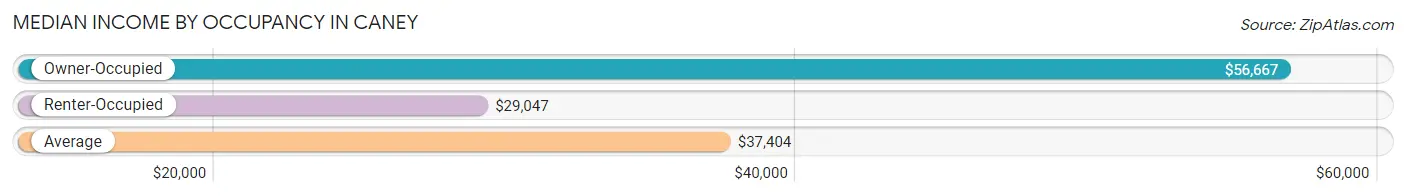
| Occupancy Type | # Households | Median Income |
| Owner-Occupied | 414 (65.8%) | $56,667 |
| Renter-Occupied | 215 (34.2%) | $29,047 |
| Average | 629 (100.0%) | $37,404 |
Occupancy by Householder Income Bracket in Caney
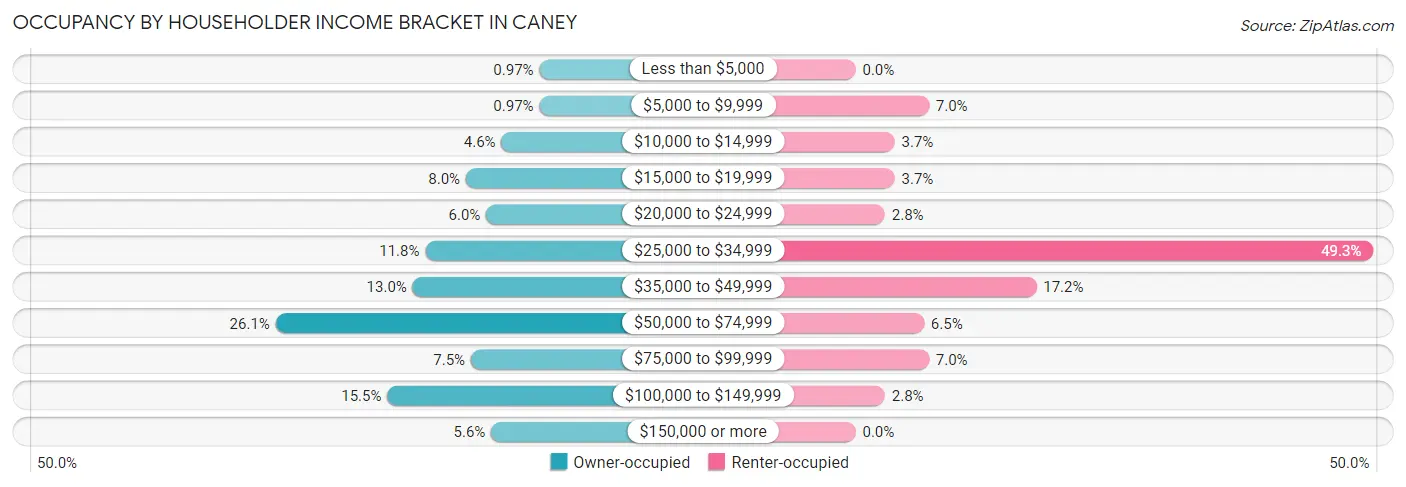
| Income Bracket | Owner-occupied | Renter-occupied |
| Less than $5,000 | 4 (1.0%) | 0 (0.0%) |
| $5,000 to $9,999 | 4 (1.0%) | 15 (7.0%) |
| $10,000 to $14,999 | 19 (4.6%) | 8 (3.7%) |
| $15,000 to $19,999 | 33 (8.0%) | 8 (3.7%) |
| $20,000 to $24,999 | 25 (6.0%) | 6 (2.8%) |
| $25,000 to $34,999 | 49 (11.8%) | 106 (49.3%) |
| $35,000 to $49,999 | 54 (13.0%) | 37 (17.2%) |
| $50,000 to $74,999 | 108 (26.1%) | 14 (6.5%) |
| $75,000 to $99,999 | 31 (7.5%) | 15 (7.0%) |
| $100,000 to $149,999 | 64 (15.5%) | 6 (2.8%) |
| $150,000 or more | 23 (5.6%) | 0 (0.0%) |
| Total | 414 (100.0%) | 215 (100.0%) |
Monthly Housing Cost Tiers in Caney
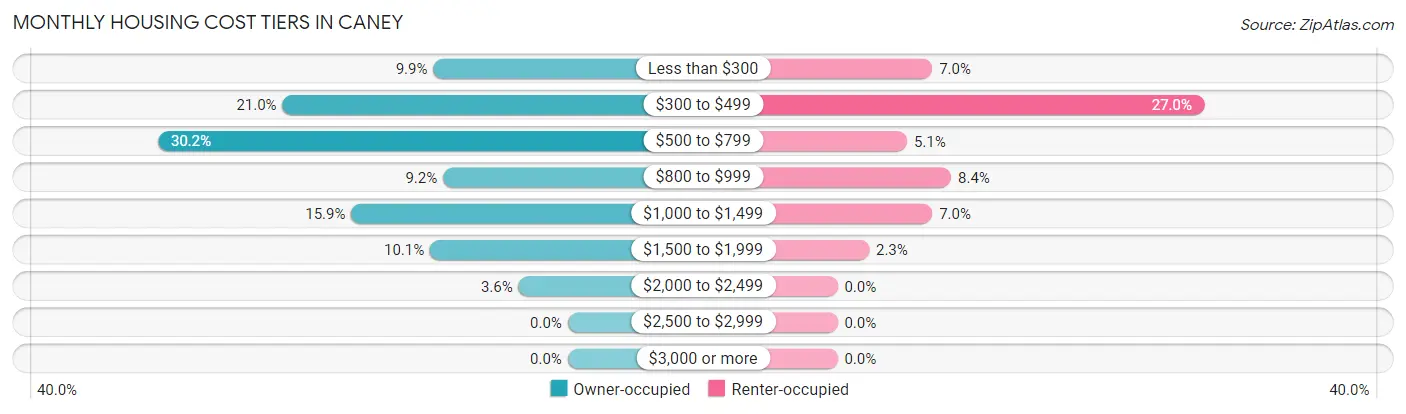
| Monthly Cost | Owner-occupied | Renter-occupied |
| Less than $300 | 41 (9.9%) | 15 (7.0%) |
| $300 to $499 | 87 (21.0%) | 58 (27.0%) |
| $500 to $799 | 125 (30.2%) | 11 (5.1%) |
| $800 to $999 | 38 (9.2%) | 18 (8.4%) |
| $1,000 to $1,499 | 66 (15.9%) | 15 (7.0%) |
| $1,500 to $1,999 | 42 (10.1%) | 5 (2.3%) |
| $2,000 to $2,499 | 15 (3.6%) | 0 (0.0%) |
| $2,500 to $2,999 | 0 (0.0%) | 0 (0.0%) |
| $3,000 or more | 0 (0.0%) | 0 (0.0%) |
| Total | 414 (100.0%) | 215 (100.0%) |
Physical Housing Characteristics in Caney
Housing Structures in Caney
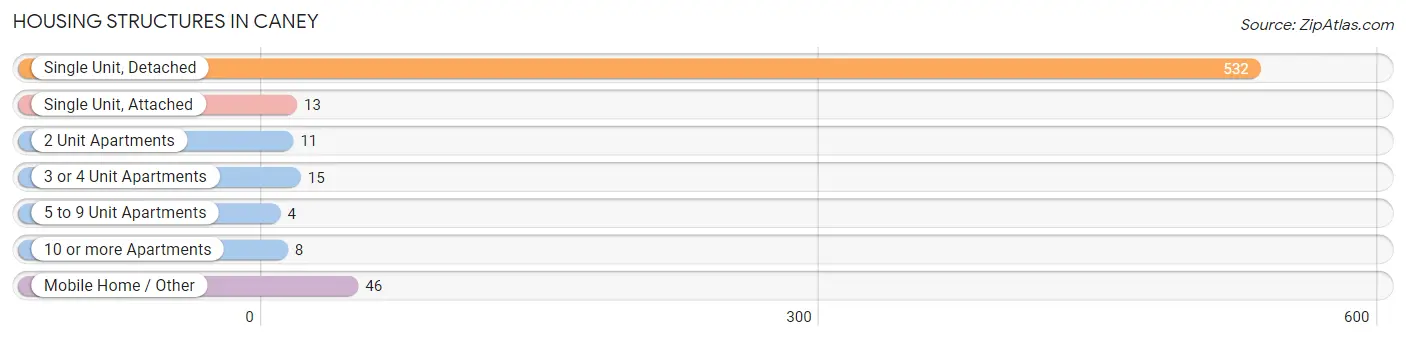
| Structure Type | # Housing Units | % Housing Units |
| Single Unit, Detached | 532 | 84.6% |
| Single Unit, Attached | 13 | 2.1% |
| 2 Unit Apartments | 11 | 1.8% |
| 3 or 4 Unit Apartments | 15 | 2.4% |
| 5 to 9 Unit Apartments | 4 | 0.6% |
| 10 or more Apartments | 8 | 1.3% |
| Mobile Home / Other | 46 | 7.3% |
| Total | 629 | 100.0% |
Housing Structures by Occupancy in Caney
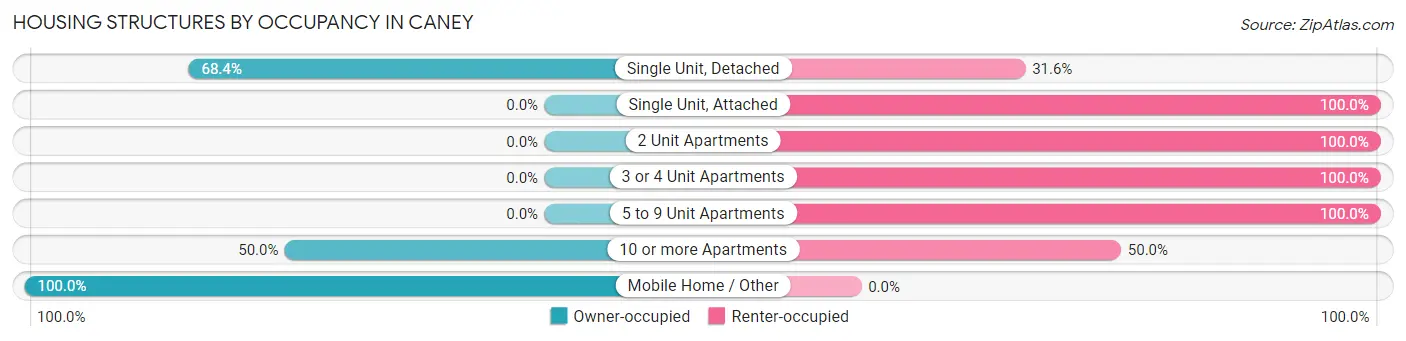
| Structure Type | Owner-occupied | Renter-occupied |
| Single Unit, Detached | 364 (68.4%) | 168 (31.6%) |
| Single Unit, Attached | 0 (0.0%) | 13 (100.0%) |
| 2 Unit Apartments | 0 (0.0%) | 11 (100.0%) |
| 3 or 4 Unit Apartments | 0 (0.0%) | 15 (100.0%) |
| 5 to 9 Unit Apartments | 0 (0.0%) | 4 (100.0%) |
| 10 or more Apartments | 4 (50.0%) | 4 (50.0%) |
| Mobile Home / Other | 46 (100.0%) | 0 (0.0%) |
| Total | 414 (65.8%) | 215 (34.2%) |
Housing Structures by Number of Rooms in Caney
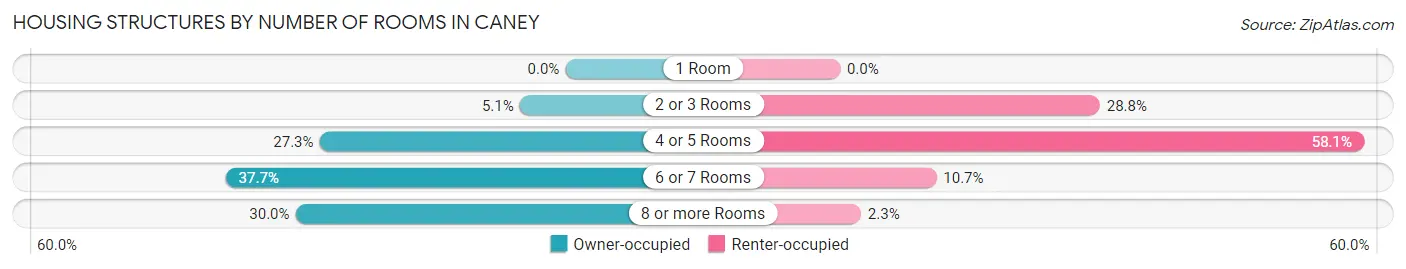
| Number of Rooms | Owner-occupied | Renter-occupied |
| 1 Room | 0 (0.0%) | 0 (0.0%) |
| 2 or 3 Rooms | 21 (5.1%) | 62 (28.8%) |
| 4 or 5 Rooms | 113 (27.3%) | 125 (58.1%) |
| 6 or 7 Rooms | 156 (37.7%) | 23 (10.7%) |
| 8 or more Rooms | 124 (29.9%) | 5 (2.3%) |
| Total | 414 (100.0%) | 215 (100.0%) |
Housing Structure by Heating Type in Caney
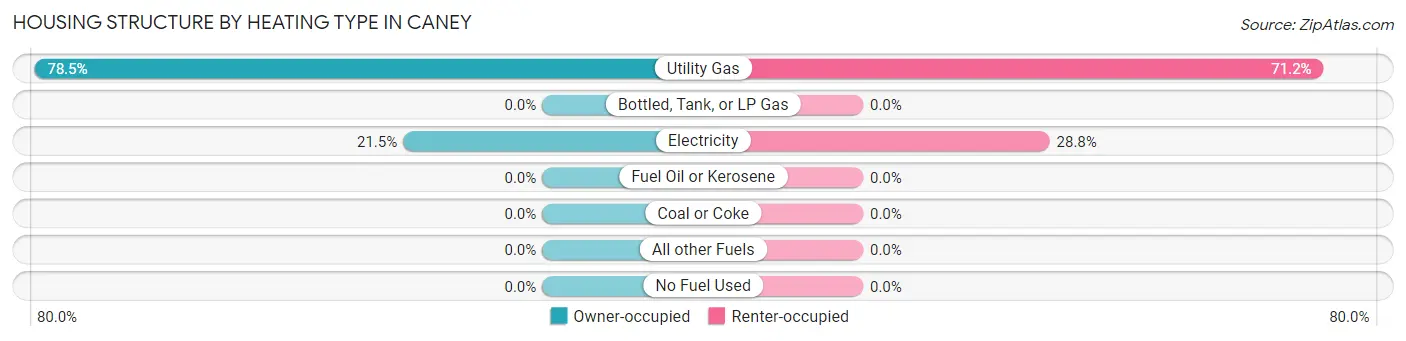
| Heating Type | Owner-occupied | Renter-occupied |
| Utility Gas | 325 (78.5%) | 153 (71.2%) |
| Bottled, Tank, or LP Gas | 0 (0.0%) | 0 (0.0%) |
| Electricity | 89 (21.5%) | 62 (28.8%) |
| Fuel Oil or Kerosene | 0 (0.0%) | 0 (0.0%) |
| Coal or Coke | 0 (0.0%) | 0 (0.0%) |
| All other Fuels | 0 (0.0%) | 0 (0.0%) |
| No Fuel Used | 0 (0.0%) | 0 (0.0%) |
| Total | 414 (100.0%) | 215 (100.0%) |
Household Vehicle Usage in Caney
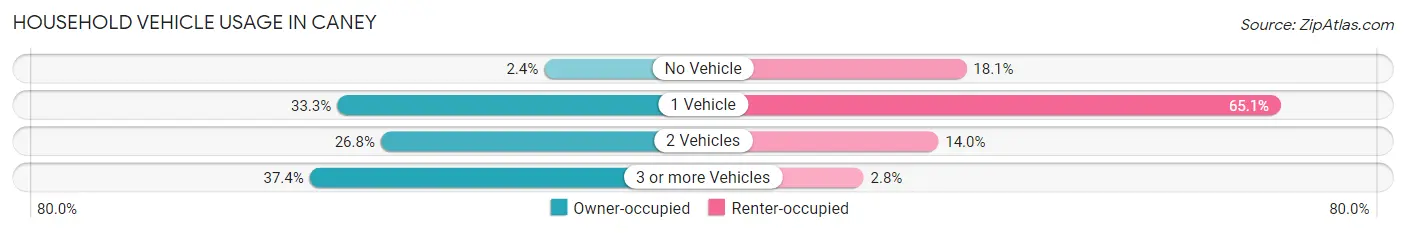
| Vehicles per Household | Owner-occupied | Renter-occupied |
| No Vehicle | 10 (2.4%) | 39 (18.1%) |
| 1 Vehicle | 138 (33.3%) | 140 (65.1%) |
| 2 Vehicles | 111 (26.8%) | 30 (14.0%) |
| 3 or more Vehicles | 155 (37.4%) | 6 (2.8%) |
| Total | 414 (100.0%) | 215 (100.0%) |
Real Estate & Mortgages in Caney
Real Estate and Mortgage Overview in Caney
| Characteristic | Without Mortgage | With Mortgage |
| Housing Units | 226 | 188 |
| Median Property Value | $39,500 | $81,300 |
| Median Household Income | $36,667 | $15 |
| Monthly Housing Costs | $446 | $0 |
| Real Estate Taxes | $875 | $0 |
Property Value by Mortgage Status in Caney
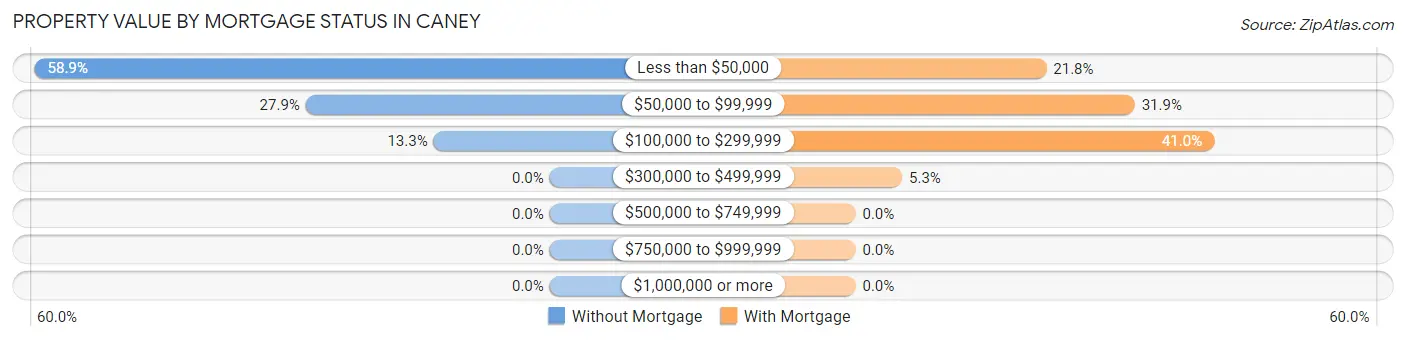
| Property Value | Without Mortgage | With Mortgage |
| Less than $50,000 | 133 (58.9%) | 41 (21.8%) |
| $50,000 to $99,999 | 63 (27.9%) | 60 (31.9%) |
| $100,000 to $299,999 | 30 (13.3%) | 77 (41.0%) |
| $300,000 to $499,999 | 0 (0.0%) | 10 (5.3%) |
| $500,000 to $749,999 | 0 (0.0%) | 0 (0.0%) |
| $750,000 to $999,999 | 0 (0.0%) | 0 (0.0%) |
| $1,000,000 or more | 0 (0.0%) | 0 (0.0%) |
| Total | 226 (100.0%) | 188 (100.0%) |
Household Income by Mortgage Status in Caney
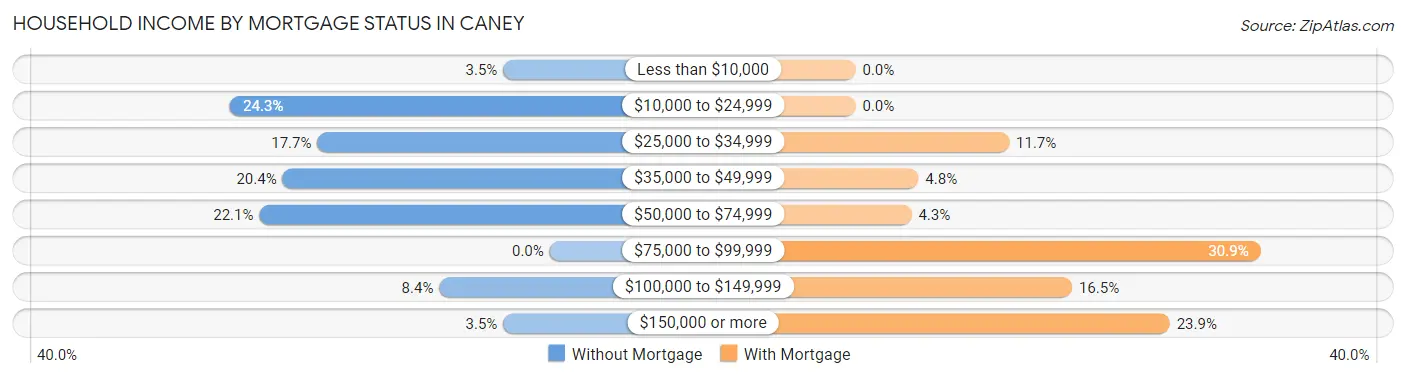
| Household Income | Without Mortgage | With Mortgage |
| Less than $10,000 | 8 (3.5%) | 0 (0.0%) |
| $10,000 to $24,999 | 55 (24.3%) | 0 (0.0%) |
| $25,000 to $34,999 | 40 (17.7%) | 22 (11.7%) |
| $35,000 to $49,999 | 46 (20.3%) | 9 (4.8%) |
| $50,000 to $74,999 | 50 (22.1%) | 8 (4.3%) |
| $75,000 to $99,999 | 0 (0.0%) | 58 (30.8%) |
| $100,000 to $149,999 | 19 (8.4%) | 31 (16.5%) |
| $150,000 or more | 8 (3.5%) | 45 (23.9%) |
| Total | 226 (100.0%) | 188 (100.0%) |
Property Value to Household Income Ratio in Caney
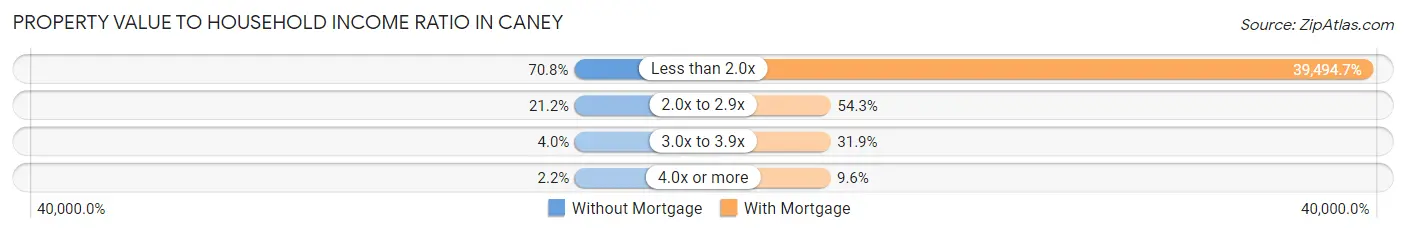
| Value-to-Income Ratio | Without Mortgage | With Mortgage |
| Less than 2.0x | 160 (70.8%) | 74,250 (39,494.7%) |
| 2.0x to 2.9x | 48 (21.2%) | 102 (54.3%) |
| 3.0x to 3.9x | 9 (4.0%) | 60 (31.9%) |
| 4.0x or more | 5 (2.2%) | 18 (9.6%) |
| Total | 226 (100.0%) | 188 (100.0%) |
Real Estate Taxes by Mortgage Status in Caney
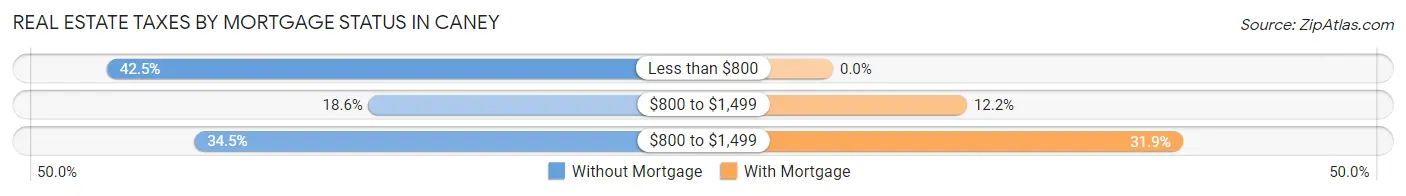
| Property Taxes | Without Mortgage | With Mortgage |
| Less than $800 | 96 (42.5%) | 0 (0.0%) |
| $800 to $1,499 | 42 (18.6%) | 23 (12.2%) |
| $800 to $1,499 | 78 (34.5%) | 60 (31.9%) |
| Total | 226 (100.0%) | 188 (100.0%) |
Health & Disability in Caney
Health Insurance Coverage by Age in Caney
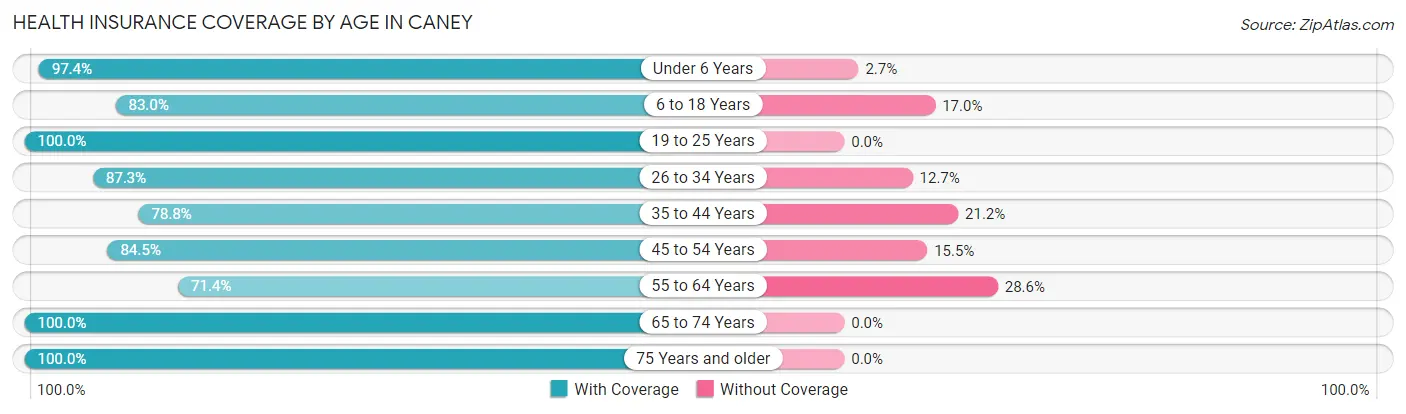
| Age Bracket | With Coverage | Without Coverage |
| Under 6 Years | 147 (97.4%) | 4 (2.6%) |
| 6 to 18 Years | 279 (83.0%) | 57 (17.0%) |
| 19 to 25 Years | 21 (100.0%) | 0 (0.0%) |
| 26 to 34 Years | 137 (87.3%) | 20 (12.7%) |
| 35 to 44 Years | 141 (78.8%) | 38 (21.2%) |
| 45 to 54 Years | 82 (84.5%) | 15 (15.5%) |
| 55 to 64 Years | 162 (71.4%) | 65 (28.6%) |
| 65 to 74 Years | 145 (100.0%) | 0 (0.0%) |
| 75 Years and older | 201 (100.0%) | 0 (0.0%) |
| Total | 1,315 (86.9%) | 199 (13.1%) |
Health Insurance Coverage by Citizenship Status in Caney
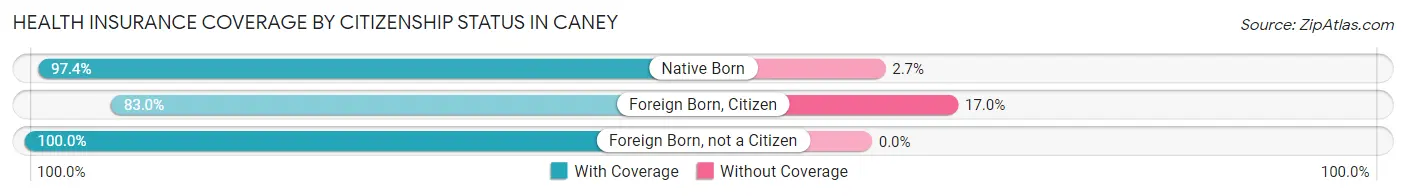
| Citizenship Status | With Coverage | Without Coverage |
| Native Born | 147 (97.4%) | 4 (2.6%) |
| Foreign Born, Citizen | 279 (83.0%) | 57 (17.0%) |
| Foreign Born, not a Citizen | 21 (100.0%) | 0 (0.0%) |
Health Insurance Coverage by Household Income in Caney
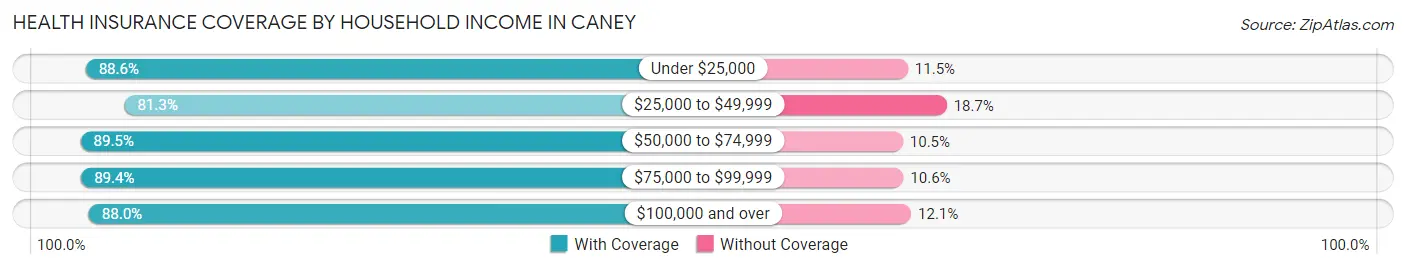
| Household Income | With Coverage | Without Coverage |
| Under $25,000 | 201 (88.5%) | 26 (11.5%) |
| $25,000 to $49,999 | 317 (81.3%) | 73 (18.7%) |
| $50,000 to $74,999 | 358 (89.5%) | 42 (10.5%) |
| $75,000 to $99,999 | 118 (89.4%) | 14 (10.6%) |
| $100,000 and over | 321 (87.9%) | 44 (12.0%) |
Public vs Private Health Insurance Coverage by Age in Caney
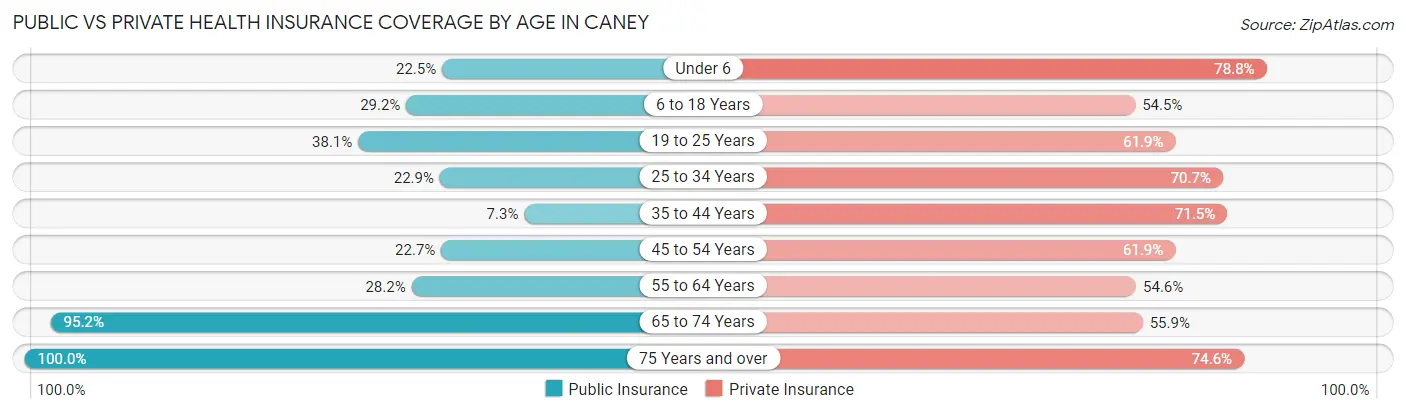
| Age Bracket | Public Insurance | Private Insurance |
| Under 6 | 34 (22.5%) | 119 (78.8%) |
| 6 to 18 Years | 98 (29.2%) | 183 (54.5%) |
| 19 to 25 Years | 8 (38.1%) | 13 (61.9%) |
| 25 to 34 Years | 36 (22.9%) | 111 (70.7%) |
| 35 to 44 Years | 13 (7.3%) | 128 (71.5%) |
| 45 to 54 Years | 22 (22.7%) | 60 (61.9%) |
| 55 to 64 Years | 64 (28.2%) | 124 (54.6%) |
| 65 to 74 Years | 138 (95.2%) | 81 (55.9%) |
| 75 Years and over | 201 (100.0%) | 150 (74.6%) |
| Total | 614 (40.6%) | 969 (64.0%) |
Disability Status by Sex by Age in Caney
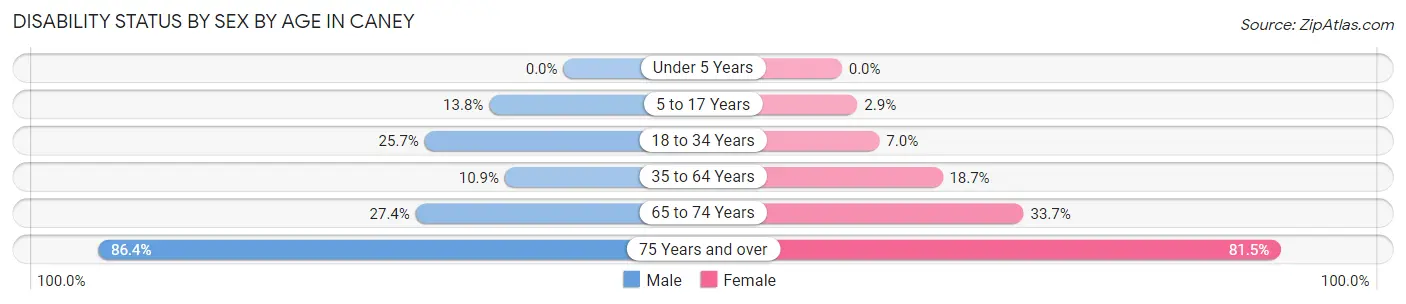
| Age Bracket | Male | Female |
| Under 5 Years | 0 (0.0%) | 0 (0.0%) |
| 5 to 17 Years | 23 (13.8%) | 6 (2.9%) |
| 18 to 34 Years | 26 (25.7%) | 6 (7.0%) |
| 35 to 64 Years | 25 (10.9%) | 51 (18.7%) |
| 65 to 74 Years | 17 (27.4%) | 28 (33.7%) |
| 75 Years and over | 38 (86.4%) | 128 (81.5%) |
Disability Class by Sex by Age in Caney
Disability Class: Hearing Difficulty
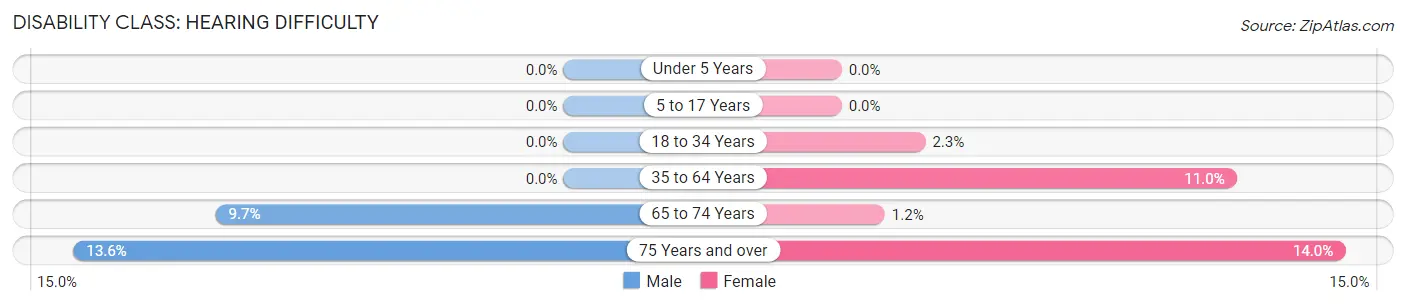
| Age Bracket | Male | Female |
| Under 5 Years | 0 (0.0%) | 0 (0.0%) |
| 5 to 17 Years | 0 (0.0%) | 0 (0.0%) |
| 18 to 34 Years | 0 (0.0%) | 2 (2.3%) |
| 35 to 64 Years | 0 (0.0%) | 30 (11.0%) |
| 65 to 74 Years | 6 (9.7%) | 1 (1.2%) |
| 75 Years and over | 6 (13.6%) | 22 (14.0%) |
Disability Class: Vision Difficulty
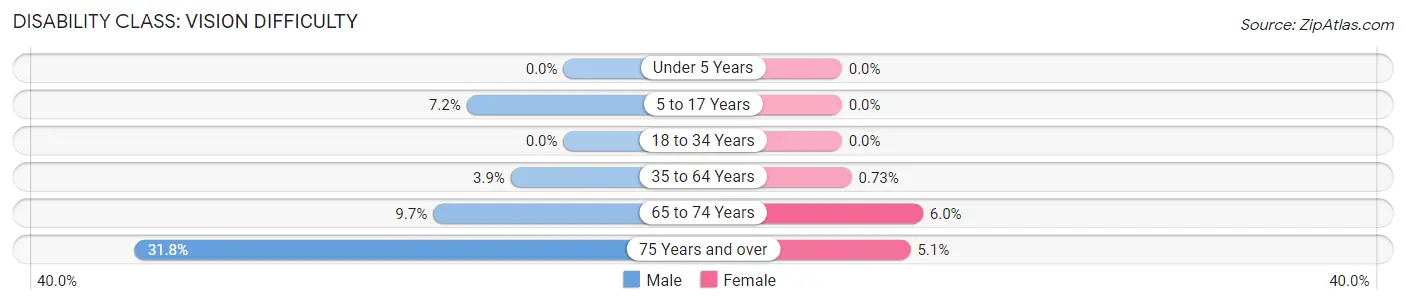
| Age Bracket | Male | Female |
| Under 5 Years | 0 (0.0%) | 0 (0.0%) |
| 5 to 17 Years | 12 (7.2%) | 0 (0.0%) |
| 18 to 34 Years | 0 (0.0%) | 0 (0.0%) |
| 35 to 64 Years | 9 (3.9%) | 2 (0.7%) |
| 65 to 74 Years | 6 (9.7%) | 5 (6.0%) |
| 75 Years and over | 14 (31.8%) | 8 (5.1%) |
Disability Class: Cognitive Difficulty
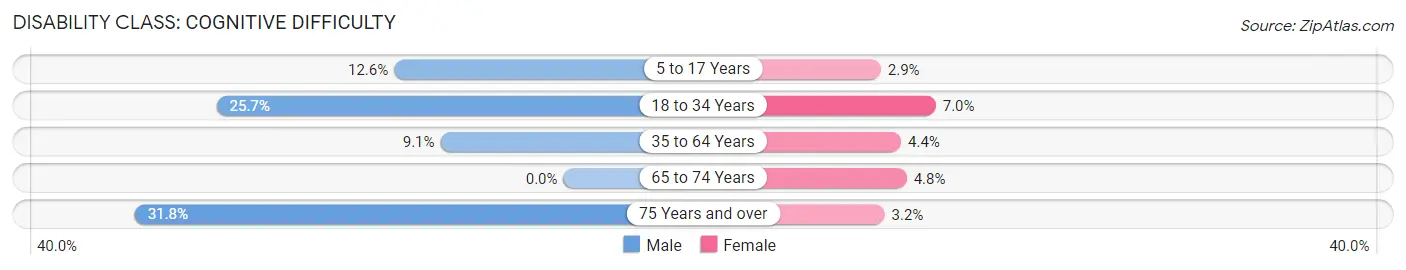
| Age Bracket | Male | Female |
| 5 to 17 Years | 21 (12.6%) | 6 (2.9%) |
| 18 to 34 Years | 26 (25.7%) | 6 (7.0%) |
| 35 to 64 Years | 21 (9.1%) | 12 (4.4%) |
| 65 to 74 Years | 0 (0.0%) | 4 (4.8%) |
| 75 Years and over | 14 (31.8%) | 5 (3.2%) |
Disability Class: Ambulatory Difficulty
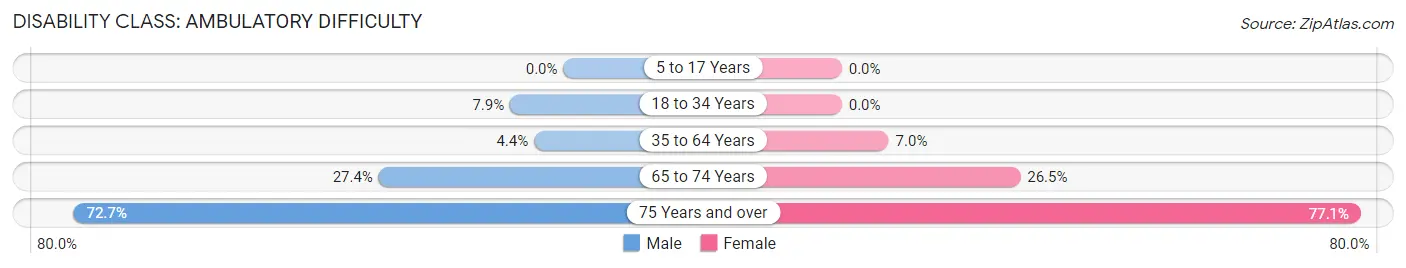
| Age Bracket | Male | Female |
| 5 to 17 Years | 0 (0.0%) | 0 (0.0%) |
| 18 to 34 Years | 8 (7.9%) | 0 (0.0%) |
| 35 to 64 Years | 10 (4.3%) | 19 (7.0%) |
| 65 to 74 Years | 17 (27.4%) | 22 (26.5%) |
| 75 Years and over | 32 (72.7%) | 121 (77.1%) |
Disability Class: Self-Care Difficulty
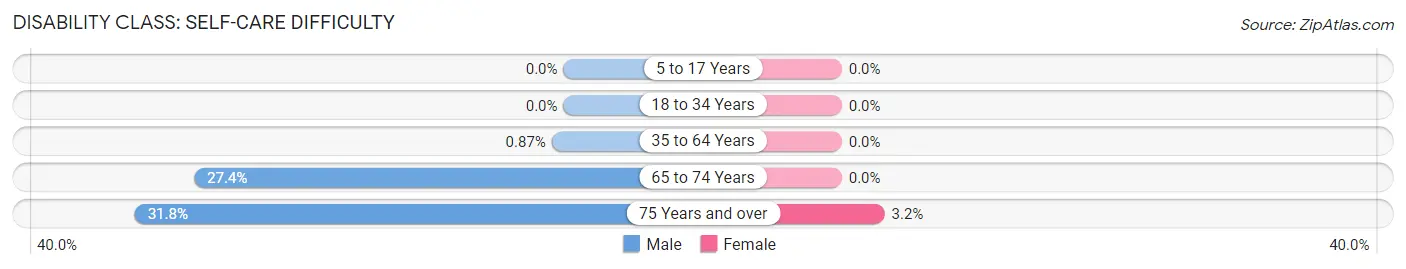
| Age Bracket | Male | Female |
| 5 to 17 Years | 0 (0.0%) | 0 (0.0%) |
| 18 to 34 Years | 0 (0.0%) | 0 (0.0%) |
| 35 to 64 Years | 2 (0.9%) | 0 (0.0%) |
| 65 to 74 Years | 17 (27.4%) | 0 (0.0%) |
| 75 Years and over | 14 (31.8%) | 5 (3.2%) |
Technology Access in Caney
Computing Device Access in Caney
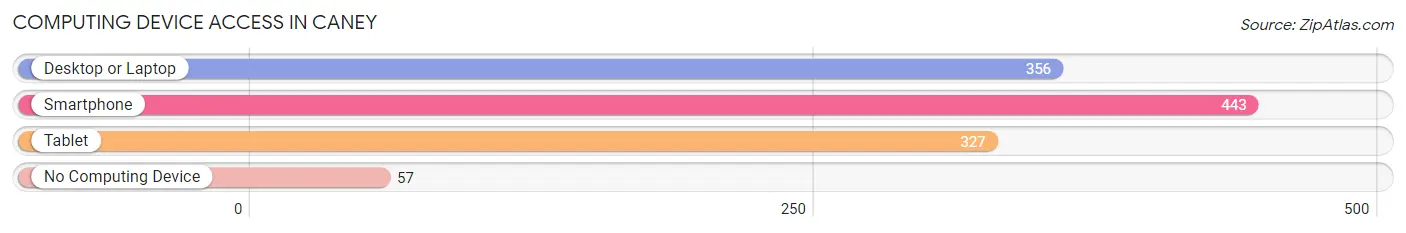
| Device Type | # Households | % Households |
| Desktop or Laptop | 356 | 56.6% |
| Smartphone | 443 | 70.4% |
| Tablet | 327 | 52.0% |
| No Computing Device | 57 | 9.1% |
| Total | 629 | 100.0% |
Internet Access in Caney
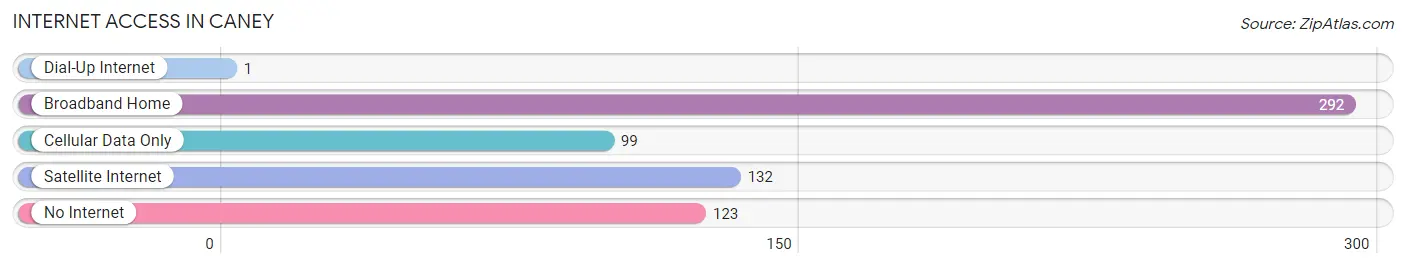
| Internet Type | # Households | % Households |
| Dial-Up Internet | 1 | 0.2% |
| Broadband Home | 292 | 46.4% |
| Cellular Data Only | 99 | 15.7% |
| Satellite Internet | 132 | 21.0% |
| No Internet | 123 | 19.6% |
| Total | 629 | 100.0% |
Caney Summary
Caney, Kansas is a small city located in Montgomery County, Kansas. It is situated in the southeastern corner of the state, approximately 30 miles south of the state capital of Topeka. The city has a population of approximately 2,500 people and is part of the Wichita metropolitan area.
History
Caney was founded in 1872 by a group of settlers from Missouri. The city was named after the nearby Caney River, which was named after the Caddo Indians who once lived in the area. The city was incorporated in 1887 and quickly became a thriving agricultural center. The city was also home to a number of businesses, including a flour mill, a brickyard, and a furniture factory.
In the early 1900s, Caney experienced a period of growth and prosperity. The city was home to a number of businesses, including a bank, a hotel, a newspaper, and a movie theater. The city also had a number of churches, including the First Baptist Church, which was founded in 1887.
In the 1950s, Caney began to experience a decline in population and economic activity. The city’s population dropped from a peak of 3,000 in 1950 to 2,500 in 2000. The city’s economy also suffered, as many of the businesses that had been located in the city closed or moved away.
Geography
Caney is located in the southeastern corner of Kansas, approximately 30 miles south of the state capital of Topeka. The city is situated in the Caney River Valley, which is part of the larger Flint Hills region of Kansas. The city is surrounded by rolling hills and is located near the confluence of the Caney and Verdigris Rivers.
The climate in Caney is characterized by hot, humid summers and cold, dry winters. The average annual temperature is around 54 degrees Fahrenheit, with an average high of around 79 degrees in the summer and an average low of around 30 degrees in the winter. The average annual precipitation is around 36 inches.
Economy
Caney’s economy is largely based on agriculture. The city is home to a number of farms, which produce a variety of crops, including corn, soybeans, wheat, and hay. The city is also home to a number of businesses, including a lumber yard, a feed store, and a hardware store.
The city is also home to a number of manufacturing businesses, including a furniture factory and a brickyard. The city is also home to a number of retail businesses, including a grocery store, a pharmacy, and a number of restaurants.
Demographics
As of the 2010 census, Caney had a population of 2,500 people. The racial makeup of the city was 95.2% White, 0.8% African American, 0.4% Native American, 0.4% Asian, 0.2% Pacific Islander, and 2.8% from other races. The median household income was $37,500, and the median family income was $45,000.
The city is home to a number of churches, including the First Baptist Church, which was founded in 1887. The city is also home to a number of schools, including Caney Elementary School, Caney Middle School, and Caney High School. The city is served by the Montgomery County Public Library.
Common Questions
What is Per Capita Income in Caney?
Per Capita income in Caney is $23,201.
What is the Median Family Income in Caney?
Median Family Income in Caney is $64,327.
What is the Median Household income in Caney?
Median Household Income in Caney is $37,404.
What is Income or Wage Gap in Caney?
Income or Wage Gap in Caney is 43.7%.
Women in Caney earn 56.3 cents for every dollar earned by a man.
What is Inequality or Gini Index in Caney?
Inequality or Gini Index in Caney is 0.38.
What is the Total Population of Caney?
Total Population of Caney is 1,543.
What is the Total Male Population of Caney?
Total Male Population of Caney is 628.
What is the Total Female Population of Caney?
Total Female Population of Caney is 915.
What is the Ratio of Males per 100 Females in Caney?
There are 68.63 Males per 100 Females in Caney.
What is the Ratio of Females per 100 Males in Caney?
There are 145.70 Females per 100 Males in Caney.
What is the Median Population Age in Caney?
Median Population Age in Caney is 41.6 Years.
What is the Average Family Size in Caney
Average Family Size in Caney is 3.4 People.
What is the Average Household Size in Caney
Average Household Size in Caney is 2.4 People.
How Large is the Labor Force in Caney?
There are 578 People in the Labor Forcein in Caney.
What is the Percentage of People in the Labor Force in Caney?
50.2% of People are in the Labor Force in Caney.
What is the Unemployment Rate in Caney?
Unemployment Rate in Caney is 5.5%.