Cities with the Lowest Poverty Level Among Children Under the Age of 5 in North Carolina
RELATED REPORTS & OPTIONS
Lowest Poverty | Child 0-5
North Carolina
Compare Cities
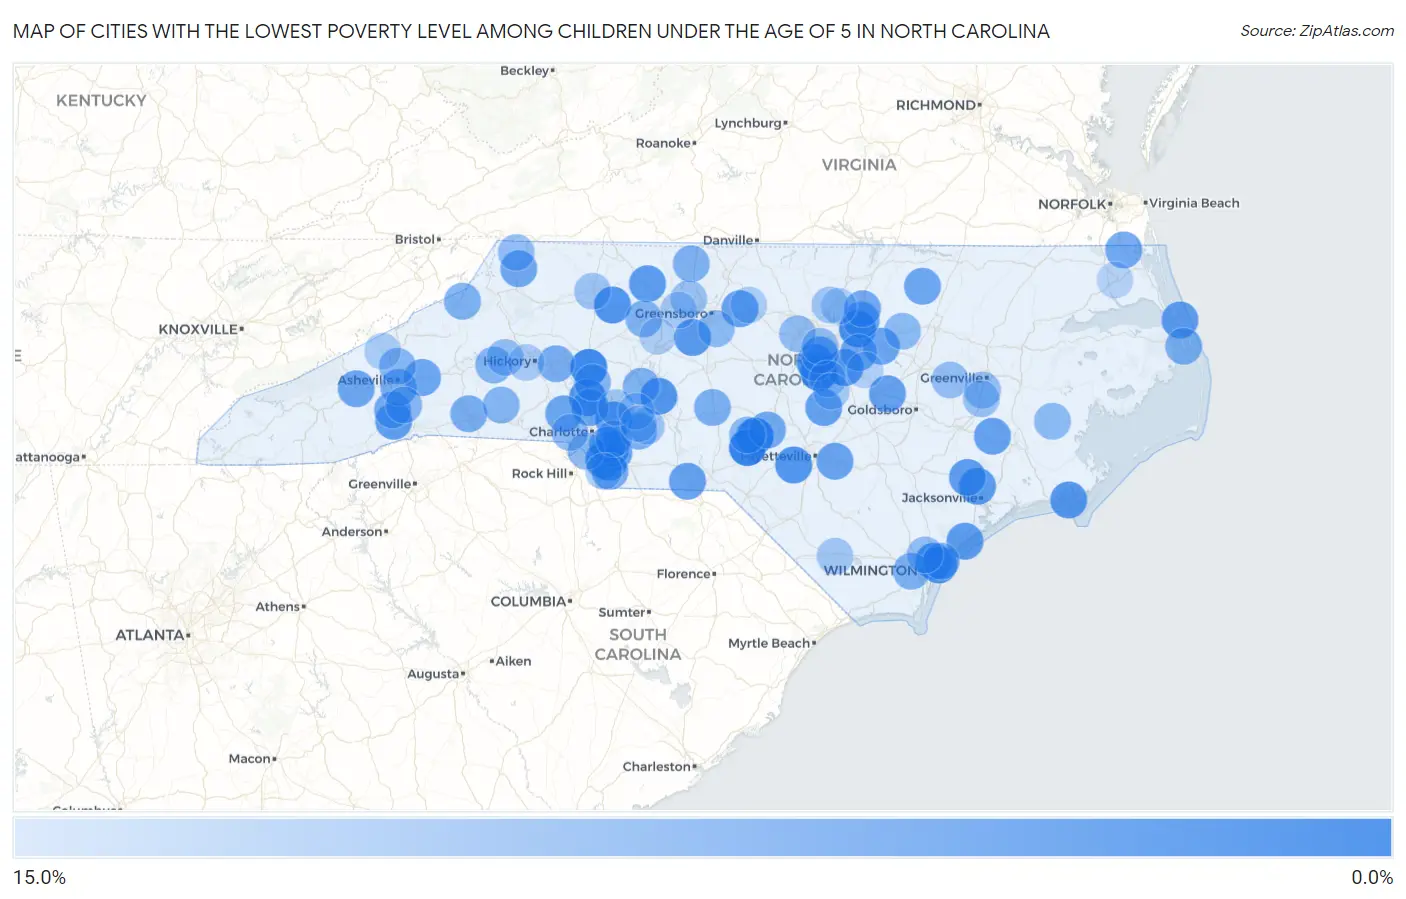
Map of Cities with the Lowest Poverty Level Among Children Under the Age of 5 in North Carolina
15.0%
0.0%
Cities with the Lowest Poverty Level Among Children Under the Age of 5 in North Carolina
| City | Child Poverty | vs State | vs National | |
| 1. | Southern Pines | 0.48% | 20.3%(-19.8)#1 | 18.1%(-17.6)#20 |
| 2. | Pinebluff | 0.56% | 20.3%(-19.7)#2 | 18.1%(-17.5)#27 |
| 3. | Troutman | 1.2% | 20.3%(-19.0)#3 | 18.1%(-16.8)#144 |
| 4. | Holly Springs | 1.3% | 20.3%(-19.0)#4 | 18.1%(-16.7)#164 |
| 5. | Wake Forest | 1.8% | 20.3%(-18.5)#5 | 18.1%(-16.3)#287 |
| 6. | Weddington | 2.0% | 20.3%(-18.3)#6 | 18.1%(-16.1)#328 |
| 7. | Yadkinville | 2.8% | 20.3%(-17.5)#7 | 18.1%(-15.3)#608 |
| 8. | Cornelius | 2.8% | 20.3%(-17.5)#8 | 18.1%(-15.2)#638 |
| 9. | Murraysville | 2.9% | 20.3%(-17.4)#9 | 18.1%(-15.1)#677 |
| 10. | Rockfish | 3.0% | 20.3%(-17.3)#10 | 18.1%(-15.1)#710 |
| 11. | Richfield | 3.1% | 20.3%(-17.2)#11 | 18.1%(-15.0)#734 |
| 12. | Garner | 3.2% | 20.3%(-17.1)#12 | 18.1%(-14.9)#774 |
| 13. | Ogden | 3.2% | 20.3%(-17.1)#13 | 18.1%(-14.9)#775 |
| 14. | Apex | 3.2% | 20.3%(-17.0)#14 | 18.1%(-14.8)#810 |
| 15. | Beaufort | 3.3% | 20.3%(-16.9)#15 | 18.1%(-14.7)#839 |
| 16. | Harrisburg | 3.4% | 20.3%(-16.9)#16 | 18.1%(-14.6)#884 |
| 17. | Archdale | 3.6% | 20.3%(-16.7)#17 | 18.1%(-14.5)#946 |
| 18. | Half Moon | 3.7% | 20.3%(-16.6)#18 | 18.1%(-14.3)#1,010 |
| 19. | Indian Trail | 3.7% | 20.3%(-16.5)#19 | 18.1%(-14.3)#1,017 |
| 20. | King | 3.8% | 20.3%(-16.5)#20 | 18.1%(-14.2)#1,051 |
| 21. | Surf City | 3.9% | 20.3%(-16.4)#21 | 18.1%(-14.2)#1,074 |
| 22. | Richlands | 3.9% | 20.3%(-16.4)#22 | 18.1%(-14.2)#1,085 |
| 23. | Etowah | 4.1% | 20.3%(-16.1)#23 | 18.1%(-13.9)#1,173 |
| 24. | Kill Devil Hills | 4.2% | 20.3%(-16.1)#24 | 18.1%(-13.9)#1,214 |
| 25. | Lillington | 4.3% | 20.3%(-15.9)#25 | 18.1%(-13.7)#1,266 |
| 26. | Pine Level | 4.6% | 20.3%(-15.7)#26 | 18.1%(-13.5)#1,377 |
| 27. | Cary | 4.7% | 20.3%(-15.6)#27 | 18.1%(-13.4)#1,420 |
| 28. | Cove City | 4.8% | 20.3%(-15.5)#28 | 18.1%(-13.3)#1,455 |
| 29. | Morven | 4.8% | 20.3%(-15.5)#29 | 18.1%(-13.3)#1,462 |
| 30. | Gibsonville | 4.8% | 20.3%(-15.5)#30 | 18.1%(-13.3)#1,491 |
| 31. | Stedman | 4.9% | 20.3%(-15.3)#31 | 18.1%(-13.1)#1,545 |
| 32. | Wesley Chapel | 5.1% | 20.3%(-15.2)#32 | 18.1%(-12.9)#1,622 |
| 33. | Spout Springs | 5.2% | 20.3%(-15.1)#33 | 18.1%(-12.9)#1,642 |
| 34. | Zebulon | 5.2% | 20.3%(-15.1)#34 | 18.1%(-12.9)#1,643 |
| 35. | Stallings | 5.2% | 20.3%(-15.1)#35 | 18.1%(-12.9)#1,648 |
| 36. | Huntersville | 5.2% | 20.3%(-15.1)#36 | 18.1%(-12.9)#1,661 |
| 37. | Hollister | 5.3% | 20.3%(-15.0)#37 | 18.1%(-12.8)#1,687 |
| 38. | Black Mountain | 5.3% | 20.3%(-15.0)#38 | 18.1%(-12.8)#1,705 |
| 39. | Stanley | 5.4% | 20.3%(-14.9)#39 | 18.1%(-12.6)#1,758 |
| 40. | West Jefferson | 5.5% | 20.3%(-14.8)#40 | 18.1%(-12.6)#1,768 |
| 41. | Clyde | 5.5% | 20.3%(-14.8)#41 | 18.1%(-12.6)#1,780 |
| 42. | Youngsville | 5.6% | 20.3%(-14.7)#42 | 18.1%(-12.5)#1,798 |
| 43. | Matthews | 5.7% | 20.3%(-14.6)#43 | 18.1%(-12.4)#1,855 |
| 44. | Franklinton | 5.7% | 20.3%(-14.6)#44 | 18.1%(-12.4)#1,870 |
| 45. | Moyock | 5.7% | 20.3%(-14.6)#45 | 18.1%(-12.4)#1,872 |
| 46. | Vass | 5.9% | 20.3%(-14.4)#46 | 18.1%(-12.1)#1,958 |
| 47. | Mills River | 6.0% | 20.3%(-14.3)#47 | 18.1%(-12.1)#1,967 |
| 48. | Knightdale | 6.0% | 20.3%(-14.3)#48 | 18.1%(-12.1)#1,990 |
| 49. | Mineral Springs | 6.1% | 20.3%(-14.1)#49 | 18.1%(-11.9)#2,037 |
| 50. | Biltmore Forest | 6.4% | 20.3%(-13.9)#50 | 18.1%(-11.7)#2,158 |
| 51. | Claremont | 6.5% | 20.3%(-13.8)#51 | 18.1%(-11.6)#2,189 |
| 52. | Spindale | 6.5% | 20.3%(-13.8)#52 | 18.1%(-11.5)#2,196 |
| 53. | Star | 6.8% | 20.3%(-13.5)#53 | 18.1%(-11.3)#2,320 |
| 54. | Stanfield | 6.8% | 20.3%(-13.5)#54 | 18.1%(-11.3)#2,326 |
| 55. | Leland | 6.8% | 20.3%(-13.5)#55 | 18.1%(-11.3)#2,332 |
| 56. | Elk Park | 6.9% | 20.3%(-13.4)#56 | 18.1%(-11.2)#2,375 |
| 57. | Wanchese | 6.9% | 20.3%(-13.4)#57 | 18.1%(-11.1)#2,391 |
| 58. | Mayodan | 7.0% | 20.3%(-13.3)#58 | 18.1%(-11.1)#2,422 |
| 59. | Rockwell | 7.0% | 20.3%(-13.2)#59 | 18.1%(-11.0)#2,442 |
| 60. | Porters Neck | 7.3% | 20.3%(-13.0)#60 | 18.1%(-10.8)#2,535 |
| 61. | Clemmons | 7.4% | 20.3%(-12.9)#61 | 18.1%(-10.7)#2,572 |
| 62. | Salem | 7.5% | 20.3%(-12.8)#62 | 18.1%(-10.6)#2,633 |
| 63. | Mooresville | 7.6% | 20.3%(-12.7)#63 | 18.1%(-10.5)#2,656 |
| 64. | Polkville | 7.7% | 20.3%(-12.6)#64 | 18.1%(-10.4)#2,721 |
| 65. | Weaverville | 7.8% | 20.3%(-12.4)#65 | 18.1%(-10.2)#2,779 |
| 66. | Fletcher | 7.9% | 20.3%(-12.4)#66 | 18.1%(-10.1)#2,802 |
| 67. | Pineville | 8.0% | 20.3%(-12.3)#67 | 18.1%(-10.0)#2,844 |
| 68. | Pinehurst | 8.1% | 20.3%(-12.2)#68 | 18.1%(-9.97)#2,864 |
| 69. | Mint Hill | 8.3% | 20.3%(-12.0)#69 | 18.1%(-9.74)#2,945 |
| 70. | Pleasant Garden | 8.3% | 20.3%(-11.9)#70 | 18.1%(-9.73)#2,949 |
| 71. | Spring Hope | 8.3% | 20.3%(-11.9)#71 | 18.1%(-9.73)#2,961 |
| 72. | Aurora | 8.3% | 20.3%(-11.9)#72 | 18.1%(-9.73)#2,969 |
| 73. | Belmont | 8.6% | 20.3%(-11.7)#73 | 18.1%(-9.44)#3,094 |
| 74. | Skippers Corner | 8.8% | 20.3%(-11.5)#74 | 18.1%(-9.26)#3,170 |
| 75. | Chapel Hill | 8.9% | 20.3%(-11.4)#75 | 18.1%(-9.18)#3,198 |
| 76. | Drexel | 9.0% | 20.3%(-11.3)#76 | 18.1%(-9.09)#3,234 |
| 77. | Walstonburg | 9.1% | 20.3%(-11.2)#77 | 18.1%(-8.97)#3,309 |
| 78. | Lansing | 9.1% | 20.3%(-11.2)#78 | 18.1%(-8.97)#3,311 |
| 79. | Morrisville | 9.1% | 20.3%(-11.2)#79 | 18.1%(-8.94)#3,322 |
| 80. | Winterville | 9.3% | 20.3%(-11.0)#80 | 18.1%(-8.74)#3,400 |
| 81. | Ayden | 9.4% | 20.3%(-10.8)#81 | 18.1%(-8.61)#3,436 |
| 82. | Oak Ridge | 9.7% | 20.3%(-10.6)#82 | 18.1%(-8.41)#3,528 |
| 83. | Jonesville | 9.9% | 20.3%(-10.4)#83 | 18.1%(-8.15)#3,612 |
| 84. | Fuquay Varina | 10.0% | 20.3%(-10.3)#84 | 18.1%(-8.09)#3,618 |
| 85. | Red Cross | 10.0% | 20.3%(-10.3)#85 | 18.1%(-8.06)#3,646 |
| 86. | Butner | 10.1% | 20.3%(-10.2)#86 | 18.1%(-8.01)#3,687 |
| 87. | Waxhaw | 10.3% | 20.3%(-9.97)#87 | 18.1%(-7.75)#3,780 |
| 88. | Concord | 10.3% | 20.3%(-9.93)#88 | 18.1%(-7.71)#3,796 |
| 89. | Whiteville | 10.4% | 20.3%(-9.88)#89 | 18.1%(-7.66)#3,808 |
| 90. | Mount Pleasant | 10.5% | 20.3%(-9.75)#90 | 18.1%(-7.54)#3,861 |
| 91. | Angier | 10.7% | 20.3%(-9.54)#91 | 18.1%(-7.32)#3,954 |
| 92. | Kernersville | 10.8% | 20.3%(-9.47)#92 | 18.1%(-7.26)#3,973 |
| 93. | Hildebran | 11.0% | 20.3%(-9.30)#93 | 18.1%(-7.09)#4,032 |
| 94. | Locust | 11.1% | 20.3%(-9.17)#94 | 18.1%(-6.95)#4,068 |
| 95. | Glen Raven | 11.1% | 20.3%(-9.17)#95 | 18.1%(-6.95)#4,070 |
| 96. | Marshall | 11.1% | 20.3%(-9.17)#96 | 18.1%(-6.95)#4,100 |
| 97. | Welcome | 11.3% | 20.3%(-8.96)#97 | 18.1%(-6.74)#4,193 |
| 98. | Creedmoor | 11.8% | 20.3%(-8.48)#98 | 18.1%(-6.26)#4,385 |
| 99. | Clayton | 11.8% | 20.3%(-8.45)#99 | 18.1%(-6.24)#4,396 |
| 100. | Elizabeth City | 12.1% | 20.3%(-8.13)#100 | 18.1%(-5.91)#4,507 |
Common Questions
What are the Top 10 Cities with the Lowest Poverty Level Among Children Under the Age of 5 in North Carolina?
Top 10 Cities with the Lowest Poverty Level Among Children Under the Age of 5 in North Carolina are:
#1
0.48%
#2
0.56%
#3
1.2%
#4
1.3%
#5
1.8%
#6
2.0%
#7
2.8%
#8
2.8%
#9
2.9%
#10
3.0%
What city has the Lowest Poverty Level Among Children Under the Age of 5 in North Carolina?
Southern Pines has the Lowest Poverty Level Among Children Under the Age of 5 in North Carolina with 0.48%.
What is the Poverty Level Among Children Under the Age of 5 in the State of North Carolina?
Poverty Level Among Children Under the Age of 5 in North Carolina is 20.3%.
What is the Poverty Level Among Children Under the Age of 5 in the United States?
Poverty Level Among Children Under the Age of 5 in the United States is 18.1%.