Chaska, MN Map & Demographics
Chaska Map
Chaska Overview
$50,819
PER CAPITA INCOME
$135,849
AVG FAMILY INCOME
$99,988
AVG HOUSEHOLD INCOME
30.1%
WAGE / INCOME GAP [ % ]
69.9¢/ $1
WAGE / INCOME GAP [ $ ]
0.42
INEQUALITY / GINI INDEX
27,764
TOTAL POPULATION
13,366
MALE POPULATION
14,398
FEMALE POPULATION
92.83
MALES / 100 FEMALES
107.72
FEMALES / 100 MALES
37.2
MEDIAN AGE
3.2
AVG FAMILY SIZE
2.6
AVG HOUSEHOLD SIZE
15,876
LABOR FORCE [ PEOPLE ]
75.1%
PERCENT IN LABOR FORCE
2.3%
UNEMPLOYMENT RATE
Chaska Zip Codes
Chaska Area Codes
Income in Chaska
Income Overview in Chaska
Per Capita Income in Chaska is $50,819, while median incomes of families and households are $135,849 and $99,988 respectively.
| Characteristic | Number | Measure |
| Per Capita Income | 27,764 | $50,819 |
| Median Family Income | 7,044 | $135,849 |
| Mean Family Income | 7,044 | $155,568 |
| Median Household Income | 10,449 | $99,988 |
| Mean Household Income | 10,449 | $130,741 |
| Income Deficit | 7,044 | $0 |
| Wage / Income Gap (%) | 27,764 | 30.10% |
| Wage / Income Gap ($) | 27,764 | 69.90¢ per $1 |
| Gini / Inequality Index | 27,764 | 0.42 |
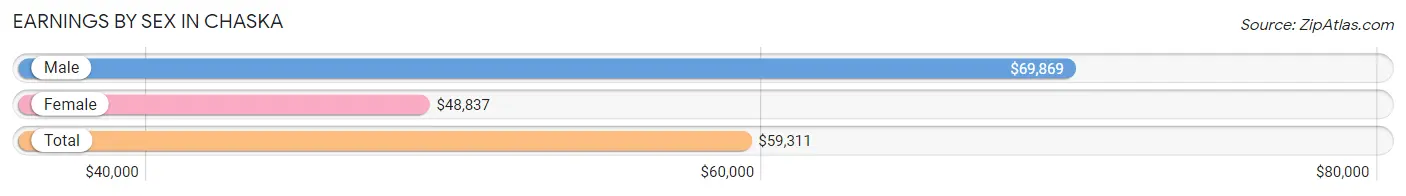
Earnings by Sex in Chaska
Average Earnings in Chaska are $59,311, $69,869 for men and $48,837 for women, a difference of 30.1%.
| Sex | Number | Average Earnings |
| Male | 8,543 (52.8%) | $69,869 |
| Female | 7,647 (47.2%) | $48,837 |
| Total | 16,190 (100.0%) | $59,311 |
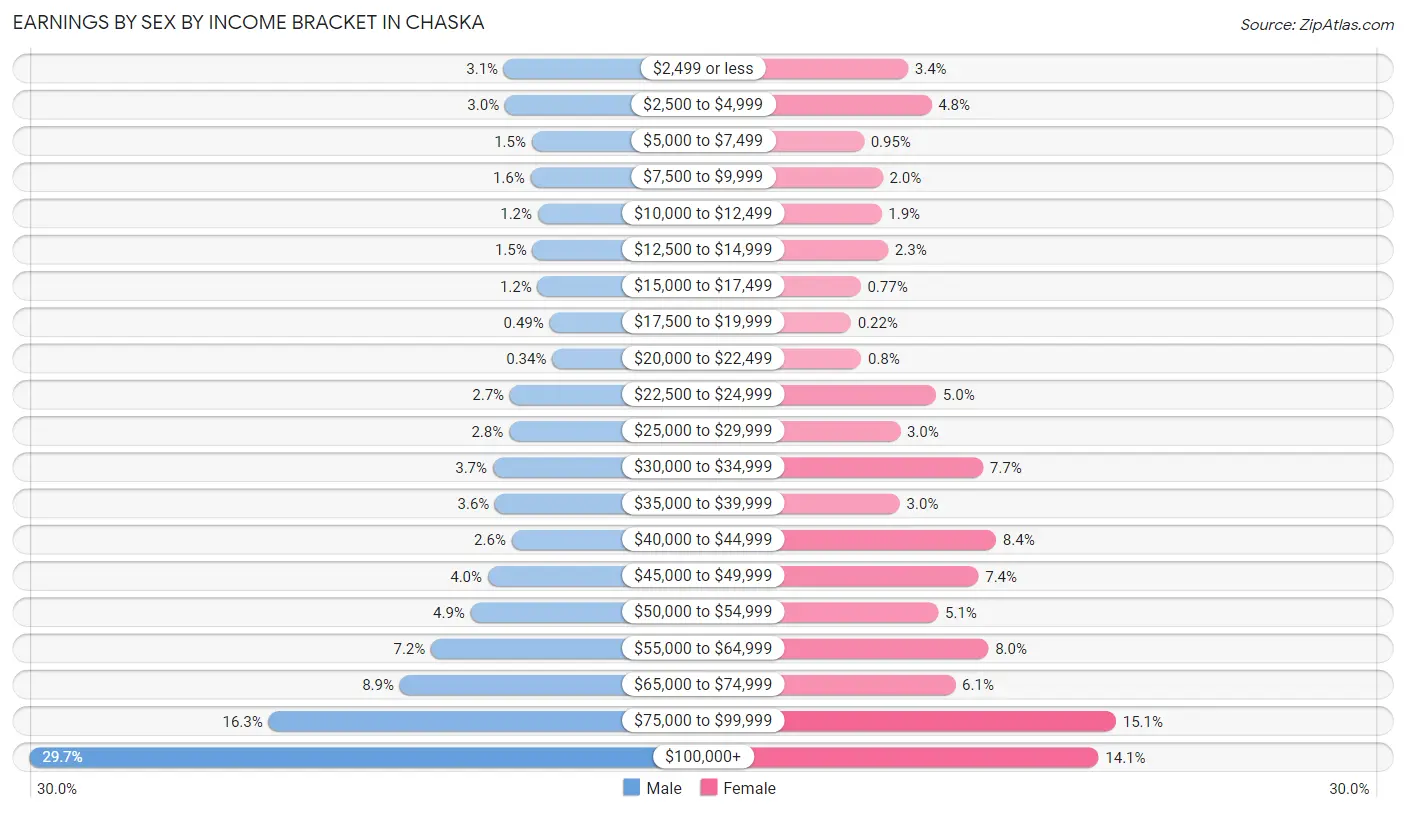
Earnings by Sex by Income Bracket in Chaska
The most common earnings brackets in Chaska are $100,000+ for men (2,540 | 29.7%) and $75,000 to $99,999 for women (1,156 | 15.1%).
| Income | Male | Female |
| $2,499 or less | 261 (3.1%) | 262 (3.4%) |
| $2,500 to $4,999 | 256 (3.0%) | 363 (4.8%) |
| $5,000 to $7,499 | 127 (1.5%) | 73 (0.9%) |
| $7,500 to $9,999 | 133 (1.6%) | 154 (2.0%) |
| $10,000 to $12,499 | 98 (1.1%) | 148 (1.9%) |
| $12,500 to $14,999 | 124 (1.5%) | 177 (2.3%) |
| $15,000 to $17,499 | 100 (1.2%) | 59 (0.8%) |
| $17,500 to $19,999 | 42 (0.5%) | 17 (0.2%) |
| $20,000 to $22,499 | 29 (0.3%) | 61 (0.8%) |
| $22,500 to $24,999 | 232 (2.7%) | 383 (5.0%) |
| $25,000 to $29,999 | 237 (2.8%) | 229 (3.0%) |
| $30,000 to $34,999 | 314 (3.7%) | 585 (7.6%) |
| $35,000 to $39,999 | 303 (3.5%) | 227 (3.0%) |
| $40,000 to $44,999 | 224 (2.6%) | 641 (8.4%) |
| $45,000 to $49,999 | 338 (4.0%) | 565 (7.4%) |
| $50,000 to $54,999 | 421 (4.9%) | 392 (5.1%) |
| $55,000 to $64,999 | 611 (7.1%) | 608 (8.0%) |
| $65,000 to $74,999 | 761 (8.9%) | 466 (6.1%) |
| $75,000 to $99,999 | 1,392 (16.3%) | 1,156 (15.1%) |
| $100,000+ | 2,540 (29.7%) | 1,081 (14.1%) |
| Total | 8,543 (100.0%) | 7,647 (100.0%) |
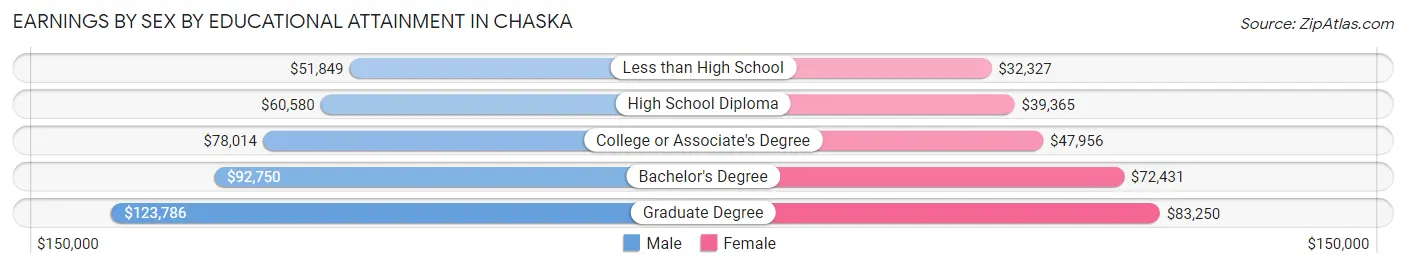
Earnings by Sex by Educational Attainment in Chaska
Average earnings in Chaska are $80,137 for men and $55,702 for women, a difference of 30.5%. Men with an educational attainment of graduate degree enjoy the highest average annual earnings of $123,786, while those with less than high school education earn the least with $51,849. Women with an educational attainment of graduate degree earn the most with the average annual earnings of $83,250, while those with less than high school education have the smallest earnings of $32,327.
| Educational Attainment | Male Income | Female Income |
| Less than High School | $51,849 | $32,327 |
| High School Diploma | $60,580 | $39,365 |
| College or Associate's Degree | $78,014 | $47,956 |
| Bachelor's Degree | $92,750 | $72,431 |
| Graduate Degree | $123,786 | $83,250 |
| Total | $80,137 | $55,702 |
Family Income in Chaska
Family Income Brackets in Chaska
According to the Chaska family income data, there are 1,564 families falling into the $200,000+ income range, which is the most common income bracket and makes up 22.2% of all families.
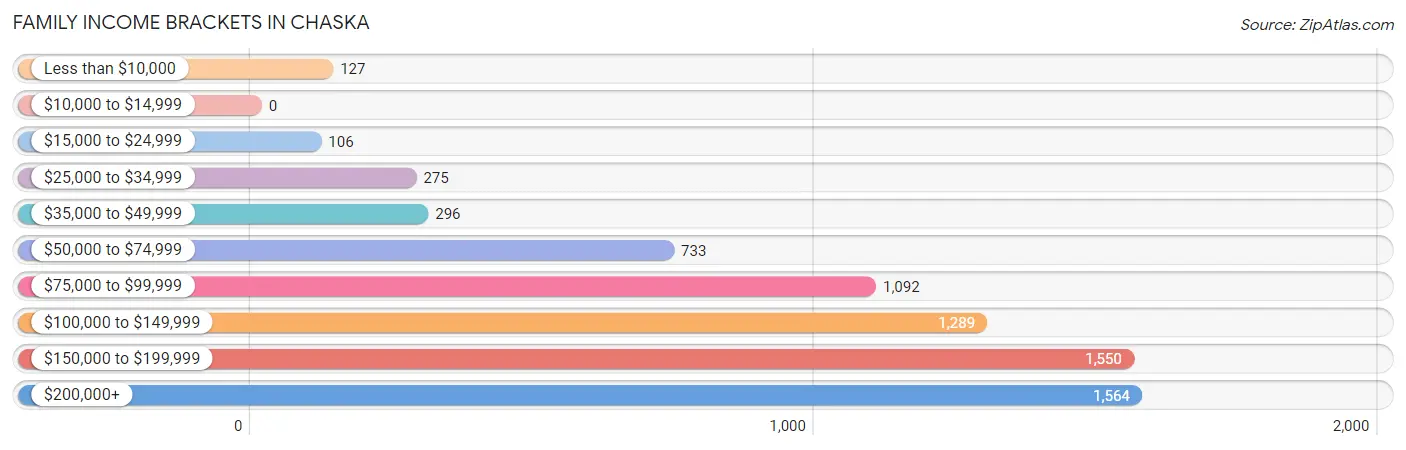
| Income Bracket | # Families | % Families |
| Less than $10,000 | 127 | 1.8% |
| $10,000 to $14,999 | 0 | 0.0% |
| $15,000 to $24,999 | 106 | 1.5% |
| $25,000 to $34,999 | 275 | 3.9% |
| $35,000 to $49,999 | 296 | 4.2% |
| $50,000 to $74,999 | 733 | 10.4% |
| $75,000 to $99,999 | 1,092 | 15.5% |
| $100,000 to $149,999 | 1,289 | 18.3% |
| $150,000 to $199,999 | 1,550 | 22.0% |
| $200,000+ | 1,564 | 22.2% |
Family Income by Famaliy Size in Chaska
5-person families (782 | 11.1%) account for the highest median family income in Chaska with $178,182 per family, while 3-person families (1,692 | 24.0%) have the highest median income of $46,824 per family member.
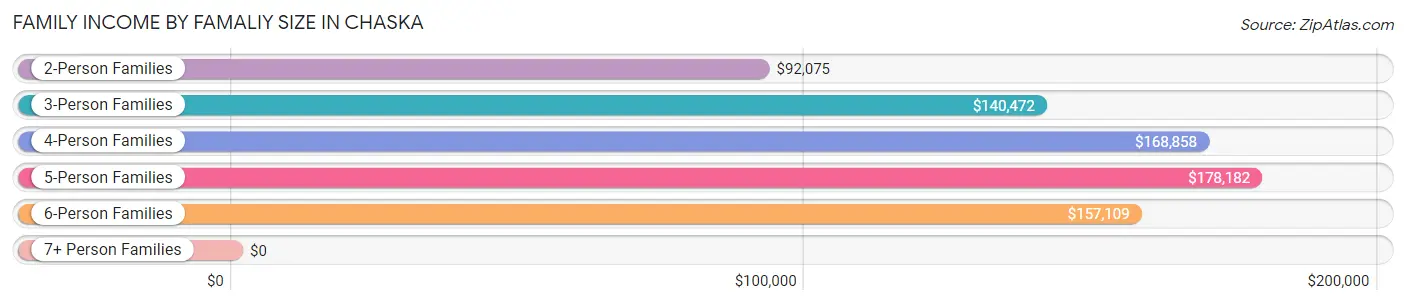
| Income Bracket | # Families | Median Income |
| 2-Person Families | 2,817 (40.0%) | $92,075 |
| 3-Person Families | 1,692 (24.0%) | $140,472 |
| 4-Person Families | 1,415 (20.1%) | $168,858 |
| 5-Person Families | 782 (11.1%) | $178,182 |
| 6-Person Families | 303 (4.3%) | $157,109 |
| 7+ Person Families | 35 (0.5%) | $0 |
| Total | 7,044 (100.0%) | $135,849 |
Family Income by Number of Earners in Chaska
The median family income in Chaska is $135,849, with families comprising 3+ earners (1,068) having the highest median family income of $172,917, while families with no earners (669) have the lowest median family income of $69,327, accounting for 15.2% and 9.5% of families, respectively.
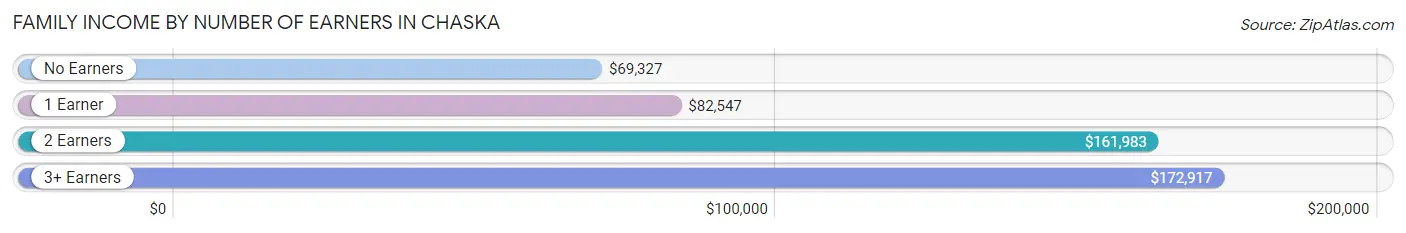
| Number of Earners | # Families | Median Income |
| No Earners | 669 (9.5%) | $69,327 |
| 1 Earner | 1,976 (28.1%) | $82,547 |
| 2 Earners | 3,331 (47.3%) | $161,983 |
| 3+ Earners | 1,068 (15.2%) | $172,917 |
| Total | 7,044 (100.0%) | $135,849 |
Household Income in Chaska
Household Income Brackets in Chaska
With 1,787 households falling in the category, the $200,000+ income range is the most frequent in Chaska, accounting for 17.1% of all households. In contrast, only 136 households (1.3%) fall into the $10,000 to $14,999 income bracket, making it the least populous group.
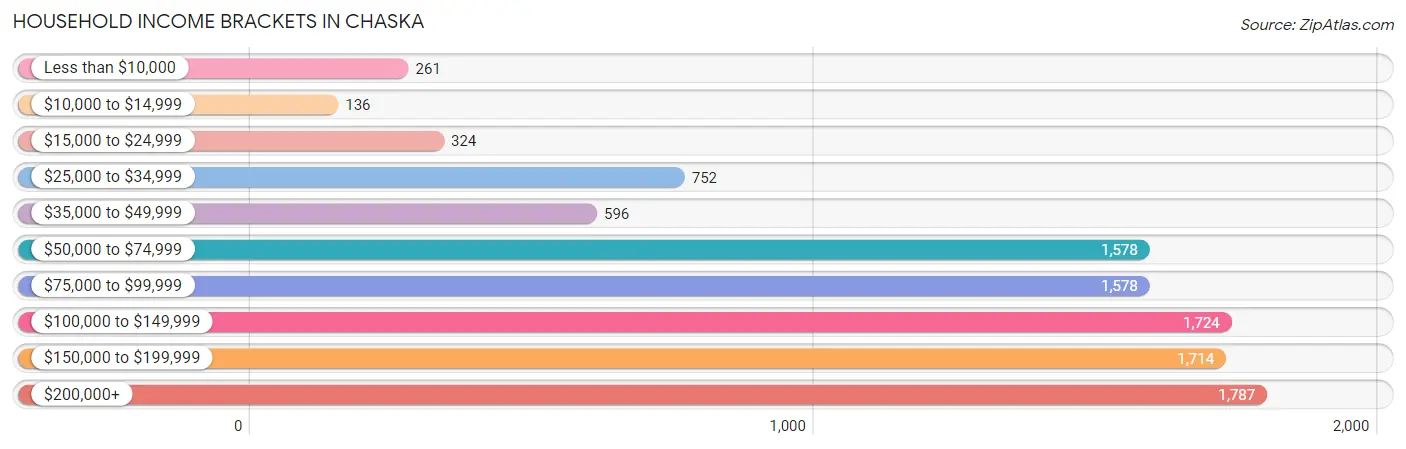
| Income Bracket | # Households | % Households |
| Less than $10,000 | 261 | 2.5% |
| $10,000 to $14,999 | 136 | 1.3% |
| $15,000 to $24,999 | 324 | 3.1% |
| $25,000 to $34,999 | 752 | 7.2% |
| $35,000 to $49,999 | 596 | 5.7% |
| $50,000 to $74,999 | 1,578 | 15.1% |
| $75,000 to $99,999 | 1,578 | 15.1% |
| $100,000 to $149,999 | 1,724 | 16.5% |
| $150,000 to $199,999 | 1,714 | 16.4% |
| $200,000+ | 1,787 | 17.1% |
Household Income by Householder Age in Chaska
The median household income in Chaska is $99,988, with the highest median household income of $136,172 found in the 45 to 64 years age bracket for the primary householder. A total of 4,297 households (41.1%) fall into this category. Meanwhile, the 15 to 24 years age bracket for the primary householder has the lowest median household income of $50,513, with 443 households (4.2%) in this group.
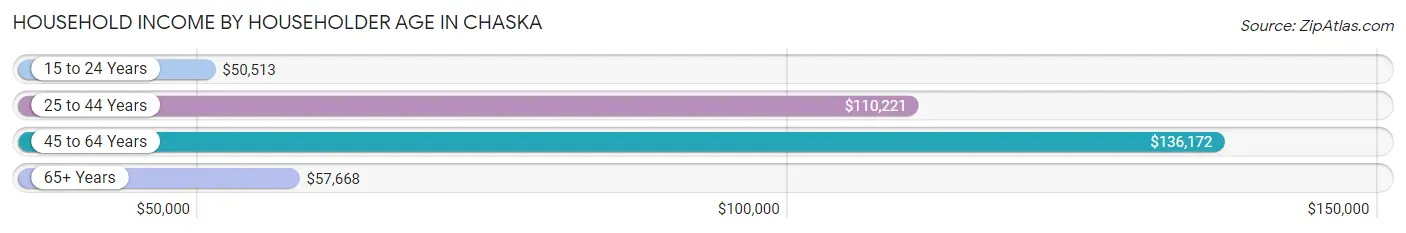
| Income Bracket | # Households | Median Income |
| 15 to 24 Years | 443 (4.2%) | $50,513 |
| 25 to 44 Years | 3,752 (35.9%) | $110,221 |
| 45 to 64 Years | 4,297 (41.1%) | $136,172 |
| 65+ Years | 1,957 (18.7%) | $57,668 |
| Total | 10,449 (100.0%) | $99,988 |
Poverty in Chaska
Income Below Poverty by Sex and Age in Chaska
With 3.0% poverty level for males and 4.9% for females among the residents of Chaska, 75 year old and over males and 15 year old females are the most vulnerable to poverty, with 63 males (10.6%) and 75 females (20.4%) in their respective age groups living below the poverty level.
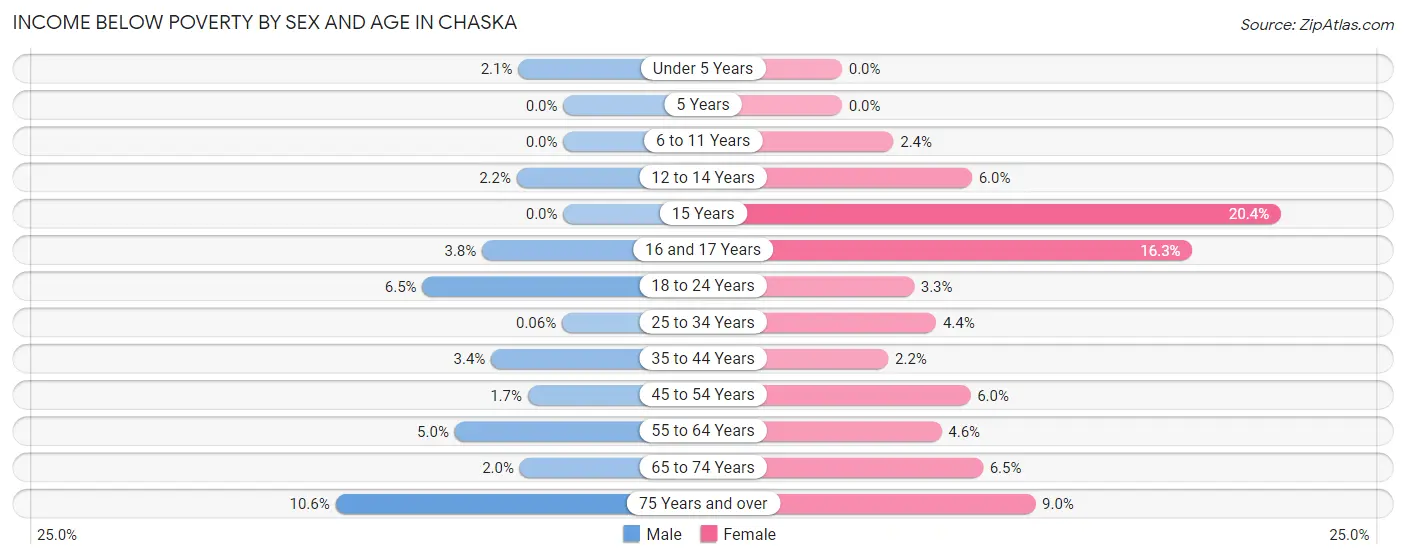
| Age Bracket | Male | Female |
| Under 5 Years | 19 (2.1%) | 0 (0.0%) |
| 5 Years | 0 (0.0%) | 0 (0.0%) |
| 6 to 11 Years | 0 (0.0%) | 29 (2.4%) |
| 12 to 14 Years | 12 (2.2%) | 39 (6.0%) |
| 15 Years | 0 (0.0%) | 75 (20.4%) |
| 16 and 17 Years | 17 (3.8%) | 68 (16.3%) |
| 18 to 24 Years | 78 (6.5%) | 41 (3.3%) |
| 25 to 34 Years | 1 (0.1%) | 65 (4.4%) |
| 35 to 44 Years | 64 (3.4%) | 48 (2.1%) |
| 45 to 54 Years | 32 (1.7%) | 122 (6.0%) |
| 55 to 64 Years | 86 (5.0%) | 74 (4.6%) |
| 65 to 74 Years | 19 (2.0%) | 60 (6.5%) |
| 75 Years and over | 63 (10.6%) | 72 (9.0%) |
| Total | 391 (3.0%) | 693 (4.9%) |
Income Above Poverty by Sex and Age in Chaska
According to the poverty statistics in Chaska, males aged 5 years and females aged under 5 years are the age groups that are most secure financially, with 100.0% of males and 100.0% of females in these age groups living above the poverty line.
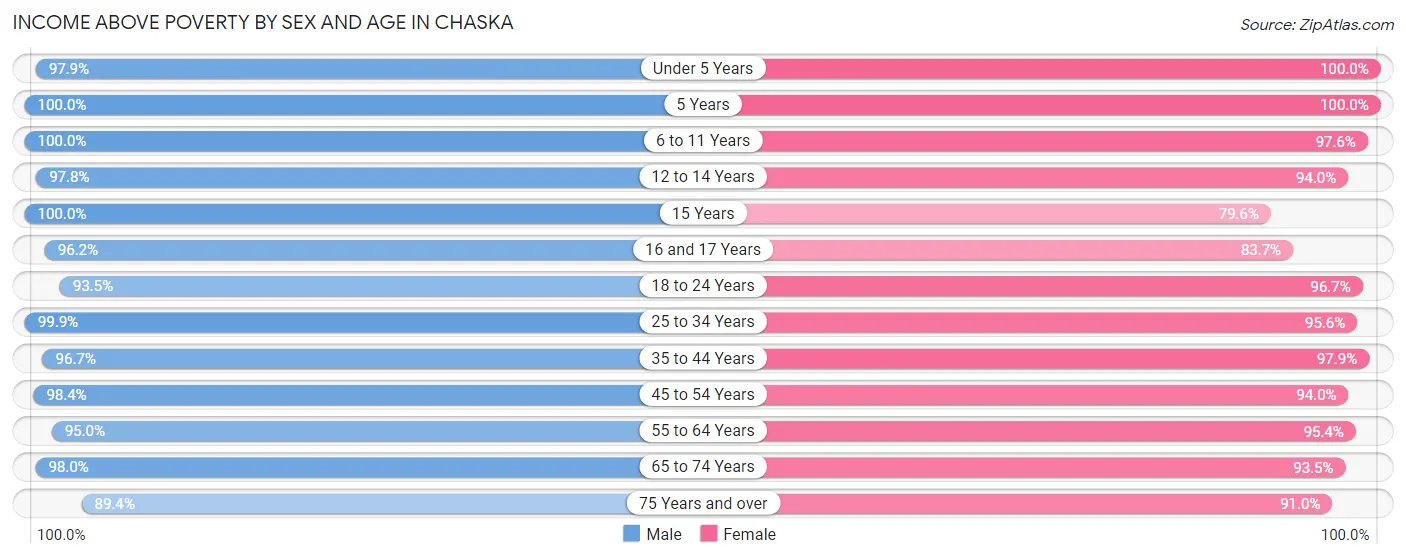
| Age Bracket | Male | Female |
| Under 5 Years | 889 (97.9%) | 1,067 (100.0%) |
| 5 Years | 117 (100.0%) | 267 (100.0%) |
| 6 to 11 Years | 1,165 (100.0%) | 1,184 (97.6%) |
| 12 to 14 Years | 544 (97.8%) | 608 (94.0%) |
| 15 Years | 159 (100.0%) | 293 (79.6%) |
| 16 and 17 Years | 434 (96.2%) | 350 (83.7%) |
| 18 to 24 Years | 1,115 (93.5%) | 1,186 (96.7%) |
| 25 to 34 Years | 1,585 (99.9%) | 1,424 (95.6%) |
| 35 to 44 Years | 1,848 (96.7%) | 2,181 (97.9%) |
| 45 to 54 Years | 1,905 (98.4%) | 1,926 (94.0%) |
| 55 to 64 Years | 1,621 (95.0%) | 1,527 (95.4%) |
| 65 to 74 Years | 922 (98.0%) | 857 (93.5%) |
| 75 Years and over | 533 (89.4%) | 731 (91.0%) |
| Total | 12,837 (97.0%) | 13,601 (95.2%) |
Income Below Poverty Among Married-Couple Families in Chaska
The poverty statistics for married-couple families in Chaska show that 0.8% or 45 of the total 5,349 families live below the poverty line. Families with no children have the highest poverty rate of 1.7%, comprising of 45 families. On the other hand, families with 1 or 2 children have the lowest poverty rate of 0.0%, which includes 0 families.
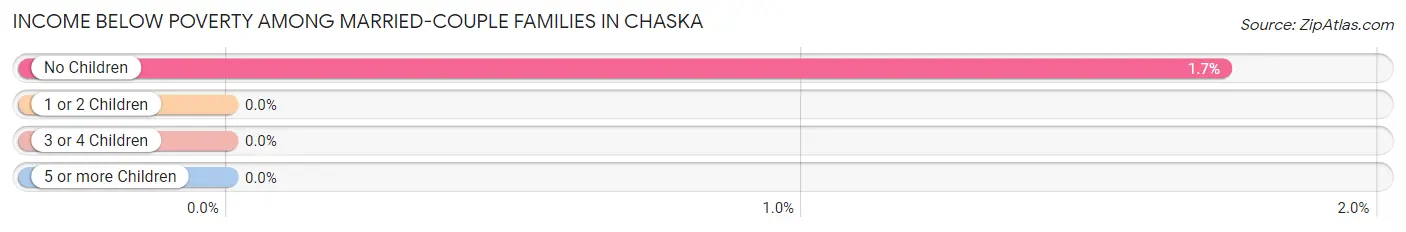
| Children | Above Poverty | Below Poverty |
| No Children | 2,551 (98.3%) | 45 (1.7%) |
| 1 or 2 Children | 1,974 (100.0%) | 0 (0.0%) |
| 3 or 4 Children | 748 (100.0%) | 0 (0.0%) |
| 5 or more Children | 31 (100.0%) | 0 (0.0%) |
| Total | 5,304 (99.2%) | 45 (0.8%) |
Income Below Poverty Among Single-Parent Households in Chaska
According to the poverty data in Chaska, 4.2% or 26 single-father households and 11.4% or 123 single-mother households are living below the poverty line. Among single-father households, those with 1 or 2 children have the highest poverty rate, with 14 households (6.5%) experiencing poverty. Likewise, among single-mother households, those with 1 or 2 children have the highest poverty rate, with 123 households (16.0%) falling below the poverty line.
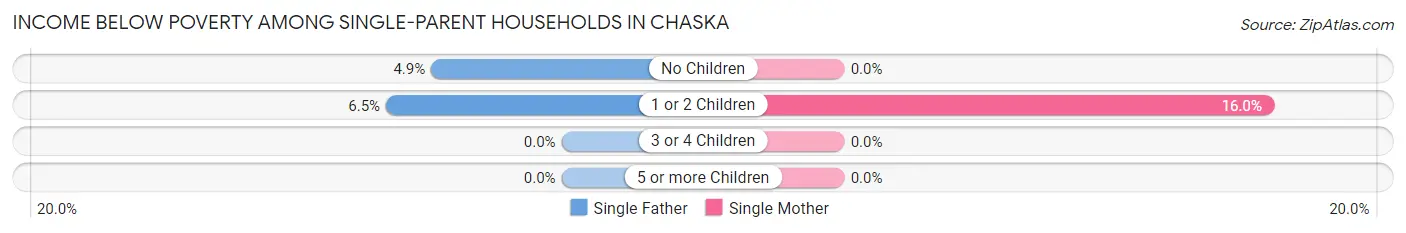
| Children | Single Father | Single Mother |
| No Children | 12 (4.9%) | 0 (0.0%) |
| 1 or 2 Children | 14 (6.5%) | 123 (16.0%) |
| 3 or 4 Children | 0 (0.0%) | 0 (0.0%) |
| 5 or more Children | 0 (0.0%) | 0 (0.0%) |
| Total | 26 (4.2%) | 123 (11.4%) |
Income Below Poverty Among Married-Couple vs Single-Parent Households in Chaska
The poverty data for Chaska shows that 45 of the married-couple family households (0.8%) and 149 of the single-parent households (8.8%) are living below the poverty level. Within the married-couple family households, those with no children have the highest poverty rate, with 45 households (1.7%) falling below the poverty line. Among the single-parent households, those with 1 or 2 children have the highest poverty rate, with 137 household (14.0%) living below poverty.
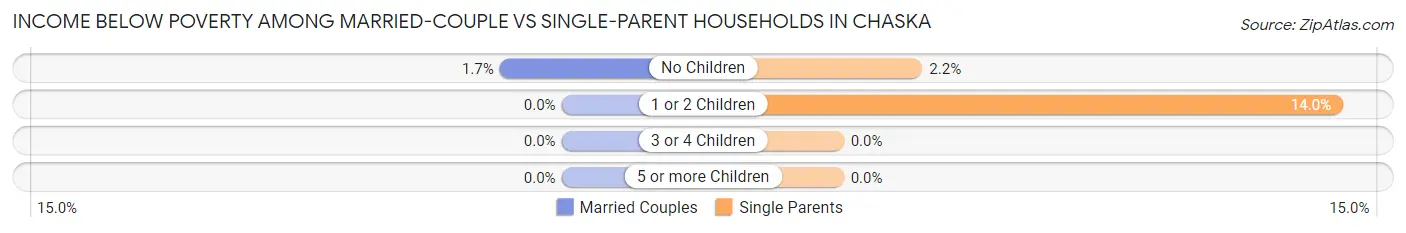
| Children | Married-Couple Families | Single-Parent Households |
| No Children | 45 (1.7%) | 12 (2.2%) |
| 1 or 2 Children | 0 (0.0%) | 137 (14.0%) |
| 3 or 4 Children | 0 (0.0%) | 0 (0.0%) |
| 5 or more Children | 0 (0.0%) | 0 (0.0%) |
| Total | 45 (0.8%) | 149 (8.8%) |
Race in Chaska
The most populous races in Chaska are White / Caucasian (23,749 | 85.5%), Hispanic or Latino (2,321 | 8.4%), and Two or more Races (1,957 | 7.0%).
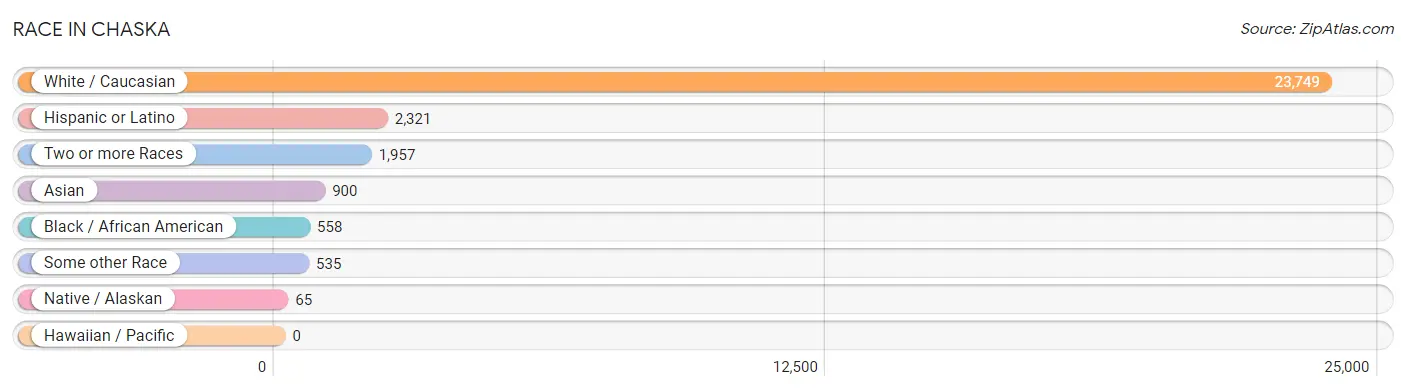
| Race | # Population | % Population |
| Asian | 900 | 3.2% |
| Black / African American | 558 | 2.0% |
| Hawaiian / Pacific | 0 | 0.0% |
| Hispanic or Latino | 2,321 | 8.4% |
| Native / Alaskan | 65 | 0.2% |
| White / Caucasian | 23,749 | 85.5% |
| Two or more Races | 1,957 | 7.0% |
| Some other Race | 535 | 1.9% |
| Total | 27,764 | 100.0% |
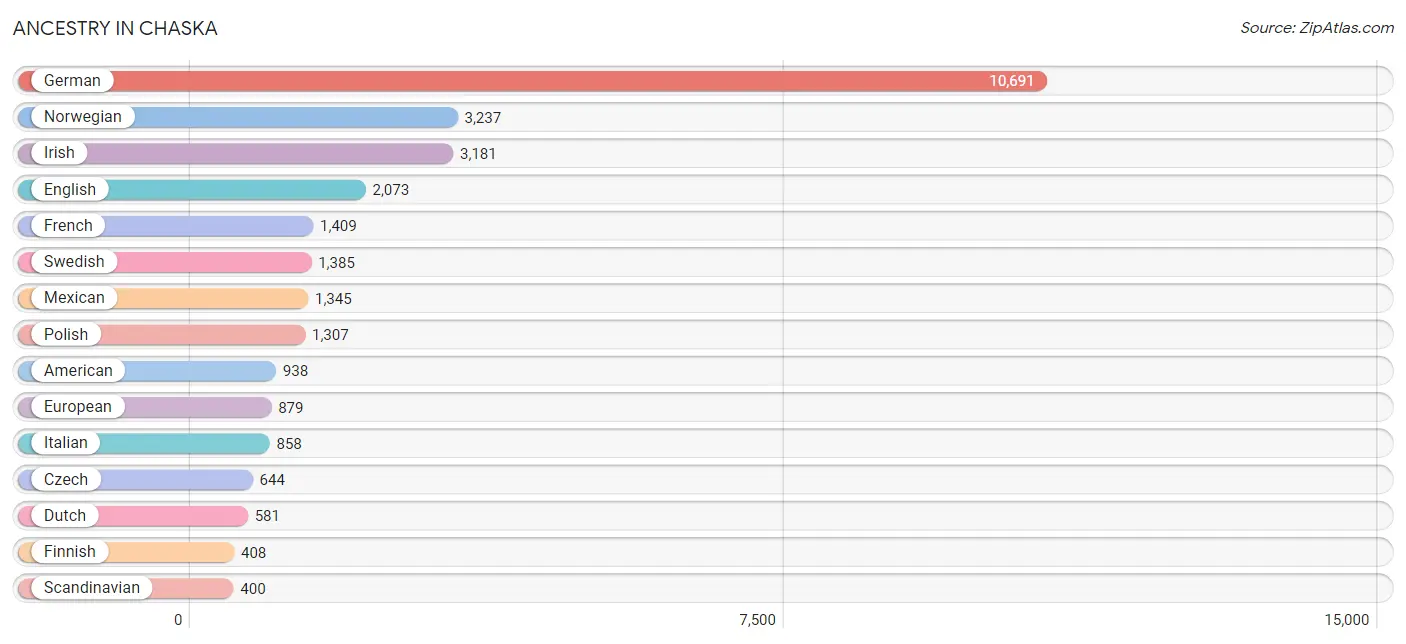
Ancestry in Chaska
The most populous ancestries reported in Chaska are German (10,691 | 38.5%), Norwegian (3,237 | 11.7%), Irish (3,181 | 11.5%), English (2,073 | 7.5%), and French (1,409 | 5.1%), together accounting for 74.2% of all Chaska residents.
| Ancestry | # Population | % Population |
| African | 36 | 0.1% |
| American | 938 | 3.4% |
| Apache | 5 | 0.0% |
| Arab | 14 | 0.1% |
| Austrian | 96 | 0.4% |
| Bangladeshi | 65 | 0.2% |
| Belgian | 148 | 0.5% |
| British | 90 | 0.3% |
| Bulgarian | 23 | 0.1% |
| Burmese | 127 | 0.5% |
| Canadian | 43 | 0.2% |
| Central American | 393 | 1.4% |
| Cherokee | 19 | 0.1% |
| Chippewa | 21 | 0.1% |
| Colombian | 20 | 0.1% |
| Croatian | 53 | 0.2% |
| Cuban | 64 | 0.2% |
| Czech | 644 | 2.3% |
| Czechoslovakian | 249 | 0.9% |
| Danish | 248 | 0.9% |
| Dominican | 32 | 0.1% |
| Dutch | 581 | 2.1% |
| Eastern European | 96 | 0.4% |
| English | 2,073 | 7.5% |
| European | 879 | 3.2% |
| Finnish | 408 | 1.5% |
| French | 1,409 | 5.1% |
| French Canadian | 232 | 0.8% |
| German | 10,691 | 38.5% |
| Greek | 34 | 0.1% |
| Guyanese | 6 | 0.0% |
| Honduran | 324 | 1.2% |
| Hungarian | 72 | 0.3% |
| Icelander | 39 | 0.1% |
| Indian (Asian) | 202 | 0.7% |
| Irish | 3,181 | 11.5% |
| Italian | 858 | 3.1% |
| Jamaican | 38 | 0.1% |
| Japanese | 231 | 0.8% |
| Korean | 143 | 0.5% |
| Latvian | 25 | 0.1% |
| Lebanese | 14 | 0.1% |
| Liberian | 8 | 0.0% |
| Lithuanian | 58 | 0.2% |
| Malaysian | 49 | 0.2% |
| Mexican | 1,345 | 4.8% |
| Native Hawaiian | 75 | 0.3% |
| Nicaraguan | 26 | 0.1% |
| Nigerian | 163 | 0.6% |
| Norwegian | 3,237 | 11.7% |
| Paraguayan | 45 | 0.2% |
| Pennsylvania German | 6 | 0.0% |
| Polish | 1,307 | 4.7% |
| Portuguese | 10 | 0.0% |
| Puerto Rican | 90 | 0.3% |
| Romanian | 176 | 0.6% |
| Russian | 93 | 0.3% |
| Salvadoran | 43 | 0.2% |
| Scandinavian | 400 | 1.4% |
| Scotch-Irish | 115 | 0.4% |
| Scottish | 174 | 0.6% |
| Sioux | 72 | 0.3% |
| Slovene | 79 | 0.3% |
| South American | 264 | 0.9% |
| Spaniard | 78 | 0.3% |
| Spanish | 14 | 0.1% |
| Sri Lankan | 218 | 0.8% |
| Subsaharan African | 207 | 0.7% |
| Swedish | 1,385 | 5.0% |
| Swiss | 31 | 0.1% |
| Thai | 163 | 0.6% |
| Ukrainian | 92 | 0.3% |
| Venezuelan | 199 | 0.7% |
| Welsh | 50 | 0.2% | View All 74 Rows |
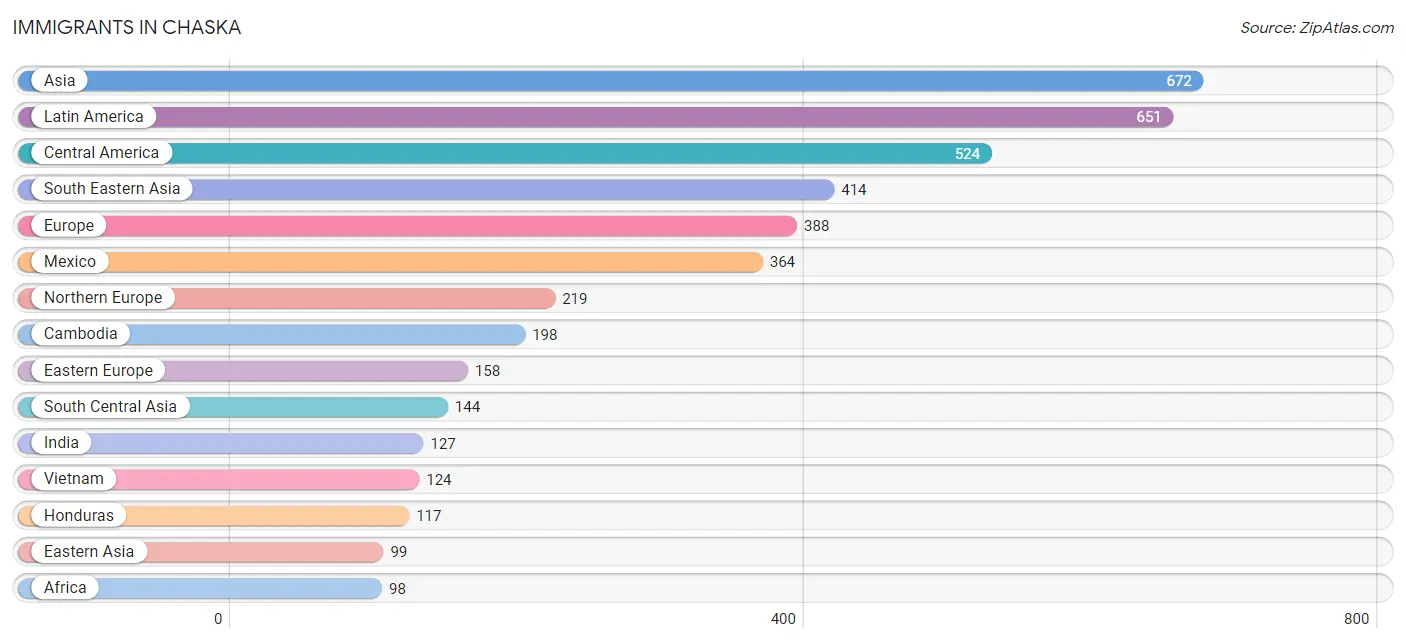
Immigrants in Chaska
The most numerous immigrant groups reported in Chaska came from Asia (672 | 2.4%), Latin America (651 | 2.3%), Central America (524 | 1.9%), South Eastern Asia (414 | 1.5%), and Europe (388 | 1.4%), together accounting for 9.5% of all Chaska residents.
| Immigration Origin | # Population | % Population |
| Africa | 98 | 0.4% |
| Asia | 672 | 2.4% |
| Australia | 20 | 0.1% |
| Barbados | 18 | 0.1% |
| Brazil | 8 | 0.0% |
| Bulgaria | 23 | 0.1% |
| Cambodia | 198 | 0.7% |
| Canada | 58 | 0.2% |
| Caribbean | 60 | 0.2% |
| Central America | 524 | 1.9% |
| China | 39 | 0.1% |
| Colombia | 20 | 0.1% |
| Croatia | 22 | 0.1% |
| Dominican Republic | 21 | 0.1% |
| Eastern Asia | 99 | 0.4% |
| Eastern Europe | 158 | 0.6% |
| El Salvador | 43 | 0.2% |
| England | 85 | 0.3% |
| Europe | 388 | 1.4% |
| Germany | 9 | 0.0% |
| Greece | 2 | 0.0% |
| Honduras | 117 | 0.4% |
| India | 127 | 0.5% |
| Ireland | 6 | 0.0% |
| Jamaica | 21 | 0.1% |
| Korea | 60 | 0.2% |
| Laos | 8 | 0.0% |
| Latin America | 651 | 2.3% |
| Mexico | 364 | 1.3% |
| Nigeria | 98 | 0.4% |
| Northern Europe | 219 | 0.8% |
| Oceania | 20 | 0.1% |
| Pakistan | 17 | 0.1% |
| Philippines | 84 | 0.3% |
| Poland | 13 | 0.1% |
| Russia | 8 | 0.0% |
| South America | 67 | 0.2% |
| South Central Asia | 144 | 0.5% |
| South Eastern Asia | 414 | 1.5% |
| Southern Europe | 2 | 0.0% |
| Ukraine | 92 | 0.3% |
| Vietnam | 124 | 0.4% |
| Western Africa | 98 | 0.4% |
| Western Asia | 15 | 0.1% |
| Western Europe | 9 | 0.0% | View All 45 Rows |
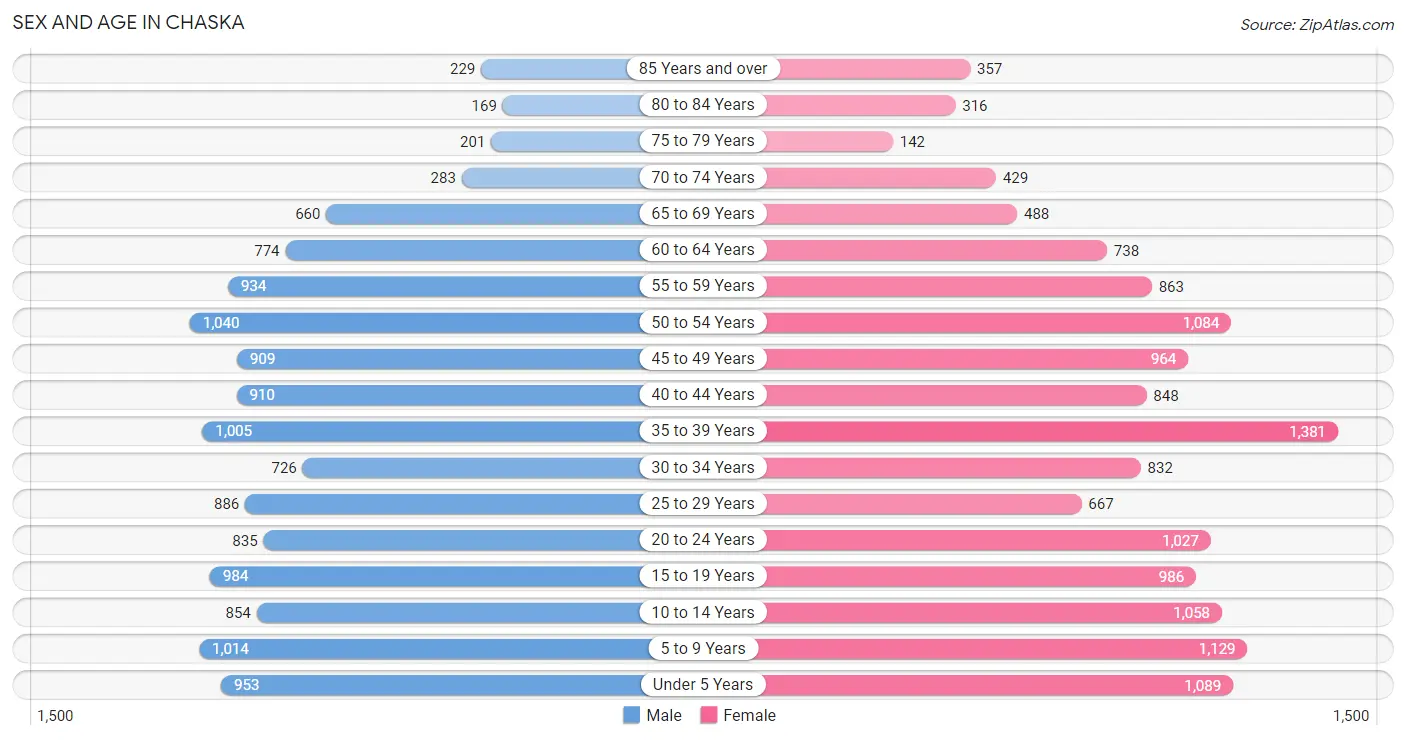
Sex and Age in Chaska
Sex and Age in Chaska
The most populous age groups in Chaska are 50 to 54 Years (1,040 | 7.8%) for men and 35 to 39 Years (1,381 | 9.6%) for women.
| Age Bracket | Male | Female |
| Under 5 Years | 953 (7.1%) | 1,089 (7.6%) |
| 5 to 9 Years | 1,014 (7.6%) | 1,129 (7.8%) |
| 10 to 14 Years | 854 (6.4%) | 1,058 (7.3%) |
| 15 to 19 Years | 984 (7.4%) | 986 (6.9%) |
| 20 to 24 Years | 835 (6.2%) | 1,027 (7.1%) |
| 25 to 29 Years | 886 (6.6%) | 667 (4.6%) |
| 30 to 34 Years | 726 (5.4%) | 832 (5.8%) |
| 35 to 39 Years | 1,005 (7.5%) | 1,381 (9.6%) |
| 40 to 44 Years | 910 (6.8%) | 848 (5.9%) |
| 45 to 49 Years | 909 (6.8%) | 964 (6.7%) |
| 50 to 54 Years | 1,040 (7.8%) | 1,084 (7.5%) |
| 55 to 59 Years | 934 (7.0%) | 863 (6.0%) |
| 60 to 64 Years | 774 (5.8%) | 738 (5.1%) |
| 65 to 69 Years | 660 (4.9%) | 488 (3.4%) |
| 70 to 74 Years | 283 (2.1%) | 429 (3.0%) |
| 75 to 79 Years | 201 (1.5%) | 142 (1.0%) |
| 80 to 84 Years | 169 (1.3%) | 316 (2.2%) |
| 85 Years and over | 229 (1.7%) | 357 (2.5%) |
| Total | 13,366 (100.0%) | 14,398 (100.0%) |
Families and Households in Chaska
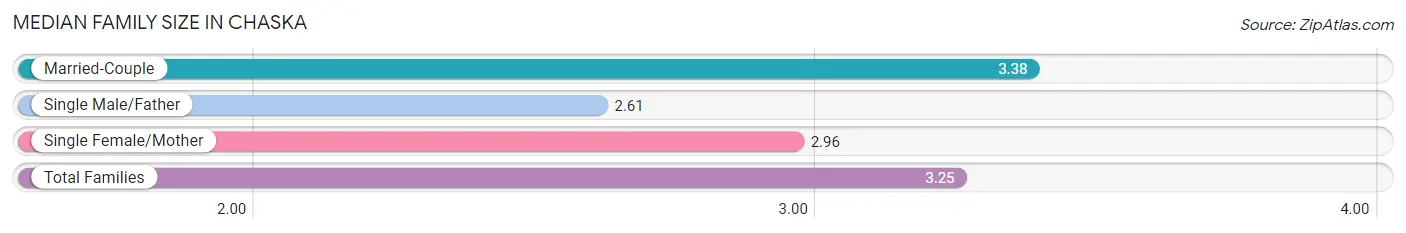
Median Family Size in Chaska
The median family size in Chaska is 3.25 persons per family, with married-couple families (5,349 | 75.9%) accounting for the largest median family size of 3.38 persons per family. On the other hand, single male/father families (614 | 8.7%) represent the smallest median family size with 2.61 persons per family.
| Family Type | # Families | Family Size |
| Married-Couple | 5,349 (75.9%) | 3.38 |
| Single Male/Father | 614 (8.7%) | 2.61 |
| Single Female/Mother | 1,081 (15.3%) | 2.96 |
| Total Families | 7,044 (100.0%) | 3.25 |
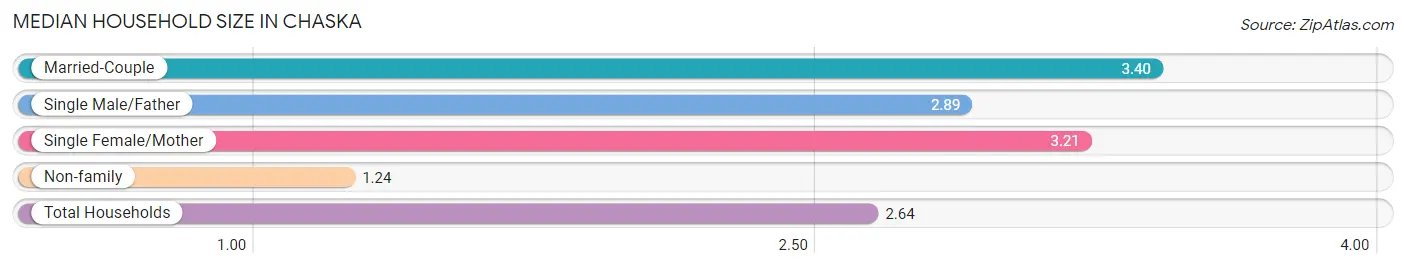
Median Household Size in Chaska
The median household size in Chaska is 2.64 persons per household, with married-couple households (5,349 | 51.2%) accounting for the largest median household size of 3.4 persons per household. non-family households (3,405 | 32.6%) represent the smallest median household size with 1.24 persons per household.
| Household Type | # Households | Household Size |
| Married-Couple | 5,349 (51.2%) | 3.40 |
| Single Male/Father | 614 (5.9%) | 2.89 |
| Single Female/Mother | 1,081 (10.3%) | 3.21 |
| Non-family | 3,405 (32.6%) | 1.24 |
| Total Households | 10,449 (100.0%) | 2.64 |
Household Size by Marriage Status in Chaska
Out of a total of 10,449 households in Chaska, 7,044 (67.4%) are family households, while 3,405 (32.6%) are nonfamily households. The most numerous type of family households are 2-person households, comprising 2,613, and the most common type of nonfamily households are 1-person households, comprising 2,714.
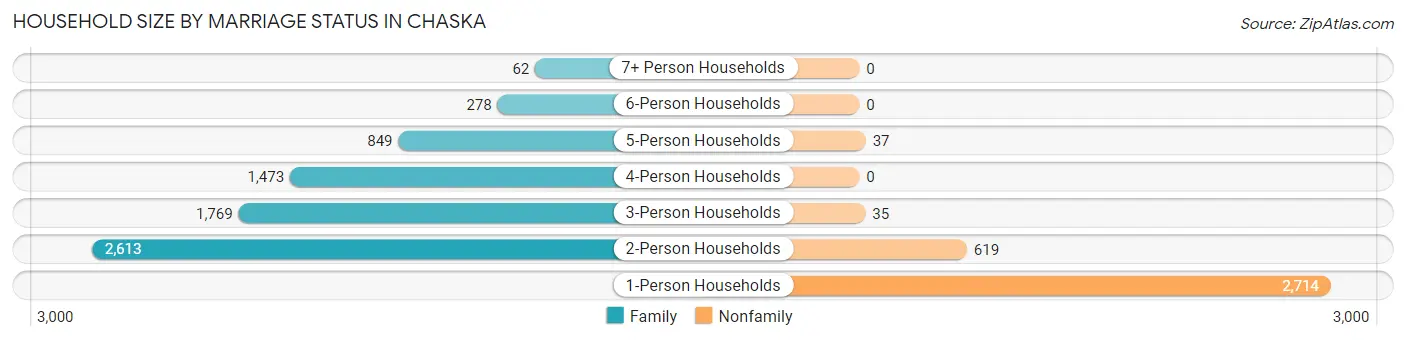
| Household Size | Family Households | Nonfamily Households |
| 1-Person Households | - | 2,714 (26.0%) |
| 2-Person Households | 2,613 (25.0%) | 619 (5.9%) |
| 3-Person Households | 1,769 (16.9%) | 35 (0.3%) |
| 4-Person Households | 1,473 (14.1%) | 0 (0.0%) |
| 5-Person Households | 849 (8.1%) | 37 (0.4%) |
| 6-Person Households | 278 (2.7%) | 0 (0.0%) |
| 7+ Person Households | 62 (0.6%) | 0 (0.0%) |
| Total | 7,044 (67.4%) | 3,405 (32.6%) |
Female Fertility in Chaska
Fertility by Age in Chaska
Average fertility rate in Chaska is 42.0 births per 1,000 women. Women in the age bracket of 20 to 34 years have the highest fertility rate with 56.0 births per 1,000 women. Women in the age bracket of 35 to 50 years acount for 51.7% of all women with births.
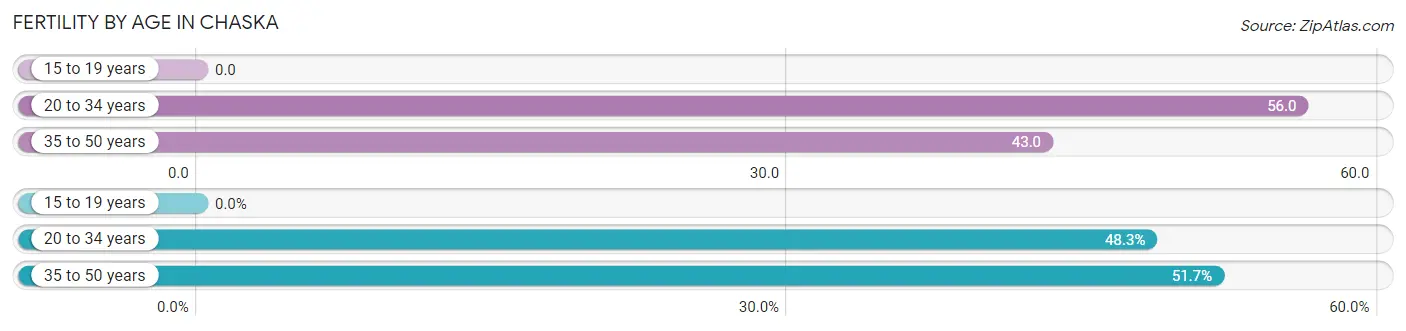
| Age Bracket | Women with Births | Births / 1,000 Women |
| 15 to 19 years | 0 (0.0%) | 0.0 |
| 20 to 34 years | 142 (48.3%) | 56.0 |
| 35 to 50 years | 152 (51.7%) | 43.0 |
| Total | 294 (100.0%) | 42.0 |
Fertility by Age by Marriage Status in Chaska
83.7% of women with births (294) in Chaska are married. The highest percentage of unmarried women with births falls into 20 to 34 years age bracket with 26.1% of them unmarried at the time of birth, while the lowest percentage of unmarried women with births belong to 35 to 50 years age bracket with 7.2% of them unmarried.
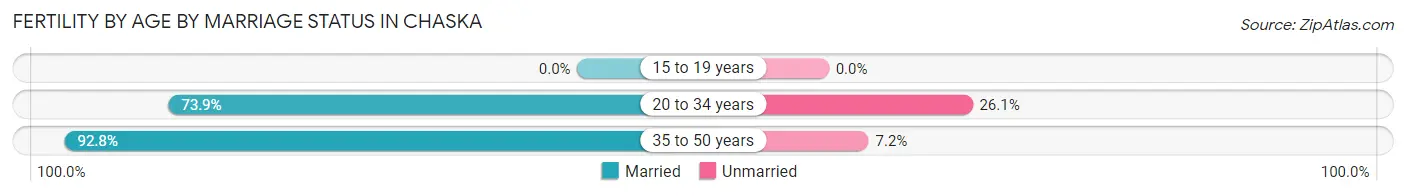
| Age Bracket | Married | Unmarried |
| 15 to 19 years | 0 (0.0%) | 0 (0.0%) |
| 20 to 34 years | 105 (73.9%) | 37 (26.1%) |
| 35 to 50 years | 141 (92.8%) | 11 (7.2%) |
| Total | 246 (83.7%) | 48 (16.3%) |
Fertility by Education in Chaska
Average fertility rate in Chaska is 42.0 births per 1,000 women. Women with the education attainment of graduate degree have the highest fertility rate of 63.0 births per 1,000 women, while women with the education attainment of high school diploma have the lowest fertility at 14.0 births per 1,000 women. Women with the education attainment of college or associate's degree represent 41.2% of all women with births.
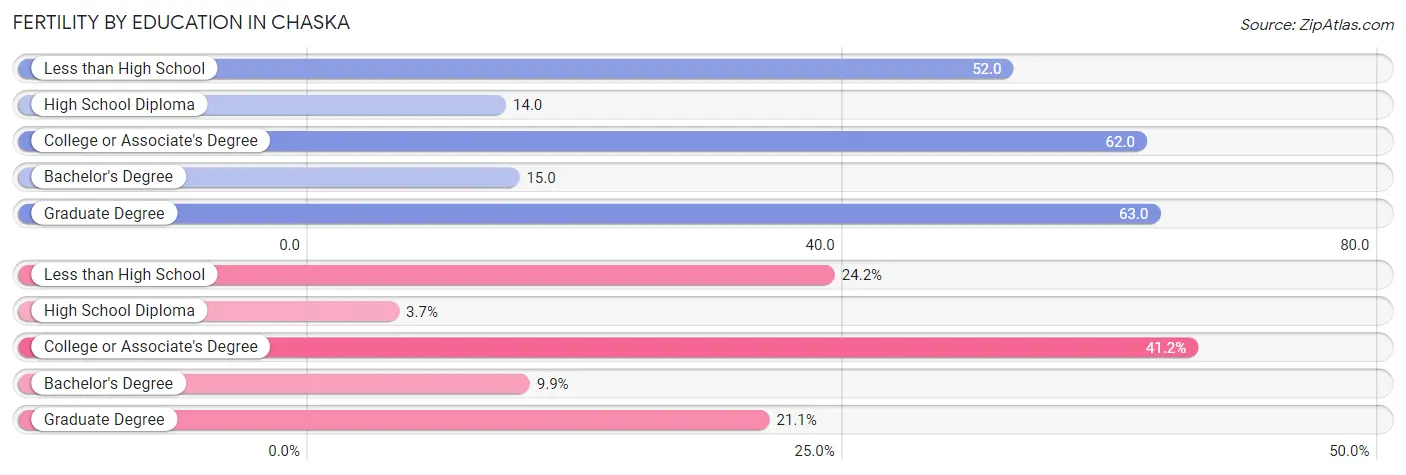
| Educational Attainment | Women with Births | Births / 1,000 Women |
| Less than High School | 71 (24.1%) | 52.0 |
| High School Diploma | 11 (3.7%) | 14.0 |
| College or Associate's Degree | 121 (41.2%) | 62.0 |
| Bachelor's Degree | 29 (9.9%) | 15.0 |
| Graduate Degree | 62 (21.1%) | 63.0 |
| Total | 294 (100.0%) | 42.0 |
Fertility by Education by Marriage Status in Chaska
16.3% of women with births in Chaska are unmarried. Women with the educational attainment of less than high school are most likely to be married with 100.0% of them married at childbirth, while women with the educational attainment of high school diploma are least likely to be married with 100.0% of them unmarried at childbirth.
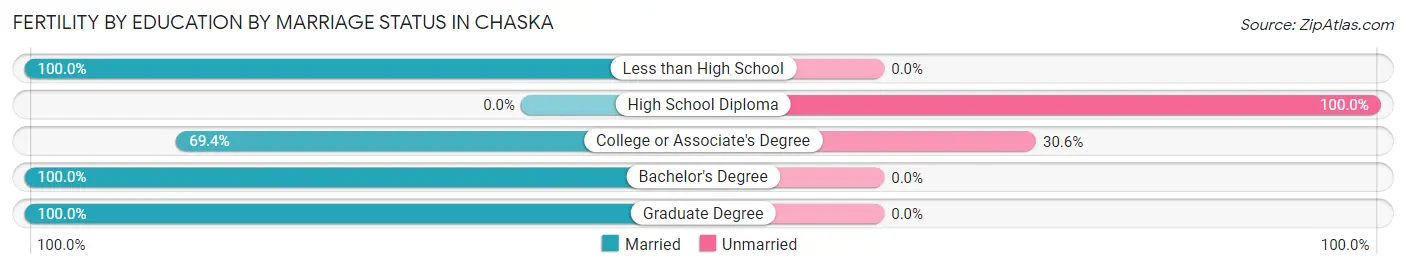
| Educational Attainment | Married | Unmarried |
| Less than High School | 71 (100.0%) | 0 (0.0%) |
| High School Diploma | 0 (0.0%) | 11 (100.0%) |
| College or Associate's Degree | 84 (69.4%) | 37 (30.6%) |
| Bachelor's Degree | 29 (100.0%) | 0 (0.0%) |
| Graduate Degree | 62 (100.0%) | 0 (0.0%) |
| Total | 246 (83.7%) | 48 (16.3%) |
Employment Characteristics in Chaska
Employment by Class of Employer in Chaska
Among the 15,376 employed individuals in Chaska, private company employees (11,035 | 71.8%), not-for-profit organizations (1,578 | 10.3%), and local government employees (1,098 | 7.1%) make up the most common classes of employment.
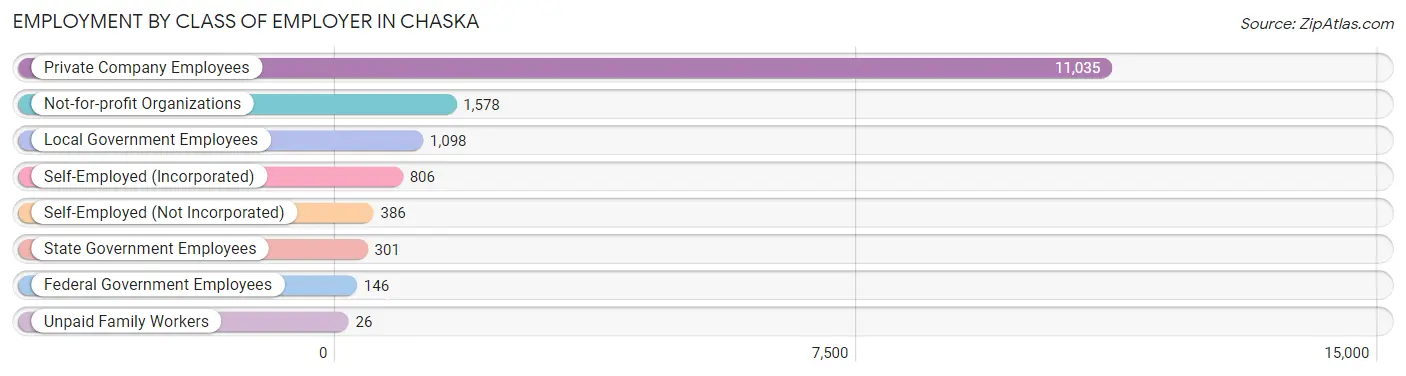
| Employer Class | # Employees | % Employees |
| Private Company Employees | 11,035 | 71.8% |
| Self-Employed (Incorporated) | 806 | 5.2% |
| Self-Employed (Not Incorporated) | 386 | 2.5% |
| Not-for-profit Organizations | 1,578 | 10.3% |
| Local Government Employees | 1,098 | 7.1% |
| State Government Employees | 301 | 2.0% |
| Federal Government Employees | 146 | 0.9% |
| Unpaid Family Workers | 26 | 0.2% |
| Total | 15,376 | 100.0% |
Employment Status by Age in Chaska
According to the labor force statistics for Chaska, out of the total population over 16 years of age (21,140), 75.1% or 15,876 individuals are in the labor force, with 2.3% or 365 of them unemployed. The age group with the highest labor force participation rate is 30 to 34 years, with 97.6% or 1,521 individuals in the labor force. Within the labor force, the 45 to 54 years age range has the highest percentage of unemployed individuals, with 3.4% or 124 of them being unemployed.
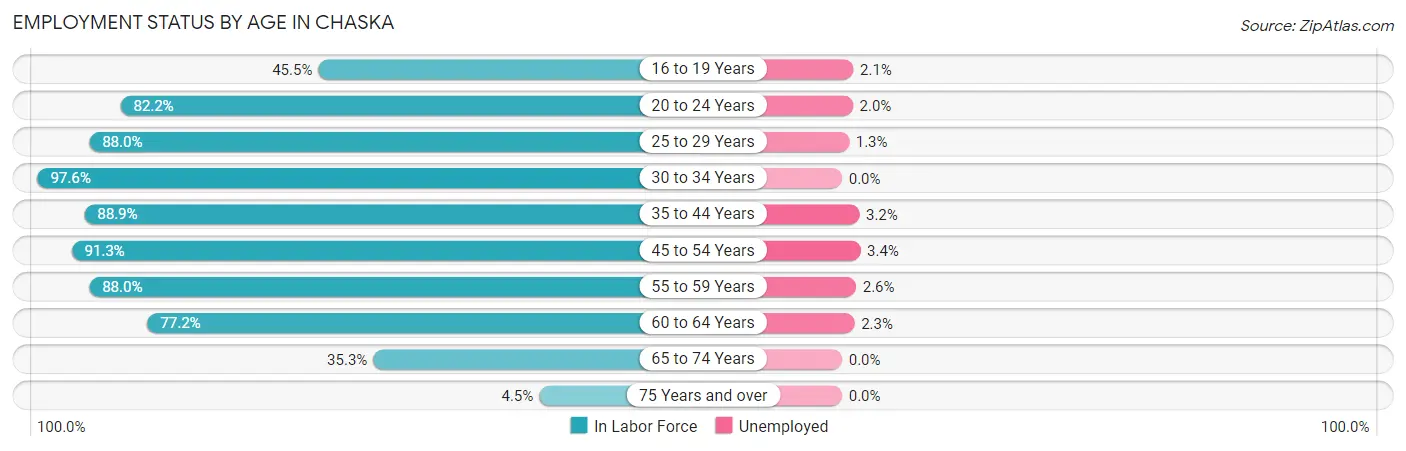
| Age Bracket | In Labor Force | Unemployed |
| 16 to 19 Years | 657 (45.5%) | 14 (2.1%) |
| 20 to 24 Years | 1,531 (82.2%) | 31 (2.0%) |
| 25 to 29 Years | 1,367 (88.0%) | 18 (1.3%) |
| 30 to 34 Years | 1,521 (97.6%) | 0 (0.0%) |
| 35 to 44 Years | 3,684 (88.9%) | 118 (3.2%) |
| 45 to 54 Years | 3,649 (91.3%) | 124 (3.4%) |
| 55 to 59 Years | 1,581 (88.0%) | 41 (2.6%) |
| 60 to 64 Years | 1,167 (77.2%) | 27 (2.3%) |
| 65 to 74 Years | 657 (35.3%) | 0 (0.0%) |
| 75 Years and over | 64 (4.5%) | 0 (0.0%) |
| Total | 15,876 (75.1%) | 365 (2.3%) |
Employment Status by Educational Attainment in Chaska
According to labor force statistics for Chaska, 89.1% of individuals (12,974) out of the total population between 25 and 64 years of age (14,561) are in the labor force, with 2.5% or 324 of them being unemployed. The group with the highest labor force participation rate are those with the educational attainment of bachelor's degree or higher, with 93.2% or 6,502 individuals in the labor force. Within the labor force, individuals with high school diploma education have the highest percentage of unemployment, with 7.3% or 167 of them being unemployed.
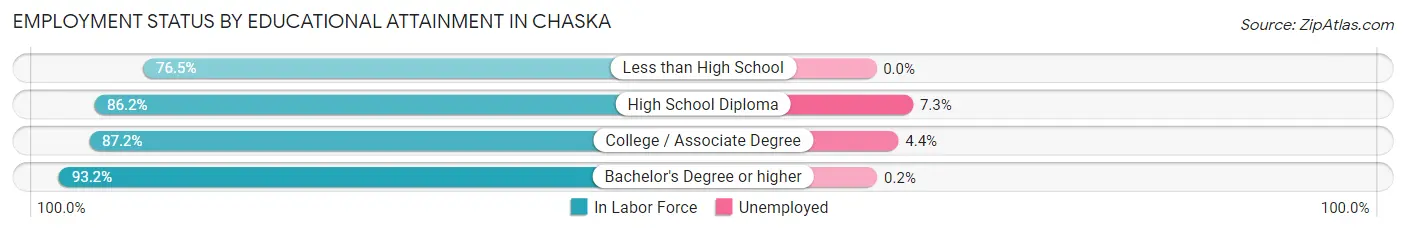
| Educational Attainment | In Labor Force | Unemployed |
| Less than High School | 857 (76.5%) | 0 (0.0%) |
| High School Diploma | 2,287 (86.2%) | 194 (7.3%) |
| College / Associate Degree | 3,324 (87.2%) | 168 (4.4%) |
| Bachelor's Degree or higher | 6,502 (93.2%) | 14 (0.2%) |
| Total | 12,974 (89.1%) | 364 (2.5%) |
Employment Occupations by Sex in Chaska
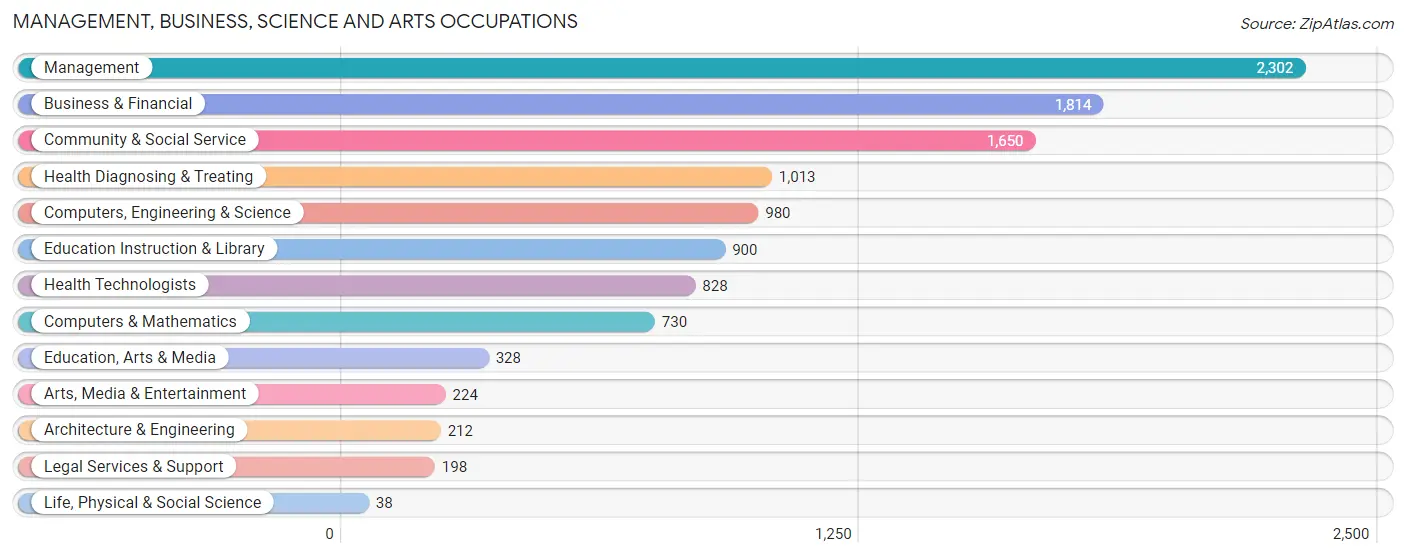
Management, Business, Science and Arts Occupations
The most common Management, Business, Science and Arts occupations in Chaska are Management (2,302 | 14.8%), Business & Financial (1,814 | 11.7%), Community & Social Service (1,650 | 10.6%), Health Diagnosing & Treating (1,013 | 6.5%), and Computers, Engineering & Science (980 | 6.3%).
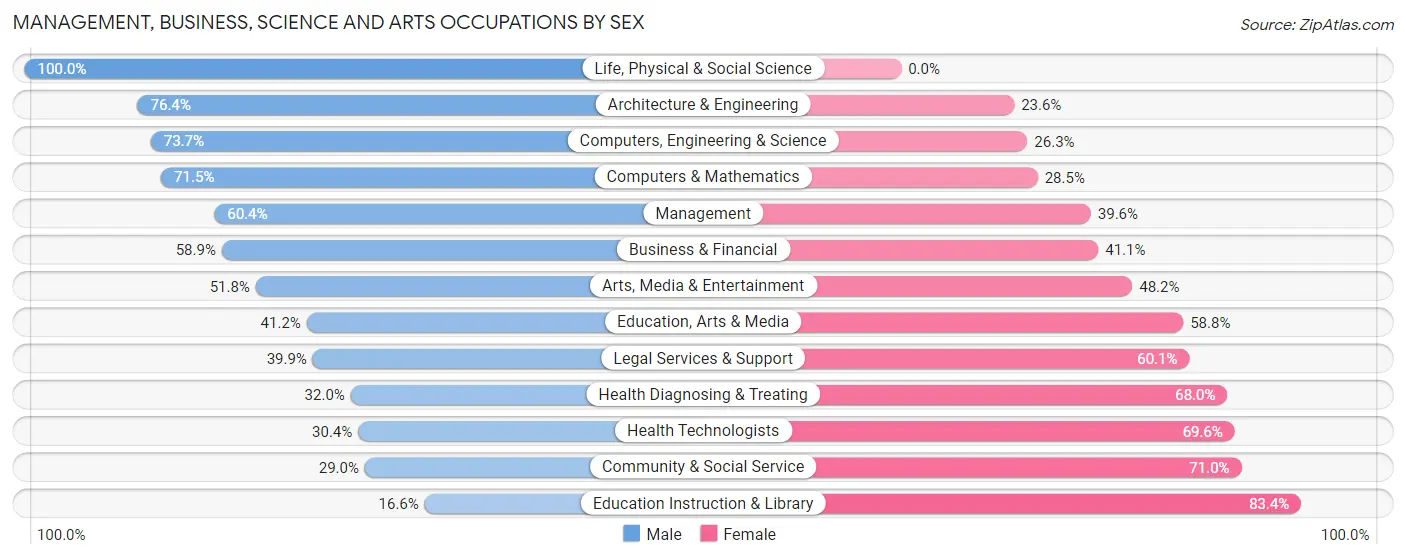
Management, Business, Science and Arts Occupations by Sex
Within the Management, Business, Science and Arts occupations in Chaska, the most male-oriented occupations are Life, Physical & Social Science (100.0%), Architecture & Engineering (76.4%), and Computers, Engineering & Science (73.7%), while the most female-oriented occupations are Education Instruction & Library (83.4%), Community & Social Service (71.0%), and Health Technologists (69.6%).
| Occupation | Male | Female |
| Management | 1,391 (60.4%) | 911 (39.6%) |
| Business & Financial | 1,068 (58.9%) | 746 (41.1%) |
| Computers, Engineering & Science | 722 (73.7%) | 258 (26.3%) |
| Computers & Mathematics | 522 (71.5%) | 208 (28.5%) |
| Architecture & Engineering | 162 (76.4%) | 50 (23.6%) |
| Life, Physical & Social Science | 38 (100.0%) | 0 (0.0%) |
| Community & Social Service | 479 (29.0%) | 1,171 (71.0%) |
| Education, Arts & Media | 135 (41.2%) | 193 (58.8%) |
| Legal Services & Support | 79 (39.9%) | 119 (60.1%) |
| Education Instruction & Library | 149 (16.6%) | 751 (83.4%) |
| Arts, Media & Entertainment | 116 (51.8%) | 108 (48.2%) |
| Health Diagnosing & Treating | 324 (32.0%) | 689 (68.0%) |
| Health Technologists | 252 (30.4%) | 576 (69.6%) |
| Total (Category) | 3,984 (51.3%) | 3,775 (48.6%) |
| Total (Overall) | 8,095 (52.2%) | 7,407 (47.8%) |
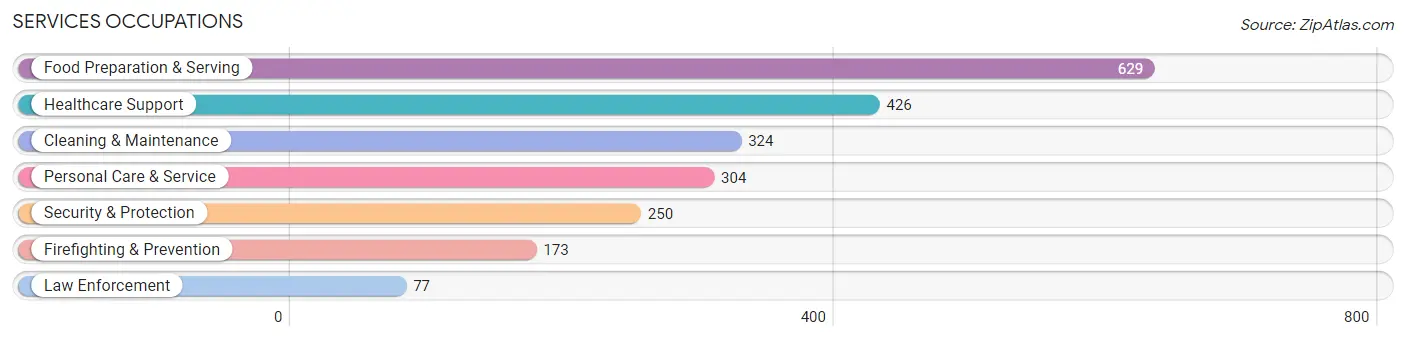
Services Occupations
The most common Services occupations in Chaska are Food Preparation & Serving (629 | 4.1%), Healthcare Support (426 | 2.8%), Cleaning & Maintenance (324 | 2.1%), Personal Care & Service (304 | 2.0%), and Security & Protection (250 | 1.6%).
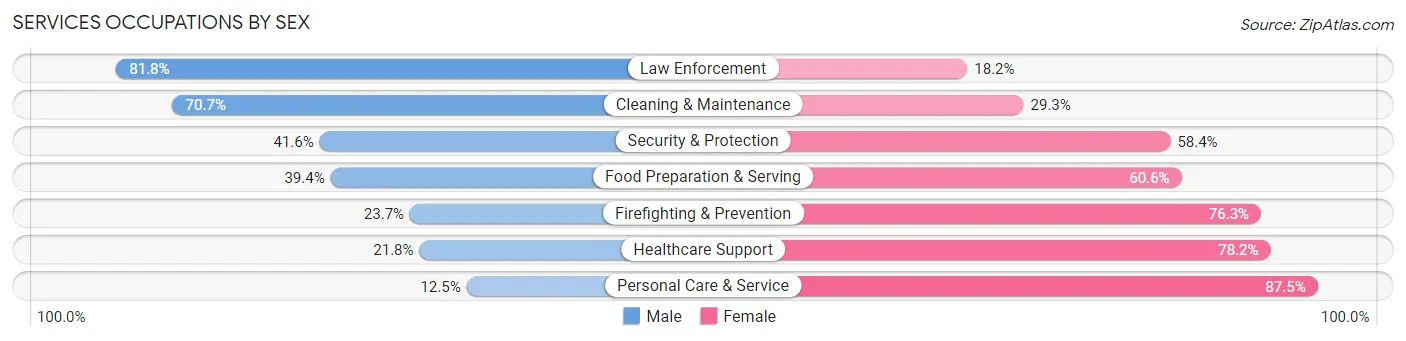
Services Occupations by Sex
Within the Services occupations in Chaska, the most male-oriented occupations are Law Enforcement (81.8%), Cleaning & Maintenance (70.7%), and Security & Protection (41.6%), while the most female-oriented occupations are Personal Care & Service (87.5%), Healthcare Support (78.2%), and Firefighting & Prevention (76.3%).
| Occupation | Male | Female |
| Healthcare Support | 93 (21.8%) | 333 (78.2%) |
| Security & Protection | 104 (41.6%) | 146 (58.4%) |
| Firefighting & Prevention | 41 (23.7%) | 132 (76.3%) |
| Law Enforcement | 63 (81.8%) | 14 (18.2%) |
| Food Preparation & Serving | 248 (39.4%) | 381 (60.6%) |
| Cleaning & Maintenance | 229 (70.7%) | 95 (29.3%) |
| Personal Care & Service | 38 (12.5%) | 266 (87.5%) |
| Total (Category) | 712 (36.8%) | 1,221 (63.2%) |
| Total (Overall) | 8,095 (52.2%) | 7,407 (47.8%) |
Sales and Office Occupations
The most common Sales and Office occupations in Chaska are Sales & Related (1,532 | 9.9%), and Office & Administration (1,443 | 9.3%).

Sales and Office Occupations by Sex
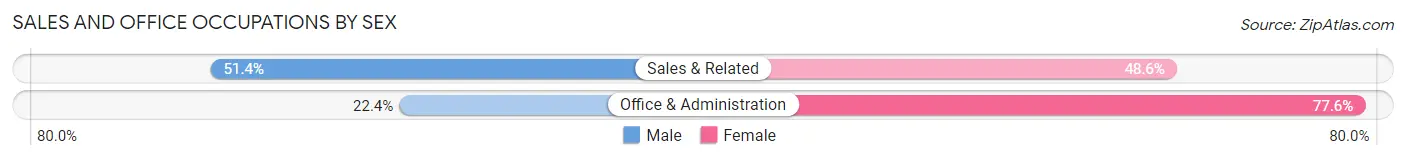
| Occupation | Male | Female |
| Sales & Related | 787 (51.4%) | 745 (48.6%) |
| Office & Administration | 323 (22.4%) | 1,120 (77.6%) |
| Total (Category) | 1,110 (37.3%) | 1,865 (62.7%) |
| Total (Overall) | 8,095 (52.2%) | 7,407 (47.8%) |
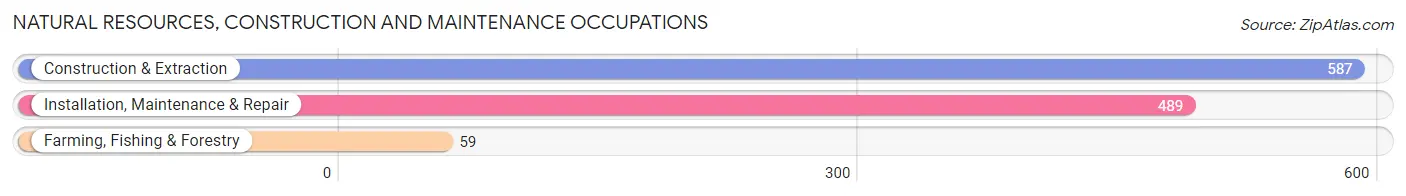
Natural Resources, Construction and Maintenance Occupations
The most common Natural Resources, Construction and Maintenance occupations in Chaska are Construction & Extraction (587 | 3.8%), Installation, Maintenance & Repair (489 | 3.2%), and Farming, Fishing & Forestry (59 | 0.4%).
Natural Resources, Construction and Maintenance Occupations by Sex
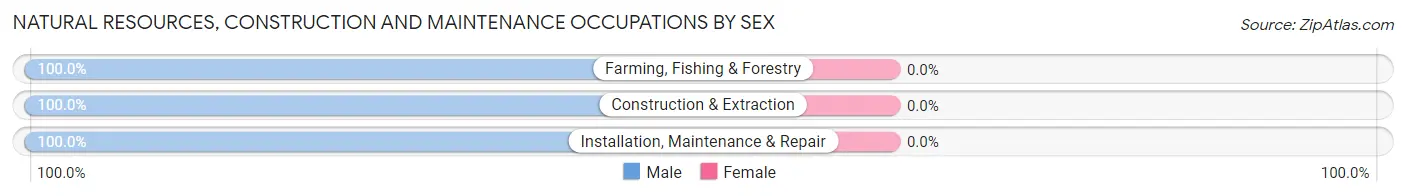
| Occupation | Male | Female |
| Farming, Fishing & Forestry | 59 (100.0%) | 0 (0.0%) |
| Construction & Extraction | 587 (100.0%) | 0 (0.0%) |
| Installation, Maintenance & Repair | 489 (100.0%) | 0 (0.0%) |
| Total (Category) | 1,135 (100.0%) | 0 (0.0%) |
| Total (Overall) | 8,095 (52.2%) | 7,407 (47.8%) |
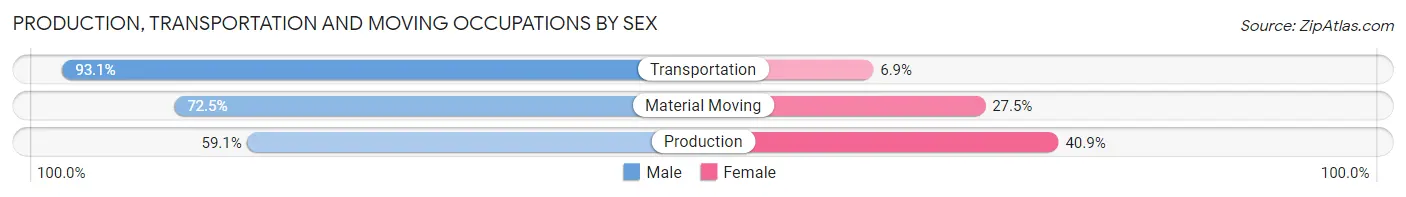
Production, Transportation and Moving Occupations
The most common Production, Transportation and Moving occupations in Chaska are Production (941 | 6.1%), Material Moving (528 | 3.4%), and Transportation (231 | 1.5%).
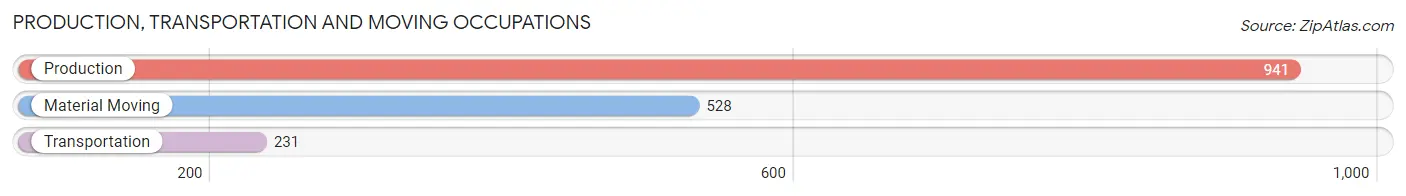
Production, Transportation and Moving Occupations by Sex
| Occupation | Male | Female |
| Production | 556 (59.1%) | 385 (40.9%) |
| Transportation | 215 (93.1%) | 16 (6.9%) |
| Material Moving | 383 (72.5%) | 145 (27.5%) |
| Total (Category) | 1,154 (67.9%) | 546 (32.1%) |
| Total (Overall) | 8,095 (52.2%) | 7,407 (47.8%) |
Employment Industries by Sex in Chaska
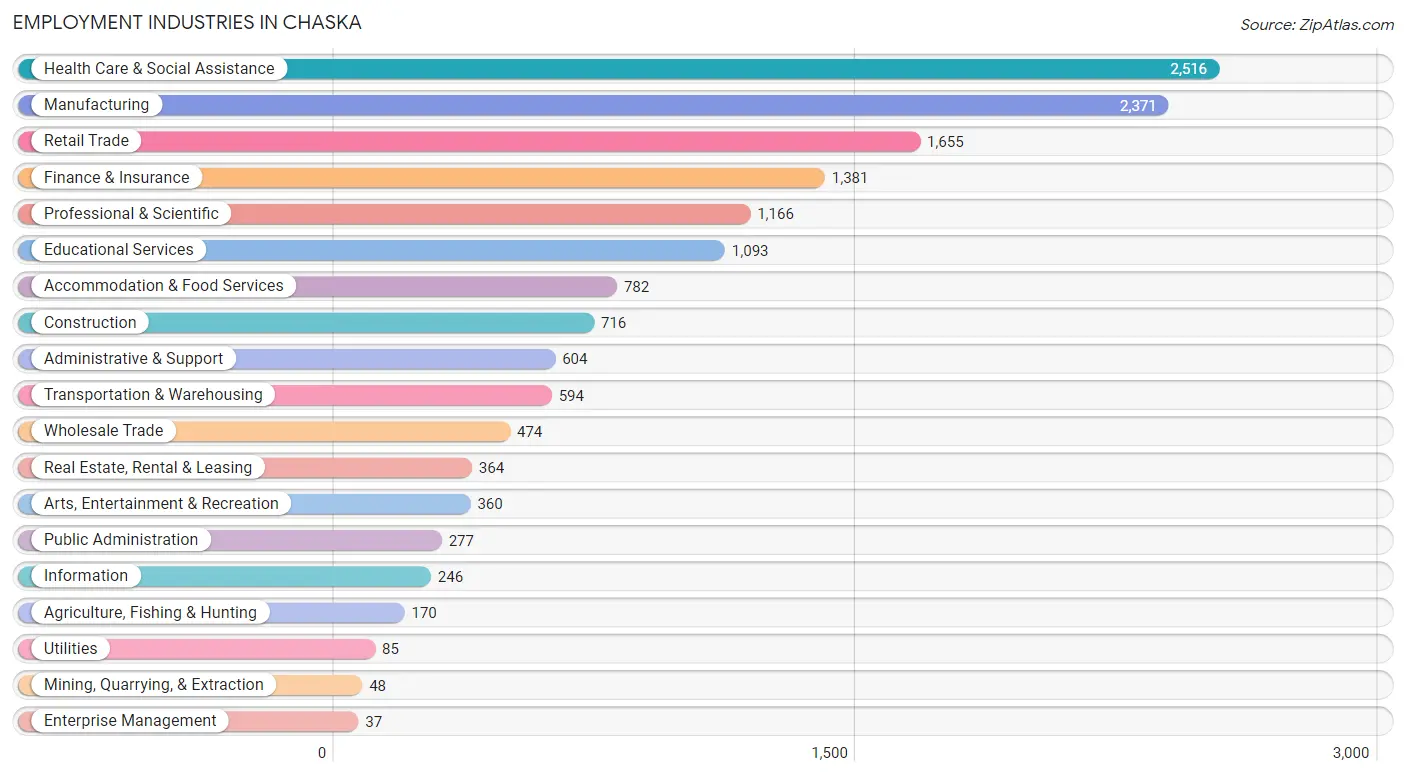
Employment Industries in Chaska
The major employment industries in Chaska include Health Care & Social Assistance (2,516 | 16.2%), Manufacturing (2,371 | 15.3%), Retail Trade (1,655 | 10.7%), Finance & Insurance (1,381 | 8.9%), and Professional & Scientific (1,166 | 7.5%).
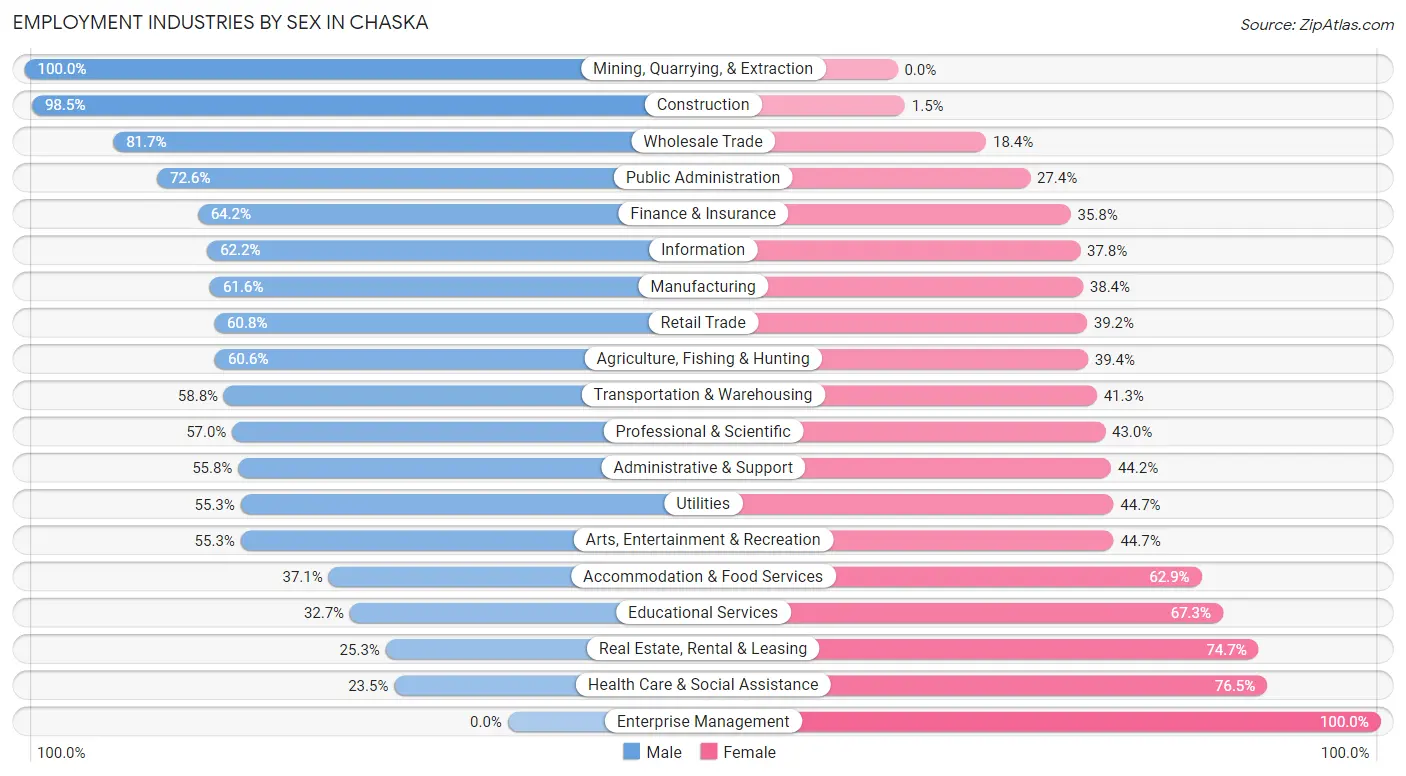
Employment Industries by Sex in Chaska
The Chaska industries that see more men than women are Mining, Quarrying, & Extraction (100.0%), Construction (98.5%), and Wholesale Trade (81.7%), whereas the industries that tend to have a higher number of women are Enterprise Management (100.0%), Health Care & Social Assistance (76.5%), and Real Estate, Rental & Leasing (74.7%).
| Industry | Male | Female |
| Agriculture, Fishing & Hunting | 103 (60.6%) | 67 (39.4%) |
| Mining, Quarrying, & Extraction | 48 (100.0%) | 0 (0.0%) |
| Construction | 705 (98.5%) | 11 (1.5%) |
| Manufacturing | 1,461 (61.6%) | 910 (38.4%) |
| Wholesale Trade | 387 (81.7%) | 87 (18.3%) |
| Retail Trade | 1,006 (60.8%) | 649 (39.2%) |
| Transportation & Warehousing | 349 (58.8%) | 245 (41.2%) |
| Utilities | 47 (55.3%) | 38 (44.7%) |
| Information | 153 (62.2%) | 93 (37.8%) |
| Finance & Insurance | 886 (64.2%) | 495 (35.8%) |
| Real Estate, Rental & Leasing | 92 (25.3%) | 272 (74.7%) |
| Professional & Scientific | 665 (57.0%) | 501 (43.0%) |
| Enterprise Management | 0 (0.0%) | 37 (100.0%) |
| Administrative & Support | 337 (55.8%) | 267 (44.2%) |
| Educational Services | 357 (32.7%) | 736 (67.3%) |
| Health Care & Social Assistance | 591 (23.5%) | 1,925 (76.5%) |
| Arts, Entertainment & Recreation | 199 (55.3%) | 161 (44.7%) |
| Accommodation & Food Services | 290 (37.1%) | 492 (62.9%) |
| Public Administration | 201 (72.6%) | 76 (27.4%) |
| Total | 8,095 (52.2%) | 7,407 (47.8%) |
Education in Chaska
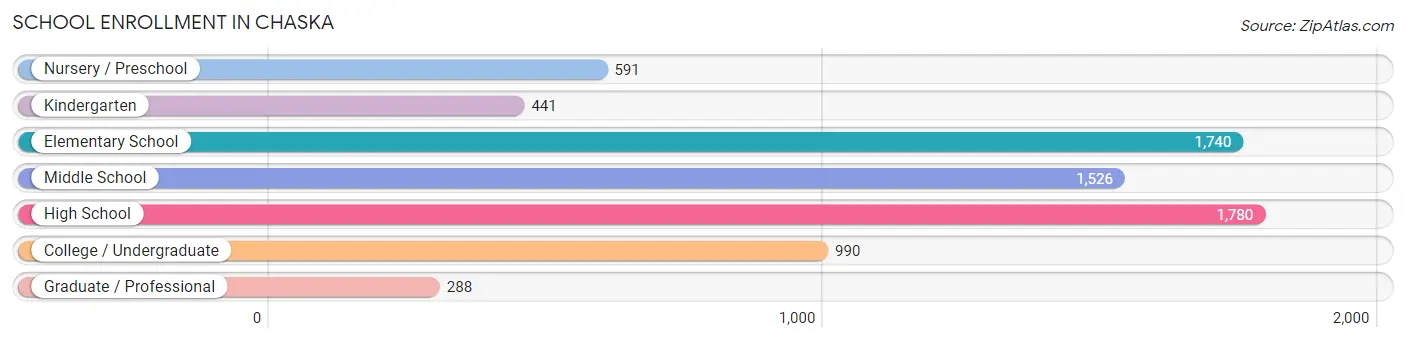
School Enrollment in Chaska
The most common levels of schooling among the 7,356 students in Chaska are high school (1,780 | 24.2%), elementary school (1,740 | 23.6%), and middle school (1,526 | 20.7%).
| School Level | # Students | % Students |
| Nursery / Preschool | 591 | 8.0% |
| Kindergarten | 441 | 6.0% |
| Elementary School | 1,740 | 23.6% |
| Middle School | 1,526 | 20.7% |
| High School | 1,780 | 24.2% |
| College / Undergraduate | 990 | 13.5% |
| Graduate / Professional | 288 | 3.9% |
| Total | 7,356 | 100.0% |
School Enrollment by Age by Funding Source in Chaska
Out of a total of 7,356 students who are enrolled in schools in Chaska, 1,412 (19.2%) attend a private institution, while the remaining 5,944 (80.8%) are enrolled in public schools. The age group of 20 to 24 year olds has the highest likelihood of being enrolled in private schools, with 264 (44.7% in the age bracket) enrolled. Conversely, the age group of 18 to 19 year olds has the lowest likelihood of being enrolled in a private school, with 302 (94.7% in the age bracket) attending a public institution.
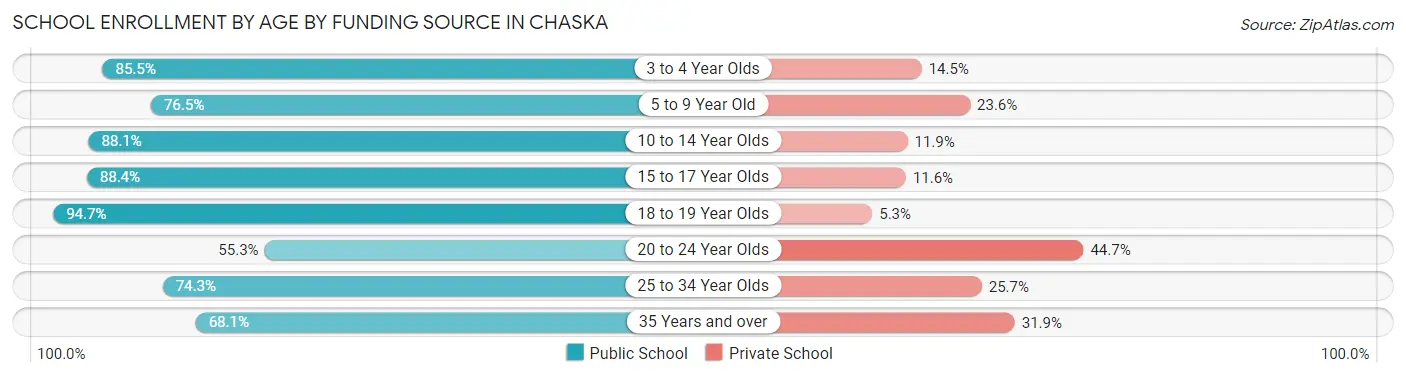
| Age Bracket | Public School | Private School |
| 3 to 4 Year Olds | 459 (85.5%) | 78 (14.5%) |
| 5 to 9 Year Old | 1,571 (76.4%) | 484 (23.5%) |
| 10 to 14 Year Olds | 1,680 (88.1%) | 227 (11.9%) |
| 15 to 17 Year Olds | 1,136 (88.4%) | 149 (11.6%) |
| 18 to 19 Year Olds | 302 (94.7%) | 17 (5.3%) |
| 20 to 24 Year Olds | 327 (55.3%) | 264 (44.7%) |
| 25 to 34 Year Olds | 254 (74.3%) | 88 (25.7%) |
| 35 Years and over | 218 (68.1%) | 102 (31.9%) |
| Total | 5,944 (80.8%) | 1,412 (19.2%) |
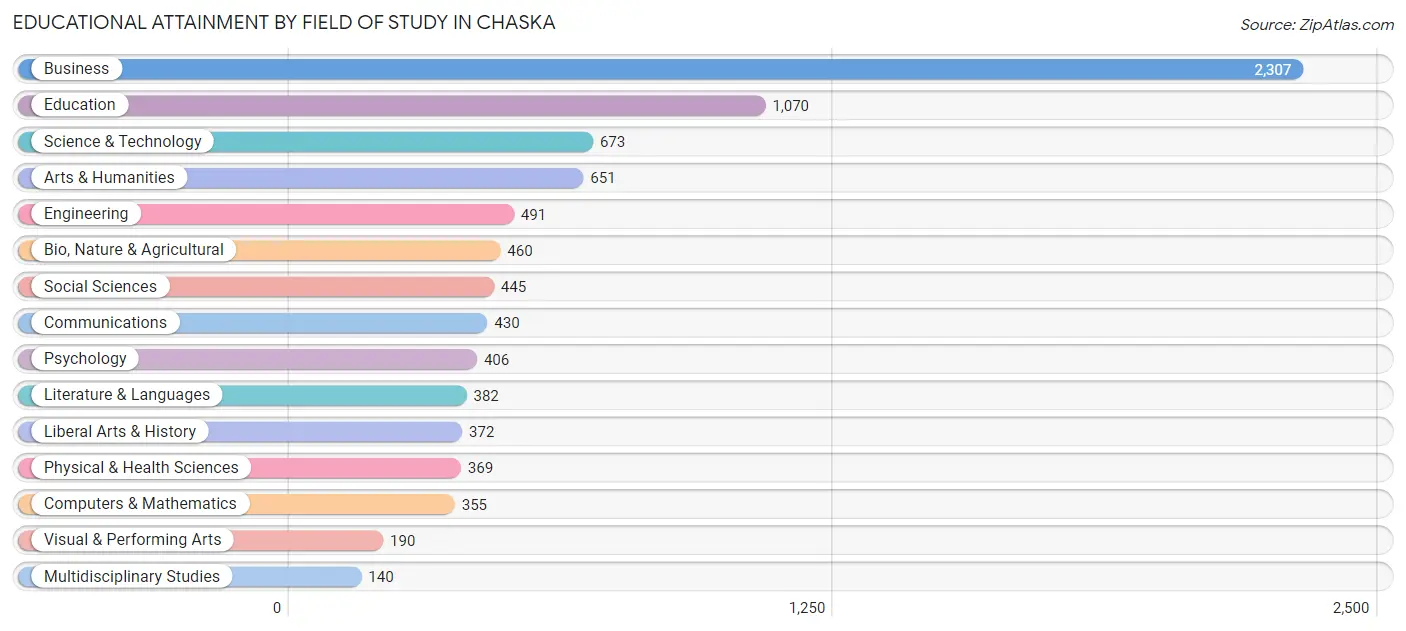
Educational Attainment by Field of Study in Chaska
Business (2,307 | 26.4%), education (1,070 | 12.2%), science & technology (673 | 7.7%), arts & humanities (651 | 7.4%), and engineering (491 | 5.6%) are the most common fields of study among 8,741 individuals in Chaska who have obtained a bachelor's degree or higher.
| Field of Study | # Graduates | % Graduates |
| Computers & Mathematics | 355 | 4.1% |
| Bio, Nature & Agricultural | 460 | 5.3% |
| Physical & Health Sciences | 369 | 4.2% |
| Psychology | 406 | 4.6% |
| Social Sciences | 445 | 5.1% |
| Engineering | 491 | 5.6% |
| Multidisciplinary Studies | 140 | 1.6% |
| Science & Technology | 673 | 7.7% |
| Business | 2,307 | 26.4% |
| Education | 1,070 | 12.2% |
| Literature & Languages | 382 | 4.4% |
| Liberal Arts & History | 372 | 4.3% |
| Visual & Performing Arts | 190 | 2.2% |
| Communications | 430 | 4.9% |
| Arts & Humanities | 651 | 7.4% |
| Total | 8,741 | 100.0% |
Transportation & Commute in Chaska
Vehicle Availability by Sex in Chaska
The most prevalent vehicle ownership categories in Chaska are males with 2 vehicles (3,848, accounting for 47.8%) and females with 2 vehicles (2,986, making up 52.5%).
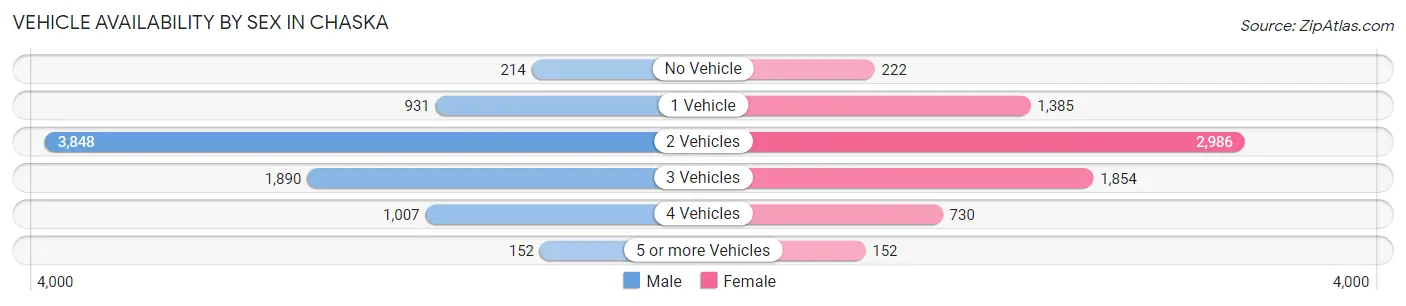
| Vehicles Available | Male | Female |
| No Vehicle | 214 (2.7%) | 222 (3.0%) |
| 1 Vehicle | 931 (11.6%) | 1,385 (18.9%) |
| 2 Vehicles | 3,848 (47.8%) | 2,986 (40.7%) |
| 3 Vehicles | 1,890 (23.5%) | 1,854 (25.3%) |
| 4 Vehicles | 1,007 (12.5%) | 730 (10.0%) |
| 5 or more Vehicles | 152 (1.9%) | 152 (2.1%) |
| Total | 8,042 (100.0%) | 7,329 (100.0%) |
Commute Time in Chaska
The most frequently occuring commute durations in Chaska are 15 to 19 minutes (2,334 commuters, 18.1%), 20 to 24 minutes (1,955 commuters, 15.1%), and 30 to 34 minutes (1,554 commuters, 12.0%).
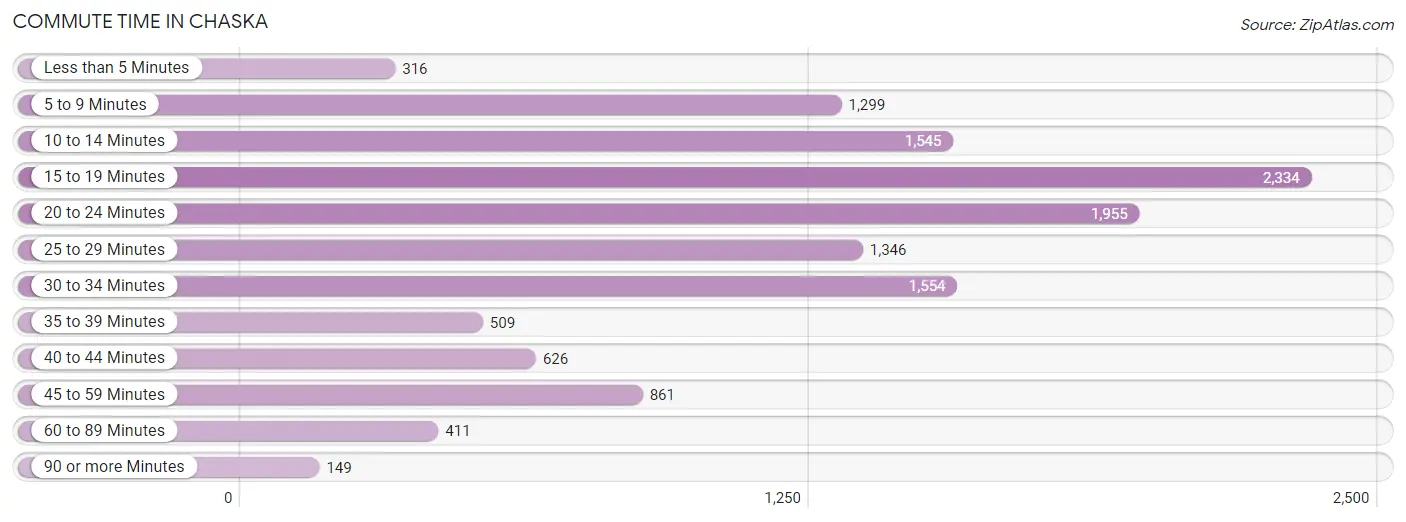
| Commute Time | # Commuters | % Commuters |
| Less than 5 Minutes | 316 | 2.5% |
| 5 to 9 Minutes | 1,299 | 10.1% |
| 10 to 14 Minutes | 1,545 | 12.0% |
| 15 to 19 Minutes | 2,334 | 18.1% |
| 20 to 24 Minutes | 1,955 | 15.1% |
| 25 to 29 Minutes | 1,346 | 10.4% |
| 30 to 34 Minutes | 1,554 | 12.0% |
| 35 to 39 Minutes | 509 | 3.9% |
| 40 to 44 Minutes | 626 | 4.9% |
| 45 to 59 Minutes | 861 | 6.7% |
| 60 to 89 Minutes | 411 | 3.2% |
| 90 or more Minutes | 149 | 1.1% |
Commute Time by Sex in Chaska
The most common commute times in Chaska are 15 to 19 minutes (1,145 commuters, 16.5%) for males and 15 to 19 minutes (1,189 commuters, 20.0%) for females.
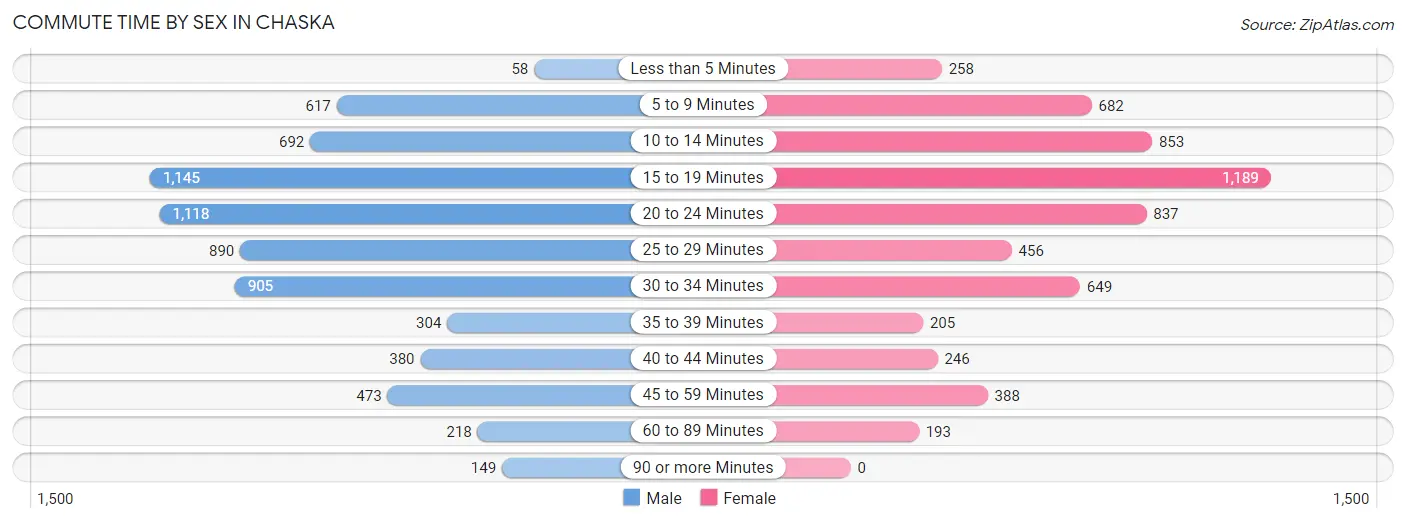
| Commute Time | Male | Female |
| Less than 5 Minutes | 58 (0.8%) | 258 (4.3%) |
| 5 to 9 Minutes | 617 (8.9%) | 682 (11.5%) |
| 10 to 14 Minutes | 692 (10.0%) | 853 (14.3%) |
| 15 to 19 Minutes | 1,145 (16.5%) | 1,189 (20.0%) |
| 20 to 24 Minutes | 1,118 (16.1%) | 837 (14.1%) |
| 25 to 29 Minutes | 890 (12.8%) | 456 (7.7%) |
| 30 to 34 Minutes | 905 (13.0%) | 649 (10.9%) |
| 35 to 39 Minutes | 304 (4.4%) | 205 (3.4%) |
| 40 to 44 Minutes | 380 (5.5%) | 246 (4.1%) |
| 45 to 59 Minutes | 473 (6.8%) | 388 (6.5%) |
| 60 to 89 Minutes | 218 (3.1%) | 193 (3.2%) |
| 90 or more Minutes | 149 (2.1%) | 0 (0.0%) |
Time of Departure to Work by Sex in Chaska
The most frequent times of departure to work in Chaska are 7:30 AM to 7:59 AM (1,603, 23.1%) for males and 7:30 AM to 7:59 AM (998, 16.8%) for females.
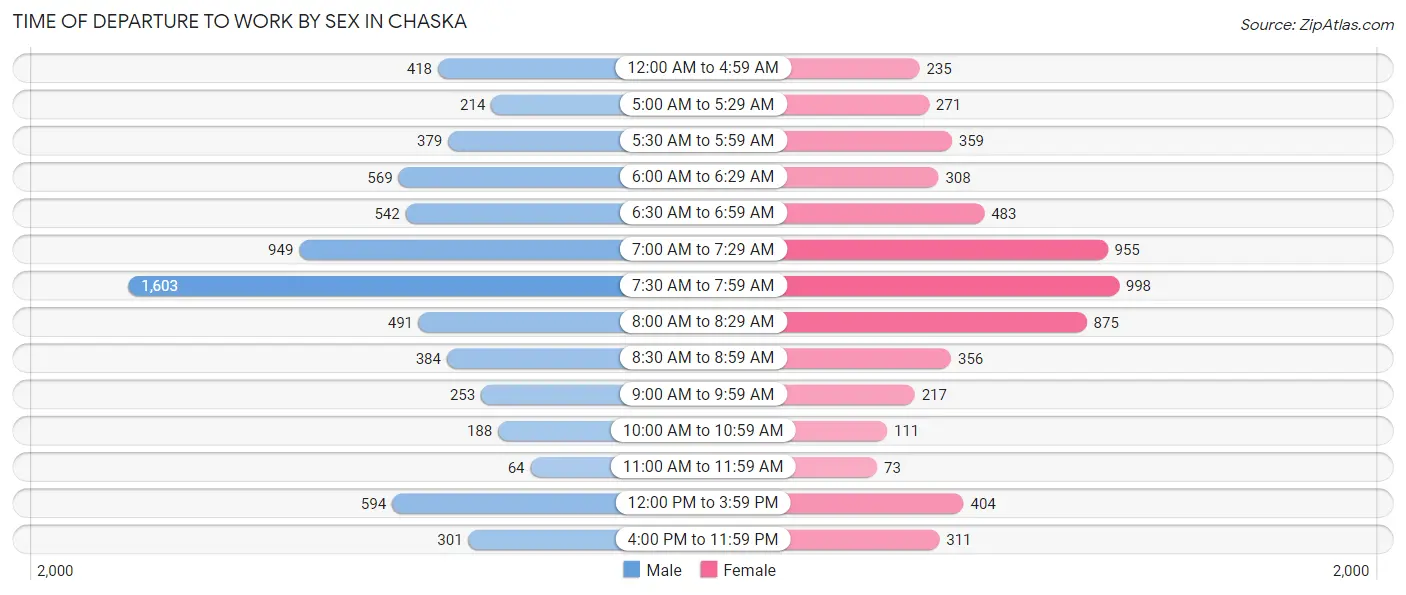
| Time of Departure | Male | Female |
| 12:00 AM to 4:59 AM | 418 (6.0%) | 235 (4.0%) |
| 5:00 AM to 5:29 AM | 214 (3.1%) | 271 (4.5%) |
| 5:30 AM to 5:59 AM | 379 (5.4%) | 359 (6.0%) |
| 6:00 AM to 6:29 AM | 569 (8.2%) | 308 (5.2%) |
| 6:30 AM to 6:59 AM | 542 (7.8%) | 483 (8.1%) |
| 7:00 AM to 7:29 AM | 949 (13.7%) | 955 (16.0%) |
| 7:30 AM to 7:59 AM | 1,603 (23.1%) | 998 (16.8%) |
| 8:00 AM to 8:29 AM | 491 (7.1%) | 875 (14.7%) |
| 8:30 AM to 8:59 AM | 384 (5.5%) | 356 (6.0%) |
| 9:00 AM to 9:59 AM | 253 (3.6%) | 217 (3.6%) |
| 10:00 AM to 10:59 AM | 188 (2.7%) | 111 (1.9%) |
| 11:00 AM to 11:59 AM | 64 (0.9%) | 73 (1.2%) |
| 12:00 PM to 3:59 PM | 594 (8.6%) | 404 (6.8%) |
| 4:00 PM to 11:59 PM | 301 (4.3%) | 311 (5.2%) |
| Total | 6,949 (100.0%) | 5,956 (100.0%) |
Housing Occupancy in Chaska
Occupancy by Ownership in Chaska
Of the total 10,449 dwellings in Chaska, owner-occupied units account for 7,311 (70.0%), while renter-occupied units make up 3,138 (30.0%).
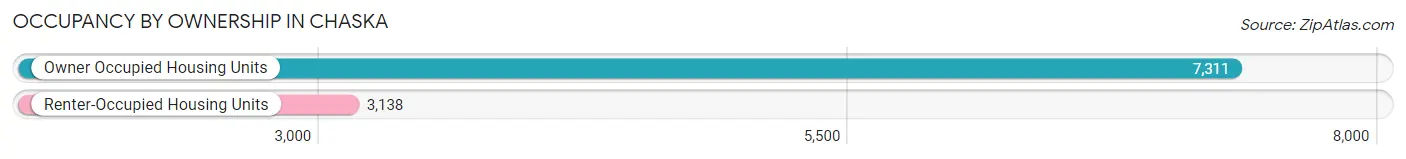
| Occupancy | # Housing Units | % Housing Units |
| Owner Occupied Housing Units | 7,311 | 70.0% |
| Renter-Occupied Housing Units | 3,138 | 30.0% |
| Total Occupied Housing Units | 10,449 | 100.0% |
Occupancy by Household Size in Chaska
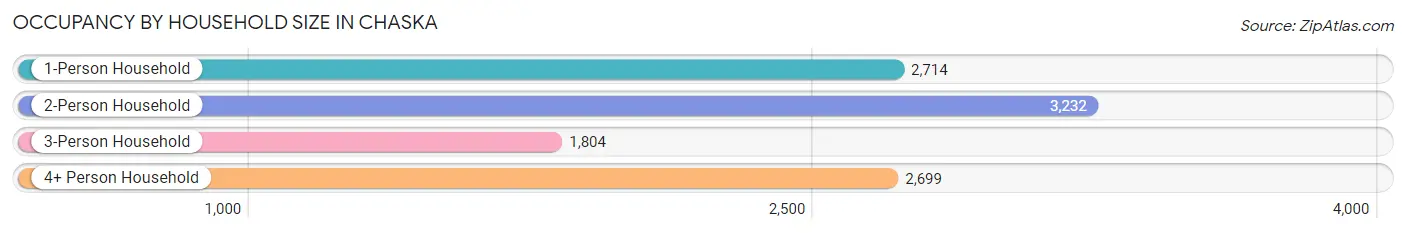
| Household Size | # Housing Units | % Housing Units |
| 1-Person Household | 2,714 | 26.0% |
| 2-Person Household | 3,232 | 30.9% |
| 3-Person Household | 1,804 | 17.3% |
| 4+ Person Household | 2,699 | 25.8% |
| Total Housing Units | 10,449 | 100.0% |
Occupancy by Ownership by Household Size in Chaska
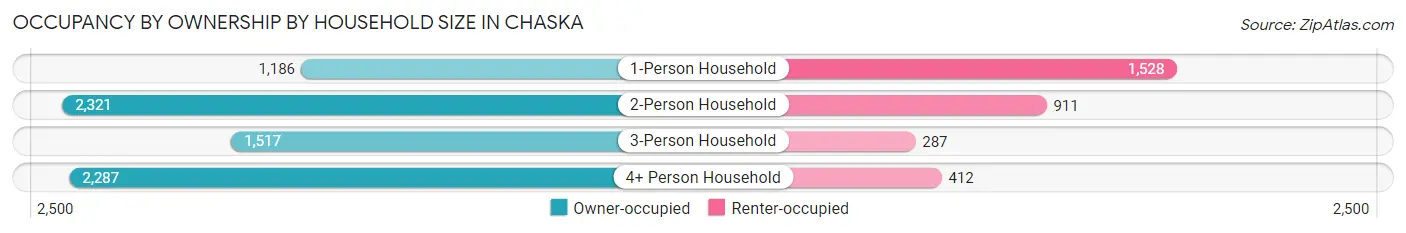
| Household Size | Owner-occupied | Renter-occupied |
| 1-Person Household | 1,186 (43.7%) | 1,528 (56.3%) |
| 2-Person Household | 2,321 (71.8%) | 911 (28.2%) |
| 3-Person Household | 1,517 (84.1%) | 287 (15.9%) |
| 4+ Person Household | 2,287 (84.7%) | 412 (15.3%) |
| Total Housing Units | 7,311 (70.0%) | 3,138 (30.0%) |
Occupancy by Educational Attainment in Chaska
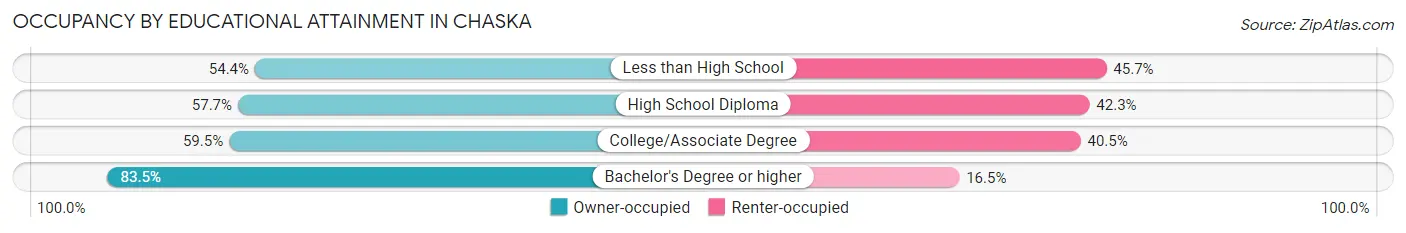
| Household Size | Owner-occupied | Renter-occupied |
| Less than High School | 350 (54.3%) | 294 (45.7%) |
| High School Diploma | 1,092 (57.7%) | 800 (42.3%) |
| College/Associate Degree | 1,832 (59.5%) | 1,248 (40.5%) |
| Bachelor's Degree or higher | 4,037 (83.5%) | 796 (16.5%) |
Occupancy by Age of Householder in Chaska
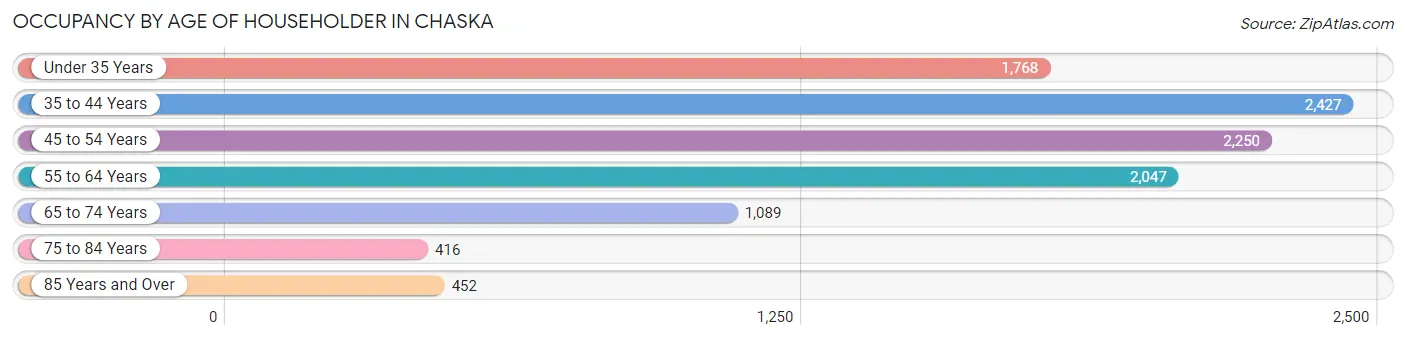
| Age Bracket | # Households | % Households |
| Under 35 Years | 1,768 | 16.9% |
| 35 to 44 Years | 2,427 | 23.2% |
| 45 to 54 Years | 2,250 | 21.5% |
| 55 to 64 Years | 2,047 | 19.6% |
| 65 to 74 Years | 1,089 | 10.4% |
| 75 to 84 Years | 416 | 4.0% |
| 85 Years and Over | 452 | 4.3% |
| Total | 10,449 | 100.0% |
Housing Finances in Chaska
Median Income by Occupancy in Chaska
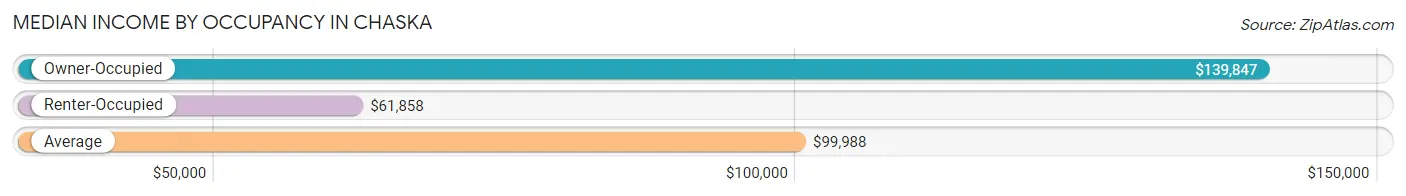
| Occupancy Type | # Households | Median Income |
| Owner-Occupied | 7,311 (70.0%) | $139,847 |
| Renter-Occupied | 3,138 (30.0%) | $61,858 |
| Average | 10,449 (100.0%) | $99,988 |
Occupancy by Householder Income Bracket in Chaska
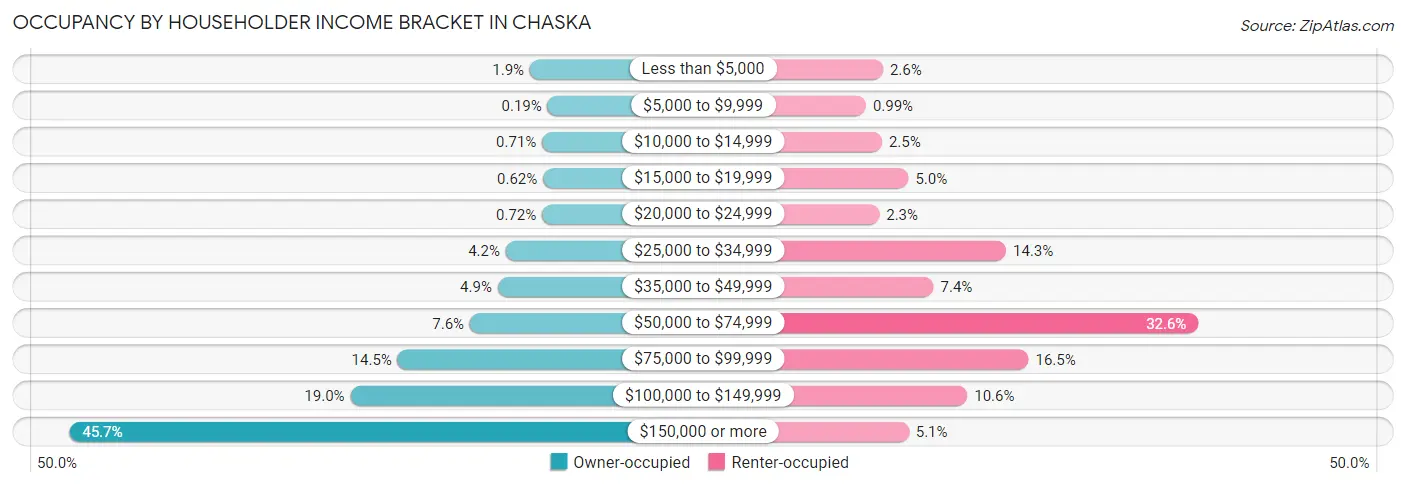
| Income Bracket | Owner-occupied | Renter-occupied |
| Less than $5,000 | 137 (1.9%) | 82 (2.6%) |
| $5,000 to $9,999 | 14 (0.2%) | 31 (1.0%) |
| $10,000 to $14,999 | 52 (0.7%) | 79 (2.5%) |
| $15,000 to $19,999 | 45 (0.6%) | 158 (5.0%) |
| $20,000 to $24,999 | 53 (0.7%) | 71 (2.3%) |
| $25,000 to $34,999 | 305 (4.2%) | 450 (14.3%) |
| $35,000 to $49,999 | 361 (4.9%) | 233 (7.4%) |
| $50,000 to $74,999 | 555 (7.6%) | 1,024 (32.6%) |
| $75,000 to $99,999 | 1,058 (14.5%) | 517 (16.5%) |
| $100,000 to $149,999 | 1,387 (19.0%) | 334 (10.6%) |
| $150,000 or more | 3,344 (45.7%) | 159 (5.1%) |
| Total | 7,311 (100.0%) | 3,138 (100.0%) |
Monthly Housing Cost Tiers in Chaska
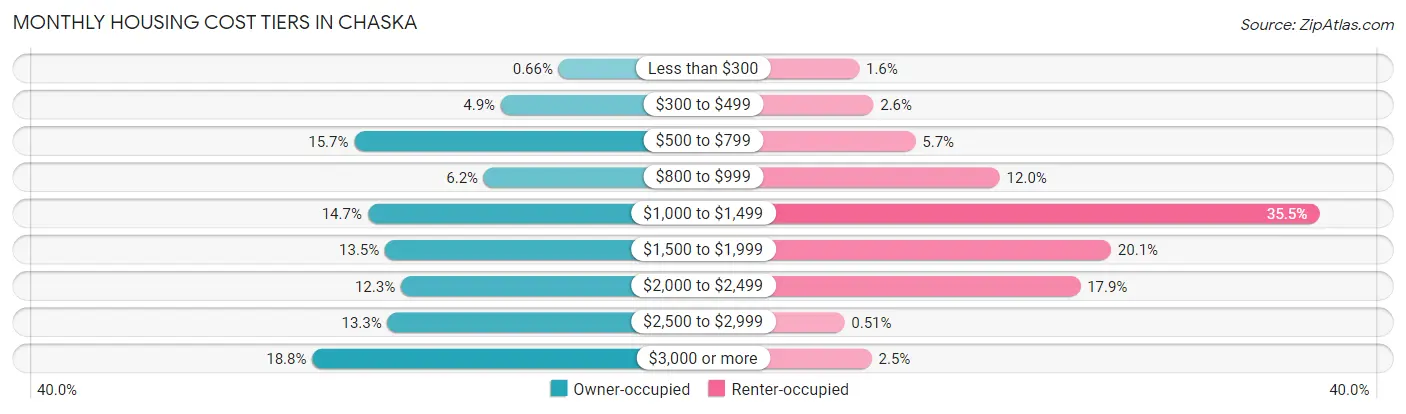
| Monthly Cost | Owner-occupied | Renter-occupied |
| Less than $300 | 48 (0.7%) | 50 (1.6%) |
| $300 to $499 | 360 (4.9%) | 83 (2.6%) |
| $500 to $799 | 1,149 (15.7%) | 180 (5.7%) |
| $800 to $999 | 451 (6.2%) | 375 (11.9%) |
| $1,000 to $1,499 | 1,077 (14.7%) | 1,113 (35.5%) |
| $1,500 to $1,999 | 983 (13.5%) | 632 (20.1%) |
| $2,000 to $2,499 | 898 (12.3%) | 561 (17.9%) |
| $2,500 to $2,999 | 970 (13.3%) | 16 (0.5%) |
| $3,000 or more | 1,375 (18.8%) | 79 (2.5%) |
| Total | 7,311 (100.0%) | 3,138 (100.0%) |
Physical Housing Characteristics in Chaska
Housing Structures in Chaska
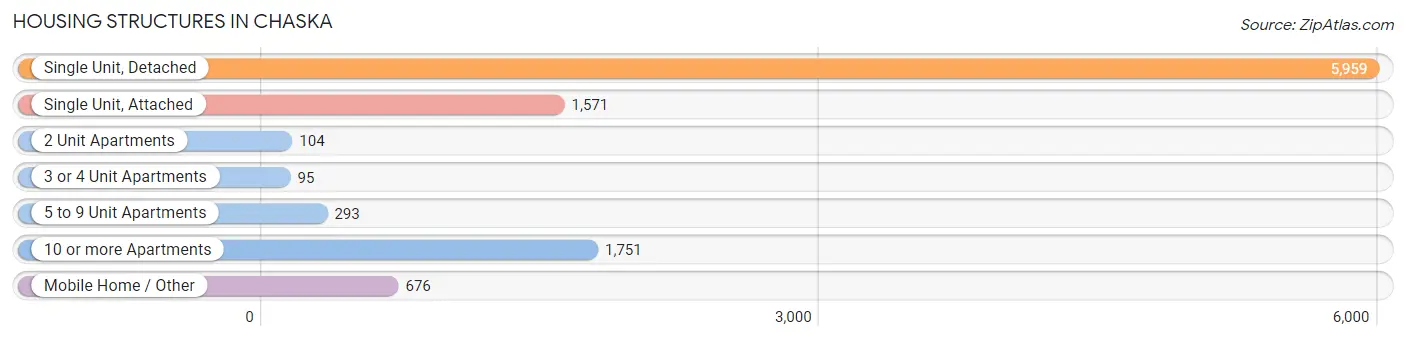
| Structure Type | # Housing Units | % Housing Units |
| Single Unit, Detached | 5,959 | 57.0% |
| Single Unit, Attached | 1,571 | 15.0% |
| 2 Unit Apartments | 104 | 1.0% |
| 3 or 4 Unit Apartments | 95 | 0.9% |
| 5 to 9 Unit Apartments | 293 | 2.8% |
| 10 or more Apartments | 1,751 | 16.8% |
| Mobile Home / Other | 676 | 6.5% |
| Total | 10,449 | 100.0% |
Housing Structures by Occupancy in Chaska
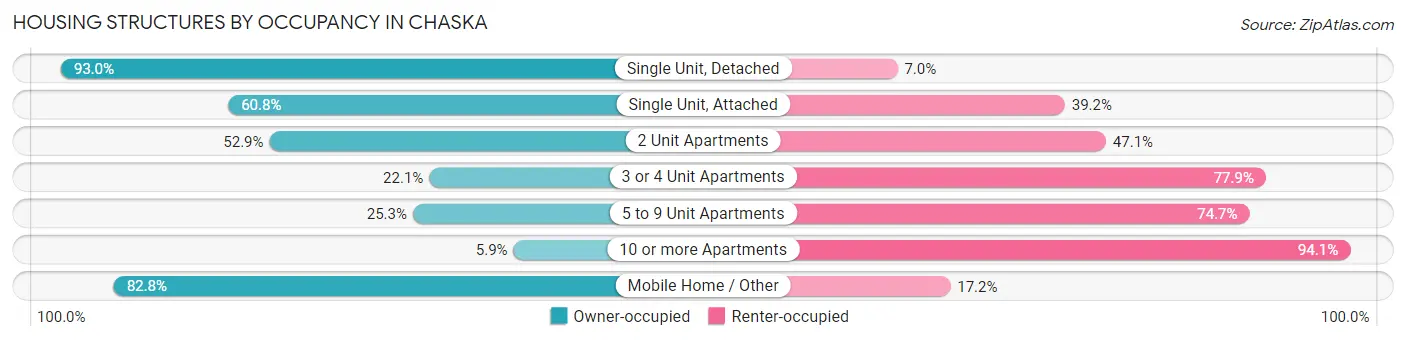
| Structure Type | Owner-occupied | Renter-occupied |
| Single Unit, Detached | 5,543 (93.0%) | 416 (7.0%) |
| Single Unit, Attached | 955 (60.8%) | 616 (39.2%) |
| 2 Unit Apartments | 55 (52.9%) | 49 (47.1%) |
| 3 or 4 Unit Apartments | 21 (22.1%) | 74 (77.9%) |
| 5 to 9 Unit Apartments | 74 (25.3%) | 219 (74.7%) |
| 10 or more Apartments | 103 (5.9%) | 1,648 (94.1%) |
| Mobile Home / Other | 560 (82.8%) | 116 (17.2%) |
| Total | 7,311 (70.0%) | 3,138 (30.0%) |
Housing Structures by Number of Rooms in Chaska
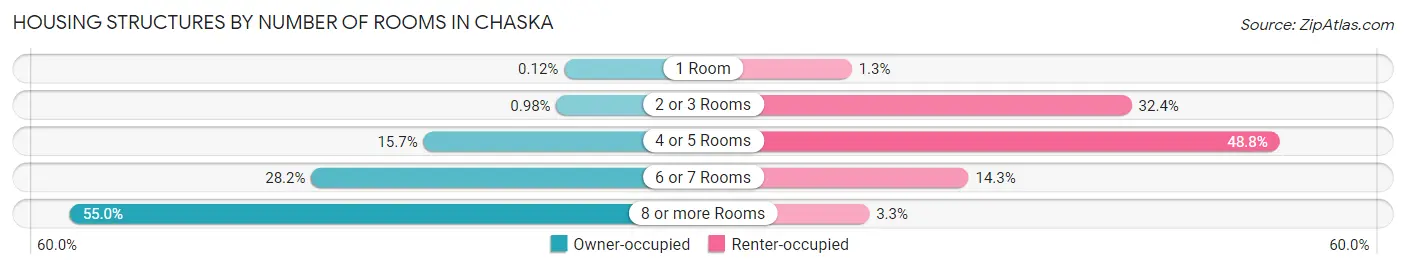
| Number of Rooms | Owner-occupied | Renter-occupied |
| 1 Room | 9 (0.1%) | 41 (1.3%) |
| 2 or 3 Rooms | 72 (1.0%) | 1,016 (32.4%) |
| 4 or 5 Rooms | 1,150 (15.7%) | 1,531 (48.8%) |
| 6 or 7 Rooms | 2,060 (28.2%) | 448 (14.3%) |
| 8 or more Rooms | 4,020 (55.0%) | 102 (3.3%) |
| Total | 7,311 (100.0%) | 3,138 (100.0%) |
Housing Structure by Heating Type in Chaska
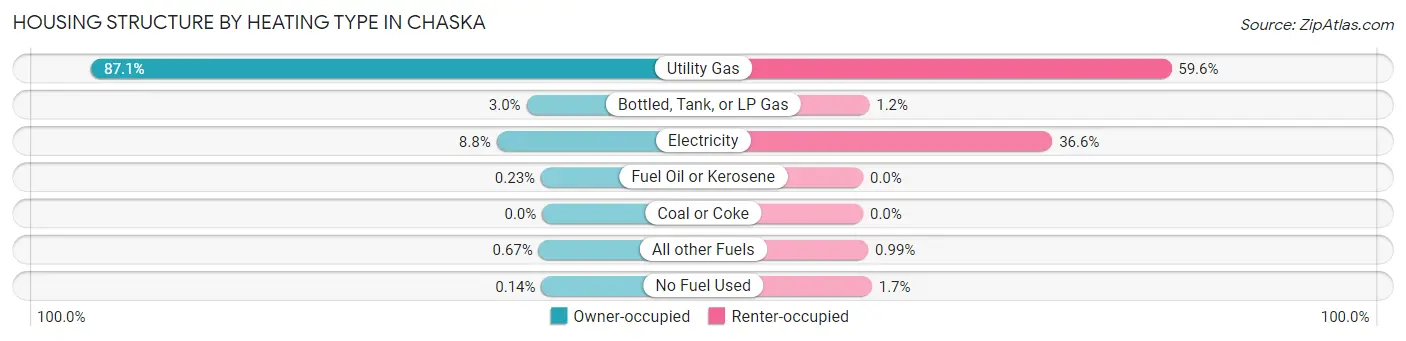
| Heating Type | Owner-occupied | Renter-occupied |
| Utility Gas | 6,370 (87.1%) | 1,869 (59.6%) |
| Bottled, Tank, or LP Gas | 221 (3.0%) | 38 (1.2%) |
| Electricity | 644 (8.8%) | 1,147 (36.5%) |
| Fuel Oil or Kerosene | 17 (0.2%) | 0 (0.0%) |
| Coal or Coke | 0 (0.0%) | 0 (0.0%) |
| All other Fuels | 49 (0.7%) | 31 (1.0%) |
| No Fuel Used | 10 (0.1%) | 53 (1.7%) |
| Total | 7,311 (100.0%) | 3,138 (100.0%) |
Household Vehicle Usage in Chaska
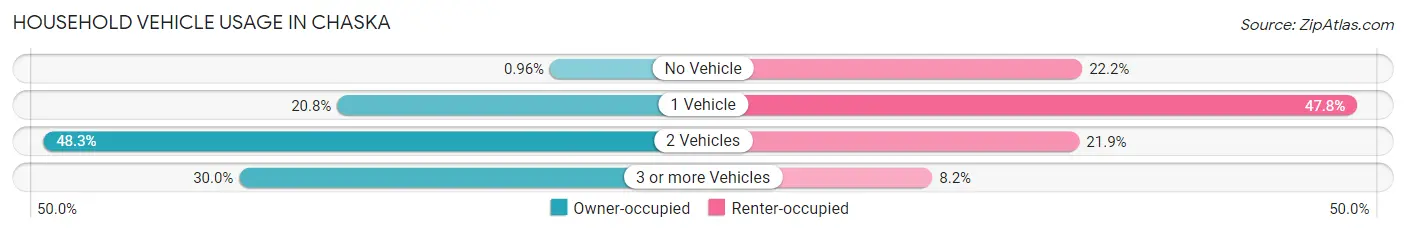
| Vehicles per Household | Owner-occupied | Renter-occupied |
| No Vehicle | 70 (1.0%) | 695 (22.2%) |
| 1 Vehicle | 1,522 (20.8%) | 1,500 (47.8%) |
| 2 Vehicles | 3,528 (48.3%) | 687 (21.9%) |
| 3 or more Vehicles | 2,191 (30.0%) | 256 (8.2%) |
| Total | 7,311 (100.0%) | 3,138 (100.0%) |
Real Estate & Mortgages in Chaska
Real Estate and Mortgage Overview in Chaska
| Characteristic | Without Mortgage | With Mortgage |
| Housing Units | 2,076 | 5,235 |
| Median Property Value | $275,800 | $389,000 |
| Median Household Income | $75,060 | $2,850 |
| Monthly Housing Costs | $697 | $1,355 |
| Real Estate Taxes | $3,097 | $55 |
Property Value by Mortgage Status in Chaska
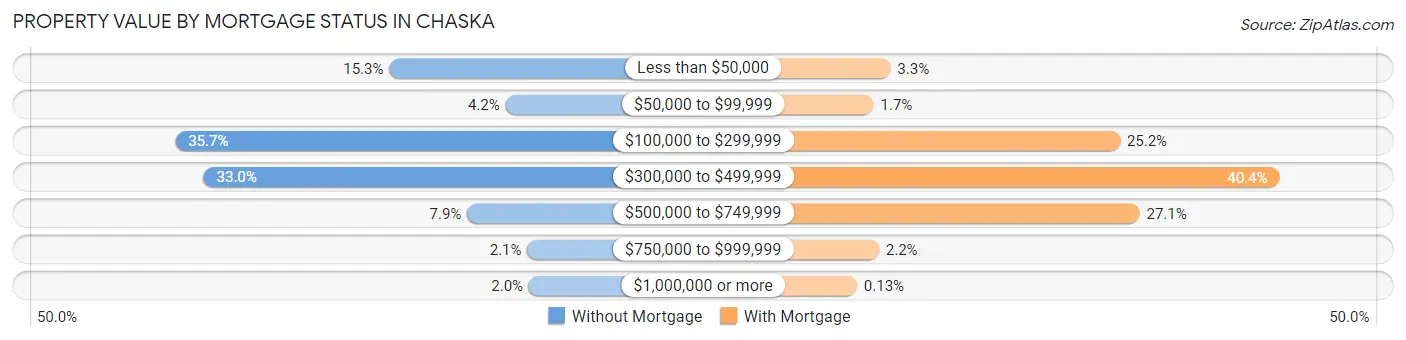
| Property Value | Without Mortgage | With Mortgage |
| Less than $50,000 | 317 (15.3%) | 174 (3.3%) |
| $50,000 to $99,999 | 87 (4.2%) | 90 (1.7%) |
| $100,000 to $299,999 | 740 (35.6%) | 1,318 (25.2%) |
| $300,000 to $499,999 | 684 (33.0%) | 2,114 (40.4%) |
| $500,000 to $749,999 | 163 (7.9%) | 1,416 (27.1%) |
| $750,000 to $999,999 | 44 (2.1%) | 116 (2.2%) |
| $1,000,000 or more | 41 (2.0%) | 7 (0.1%) |
| Total | 2,076 (100.0%) | 5,235 (100.0%) |
Household Income by Mortgage Status in Chaska
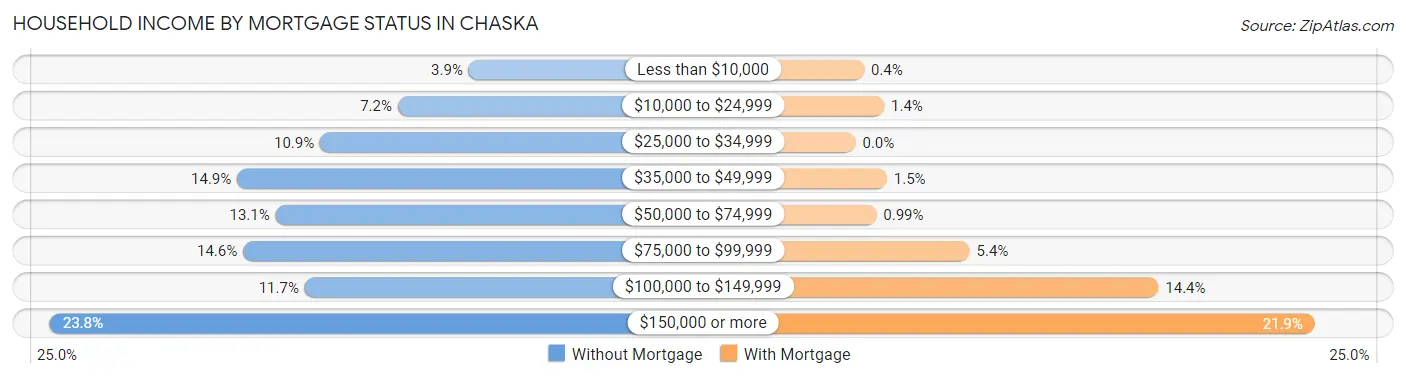
| Household Income | Without Mortgage | With Mortgage |
| Less than $10,000 | 80 (3.8%) | 21 (0.4%) |
| $10,000 to $24,999 | 150 (7.2%) | 71 (1.4%) |
| $25,000 to $34,999 | 227 (10.9%) | 0 (0.0%) |
| $35,000 to $49,999 | 309 (14.9%) | 78 (1.5%) |
| $50,000 to $74,999 | 271 (13.1%) | 52 (1.0%) |
| $75,000 to $99,999 | 303 (14.6%) | 284 (5.4%) |
| $100,000 to $149,999 | 242 (11.7%) | 755 (14.4%) |
| $150,000 or more | 494 (23.8%) | 1,145 (21.9%) |
| Total | 2,076 (100.0%) | 5,235 (100.0%) |
Property Value to Household Income Ratio in Chaska
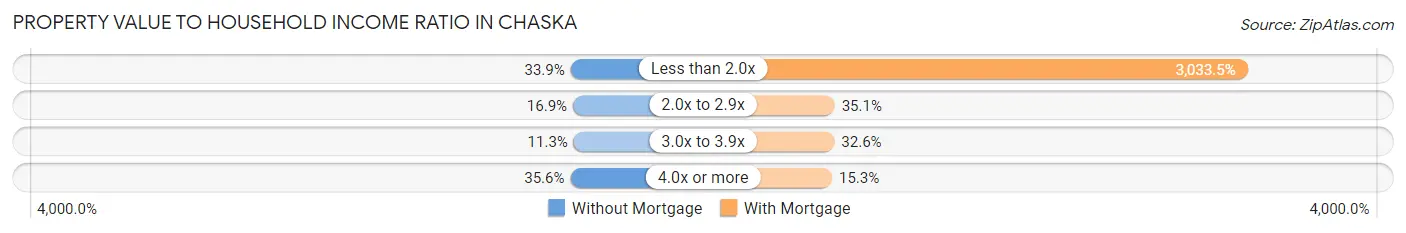
| Value-to-Income Ratio | Without Mortgage | With Mortgage |
| Less than 2.0x | 704 (33.9%) | 158,805 (3,033.5%) |
| 2.0x to 2.9x | 351 (16.9%) | 1,836 (35.1%) |
| 3.0x to 3.9x | 234 (11.3%) | 1,705 (32.6%) |
| 4.0x or more | 738 (35.5%) | 799 (15.3%) |
| Total | 2,076 (100.0%) | 5,235 (100.0%) |
Real Estate Taxes by Mortgage Status in Chaska
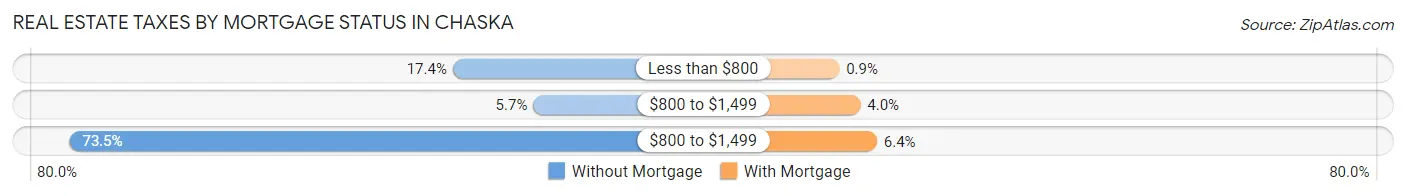
| Property Taxes | Without Mortgage | With Mortgage |
| Less than $800 | 362 (17.4%) | 47 (0.9%) |
| $800 to $1,499 | 118 (5.7%) | 209 (4.0%) |
| $800 to $1,499 | 1,525 (73.5%) | 335 (6.4%) |
| Total | 2,076 (100.0%) | 5,235 (100.0%) |
Health & Disability in Chaska
Health Insurance Coverage by Age in Chaska
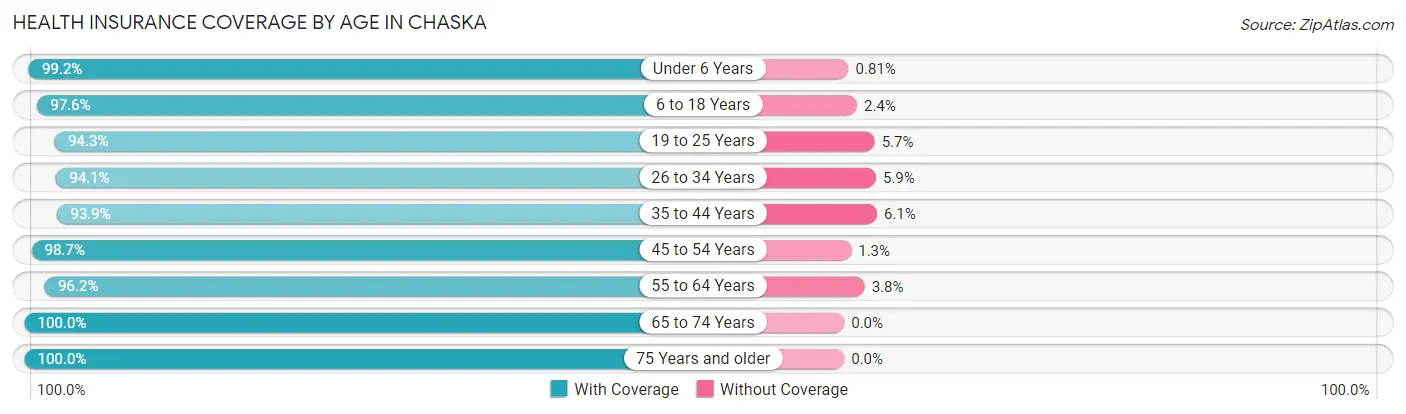
| Age Bracket | With Coverage | Without Coverage |
| Under 6 Years | 2,436 (99.2%) | 20 (0.8%) |
| 6 to 18 Years | 5,280 (97.6%) | 129 (2.4%) |
| 19 to 25 Years | 2,297 (94.3%) | 138 (5.7%) |
| 26 to 34 Years | 2,529 (94.1%) | 159 (5.9%) |
| 35 to 44 Years | 3,888 (93.9%) | 253 (6.1%) |
| 45 to 54 Years | 3,933 (98.7%) | 52 (1.3%) |
| 55 to 64 Years | 3,182 (96.2%) | 126 (3.8%) |
| 65 to 74 Years | 1,858 (100.0%) | 0 (0.0%) |
| 75 Years and older | 1,399 (100.0%) | 0 (0.0%) |
| Total | 26,802 (96.8%) | 877 (3.2%) |
Health Insurance Coverage by Citizenship Status in Chaska
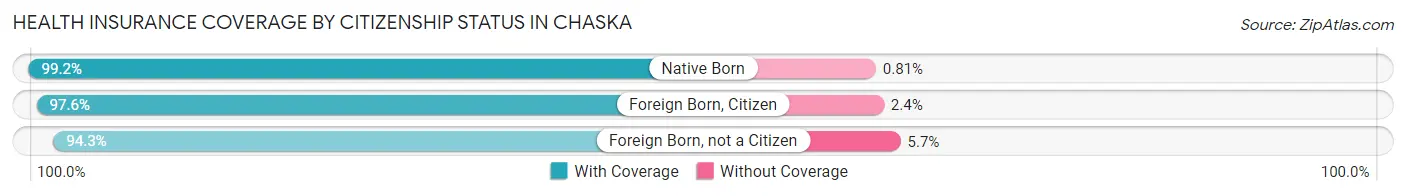
| Citizenship Status | With Coverage | Without Coverage |
| Native Born | 2,436 (99.2%) | 20 (0.8%) |
| Foreign Born, Citizen | 5,280 (97.6%) | 129 (2.4%) |
| Foreign Born, not a Citizen | 2,297 (94.3%) | 138 (5.7%) |
Health Insurance Coverage by Household Income in Chaska
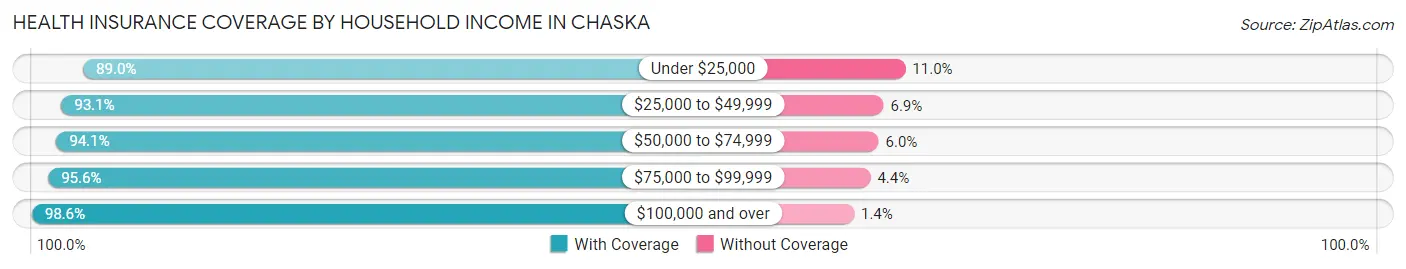
| Household Income | With Coverage | Without Coverage |
| Under $25,000 | 997 (89.0%) | 123 (11.0%) |
| $25,000 to $49,999 | 2,138 (93.1%) | 158 (6.9%) |
| $50,000 to $74,999 | 2,846 (94.1%) | 180 (5.9%) |
| $75,000 to $99,999 | 3,990 (95.6%) | 185 (4.4%) |
| $100,000 and over | 16,786 (98.6%) | 231 (1.4%) |
Public vs Private Health Insurance Coverage by Age in Chaska
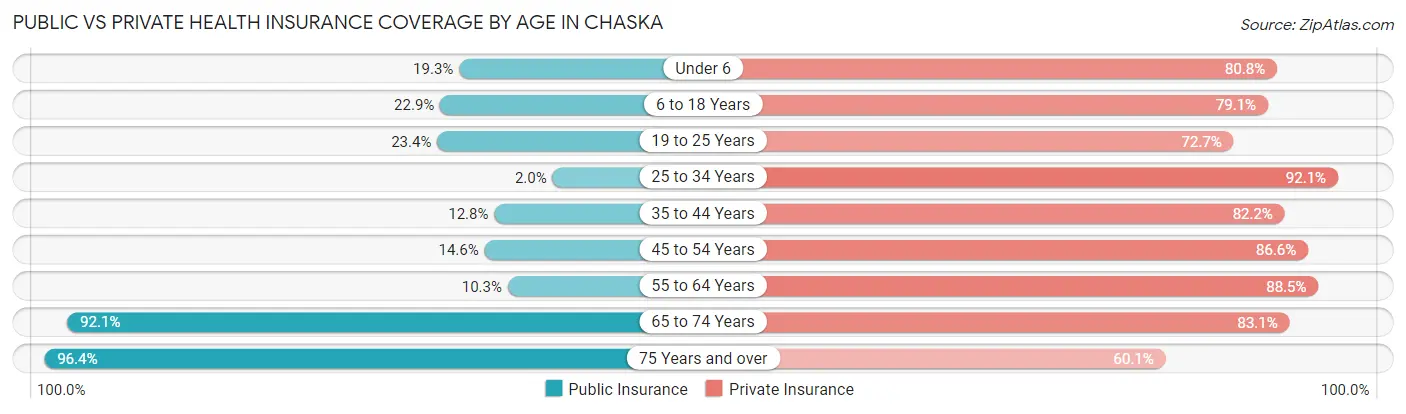
| Age Bracket | Public Insurance | Private Insurance |
| Under 6 | 475 (19.3%) | 1,984 (80.8%) |
| 6 to 18 Years | 1,237 (22.9%) | 4,278 (79.1%) |
| 19 to 25 Years | 570 (23.4%) | 1,771 (72.7%) |
| 25 to 34 Years | 54 (2.0%) | 2,475 (92.1%) |
| 35 to 44 Years | 531 (12.8%) | 3,404 (82.2%) |
| 45 to 54 Years | 583 (14.6%) | 3,449 (86.6%) |
| 55 to 64 Years | 341 (10.3%) | 2,926 (88.4%) |
| 65 to 74 Years | 1,711 (92.1%) | 1,544 (83.1%) |
| 75 Years and over | 1,348 (96.4%) | 841 (60.1%) |
| Total | 6,850 (24.7%) | 22,672 (81.9%) |
Disability Status by Sex by Age in Chaska
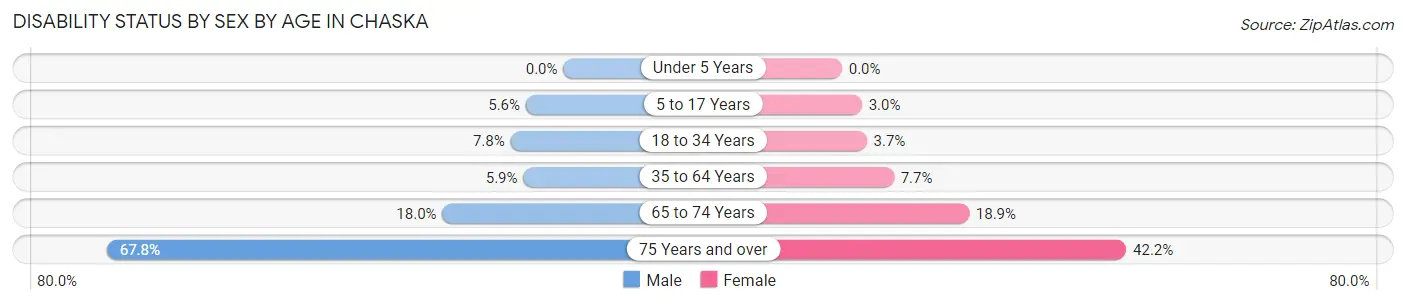
| Age Bracket | Male | Female |
| Under 5 Years | 0 (0.0%) | 0 (0.0%) |
| 5 to 17 Years | 138 (5.6%) | 88 (3.0%) |
| 18 to 34 Years | 218 (7.8%) | 100 (3.7%) |
| 35 to 64 Years | 330 (5.9%) | 453 (7.7%) |
| 65 to 74 Years | 169 (18.0%) | 173 (18.9%) |
| 75 Years and over | 404 (67.8%) | 339 (42.2%) |
Disability Class by Sex by Age in Chaska
Disability Class: Hearing Difficulty
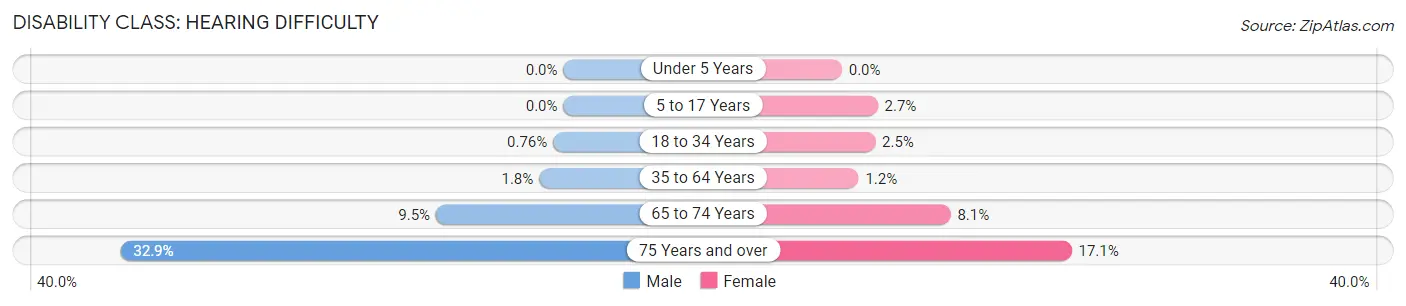
| Age Bracket | Male | Female |
| Under 5 Years | 0 (0.0%) | 0 (0.0%) |
| 5 to 17 Years | 0 (0.0%) | 79 (2.7%) |
| 18 to 34 Years | 21 (0.8%) | 67 (2.5%) |
| 35 to 64 Years | 100 (1.8%) | 73 (1.2%) |
| 65 to 74 Years | 89 (9.5%) | 74 (8.1%) |
| 75 Years and over | 196 (32.9%) | 137 (17.1%) |
Disability Class: Vision Difficulty
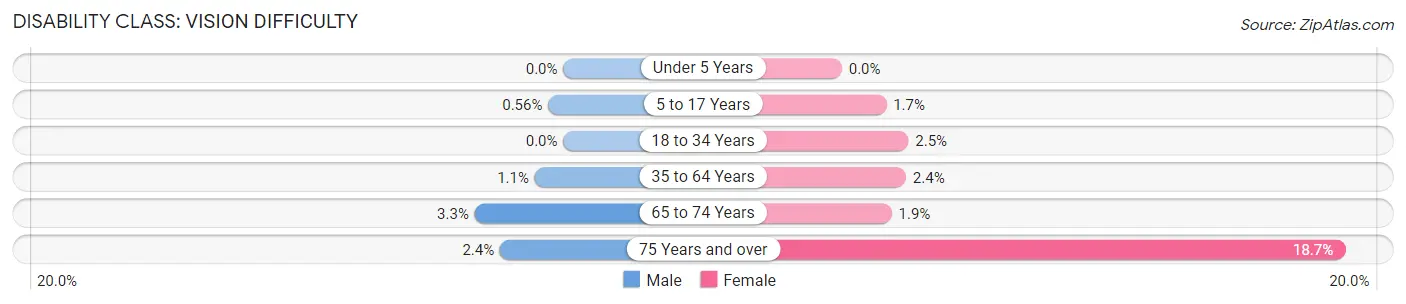
| Age Bracket | Male | Female |
| Under 5 Years | 0 (0.0%) | 0 (0.0%) |
| 5 to 17 Years | 14 (0.6%) | 49 (1.7%) |
| 18 to 34 Years | 0 (0.0%) | 67 (2.5%) |
| 35 to 64 Years | 59 (1.1%) | 140 (2.4%) |
| 65 to 74 Years | 31 (3.3%) | 17 (1.8%) |
| 75 Years and over | 14 (2.4%) | 150 (18.7%) |
Disability Class: Cognitive Difficulty
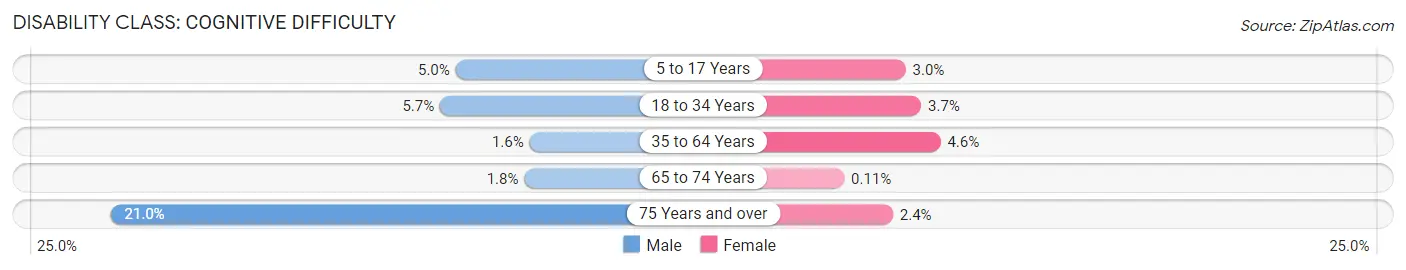
| Age Bracket | Male | Female |
| 5 to 17 Years | 124 (5.0%) | 88 (3.0%) |
| 18 to 34 Years | 159 (5.7%) | 100 (3.7%) |
| 35 to 64 Years | 87 (1.6%) | 269 (4.6%) |
| 65 to 74 Years | 17 (1.8%) | 1 (0.1%) |
| 75 Years and over | 125 (21.0%) | 19 (2.4%) |
Disability Class: Ambulatory Difficulty
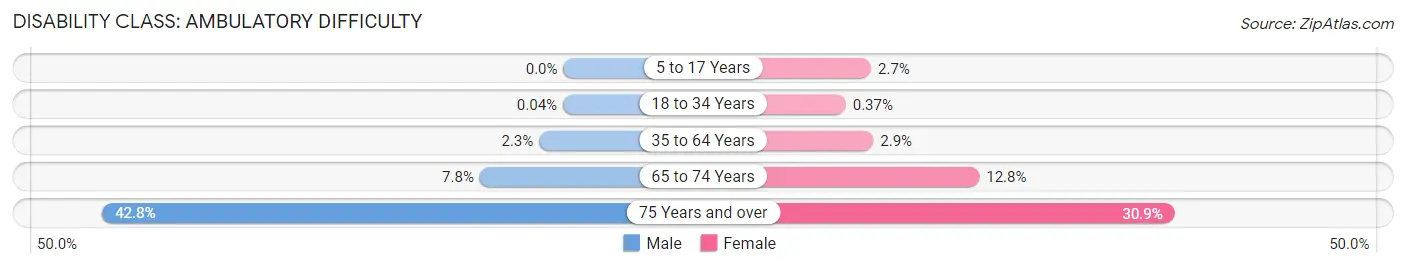
| Age Bracket | Male | Female |
| 5 to 17 Years | 0 (0.0%) | 81 (2.7%) |
| 18 to 34 Years | 1 (0.0%) | 10 (0.4%) |
| 35 to 64 Years | 125 (2.2%) | 172 (2.9%) |
| 65 to 74 Years | 73 (7.8%) | 117 (12.8%) |
| 75 Years and over | 255 (42.8%) | 248 (30.9%) |
Disability Class: Self-Care Difficulty
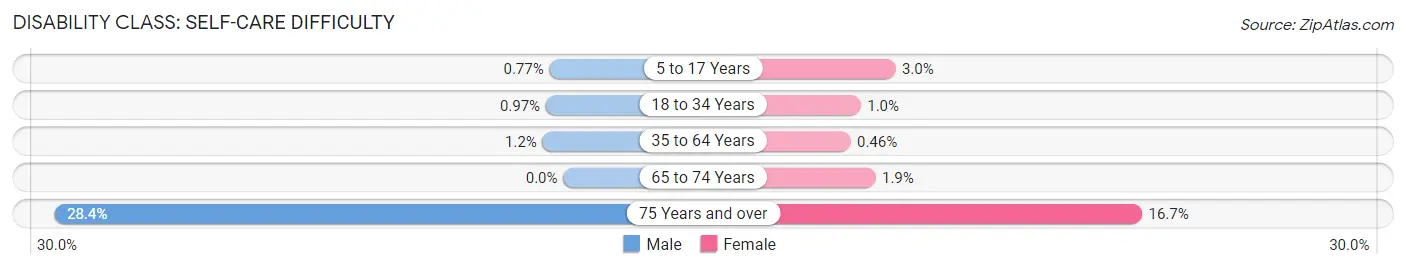
| Age Bracket | Male | Female |
| 5 to 17 Years | 19 (0.8%) | 88 (3.0%) |
| 18 to 34 Years | 27 (1.0%) | 28 (1.0%) |
| 35 to 64 Years | 64 (1.1%) | 27 (0.5%) |
| 65 to 74 Years | 0 (0.0%) | 17 (1.8%) |
| 75 Years and over | 169 (28.4%) | 134 (16.7%) |
Technology Access in Chaska
Computing Device Access in Chaska
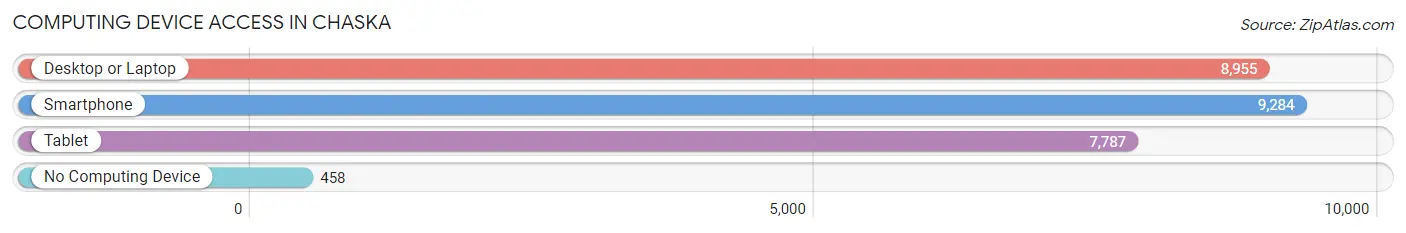
| Device Type | # Households | % Households |
| Desktop or Laptop | 8,955 | 85.7% |
| Smartphone | 9,284 | 88.8% |
| Tablet | 7,787 | 74.5% |
| No Computing Device | 458 | 4.4% |
| Total | 10,449 | 100.0% |
Internet Access in Chaska
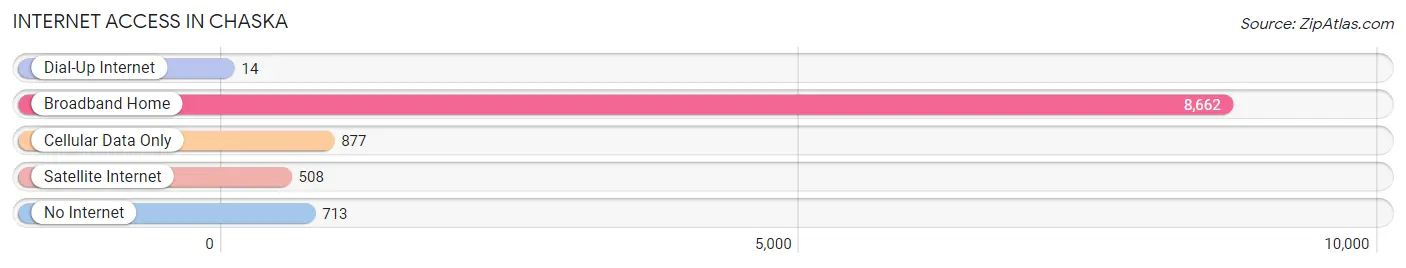
| Internet Type | # Households | % Households |
| Dial-Up Internet | 14 | 0.1% |
| Broadband Home | 8,662 | 82.9% |
| Cellular Data Only | 877 | 8.4% |
| Satellite Internet | 508 | 4.9% |
| No Internet | 713 | 6.8% |
| Total | 10,449 | 100.0% |
Chaska Summary
Chaska, Minnesota is a city located in Carver County, Minnesota, United States. The population was 23,770 at the 2010 census. It is the county seat of Carver County. Chaska is a part of the Minneapolis-St. Paul metropolitan area and is located on the south bank of the Minnesota River, about 30 miles southwest of Minneapolis.
History
The area that is now Chaska was first settled by European immigrants in the mid-1800s. The city was originally known as Union City, and was later renamed Chaska after the Dakota word for “first born daughter.” The city was officially incorporated in 1872.
In the late 1800s, Chaska was a major center for flour milling and other agricultural activities. The city was also home to a number of brickyards and other industries. In the early 1900s, Chaska was a popular tourist destination, with many visitors coming to enjoy the city’s natural beauty and recreational activities.
In the 1950s, Chaska began to experience rapid growth as the city became a popular bedroom community for Minneapolis and St. Paul. The city’s population more than doubled between 1950 and 1960, and continued to grow steadily in the decades that followed.
Geography
Chaska is located in Carver County, Minnesota, about 30 miles southwest of Minneapolis. The city is situated on the south bank of the Minnesota River, and is surrounded by the cities of Chanhassen, Victoria, and Waconia.
The city has a total area of 11.2 square miles, of which 11.1 square miles is land and 0.1 square miles is water. The terrain is mostly flat, with some rolling hills in the northern and western parts of the city.
Economy
Chaska’s economy is largely based on manufacturing and retail. The city is home to a number of large manufacturing companies, including 3M, Cargill, and General Mills. The city is also home to a number of retail stores, including Target, Walmart, and Kohl’s.
The city’s largest employer is the Chaska School District, which employs over 1,000 people. Other major employers include the Carver County government, the City of Chaska, and the Chaska Medical Center.
Demographics
As of the 2010 census, the population of Chaska was 23,770. The racial makeup of the city was 87.3% White, 5.2% African American, 0.7% Native American, 2.7% Asian, 0.1% Pacific Islander, 1.7% from other races, and 2.4% from two or more races. Hispanic or Latino of any race were 4.3% of the population.
The median household income in Chaska was $68,845 in 2017. The median home value was $269,400 in 2017. The median age of the city’s population was 37.7 years.
Conclusion
Chaska, Minnesota is a city located in Carver County, Minnesota, United States. The city has a long history, dating back to the mid-1800s, and has experienced rapid growth in recent decades. The city’s economy is largely based on manufacturing and retail, and the city’s largest employer is the Chaska School District. The population of Chaska was 23,770 at the 2010 census, and the median household income was $68,845 in 2017.
Common Questions
What is Per Capita Income in Chaska?
Per Capita income in Chaska is $50,819.
What is the Median Family Income in Chaska?
Median Family Income in Chaska is $135,849.
What is the Median Household income in Chaska?
Median Household Income in Chaska is $99,988.
What is Income or Wage Gap in Chaska?
Income or Wage Gap in Chaska is 30.1%.
Women in Chaska earn 69.9 cents for every dollar earned by a man.
What is Inequality or Gini Index in Chaska?
Inequality or Gini Index in Chaska is 0.42.
What is the Total Population of Chaska?
Total Population of Chaska is 27,764.
What is the Total Male Population of Chaska?
Total Male Population of Chaska is 13,366.
What is the Total Female Population of Chaska?
Total Female Population of Chaska is 14,398.
What is the Ratio of Males per 100 Females in Chaska?
There are 92.83 Males per 100 Females in Chaska.
What is the Ratio of Females per 100 Males in Chaska?
There are 107.72 Females per 100 Males in Chaska.
What is the Median Population Age in Chaska?
Median Population Age in Chaska is 37.2 Years.
What is the Average Family Size in Chaska
Average Family Size in Chaska is 3.2 People.
What is the Average Household Size in Chaska
Average Household Size in Chaska is 2.6 People.
How Large is the Labor Force in Chaska?
There are 15,876 People in the Labor Forcein in Chaska.
What is the Percentage of People in the Labor Force in Chaska?
75.1% of People are in the Labor Force in Chaska.
What is the Unemployment Rate in Chaska?
Unemployment Rate in Chaska is 2.3%.