Pinebluff, NC Map & Demographics
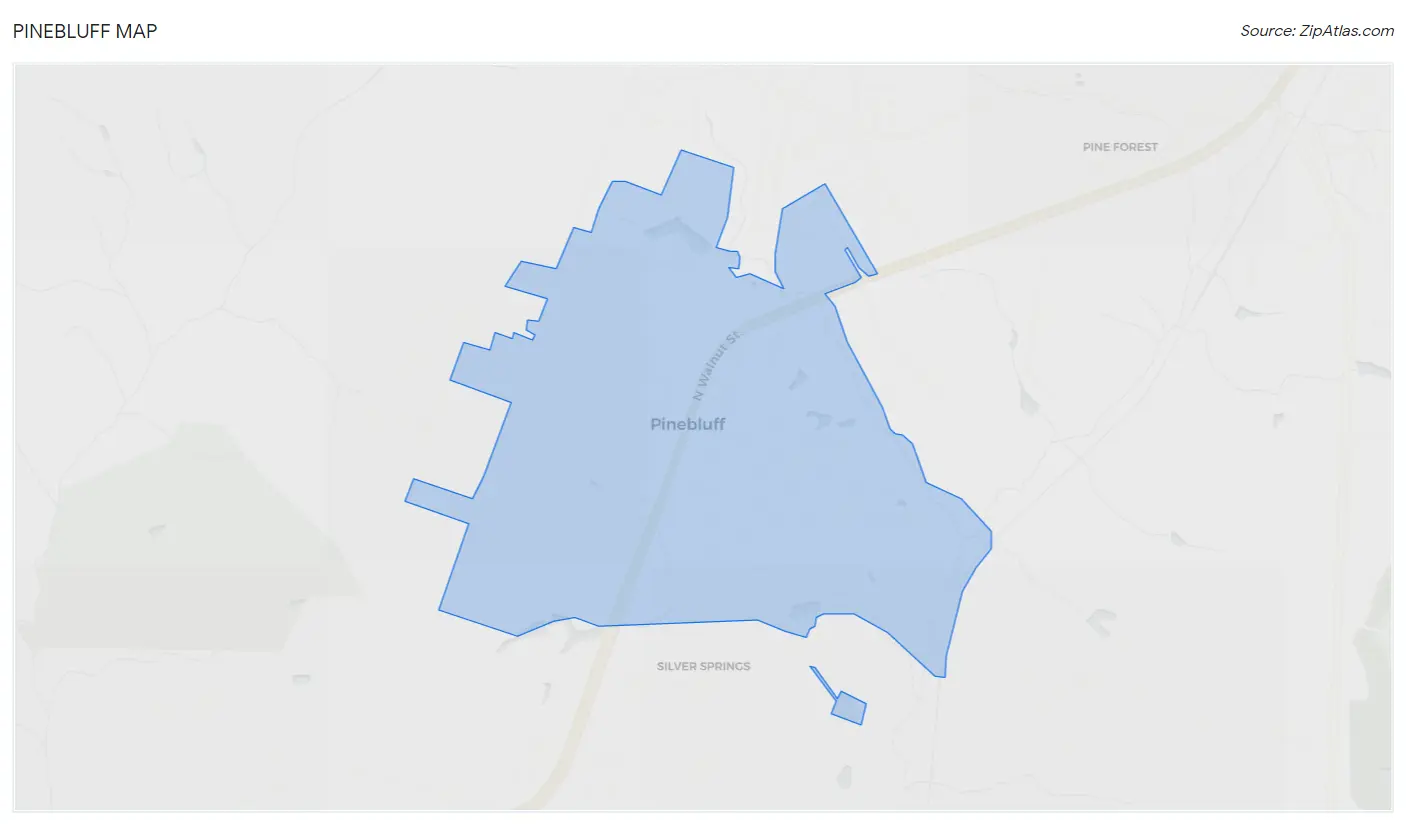
Pinebluff Map
Pinebluff Overview
$27,989
PER CAPITA INCOME
$78,750
AVG FAMILY INCOME
$70,750
AVG HOUSEHOLD INCOME
32.4%
WAGE / INCOME GAP [ % ]
67.6¢/ $1
WAGE / INCOME GAP [ $ ]
0.31
INEQUALITY / GINI INDEX
1,767
TOTAL POPULATION
944
MALE POPULATION
823
FEMALE POPULATION
114.70
MALES / 100 FEMALES
87.18
FEMALES / 100 MALES
39.4
MEDIAN AGE
3.5
AVG FAMILY SIZE
2.8
AVG HOUSEHOLD SIZE
785
LABOR FORCE [ PEOPLE ]
58.5%
PERCENT IN LABOR FORCE
4.7%
UNEMPLOYMENT RATE
Pinebluff Zip Codes
Pinebluff Area Codes
Income in Pinebluff
Income Overview in Pinebluff
Per Capita Income in Pinebluff is $27,989, while median incomes of families and households are $78,750 and $70,750 respectively.
| Characteristic | Number | Measure |
| Per Capita Income | 1,767 | $27,989 |
| Median Family Income | 430 | $78,750 |
| Mean Family Income | 430 | $85,956 |
| Median Household Income | 627 | $70,750 |
| Mean Household Income | 627 | $75,045 |
| Income Deficit | 430 | $0 |
| Wage / Income Gap (%) | 1,767 | 32.41% |
| Wage / Income Gap ($) | 1,767 | 67.59¢ per $1 |
| Gini / Inequality Index | 1,767 | 0.31 |
Earnings by Sex in Pinebluff
Average Earnings in Pinebluff are $36,938, $43,011 for men and $29,073 for women, a difference of 32.4%.
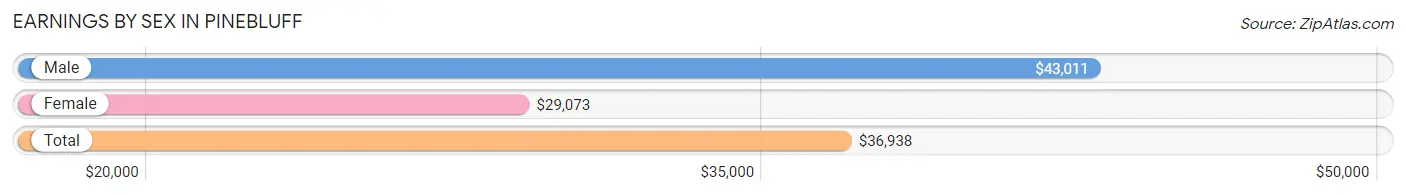
| Sex | Number | Average Earnings |
| Male | 457 (53.4%) | $43,011 |
| Female | 398 (46.6%) | $29,073 |
| Total | 855 (100.0%) | $36,938 |
Earnings by Sex by Income Bracket in Pinebluff
The most common earnings brackets in Pinebluff are $35,000 to $39,999 for men (85 | 18.6%) and $25,000 to $29,999 for women (65 | 16.3%).
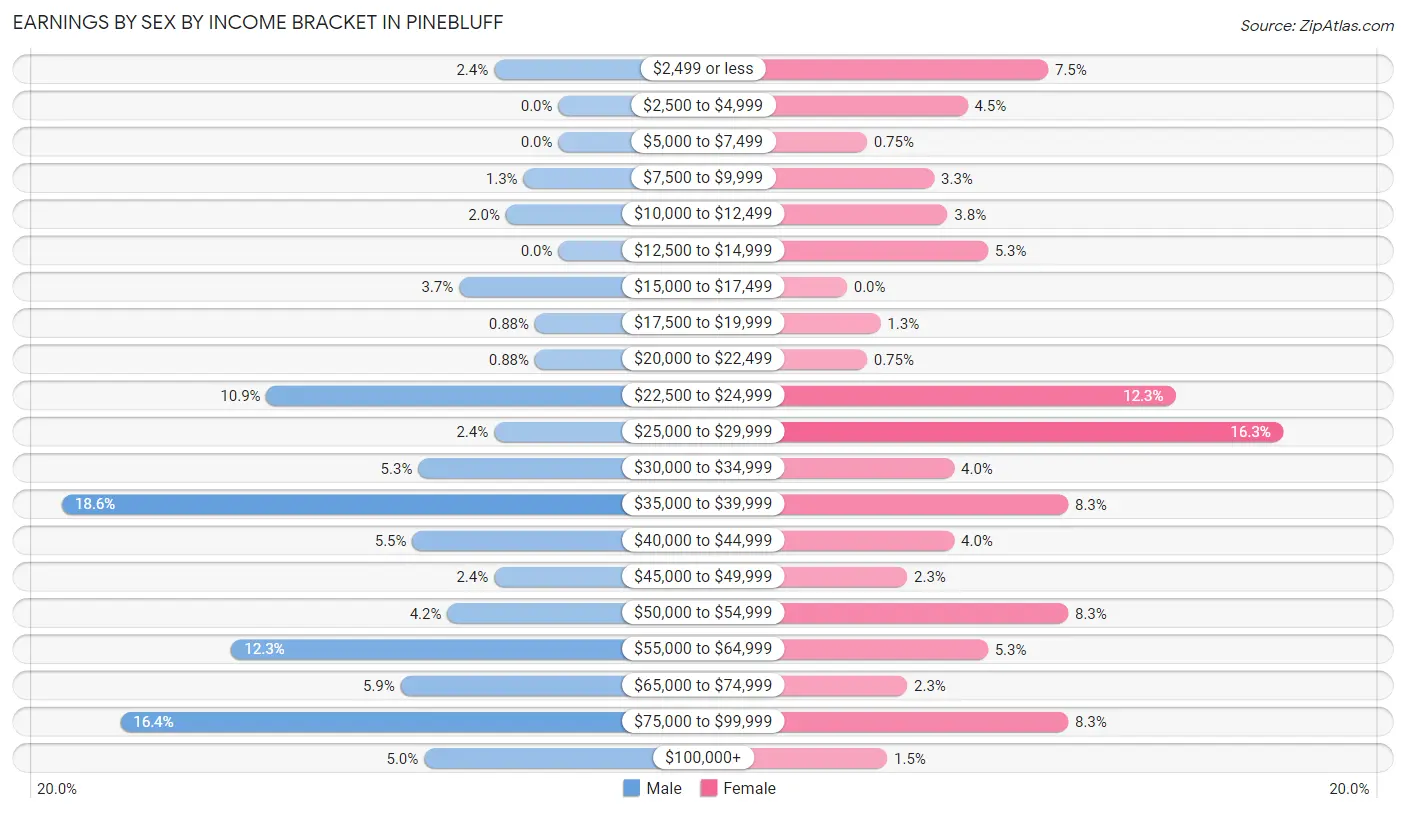
| Income | Male | Female |
| $2,499 or less | 11 (2.4%) | 30 (7.5%) |
| $2,500 to $4,999 | 0 (0.0%) | 18 (4.5%) |
| $5,000 to $7,499 | 0 (0.0%) | 3 (0.7%) |
| $7,500 to $9,999 | 6 (1.3%) | 13 (3.3%) |
| $10,000 to $12,499 | 9 (2.0%) | 15 (3.8%) |
| $12,500 to $14,999 | 0 (0.0%) | 21 (5.3%) |
| $15,000 to $17,499 | 17 (3.7%) | 0 (0.0%) |
| $17,500 to $19,999 | 4 (0.9%) | 5 (1.3%) |
| $20,000 to $22,499 | 4 (0.9%) | 3 (0.7%) |
| $22,500 to $24,999 | 50 (10.9%) | 49 (12.3%) |
| $25,000 to $29,999 | 11 (2.4%) | 65 (16.3%) |
| $30,000 to $34,999 | 24 (5.2%) | 16 (4.0%) |
| $35,000 to $39,999 | 85 (18.6%) | 33 (8.3%) |
| $40,000 to $44,999 | 25 (5.5%) | 16 (4.0%) |
| $45,000 to $49,999 | 11 (2.4%) | 9 (2.3%) |
| $50,000 to $54,999 | 19 (4.2%) | 33 (8.3%) |
| $55,000 to $64,999 | 56 (12.2%) | 21 (5.3%) |
| $65,000 to $74,999 | 27 (5.9%) | 9 (2.3%) |
| $75,000 to $99,999 | 75 (16.4%) | 33 (8.3%) |
| $100,000+ | 23 (5.0%) | 6 (1.5%) |
| Total | 457 (100.0%) | 398 (100.0%) |
Earnings by Sex by Educational Attainment in Pinebluff
Average earnings in Pinebluff are $43,807 for men and $29,698 for women, a difference of 32.2%. Men with an educational attainment of bachelor's degree enjoy the highest average annual earnings of $56,023, while those with high school diploma education earn the least with $35,000. Women with an educational attainment of bachelor's degree earn the most with the average annual earnings of $53,125, while those with college or associate's degree education have the smallest earnings of $28,070.
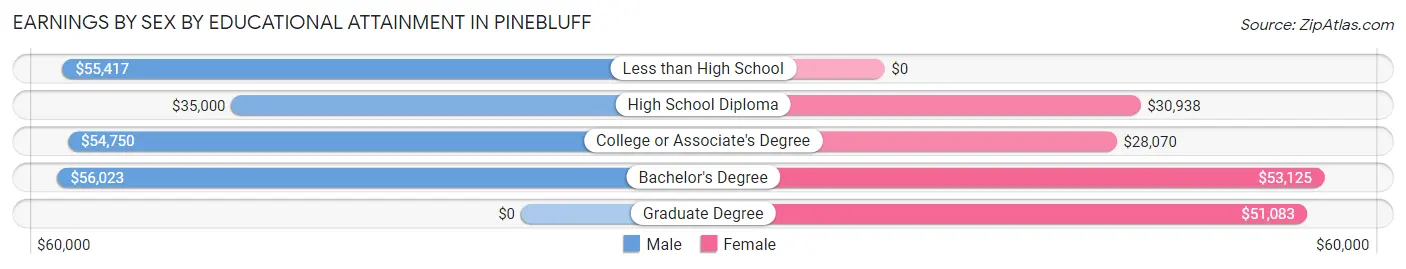
| Educational Attainment | Male Income | Female Income |
| Less than High School | $55,417 | $0 |
| High School Diploma | $35,000 | $30,938 |
| College or Associate's Degree | $54,750 | $28,070 |
| Bachelor's Degree | $56,023 | $53,125 |
| Graduate Degree | - | - |
| Total | $43,807 | $29,698 |
Family Income in Pinebluff
Family Income Brackets in Pinebluff
According to the Pinebluff family income data, there are 121 families falling into the $100,000 to $149,999 income range, which is the most common income bracket and makes up 28.1% of all families.
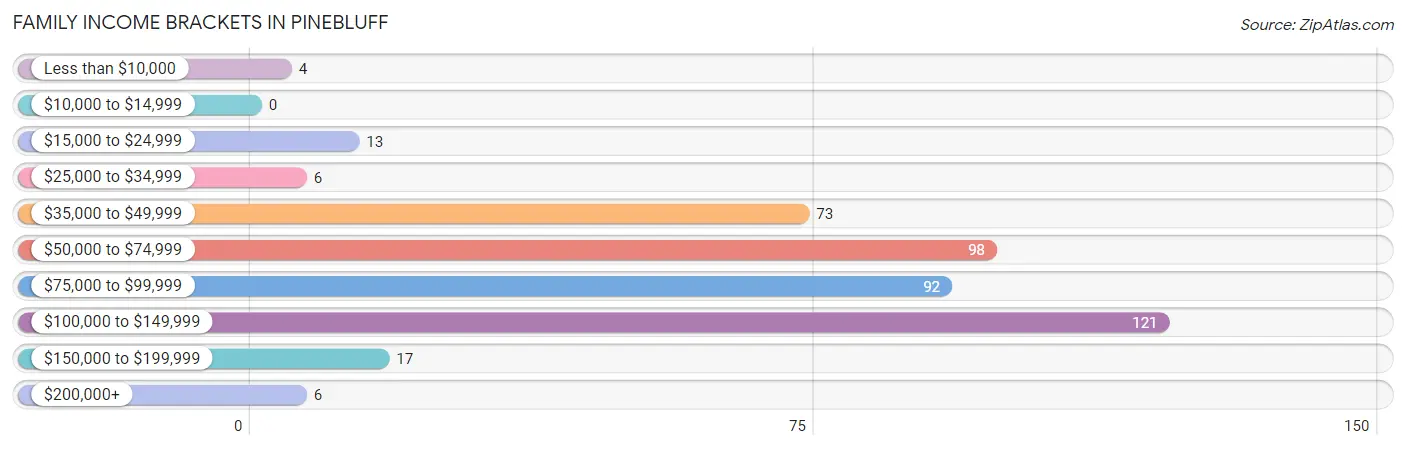
| Income Bracket | # Families | % Families |
| Less than $10,000 | 4 | 0.9% |
| $10,000 to $14,999 | 0 | 0.0% |
| $15,000 to $24,999 | 13 | 3.0% |
| $25,000 to $34,999 | 6 | 1.4% |
| $35,000 to $49,999 | 73 | 17.0% |
| $50,000 to $74,999 | 98 | 22.8% |
| $75,000 to $99,999 | 92 | 21.4% |
| $100,000 to $149,999 | 121 | 28.1% |
| $150,000 to $199,999 | 17 | 4.0% |
| $200,000+ | 6 | 1.4% |
Family Income by Famaliy Size in Pinebluff
4-person families (92 | 21.4%) account for the highest median family income in Pinebluff with $99,500 per family, while 2-person families (159 | 37.0%) have the highest median income of $35,782 per family member.
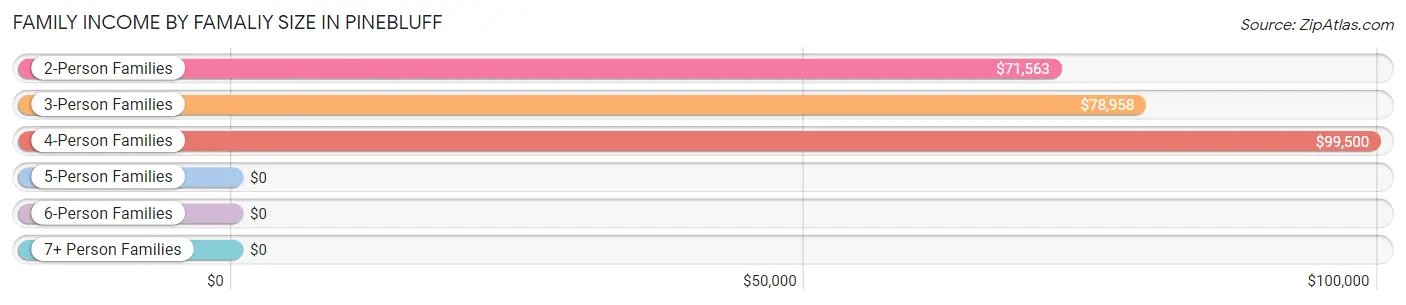
| Income Bracket | # Families | Median Income |
| 2-Person Families | 159 (37.0%) | $71,563 |
| 3-Person Families | 142 (33.0%) | $78,958 |
| 4-Person Families | 92 (21.4%) | $99,500 |
| 5-Person Families | 28 (6.5%) | $0 |
| 6-Person Families | 9 (2.1%) | $0 |
| 7+ Person Families | 0 (0.0%) | $0 |
| Total | 430 (100.0%) | $78,750 |
Family Income by Number of Earners in Pinebluff
The median family income in Pinebluff is $78,750, with families comprising 2 earners (205) having the highest median family income of $98,750, while families with no earners (64) have the lowest median family income of $52,955, accounting for 47.7% and 14.9% of families, respectively.
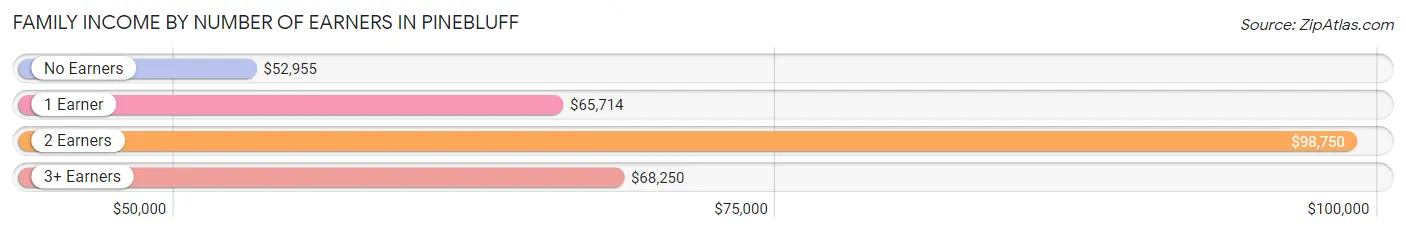
| Number of Earners | # Families | Median Income |
| No Earners | 64 (14.9%) | $52,955 |
| 1 Earner | 138 (32.1%) | $65,714 |
| 2 Earners | 205 (47.7%) | $98,750 |
| 3+ Earners | 23 (5.3%) | $68,250 |
| Total | 430 (100.0%) | $78,750 |
Household Income in Pinebluff
Household Income Brackets in Pinebluff
With 163 households falling in the category, the $50,000 to $74,999 income range is the most frequent in Pinebluff, accounting for 26.0% of all households. In contrast, only 9 households (1.4%) fall into the $200,000+ income bracket, making it the least populous group.
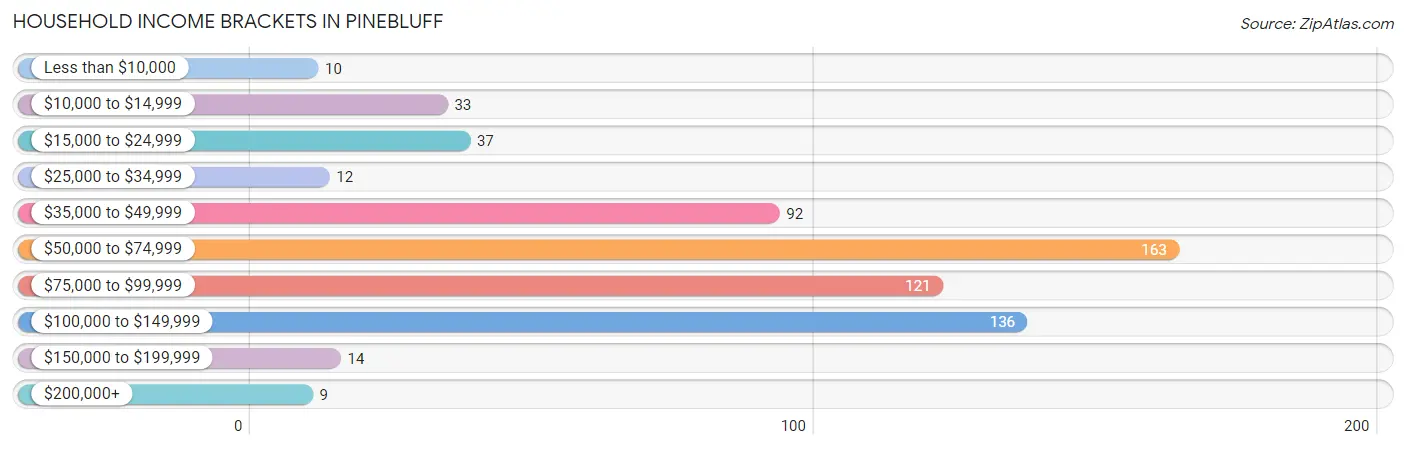
| Income Bracket | # Households | % Households |
| Less than $10,000 | 10 | 1.6% |
| $10,000 to $14,999 | 33 | 5.3% |
| $15,000 to $24,999 | 37 | 5.9% |
| $25,000 to $34,999 | 12 | 1.9% |
| $35,000 to $49,999 | 92 | 14.7% |
| $50,000 to $74,999 | 163 | 26.0% |
| $75,000 to $99,999 | 121 | 19.3% |
| $100,000 to $149,999 | 136 | 21.7% |
| $150,000 to $199,999 | 14 | 2.2% |
| $200,000+ | 9 | 1.4% |
Household Income by Householder Age in Pinebluff
The median household income in Pinebluff is $70,750, with the highest median household income of $92,596 found in the 25 to 44 years age bracket for the primary householder. A total of 211 households (33.7%) fall into this category. Meanwhile, the 15 to 24 years age bracket for the primary householder has the lowest median household income of $0, with 4 households (0.6%) in this group.
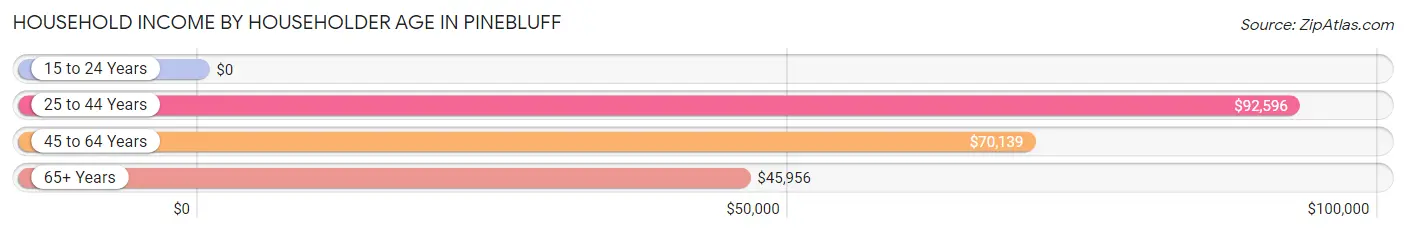
| Income Bracket | # Households | Median Income |
| 15 to 24 Years | 4 (0.6%) | $0 |
| 25 to 44 Years | 211 (33.7%) | $92,596 |
| 45 to 64 Years | 265 (42.3%) | $70,139 |
| 65+ Years | 147 (23.4%) | $45,956 |
| Total | 627 (100.0%) | $70,750 |
Poverty in Pinebluff
Income Below Poverty by Sex and Age in Pinebluff
With 4.4% poverty level for males and 4.0% for females among the residents of Pinebluff, 15 year old males and 55 to 64 year old females are the most vulnerable to poverty, with 13 males (28.3%) and 6 females (11.1%) in their respective age groups living below the poverty level.
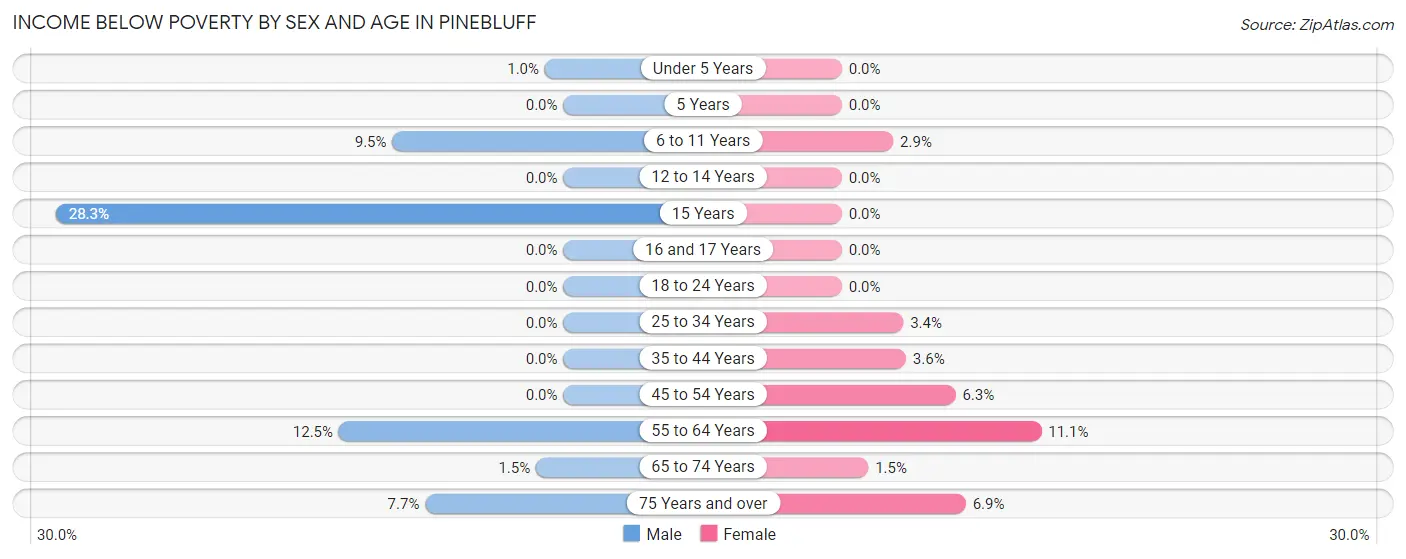
| Age Bracket | Male | Female |
| Under 5 Years | 1 (1.0%) | 0 (0.0%) |
| 5 Years | 0 (0.0%) | 0 (0.0%) |
| 6 to 11 Years | 6 (9.5%) | 2 (2.9%) |
| 12 to 14 Years | 0 (0.0%) | 0 (0.0%) |
| 15 Years | 13 (28.3%) | 0 (0.0%) |
| 16 and 17 Years | 0 (0.0%) | 0 (0.0%) |
| 18 to 24 Years | 0 (0.0%) | 0 (0.0%) |
| 25 to 34 Years | 0 (0.0%) | 4 (3.4%) |
| 35 to 44 Years | 0 (0.0%) | 4 (3.6%) |
| 45 to 54 Years | 0 (0.0%) | 10 (6.3%) |
| 55 to 64 Years | 17 (12.5%) | 6 (11.1%) |
| 65 to 74 Years | 1 (1.5%) | 1 (1.5%) |
| 75 Years and over | 4 (7.7%) | 6 (6.9%) |
| Total | 42 (4.4%) | 33 (4.0%) |
Income Above Poverty by Sex and Age in Pinebluff
According to the poverty statistics in Pinebluff, males aged 5 years and females aged under 5 years are the age groups that are most secure financially, with 100.0% of males and 100.0% of females in these age groups living above the poverty line.
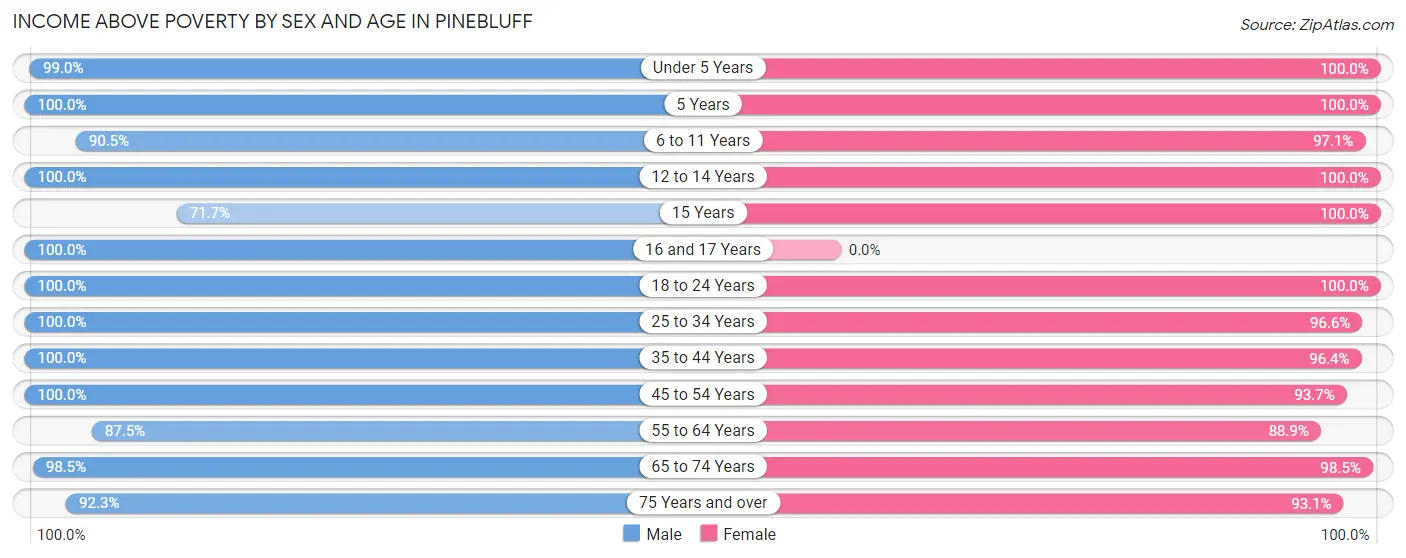
| Age Bracket | Male | Female |
| Under 5 Years | 96 (99.0%) | 82 (100.0%) |
| 5 Years | 14 (100.0%) | 14 (100.0%) |
| 6 to 11 Years | 57 (90.5%) | 68 (97.1%) |
| 12 to 14 Years | 28 (100.0%) | 6 (100.0%) |
| 15 Years | 33 (71.7%) | 5 (100.0%) |
| 16 and 17 Years | 27 (100.0%) | 0 (0.0%) |
| 18 to 24 Years | 59 (100.0%) | 50 (100.0%) |
| 25 to 34 Years | 101 (100.0%) | 113 (96.6%) |
| 35 to 44 Years | 118 (100.0%) | 108 (96.4%) |
| 45 to 54 Years | 137 (100.0%) | 148 (93.7%) |
| 55 to 64 Years | 119 (87.5%) | 48 (88.9%) |
| 65 to 74 Years | 65 (98.5%) | 67 (98.5%) |
| 75 Years and over | 48 (92.3%) | 81 (93.1%) |
| Total | 902 (95.6%) | 790 (96.0%) |
Income Below Poverty Among Married-Couple Families in Pinebluff
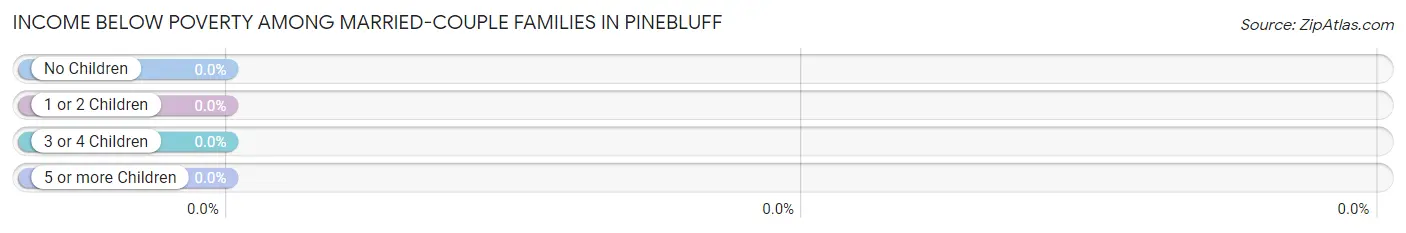
| Children | Above Poverty | Below Poverty |
| No Children | 194 (100.0%) | 0 (0.0%) |
| 1 or 2 Children | 153 (100.0%) | 0 (0.0%) |
| 3 or 4 Children | 28 (100.0%) | 0 (0.0%) |
| 5 or more Children | 0 (0.0%) | 0 (0.0%) |
| Total | 375 (100.0%) | 0 (0.0%) |
Income Below Poverty Among Single-Parent Households in Pinebluff
According to the poverty data in Pinebluff, 100.0% or 1 single-father households and 7.4% or 4 single-mother households are living below the poverty line. Among single-father households, those with 1 or 2 children have the highest poverty rate, with 1 households (100.0%) experiencing poverty. Likewise, among single-mother households, those with 1 or 2 children have the highest poverty rate, with 4 households (10.5%) falling below the poverty line.
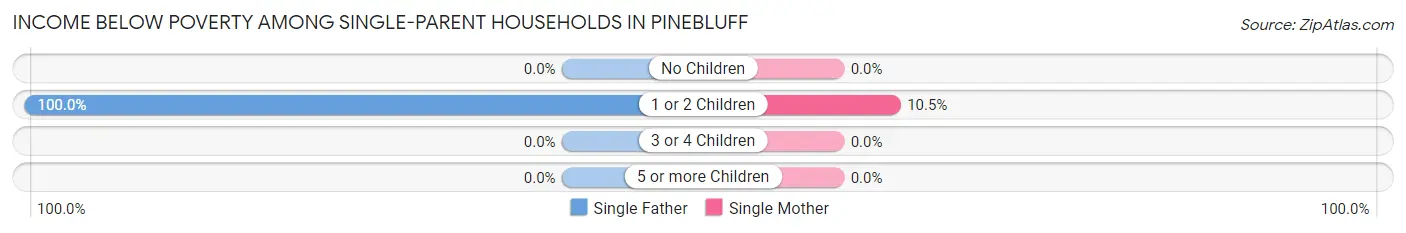
| Children | Single Father | Single Mother |
| No Children | 0 (0.0%) | 0 (0.0%) |
| 1 or 2 Children | 1 (100.0%) | 4 (10.5%) |
| 3 or 4 Children | 0 (0.0%) | 0 (0.0%) |
| 5 or more Children | 0 (0.0%) | 0 (0.0%) |
| Total | 1 (100.0%) | 4 (7.4%) |
Income Below Poverty Among Married-Couple vs Single-Parent Households in Pinebluff
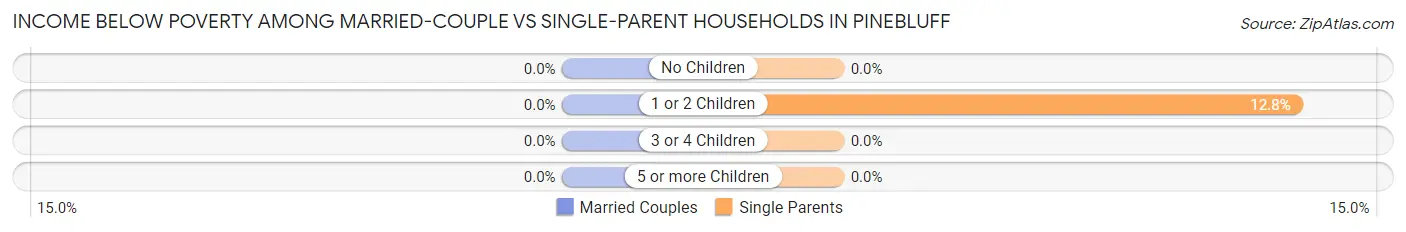
| Children | Married-Couple Families | Single-Parent Households |
| No Children | 0 (0.0%) | 0 (0.0%) |
| 1 or 2 Children | 0 (0.0%) | 5 (12.8%) |
| 3 or 4 Children | 0 (0.0%) | 0 (0.0%) |
| 5 or more Children | 0 (0.0%) | 0 (0.0%) |
| Total | 0 (0.0%) | 5 (9.1%) |
Race in Pinebluff
The most populous races in Pinebluff are White / Caucasian (1,157 | 65.5%), Black / African American (407 | 23.0%), and Hispanic or Latino (182 | 10.3%).
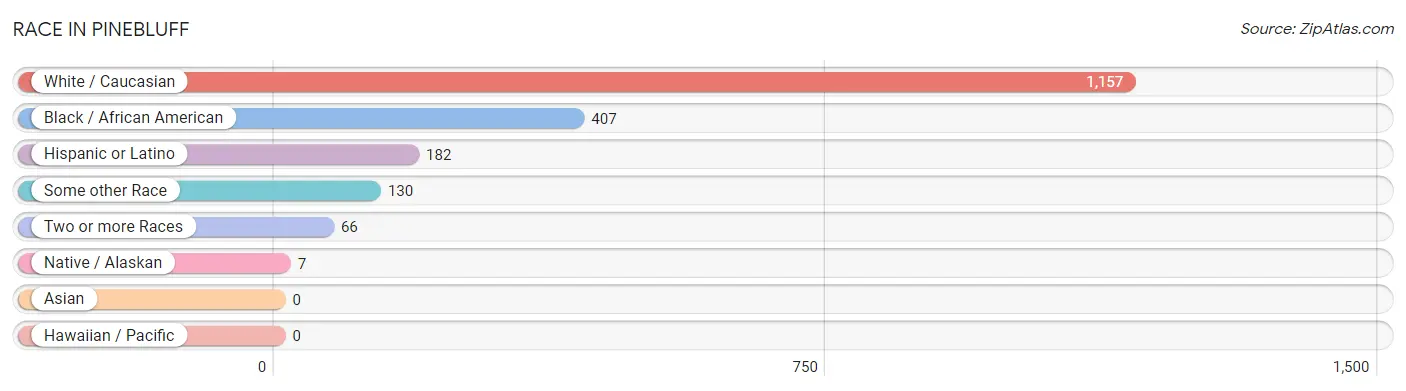
| Race | # Population | % Population |
| Asian | 0 | 0.0% |
| Black / African American | 407 | 23.0% |
| Hawaiian / Pacific | 0 | 0.0% |
| Hispanic or Latino | 182 | 10.3% |
| Native / Alaskan | 7 | 0.4% |
| White / Caucasian | 1,157 | 65.5% |
| Two or more Races | 66 | 3.7% |
| Some other Race | 130 | 7.4% |
| Total | 1,767 | 100.0% |
Ancestry in Pinebluff
The most populous ancestries reported in Pinebluff are English (278 | 15.7%), German (208 | 11.8%), Irish (160 | 9.0%), Mexican (144 | 8.2%), and Scottish (98 | 5.6%), together accounting for 50.3% of all Pinebluff residents.
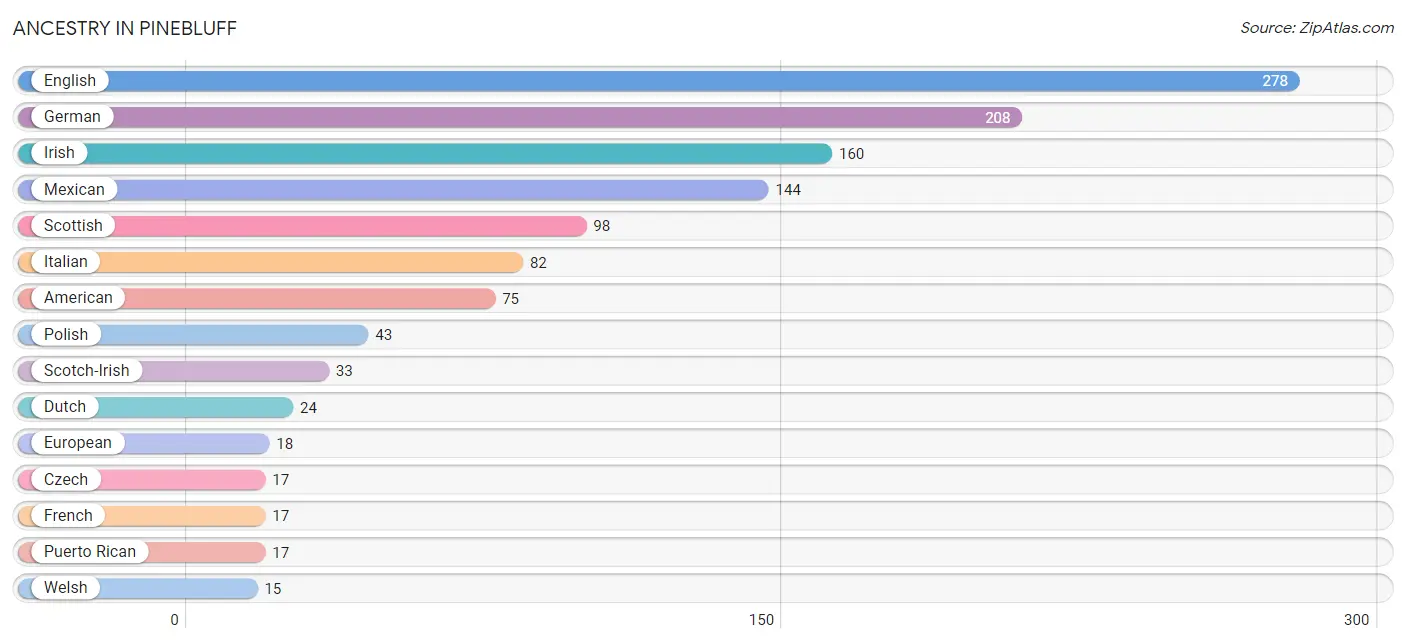
| Ancestry | # Population | % Population |
| African | 4 | 0.2% |
| American | 75 | 4.2% |
| Australian | 2 | 0.1% |
| British | 2 | 0.1% |
| Cherokee | 5 | 0.3% |
| Croatian | 3 | 0.2% |
| Czech | 17 | 1.0% |
| Danish | 5 | 0.3% |
| Dominican | 11 | 0.6% |
| Dutch | 24 | 1.4% |
| English | 278 | 15.7% |
| European | 18 | 1.0% |
| French | 17 | 1.0% |
| French Canadian | 8 | 0.4% |
| German | 208 | 11.8% |
| Hungarian | 3 | 0.2% |
| Irish | 160 | 9.0% |
| Italian | 82 | 4.6% |
| Lumbee | 6 | 0.3% |
| Mexican | 144 | 8.2% |
| Norwegian | 5 | 0.3% |
| Pakistani | 11 | 0.6% |
| Peruvian | 10 | 0.6% |
| Polish | 43 | 2.4% |
| Portuguese | 12 | 0.7% |
| Puerto Rican | 17 | 1.0% |
| Russian | 2 | 0.1% |
| Scotch-Irish | 33 | 1.9% |
| Scottish | 98 | 5.6% |
| South American | 10 | 0.6% |
| Subsaharan African | 4 | 0.2% |
| Swedish | 8 | 0.4% |
| Ukrainian | 7 | 0.4% |
| Welsh | 15 | 0.9% | View All 34 Rows |
Immigrants in Pinebluff
The most numerous immigrant groups reported in Pinebluff came from Latin America (100 | 5.7%), Central America (93 | 5.3%), Mexico (93 | 5.3%), Europe (14 | 0.8%), and Eastern Europe (12 | 0.7%), together accounting for 17.6% of all Pinebluff residents.
| Immigration Origin | # Population | % Population |
| Caribbean | 7 | 0.4% |
| Central America | 93 | 5.3% |
| Dominican Republic | 7 | 0.4% |
| Eastern Europe | 12 | 0.7% |
| Europe | 14 | 0.8% |
| Germany | 2 | 0.1% |
| Latin America | 100 | 5.7% |
| Mexico | 93 | 5.3% |
| Russia | 12 | 0.7% |
| Western Europe | 2 | 0.1% | View All 10 Rows |
Sex and Age in Pinebluff
Sex and Age in Pinebluff
The most populous age groups in Pinebluff are 45 to 49 Years (105 | 11.1%) for men and 45 to 49 Years (96 | 11.7%) for women.
| Age Bracket | Male | Female |
| Under 5 Years | 97 (10.3%) | 82 (10.0%) |
| 5 to 9 Years | 49 (5.2%) | 70 (8.5%) |
| 10 to 14 Years | 56 (5.9%) | 20 (2.4%) |
| 15 to 19 Years | 89 (9.4%) | 11 (1.3%) |
| 20 to 24 Years | 43 (4.6%) | 44 (5.3%) |
| 25 to 29 Years | 51 (5.4%) | 43 (5.2%) |
| 30 to 34 Years | 50 (5.3%) | 74 (9.0%) |
| 35 to 39 Years | 68 (7.2%) | 44 (5.3%) |
| 40 to 44 Years | 50 (5.3%) | 68 (8.3%) |
| 45 to 49 Years | 105 (11.1%) | 96 (11.7%) |
| 50 to 54 Years | 32 (3.4%) | 62 (7.5%) |
| 55 to 59 Years | 82 (8.7%) | 29 (3.5%) |
| 60 to 64 Years | 54 (5.7%) | 25 (3.0%) |
| 65 to 69 Years | 31 (3.3%) | 36 (4.4%) |
| 70 to 74 Years | 35 (3.7%) | 32 (3.9%) |
| 75 to 79 Years | 48 (5.1%) | 62 (7.5%) |
| 80 to 84 Years | 0 (0.0%) | 7 (0.9%) |
| 85 Years and over | 4 (0.4%) | 18 (2.2%) |
| Total | 944 (100.0%) | 823 (100.0%) |
Families and Households in Pinebluff
Median Family Size in Pinebluff
The median family size in Pinebluff is 3.54 persons per family, with single male/father families (1 | 0.2%) accounting for the largest median family size of 7 persons per family. On the other hand, married-couple families (375 | 87.2%) represent the smallest median family size with 3.53 persons per family.
| Family Type | # Families | Family Size |
| Married-Couple | 375 (87.2%) | 3.53 |
| Single Male/Father | 1 (0.2%) | 7.00 |
| Single Female/Mother | 54 (12.6%) | 3.57 |
| Total Families | 430 (100.0%) | 3.54 |
Median Household Size in Pinebluff
The median household size in Pinebluff is 2.82 persons per household, with single male/father households (1 | 0.2%) accounting for the largest median household size of 7 persons per household. non-family households (197 | 31.4%) represent the smallest median household size with 1.04 persons per household.
| Household Type | # Households | Household Size |
| Married-Couple | 375 (59.8%) | 3.57 |
| Single Male/Father | 1 (0.2%) | 7.00 |
| Single Female/Mother | 54 (8.6%) | 4.04 |
| Non-family | 197 (31.4%) | 1.04 |
| Total Households | 627 (100.0%) | 2.82 |
Household Size by Marriage Status in Pinebluff
Out of a total of 627 households in Pinebluff, 430 (68.6%) are family households, while 197 (31.4%) are nonfamily households. The most numerous type of family households are 3-person households, comprising 164, and the most common type of nonfamily households are 1-person households, comprising 188.
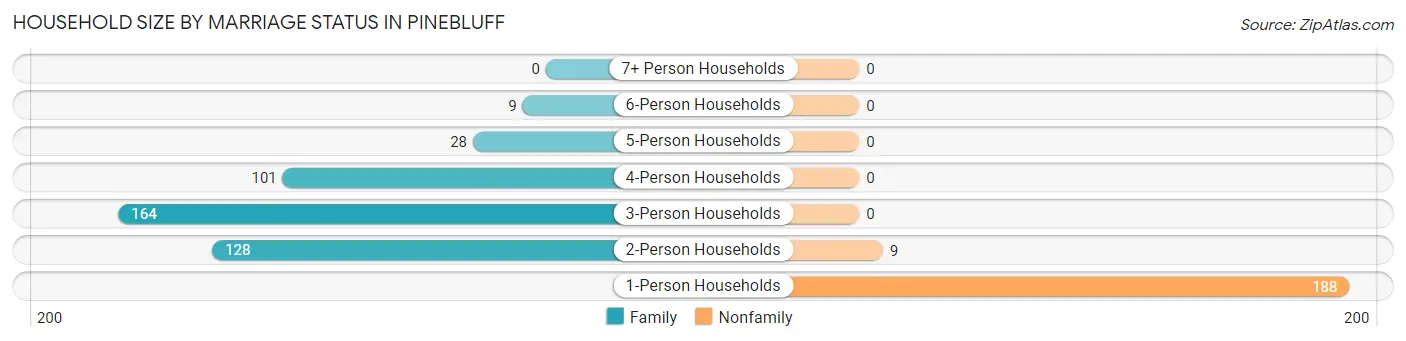
| Household Size | Family Households | Nonfamily Households |
| 1-Person Households | - | 188 (30.0%) |
| 2-Person Households | 128 (20.4%) | 9 (1.4%) |
| 3-Person Households | 164 (26.2%) | 0 (0.0%) |
| 4-Person Households | 101 (16.1%) | 0 (0.0%) |
| 5-Person Households | 28 (4.5%) | 0 (0.0%) |
| 6-Person Households | 9 (1.4%) | 0 (0.0%) |
| 7+ Person Households | 0 (0.0%) | 0 (0.0%) |
| Total | 430 (68.6%) | 197 (31.4%) |
Female Fertility in Pinebluff
Fertility by Age in Pinebluff
Average fertility rate in Pinebluff is 75.0 births per 1,000 women. Women in the age bracket of 20 to 34 years have the highest fertility rate with 118.0 births per 1,000 women. Women in the age bracket of 20 to 34 years acount for 65.5% of all women with births.
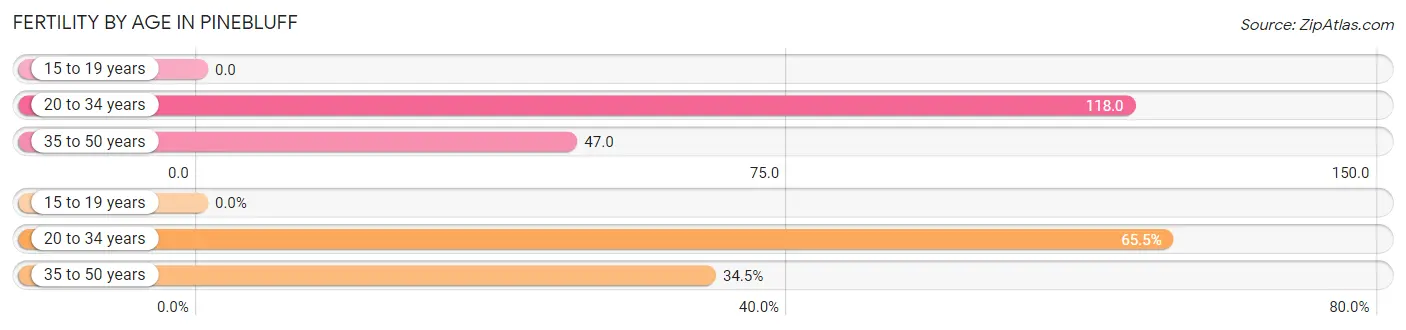
| Age Bracket | Women with Births | Births / 1,000 Women |
| 15 to 19 years | 0 (0.0%) | 0.0 |
| 20 to 34 years | 19 (65.5%) | 118.0 |
| 35 to 50 years | 10 (34.5%) | 47.0 |
| Total | 29 (100.0%) | 75.0 |
Fertility by Age by Marriage Status in Pinebluff
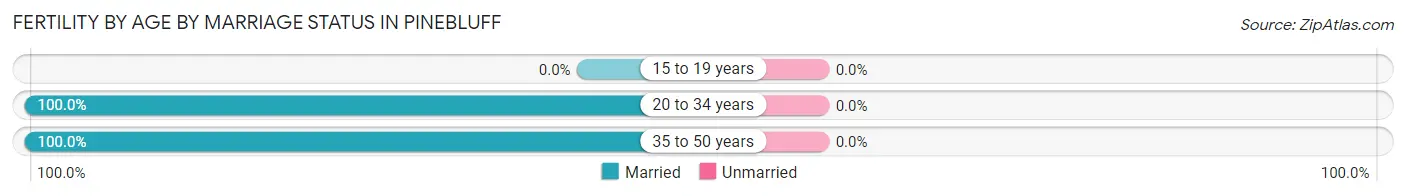
| Age Bracket | Married | Unmarried |
| 15 to 19 years | 0 (0.0%) | 0 (0.0%) |
| 20 to 34 years | 19 (100.0%) | 0 (0.0%) |
| 35 to 50 years | 10 (100.0%) | 0 (0.0%) |
| Total | 29 (100.0%) | 0 (0.0%) |
Fertility by Education in Pinebluff
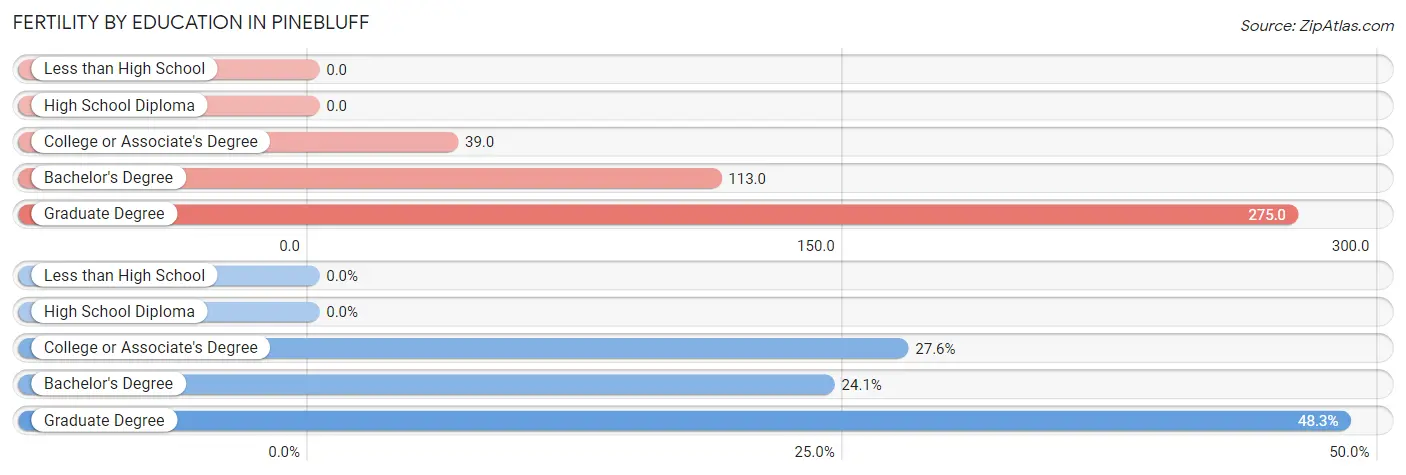
| Educational Attainment | Women with Births | Births / 1,000 Women |
| Less than High School | 0 (0.0%) | 0.0 |
| High School Diploma | 0 (0.0%) | 0.0 |
| College or Associate's Degree | 8 (27.6%) | 39.0 |
| Bachelor's Degree | 7 (24.1%) | 113.0 |
| Graduate Degree | 14 (48.3%) | 275.0 |
| Total | 29 (100.0%) | 75.0 |
Fertility by Education by Marriage Status in Pinebluff
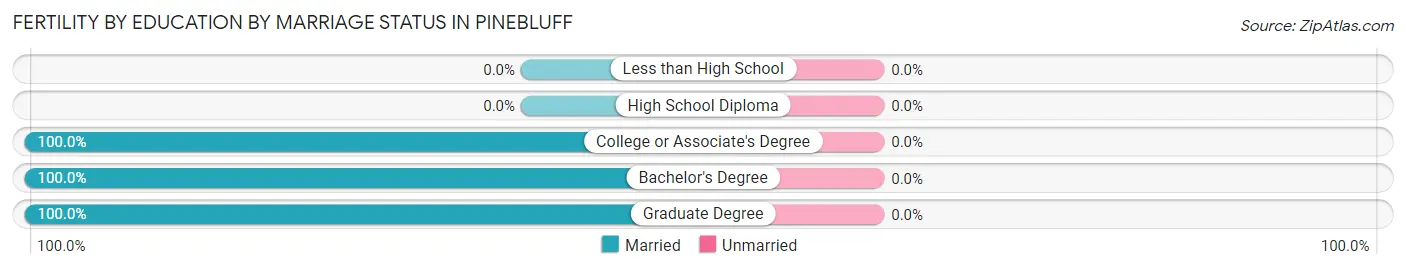
| Educational Attainment | Married | Unmarried |
| Less than High School | 0 (0.0%) | 0 (0.0%) |
| High School Diploma | 0 (0.0%) | 0 (0.0%) |
| College or Associate's Degree | 8 (100.0%) | 0 (0.0%) |
| Bachelor's Degree | 7 (100.0%) | 0 (0.0%) |
| Graduate Degree | 14 (100.0%) | 0 (0.0%) |
| Total | 29 (100.0%) | 0 (0.0%) |
Employment Characteristics in Pinebluff
Employment by Class of Employer in Pinebluff
Among the 744 employed individuals in Pinebluff, private company employees (516 | 69.4%), self-employed (not incorporated) (66 | 8.9%), and local government employees (47 | 6.3%) make up the most common classes of employment.
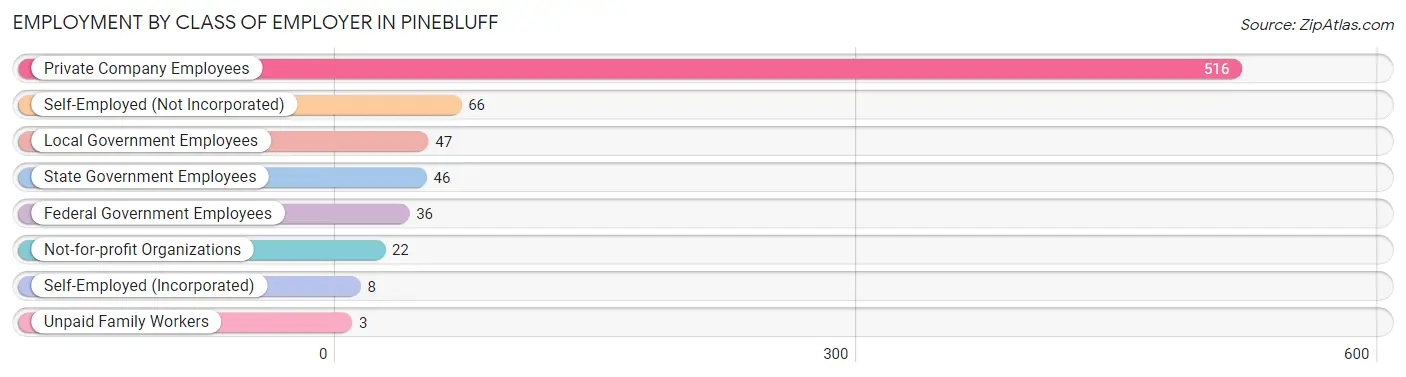
| Employer Class | # Employees | % Employees |
| Private Company Employees | 516 | 69.4% |
| Self-Employed (Incorporated) | 8 | 1.1% |
| Self-Employed (Not Incorporated) | 66 | 8.9% |
| Not-for-profit Organizations | 22 | 3.0% |
| Local Government Employees | 47 | 6.3% |
| State Government Employees | 46 | 6.2% |
| Federal Government Employees | 36 | 4.8% |
| Unpaid Family Workers | 3 | 0.4% |
| Total | 744 | 100.0% |
Employment Status by Age in Pinebluff
According to the labor force statistics for Pinebluff, out of the total population over 16 years of age (1,342), 58.5% or 785 individuals are in the labor force, with 4.7% or 37 of them unemployed. The age group with the highest labor force participation rate is 30 to 34 years, with 88.7% or 110 individuals in the labor force. Within the labor force, the 16 to 19 years age range has the highest percentage of unemployed individuals, with 45.8% or 11 of them being unemployed.
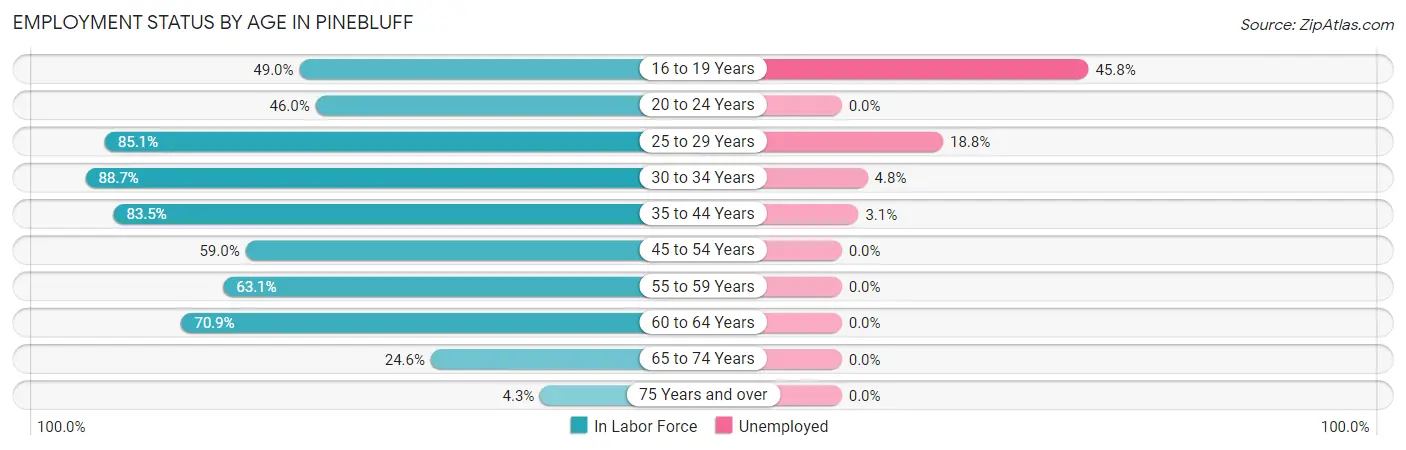
| Age Bracket | In Labor Force | Unemployed |
| 16 to 19 Years | 24 (49.0%) | 11 (45.8%) |
| 20 to 24 Years | 40 (46.0%) | 0 (0.0%) |
| 25 to 29 Years | 80 (85.1%) | 15 (18.8%) |
| 30 to 34 Years | 110 (88.7%) | 5 (4.8%) |
| 35 to 44 Years | 192 (83.5%) | 6 (3.1%) |
| 45 to 54 Years | 174 (59.0%) | 0 (0.0%) |
| 55 to 59 Years | 70 (63.1%) | 0 (0.0%) |
| 60 to 64 Years | 56 (70.9%) | 0 (0.0%) |
| 65 to 74 Years | 33 (24.6%) | 0 (0.0%) |
| 75 Years and over | 6 (4.3%) | 0 (0.0%) |
| Total | 785 (58.5%) | 37 (4.7%) |
Employment Status by Educational Attainment in Pinebluff
According to labor force statistics for Pinebluff, 73.1% of individuals (682) out of the total population between 25 and 64 years of age (933) are in the labor force, with 3.8% or 26 of them being unemployed. The group with the highest labor force participation rate are those with the educational attainment of high school diploma, with 85.8% or 205 individuals in the labor force. Within the labor force, individuals with high school diploma education have the highest percentage of unemployment, with 10.2% or 21 of them being unemployed.
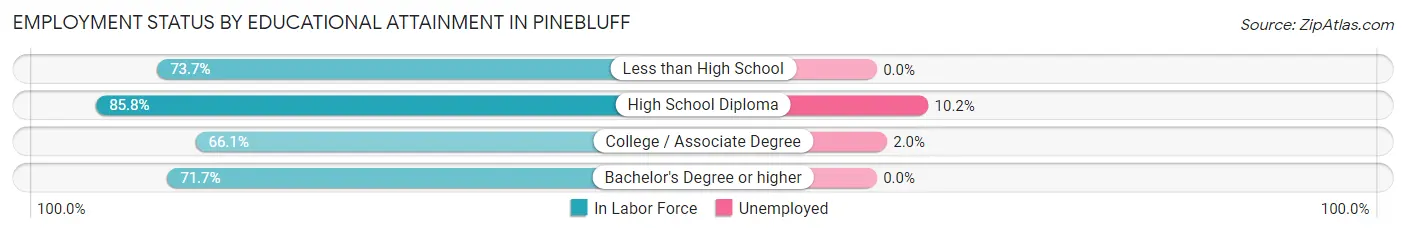
| Educational Attainment | In Labor Force | Unemployed |
| Less than High School | 28 (73.7%) | 0 (0.0%) |
| High School Diploma | 205 (85.8%) | 24 (10.2%) |
| College / Associate Degree | 254 (66.1%) | 8 (2.0%) |
| Bachelor's Degree or higher | 195 (71.7%) | 0 (0.0%) |
| Total | 682 (73.1%) | 35 (3.8%) |
Employment Occupations by Sex in Pinebluff
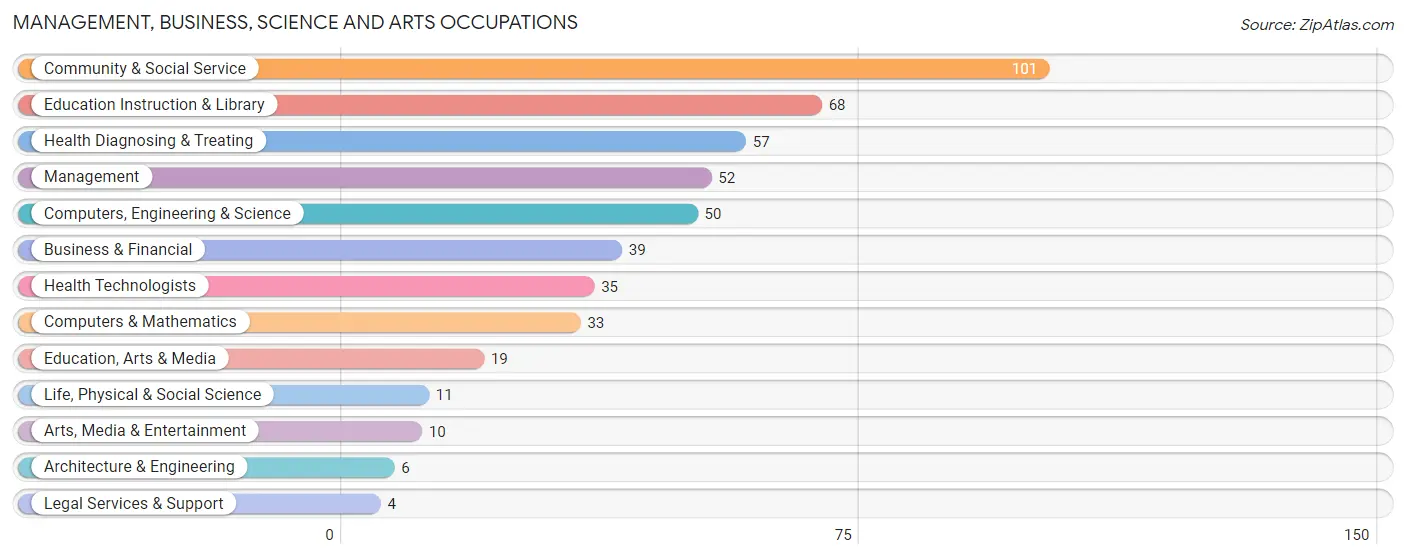
Management, Business, Science and Arts Occupations
The most common Management, Business, Science and Arts occupations in Pinebluff are Community & Social Service (101 | 13.6%), Education Instruction & Library (68 | 9.1%), Health Diagnosing & Treating (57 | 7.7%), Management (52 | 7.0%), and Computers, Engineering & Science (50 | 6.7%).
Management, Business, Science and Arts Occupations by Sex
Within the Management, Business, Science and Arts occupations in Pinebluff, the most male-oriented occupations are Architecture & Engineering (100.0%), Legal Services & Support (100.0%), and Arts, Media & Entertainment (100.0%), while the most female-oriented occupations are Education, Arts & Media (100.0%), Health Diagnosing & Treating (82.5%), and Health Technologists (71.4%).
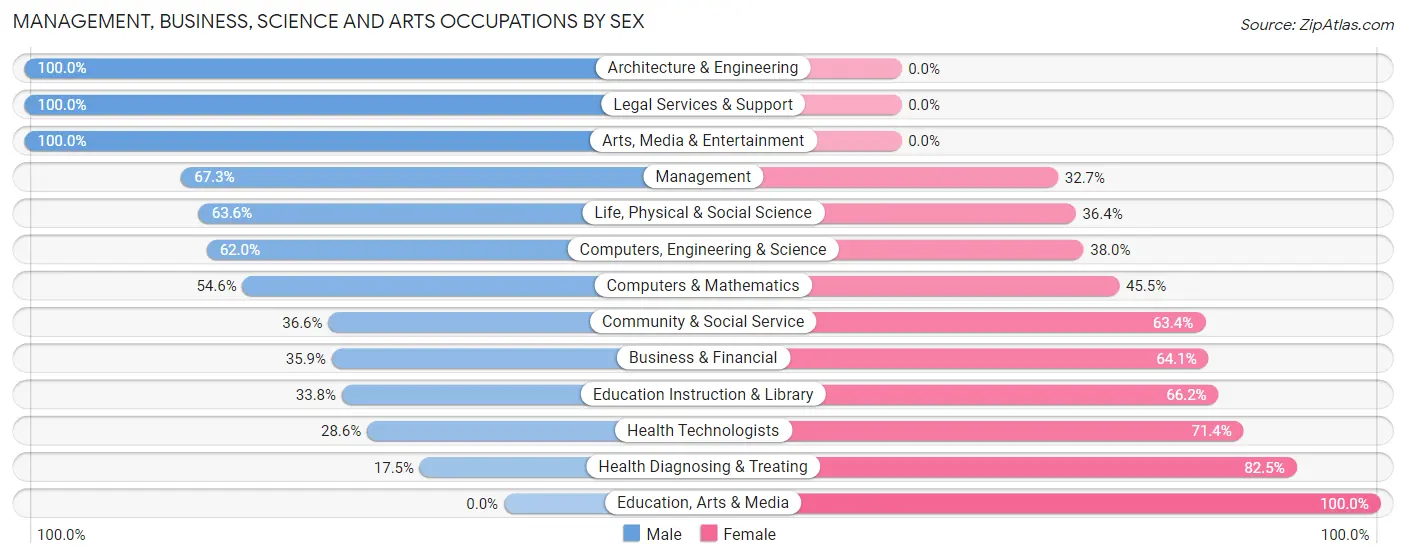
| Occupation | Male | Female |
| Management | 35 (67.3%) | 17 (32.7%) |
| Business & Financial | 14 (35.9%) | 25 (64.1%) |
| Computers, Engineering & Science | 31 (62.0%) | 19 (38.0%) |
| Computers & Mathematics | 18 (54.5%) | 15 (45.5%) |
| Architecture & Engineering | 6 (100.0%) | 0 (0.0%) |
| Life, Physical & Social Science | 7 (63.6%) | 4 (36.4%) |
| Community & Social Service | 37 (36.6%) | 64 (63.4%) |
| Education, Arts & Media | 0 (0.0%) | 19 (100.0%) |
| Legal Services & Support | 4 (100.0%) | 0 (0.0%) |
| Education Instruction & Library | 23 (33.8%) | 45 (66.2%) |
| Arts, Media & Entertainment | 10 (100.0%) | 0 (0.0%) |
| Health Diagnosing & Treating | 10 (17.5%) | 47 (82.5%) |
| Health Technologists | 10 (28.6%) | 25 (71.4%) |
| Total (Category) | 127 (42.5%) | 172 (57.5%) |
| Total (Overall) | 419 (56.4%) | 324 (43.6%) |
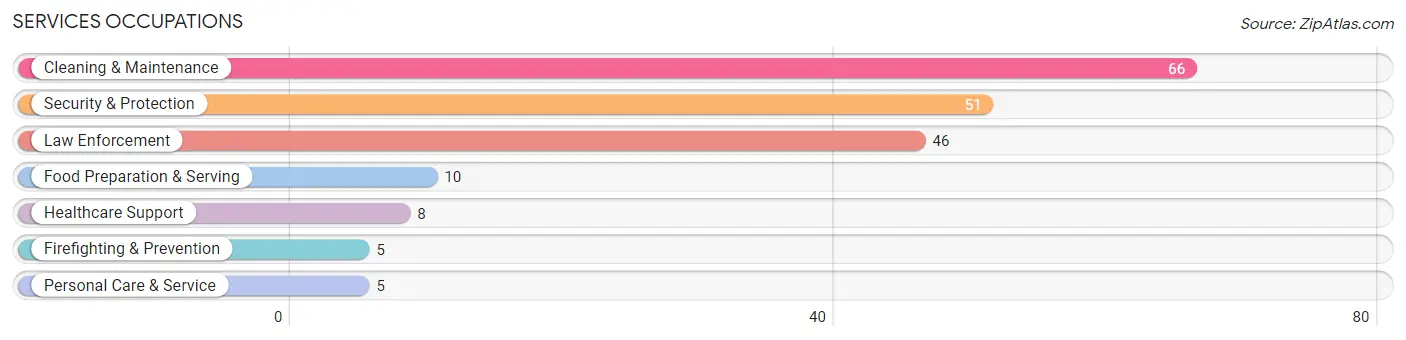
Services Occupations
The most common Services occupations in Pinebluff are Cleaning & Maintenance (66 | 8.9%), Security & Protection (51 | 6.9%), Law Enforcement (46 | 6.2%), Food Preparation & Serving (10 | 1.3%), and Healthcare Support (8 | 1.1%).
Services Occupations by Sex
Within the Services occupations in Pinebluff, the most male-oriented occupations are Cleaning & Maintenance (83.3%), Law Enforcement (32.6%), and Security & Protection (29.4%), while the most female-oriented occupations are Healthcare Support (100.0%), Firefighting & Prevention (100.0%), and Food Preparation & Serving (100.0%).
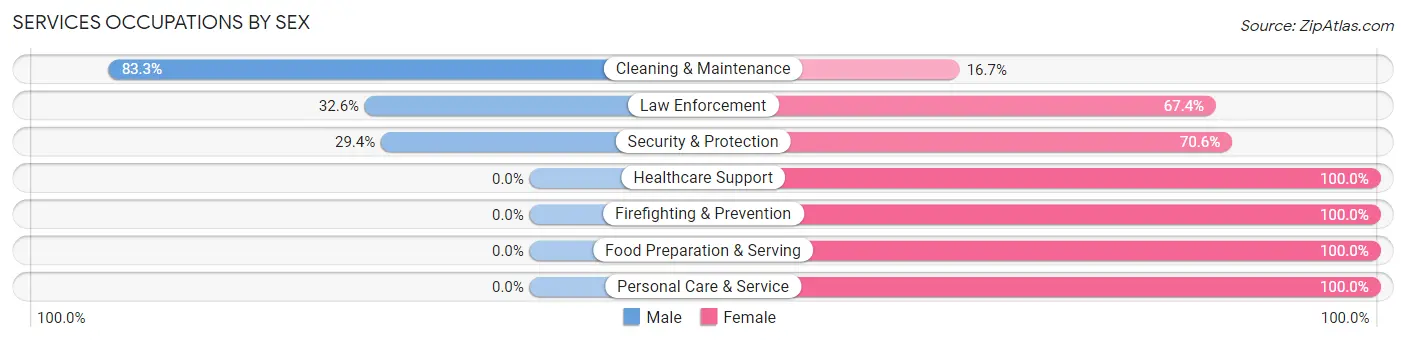
| Occupation | Male | Female |
| Healthcare Support | 0 (0.0%) | 8 (100.0%) |
| Security & Protection | 15 (29.4%) | 36 (70.6%) |
| Firefighting & Prevention | 0 (0.0%) | 5 (100.0%) |
| Law Enforcement | 15 (32.6%) | 31 (67.4%) |
| Food Preparation & Serving | 0 (0.0%) | 10 (100.0%) |
| Cleaning & Maintenance | 55 (83.3%) | 11 (16.7%) |
| Personal Care & Service | 0 (0.0%) | 5 (100.0%) |
| Total (Category) | 70 (50.0%) | 70 (50.0%) |
| Total (Overall) | 419 (56.4%) | 324 (43.6%) |
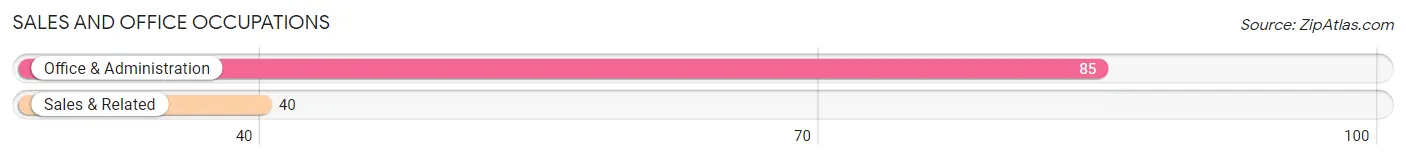
Sales and Office Occupations
The most common Sales and Office occupations in Pinebluff are Office & Administration (85 | 11.4%), and Sales & Related (40 | 5.4%).
Sales and Office Occupations by Sex
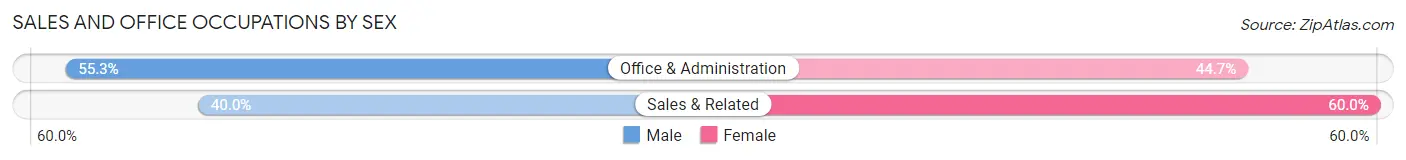
| Occupation | Male | Female |
| Sales & Related | 16 (40.0%) | 24 (60.0%) |
| Office & Administration | 47 (55.3%) | 38 (44.7%) |
| Total (Category) | 63 (50.4%) | 62 (49.6%) |
| Total (Overall) | 419 (56.4%) | 324 (43.6%) |
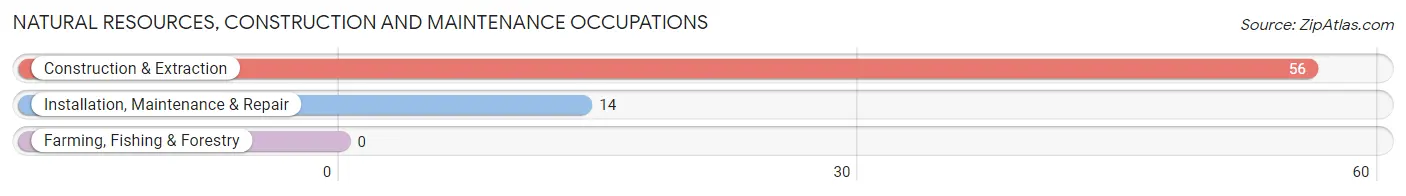
Natural Resources, Construction and Maintenance Occupations
The most common Natural Resources, Construction and Maintenance occupations in Pinebluff are Construction & Extraction (56 | 7.5%), and Installation, Maintenance & Repair (14 | 1.9%).
Natural Resources, Construction and Maintenance Occupations by Sex
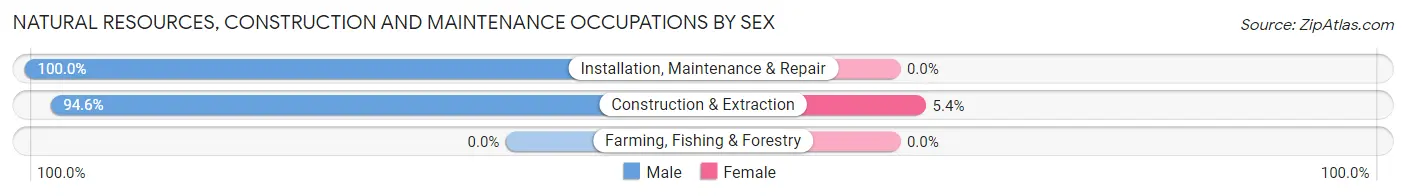
| Occupation | Male | Female |
| Farming, Fishing & Forestry | 0 (0.0%) | 0 (0.0%) |
| Construction & Extraction | 53 (94.6%) | 3 (5.4%) |
| Installation, Maintenance & Repair | 14 (100.0%) | 0 (0.0%) |
| Total (Category) | 67 (95.7%) | 3 (4.3%) |
| Total (Overall) | 419 (56.4%) | 324 (43.6%) |
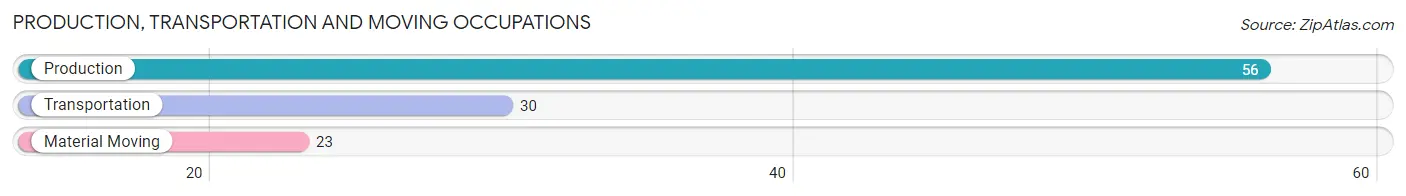
Production, Transportation and Moving Occupations
The most common Production, Transportation and Moving occupations in Pinebluff are Production (56 | 7.5%), Transportation (30 | 4.0%), and Material Moving (23 | 3.1%).
Production, Transportation and Moving Occupations by Sex
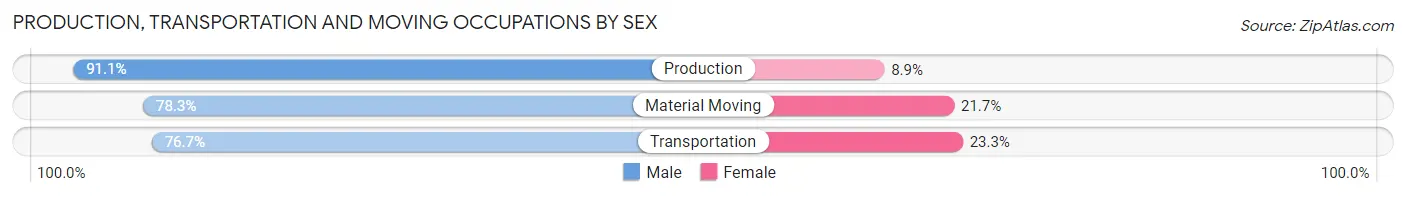
| Occupation | Male | Female |
| Production | 51 (91.1%) | 5 (8.9%) |
| Transportation | 23 (76.7%) | 7 (23.3%) |
| Material Moving | 18 (78.3%) | 5 (21.7%) |
| Total (Category) | 92 (84.4%) | 17 (15.6%) |
| Total (Overall) | 419 (56.4%) | 324 (43.6%) |
Employment Industries by Sex in Pinebluff
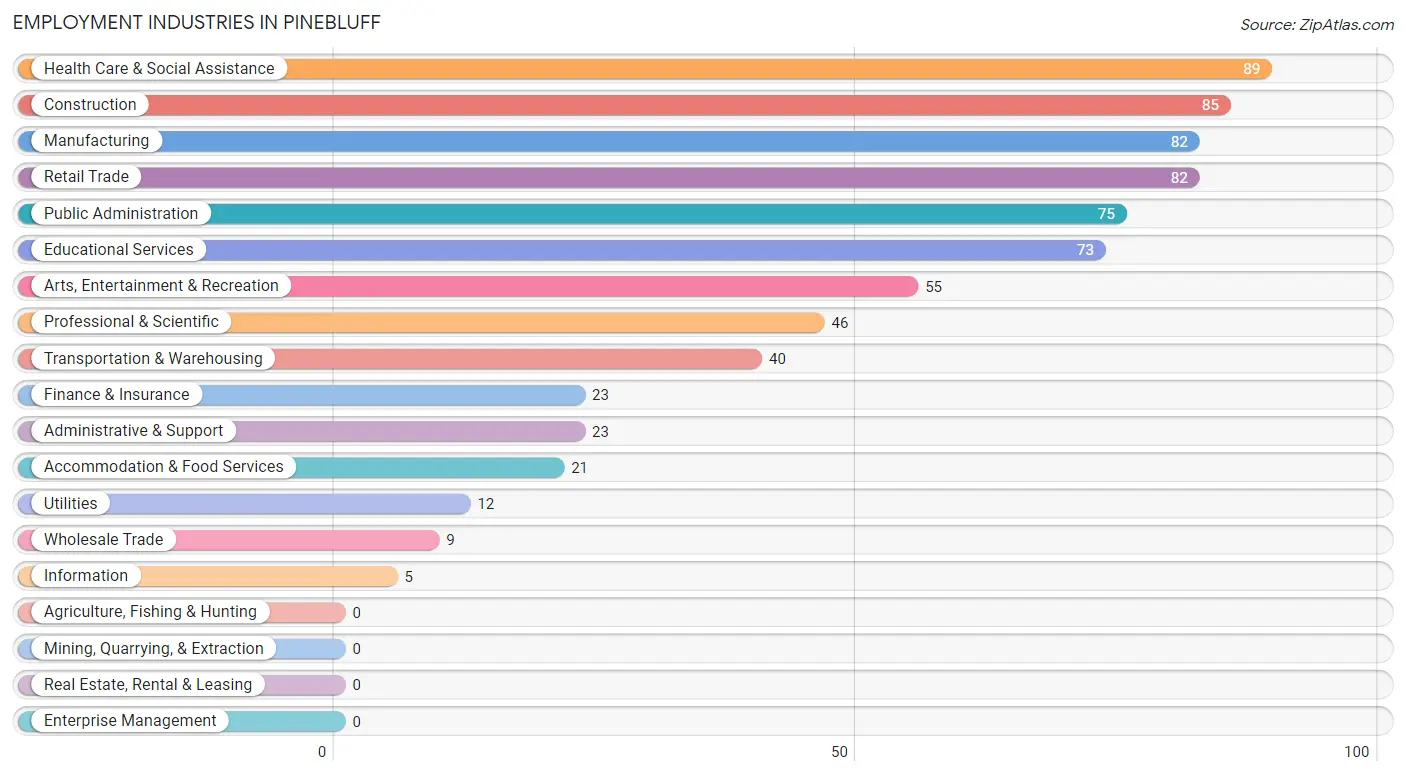
Employment Industries in Pinebluff
The major employment industries in Pinebluff include Health Care & Social Assistance (89 | 12.0%), Construction (85 | 11.4%), Manufacturing (82 | 11.0%), Retail Trade (82 | 11.0%), and Public Administration (75 | 10.1%).
Employment Industries by Sex in Pinebluff
The Pinebluff industries that see more men than women are Manufacturing (93.9%), Arts, Entertainment & Recreation (83.6%), and Transportation & Warehousing (82.5%), whereas the industries that tend to have a higher number of women are Information (100.0%), Finance & Insurance (87.0%), and Public Administration (70.7%).
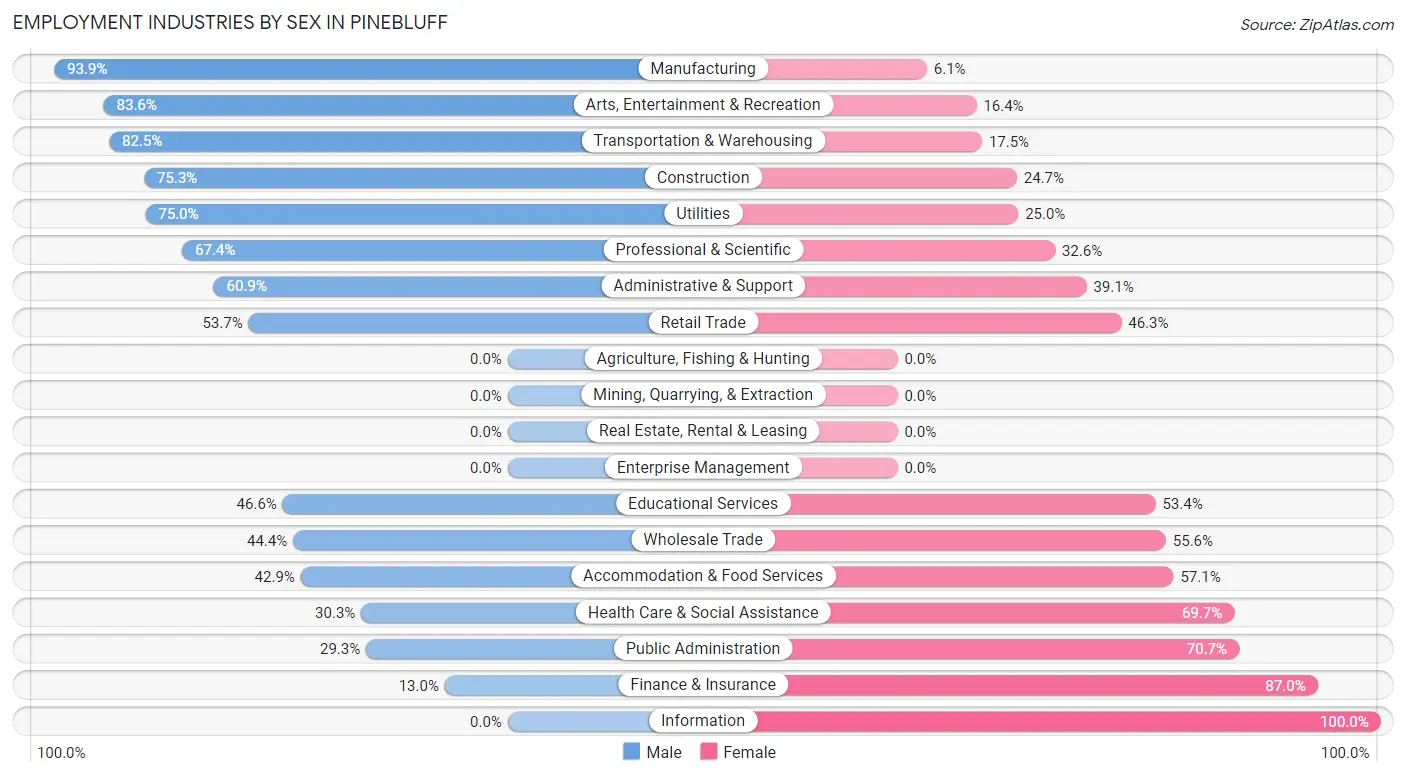
| Industry | Male | Female |
| Agriculture, Fishing & Hunting | 0 (0.0%) | 0 (0.0%) |
| Mining, Quarrying, & Extraction | 0 (0.0%) | 0 (0.0%) |
| Construction | 64 (75.3%) | 21 (24.7%) |
| Manufacturing | 77 (93.9%) | 5 (6.1%) |
| Wholesale Trade | 4 (44.4%) | 5 (55.6%) |
| Retail Trade | 44 (53.7%) | 38 (46.3%) |
| Transportation & Warehousing | 33 (82.5%) | 7 (17.5%) |
| Utilities | 9 (75.0%) | 3 (25.0%) |
| Information | 0 (0.0%) | 5 (100.0%) |
| Finance & Insurance | 3 (13.0%) | 20 (87.0%) |
| Real Estate, Rental & Leasing | 0 (0.0%) | 0 (0.0%) |
| Professional & Scientific | 31 (67.4%) | 15 (32.6%) |
| Enterprise Management | 0 (0.0%) | 0 (0.0%) |
| Administrative & Support | 14 (60.9%) | 9 (39.1%) |
| Educational Services | 34 (46.6%) | 39 (53.4%) |
| Health Care & Social Assistance | 27 (30.3%) | 62 (69.7%) |
| Arts, Entertainment & Recreation | 46 (83.6%) | 9 (16.4%) |
| Accommodation & Food Services | 9 (42.9%) | 12 (57.1%) |
| Public Administration | 22 (29.3%) | 53 (70.7%) |
| Total | 419 (56.4%) | 324 (43.6%) |
Education in Pinebluff
School Enrollment in Pinebluff
The most common levels of schooling among the 378 students in Pinebluff are elementary school (88 | 23.3%), high school (83 | 22.0%), and middle school (67 | 17.7%).
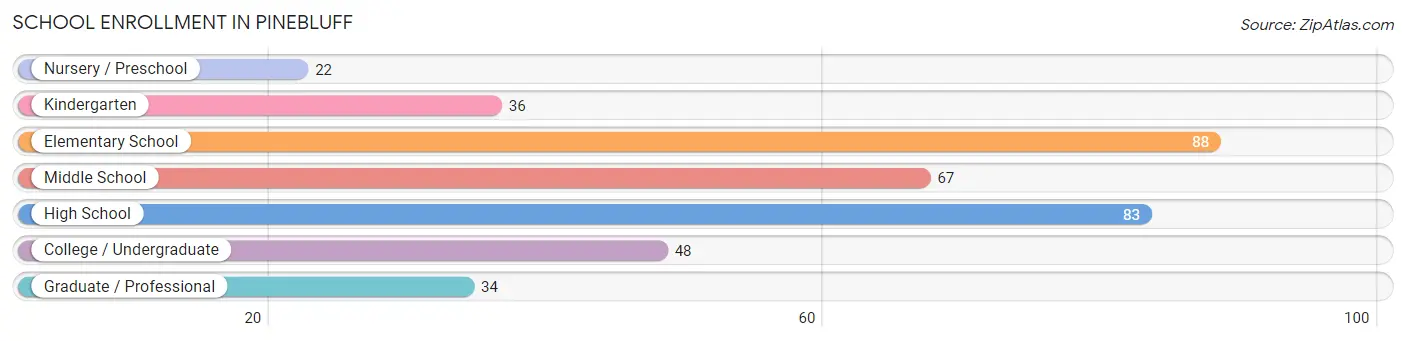
| School Level | # Students | % Students |
| Nursery / Preschool | 22 | 5.8% |
| Kindergarten | 36 | 9.5% |
| Elementary School | 88 | 23.3% |
| Middle School | 67 | 17.7% |
| High School | 83 | 22.0% |
| College / Undergraduate | 48 | 12.7% |
| Graduate / Professional | 34 | 9.0% |
| Total | 378 | 100.0% |
School Enrollment by Age by Funding Source in Pinebluff
Out of a total of 378 students who are enrolled in schools in Pinebluff, 60 (15.9%) attend a private institution, while the remaining 318 (84.1%) are enrolled in public schools. The age group of 3 to 4 year olds has the highest likelihood of being enrolled in private schools, with 22 (100.0% in the age bracket) enrolled. Conversely, the age group of 15 to 17 year olds has the lowest likelihood of being enrolled in a private school, with 76 (100.0% in the age bracket) attending a public institution.
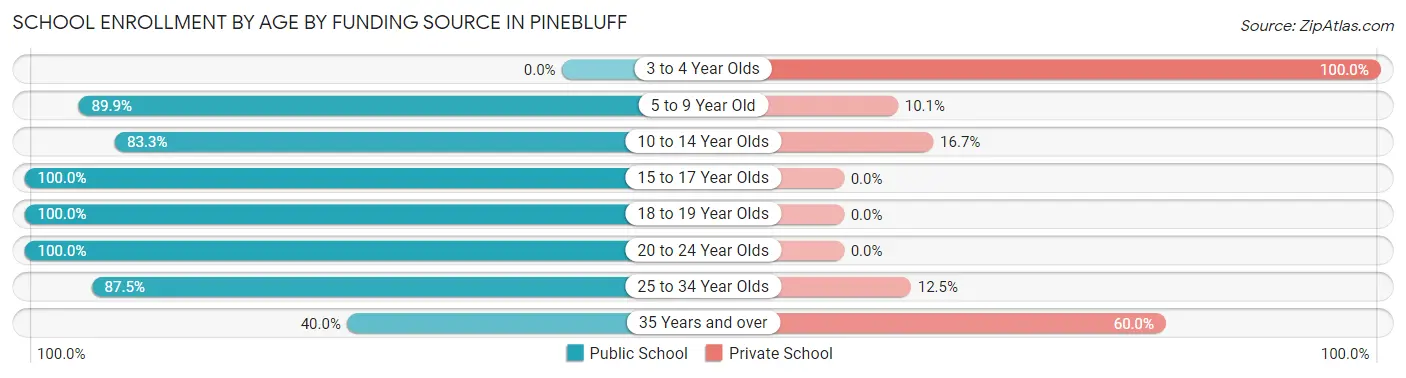
| Age Bracket | Public School | Private School |
| 3 to 4 Year Olds | 0 (0.0%) | 22 (100.0%) |
| 5 to 9 Year Old | 107 (89.9%) | 12 (10.1%) |
| 10 to 14 Year Olds | 60 (83.3%) | 12 (16.7%) |
| 15 to 17 Year Olds | 76 (100.0%) | 0 (0.0%) |
| 18 to 19 Year Olds | 9 (100.0%) | 0 (0.0%) |
| 20 to 24 Year Olds | 25 (100.0%) | 0 (0.0%) |
| 25 to 34 Year Olds | 35 (87.5%) | 5 (12.5%) |
| 35 Years and over | 6 (40.0%) | 9 (60.0%) |
| Total | 318 (84.1%) | 60 (15.9%) |
Educational Attainment by Field of Study in Pinebluff
Science & technology (72 | 22.8%), business (49 | 15.5%), social sciences (30 | 9.5%), engineering (26 | 8.2%), and education (24 | 7.6%) are the most common fields of study among 316 individuals in Pinebluff who have obtained a bachelor's degree or higher.
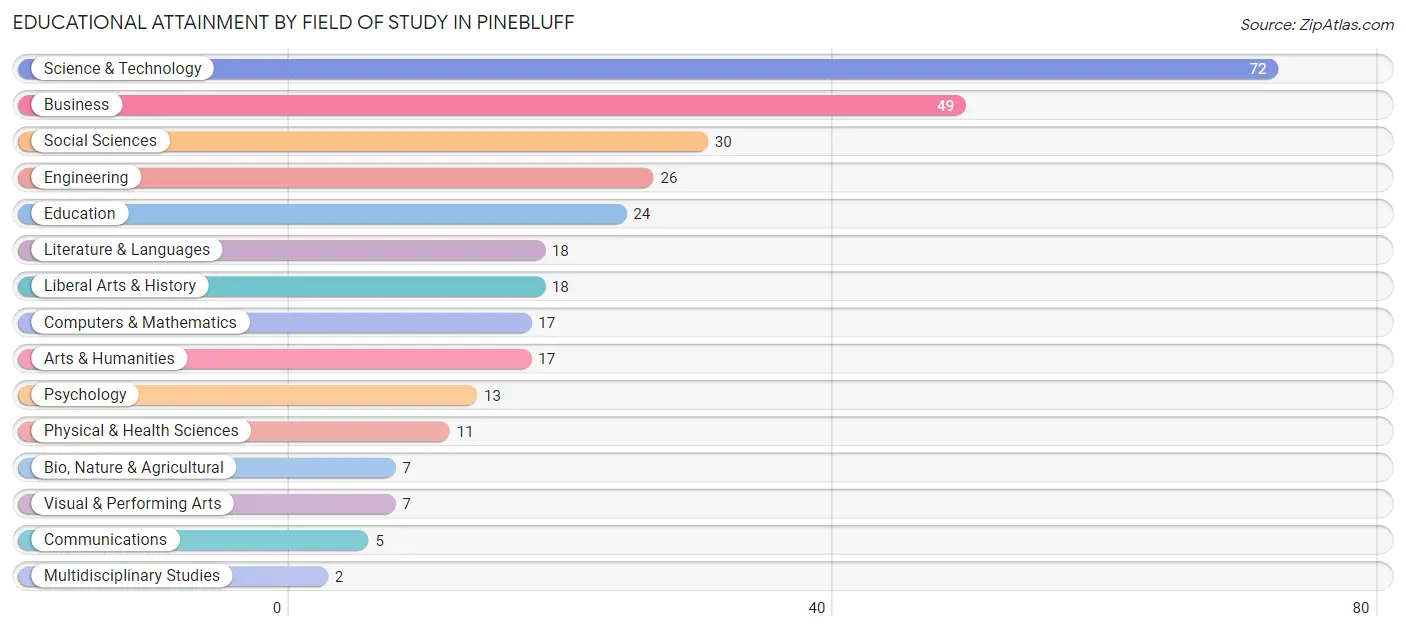
| Field of Study | # Graduates | % Graduates |
| Computers & Mathematics | 17 | 5.4% |
| Bio, Nature & Agricultural | 7 | 2.2% |
| Physical & Health Sciences | 11 | 3.5% |
| Psychology | 13 | 4.1% |
| Social Sciences | 30 | 9.5% |
| Engineering | 26 | 8.2% |
| Multidisciplinary Studies | 2 | 0.6% |
| Science & Technology | 72 | 22.8% |
| Business | 49 | 15.5% |
| Education | 24 | 7.6% |
| Literature & Languages | 18 | 5.7% |
| Liberal Arts & History | 18 | 5.7% |
| Visual & Performing Arts | 7 | 2.2% |
| Communications | 5 | 1.6% |
| Arts & Humanities | 17 | 5.4% |
| Total | 316 | 100.0% |
Transportation & Commute in Pinebluff
Vehicle Availability by Sex in Pinebluff
The most prevalent vehicle ownership categories in Pinebluff are males with 2 vehicles (158, accounting for 37.3%) and females with 2 vehicles (130, making up 49.2%).
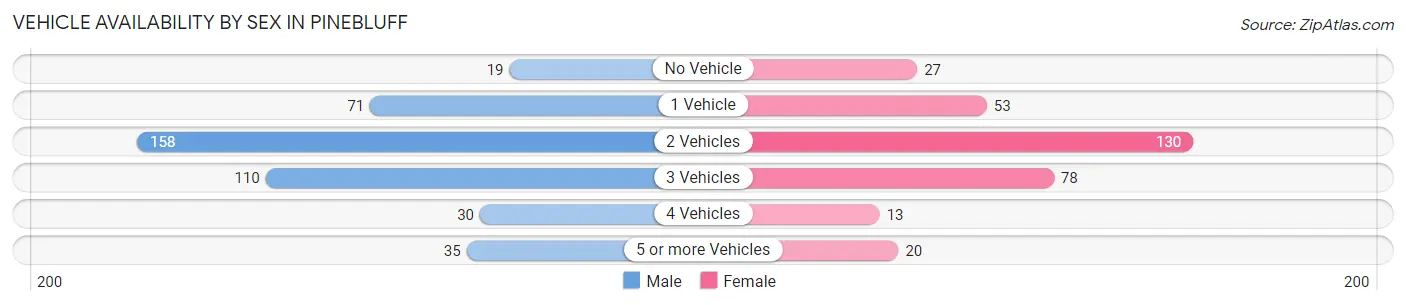
| Vehicles Available | Male | Female |
| No Vehicle | 19 (4.5%) | 27 (8.4%) |
| 1 Vehicle | 71 (16.8%) | 53 (16.5%) |
| 2 Vehicles | 158 (37.3%) | 130 (40.5%) |
| 3 Vehicles | 110 (26.0%) | 78 (24.3%) |
| 4 Vehicles | 30 (7.1%) | 13 (4.1%) |
| 5 or more Vehicles | 35 (8.3%) | 20 (6.2%) |
| Total | 423 (100.0%) | 321 (100.0%) |
Commute Time in Pinebluff
The most frequently occuring commute durations in Pinebluff are 15 to 19 minutes (153 commuters, 22.2%), 10 to 14 minutes (135 commuters, 19.6%), and 20 to 24 minutes (96 commuters, 14.0%).
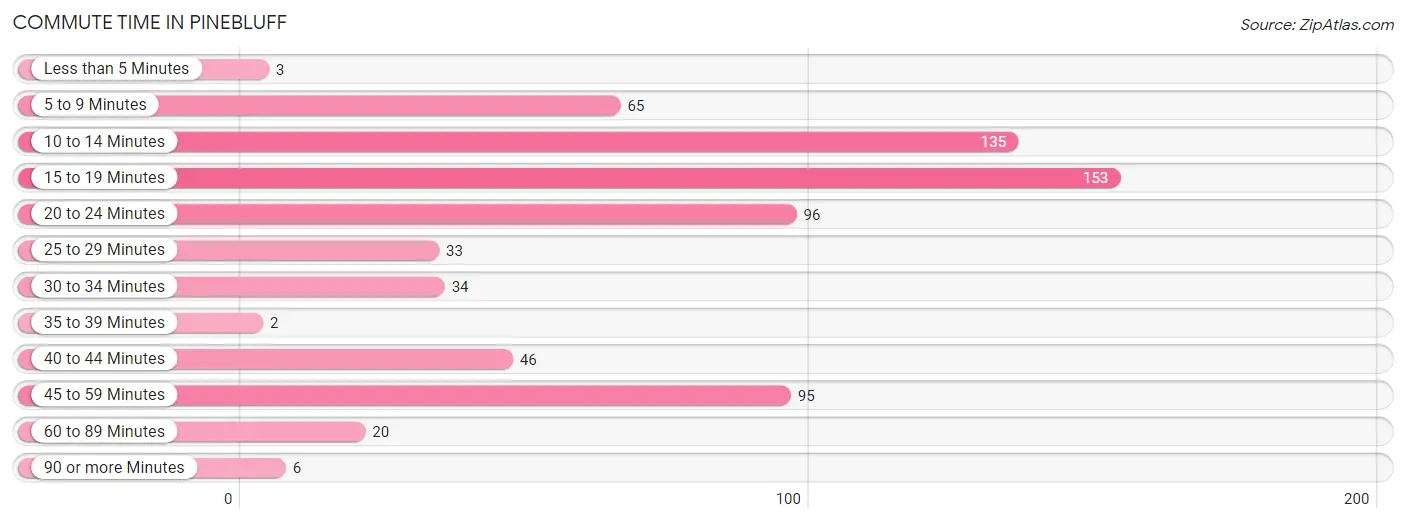
| Commute Time | # Commuters | % Commuters |
| Less than 5 Minutes | 3 | 0.4% |
| 5 to 9 Minutes | 65 | 9.5% |
| 10 to 14 Minutes | 135 | 19.6% |
| 15 to 19 Minutes | 153 | 22.2% |
| 20 to 24 Minutes | 96 | 14.0% |
| 25 to 29 Minutes | 33 | 4.8% |
| 30 to 34 Minutes | 34 | 4.9% |
| 35 to 39 Minutes | 2 | 0.3% |
| 40 to 44 Minutes | 46 | 6.7% |
| 45 to 59 Minutes | 95 | 13.8% |
| 60 to 89 Minutes | 20 | 2.9% |
| 90 or more Minutes | 6 | 0.9% |
Commute Time by Sex in Pinebluff
The most common commute times in Pinebluff are 20 to 24 minutes (75 commuters, 18.6%) for males and 15 to 19 minutes (91 commuters, 31.9%) for females.
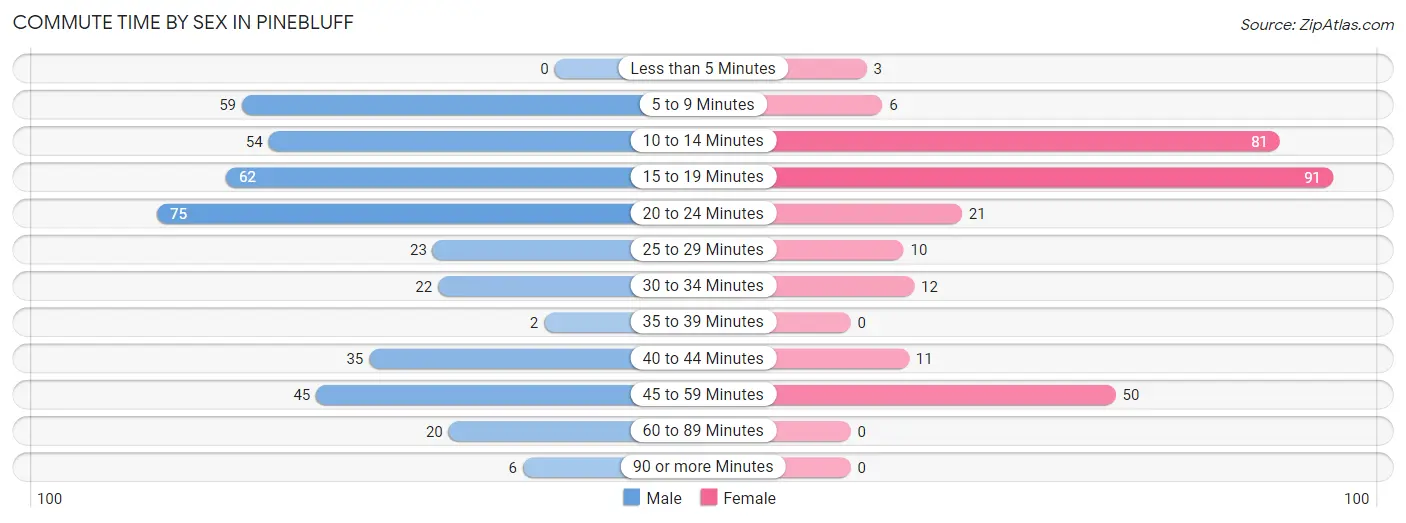
| Commute Time | Male | Female |
| Less than 5 Minutes | 0 (0.0%) | 3 (1.1%) |
| 5 to 9 Minutes | 59 (14.6%) | 6 (2.1%) |
| 10 to 14 Minutes | 54 (13.4%) | 81 (28.4%) |
| 15 to 19 Minutes | 62 (15.4%) | 91 (31.9%) |
| 20 to 24 Minutes | 75 (18.6%) | 21 (7.4%) |
| 25 to 29 Minutes | 23 (5.7%) | 10 (3.5%) |
| 30 to 34 Minutes | 22 (5.5%) | 12 (4.2%) |
| 35 to 39 Minutes | 2 (0.5%) | 0 (0.0%) |
| 40 to 44 Minutes | 35 (8.7%) | 11 (3.9%) |
| 45 to 59 Minutes | 45 (11.2%) | 50 (17.5%) |
| 60 to 89 Minutes | 20 (5.0%) | 0 (0.0%) |
| 90 or more Minutes | 6 (1.5%) | 0 (0.0%) |
Time of Departure to Work by Sex in Pinebluff
The most frequent times of departure to work in Pinebluff are 6:00 AM to 6:29 AM (73, 18.1%) for males and 7:30 AM to 7:59 AM (87, 30.5%) for females.
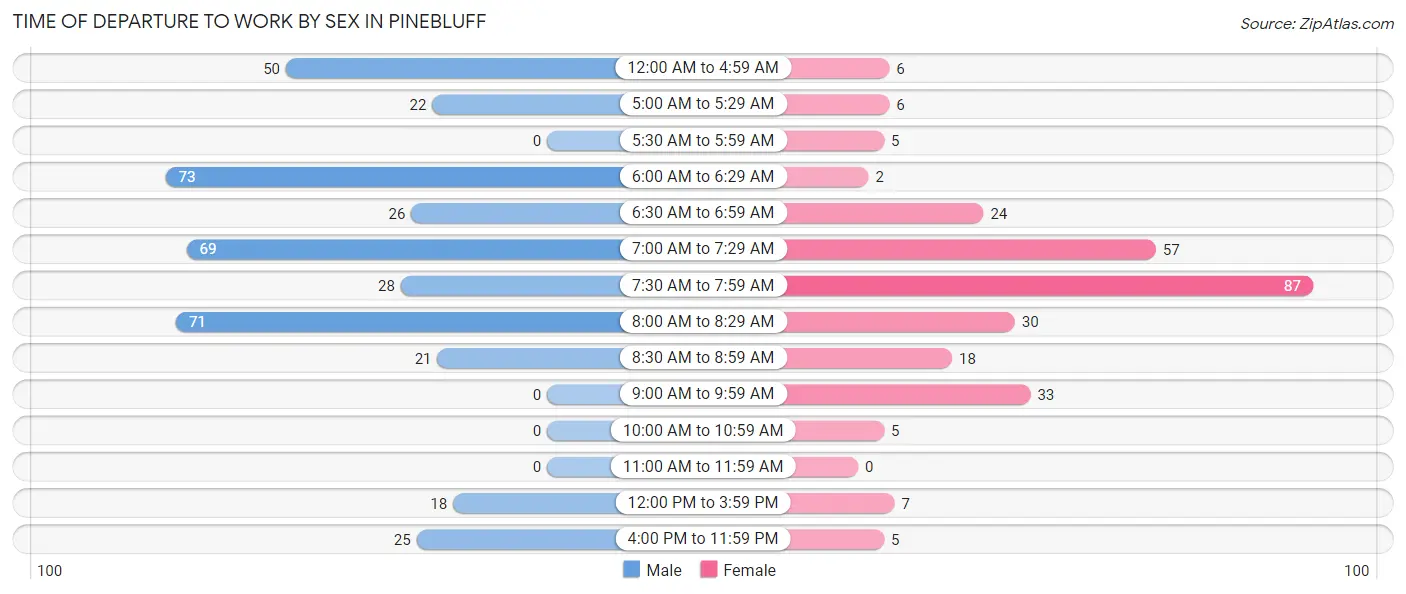
| Time of Departure | Male | Female |
| 12:00 AM to 4:59 AM | 50 (12.4%) | 6 (2.1%) |
| 5:00 AM to 5:29 AM | 22 (5.5%) | 6 (2.1%) |
| 5:30 AM to 5:59 AM | 0 (0.0%) | 5 (1.8%) |
| 6:00 AM to 6:29 AM | 73 (18.1%) | 2 (0.7%) |
| 6:30 AM to 6:59 AM | 26 (6.5%) | 24 (8.4%) |
| 7:00 AM to 7:29 AM | 69 (17.1%) | 57 (20.0%) |
| 7:30 AM to 7:59 AM | 28 (7.0%) | 87 (30.5%) |
| 8:00 AM to 8:29 AM | 71 (17.6%) | 30 (10.5%) |
| 8:30 AM to 8:59 AM | 21 (5.2%) | 18 (6.3%) |
| 9:00 AM to 9:59 AM | 0 (0.0%) | 33 (11.6%) |
| 10:00 AM to 10:59 AM | 0 (0.0%) | 5 (1.8%) |
| 11:00 AM to 11:59 AM | 0 (0.0%) | 0 (0.0%) |
| 12:00 PM to 3:59 PM | 18 (4.5%) | 7 (2.5%) |
| 4:00 PM to 11:59 PM | 25 (6.2%) | 5 (1.8%) |
| Total | 403 (100.0%) | 285 (100.0%) |
Housing Occupancy in Pinebluff
Occupancy by Ownership in Pinebluff
Of the total 627 dwellings in Pinebluff, owner-occupied units account for 475 (75.8%), while renter-occupied units make up 152 (24.2%).
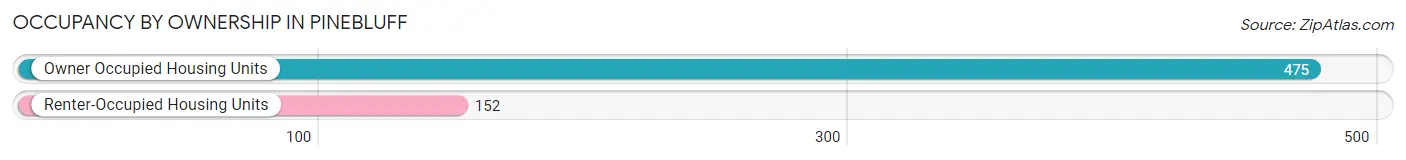
| Occupancy | # Housing Units | % Housing Units |
| Owner Occupied Housing Units | 475 | 75.8% |
| Renter-Occupied Housing Units | 152 | 24.2% |
| Total Occupied Housing Units | 627 | 100.0% |
Occupancy by Household Size in Pinebluff
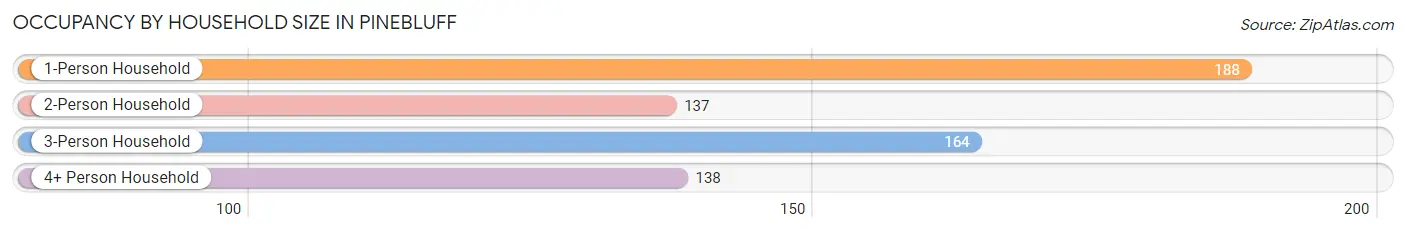
| Household Size | # Housing Units | % Housing Units |
| 1-Person Household | 188 | 30.0% |
| 2-Person Household | 137 | 21.8% |
| 3-Person Household | 164 | 26.2% |
| 4+ Person Household | 138 | 22.0% |
| Total Housing Units | 627 | 100.0% |
Occupancy by Ownership by Household Size in Pinebluff
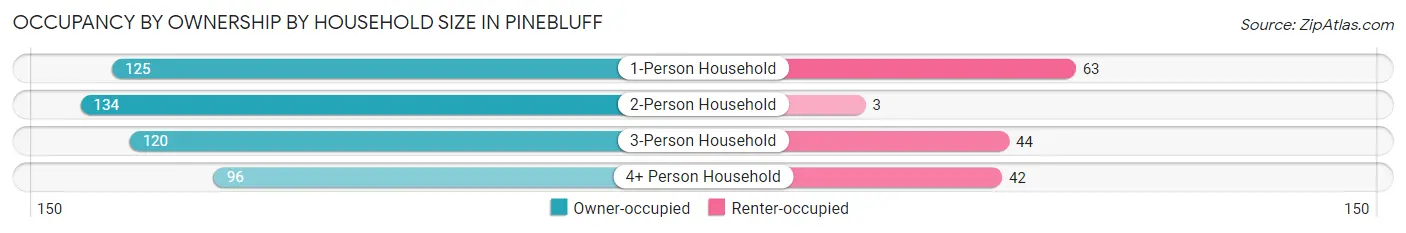
| Household Size | Owner-occupied | Renter-occupied |
| 1-Person Household | 125 (66.5%) | 63 (33.5%) |
| 2-Person Household | 134 (97.8%) | 3 (2.2%) |
| 3-Person Household | 120 (73.2%) | 44 (26.8%) |
| 4+ Person Household | 96 (69.6%) | 42 (30.4%) |
| Total Housing Units | 475 (75.8%) | 152 (24.2%) |
Occupancy by Educational Attainment in Pinebluff
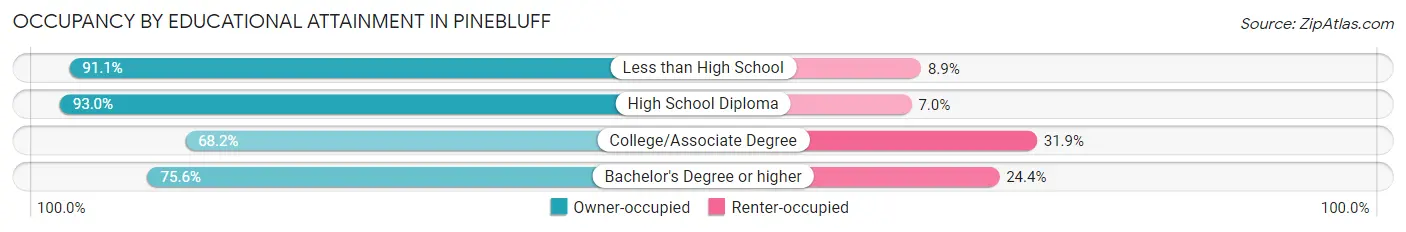
| Household Size | Owner-occupied | Renter-occupied |
| Less than High School | 41 (91.1%) | 4 (8.9%) |
| High School Diploma | 93 (93.0%) | 7 (7.0%) |
| College/Associate Degree | 214 (68.1%) | 100 (31.9%) |
| Bachelor's Degree or higher | 127 (75.6%) | 41 (24.4%) |
Occupancy by Age of Householder in Pinebluff
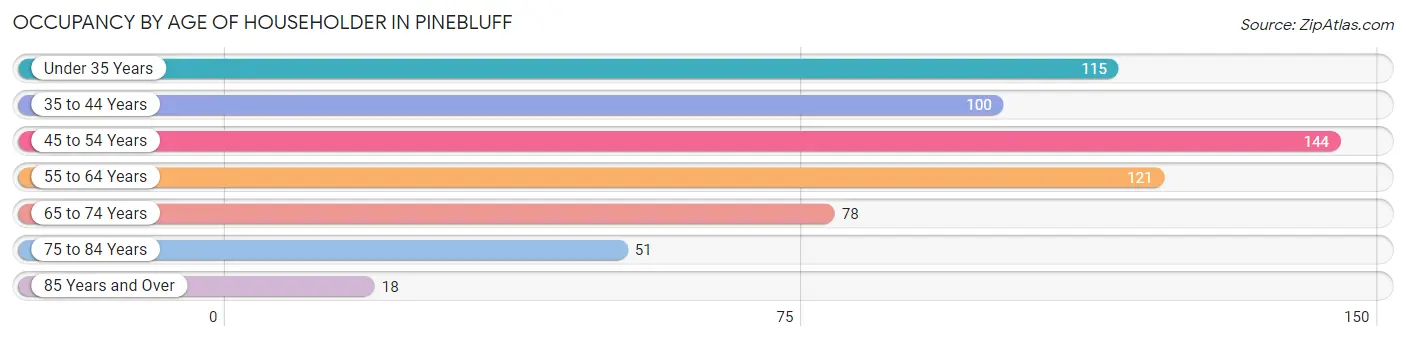
| Age Bracket | # Households | % Households |
| Under 35 Years | 115 | 18.3% |
| 35 to 44 Years | 100 | 16.0% |
| 45 to 54 Years | 144 | 23.0% |
| 55 to 64 Years | 121 | 19.3% |
| 65 to 74 Years | 78 | 12.4% |
| 75 to 84 Years | 51 | 8.1% |
| 85 Years and Over | 18 | 2.9% |
| Total | 627 | 100.0% |
Housing Finances in Pinebluff
Median Income by Occupancy in Pinebluff
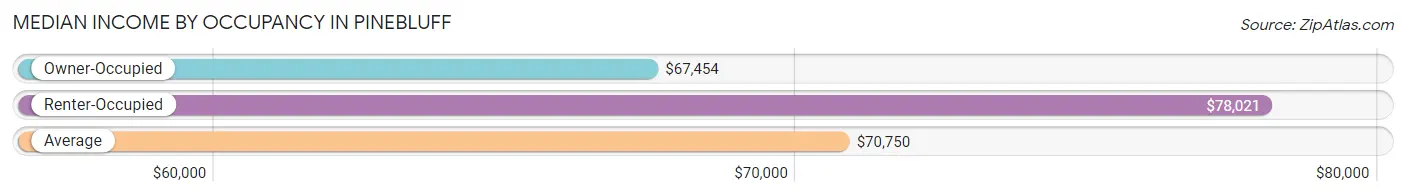
| Occupancy Type | # Households | Median Income |
| Owner-Occupied | 475 (75.8%) | $67,454 |
| Renter-Occupied | 152 (24.2%) | $78,021 |
| Average | 627 (100.0%) | $70,750 |
Occupancy by Householder Income Bracket in Pinebluff
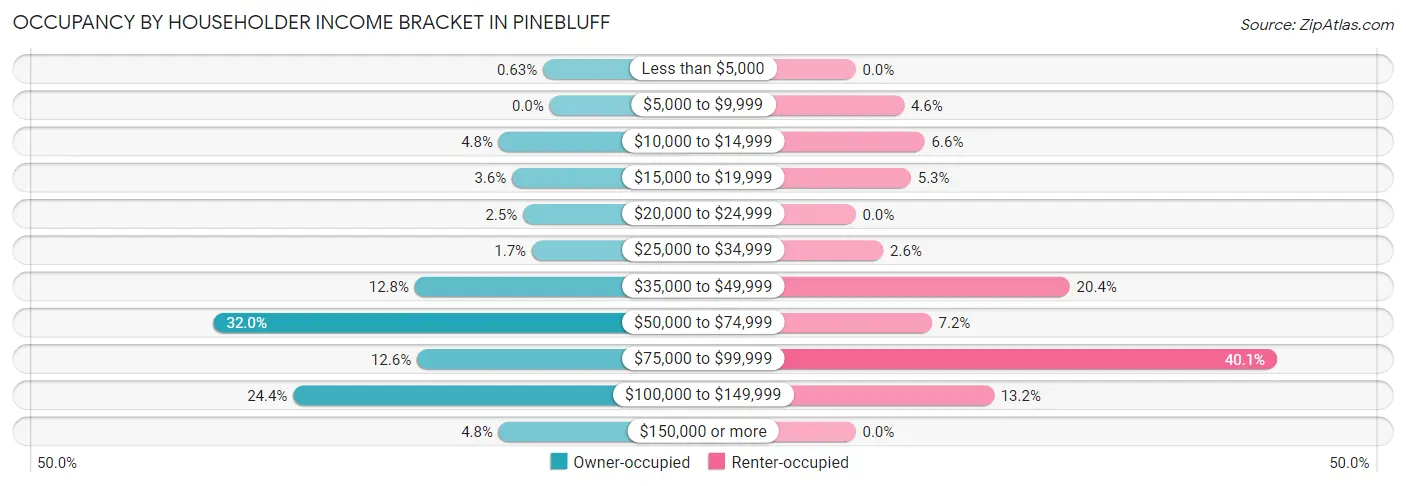
| Income Bracket | Owner-occupied | Renter-occupied |
| Less than $5,000 | 3 (0.6%) | 0 (0.0%) |
| $5,000 to $9,999 | 0 (0.0%) | 7 (4.6%) |
| $10,000 to $14,999 | 23 (4.8%) | 10 (6.6%) |
| $15,000 to $19,999 | 17 (3.6%) | 8 (5.3%) |
| $20,000 to $24,999 | 12 (2.5%) | 0 (0.0%) |
| $25,000 to $34,999 | 8 (1.7%) | 4 (2.6%) |
| $35,000 to $49,999 | 61 (12.8%) | 31 (20.4%) |
| $50,000 to $74,999 | 152 (32.0%) | 11 (7.2%) |
| $75,000 to $99,999 | 60 (12.6%) | 61 (40.1%) |
| $100,000 to $149,999 | 116 (24.4%) | 20 (13.2%) |
| $150,000 or more | 23 (4.8%) | 0 (0.0%) |
| Total | 475 (100.0%) | 152 (100.0%) |
Monthly Housing Cost Tiers in Pinebluff
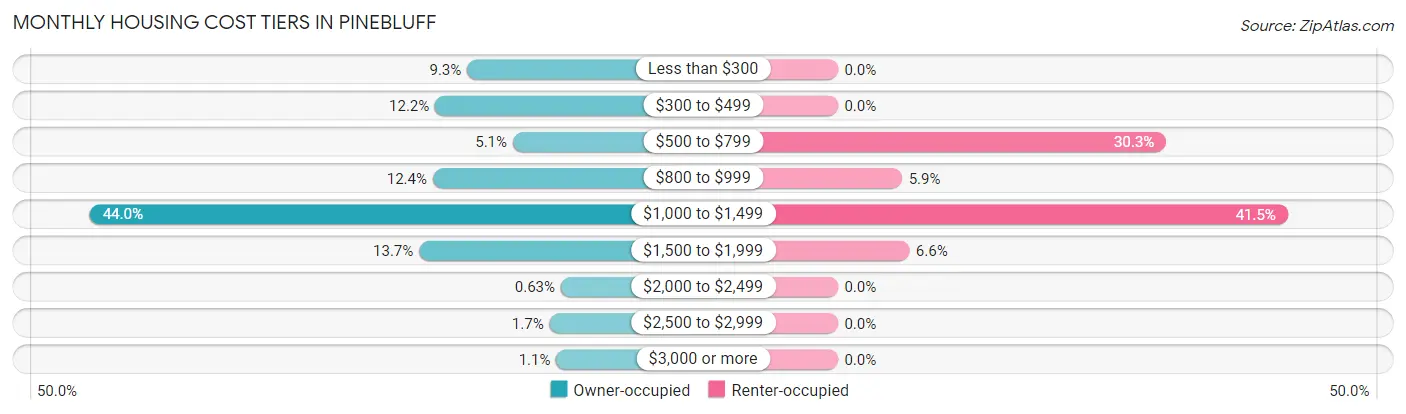
| Monthly Cost | Owner-occupied | Renter-occupied |
| Less than $300 | 44 (9.3%) | 0 (0.0%) |
| $300 to $499 | 58 (12.2%) | 0 (0.0%) |
| $500 to $799 | 24 (5.1%) | 46 (30.3%) |
| $800 to $999 | 59 (12.4%) | 9 (5.9%) |
| $1,000 to $1,499 | 209 (44.0%) | 63 (41.4%) |
| $1,500 to $1,999 | 65 (13.7%) | 10 (6.6%) |
| $2,000 to $2,499 | 3 (0.6%) | 0 (0.0%) |
| $2,500 to $2,999 | 8 (1.7%) | 0 (0.0%) |
| $3,000 or more | 5 (1.1%) | 0 (0.0%) |
| Total | 475 (100.0%) | 152 (100.0%) |
Physical Housing Characteristics in Pinebluff
Housing Structures in Pinebluff
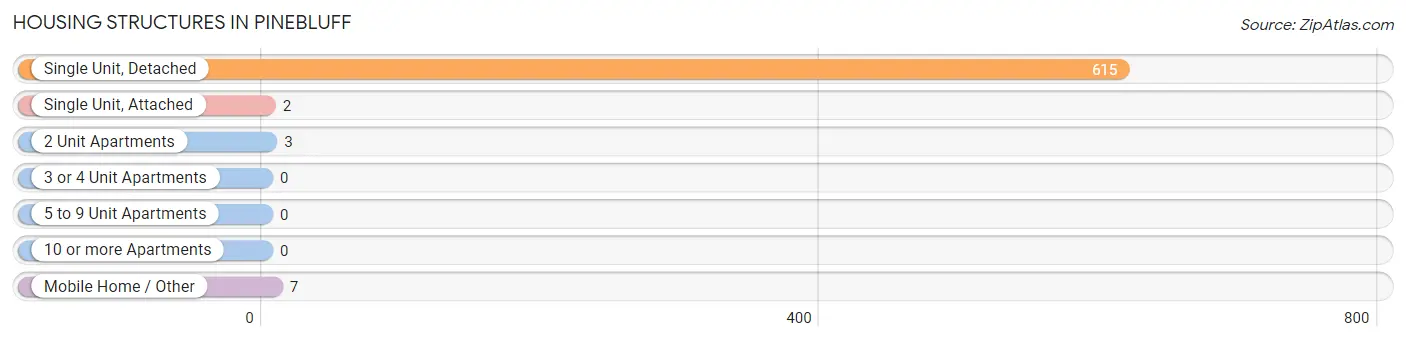
| Structure Type | # Housing Units | % Housing Units |
| Single Unit, Detached | 615 | 98.1% |
| Single Unit, Attached | 2 | 0.3% |
| 2 Unit Apartments | 3 | 0.5% |
| 3 or 4 Unit Apartments | 0 | 0.0% |
| 5 to 9 Unit Apartments | 0 | 0.0% |
| 10 or more Apartments | 0 | 0.0% |
| Mobile Home / Other | 7 | 1.1% |
| Total | 627 | 100.0% |
Housing Structures by Occupancy in Pinebluff
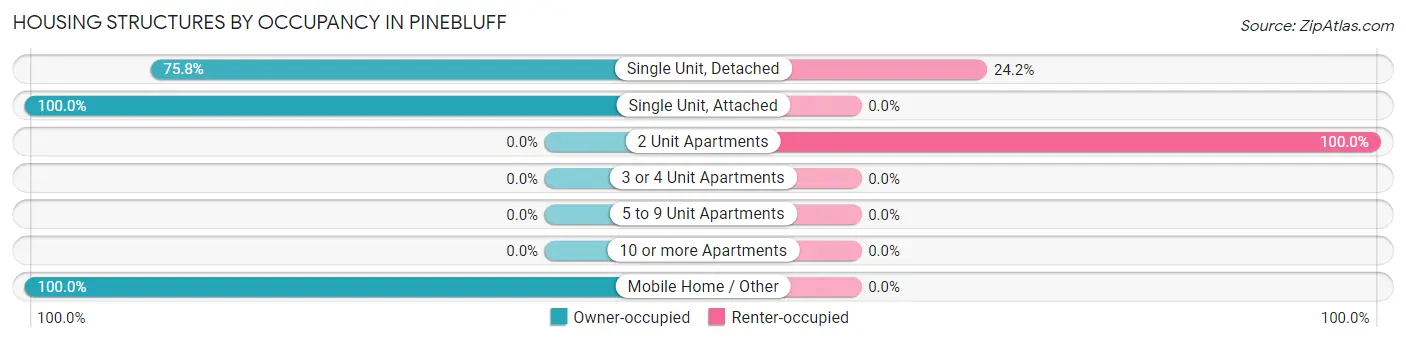
| Structure Type | Owner-occupied | Renter-occupied |
| Single Unit, Detached | 466 (75.8%) | 149 (24.2%) |
| Single Unit, Attached | 2 (100.0%) | 0 (0.0%) |
| 2 Unit Apartments | 0 (0.0%) | 3 (100.0%) |
| 3 or 4 Unit Apartments | 0 (0.0%) | 0 (0.0%) |
| 5 to 9 Unit Apartments | 0 (0.0%) | 0 (0.0%) |
| 10 or more Apartments | 0 (0.0%) | 0 (0.0%) |
| Mobile Home / Other | 7 (100.0%) | 0 (0.0%) |
| Total | 475 (75.8%) | 152 (24.2%) |
Housing Structures by Number of Rooms in Pinebluff
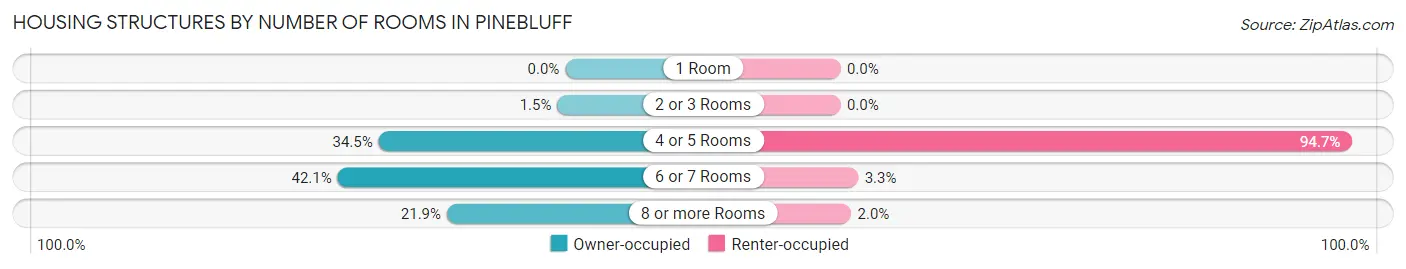
| Number of Rooms | Owner-occupied | Renter-occupied |
| 1 Room | 0 (0.0%) | 0 (0.0%) |
| 2 or 3 Rooms | 7 (1.5%) | 0 (0.0%) |
| 4 or 5 Rooms | 164 (34.5%) | 144 (94.7%) |
| 6 or 7 Rooms | 200 (42.1%) | 5 (3.3%) |
| 8 or more Rooms | 104 (21.9%) | 3 (2.0%) |
| Total | 475 (100.0%) | 152 (100.0%) |
Housing Structure by Heating Type in Pinebluff
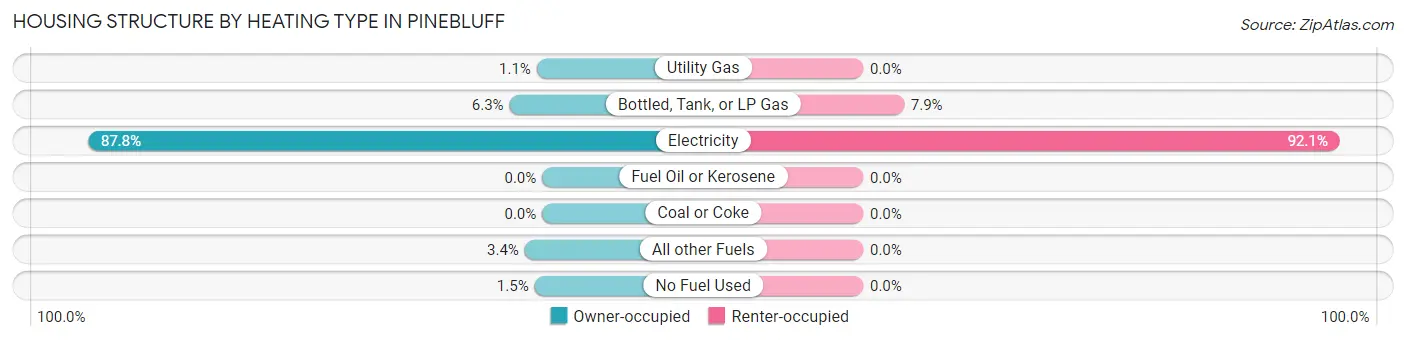
| Heating Type | Owner-occupied | Renter-occupied |
| Utility Gas | 5 (1.1%) | 0 (0.0%) |
| Bottled, Tank, or LP Gas | 30 (6.3%) | 12 (7.9%) |
| Electricity | 417 (87.8%) | 140 (92.1%) |
| Fuel Oil or Kerosene | 0 (0.0%) | 0 (0.0%) |
| Coal or Coke | 0 (0.0%) | 0 (0.0%) |
| All other Fuels | 16 (3.4%) | 0 (0.0%) |
| No Fuel Used | 7 (1.5%) | 0 (0.0%) |
| Total | 475 (100.0%) | 152 (100.0%) |
Household Vehicle Usage in Pinebluff
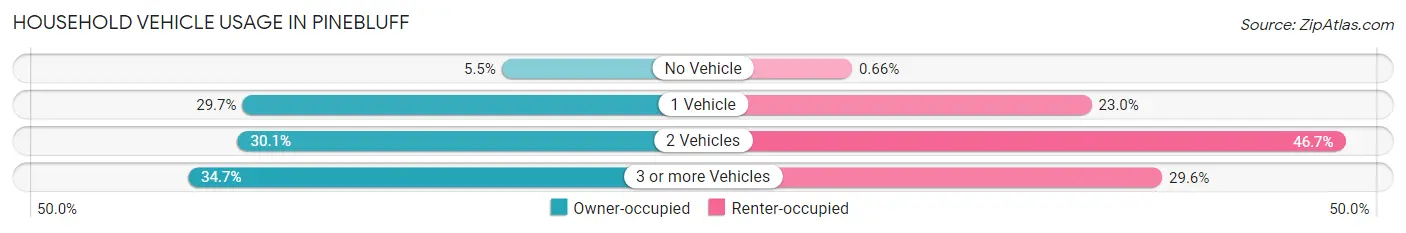
| Vehicles per Household | Owner-occupied | Renter-occupied |
| No Vehicle | 26 (5.5%) | 1 (0.7%) |
| 1 Vehicle | 141 (29.7%) | 35 (23.0%) |
| 2 Vehicles | 143 (30.1%) | 71 (46.7%) |
| 3 or more Vehicles | 165 (34.7%) | 45 (29.6%) |
| Total | 475 (100.0%) | 152 (100.0%) |
Real Estate & Mortgages in Pinebluff
Real Estate and Mortgage Overview in Pinebluff
| Characteristic | Without Mortgage | With Mortgage |
| Housing Units | 113 | 362 |
| Median Property Value | $142,300 | $203,900 |
| Median Household Income | $39,875 | $19 |
| Monthly Housing Costs | $369 | $5 |
| Real Estate Taxes | $972 | $2 |
Property Value by Mortgage Status in Pinebluff
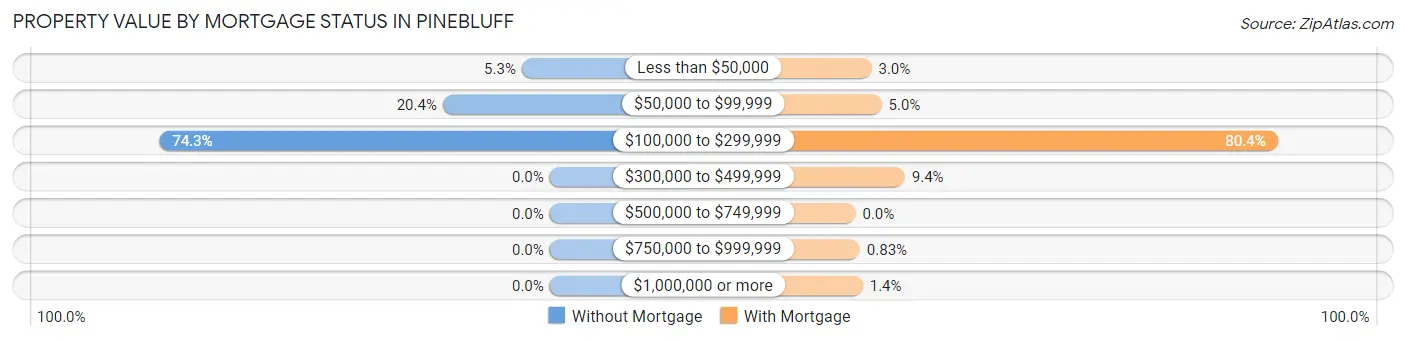
| Property Value | Without Mortgage | With Mortgage |
| Less than $50,000 | 6 (5.3%) | 11 (3.0%) |
| $50,000 to $99,999 | 23 (20.3%) | 18 (5.0%) |
| $100,000 to $299,999 | 84 (74.3%) | 291 (80.4%) |
| $300,000 to $499,999 | 0 (0.0%) | 34 (9.4%) |
| $500,000 to $749,999 | 0 (0.0%) | 0 (0.0%) |
| $750,000 to $999,999 | 0 (0.0%) | 3 (0.8%) |
| $1,000,000 or more | 0 (0.0%) | 5 (1.4%) |
| Total | 113 (100.0%) | 362 (100.0%) |
Household Income by Mortgage Status in Pinebluff
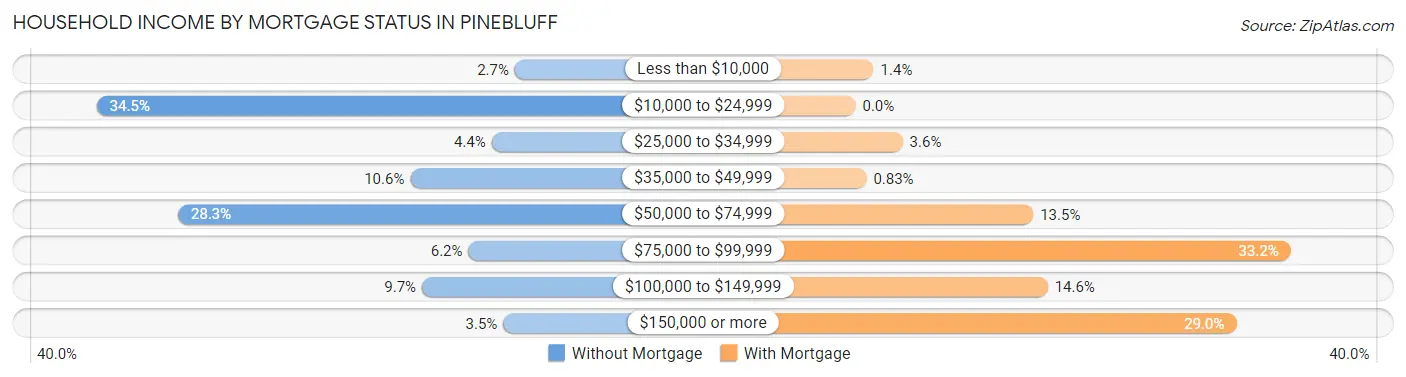
| Household Income | Without Mortgage | With Mortgage |
| Less than $10,000 | 3 (2.6%) | 5 (1.4%) |
| $10,000 to $24,999 | 39 (34.5%) | 0 (0.0%) |
| $25,000 to $34,999 | 5 (4.4%) | 13 (3.6%) |
| $35,000 to $49,999 | 12 (10.6%) | 3 (0.8%) |
| $50,000 to $74,999 | 32 (28.3%) | 49 (13.5%) |
| $75,000 to $99,999 | 7 (6.2%) | 120 (33.2%) |
| $100,000 to $149,999 | 11 (9.7%) | 53 (14.6%) |
| $150,000 or more | 4 (3.5%) | 105 (29.0%) |
| Total | 113 (100.0%) | 362 (100.0%) |
Property Value to Household Income Ratio in Pinebluff
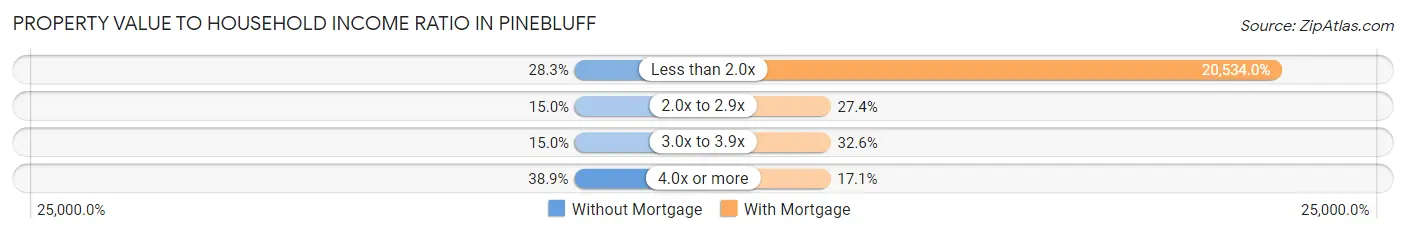
| Value-to-Income Ratio | Without Mortgage | With Mortgage |
| Less than 2.0x | 32 (28.3%) | 74,333 (20,534.0%) |
| 2.0x to 2.9x | 17 (15.0%) | 99 (27.4%) |
| 3.0x to 3.9x | 17 (15.0%) | 118 (32.6%) |
| 4.0x or more | 44 (38.9%) | 62 (17.1%) |
| Total | 113 (100.0%) | 362 (100.0%) |
Real Estate Taxes by Mortgage Status in Pinebluff
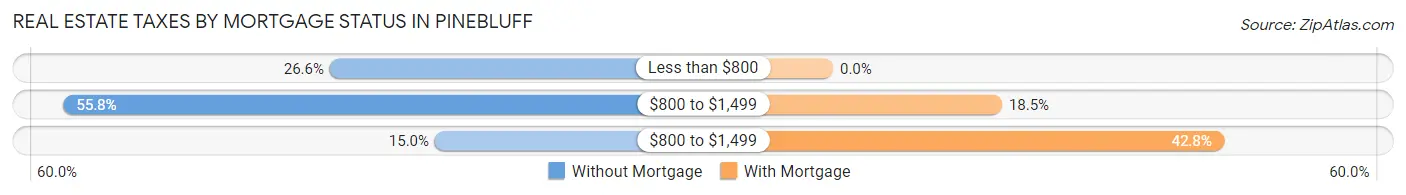
| Property Taxes | Without Mortgage | With Mortgage |
| Less than $800 | 30 (26.6%) | 0 (0.0%) |
| $800 to $1,499 | 63 (55.7%) | 67 (18.5%) |
| $800 to $1,499 | 17 (15.0%) | 155 (42.8%) |
| Total | 113 (100.0%) | 362 (100.0%) |
Health & Disability in Pinebluff
Health Insurance Coverage by Age in Pinebluff
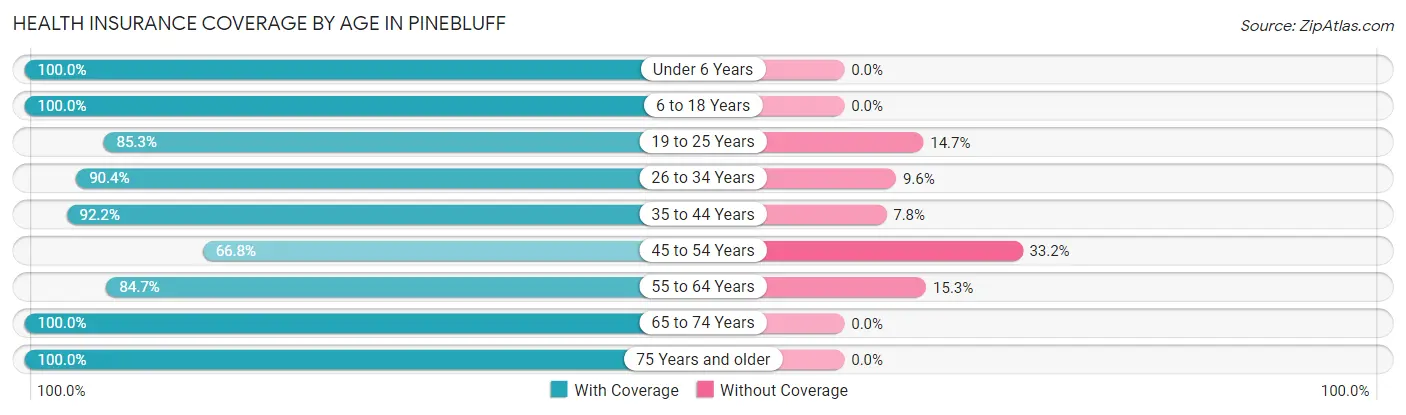
| Age Bracket | With Coverage | Without Coverage |
| Under 6 Years | 207 (100.0%) | 0 (0.0%) |
| 6 to 18 Years | 251 (100.0%) | 0 (0.0%) |
| 19 to 25 Years | 110 (85.3%) | 19 (14.7%) |
| 26 to 34 Years | 169 (90.4%) | 18 (9.6%) |
| 35 to 44 Years | 212 (92.2%) | 18 (7.8%) |
| 45 to 54 Years | 197 (66.8%) | 98 (33.2%) |
| 55 to 64 Years | 161 (84.7%) | 29 (15.3%) |
| 65 to 74 Years | 134 (100.0%) | 0 (0.0%) |
| 75 Years and older | 139 (100.0%) | 0 (0.0%) |
| Total | 1,580 (89.7%) | 182 (10.3%) |
Health Insurance Coverage by Citizenship Status in Pinebluff
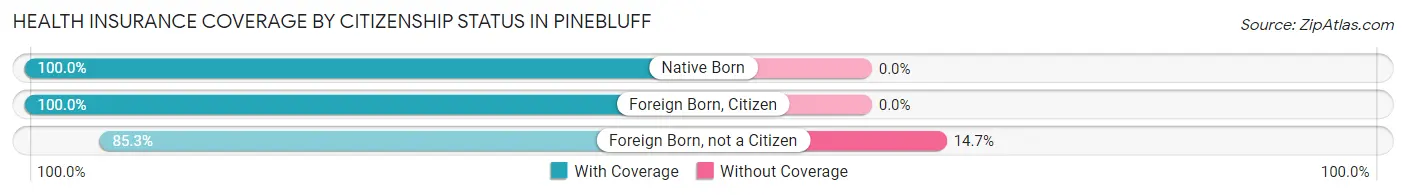
| Citizenship Status | With Coverage | Without Coverage |
| Native Born | 207 (100.0%) | 0 (0.0%) |
| Foreign Born, Citizen | 251 (100.0%) | 0 (0.0%) |
| Foreign Born, not a Citizen | 110 (85.3%) | 19 (14.7%) |
Health Insurance Coverage by Household Income in Pinebluff
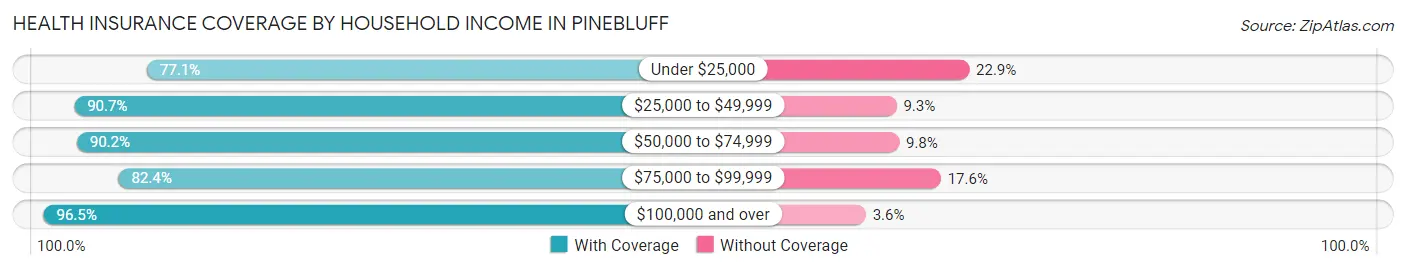
| Household Income | With Coverage | Without Coverage |
| Under $25,000 | 74 (77.1%) | 22 (22.9%) |
| $25,000 to $49,999 | 390 (90.7%) | 40 (9.3%) |
| $50,000 to $74,999 | 304 (90.2%) | 33 (9.8%) |
| $75,000 to $99,999 | 323 (82.4%) | 69 (17.6%) |
| $100,000 and over | 489 (96.5%) | 18 (3.5%) |
Public vs Private Health Insurance Coverage by Age in Pinebluff
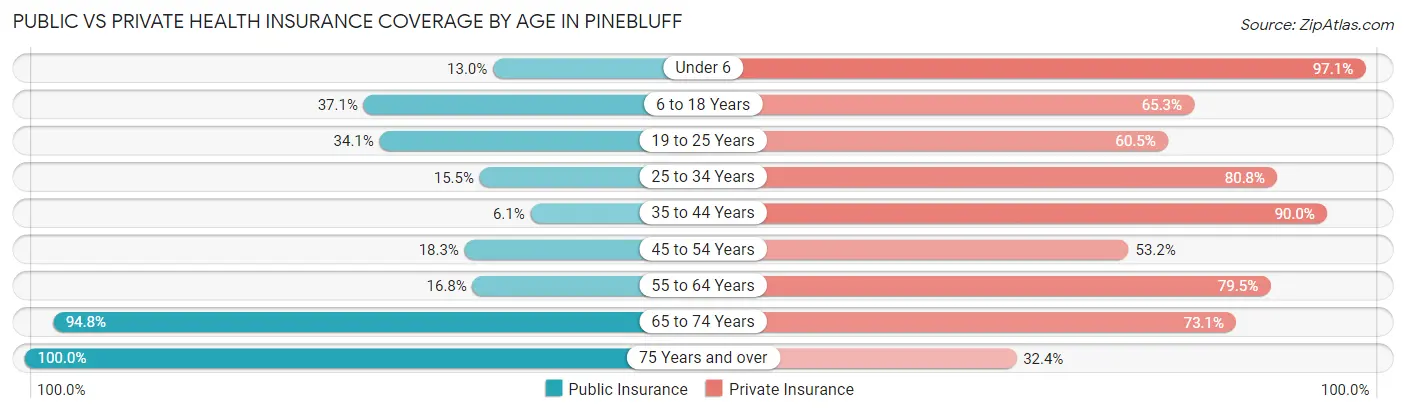
| Age Bracket | Public Insurance | Private Insurance |
| Under 6 | 27 (13.0%) | 201 (97.1%) |
| 6 to 18 Years | 93 (37.0%) | 164 (65.3%) |
| 19 to 25 Years | 44 (34.1%) | 78 (60.5%) |
| 25 to 34 Years | 29 (15.5%) | 151 (80.7%) |
| 35 to 44 Years | 14 (6.1%) | 207 (90.0%) |
| 45 to 54 Years | 54 (18.3%) | 157 (53.2%) |
| 55 to 64 Years | 32 (16.8%) | 151 (79.5%) |
| 65 to 74 Years | 127 (94.8%) | 98 (73.1%) |
| 75 Years and over | 139 (100.0%) | 45 (32.4%) |
| Total | 559 (31.7%) | 1,252 (71.1%) |
Disability Status by Sex by Age in Pinebluff
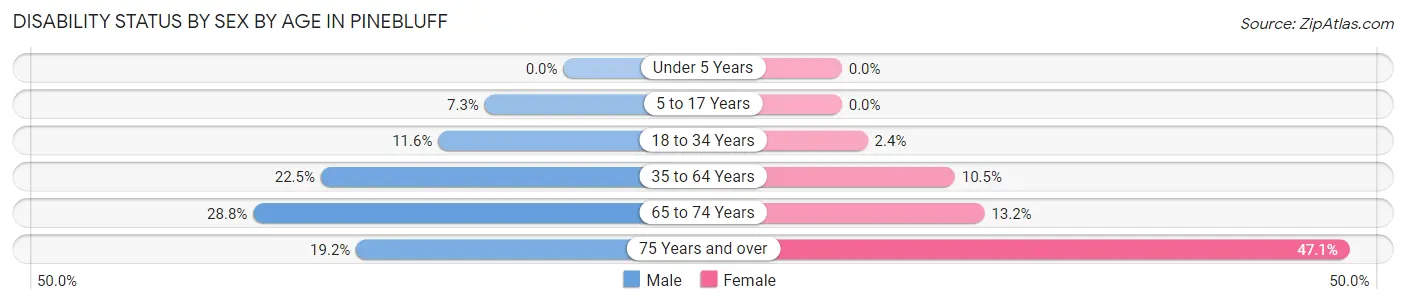
| Age Bracket | Male | Female |
| Under 5 Years | 0 (0.0%) | 0 (0.0%) |
| 5 to 17 Years | 13 (7.3%) | 0 (0.0%) |
| 18 to 34 Years | 18 (11.6%) | 4 (2.4%) |
| 35 to 64 Years | 88 (22.5%) | 34 (10.5%) |
| 65 to 74 Years | 19 (28.8%) | 9 (13.2%) |
| 75 Years and over | 10 (19.2%) | 41 (47.1%) |
Disability Class by Sex by Age in Pinebluff
Disability Class: Hearing Difficulty
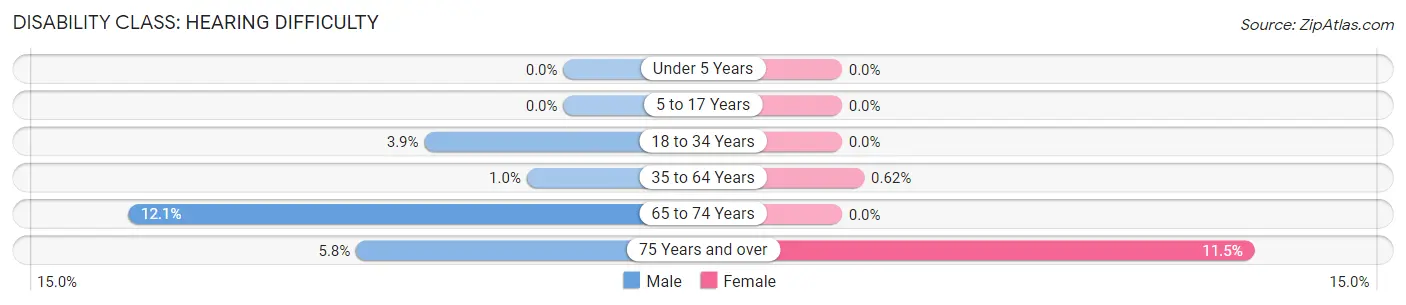
| Age Bracket | Male | Female |
| Under 5 Years | 0 (0.0%) | 0 (0.0%) |
| 5 to 17 Years | 0 (0.0%) | 0 (0.0%) |
| 18 to 34 Years | 6 (3.9%) | 0 (0.0%) |
| 35 to 64 Years | 4 (1.0%) | 2 (0.6%) |
| 65 to 74 Years | 8 (12.1%) | 0 (0.0%) |
| 75 Years and over | 3 (5.8%) | 10 (11.5%) |
Disability Class: Vision Difficulty
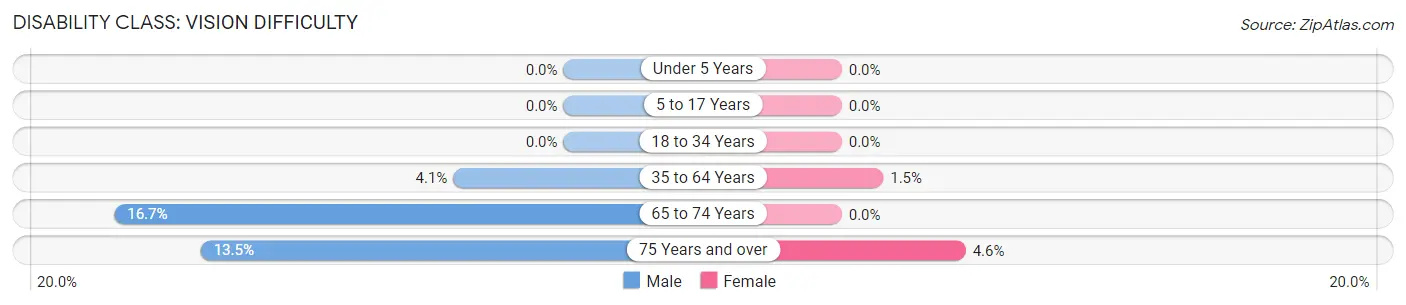
| Age Bracket | Male | Female |
| Under 5 Years | 0 (0.0%) | 0 (0.0%) |
| 5 to 17 Years | 0 (0.0%) | 0 (0.0%) |
| 18 to 34 Years | 0 (0.0%) | 0 (0.0%) |
| 35 to 64 Years | 16 (4.1%) | 5 (1.5%) |
| 65 to 74 Years | 11 (16.7%) | 0 (0.0%) |
| 75 Years and over | 7 (13.5%) | 4 (4.6%) |
Disability Class: Cognitive Difficulty
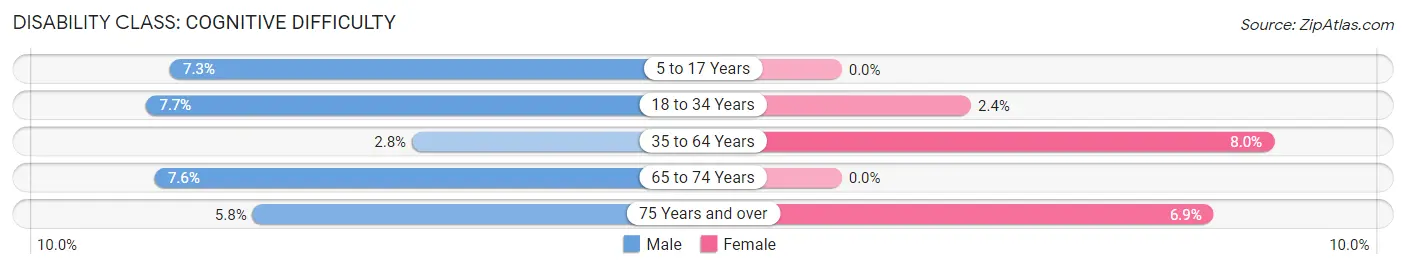
| Age Bracket | Male | Female |
| 5 to 17 Years | 13 (7.3%) | 0 (0.0%) |
| 18 to 34 Years | 12 (7.7%) | 4 (2.4%) |
| 35 to 64 Years | 11 (2.8%) | 26 (8.0%) |
| 65 to 74 Years | 5 (7.6%) | 0 (0.0%) |
| 75 Years and over | 3 (5.8%) | 6 (6.9%) |
Disability Class: Ambulatory Difficulty
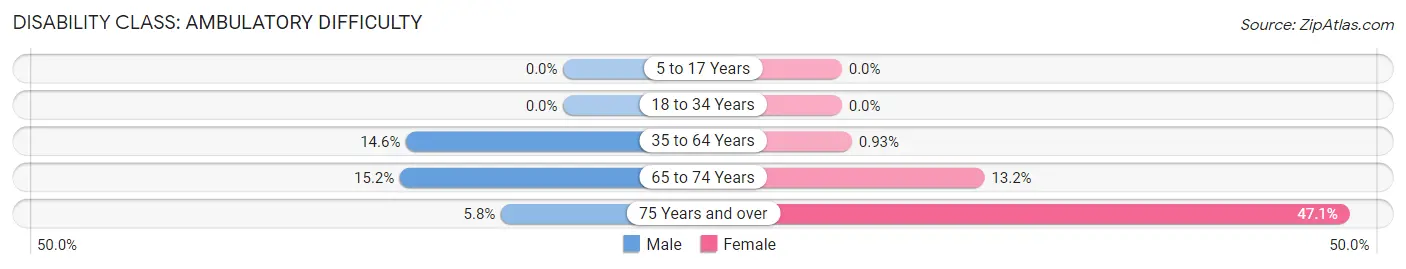
| Age Bracket | Male | Female |
| 5 to 17 Years | 0 (0.0%) | 0 (0.0%) |
| 18 to 34 Years | 0 (0.0%) | 0 (0.0%) |
| 35 to 64 Years | 57 (14.6%) | 3 (0.9%) |
| 65 to 74 Years | 10 (15.1%) | 9 (13.2%) |
| 75 Years and over | 3 (5.8%) | 41 (47.1%) |
Disability Class: Self-Care Difficulty
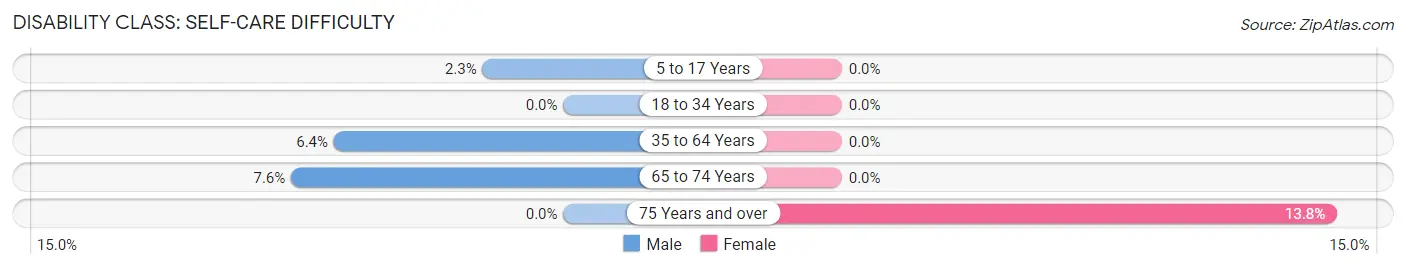
| Age Bracket | Male | Female |
| 5 to 17 Years | 4 (2.2%) | 0 (0.0%) |
| 18 to 34 Years | 0 (0.0%) | 0 (0.0%) |
| 35 to 64 Years | 25 (6.4%) | 0 (0.0%) |
| 65 to 74 Years | 5 (7.6%) | 0 (0.0%) |
| 75 Years and over | 0 (0.0%) | 12 (13.8%) |
Technology Access in Pinebluff
Computing Device Access in Pinebluff
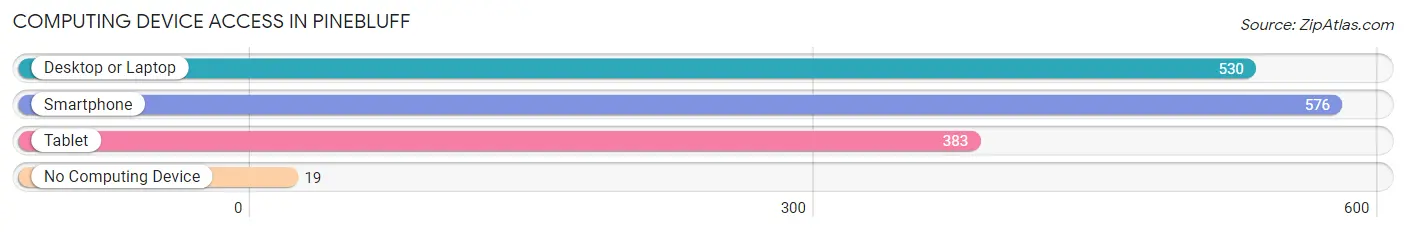
| Device Type | # Households | % Households |
| Desktop or Laptop | 530 | 84.5% |
| Smartphone | 576 | 91.9% |
| Tablet | 383 | 61.1% |
| No Computing Device | 19 | 3.0% |
| Total | 627 | 100.0% |
Internet Access in Pinebluff
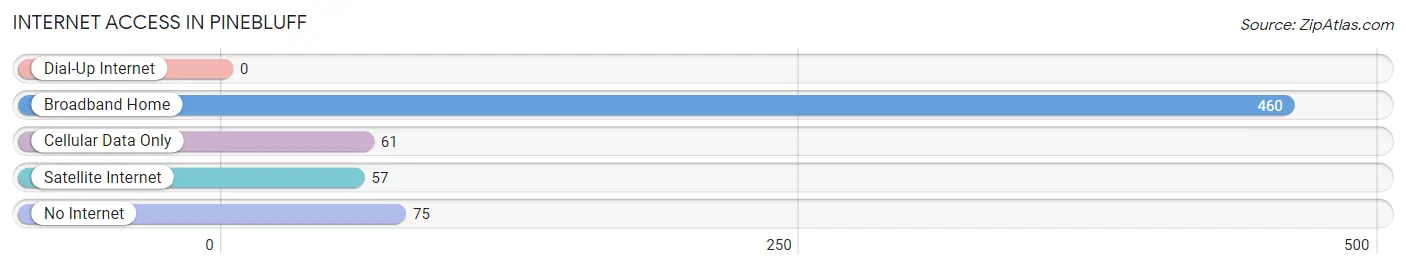
| Internet Type | # Households | % Households |
| Dial-Up Internet | 0 | 0.0% |
| Broadband Home | 460 | 73.4% |
| Cellular Data Only | 61 | 9.7% |
| Satellite Internet | 57 | 9.1% |
| No Internet | 75 | 12.0% |
| Total | 627 | 100.0% |
Pinebluff Summary
Pinebluff, North Carolina is a small town located in Moore County, North Carolina. It is situated in the Sandhills region of the state, and is part of the Fayetteville Metropolitan Statistical Area. The town has a population of approximately 1,500 people, and is known for its rural charm and friendly atmosphere.
History
Pinebluff was first settled in the late 1700s by a group of settlers from Scotland. The town was originally known as “Piney Bluff”, and was named after the abundance of pine trees in the area. The town was officially incorporated in 1891, and was named after the nearby Pinebluff Creek.
In the early 1900s, Pinebluff was a thriving agricultural community, with cotton, tobacco, and corn being the main crops. The town also had a thriving lumber industry, with several sawmills located in the area.
In the 1950s, Pinebluff began to experience a decline in population as many of the town’s residents moved away in search of better job opportunities. However, the town has experienced a resurgence in recent years, with many new businesses and residents moving to the area.
Geography
Pinebluff is located in the Sandhills region of North Carolina, and is situated in the southeastern part of Moore County. The town is located approximately 25 miles south of Fayetteville, and is bordered by the towns of Aberdeen, Southern Pines, and Carthage.
The town is situated on the banks of the Pinebluff Creek, and is surrounded by rolling hills and forests. The town is located at an elevation of approximately 500 feet above sea level.
Economy
Pinebluff’s economy is largely based on agriculture and tourism. The town is home to several farms, which produce a variety of crops, including cotton, tobacco, corn, and soybeans. The town also has a thriving lumber industry, with several sawmills located in the area.
In addition, Pinebluff is home to several small businesses, including restaurants, retail stores, and service providers. The town is also home to several tourist attractions, including the Pinebluff Museum and the Pinebluff Nature Preserve.
Demographics
As of the 2010 census, Pinebluff had a population of 1,500 people. The racial makeup of the town was 94.7% White, 2.7% African American, 0.7% Native American, 0.3% Asian, and 1.6% from other races. The median household income was $37,500, and the median age was 41.
Conclusion
Pinebluff, North Carolina is a small town located in Moore County, North Carolina. It is situated in the Sandhills region of the state, and is part of the Fayetteville Metropolitan Statistical Area. The town has a population of approximately 1,500 people, and is known for its rural charm and friendly atmosphere. The town’s economy is largely based on agriculture and tourism, and the town is home to several small businesses, farms, and tourist attractions. The town has a diverse population, with a median household income of $37,500 and a median age of 41.
Common Questions
What is Per Capita Income in Pinebluff?
Per Capita income in Pinebluff is $27,989.
What is the Median Family Income in Pinebluff?
Median Family Income in Pinebluff is $78,750.
What is the Median Household income in Pinebluff?
Median Household Income in Pinebluff is $70,750.
What is Income or Wage Gap in Pinebluff?
Income or Wage Gap in Pinebluff is 32.4%.
Women in Pinebluff earn 67.6 cents for every dollar earned by a man.
What is Inequality or Gini Index in Pinebluff?
Inequality or Gini Index in Pinebluff is 0.31.
What is the Total Population of Pinebluff?
Total Population of Pinebluff is 1,767.
What is the Total Male Population of Pinebluff?
Total Male Population of Pinebluff is 944.
What is the Total Female Population of Pinebluff?
Total Female Population of Pinebluff is 823.
What is the Ratio of Males per 100 Females in Pinebluff?
There are 114.70 Males per 100 Females in Pinebluff.
What is the Ratio of Females per 100 Males in Pinebluff?
There are 87.18 Females per 100 Males in Pinebluff.
What is the Median Population Age in Pinebluff?
Median Population Age in Pinebluff is 39.4 Years.
What is the Average Family Size in Pinebluff
Average Family Size in Pinebluff is 3.5 People.
What is the Average Household Size in Pinebluff
Average Household Size in Pinebluff is 2.8 People.
How Large is the Labor Force in Pinebluff?
There are 785 People in the Labor Forcein in Pinebluff.
What is the Percentage of People in the Labor Force in Pinebluff?
58.5% of People are in the Labor Force in Pinebluff.
What is the Unemployment Rate in Pinebluff?
Unemployment Rate in Pinebluff is 4.7%.