Bayard, NE Map & Demographics
Bayard Map
Bayard Overview
$27,099
PER CAPITA INCOME
$79,899
AVG FAMILY INCOME
$60,000
AVG HOUSEHOLD INCOME
6.6%
WAGE / INCOME GAP [ % ]
93.4¢/ $1
WAGE / INCOME GAP [ $ ]
0.41
INEQUALITY / GINI INDEX
1,435
TOTAL POPULATION
748
MALE POPULATION
687
FEMALE POPULATION
108.88
MALES / 100 FEMALES
91.84
FEMALES / 100 MALES
38.2
MEDIAN AGE
3.5
AVG FAMILY SIZE
2.6
AVG HOUSEHOLD SIZE
750
LABOR FORCE [ PEOPLE ]
63.2%
PERCENT IN LABOR FORCE
2.4%
UNEMPLOYMENT RATE
Bayard Zip Codes
Bayard Area Codes
Income in Bayard
Income Overview in Bayard
Per Capita Income in Bayard is $27,099, while median incomes of families and households are $79,899 and $60,000 respectively.
| Characteristic | Number | Measure |
| Per Capita Income | 1,435 | $27,099 |
| Median Family Income | 339 | $79,899 |
| Mean Family Income | 339 | $91,643 |
| Median Household Income | 532 | $60,000 |
| Mean Household Income | 532 | $73,179 |
| Income Deficit | 339 | $0 |
| Wage / Income Gap (%) | 1,435 | 6.64% |
| Wage / Income Gap ($) | 1,435 | 93.36¢ per $1 |
| Gini / Inequality Index | 1,435 | 0.41 |
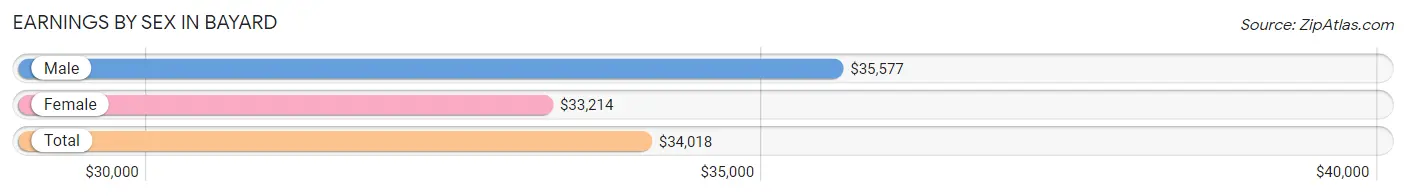
Earnings by Sex in Bayard
Average Earnings in Bayard are $34,018, $35,577 for men and $33,214 for women, a difference of 6.6%.
| Sex | Number | Average Earnings |
| Male | 442 (56.5%) | $35,577 |
| Female | 340 (43.5%) | $33,214 |
| Total | 782 (100.0%) | $34,018 |
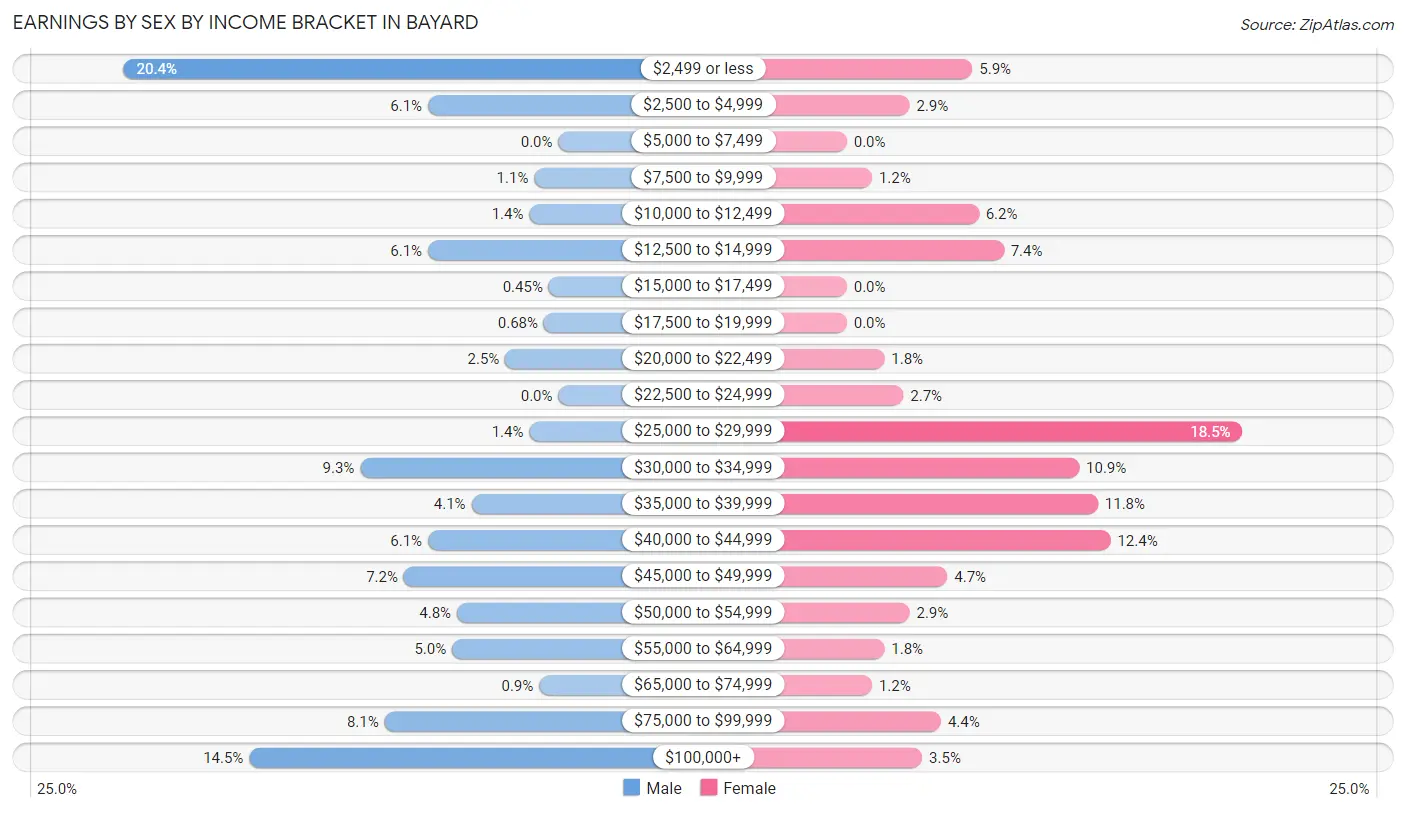
Earnings by Sex by Income Bracket in Bayard
The most common earnings brackets in Bayard are $2,499 or less for men (90 | 20.4%) and $25,000 to $29,999 for women (63 | 18.5%).
| Income | Male | Female |
| $2,499 or less | 90 (20.4%) | 20 (5.9%) |
| $2,500 to $4,999 | 27 (6.1%) | 10 (2.9%) |
| $5,000 to $7,499 | 0 (0.0%) | 0 (0.0%) |
| $7,500 to $9,999 | 5 (1.1%) | 4 (1.2%) |
| $10,000 to $12,499 | 6 (1.4%) | 21 (6.2%) |
| $12,500 to $14,999 | 27 (6.1%) | 25 (7.3%) |
| $15,000 to $17,499 | 2 (0.4%) | 0 (0.0%) |
| $17,500 to $19,999 | 3 (0.7%) | 0 (0.0%) |
| $20,000 to $22,499 | 11 (2.5%) | 6 (1.8%) |
| $22,500 to $24,999 | 0 (0.0%) | 9 (2.6%) |
| $25,000 to $29,999 | 6 (1.4%) | 63 (18.5%) |
| $30,000 to $34,999 | 41 (9.3%) | 37 (10.9%) |
| $35,000 to $39,999 | 18 (4.1%) | 40 (11.8%) |
| $40,000 to $44,999 | 27 (6.1%) | 42 (12.3%) |
| $45,000 to $49,999 | 32 (7.2%) | 16 (4.7%) |
| $50,000 to $54,999 | 21 (4.8%) | 10 (2.9%) |
| $55,000 to $64,999 | 22 (5.0%) | 6 (1.8%) |
| $65,000 to $74,999 | 4 (0.9%) | 4 (1.2%) |
| $75,000 to $99,999 | 36 (8.1%) | 15 (4.4%) |
| $100,000+ | 64 (14.5%) | 12 (3.5%) |
| Total | 442 (100.0%) | 340 (100.0%) |
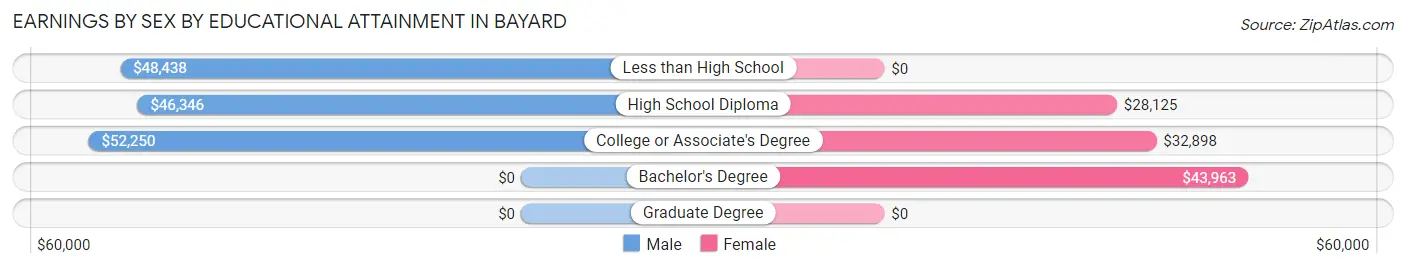
Earnings by Sex by Educational Attainment in Bayard
Average earnings in Bayard are $44,625 for men and $34,786 for women, a difference of 22.1%. Men with an educational attainment of college or associate's degree enjoy the highest average annual earnings of $52,250, while those with high school diploma education earn the least with $46,346. Women with an educational attainment of bachelor's degree earn the most with the average annual earnings of $43,963, while those with high school diploma education have the smallest earnings of $28,125.
| Educational Attainment | Male Income | Female Income |
| Less than High School | $48,438 | $0 |
| High School Diploma | $46,346 | $28,125 |
| College or Associate's Degree | $52,250 | $32,898 |
| Bachelor's Degree | - | - |
| Graduate Degree | - | - |
| Total | $44,625 | $34,786 |
Family Income in Bayard
Family Income Brackets in Bayard
According to the Bayard family income data, there are 87 families falling into the $75,000 to $99,999 income range, which is the most common income bracket and makes up 25.7% of all families.
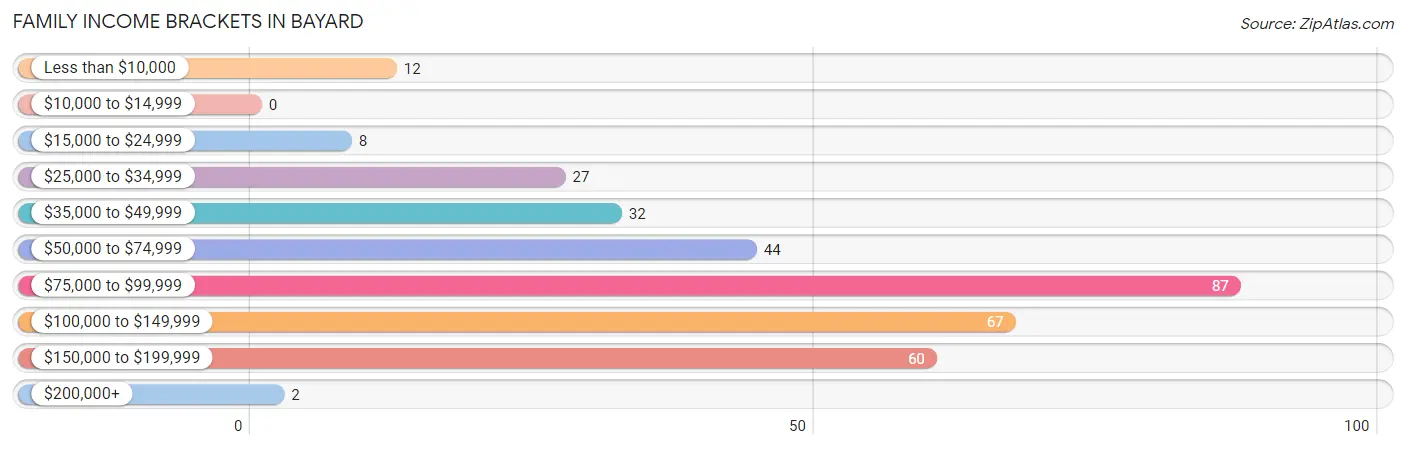
| Income Bracket | # Families | % Families |
| Less than $10,000 | 12 | 3.5% |
| $10,000 to $14,999 | 0 | 0.0% |
| $15,000 to $24,999 | 8 | 2.4% |
| $25,000 to $34,999 | 27 | 8.0% |
| $35,000 to $49,999 | 32 | 9.4% |
| $50,000 to $74,999 | 44 | 13.0% |
| $75,000 to $99,999 | 87 | 25.7% |
| $100,000 to $149,999 | 67 | 19.8% |
| $150,000 to $199,999 | 60 | 17.7% |
| $200,000+ | 2 | 0.6% |
Family Income by Famaliy Size in Bayard
4-person families (75 | 22.1%) account for the highest median family income in Bayard with $118,869 per family, while 2-person families (150 | 44.3%) have the highest median income of $37,222 per family member.
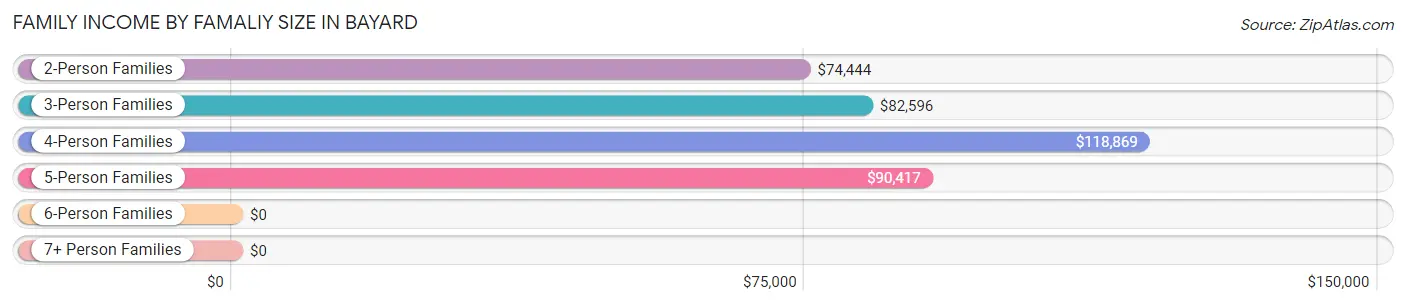
| Income Bracket | # Families | Median Income |
| 2-Person Families | 150 (44.3%) | $74,444 |
| 3-Person Families | 33 (9.7%) | $82,596 |
| 4-Person Families | 75 (22.1%) | $118,869 |
| 5-Person Families | 81 (23.9%) | $90,417 |
| 6-Person Families | 0 (0.0%) | $0 |
| 7+ Person Families | 0 (0.0%) | $0 |
| Total | 339 (100.0%) | $79,899 |
Family Income by Number of Earners in Bayard
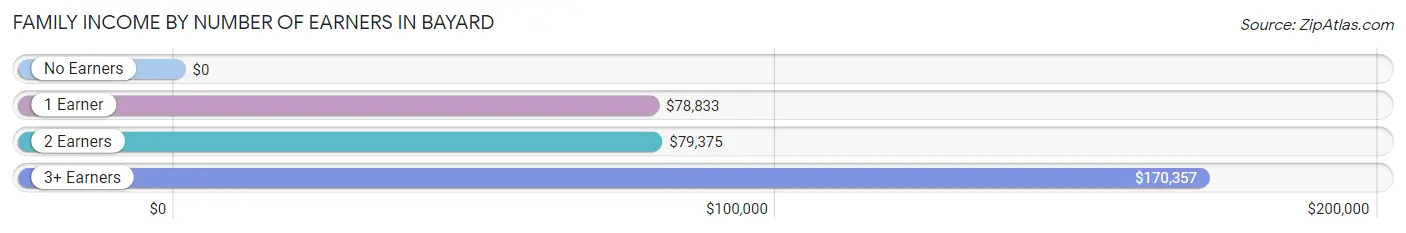
| Number of Earners | # Families | Median Income |
| No Earners | 23 (6.8%) | $0 |
| 1 Earner | 92 (27.1%) | $78,833 |
| 2 Earners | 162 (47.8%) | $79,375 |
| 3+ Earners | 62 (18.3%) | $170,357 |
| Total | 339 (100.0%) | $79,899 |
Household Income in Bayard
Household Income Brackets in Bayard
With 83 households falling in the category, the $75,000 to $99,999 income range is the most frequent in Bayard, accounting for 15.6% of all households. In contrast, only 14 households (2.6%) fall into the $200,000+ income bracket, making it the least populous group.
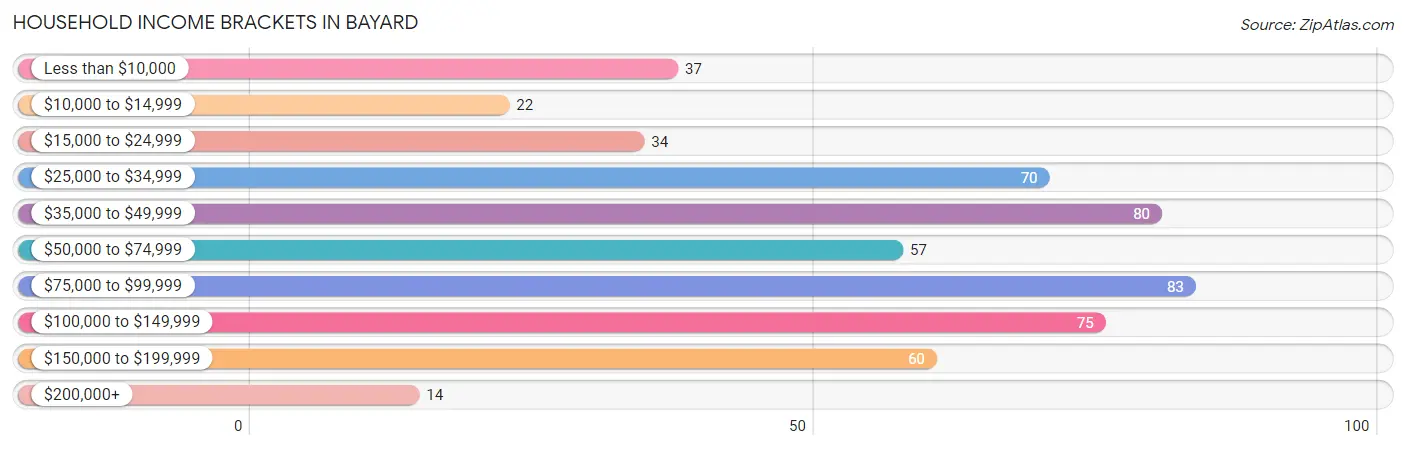
| Income Bracket | # Households | % Households |
| Less than $10,000 | 37 | 7.0% |
| $10,000 to $14,999 | 22 | 4.1% |
| $15,000 to $24,999 | 34 | 6.4% |
| $25,000 to $34,999 | 70 | 13.2% |
| $35,000 to $49,999 | 80 | 15.0% |
| $50,000 to $74,999 | 57 | 10.7% |
| $75,000 to $99,999 | 83 | 15.6% |
| $100,000 to $149,999 | 75 | 14.1% |
| $150,000 to $199,999 | 60 | 11.3% |
| $200,000+ | 14 | 2.6% |
Household Income by Householder Age in Bayard
The median household income in Bayard is $60,000, with the highest median household income of $117,863 found in the 25 to 44 years age bracket for the primary householder. A total of 177 households (33.3%) fall into this category. Meanwhile, the 15 to 24 years age bracket for the primary householder has the lowest median household income of $0, with 5 households (0.9%) in this group.
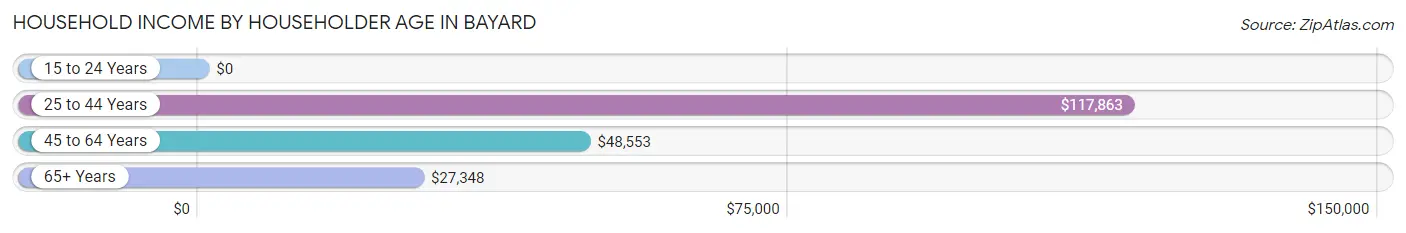
| Income Bracket | # Households | Median Income |
| 15 to 24 Years | 5 (0.9%) | $0 |
| 25 to 44 Years | 177 (33.3%) | $117,863 |
| 45 to 64 Years | 172 (32.3%) | $48,553 |
| 65+ Years | 178 (33.5%) | $27,348 |
| Total | 532 (100.0%) | $60,000 |
Poverty in Bayard
Income Below Poverty by Sex and Age in Bayard
With 4.8% poverty level for males and 9.5% for females among the residents of Bayard, 15 year old males and 75 year old and over females are the most vulnerable to poverty, with 9 males (37.5%) and 29 females (48.3%) in their respective age groups living below the poverty level.
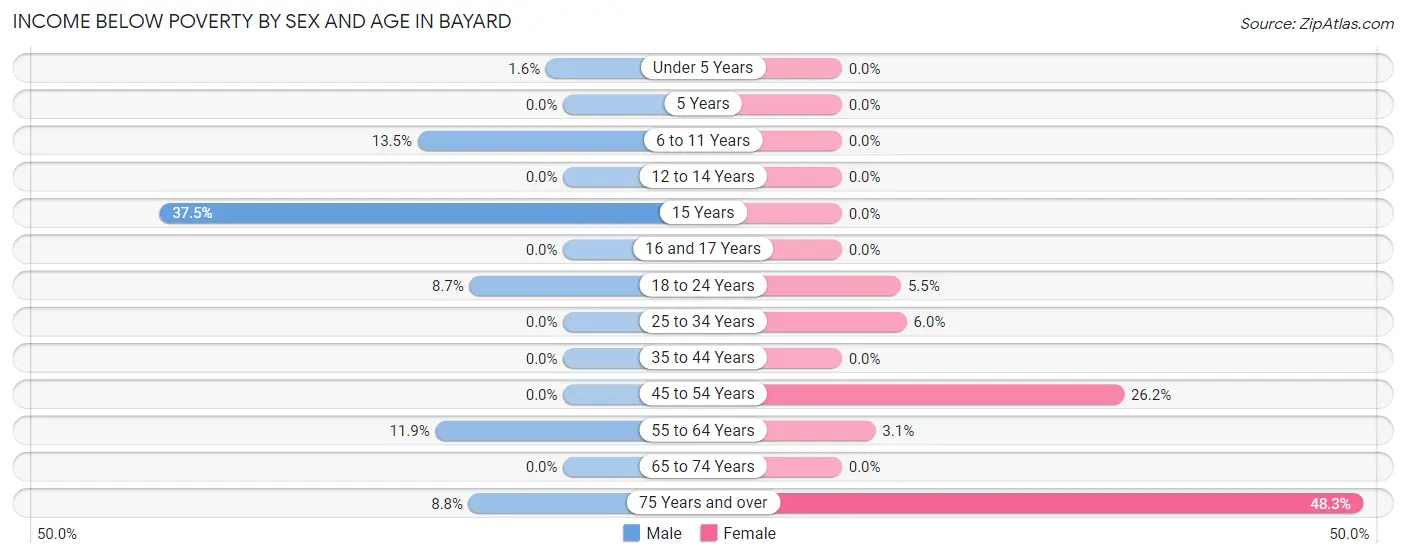
| Age Bracket | Male | Female |
| Under 5 Years | 1 (1.6%) | 0 (0.0%) |
| 5 Years | 0 (0.0%) | 0 (0.0%) |
| 6 to 11 Years | 5 (13.5%) | 0 (0.0%) |
| 12 to 14 Years | 0 (0.0%) | 0 (0.0%) |
| 15 Years | 9 (37.5%) | 0 (0.0%) |
| 16 and 17 Years | 0 (0.0%) | 0 (0.0%) |
| 18 to 24 Years | 8 (8.7%) | 5 (5.5%) |
| 25 to 34 Years | 0 (0.0%) | 5 (6.0%) |
| 35 to 44 Years | 0 (0.0%) | 0 (0.0%) |
| 45 to 54 Years | 0 (0.0%) | 22 (26.2%) |
| 55 to 64 Years | 7 (11.9%) | 2 (3.1%) |
| 65 to 74 Years | 0 (0.0%) | 0 (0.0%) |
| 75 Years and over | 5 (8.8%) | 29 (48.3%) |
| Total | 35 (4.8%) | 63 (9.5%) |
Income Above Poverty by Sex and Age in Bayard
According to the poverty statistics in Bayard, males aged 5 years and females aged under 5 years are the age groups that are most secure financially, with 100.0% of males and 100.0% of females in these age groups living above the poverty line.
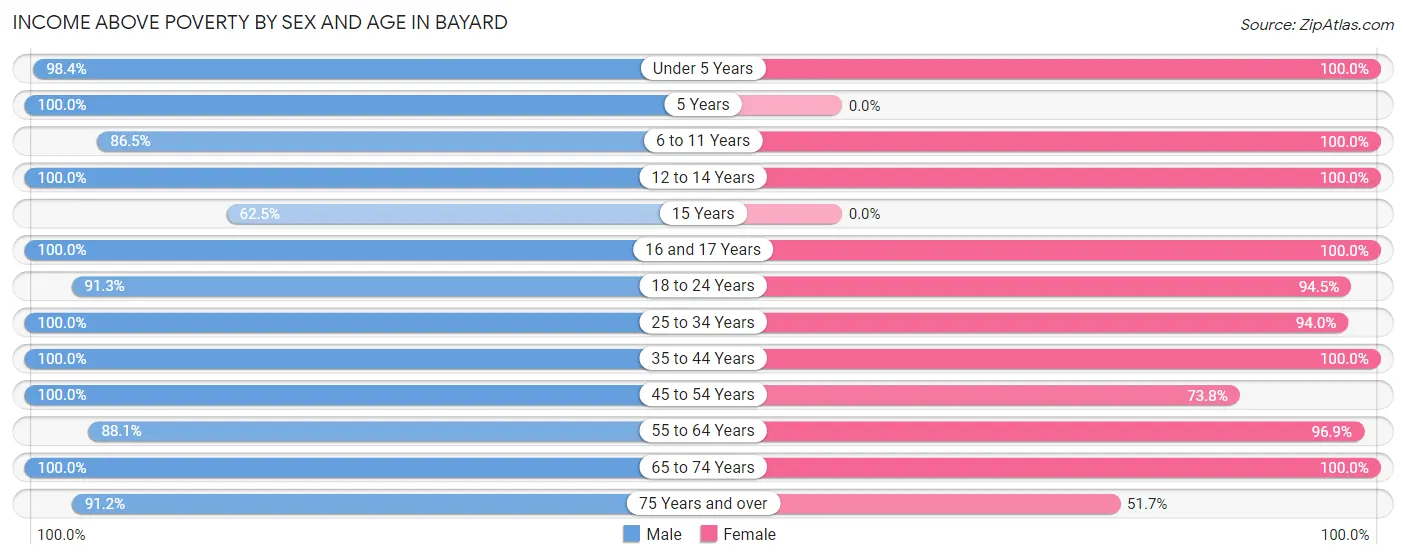
| Age Bracket | Male | Female |
| Under 5 Years | 61 (98.4%) | 46 (100.0%) |
| 5 Years | 4 (100.0%) | 0 (0.0%) |
| 6 to 11 Years | 32 (86.5%) | 45 (100.0%) |
| 12 to 14 Years | 12 (100.0%) | 19 (100.0%) |
| 15 Years | 15 (62.5%) | 0 (0.0%) |
| 16 and 17 Years | 54 (100.0%) | 16 (100.0%) |
| 18 to 24 Years | 84 (91.3%) | 86 (94.5%) |
| 25 to 34 Years | 93 (100.0%) | 78 (94.0%) |
| 35 to 44 Years | 102 (100.0%) | 104 (100.0%) |
| 45 to 54 Years | 62 (100.0%) | 62 (73.8%) |
| 55 to 64 Years | 52 (88.1%) | 62 (96.9%) |
| 65 to 74 Years | 75 (100.0%) | 52 (100.0%) |
| 75 Years and over | 52 (91.2%) | 31 (51.7%) |
| Total | 698 (95.2%) | 601 (90.5%) |
Income Below Poverty Among Married-Couple Families in Bayard
The poverty statistics for married-couple families in Bayard show that 0.7% or 2 of the total 276 families live below the poverty line. Families with no children have the highest poverty rate of 1.6%, comprising of 2 families. On the other hand, families with 1 or 2 children have the lowest poverty rate of 0.0%, which includes 0 families.
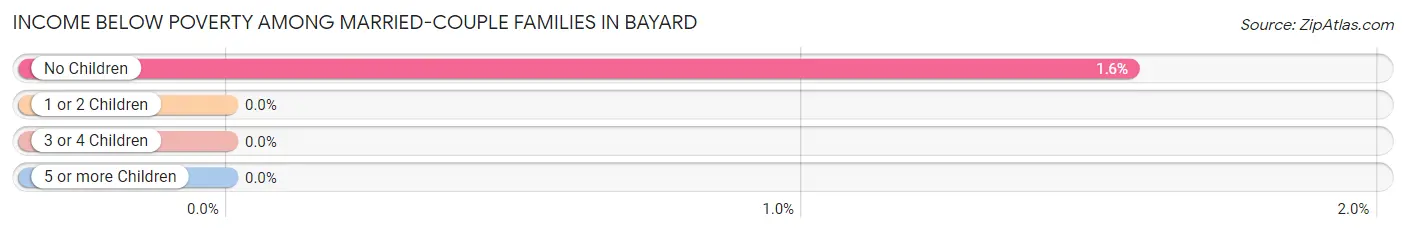
| Children | Above Poverty | Below Poverty |
| No Children | 125 (98.4%) | 2 (1.6%) |
| 1 or 2 Children | 130 (100.0%) | 0 (0.0%) |
| 3 or 4 Children | 19 (100.0%) | 0 (0.0%) |
| 5 or more Children | 0 (0.0%) | 0 (0.0%) |
| Total | 274 (99.3%) | 2 (0.7%) |
Income Below Poverty Among Single-Parent Households in Bayard
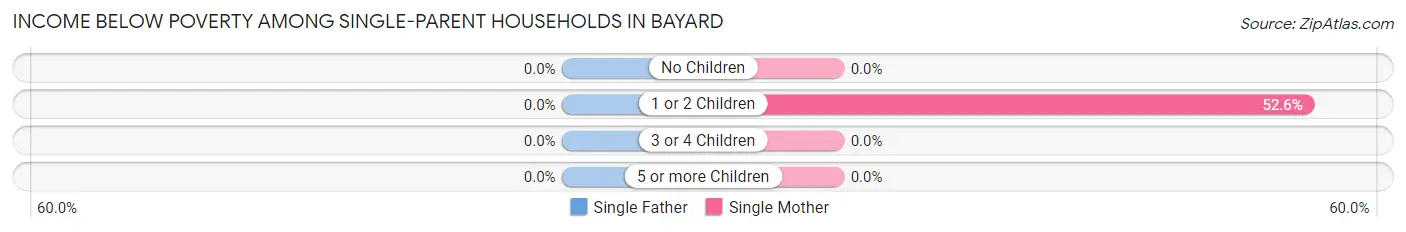
| Children | Single Father | Single Mother |
| No Children | 0 (0.0%) | 0 (0.0%) |
| 1 or 2 Children | 0 (0.0%) | 10 (52.6%) |
| 3 or 4 Children | 0 (0.0%) | 0 (0.0%) |
| 5 or more Children | 0 (0.0%) | 0 (0.0%) |
| Total | 0 (0.0%) | 10 (18.2%) |
Income Below Poverty Among Married-Couple vs Single-Parent Households in Bayard
The poverty data for Bayard shows that 2 of the married-couple family households (0.7%) and 10 of the single-parent households (15.9%) are living below the poverty level. Within the married-couple family households, those with no children have the highest poverty rate, with 2 households (1.6%) falling below the poverty line. Among the single-parent households, those with 1 or 2 children have the highest poverty rate, with 10 household (52.6%) living below poverty.
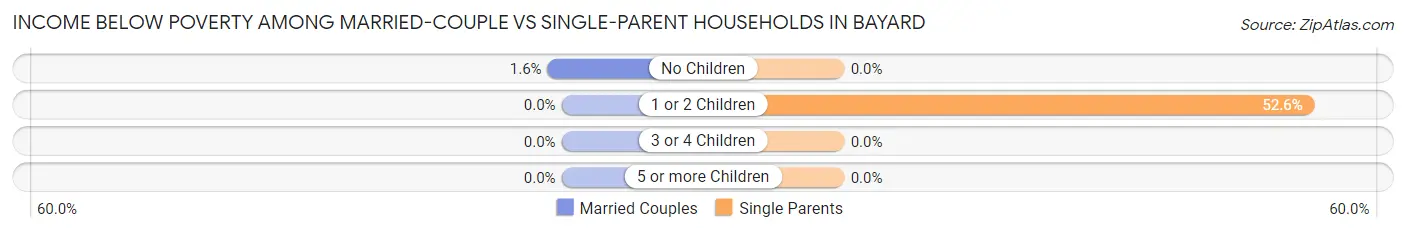
| Children | Married-Couple Families | Single-Parent Households |
| No Children | 2 (1.6%) | 0 (0.0%) |
| 1 or 2 Children | 0 (0.0%) | 10 (52.6%) |
| 3 or 4 Children | 0 (0.0%) | 0 (0.0%) |
| 5 or more Children | 0 (0.0%) | 0 (0.0%) |
| Total | 2 (0.7%) | 10 (15.9%) |
Race in Bayard
The most populous races in Bayard are White / Caucasian (1,034 | 72.1%), Hispanic or Latino (381 | 26.6%), and Two or more Races (278 | 19.4%).
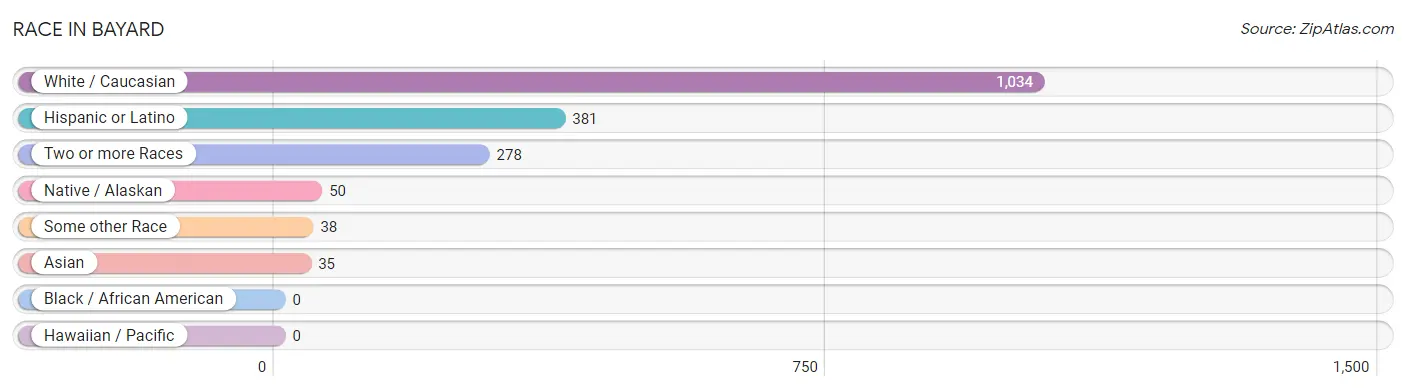
| Race | # Population | % Population |
| Asian | 35 | 2.4% |
| Black / African American | 0 | 0.0% |
| Hawaiian / Pacific | 0 | 0.0% |
| Hispanic or Latino | 381 | 26.6% |
| Native / Alaskan | 50 | 3.5% |
| White / Caucasian | 1,034 | 72.1% |
| Two or more Races | 278 | 19.4% |
| Some other Race | 38 | 2.6% |
| Total | 1,435 | 100.0% |
Ancestry in Bayard
The most populous ancestries reported in Bayard are Mexican (374 | 26.1%), German (357 | 24.9%), Irish (95 | 6.6%), English (70 | 4.9%), and Danish (61 | 4.3%), together accounting for 66.7% of all Bayard residents.
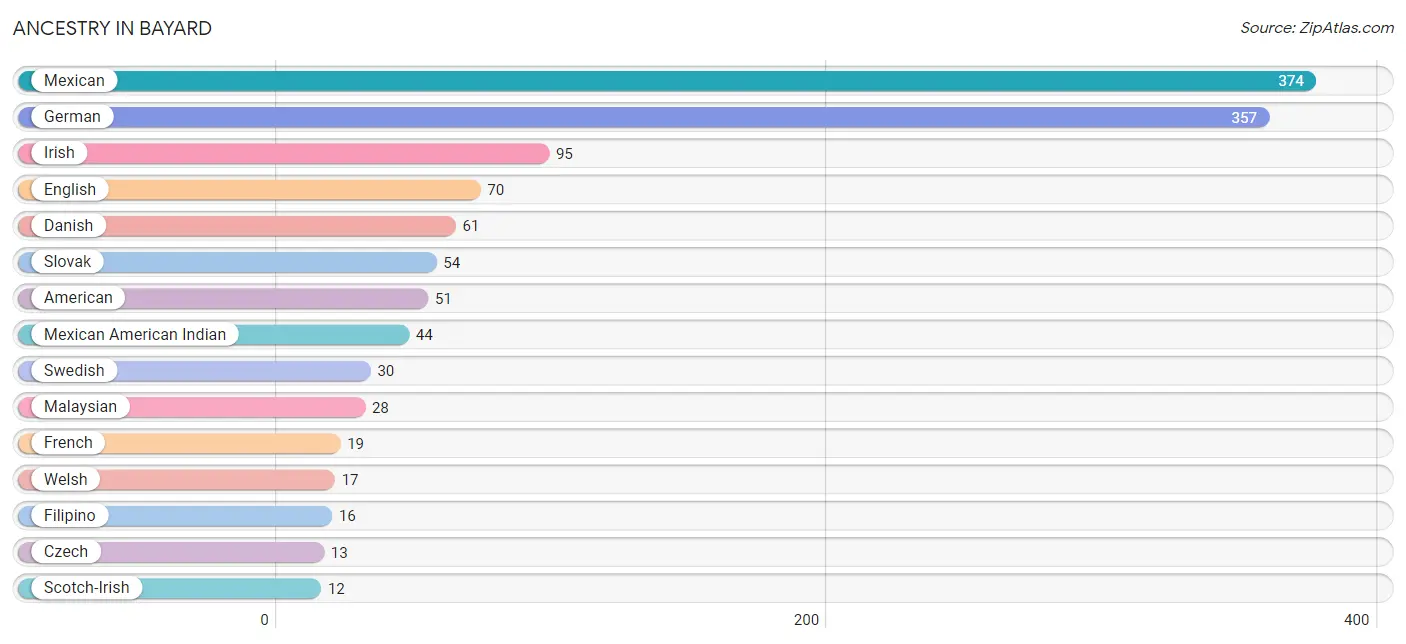
| Ancestry | # Population | % Population |
| American | 51 | 3.5% |
| Apache | 6 | 0.4% |
| Blackfeet | 5 | 0.4% |
| Canadian | 6 | 0.4% |
| Czech | 13 | 0.9% |
| Danish | 61 | 4.3% |
| Dutch | 11 | 0.8% |
| English | 70 | 4.9% |
| European | 6 | 0.4% |
| Filipino | 16 | 1.1% |
| French | 19 | 1.3% |
| German | 357 | 24.9% |
| German Russian | 2 | 0.1% |
| Greek | 6 | 0.4% |
| Irish | 95 | 6.6% |
| Iroquois | 4 | 0.3% |
| Italian | 11 | 0.8% |
| Malaysian | 28 | 1.9% |
| Mexican | 374 | 26.1% |
| Mexican American Indian | 44 | 3.1% |
| Norwegian | 3 | 0.2% |
| Polish | 2 | 0.1% |
| Russian | 10 | 0.7% |
| Scotch-Irish | 12 | 0.8% |
| Slovak | 54 | 3.8% |
| Spaniard | 2 | 0.1% |
| Swedish | 30 | 2.1% |
| Ukrainian | 2 | 0.1% |
| Welsh | 17 | 1.2% | View All 29 Rows |
Immigrants in Bayard
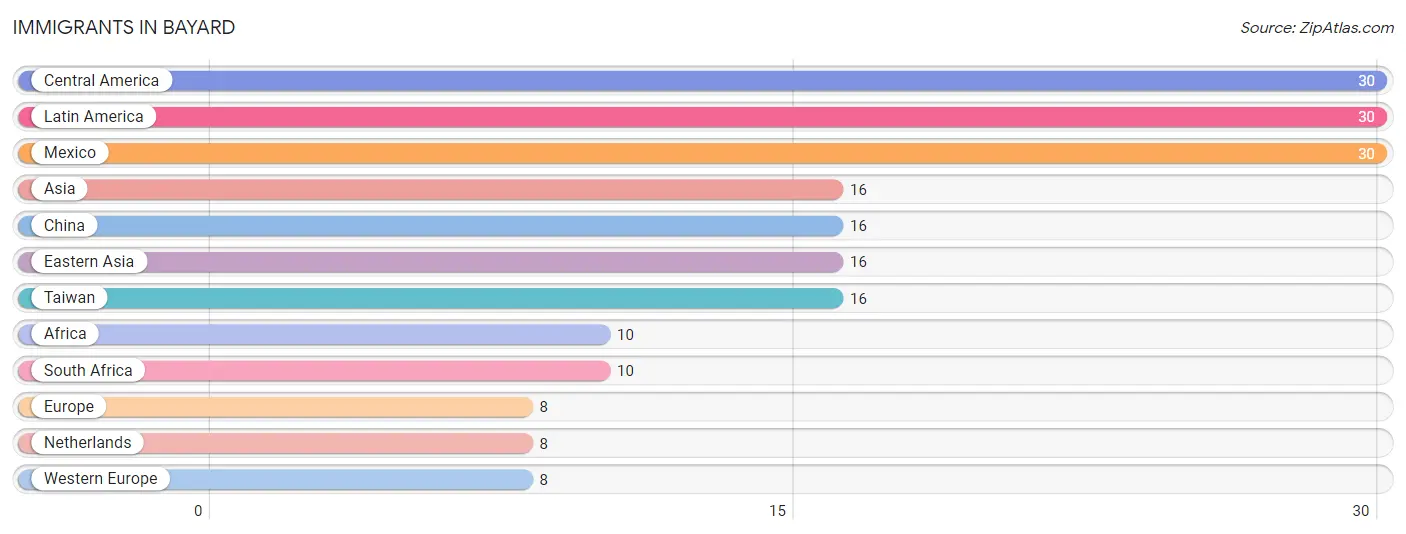
The most numerous immigrant groups reported in Bayard came from Central America (30 | 2.1%), Latin America (30 | 2.1%), Mexico (30 | 2.1%), Asia (16 | 1.1%), and China (16 | 1.1%), together accounting for 8.5% of all Bayard residents.
| Immigration Origin | # Population | % Population |
| Africa | 10 | 0.7% |
| Asia | 16 | 1.1% |
| Central America | 30 | 2.1% |
| China | 16 | 1.1% |
| Eastern Asia | 16 | 1.1% |
| Europe | 8 | 0.6% |
| Latin America | 30 | 2.1% |
| Mexico | 30 | 2.1% |
| Netherlands | 8 | 0.6% |
| South Africa | 10 | 0.7% |
| Taiwan | 16 | 1.1% |
| Western Europe | 8 | 0.6% | View All 12 Rows |
Sex and Age in Bayard
Sex and Age in Bayard
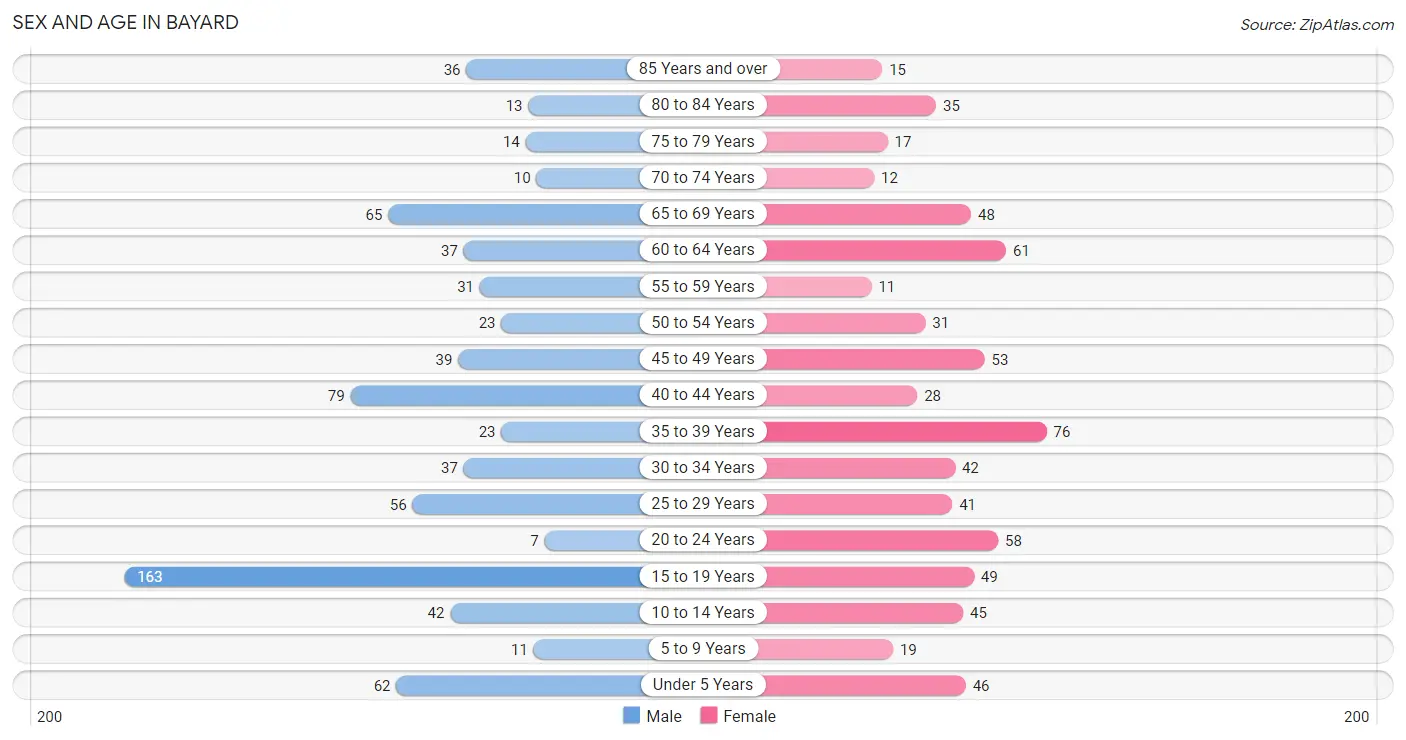
The most populous age groups in Bayard are 15 to 19 Years (163 | 21.8%) for men and 35 to 39 Years (76 | 11.1%) for women.
| Age Bracket | Male | Female |
| Under 5 Years | 62 (8.3%) | 46 (6.7%) |
| 5 to 9 Years | 11 (1.5%) | 19 (2.8%) |
| 10 to 14 Years | 42 (5.6%) | 45 (6.6%) |
| 15 to 19 Years | 163 (21.8%) | 49 (7.1%) |
| 20 to 24 Years | 7 (0.9%) | 58 (8.4%) |
| 25 to 29 Years | 56 (7.5%) | 41 (6.0%) |
| 30 to 34 Years | 37 (5.0%) | 42 (6.1%) |
| 35 to 39 Years | 23 (3.1%) | 76 (11.1%) |
| 40 to 44 Years | 79 (10.6%) | 28 (4.1%) |
| 45 to 49 Years | 39 (5.2%) | 53 (7.7%) |
| 50 to 54 Years | 23 (3.1%) | 31 (4.5%) |
| 55 to 59 Years | 31 (4.1%) | 11 (1.6%) |
| 60 to 64 Years | 37 (5.0%) | 61 (8.9%) |
| 65 to 69 Years | 65 (8.7%) | 48 (7.0%) |
| 70 to 74 Years | 10 (1.3%) | 12 (1.8%) |
| 75 to 79 Years | 14 (1.9%) | 17 (2.5%) |
| 80 to 84 Years | 13 (1.7%) | 35 (5.1%) |
| 85 Years and over | 36 (4.8%) | 15 (2.2%) |
| Total | 748 (100.0%) | 687 (100.0%) |
Families and Households in Bayard
Median Family Size in Bayard
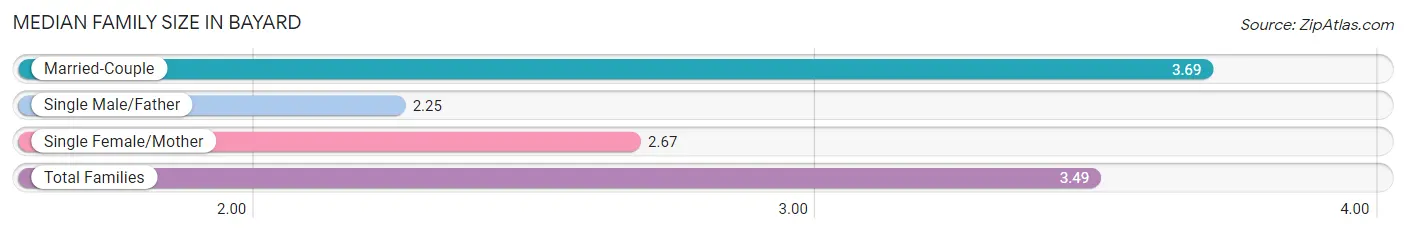
The median family size in Bayard is 3.49 persons per family, with married-couple families (276 | 81.4%) accounting for the largest median family size of 3.69 persons per family. On the other hand, single male/father families (8 | 2.4%) represent the smallest median family size with 2.25 persons per family.
| Family Type | # Families | Family Size |
| Married-Couple | 276 (81.4%) | 3.69 |
| Single Male/Father | 8 (2.4%) | 2.25 |
| Single Female/Mother | 55 (16.2%) | 2.67 |
| Total Families | 339 (100.0%) | 3.49 |
Median Household Size in Bayard
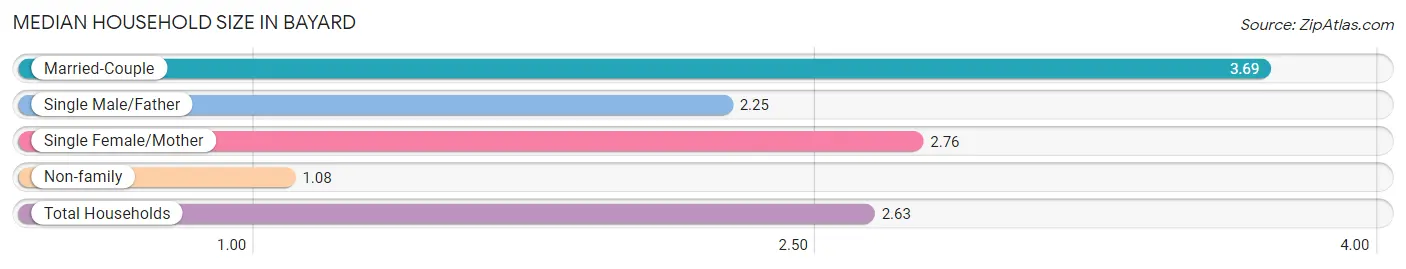
The median household size in Bayard is 2.63 persons per household, with married-couple households (276 | 51.9%) accounting for the largest median household size of 3.69 persons per household. non-family households (193 | 36.3%) represent the smallest median household size with 1.08 persons per household.
| Household Type | # Households | Household Size |
| Married-Couple | 276 (51.9%) | 3.69 |
| Single Male/Father | 8 (1.5%) | 2.25 |
| Single Female/Mother | 55 (10.3%) | 2.76 |
| Non-family | 193 (36.3%) | 1.08 |
| Total Households | 532 (100.0%) | 2.63 |
Household Size by Marriage Status in Bayard
Out of a total of 532 households in Bayard, 339 (63.7%) are family households, while 193 (36.3%) are nonfamily households. The most numerous type of family households are 2-person households, comprising 150, and the most common type of nonfamily households are 1-person households, comprising 175.
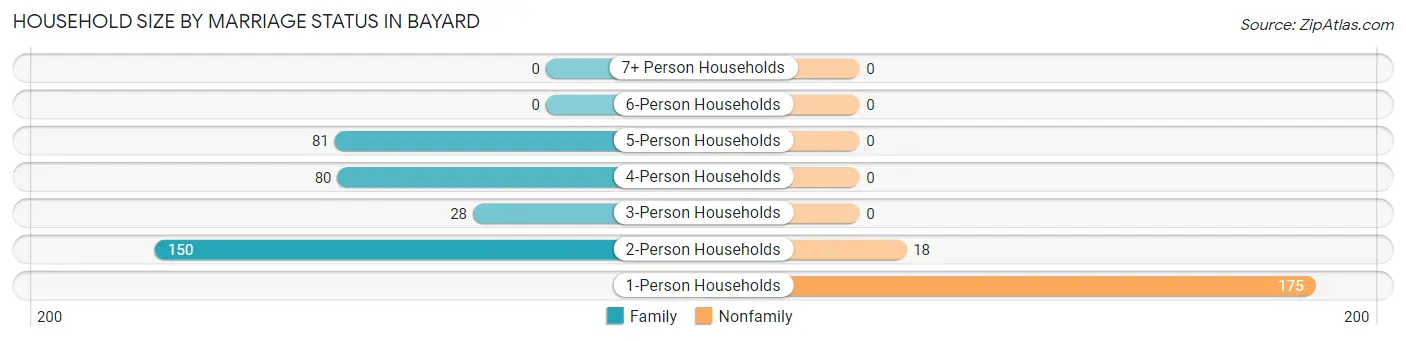
| Household Size | Family Households | Nonfamily Households |
| 1-Person Households | - | 175 (32.9%) |
| 2-Person Households | 150 (28.2%) | 18 (3.4%) |
| 3-Person Households | 28 (5.3%) | 0 (0.0%) |
| 4-Person Households | 80 (15.0%) | 0 (0.0%) |
| 5-Person Households | 81 (15.2%) | 0 (0.0%) |
| 6-Person Households | 0 (0.0%) | 0 (0.0%) |
| 7+ Person Households | 0 (0.0%) | 0 (0.0%) |
| Total | 339 (63.7%) | 193 (36.3%) |
Female Fertility in Bayard
Fertility by Age in Bayard
Average fertility rate in Bayard is 127.0 births per 1,000 women. Women in the age bracket of 20 to 34 years have the highest fertility rate with 319.0 births per 1,000 women. Women in the age bracket of 20 to 34 years acount for 100.0% of all women with births.
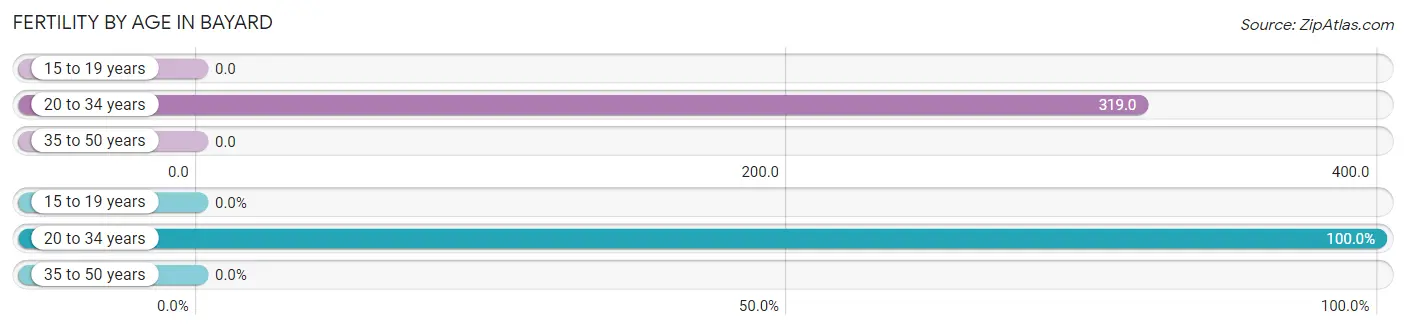
| Age Bracket | Women with Births | Births / 1,000 Women |
| 15 to 19 years | 0 (0.0%) | 0.0 |
| 20 to 34 years | 45 (100.0%) | 319.0 |
| 35 to 50 years | 0 (0.0%) | 0.0 |
| Total | 45 (100.0%) | 127.0 |
Fertility by Age by Marriage Status in Bayard
8.9% of women with births (45) in Bayard are married. The highest percentage of unmarried women with births falls into 20 to 34 years age bracket with 91.1% of them unmarried at the time of birth, while the lowest percentage of unmarried women with births belong to 20 to 34 years age bracket with 91.1% of them unmarried.
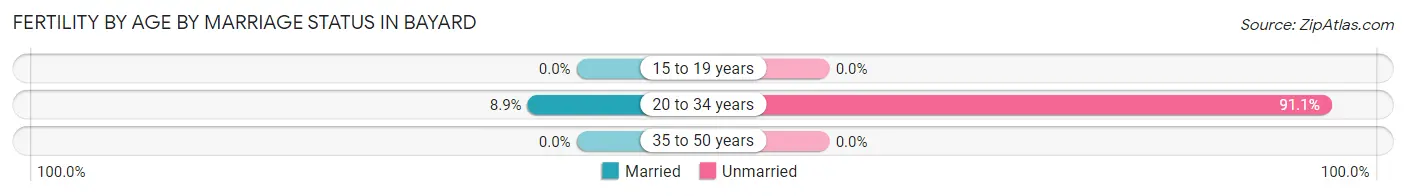
| Age Bracket | Married | Unmarried |
| 15 to 19 years | 0 (0.0%) | 0 (0.0%) |
| 20 to 34 years | 4 (8.9%) | 41 (91.1%) |
| 35 to 50 years | 0 (0.0%) | 0 (0.0%) |
| Total | 4 (8.9%) | 41 (91.1%) |
Fertility by Education in Bayard
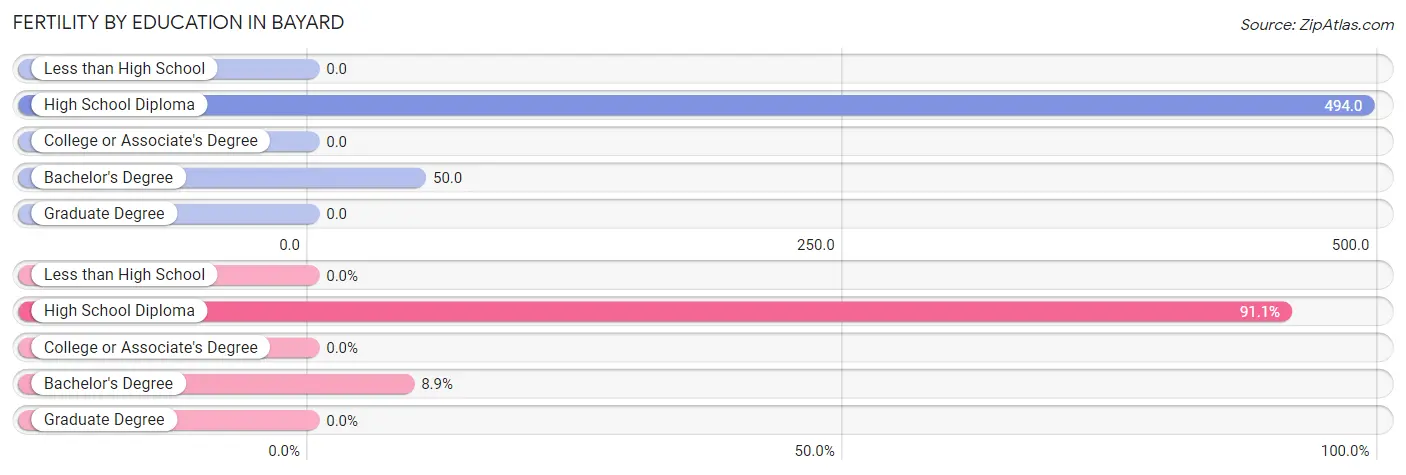
| Educational Attainment | Women with Births | Births / 1,000 Women |
| Less than High School | 0 (0.0%) | 0.0 |
| High School Diploma | 41 (91.1%) | 494.0 |
| College or Associate's Degree | 0 (0.0%) | 0.0 |
| Bachelor's Degree | 4 (8.9%) | 50.0 |
| Graduate Degree | 0 (0.0%) | 0.0 |
| Total | 45 (100.0%) | 127.0 |
Fertility by Education by Marriage Status in Bayard
91.1% of women with births in Bayard are unmarried. Women with the educational attainment of bachelor's degree are most likely to be married with 100.0% of them married at childbirth, while women with the educational attainment of high school diploma are least likely to be married with 100.0% of them unmarried at childbirth.
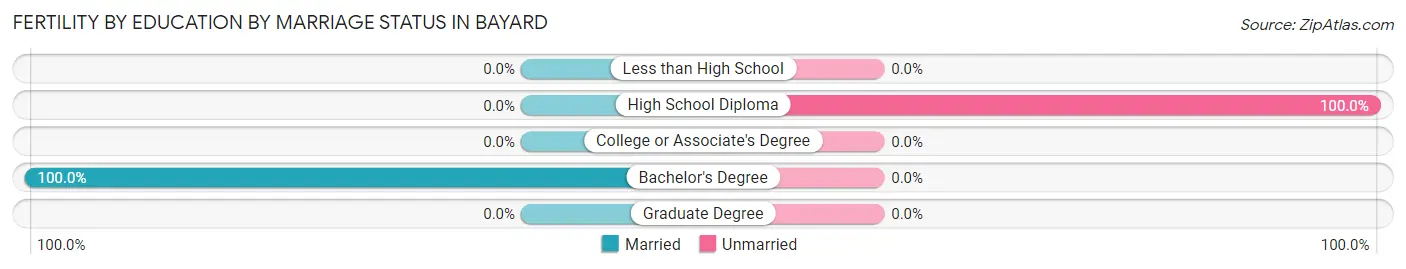
| Educational Attainment | Married | Unmarried |
| Less than High School | 0 (0.0%) | 0 (0.0%) |
| High School Diploma | 0 (0.0%) | 41 (100.0%) |
| College or Associate's Degree | 0 (0.0%) | 0 (0.0%) |
| Bachelor's Degree | 4 (100.0%) | 0 (0.0%) |
| Graduate Degree | 0 (0.0%) | 0 (0.0%) |
| Total | 4 (8.9%) | 41 (91.1%) |
Employment Characteristics in Bayard
Employment by Class of Employer in Bayard
Among the 654 employed individuals in Bayard, private company employees (395 | 60.4%), local government employees (92 | 14.1%), and state government employees (69 | 10.5%) make up the most common classes of employment.
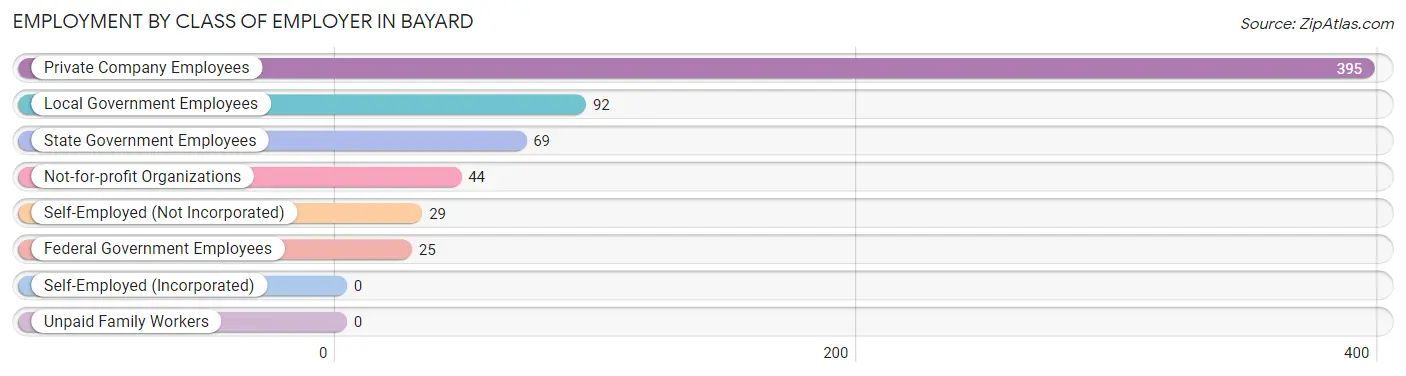
| Employer Class | # Employees | % Employees |
| Private Company Employees | 395 | 60.4% |
| Self-Employed (Incorporated) | 0 | 0.0% |
| Self-Employed (Not Incorporated) | 29 | 4.4% |
| Not-for-profit Organizations | 44 | 6.7% |
| Local Government Employees | 92 | 14.1% |
| State Government Employees | 69 | 10.5% |
| Federal Government Employees | 25 | 3.8% |
| Unpaid Family Workers | 0 | 0.0% |
| Total | 654 | 100.0% |
Employment Status by Age in Bayard
According to the labor force statistics for Bayard, out of the total population over 16 years of age (1,186), 63.2% or 750 individuals are in the labor force, with 2.4% or 18 of them unemployed. The age group with the highest labor force participation rate is 25 to 29 years, with 100.0% or 97 individuals in the labor force. Within the labor force, the 16 to 19 years age range has the highest percentage of unemployed individuals, with 9.2% or 8 of them being unemployed.
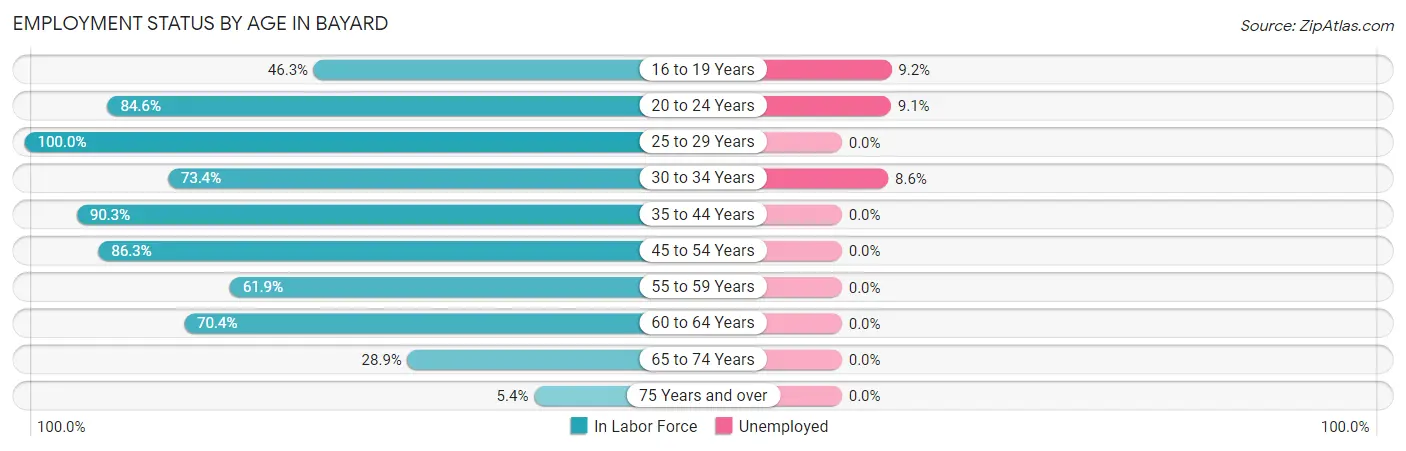
| Age Bracket | In Labor Force | Unemployed |
| 16 to 19 Years | 87 (46.3%) | 8 (9.2%) |
| 20 to 24 Years | 55 (84.6%) | 5 (9.1%) |
| 25 to 29 Years | 97 (100.0%) | 0 (0.0%) |
| 30 to 34 Years | 58 (73.4%) | 5 (8.6%) |
| 35 to 44 Years | 186 (90.3%) | 0 (0.0%) |
| 45 to 54 Years | 126 (86.3%) | 0 (0.0%) |
| 55 to 59 Years | 26 (61.9%) | 0 (0.0%) |
| 60 to 64 Years | 69 (70.4%) | 0 (0.0%) |
| 65 to 74 Years | 39 (28.9%) | 0 (0.0%) |
| 75 Years and over | 7 (5.4%) | 0 (0.0%) |
| Total | 750 (63.2%) | 18 (2.4%) |
Employment Status by Educational Attainment in Bayard
According to labor force statistics for Bayard, 84.1% of individuals (562) out of the total population between 25 and 64 years of age (668) are in the labor force, with 0.9% or 5 of them being unemployed. The group with the highest labor force participation rate are those with the educational attainment of bachelor's degree or higher, with 87.9% or 138 individuals in the labor force. Within the labor force, individuals with high school diploma education have the highest percentage of unemployment, with 3.2% or 5 of them being unemployed.
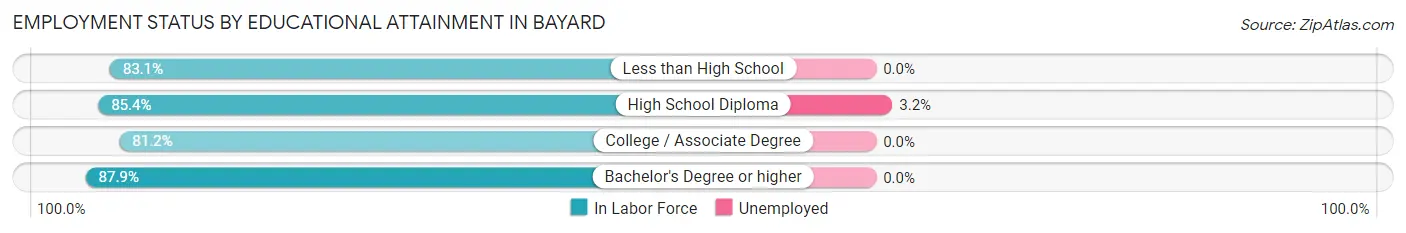
| Educational Attainment | In Labor Force | Unemployed |
| Less than High School | 54 (83.1%) | 0 (0.0%) |
| High School Diploma | 158 (85.4%) | 6 (3.2%) |
| College / Associate Degree | 212 (81.2%) | 0 (0.0%) |
| Bachelor's Degree or higher | 138 (87.9%) | 0 (0.0%) |
| Total | 562 (84.1%) | 6 (0.9%) |
Employment Occupations by Sex in Bayard
Management, Business, Science and Arts Occupations
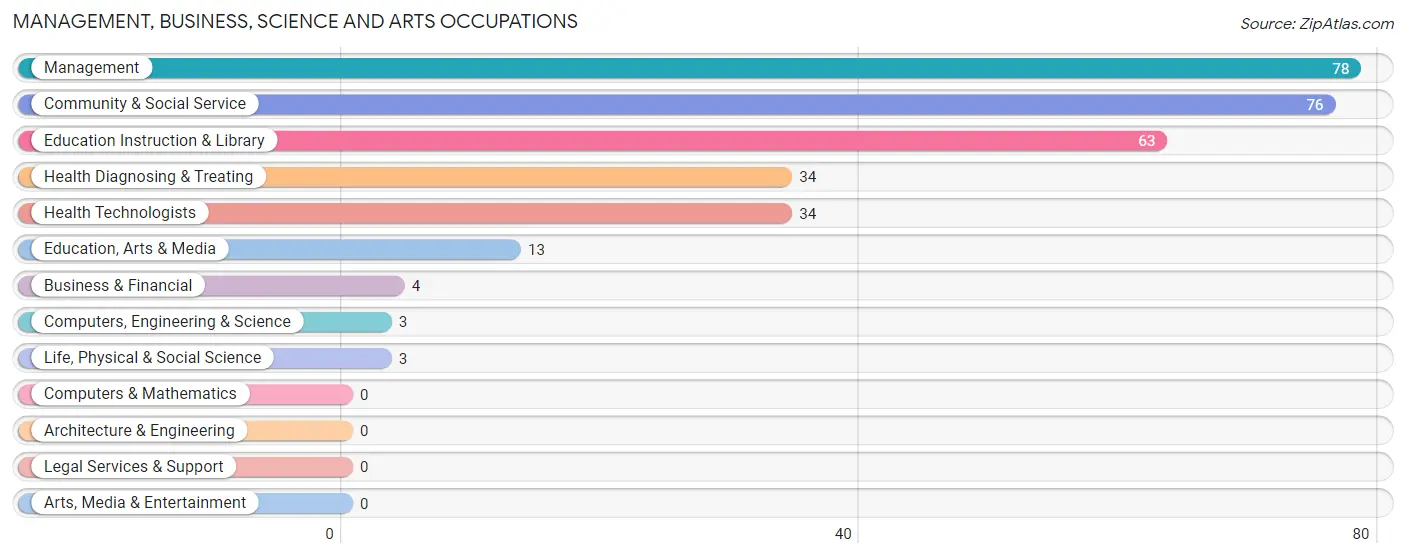
The most common Management, Business, Science and Arts occupations in Bayard are Management (78 | 10.7%), Community & Social Service (76 | 10.4%), Education Instruction & Library (63 | 8.6%), Health Diagnosing & Treating (34 | 4.6%), and Health Technologists (34 | 4.6%).
Management, Business, Science and Arts Occupations by Sex
Within the Management, Business, Science and Arts occupations in Bayard, the most male-oriented occupations are Business & Financial (100.0%), Health Diagnosing & Treating (61.8%), and Health Technologists (61.8%), while the most female-oriented occupations are Computers, Engineering & Science (100.0%), Life, Physical & Social Science (100.0%), and Education, Arts & Media (100.0%).
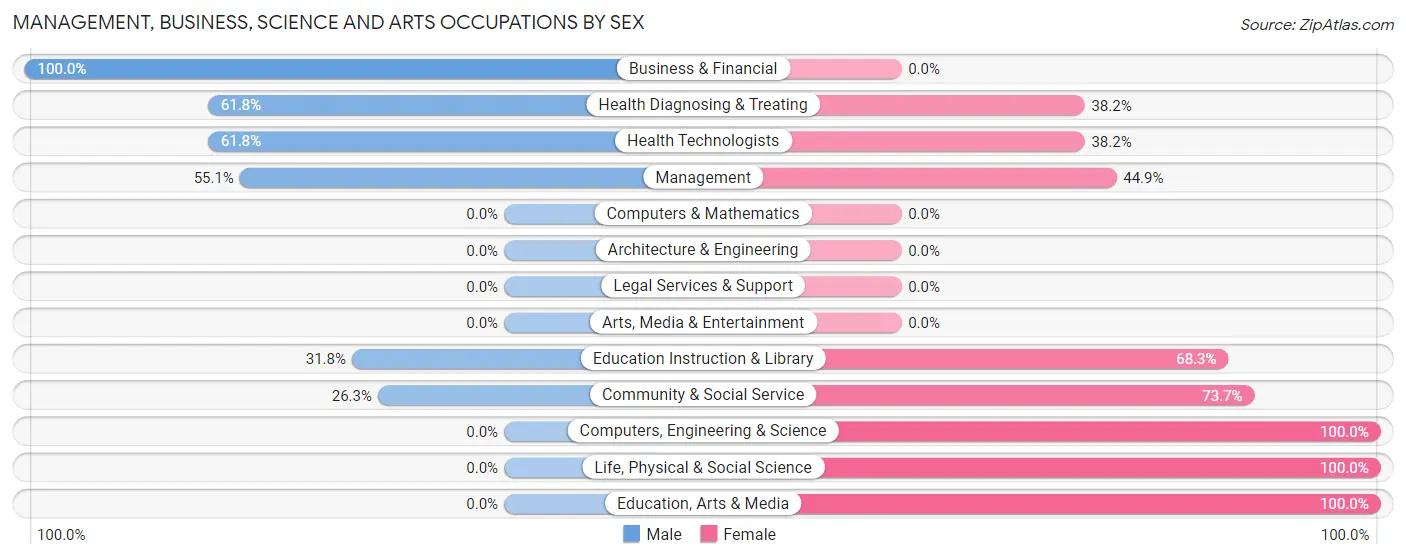
| Occupation | Male | Female |
| Management | 43 (55.1%) | 35 (44.9%) |
| Business & Financial | 4 (100.0%) | 0 (0.0%) |
| Computers, Engineering & Science | 0 (0.0%) | 3 (100.0%) |
| Computers & Mathematics | 0 (0.0%) | 0 (0.0%) |
| Architecture & Engineering | 0 (0.0%) | 0 (0.0%) |
| Life, Physical & Social Science | 0 (0.0%) | 3 (100.0%) |
| Community & Social Service | 20 (26.3%) | 56 (73.7%) |
| Education, Arts & Media | 0 (0.0%) | 13 (100.0%) |
| Legal Services & Support | 0 (0.0%) | 0 (0.0%) |
| Education Instruction & Library | 20 (31.8%) | 43 (68.2%) |
| Arts, Media & Entertainment | 0 (0.0%) | 0 (0.0%) |
| Health Diagnosing & Treating | 21 (61.8%) | 13 (38.2%) |
| Health Technologists | 21 (61.8%) | 13 (38.2%) |
| Total (Category) | 88 (45.1%) | 107 (54.9%) |
| Total (Overall) | 408 (55.7%) | 324 (44.3%) |
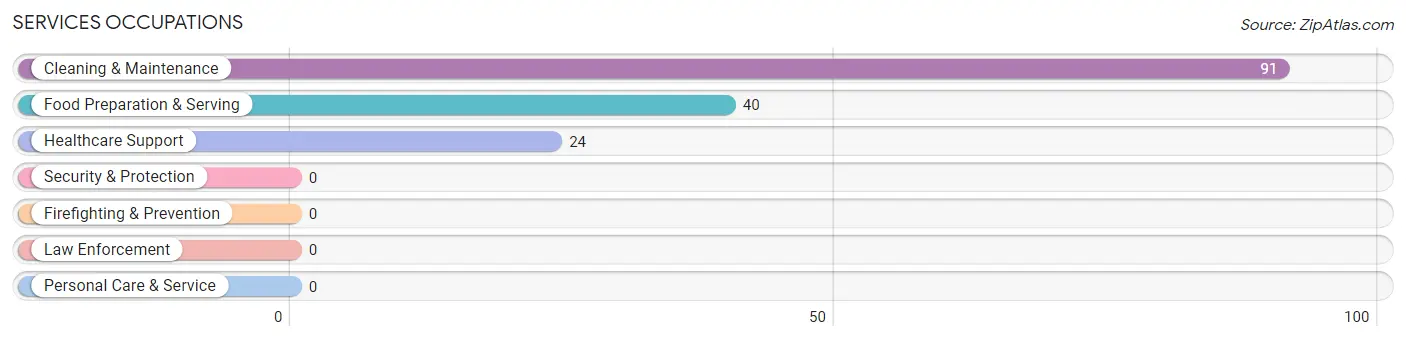
Services Occupations
The most common Services occupations in Bayard are Cleaning & Maintenance (91 | 12.4%), Food Preparation & Serving (40 | 5.5%), and Healthcare Support (24 | 3.3%).
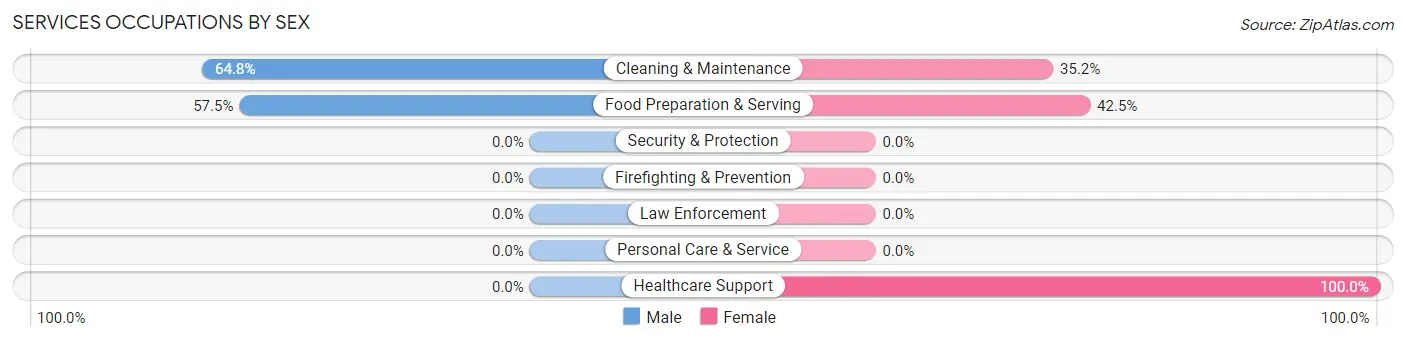
Services Occupations by Sex
Within the Services occupations in Bayard, the most male-oriented occupations are Cleaning & Maintenance (64.8%), and Food Preparation & Serving (57.5%), while the most female-oriented occupations are Healthcare Support (100.0%), Food Preparation & Serving (42.5%), and Cleaning & Maintenance (35.2%).
| Occupation | Male | Female |
| Healthcare Support | 0 (0.0%) | 24 (100.0%) |
| Security & Protection | 0 (0.0%) | 0 (0.0%) |
| Firefighting & Prevention | 0 (0.0%) | 0 (0.0%) |
| Law Enforcement | 0 (0.0%) | 0 (0.0%) |
| Food Preparation & Serving | 23 (57.5%) | 17 (42.5%) |
| Cleaning & Maintenance | 59 (64.8%) | 32 (35.2%) |
| Personal Care & Service | 0 (0.0%) | 0 (0.0%) |
| Total (Category) | 82 (52.9%) | 73 (47.1%) |
| Total (Overall) | 408 (55.7%) | 324 (44.3%) |
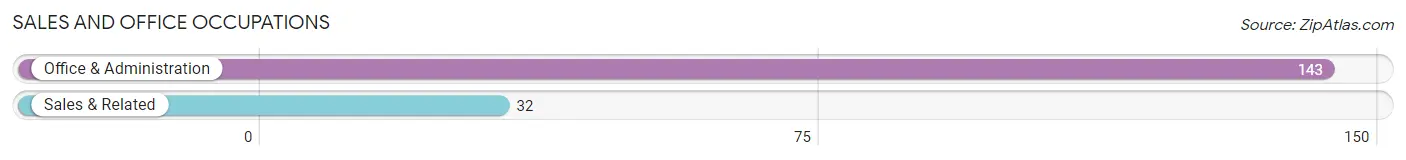
Sales and Office Occupations
The most common Sales and Office occupations in Bayard are Office & Administration (143 | 19.5%), and Sales & Related (32 | 4.4%).
Sales and Office Occupations by Sex
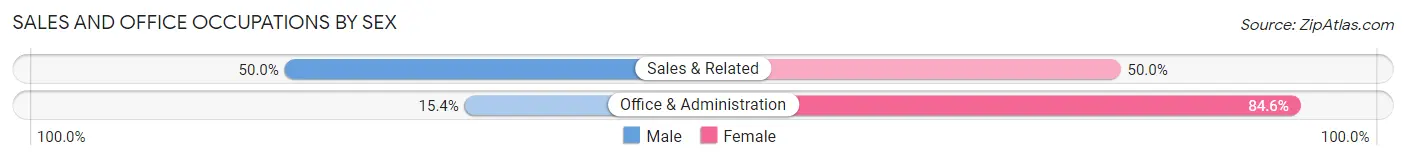
| Occupation | Male | Female |
| Sales & Related | 16 (50.0%) | 16 (50.0%) |
| Office & Administration | 22 (15.4%) | 121 (84.6%) |
| Total (Category) | 38 (21.7%) | 137 (78.3%) |
| Total (Overall) | 408 (55.7%) | 324 (44.3%) |
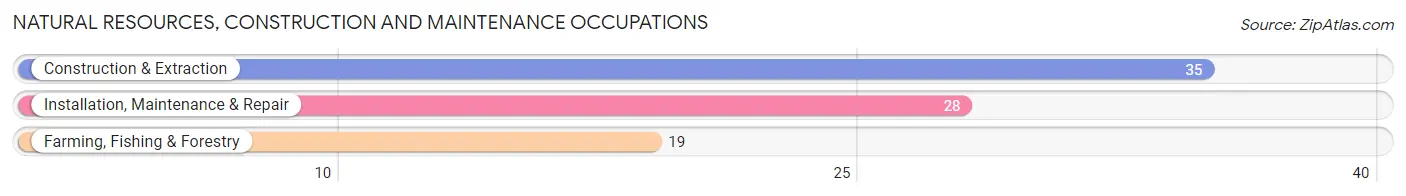
Natural Resources, Construction and Maintenance Occupations
The most common Natural Resources, Construction and Maintenance occupations in Bayard are Construction & Extraction (35 | 4.8%), Installation, Maintenance & Repair (28 | 3.8%), and Farming, Fishing & Forestry (19 | 2.6%).
Natural Resources, Construction and Maintenance Occupations by Sex
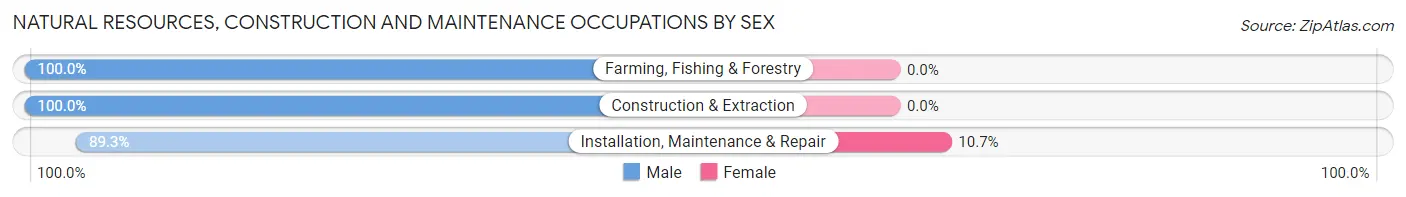
| Occupation | Male | Female |
| Farming, Fishing & Forestry | 19 (100.0%) | 0 (0.0%) |
| Construction & Extraction | 35 (100.0%) | 0 (0.0%) |
| Installation, Maintenance & Repair | 25 (89.3%) | 3 (10.7%) |
| Total (Category) | 79 (96.3%) | 3 (3.7%) |
| Total (Overall) | 408 (55.7%) | 324 (44.3%) |
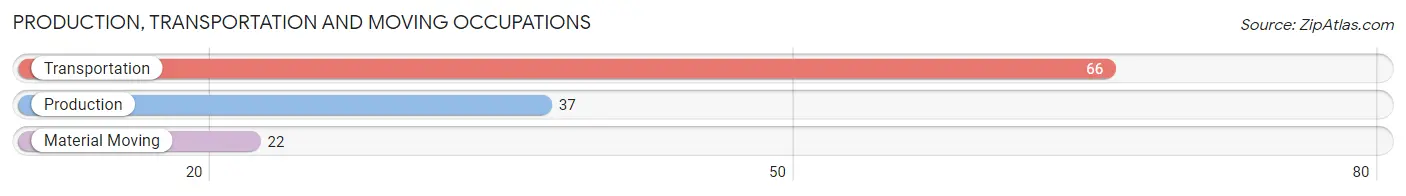
Production, Transportation and Moving Occupations
The most common Production, Transportation and Moving occupations in Bayard are Transportation (66 | 9.0%), Production (37 | 5.1%), and Material Moving (22 | 3.0%).
Production, Transportation and Moving Occupations by Sex
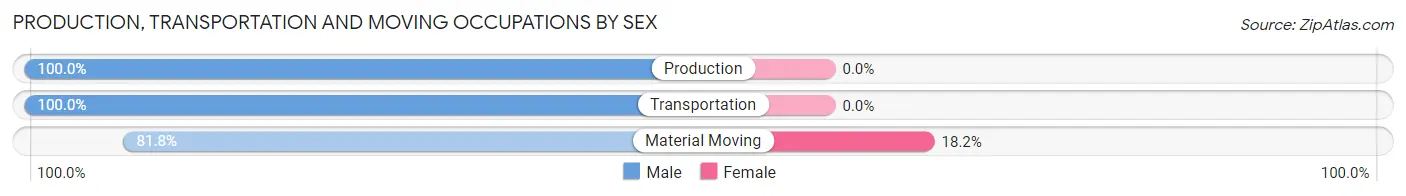
| Occupation | Male | Female |
| Production | 37 (100.0%) | 0 (0.0%) |
| Transportation | 66 (100.0%) | 0 (0.0%) |
| Material Moving | 18 (81.8%) | 4 (18.2%) |
| Total (Category) | 121 (96.8%) | 4 (3.2%) |
| Total (Overall) | 408 (55.7%) | 324 (44.3%) |
Employment Industries by Sex in Bayard
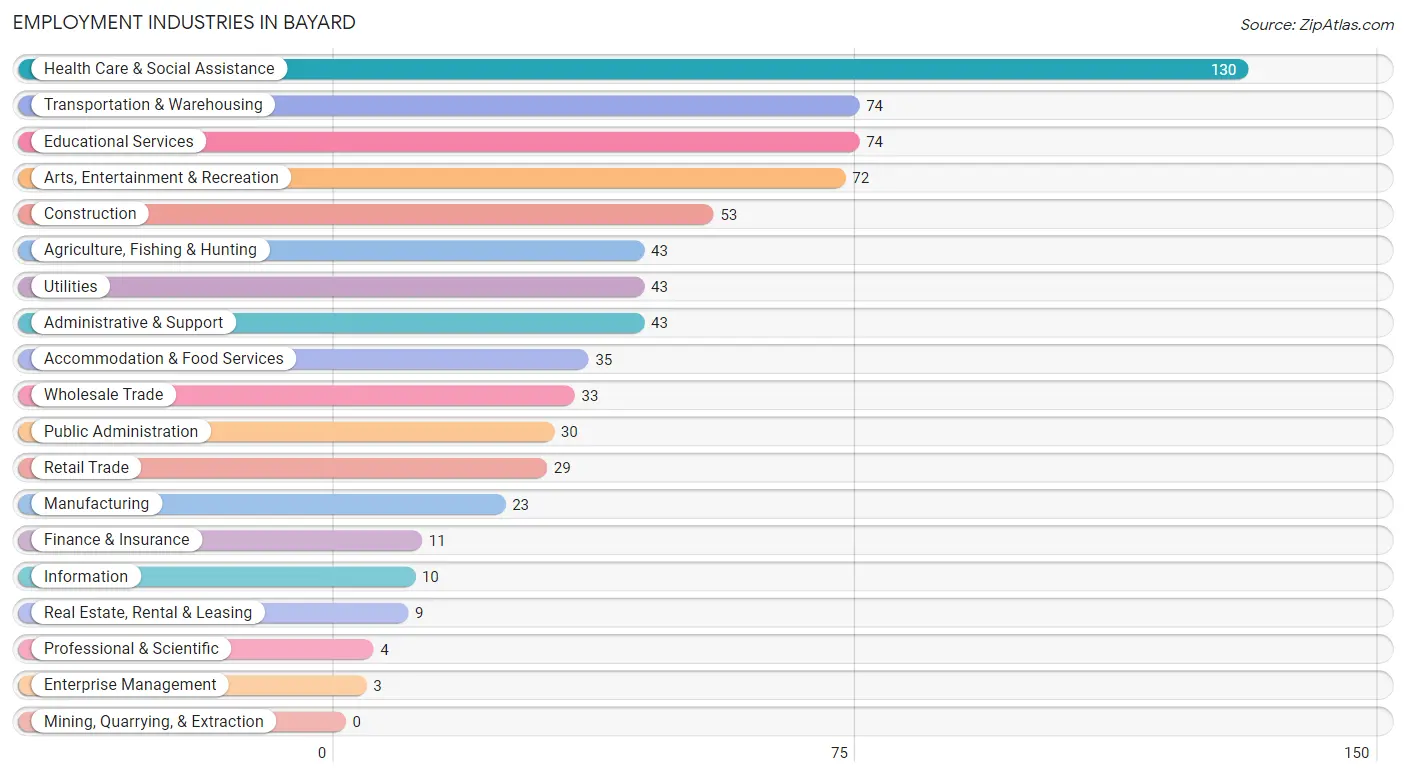
Employment Industries in Bayard
The major employment industries in Bayard include Health Care & Social Assistance (130 | 17.8%), Transportation & Warehousing (74 | 10.1%), Educational Services (74 | 10.1%), Arts, Entertainment & Recreation (72 | 9.8%), and Construction (53 | 7.2%).
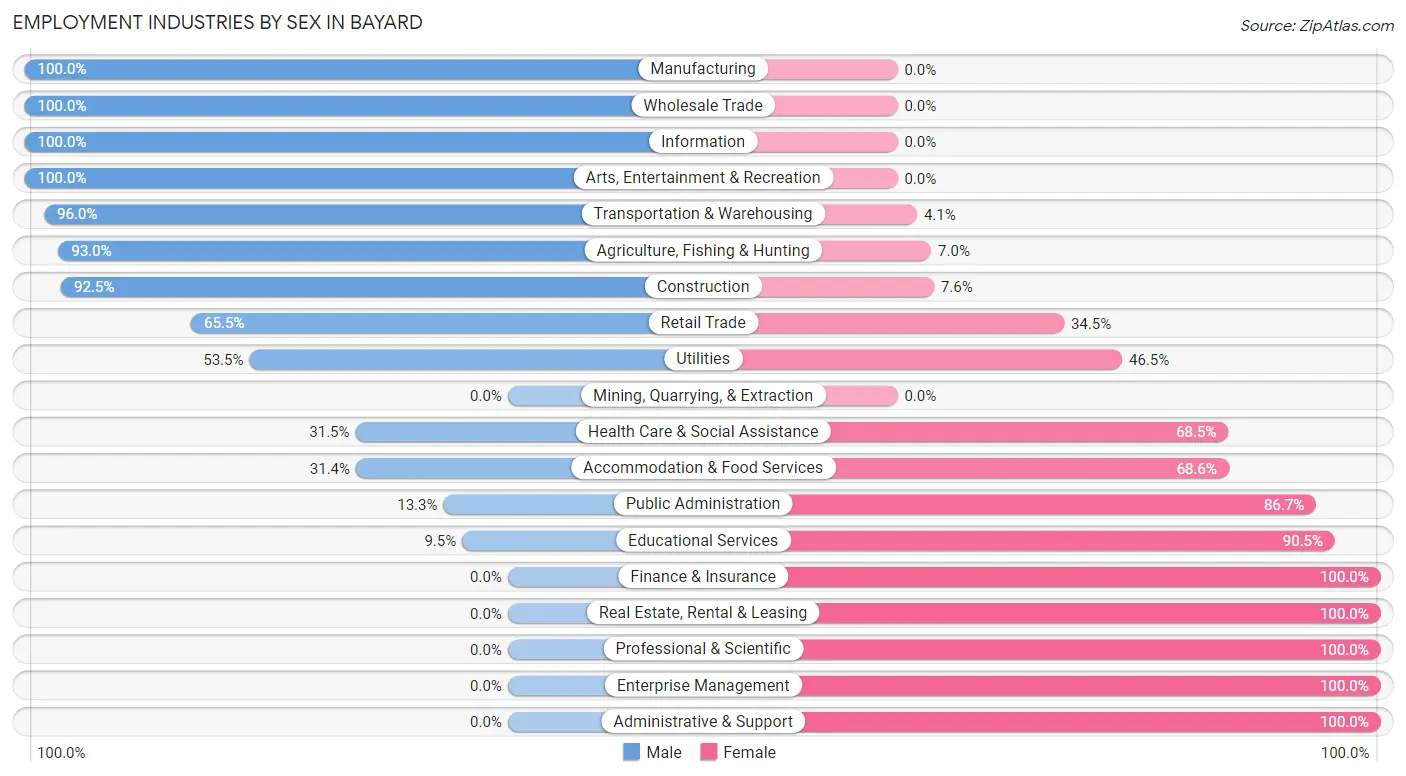
Employment Industries by Sex in Bayard
The Bayard industries that see more men than women are Manufacturing (100.0%), Wholesale Trade (100.0%), and Information (100.0%), whereas the industries that tend to have a higher number of women are Finance & Insurance (100.0%), Real Estate, Rental & Leasing (100.0%), and Professional & Scientific (100.0%).
| Industry | Male | Female |
| Agriculture, Fishing & Hunting | 40 (93.0%) | 3 (7.0%) |
| Mining, Quarrying, & Extraction | 0 (0.0%) | 0 (0.0%) |
| Construction | 49 (92.4%) | 4 (7.5%) |
| Manufacturing | 23 (100.0%) | 0 (0.0%) |
| Wholesale Trade | 33 (100.0%) | 0 (0.0%) |
| Retail Trade | 19 (65.5%) | 10 (34.5%) |
| Transportation & Warehousing | 71 (96.0%) | 3 (4.1%) |
| Utilities | 23 (53.5%) | 20 (46.5%) |
| Information | 10 (100.0%) | 0 (0.0%) |
| Finance & Insurance | 0 (0.0%) | 11 (100.0%) |
| Real Estate, Rental & Leasing | 0 (0.0%) | 9 (100.0%) |
| Professional & Scientific | 0 (0.0%) | 4 (100.0%) |
| Enterprise Management | 0 (0.0%) | 3 (100.0%) |
| Administrative & Support | 0 (0.0%) | 43 (100.0%) |
| Educational Services | 7 (9.5%) | 67 (90.5%) |
| Health Care & Social Assistance | 41 (31.5%) | 89 (68.5%) |
| Arts, Entertainment & Recreation | 72 (100.0%) | 0 (0.0%) |
| Accommodation & Food Services | 11 (31.4%) | 24 (68.6%) |
| Public Administration | 4 (13.3%) | 26 (86.7%) |
| Total | 408 (55.7%) | 324 (44.3%) |
Education in Bayard
School Enrollment in Bayard
The most common levels of schooling among the 362 students in Bayard are high school (170 | 47.0%), middle school (60 | 16.6%), and elementary school (42 | 11.6%).
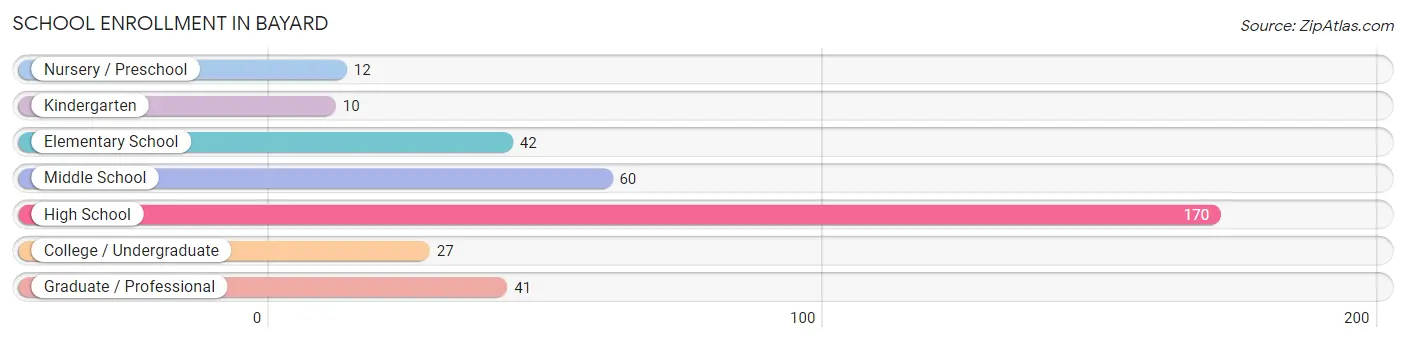
| School Level | # Students | % Students |
| Nursery / Preschool | 12 | 3.3% |
| Kindergarten | 10 | 2.8% |
| Elementary School | 42 | 11.6% |
| Middle School | 60 | 16.6% |
| High School | 170 | 47.0% |
| College / Undergraduate | 27 | 7.5% |
| Graduate / Professional | 41 | 11.3% |
| Total | 362 | 100.0% |
School Enrollment by Age by Funding Source in Bayard
Out of a total of 362 students who are enrolled in schools in Bayard, 32 (8.8%) attend a private institution, while the remaining 330 (91.2%) are enrolled in public schools. The age group of 15 to 17 year olds has the highest likelihood of being enrolled in private schools, with 15 (26.8% in the age bracket) enrolled. Conversely, the age group of 5 to 9 year old has the lowest likelihood of being enrolled in a private school, with 30 (100.0% in the age bracket) attending a public institution.
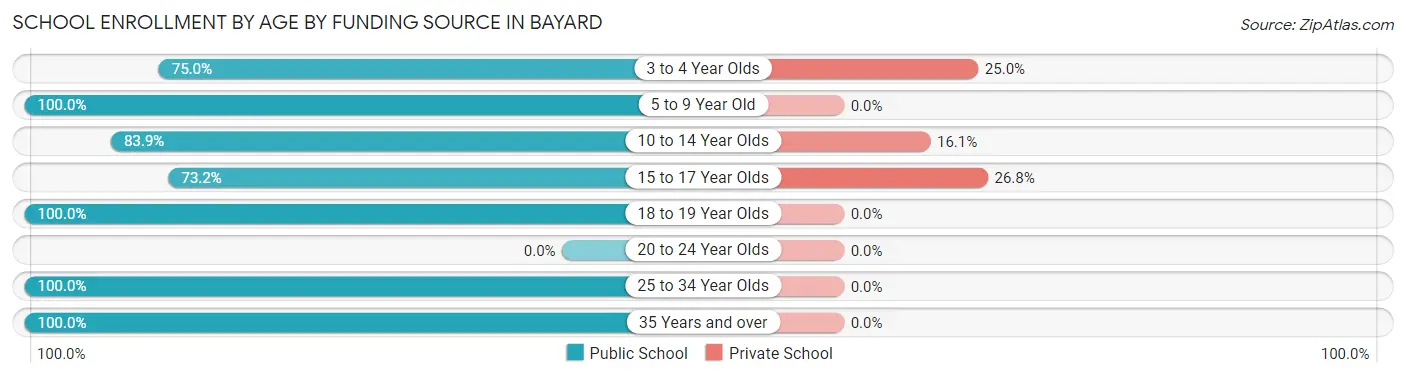
| Age Bracket | Public School | Private School |
| 3 to 4 Year Olds | 9 (75.0%) | 3 (25.0%) |
| 5 to 9 Year Old | 30 (100.0%) | 0 (0.0%) |
| 10 to 14 Year Olds | 73 (83.9%) | 14 (16.1%) |
| 15 to 17 Year Olds | 41 (73.2%) | 15 (26.8%) |
| 18 to 19 Year Olds | 110 (100.0%) | 0 (0.0%) |
| 20 to 24 Year Olds | 0 (0.0%) | 0 (0.0%) |
| 25 to 34 Year Olds | 31 (100.0%) | 0 (0.0%) |
| 35 Years and over | 36 (100.0%) | 0 (0.0%) |
| Total | 330 (91.2%) | 32 (8.8%) |
Educational Attainment by Field of Study in Bayard
Science & technology (65 | 34.8%), arts & humanities (51 | 27.3%), education (36 | 19.3%), social sciences (15 | 8.0%), and engineering (9 | 4.8%) are the most common fields of study among 187 individuals in Bayard who have obtained a bachelor's degree or higher.
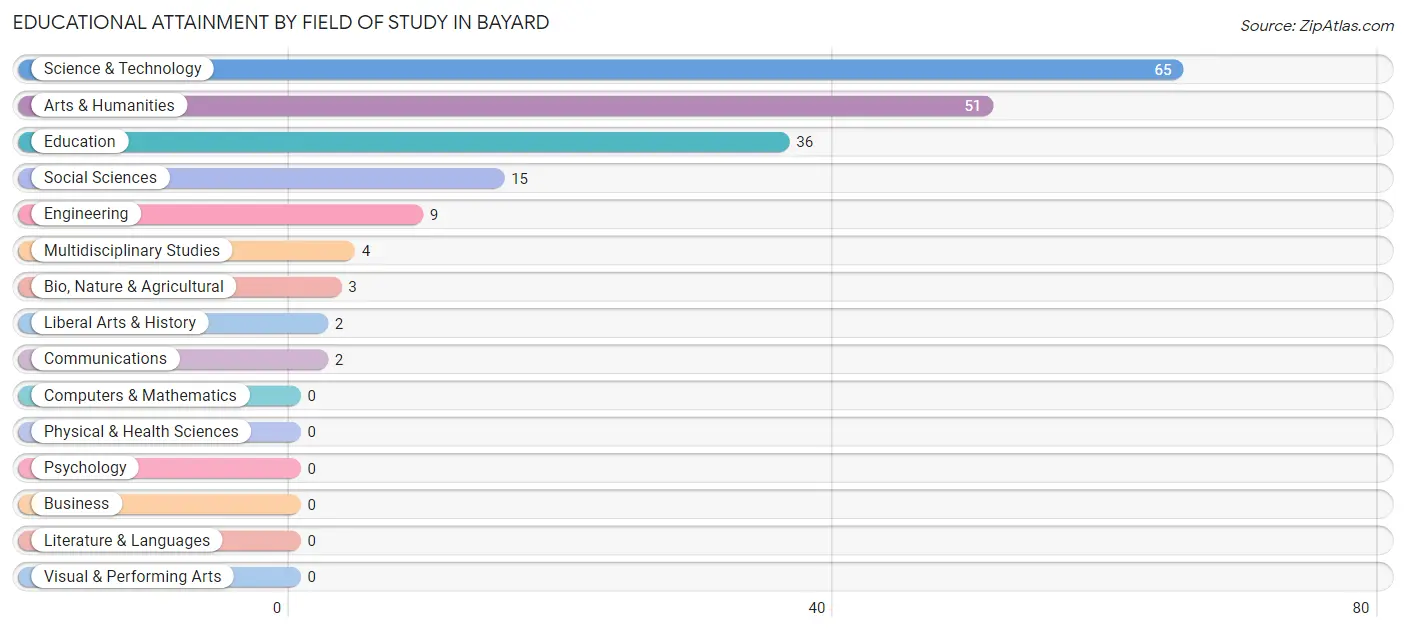
| Field of Study | # Graduates | % Graduates |
| Computers & Mathematics | 0 | 0.0% |
| Bio, Nature & Agricultural | 3 | 1.6% |
| Physical & Health Sciences | 0 | 0.0% |
| Psychology | 0 | 0.0% |
| Social Sciences | 15 | 8.0% |
| Engineering | 9 | 4.8% |
| Multidisciplinary Studies | 4 | 2.1% |
| Science & Technology | 65 | 34.8% |
| Business | 0 | 0.0% |
| Education | 36 | 19.3% |
| Literature & Languages | 0 | 0.0% |
| Liberal Arts & History | 2 | 1.1% |
| Visual & Performing Arts | 0 | 0.0% |
| Communications | 2 | 1.1% |
| Arts & Humanities | 51 | 27.3% |
| Total | 187 | 100.0% |
Transportation & Commute in Bayard
Vehicle Availability by Sex in Bayard
The most prevalent vehicle ownership categories in Bayard are males with 3 vehicles (220, accounting for 55.0%) and females with 3 vehicles (98, making up 86.6%).
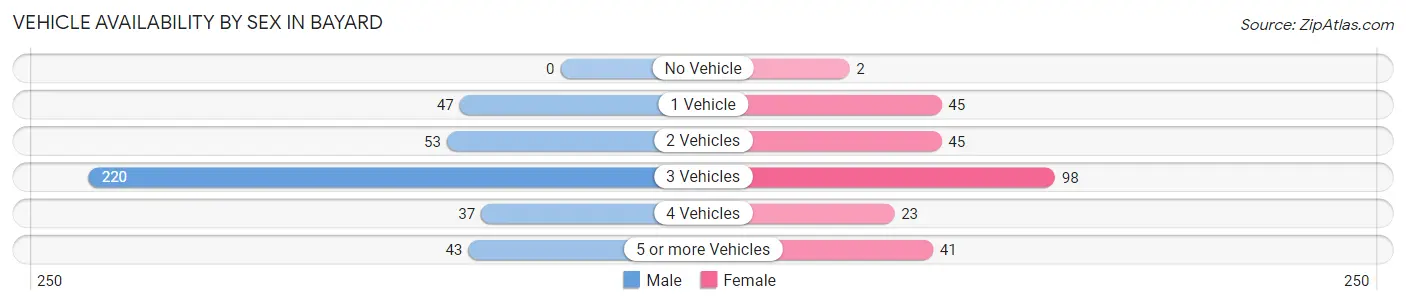
| Vehicles Available | Male | Female |
| No Vehicle | 0 (0.0%) | 2 (0.8%) |
| 1 Vehicle | 47 (11.7%) | 45 (17.7%) |
| 2 Vehicles | 53 (13.3%) | 45 (17.7%) |
| 3 Vehicles | 220 (55.0%) | 98 (38.6%) |
| 4 Vehicles | 37 (9.2%) | 23 (9.1%) |
| 5 or more Vehicles | 43 (10.7%) | 41 (16.1%) |
| Total | 400 (100.0%) | 254 (100.0%) |
Commute Time in Bayard
The most frequently occuring commute durations in Bayard are 5 to 9 minutes (123 commuters, 20.4%), 25 to 29 minutes (99 commuters, 16.5%), and less than 5 minutes (75 commuters, 12.5%).
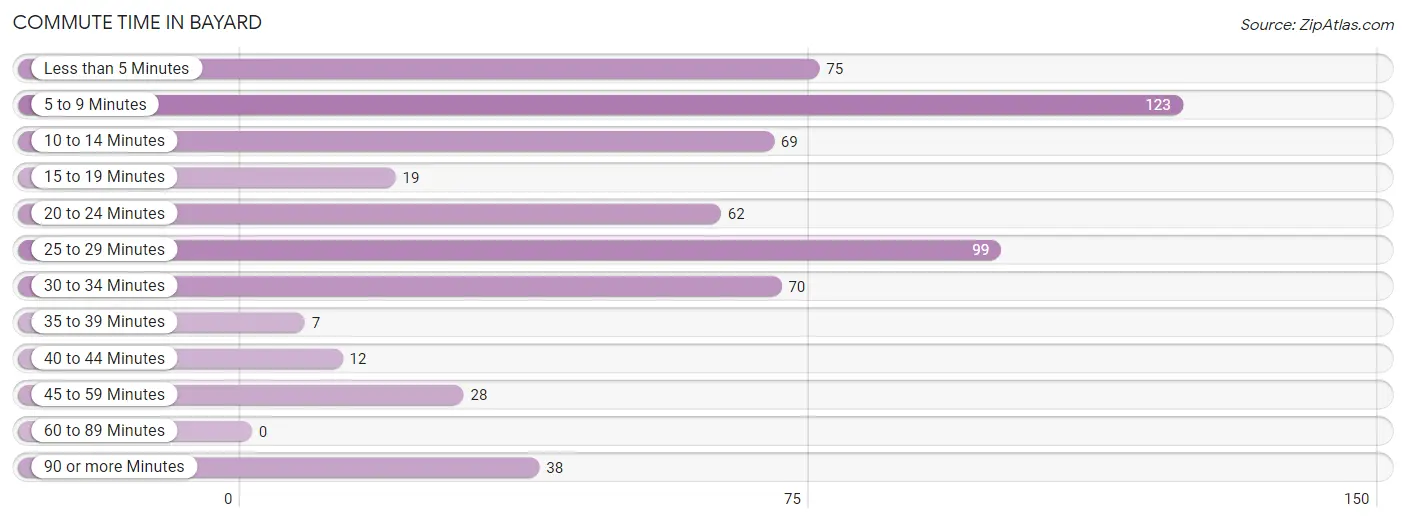
| Commute Time | # Commuters | % Commuters |
| Less than 5 Minutes | 75 | 12.5% |
| 5 to 9 Minutes | 123 | 20.4% |
| 10 to 14 Minutes | 69 | 11.5% |
| 15 to 19 Minutes | 19 | 3.2% |
| 20 to 24 Minutes | 62 | 10.3% |
| 25 to 29 Minutes | 99 | 16.5% |
| 30 to 34 Minutes | 70 | 11.6% |
| 35 to 39 Minutes | 7 | 1.2% |
| 40 to 44 Minutes | 12 | 2.0% |
| 45 to 59 Minutes | 28 | 4.6% |
| 60 to 89 Minutes | 0 | 0.0% |
| 90 or more Minutes | 38 | 6.3% |
Commute Time by Sex in Bayard
The most common commute times in Bayard are 5 to 9 minutes (67 commuters, 17.4%) for males and 25 to 29 minutes (58 commuters, 26.7%) for females.
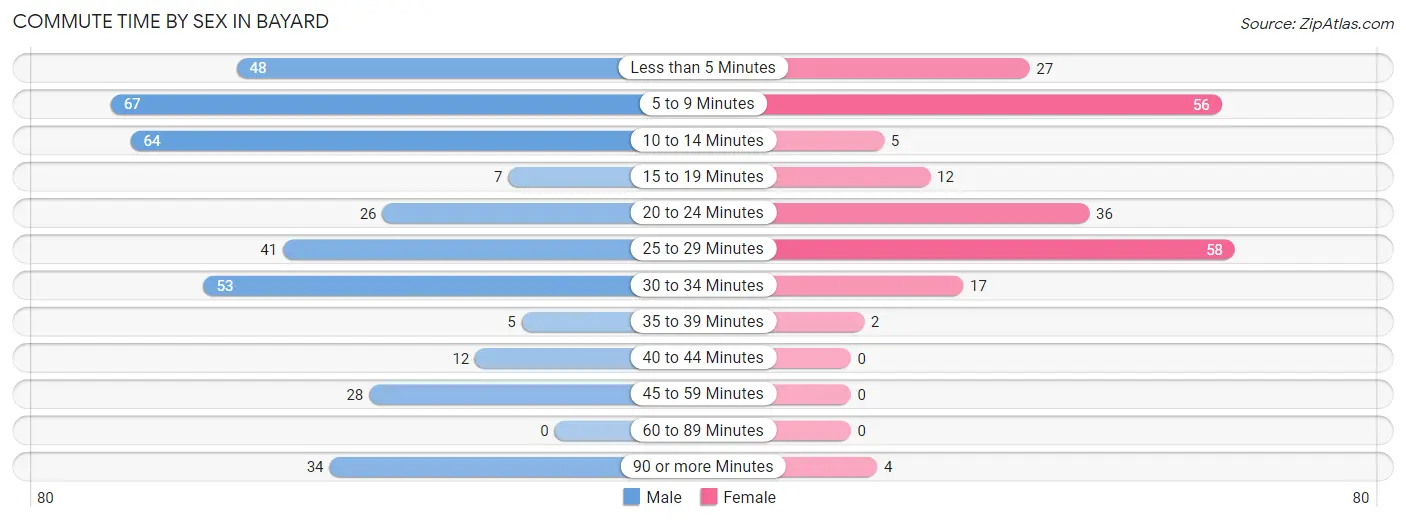
| Commute Time | Male | Female |
| Less than 5 Minutes | 48 (12.5%) | 27 (12.4%) |
| 5 to 9 Minutes | 67 (17.4%) | 56 (25.8%) |
| 10 to 14 Minutes | 64 (16.6%) | 5 (2.3%) |
| 15 to 19 Minutes | 7 (1.8%) | 12 (5.5%) |
| 20 to 24 Minutes | 26 (6.8%) | 36 (16.6%) |
| 25 to 29 Minutes | 41 (10.6%) | 58 (26.7%) |
| 30 to 34 Minutes | 53 (13.8%) | 17 (7.8%) |
| 35 to 39 Minutes | 5 (1.3%) | 2 (0.9%) |
| 40 to 44 Minutes | 12 (3.1%) | 0 (0.0%) |
| 45 to 59 Minutes | 28 (7.3%) | 0 (0.0%) |
| 60 to 89 Minutes | 0 (0.0%) | 0 (0.0%) |
| 90 or more Minutes | 34 (8.8%) | 4 (1.8%) |
Time of Departure to Work by Sex in Bayard
The most frequent times of departure to work in Bayard are 6:30 AM to 6:59 AM (91, 23.6%) for males and 9:00 AM to 9:59 AM (60, 27.7%) for females.
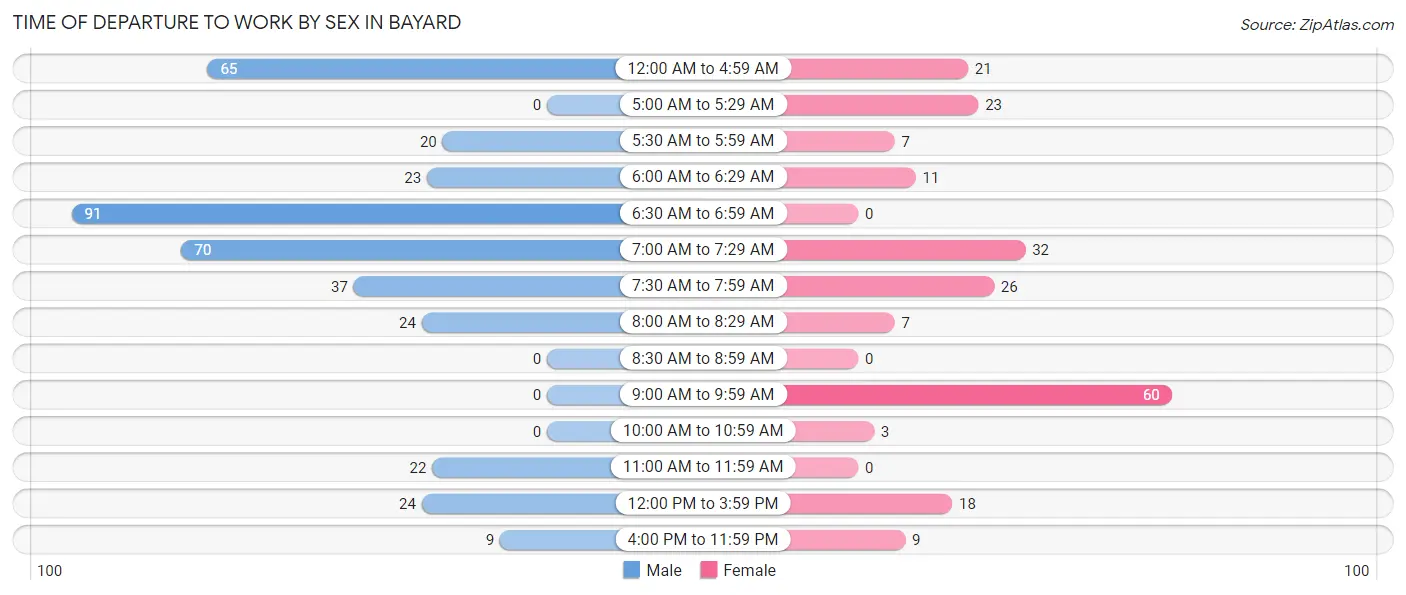
| Time of Departure | Male | Female |
| 12:00 AM to 4:59 AM | 65 (16.9%) | 21 (9.7%) |
| 5:00 AM to 5:29 AM | 0 (0.0%) | 23 (10.6%) |
| 5:30 AM to 5:59 AM | 20 (5.2%) | 7 (3.2%) |
| 6:00 AM to 6:29 AM | 23 (6.0%) | 11 (5.1%) |
| 6:30 AM to 6:59 AM | 91 (23.6%) | 0 (0.0%) |
| 7:00 AM to 7:29 AM | 70 (18.2%) | 32 (14.7%) |
| 7:30 AM to 7:59 AM | 37 (9.6%) | 26 (12.0%) |
| 8:00 AM to 8:29 AM | 24 (6.2%) | 7 (3.2%) |
| 8:30 AM to 8:59 AM | 0 (0.0%) | 0 (0.0%) |
| 9:00 AM to 9:59 AM | 0 (0.0%) | 60 (27.7%) |
| 10:00 AM to 10:59 AM | 0 (0.0%) | 3 (1.4%) |
| 11:00 AM to 11:59 AM | 22 (5.7%) | 0 (0.0%) |
| 12:00 PM to 3:59 PM | 24 (6.2%) | 18 (8.3%) |
| 4:00 PM to 11:59 PM | 9 (2.3%) | 9 (4.2%) |
| Total | 385 (100.0%) | 217 (100.0%) |
Housing Occupancy in Bayard
Occupancy by Ownership in Bayard
Of the total 532 dwellings in Bayard, owner-occupied units account for 468 (88.0%), while renter-occupied units make up 64 (12.0%).
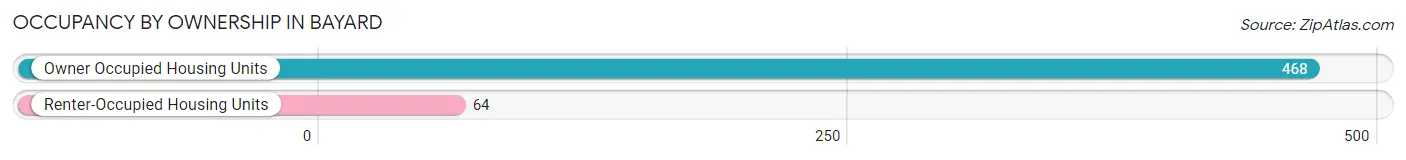
| Occupancy | # Housing Units | % Housing Units |
| Owner Occupied Housing Units | 468 | 88.0% |
| Renter-Occupied Housing Units | 64 | 12.0% |
| Total Occupied Housing Units | 532 | 100.0% |
Occupancy by Household Size in Bayard
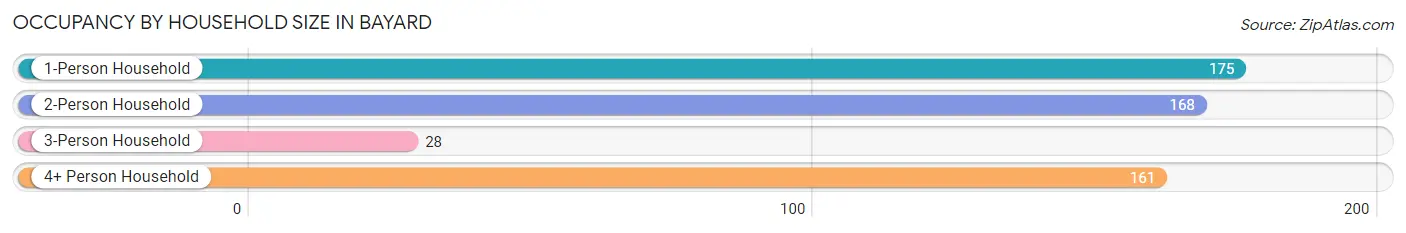
| Household Size | # Housing Units | % Housing Units |
| 1-Person Household | 175 | 32.9% |
| 2-Person Household | 168 | 31.6% |
| 3-Person Household | 28 | 5.3% |
| 4+ Person Household | 161 | 30.3% |
| Total Housing Units | 532 | 100.0% |
Occupancy by Ownership by Household Size in Bayard
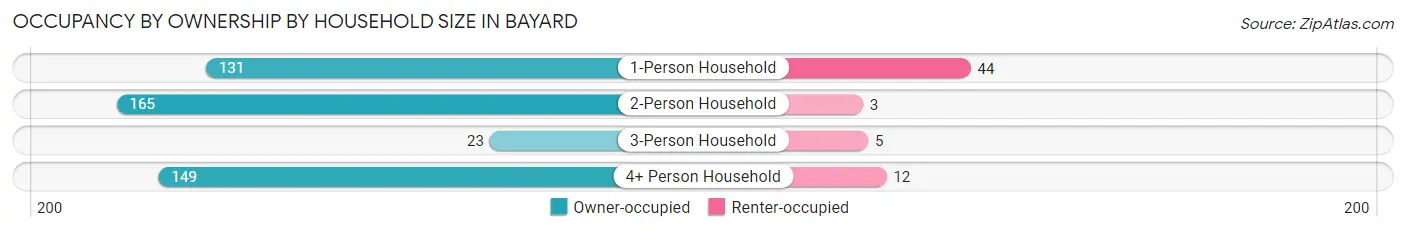
| Household Size | Owner-occupied | Renter-occupied |
| 1-Person Household | 131 (74.9%) | 44 (25.1%) |
| 2-Person Household | 165 (98.2%) | 3 (1.8%) |
| 3-Person Household | 23 (82.1%) | 5 (17.9%) |
| 4+ Person Household | 149 (92.5%) | 12 (7.4%) |
| Total Housing Units | 468 (88.0%) | 64 (12.0%) |
Occupancy by Educational Attainment in Bayard
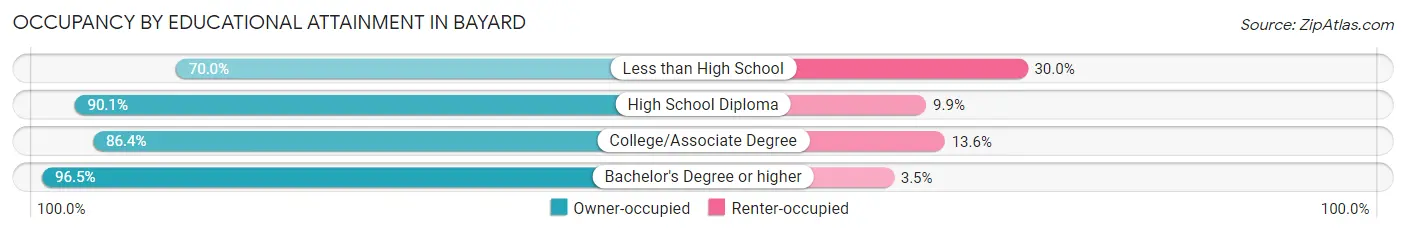
| Household Size | Owner-occupied | Renter-occupied |
| Less than High School | 35 (70.0%) | 15 (30.0%) |
| High School Diploma | 191 (90.1%) | 21 (9.9%) |
| College/Associate Degree | 159 (86.4%) | 25 (13.6%) |
| Bachelor's Degree or higher | 83 (96.5%) | 3 (3.5%) |
Occupancy by Age of Householder in Bayard
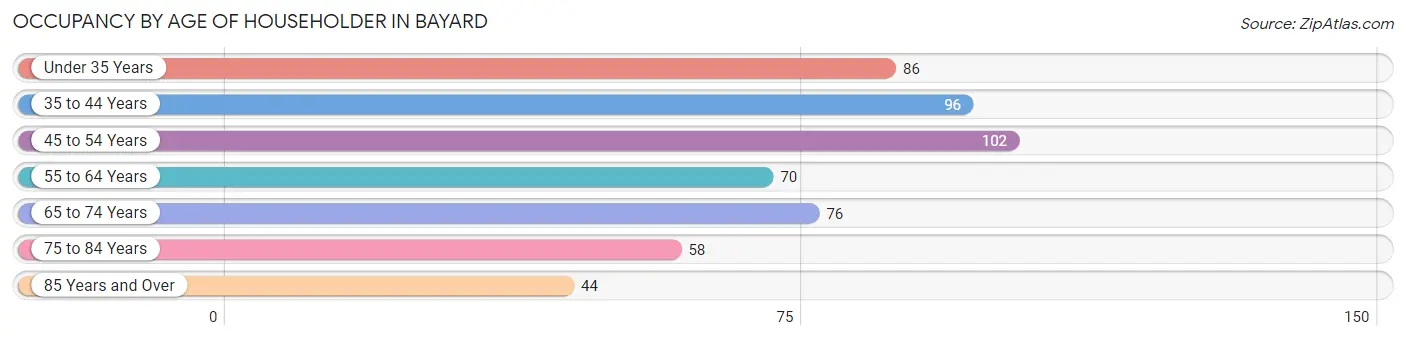
| Age Bracket | # Households | % Households |
| Under 35 Years | 86 | 16.2% |
| 35 to 44 Years | 96 | 18.0% |
| 45 to 54 Years | 102 | 19.2% |
| 55 to 64 Years | 70 | 13.2% |
| 65 to 74 Years | 76 | 14.3% |
| 75 to 84 Years | 58 | 10.9% |
| 85 Years and Over | 44 | 8.3% |
| Total | 532 | 100.0% |
Housing Finances in Bayard
Median Income by Occupancy in Bayard
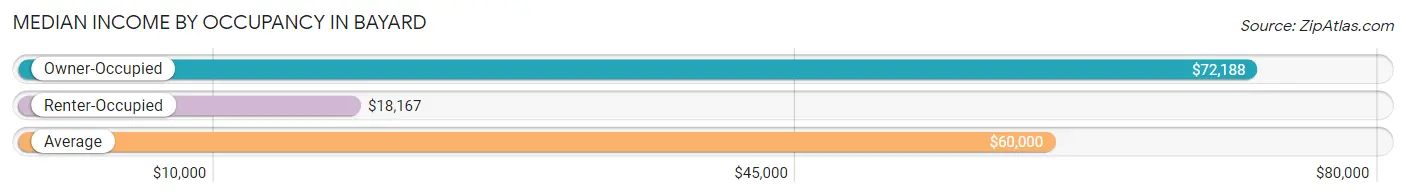
| Occupancy Type | # Households | Median Income |
| Owner-Occupied | 468 (88.0%) | $72,188 |
| Renter-Occupied | 64 (12.0%) | $18,167 |
| Average | 532 (100.0%) | $60,000 |
Occupancy by Householder Income Bracket in Bayard
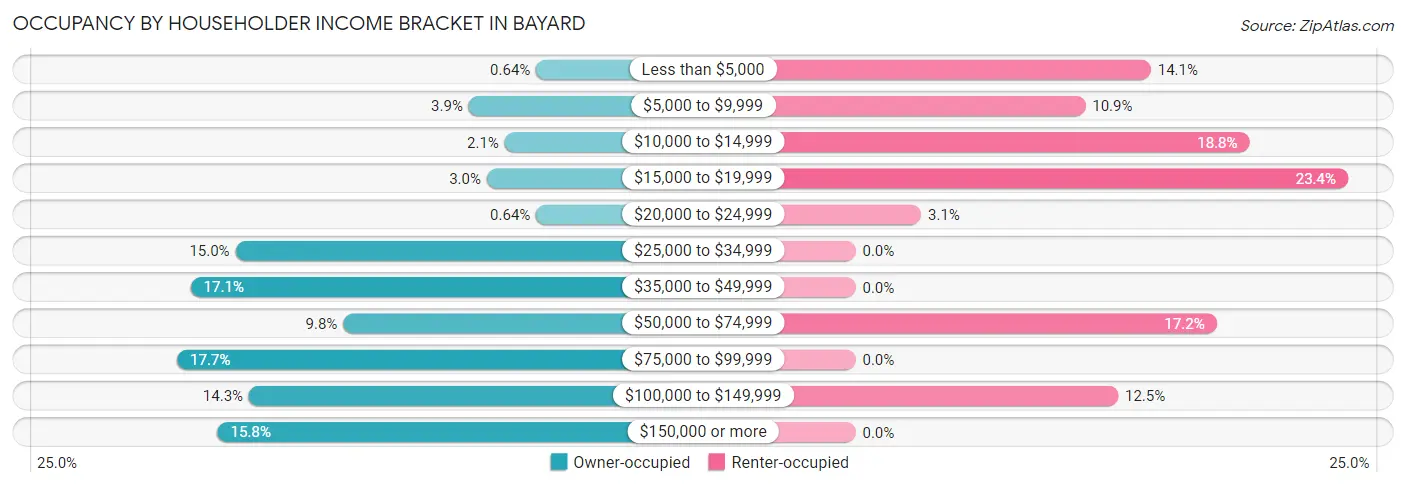
| Income Bracket | Owner-occupied | Renter-occupied |
| Less than $5,000 | 3 (0.6%) | 9 (14.1%) |
| $5,000 to $9,999 | 18 (3.8%) | 7 (10.9%) |
| $10,000 to $14,999 | 10 (2.1%) | 12 (18.8%) |
| $15,000 to $19,999 | 14 (3.0%) | 15 (23.4%) |
| $20,000 to $24,999 | 3 (0.6%) | 2 (3.1%) |
| $25,000 to $34,999 | 70 (15.0%) | 0 (0.0%) |
| $35,000 to $49,999 | 80 (17.1%) | 0 (0.0%) |
| $50,000 to $74,999 | 46 (9.8%) | 11 (17.2%) |
| $75,000 to $99,999 | 83 (17.7%) | 0 (0.0%) |
| $100,000 to $149,999 | 67 (14.3%) | 8 (12.5%) |
| $150,000 or more | 74 (15.8%) | 0 (0.0%) |
| Total | 468 (100.0%) | 64 (100.0%) |
Monthly Housing Cost Tiers in Bayard
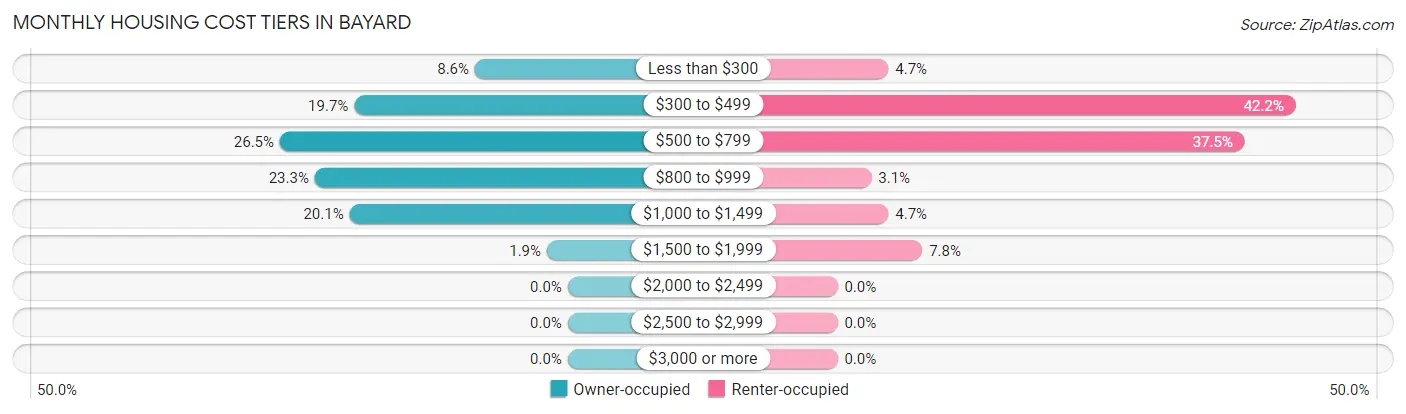
| Monthly Cost | Owner-occupied | Renter-occupied |
| Less than $300 | 40 (8.6%) | 3 (4.7%) |
| $300 to $499 | 92 (19.7%) | 27 (42.2%) |
| $500 to $799 | 124 (26.5%) | 24 (37.5%) |
| $800 to $999 | 109 (23.3%) | 2 (3.1%) |
| $1,000 to $1,499 | 94 (20.1%) | 3 (4.7%) |
| $1,500 to $1,999 | 9 (1.9%) | 5 (7.8%) |
| $2,000 to $2,499 | 0 (0.0%) | 0 (0.0%) |
| $2,500 to $2,999 | 0 (0.0%) | 0 (0.0%) |
| $3,000 or more | 0 (0.0%) | 0 (0.0%) |
| Total | 468 (100.0%) | 64 (100.0%) |
Physical Housing Characteristics in Bayard
Housing Structures in Bayard
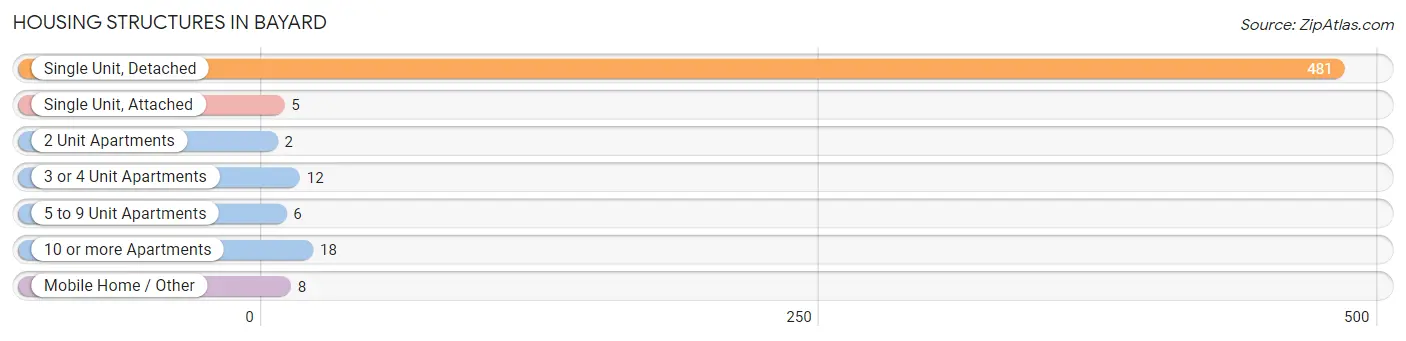
| Structure Type | # Housing Units | % Housing Units |
| Single Unit, Detached | 481 | 90.4% |
| Single Unit, Attached | 5 | 0.9% |
| 2 Unit Apartments | 2 | 0.4% |
| 3 or 4 Unit Apartments | 12 | 2.3% |
| 5 to 9 Unit Apartments | 6 | 1.1% |
| 10 or more Apartments | 18 | 3.4% |
| Mobile Home / Other | 8 | 1.5% |
| Total | 532 | 100.0% |
Housing Structures by Occupancy in Bayard
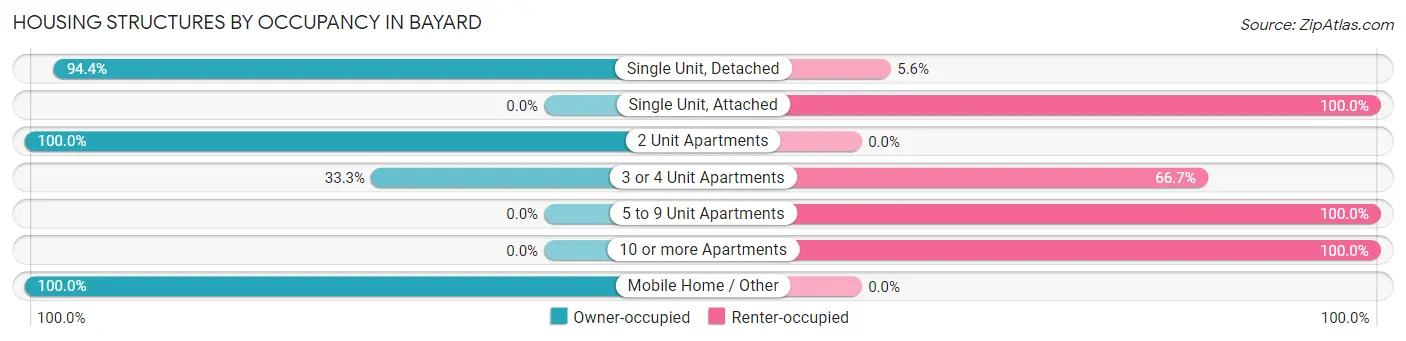
| Structure Type | Owner-occupied | Renter-occupied |
| Single Unit, Detached | 454 (94.4%) | 27 (5.6%) |
| Single Unit, Attached | 0 (0.0%) | 5 (100.0%) |
| 2 Unit Apartments | 2 (100.0%) | 0 (0.0%) |
| 3 or 4 Unit Apartments | 4 (33.3%) | 8 (66.7%) |
| 5 to 9 Unit Apartments | 0 (0.0%) | 6 (100.0%) |
| 10 or more Apartments | 0 (0.0%) | 18 (100.0%) |
| Mobile Home / Other | 8 (100.0%) | 0 (0.0%) |
| Total | 468 (88.0%) | 64 (12.0%) |
Housing Structures by Number of Rooms in Bayard
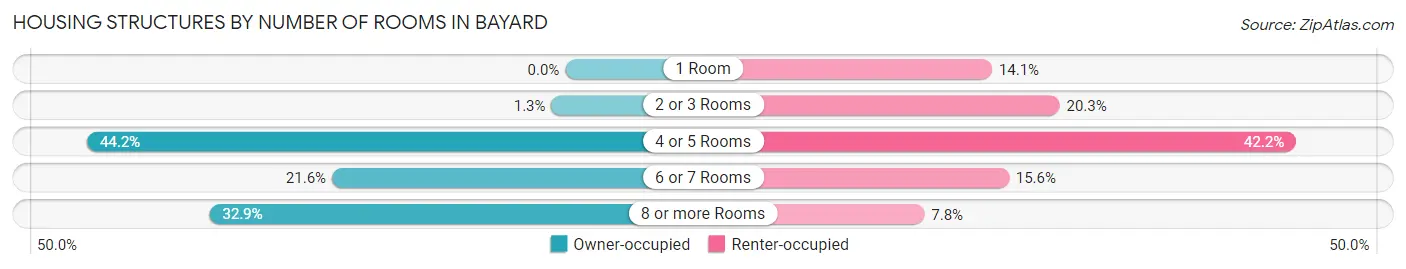
| Number of Rooms | Owner-occupied | Renter-occupied |
| 1 Room | 0 (0.0%) | 9 (14.1%) |
| 2 or 3 Rooms | 6 (1.3%) | 13 (20.3%) |
| 4 or 5 Rooms | 207 (44.2%) | 27 (42.2%) |
| 6 or 7 Rooms | 101 (21.6%) | 10 (15.6%) |
| 8 or more Rooms | 154 (32.9%) | 5 (7.8%) |
| Total | 468 (100.0%) | 64 (100.0%) |
Housing Structure by Heating Type in Bayard
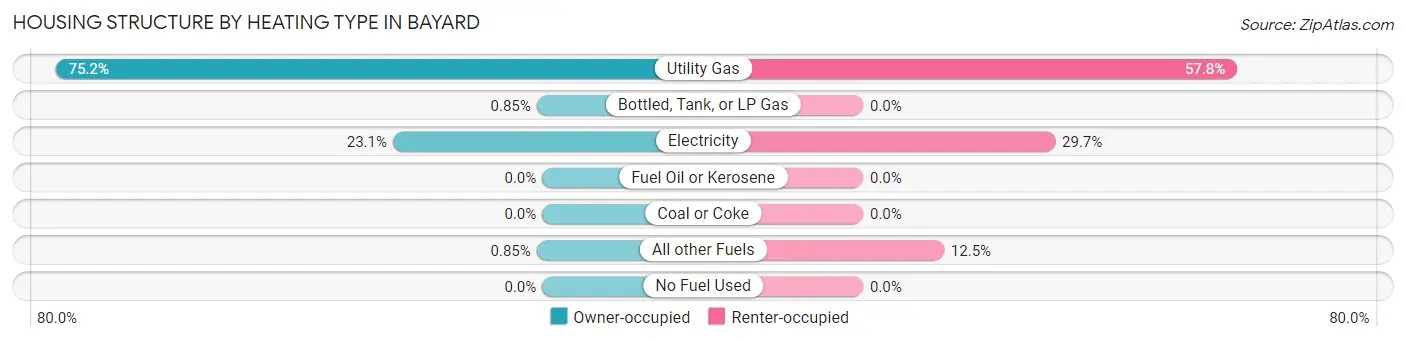
| Heating Type | Owner-occupied | Renter-occupied |
| Utility Gas | 352 (75.2%) | 37 (57.8%) |
| Bottled, Tank, or LP Gas | 4 (0.9%) | 0 (0.0%) |
| Electricity | 108 (23.1%) | 19 (29.7%) |
| Fuel Oil or Kerosene | 0 (0.0%) | 0 (0.0%) |
| Coal or Coke | 0 (0.0%) | 0 (0.0%) |
| All other Fuels | 4 (0.9%) | 8 (12.5%) |
| No Fuel Used | 0 (0.0%) | 0 (0.0%) |
| Total | 468 (100.0%) | 64 (100.0%) |
Household Vehicle Usage in Bayard
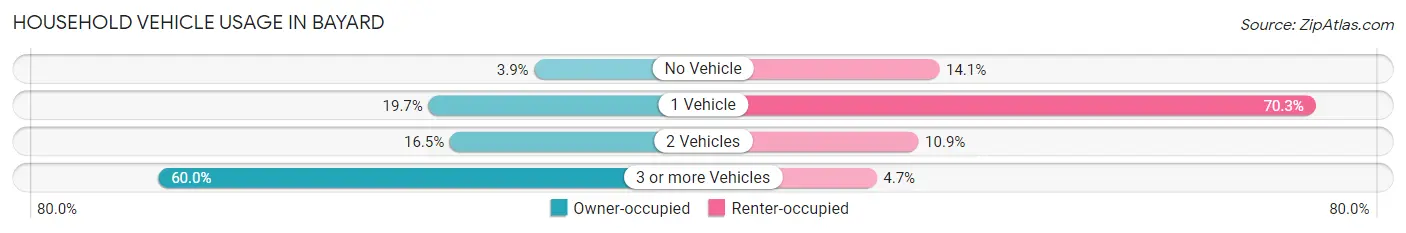
| Vehicles per Household | Owner-occupied | Renter-occupied |
| No Vehicle | 18 (3.8%) | 9 (14.1%) |
| 1 Vehicle | 92 (19.7%) | 45 (70.3%) |
| 2 Vehicles | 77 (16.5%) | 7 (10.9%) |
| 3 or more Vehicles | 281 (60.0%) | 3 (4.7%) |
| Total | 468 (100.0%) | 64 (100.0%) |
Real Estate & Mortgages in Bayard
Real Estate and Mortgage Overview in Bayard
| Characteristic | Without Mortgage | With Mortgage |
| Housing Units | 300 | 168 |
| Median Property Value | $105,400 | $85,300 |
| Median Household Income | $46,500 | $46 |
| Monthly Housing Costs | $518 | $0 |
| Real Estate Taxes | $955 | $20 |
Property Value by Mortgage Status in Bayard
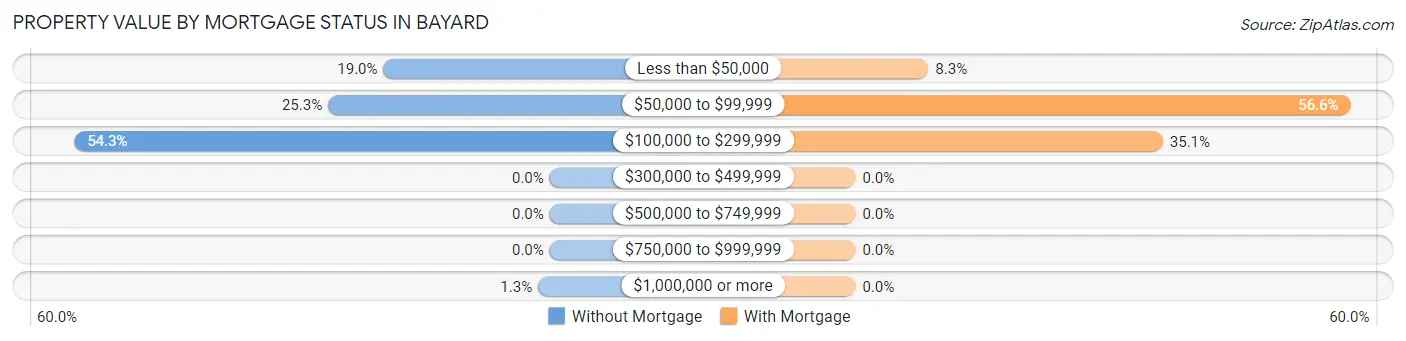
| Property Value | Without Mortgage | With Mortgage |
| Less than $50,000 | 57 (19.0%) | 14 (8.3%) |
| $50,000 to $99,999 | 76 (25.3%) | 95 (56.6%) |
| $100,000 to $299,999 | 163 (54.3%) | 59 (35.1%) |
| $300,000 to $499,999 | 0 (0.0%) | 0 (0.0%) |
| $500,000 to $749,999 | 0 (0.0%) | 0 (0.0%) |
| $750,000 to $999,999 | 0 (0.0%) | 0 (0.0%) |
| $1,000,000 or more | 4 (1.3%) | 0 (0.0%) |
| Total | 300 (100.0%) | 168 (100.0%) |
Household Income by Mortgage Status in Bayard
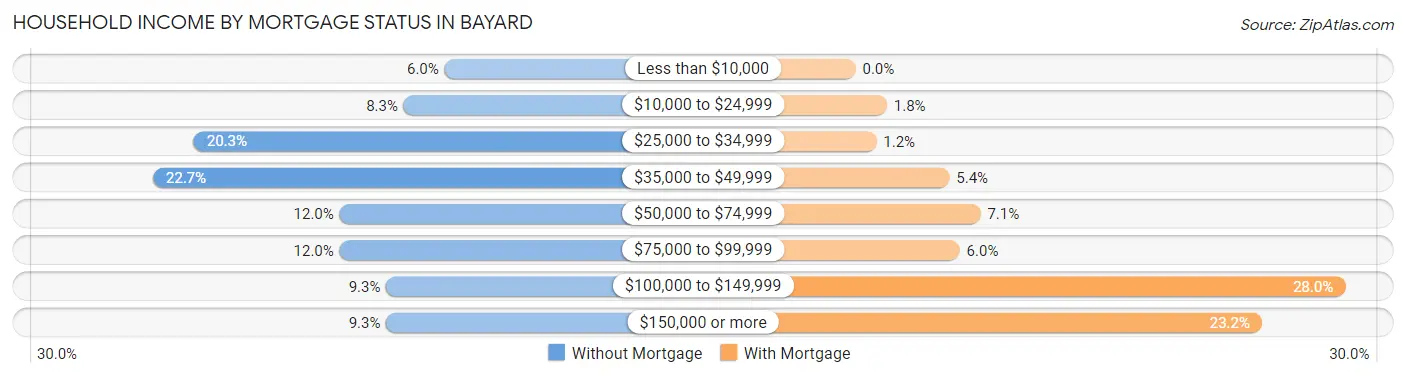
| Household Income | Without Mortgage | With Mortgage |
| Less than $10,000 | 18 (6.0%) | 0 (0.0%) |
| $10,000 to $24,999 | 25 (8.3%) | 3 (1.8%) |
| $25,000 to $34,999 | 61 (20.3%) | 2 (1.2%) |
| $35,000 to $49,999 | 68 (22.7%) | 9 (5.4%) |
| $50,000 to $74,999 | 36 (12.0%) | 12 (7.1%) |
| $75,000 to $99,999 | 36 (12.0%) | 10 (5.9%) |
| $100,000 to $149,999 | 28 (9.3%) | 47 (28.0%) |
| $150,000 or more | 28 (9.3%) | 39 (23.2%) |
| Total | 300 (100.0%) | 168 (100.0%) |
Property Value to Household Income Ratio in Bayard
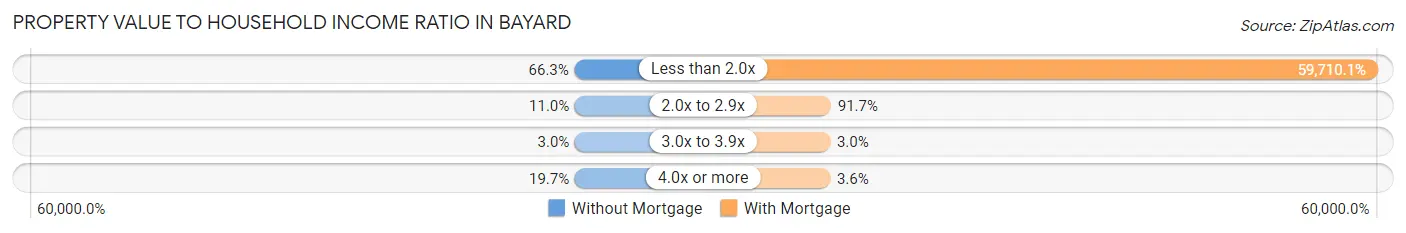
| Value-to-Income Ratio | Without Mortgage | With Mortgage |
| Less than 2.0x | 199 (66.3%) | 100,313 (59,710.1%) |
| 2.0x to 2.9x | 33 (11.0%) | 154 (91.7%) |
| 3.0x to 3.9x | 9 (3.0%) | 5 (3.0%) |
| 4.0x or more | 59 (19.7%) | 6 (3.6%) |
| Total | 300 (100.0%) | 168 (100.0%) |
Real Estate Taxes by Mortgage Status in Bayard
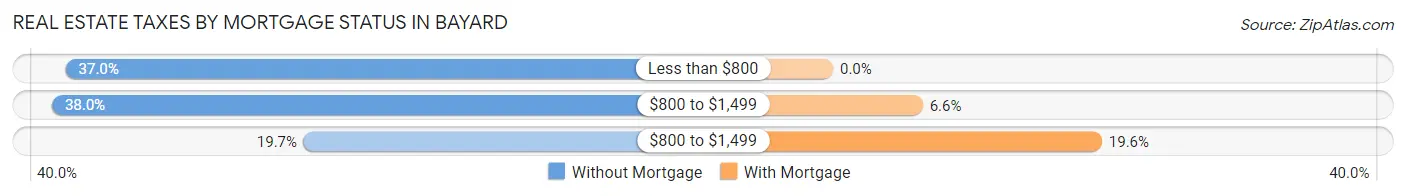
| Property Taxes | Without Mortgage | With Mortgage |
| Less than $800 | 111 (37.0%) | 0 (0.0%) |
| $800 to $1,499 | 114 (38.0%) | 11 (6.6%) |
| $800 to $1,499 | 59 (19.7%) | 33 (19.6%) |
| Total | 300 (100.0%) | 168 (100.0%) |
Health & Disability in Bayard
Health Insurance Coverage by Age in Bayard
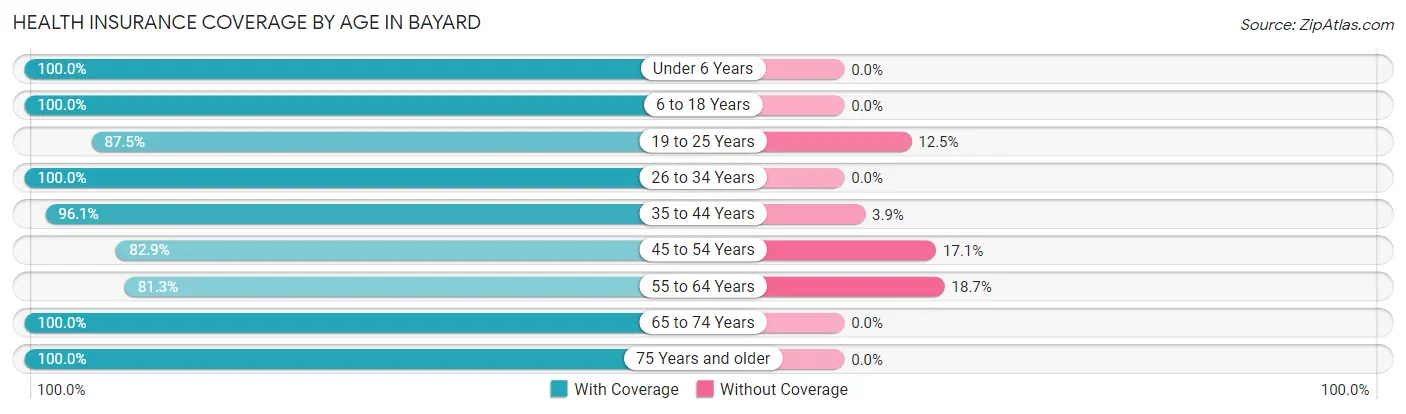
| Age Bracket | With Coverage | Without Coverage |
| Under 6 Years | 112 (100.0%) | 0 (0.0%) |
| 6 to 18 Years | 320 (100.0%) | 0 (0.0%) |
| 19 to 25 Years | 77 (87.5%) | 11 (12.5%) |
| 26 to 34 Years | 158 (100.0%) | 0 (0.0%) |
| 35 to 44 Years | 198 (96.1%) | 8 (3.9%) |
| 45 to 54 Years | 121 (82.9%) | 25 (17.1%) |
| 55 to 64 Years | 100 (81.3%) | 23 (18.7%) |
| 65 to 74 Years | 127 (100.0%) | 0 (0.0%) |
| 75 Years and older | 117 (100.0%) | 0 (0.0%) |
| Total | 1,330 (95.2%) | 67 (4.8%) |
Health Insurance Coverage by Citizenship Status in Bayard
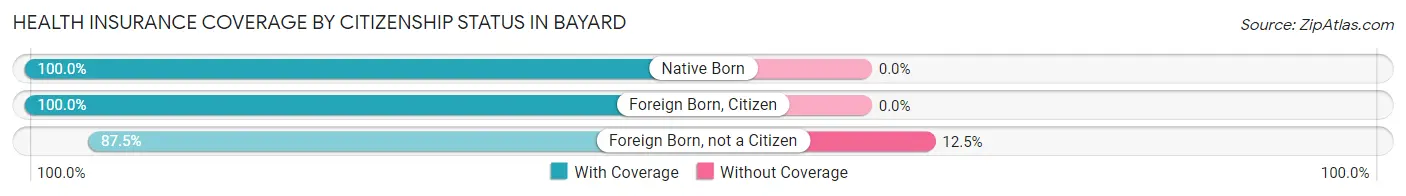
| Citizenship Status | With Coverage | Without Coverage |
| Native Born | 112 (100.0%) | 0 (0.0%) |
| Foreign Born, Citizen | 320 (100.0%) | 0 (0.0%) |
| Foreign Born, not a Citizen | 77 (87.5%) | 11 (12.5%) |
Health Insurance Coverage by Household Income in Bayard
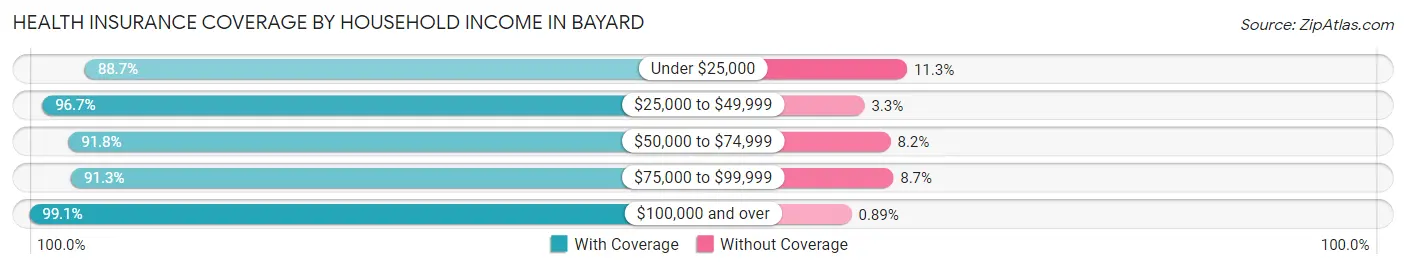
| Household Income | With Coverage | Without Coverage |
| Under $25,000 | 118 (88.7%) | 15 (11.3%) |
| $25,000 to $49,999 | 234 (96.7%) | 8 (3.3%) |
| $50,000 to $74,999 | 157 (91.8%) | 14 (8.2%) |
| $75,000 to $99,999 | 262 (91.3%) | 25 (8.7%) |
| $100,000 and over | 559 (99.1%) | 5 (0.9%) |
Public vs Private Health Insurance Coverage by Age in Bayard
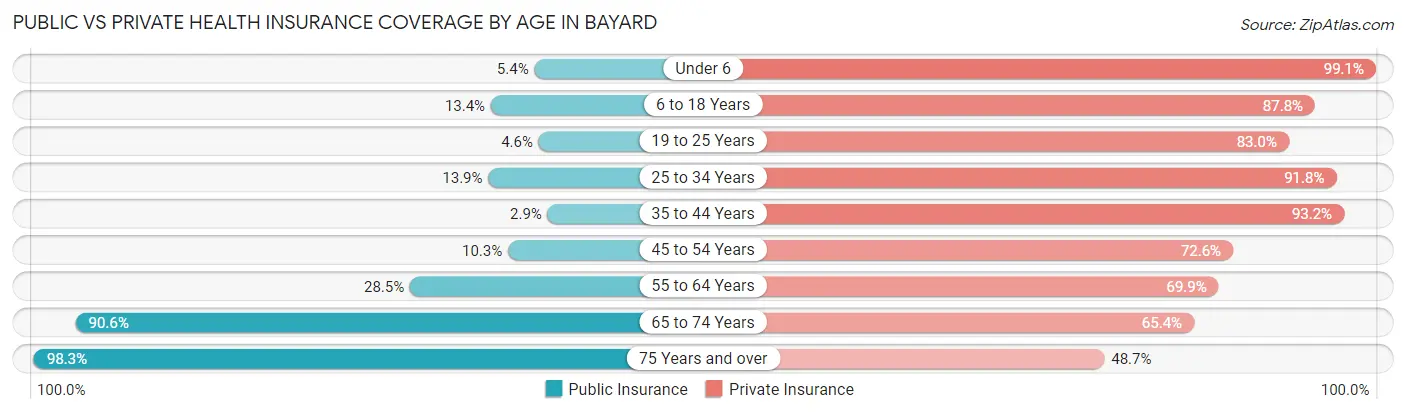
| Age Bracket | Public Insurance | Private Insurance |
| Under 6 | 6 (5.4%) | 111 (99.1%) |
| 6 to 18 Years | 43 (13.4%) | 281 (87.8%) |
| 19 to 25 Years | 4 (4.5%) | 73 (83.0%) |
| 25 to 34 Years | 22 (13.9%) | 145 (91.8%) |
| 35 to 44 Years | 6 (2.9%) | 192 (93.2%) |
| 45 to 54 Years | 15 (10.3%) | 106 (72.6%) |
| 55 to 64 Years | 35 (28.5%) | 86 (69.9%) |
| 65 to 74 Years | 115 (90.5%) | 83 (65.3%) |
| 75 Years and over | 115 (98.3%) | 57 (48.7%) |
| Total | 361 (25.8%) | 1,134 (81.2%) |
Disability Status by Sex by Age in Bayard
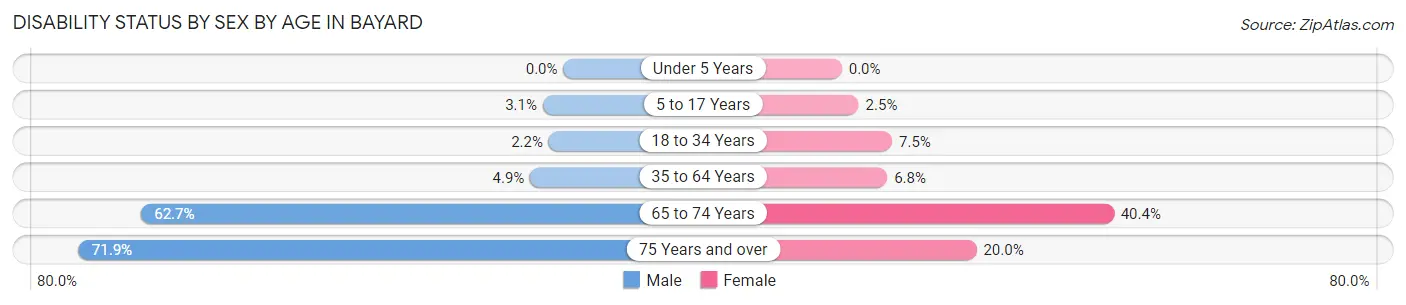
| Age Bracket | Male | Female |
| Under 5 Years | 0 (0.0%) | 0 (0.0%) |
| 5 to 17 Years | 4 (3.0%) | 2 (2.5%) |
| 18 to 34 Years | 4 (2.2%) | 13 (7.5%) |
| 35 to 64 Years | 11 (4.9%) | 17 (6.8%) |
| 65 to 74 Years | 47 (62.7%) | 21 (40.4%) |
| 75 Years and over | 41 (71.9%) | 12 (20.0%) |
Disability Class by Sex by Age in Bayard
Disability Class: Hearing Difficulty
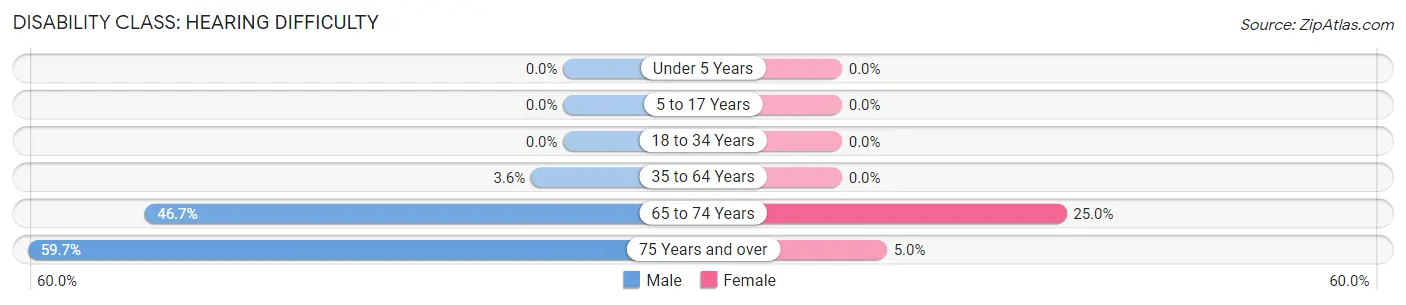
| Age Bracket | Male | Female |
| Under 5 Years | 0 (0.0%) | 0 (0.0%) |
| 5 to 17 Years | 0 (0.0%) | 0 (0.0%) |
| 18 to 34 Years | 0 (0.0%) | 0 (0.0%) |
| 35 to 64 Years | 8 (3.6%) | 0 (0.0%) |
| 65 to 74 Years | 35 (46.7%) | 13 (25.0%) |
| 75 Years and over | 34 (59.7%) | 3 (5.0%) |
Disability Class: Vision Difficulty
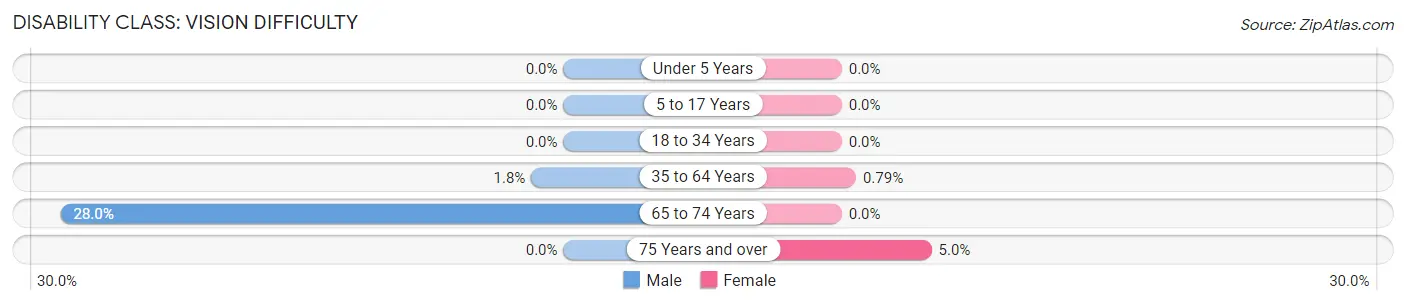
| Age Bracket | Male | Female |
| Under 5 Years | 0 (0.0%) | 0 (0.0%) |
| 5 to 17 Years | 0 (0.0%) | 0 (0.0%) |
| 18 to 34 Years | 0 (0.0%) | 0 (0.0%) |
| 35 to 64 Years | 4 (1.8%) | 2 (0.8%) |
| 65 to 74 Years | 21 (28.0%) | 0 (0.0%) |
| 75 Years and over | 0 (0.0%) | 3 (5.0%) |
Disability Class: Cognitive Difficulty
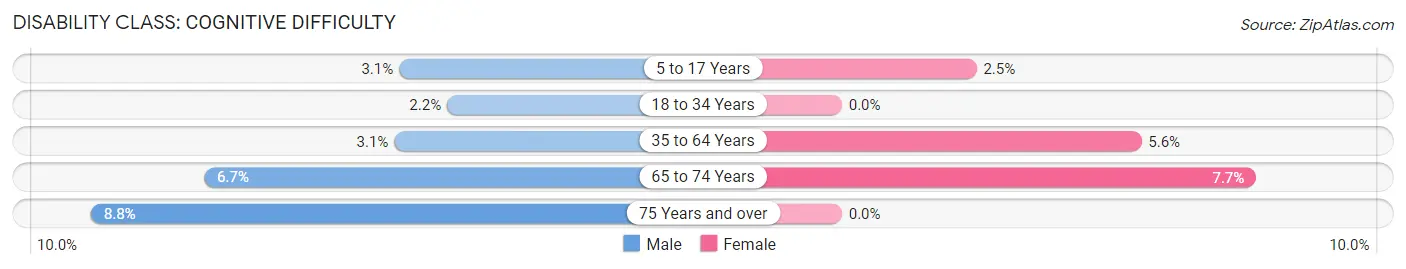
| Age Bracket | Male | Female |
| 5 to 17 Years | 4 (3.0%) | 2 (2.5%) |
| 18 to 34 Years | 4 (2.2%) | 0 (0.0%) |
| 35 to 64 Years | 7 (3.1%) | 14 (5.6%) |
| 65 to 74 Years | 5 (6.7%) | 4 (7.7%) |
| 75 Years and over | 5 (8.8%) | 0 (0.0%) |
Disability Class: Ambulatory Difficulty
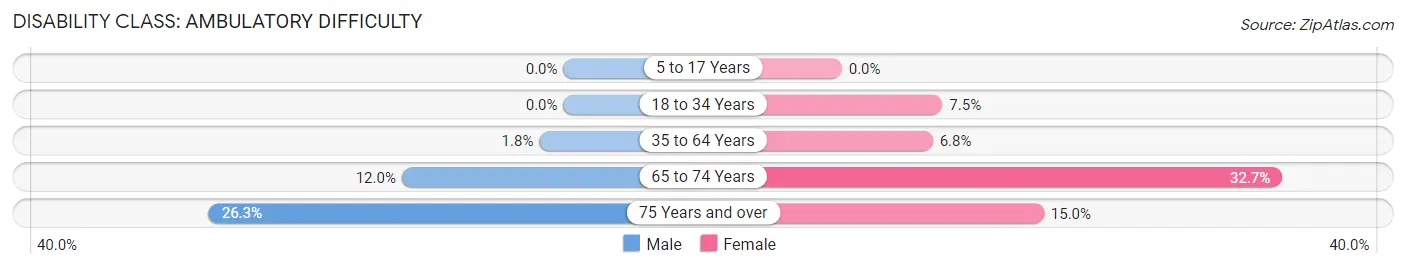
| Age Bracket | Male | Female |
| 5 to 17 Years | 0 (0.0%) | 0 (0.0%) |
| 18 to 34 Years | 0 (0.0%) | 13 (7.5%) |
| 35 to 64 Years | 4 (1.8%) | 17 (6.8%) |
| 65 to 74 Years | 9 (12.0%) | 17 (32.7%) |
| 75 Years and over | 15 (26.3%) | 9 (15.0%) |
Disability Class: Self-Care Difficulty
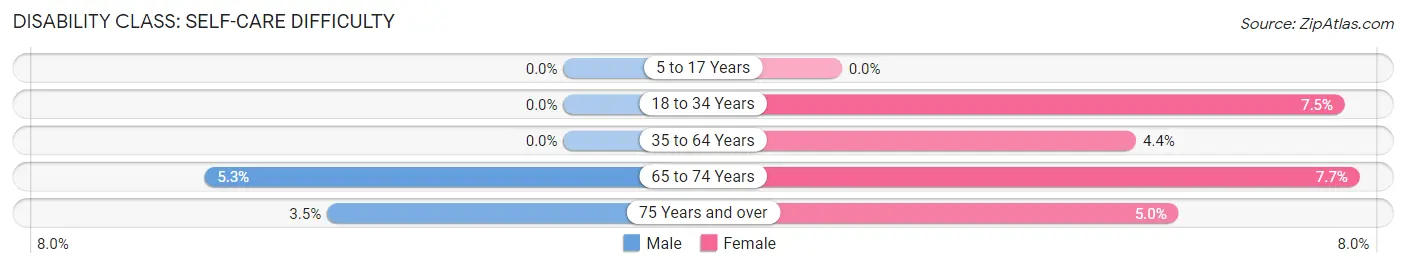
| Age Bracket | Male | Female |
| 5 to 17 Years | 0 (0.0%) | 0 (0.0%) |
| 18 to 34 Years | 0 (0.0%) | 13 (7.5%) |
| 35 to 64 Years | 0 (0.0%) | 11 (4.4%) |
| 65 to 74 Years | 4 (5.3%) | 4 (7.7%) |
| 75 Years and over | 2 (3.5%) | 3 (5.0%) |
Technology Access in Bayard
Computing Device Access in Bayard
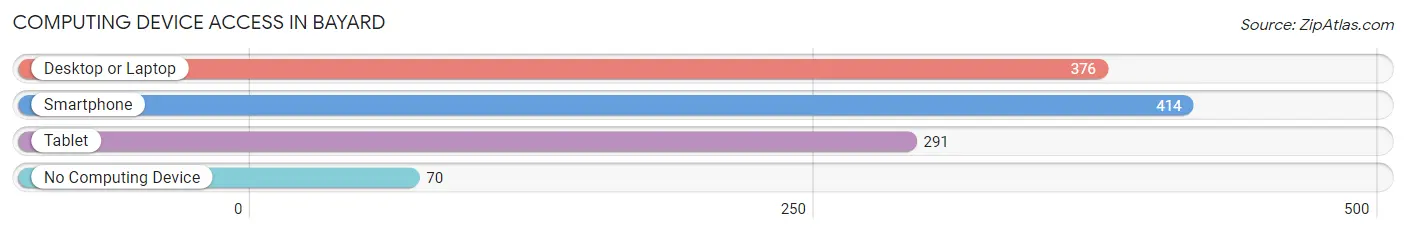
| Device Type | # Households | % Households |
| Desktop or Laptop | 376 | 70.7% |
| Smartphone | 414 | 77.8% |
| Tablet | 291 | 54.7% |
| No Computing Device | 70 | 13.2% |
| Total | 532 | 100.0% |
Internet Access in Bayard
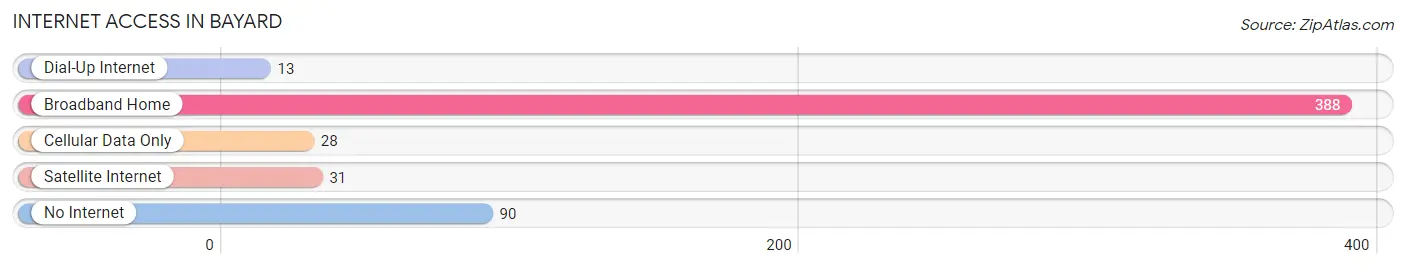
| Internet Type | # Households | % Households |
| Dial-Up Internet | 13 | 2.4% |
| Broadband Home | 388 | 72.9% |
| Cellular Data Only | 28 | 5.3% |
| Satellite Internet | 31 | 5.8% |
| No Internet | 90 | 16.9% |
| Total | 532 | 100.0% |
Bayard Summary
Bayard is a city located in the western part of Nebraska, in the United States. It is the county seat of Morrill County and is located along the North Platte River. The city has a population of 1,619 people, according to the 2010 census.
History
The area that is now Bayard was first settled in the late 1800s by homesteaders. The town was originally called "Cottonwood Springs" and was located near the present-day town of Bayard. In 1887, the town was renamed "Bayard" after General George D. Bayard, a Civil War hero.
The town was officially incorporated in 1891 and was the first town in Morrill County. The town grew quickly and by 1900, it had a population of over 500 people.
Geography
Bayard is located in western Nebraska, in the United States. It is the county seat of Morrill County and is located along the North Platte River. The city has a total area of 1.2 square miles, all of which is land.
The city is located in the High Plains region of the Great Plains. The climate is semi-arid, with hot summers and cold winters. The average annual precipitation is 16.5 inches.
Economy
The economy of Bayard is largely based on agriculture. The city is home to several large farms and ranches, as well as a number of smaller farms. The city is also home to several businesses, including a grocery store, a hardware store, and a restaurant.
Demographics
According to the 2010 census, the population of Bayard was 1,619 people. The racial makeup of the city was 95.2% White, 0.2% African American, 0.7% Native American, 0.2% Asian, 0.1% Pacific Islander, 1.7% from other races, and 1.9% from two or more races. Hispanic or Latino of any race were 4.2% of the population.
The median income for a household in the city was $37,500, and the median income for a family was $45,000. The per capita income for the city was $17,845. About 11.2% of families and 14.2% of the population were below the poverty line, including 18.2% of those under age 18 and 8.3% of those age 65 or over.
Bayard is served by the Bayard Public Schools, which includes an elementary school, a middle school, and a high school. The city is also home to a branch of the Morrill County Library.
Common Questions
What is Per Capita Income in Bayard?
Per Capita income in Bayard is $27,099.
What is the Median Family Income in Bayard?
Median Family Income in Bayard is $79,899.
What is the Median Household income in Bayard?
Median Household Income in Bayard is $60,000.
What is Income or Wage Gap in Bayard?
Income or Wage Gap in Bayard is 6.6%.
Women in Bayard earn 93.4 cents for every dollar earned by a man.
What is Inequality or Gini Index in Bayard?
Inequality or Gini Index in Bayard is 0.41.
What is the Total Population of Bayard?
Total Population of Bayard is 1,435.
What is the Total Male Population of Bayard?
Total Male Population of Bayard is 748.
What is the Total Female Population of Bayard?
Total Female Population of Bayard is 687.
What is the Ratio of Males per 100 Females in Bayard?
There are 108.88 Males per 100 Females in Bayard.
What is the Ratio of Females per 100 Males in Bayard?
There are 91.84 Females per 100 Males in Bayard.
What is the Median Population Age in Bayard?
Median Population Age in Bayard is 38.2 Years.
What is the Average Family Size in Bayard
Average Family Size in Bayard is 3.5 People.
What is the Average Household Size in Bayard
Average Household Size in Bayard is 2.6 People.
How Large is the Labor Force in Bayard?
There are 750 People in the Labor Forcein in Bayard.
What is the Percentage of People in the Labor Force in Bayard?
63.2% of People are in the Labor Force in Bayard.
What is the Unemployment Rate in Bayard?
Unemployment Rate in Bayard is 2.4%.