Martinez, CA Map & Demographics
Martinez Map
Martinez Overview
$61,048
PER CAPITA INCOME
$149,100
AVG FAMILY INCOME
$124,669
AVG HOUSEHOLD INCOME
27.3%
WAGE / INCOME GAP [ % ]
72.7¢/ $1
WAGE / INCOME GAP [ $ ]
0.41
INEQUALITY / GINI INDEX
37,093
TOTAL POPULATION
18,548
MALE POPULATION
18,545
FEMALE POPULATION
100.02
MALES / 100 FEMALES
99.98
FEMALES / 100 MALES
42.1
MEDIAN AGE
3.0
AVG FAMILY SIZE
2.5
AVG HOUSEHOLD SIZE
20,479
LABOR FORCE [ PEOPLE ]
67.9%
PERCENT IN LABOR FORCE
4.9%
UNEMPLOYMENT RATE
Martinez Zip Codes
Martinez Area Codes
Income in Martinez
Income Overview in Martinez
Per Capita Income in Martinez is $61,048, while median incomes of families and households are $149,100 and $124,669 respectively.
| Characteristic | Number | Measure |
| Per Capita Income | 37,093 | $61,048 |
| Median Family Income | 9,638 | $149,100 |
| Mean Family Income | 9,638 | $172,113 |
| Median Household Income | 14,615 | $124,669 |
| Mean Household Income | 14,615 | $152,099 |
| Income Deficit | 9,638 | $0 |
| Wage / Income Gap (%) | 37,093 | 27.33% |
| Wage / Income Gap ($) | 37,093 | 72.67¢ per $1 |
| Gini / Inequality Index | 37,093 | 0.41 |
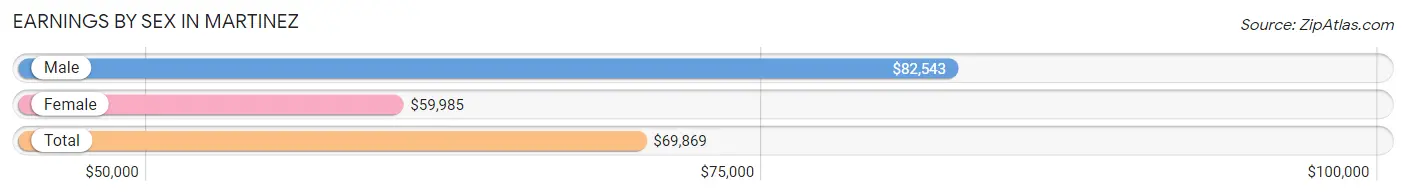
Earnings by Sex in Martinez
Average Earnings in Martinez are $69,869, $82,543 for men and $59,985 for women, a difference of 27.3%.
| Sex | Number | Average Earnings |
| Male | 10,816 (51.7%) | $82,543 |
| Female | 10,087 (48.3%) | $59,985 |
| Total | 20,903 (100.0%) | $69,869 |
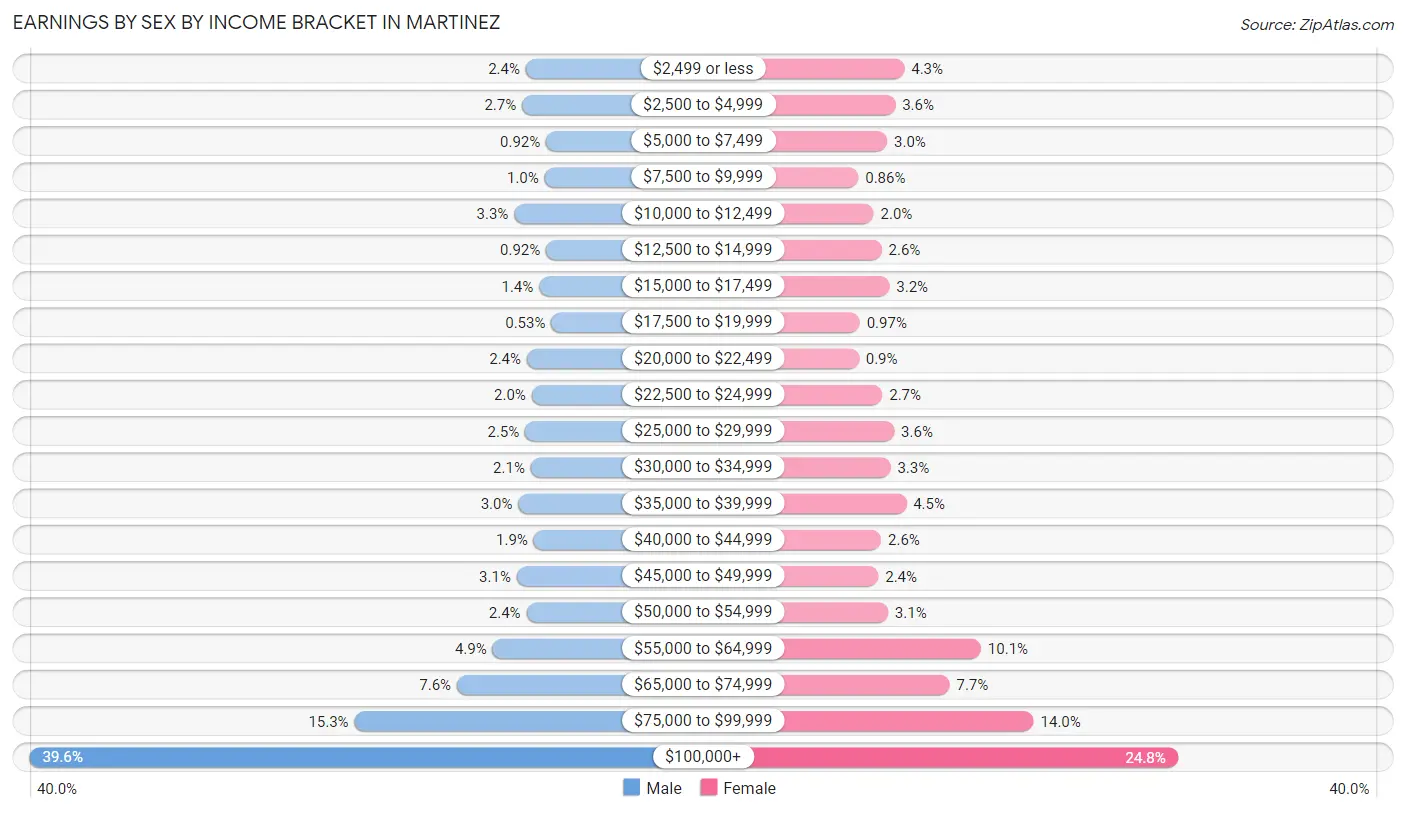
Earnings by Sex by Income Bracket in Martinez
The most common earnings brackets in Martinez are $100,000+ for men (4,286 | 39.6%) and $100,000+ for women (2,501 | 24.8%).
| Income | Male | Female |
| $2,499 or less | 264 (2.4%) | 435 (4.3%) |
| $2,500 to $4,999 | 294 (2.7%) | 366 (3.6%) |
| $5,000 to $7,499 | 99 (0.9%) | 305 (3.0%) |
| $7,500 to $9,999 | 111 (1.0%) | 87 (0.9%) |
| $10,000 to $12,499 | 358 (3.3%) | 203 (2.0%) |
| $12,500 to $14,999 | 99 (0.9%) | 263 (2.6%) |
| $15,000 to $17,499 | 156 (1.4%) | 322 (3.2%) |
| $17,500 to $19,999 | 57 (0.5%) | 98 (1.0%) |
| $20,000 to $22,499 | 255 (2.4%) | 91 (0.9%) |
| $22,500 to $24,999 | 216 (2.0%) | 268 (2.7%) |
| $25,000 to $29,999 | 269 (2.5%) | 358 (3.5%) |
| $30,000 to $34,999 | 224 (2.1%) | 330 (3.3%) |
| $35,000 to $39,999 | 324 (3.0%) | 449 (4.4%) |
| $40,000 to $44,999 | 200 (1.8%) | 259 (2.6%) |
| $45,000 to $49,999 | 338 (3.1%) | 238 (2.4%) |
| $50,000 to $54,999 | 258 (2.4%) | 311 (3.1%) |
| $55,000 to $64,999 | 533 (4.9%) | 1,014 (10.1%) |
| $65,000 to $74,999 | 822 (7.6%) | 777 (7.7%) |
| $75,000 to $99,999 | 1,653 (15.3%) | 1,412 (14.0%) |
| $100,000+ | 4,286 (39.6%) | 2,501 (24.8%) |
| Total | 10,816 (100.0%) | 10,087 (100.0%) |
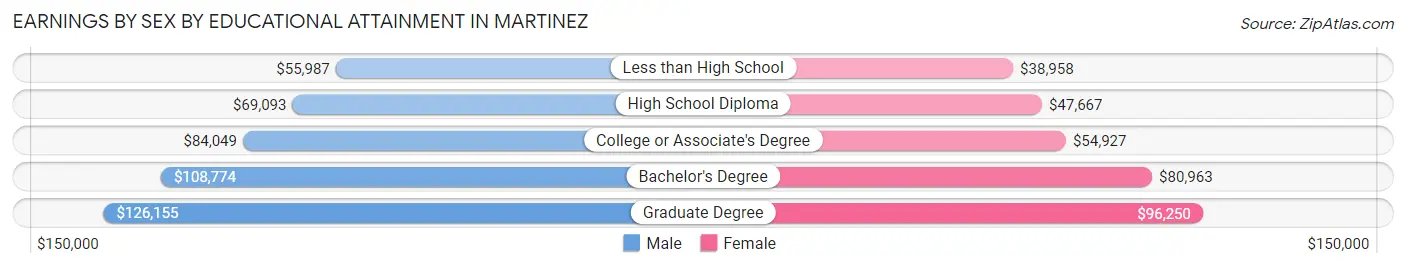
Earnings by Sex by Educational Attainment in Martinez
Average earnings in Martinez are $91,352 for men and $66,724 for women, a difference of 27.0%. Men with an educational attainment of graduate degree enjoy the highest average annual earnings of $126,155, while those with less than high school education earn the least with $55,987. Women with an educational attainment of graduate degree earn the most with the average annual earnings of $96,250, while those with less than high school education have the smallest earnings of $38,958.
| Educational Attainment | Male Income | Female Income |
| Less than High School | $55,987 | $38,958 |
| High School Diploma | $69,093 | $47,667 |
| College or Associate's Degree | $84,049 | $54,927 |
| Bachelor's Degree | $108,774 | $80,963 |
| Graduate Degree | $126,155 | $96,250 |
| Total | $91,352 | $66,724 |
Family Income in Martinez
Family Income Brackets in Martinez
According to the Martinez family income data, there are 3,036 families falling into the $200,000+ income range, which is the most common income bracket and makes up 31.5% of all families. Conversely, the $10,000 to $14,999 income bracket is the least frequent group with only 39 families (0.4%) belonging to this category.
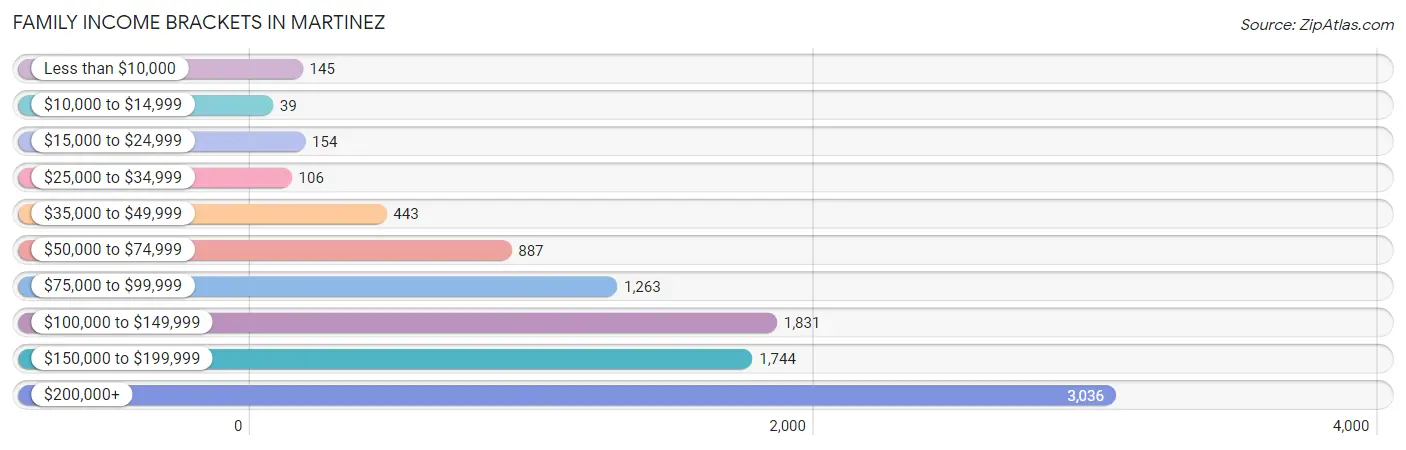
| Income Bracket | # Families | % Families |
| Less than $10,000 | 145 | 1.5% |
| $10,000 to $14,999 | 39 | 0.4% |
| $15,000 to $24,999 | 154 | 1.6% |
| $25,000 to $34,999 | 106 | 1.1% |
| $35,000 to $49,999 | 443 | 4.6% |
| $50,000 to $74,999 | 887 | 9.2% |
| $75,000 to $99,999 | 1,263 | 13.1% |
| $100,000 to $149,999 | 1,831 | 19.0% |
| $150,000 to $199,999 | 1,744 | 18.1% |
| $200,000+ | 3,036 | 31.5% |
Family Income by Famaliy Size in Martinez
7+ person families (15 | 0.2%) account for the highest median family income in Martinez with $250,001 per family, while 2-person families (4,395 | 45.6%) have the highest median income of $56,468 per family member.
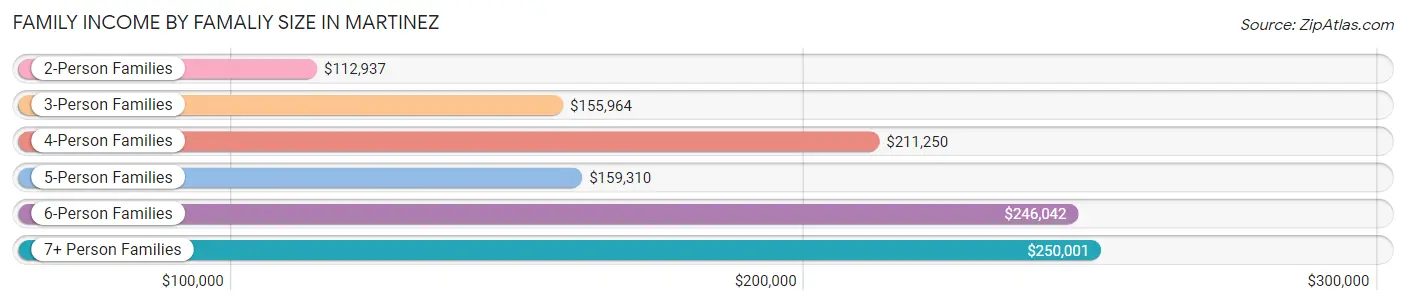
| Income Bracket | # Families | Median Income |
| 2-Person Families | 4,395 (45.6%) | $112,937 |
| 3-Person Families | 2,265 (23.5%) | $155,964 |
| 4-Person Families | 2,286 (23.7%) | $211,250 |
| 5-Person Families | 569 (5.9%) | $159,310 |
| 6-Person Families | 108 (1.1%) | $246,042 |
| 7+ Person Families | 15 (0.2%) | $250,001 |
| Total | 9,638 (100.0%) | $149,100 |
Family Income by Number of Earners in Martinez
The median family income in Martinez is $149,100, with families comprising 3+ earners (1,118) having the highest median family income of $223,696, while families with no earners (1,354) have the lowest median family income of $83,981, accounting for 11.6% and 14.1% of families, respectively.
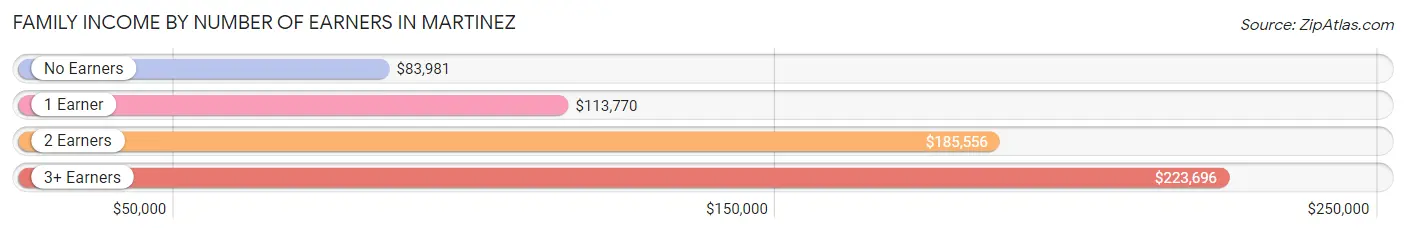
| Number of Earners | # Families | Median Income |
| No Earners | 1,354 (14.1%) | $83,981 |
| 1 Earner | 2,826 (29.3%) | $113,770 |
| 2 Earners | 4,340 (45.0%) | $185,556 |
| 3+ Earners | 1,118 (11.6%) | $223,696 |
| Total | 9,638 (100.0%) | $149,100 |
Household Income in Martinez
Household Income Brackets in Martinez
With 3,698 households falling in the category, the $200,000+ income range is the most frequent in Martinez, accounting for 25.3% of all households. In contrast, only 322 households (2.2%) fall into the $10,000 to $14,999 income bracket, making it the least populous group.
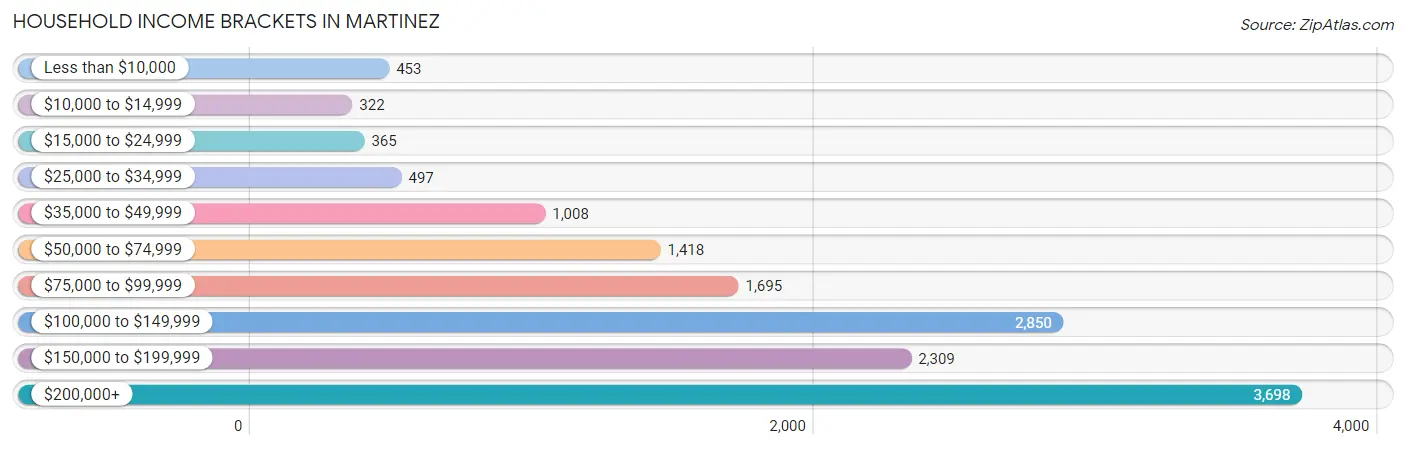
| Income Bracket | # Households | % Households |
| Less than $10,000 | 453 | 3.1% |
| $10,000 to $14,999 | 322 | 2.2% |
| $15,000 to $24,999 | 365 | 2.5% |
| $25,000 to $34,999 | 497 | 3.4% |
| $35,000 to $49,999 | 1,008 | 6.9% |
| $50,000 to $74,999 | 1,418 | 9.7% |
| $75,000 to $99,999 | 1,695 | 11.6% |
| $100,000 to $149,999 | 2,850 | 19.5% |
| $150,000 to $199,999 | 2,309 | 15.8% |
| $200,000+ | 3,698 | 25.3% |
Household Income by Householder Age in Martinez
The median household income in Martinez is $124,669, with the highest median household income of $158,235 found in the 25 to 44 years age bracket for the primary householder. A total of 4,674 households (32.0%) fall into this category. Meanwhile, the 65+ years age bracket for the primary householder has the lowest median household income of $87,875, with 3,716 households (25.4%) in this group.
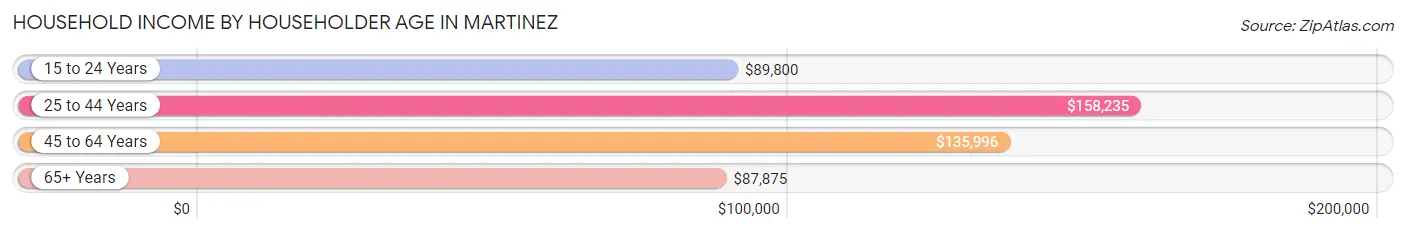
| Income Bracket | # Households | Median Income |
| 15 to 24 Years | 196 (1.3%) | $89,800 |
| 25 to 44 Years | 4,674 (32.0%) | $158,235 |
| 45 to 64 Years | 6,029 (41.2%) | $135,996 |
| 65+ Years | 3,716 (25.4%) | $87,875 |
| Total | 14,615 (100.0%) | $124,669 |
Poverty in Martinez
Income Below Poverty by Sex and Age in Martinez
With 4.7% poverty level for males and 6.0% for females among the residents of Martinez, 15 year old males and 18 to 24 year old females are the most vulnerable to poverty, with 14 males (12.1%) and 165 females (13.1%) in their respective age groups living below the poverty level.
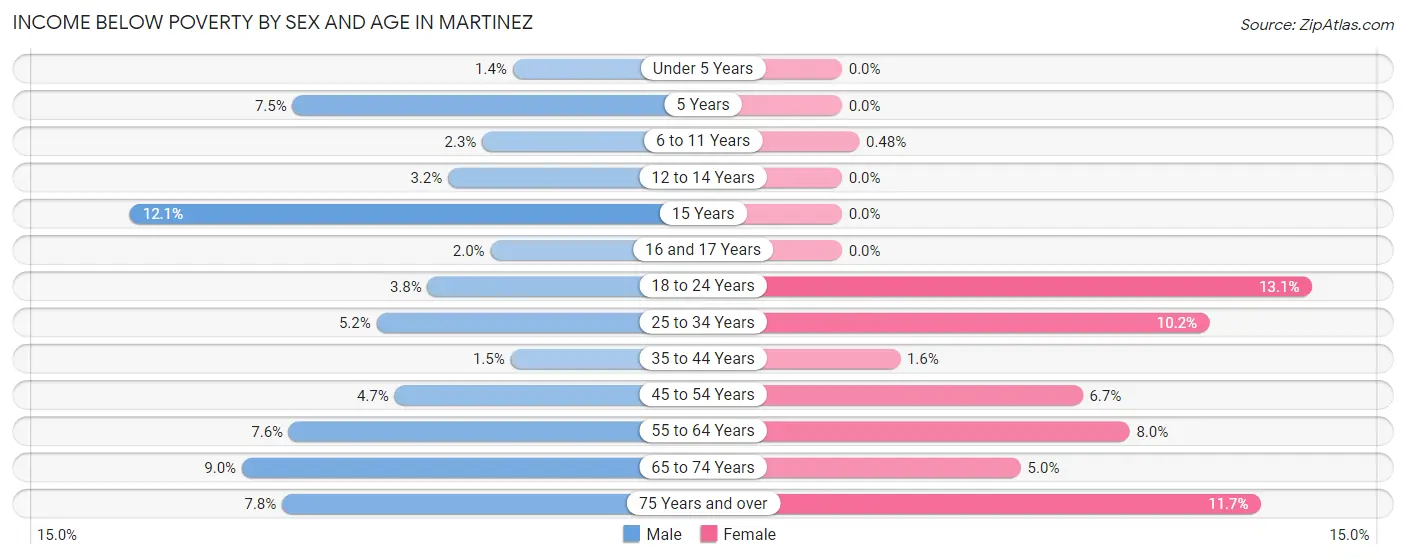
| Age Bracket | Male | Female |
| Under 5 Years | 19 (1.4%) | 0 (0.0%) |
| 5 Years | 19 (7.5%) | 0 (0.0%) |
| 6 to 11 Years | 30 (2.3%) | 5 (0.5%) |
| 12 to 14 Years | 18 (3.2%) | 0 (0.0%) |
| 15 Years | 14 (12.1%) | 0 (0.0%) |
| 16 and 17 Years | 11 (2.0%) | 0 (0.0%) |
| 18 to 24 Years | 47 (3.8%) | 165 (13.1%) |
| 25 to 34 Years | 118 (5.2%) | 207 (10.2%) |
| 35 to 44 Years | 43 (1.5%) | 45 (1.6%) |
| 45 to 54 Years | 105 (4.7%) | 159 (6.7%) |
| 55 to 64 Years | 201 (7.6%) | 237 (8.0%) |
| 65 to 74 Years | 151 (8.9%) | 108 (5.0%) |
| 75 Years and over | 77 (7.8%) | 166 (11.7%) |
| Total | 853 (4.7%) | 1,092 (6.0%) |
Income Above Poverty by Sex and Age in Martinez
According to the poverty statistics in Martinez, males aged under 5 years and females aged under 5 years are the age groups that are most secure financially, with 98.6% of males and 100.0% of females in these age groups living above the poverty line.
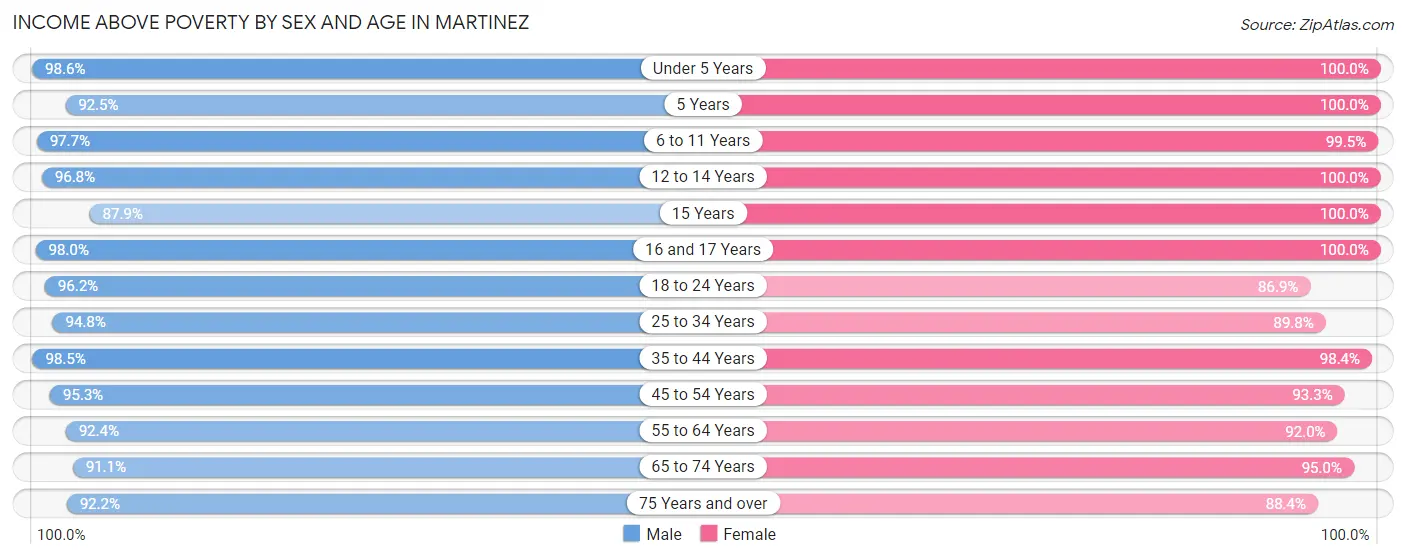
| Age Bracket | Male | Female |
| Under 5 Years | 1,326 (98.6%) | 1,281 (100.0%) |
| 5 Years | 233 (92.5%) | 277 (100.0%) |
| 6 to 11 Years | 1,297 (97.7%) | 1,030 (99.5%) |
| 12 to 14 Years | 542 (96.8%) | 466 (100.0%) |
| 15 Years | 102 (87.9%) | 71 (100.0%) |
| 16 and 17 Years | 530 (98.0%) | 215 (100.0%) |
| 18 to 24 Years | 1,197 (96.2%) | 1,097 (86.9%) |
| 25 to 34 Years | 2,150 (94.8%) | 1,819 (89.8%) |
| 35 to 44 Years | 2,877 (98.5%) | 2,726 (98.4%) |
| 45 to 54 Years | 2,130 (95.3%) | 2,215 (93.3%) |
| 55 to 64 Years | 2,429 (92.4%) | 2,720 (92.0%) |
| 65 to 74 Years | 1,537 (91.0%) | 2,062 (95.0%) |
| 75 Years and over | 907 (92.2%) | 1,259 (88.3%) |
| Total | 17,257 (95.3%) | 17,238 (94.0%) |
Income Below Poverty Among Married-Couple Families in Martinez
The poverty statistics for married-couple families in Martinez show that 1.7% or 127 of the total 7,641 families live below the poverty line. Families with no children have the highest poverty rate of 2.9%, comprising of 127 families. On the other hand, families with 1 or 2 children have the lowest poverty rate of 0.0%, which includes 0 families.
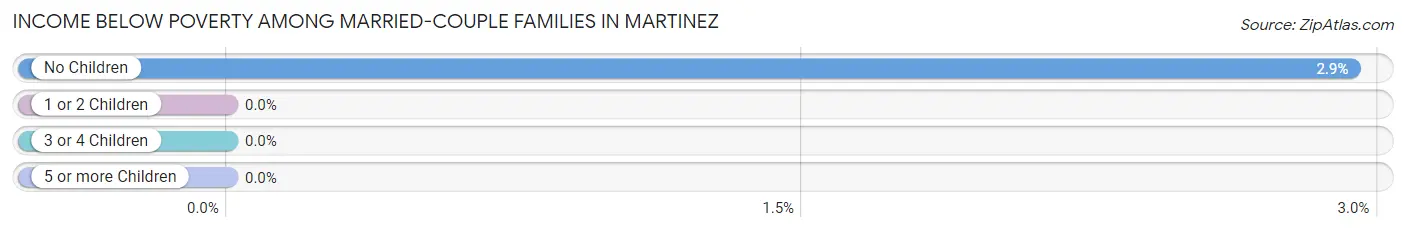
| Children | Above Poverty | Below Poverty |
| No Children | 4,209 (97.1%) | 127 (2.9%) |
| 1 or 2 Children | 2,999 (100.0%) | 0 (0.0%) |
| 3 or 4 Children | 306 (100.0%) | 0 (0.0%) |
| 5 or more Children | 0 (0.0%) | 0 (0.0%) |
| Total | 7,514 (98.3%) | 127 (1.7%) |
Income Below Poverty Among Single-Parent Households in Martinez
According to the poverty data in Martinez, 2.2% or 17 single-father households and 8.8% or 108 single-mother households are living below the poverty line. Among single-father households, those with 1 or 2 children have the highest poverty rate, with 17 households (4.3%) experiencing poverty. Likewise, among single-mother households, those with 1 or 2 children have the highest poverty rate, with 92 households (12.9%) falling below the poverty line.
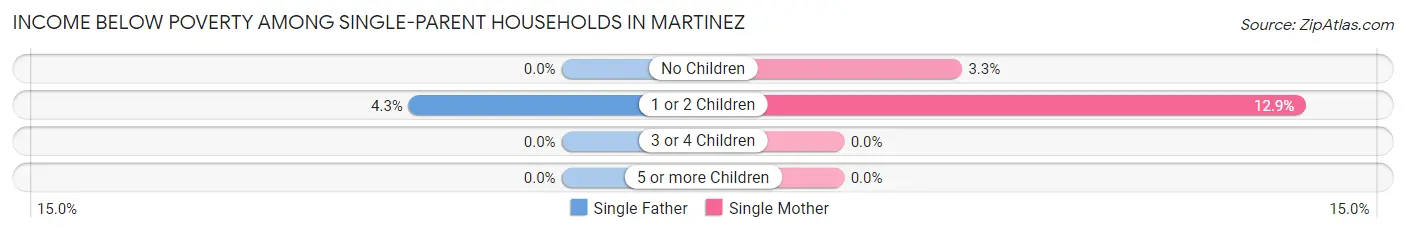
| Children | Single Father | Single Mother |
| No Children | 0 (0.0%) | 16 (3.3%) |
| 1 or 2 Children | 17 (4.3%) | 92 (12.9%) |
| 3 or 4 Children | 0 (0.0%) | 0 (0.0%) |
| 5 or more Children | 0 (0.0%) | 0 (0.0%) |
| Total | 17 (2.2%) | 108 (8.8%) |
Income Below Poverty Among Married-Couple vs Single-Parent Households in Martinez
The poverty data for Martinez shows that 127 of the married-couple family households (1.7%) and 125 of the single-parent households (6.3%) are living below the poverty level. Within the married-couple family households, those with no children have the highest poverty rate, with 127 households (2.9%) falling below the poverty line. Among the single-parent households, those with 1 or 2 children have the highest poverty rate, with 109 household (9.8%) living below poverty.
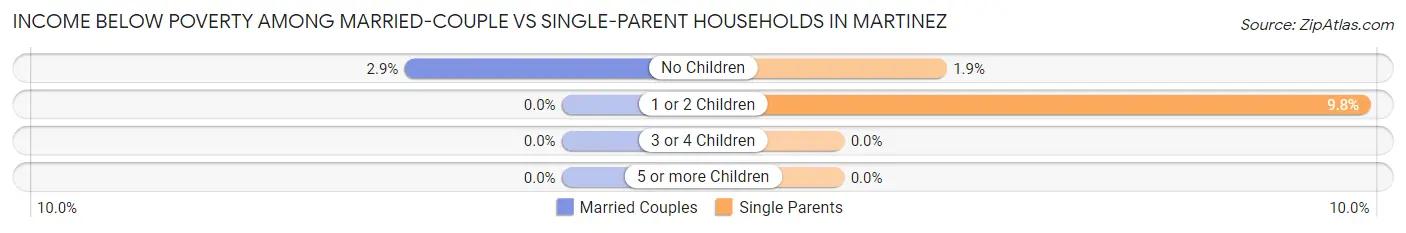
| Children | Married-Couple Families | Single-Parent Households |
| No Children | 127 (2.9%) | 16 (1.9%) |
| 1 or 2 Children | 0 (0.0%) | 109 (9.8%) |
| 3 or 4 Children | 0 (0.0%) | 0 (0.0%) |
| 5 or more Children | 0 (0.0%) | 0 (0.0%) |
| Total | 127 (1.7%) | 125 (6.3%) |
Race in Martinez
The most populous races in Martinez are White / Caucasian (24,471 | 66.0%), Hispanic or Latino (7,197 | 19.4%), and Two or more Races (6,041 | 16.3%).
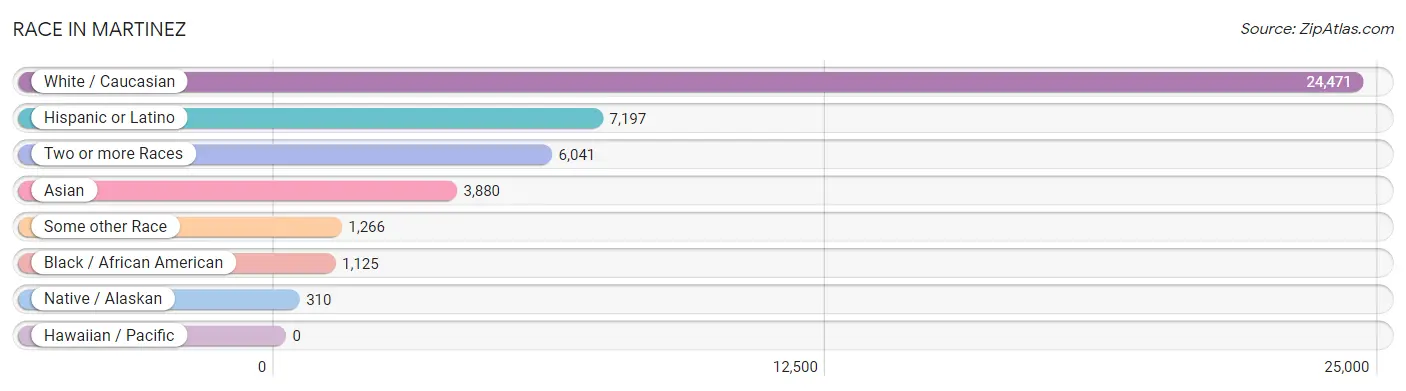
| Race | # Population | % Population |
| Asian | 3,880 | 10.5% |
| Black / African American | 1,125 | 3.0% |
| Hawaiian / Pacific | 0 | 0.0% |
| Hispanic or Latino | 7,197 | 19.4% |
| Native / Alaskan | 310 | 0.8% |
| White / Caucasian | 24,471 | 66.0% |
| Two or more Races | 6,041 | 16.3% |
| Some other Race | 1,266 | 3.4% |
| Total | 37,093 | 100.0% |
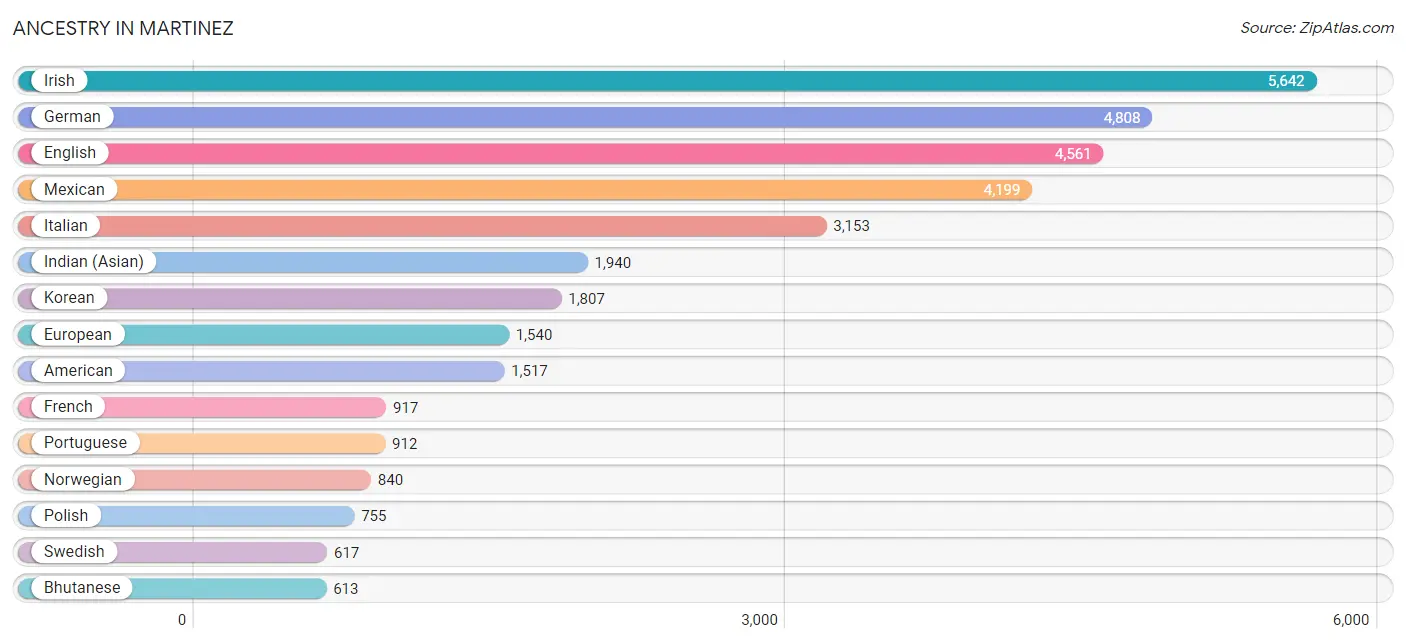
Ancestry in Martinez
The most populous ancestries reported in Martinez are Irish (5,642 | 15.2%), German (4,808 | 13.0%), English (4,561 | 12.3%), Mexican (4,199 | 11.3%), and Italian (3,153 | 8.5%), together accounting for 60.3% of all Martinez residents.
| Ancestry | # Population | % Population |
| Afghan | 135 | 0.4% |
| African | 75 | 0.2% |
| American | 1,517 | 4.1% |
| Apache | 59 | 0.2% |
| Arab | 379 | 1.0% |
| Armenian | 38 | 0.1% |
| Australian | 15 | 0.0% |
| Austrian | 86 | 0.2% |
| Belgian | 15 | 0.0% |
| Bhutanese | 613 | 1.7% |
| Blackfeet | 31 | 0.1% |
| British | 398 | 1.1% |
| Bulgarian | 70 | 0.2% |
| Burmese | 492 | 1.3% |
| Cambodian | 34 | 0.1% |
| Canadian | 69 | 0.2% |
| Cape Verdean | 28 | 0.1% |
| Central American | 220 | 0.6% |
| Central American Indian | 60 | 0.2% |
| Cherokee | 249 | 0.7% |
| Chilean | 87 | 0.2% |
| Choctaw | 93 | 0.3% |
| Colombian | 123 | 0.3% |
| Creek | 36 | 0.1% |
| Croatian | 23 | 0.1% |
| Cuban | 355 | 1.0% |
| Czech | 172 | 0.5% |
| Czechoslovakian | 53 | 0.1% |
| Danish | 182 | 0.5% |
| Dominican | 300 | 0.8% |
| Dutch | 458 | 1.2% |
| Eastern European | 106 | 0.3% |
| Ecuadorian | 21 | 0.1% |
| Egyptian | 42 | 0.1% |
| English | 4,561 | 12.3% |
| European | 1,540 | 4.2% |
| Filipino | 74 | 0.2% |
| Finnish | 238 | 0.6% |
| French | 917 | 2.5% |
| French Canadian | 64 | 0.2% |
| German | 4,808 | 13.0% |
| Greek | 193 | 0.5% |
| Guamanian / Chamorro | 223 | 0.6% |
| Guatemalan | 2 | 0.0% |
| Hungarian | 137 | 0.4% |
| Indian (Asian) | 1,940 | 5.2% |
| Iranian | 140 | 0.4% |
| Iraqi | 29 | 0.1% |
| Irish | 5,642 | 15.2% |
| Italian | 3,153 | 8.5% |
| Jamaican | 44 | 0.1% |
| Jordanian | 27 | 0.1% |
| Korean | 1,807 | 4.9% |
| Laotian | 83 | 0.2% |
| Latvian | 17 | 0.1% |
| Lebanese | 110 | 0.3% |
| Lithuanian | 66 | 0.2% |
| Malaysian | 238 | 0.6% |
| Maltese | 31 | 0.1% |
| Mexican | 4,199 | 11.3% |
| Mexican American Indian | 210 | 0.6% |
| Mongolian | 53 | 0.1% |
| Native Hawaiian | 86 | 0.2% |
| Navajo | 14 | 0.0% |
| Nicaraguan | 153 | 0.4% |
| Northern European | 302 | 0.8% |
| Norwegian | 840 | 2.3% |
| Pakistani | 47 | 0.1% |
| Palestinian | 50 | 0.1% |
| Panamanian | 40 | 0.1% |
| Pennsylvania German | 10 | 0.0% |
| Peruvian | 197 | 0.5% |
| Polish | 755 | 2.0% |
| Portuguese | 912 | 2.5% |
| Pueblo | 60 | 0.2% |
| Puerto Rican | 501 | 1.3% |
| Romanian | 33 | 0.1% |
| Russian | 485 | 1.3% |
| Salvadoran | 25 | 0.1% |
| Samoan | 19 | 0.1% |
| Scandinavian | 171 | 0.5% |
| Scotch-Irish | 395 | 1.1% |
| Scottish | 508 | 1.4% |
| Slavic | 18 | 0.1% |
| Slovak | 21 | 0.1% |
| South American | 514 | 1.4% |
| Spaniard | 449 | 1.2% |
| Spanish | 216 | 0.6% |
| Spanish American | 9 | 0.0% |
| Sri Lankan | 229 | 0.6% |
| Subsaharan African | 103 | 0.3% |
| Swedish | 617 | 1.7% |
| Swiss | 167 | 0.4% |
| Syrian | 104 | 0.3% |
| Thai | 427 | 1.1% |
| Tongan | 10 | 0.0% |
| Trinidadian and Tobagonian | 57 | 0.2% |
| Turkish | 102 | 0.3% |
| Ukrainian | 96 | 0.3% |
| Venezuelan | 74 | 0.2% |
| Welsh | 437 | 1.2% |
| Yaqui | 16 | 0.0% |
| Yugoslavian | 37 | 0.1% | View All 103 Rows |
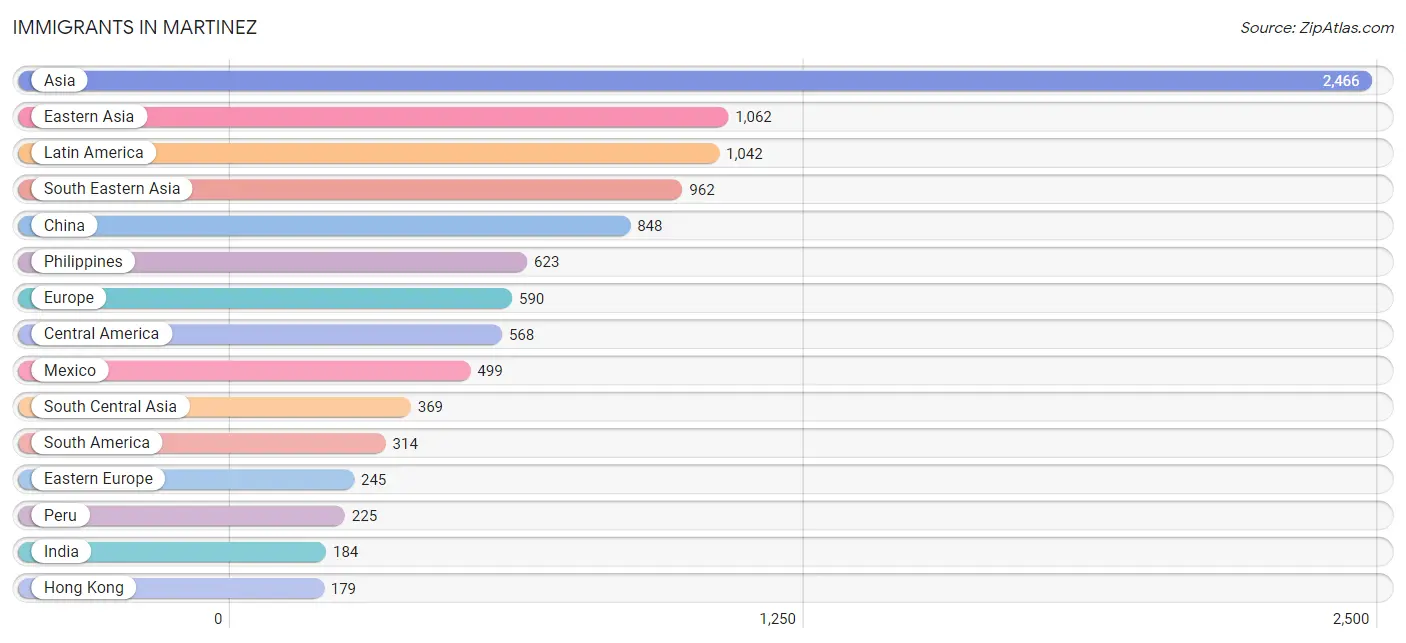
Immigrants in Martinez
The most numerous immigrant groups reported in Martinez came from Asia (2,466 | 6.7%), Eastern Asia (1,062 | 2.9%), Latin America (1,042 | 2.8%), South Eastern Asia (962 | 2.6%), and China (848 | 2.3%), together accounting for 17.2% of all Martinez residents.
| Immigration Origin | # Population | % Population |
| Afghanistan | 75 | 0.2% |
| Africa | 131 | 0.4% |
| Asia | 2,466 | 6.7% |
| Australia | 13 | 0.0% |
| Bolivia | 8 | 0.0% |
| Brazil | 1 | 0.0% |
| Bulgaria | 70 | 0.2% |
| Canada | 154 | 0.4% |
| Caribbean | 160 | 0.4% |
| Central America | 568 | 1.5% |
| Chile | 27 | 0.1% |
| China | 848 | 2.3% |
| Cuba | 39 | 0.1% |
| Dominican Republic | 69 | 0.2% |
| Eastern Africa | 45 | 0.1% |
| Eastern Asia | 1,062 | 2.9% |
| Eastern Europe | 245 | 0.7% |
| Ecuador | 7 | 0.0% |
| Egypt | 25 | 0.1% |
| El Salvador | 8 | 0.0% |
| England | 72 | 0.2% |
| Ethiopia | 36 | 0.1% |
| Europe | 590 | 1.6% |
| Fiji | 24 | 0.1% |
| France | 7 | 0.0% |
| Germany | 86 | 0.2% |
| Guatemala | 2 | 0.0% |
| Hong Kong | 179 | 0.5% |
| Hungary | 45 | 0.1% |
| India | 184 | 0.5% |
| Indonesia | 20 | 0.1% |
| Iran | 72 | 0.2% |
| Ireland | 47 | 0.1% |
| Israel | 17 | 0.1% |
| Italy | 9 | 0.0% |
| Jamaica | 44 | 0.1% |
| Japan | 57 | 0.2% |
| Jordan | 12 | 0.0% |
| Kenya | 9 | 0.0% |
| Korea | 141 | 0.4% |
| Laos | 136 | 0.4% |
| Latin America | 1,042 | 2.8% |
| Liberia | 31 | 0.1% |
| Malaysia | 53 | 0.1% |
| Mexico | 499 | 1.3% |
| Netherlands | 36 | 0.1% |
| Nicaragua | 39 | 0.1% |
| Northern Africa | 55 | 0.2% |
| Northern Europe | 159 | 0.4% |
| Oceania | 60 | 0.2% |
| Pakistan | 38 | 0.1% |
| Panama | 20 | 0.1% |
| Peru | 225 | 0.6% |
| Philippines | 623 | 1.7% |
| Poland | 2 | 0.0% |
| Portugal | 15 | 0.0% |
| Russia | 23 | 0.1% |
| Scotland | 16 | 0.0% |
| Serbia | 10 | 0.0% |
| Singapore | 11 | 0.0% |
| South America | 314 | 0.9% |
| South Central Asia | 369 | 1.0% |
| South Eastern Asia | 962 | 2.6% |
| Southern Europe | 33 | 0.1% |
| Spain | 9 | 0.0% |
| Switzerland | 17 | 0.1% |
| Taiwan | 100 | 0.3% |
| Trinidad and Tobago | 8 | 0.0% |
| Ukraine | 59 | 0.2% |
| Venezuela | 46 | 0.1% |
| Vietnam | 119 | 0.3% |
| Western Africa | 31 | 0.1% |
| Western Asia | 73 | 0.2% |
| Western Europe | 146 | 0.4% | View All 74 Rows |
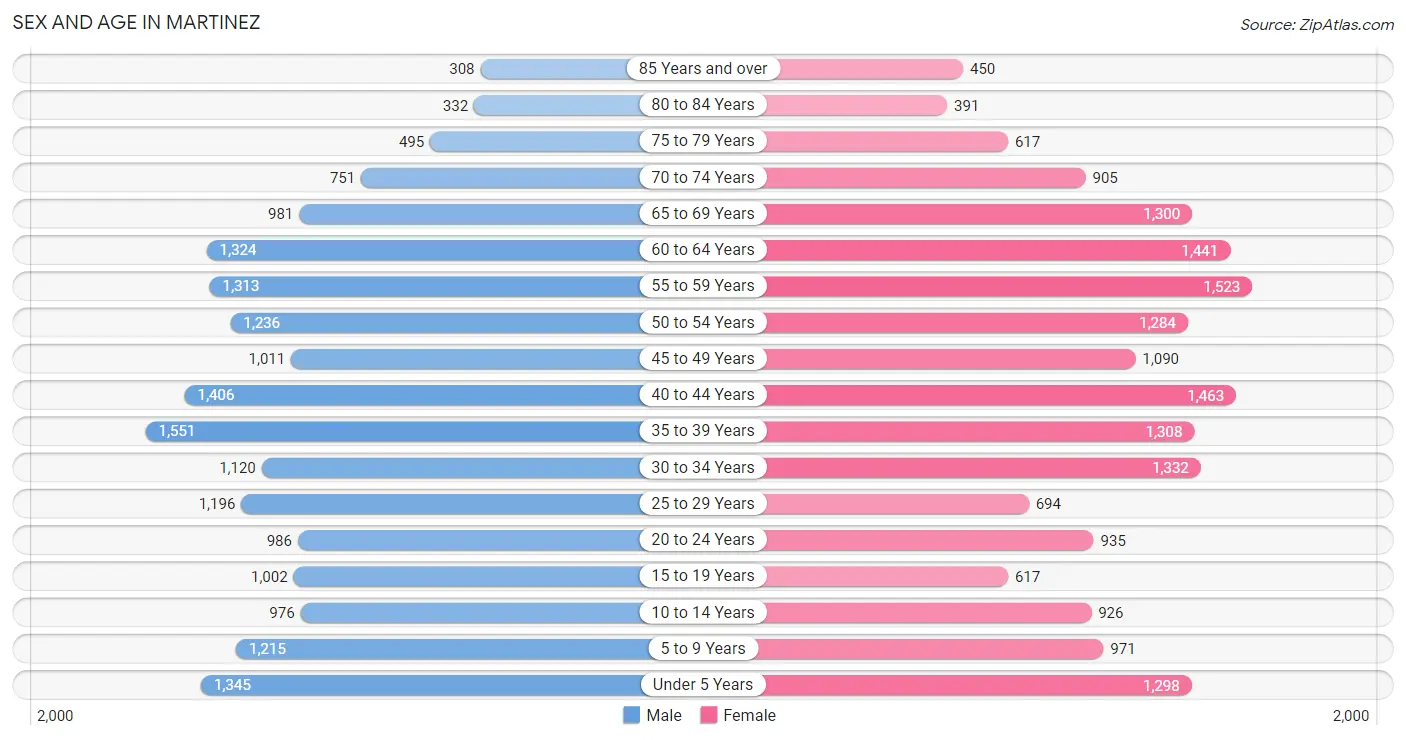
Sex and Age in Martinez
Sex and Age in Martinez
The most populous age groups in Martinez are 35 to 39 Years (1,551 | 8.4%) for men and 55 to 59 Years (1,523 | 8.2%) for women.
| Age Bracket | Male | Female |
| Under 5 Years | 1,345 (7.2%) | 1,298 (7.0%) |
| 5 to 9 Years | 1,215 (6.6%) | 971 (5.2%) |
| 10 to 14 Years | 976 (5.3%) | 926 (5.0%) |
| 15 to 19 Years | 1,002 (5.4%) | 617 (3.3%) |
| 20 to 24 Years | 986 (5.3%) | 935 (5.0%) |
| 25 to 29 Years | 1,196 (6.5%) | 694 (3.7%) |
| 30 to 34 Years | 1,120 (6.0%) | 1,332 (7.2%) |
| 35 to 39 Years | 1,551 (8.4%) | 1,308 (7.0%) |
| 40 to 44 Years | 1,406 (7.6%) | 1,463 (7.9%) |
| 45 to 49 Years | 1,011 (5.4%) | 1,090 (5.9%) |
| 50 to 54 Years | 1,236 (6.7%) | 1,284 (6.9%) |
| 55 to 59 Years | 1,313 (7.1%) | 1,523 (8.2%) |
| 60 to 64 Years | 1,324 (7.1%) | 1,441 (7.8%) |
| 65 to 69 Years | 981 (5.3%) | 1,300 (7.0%) |
| 70 to 74 Years | 751 (4.1%) | 905 (4.9%) |
| 75 to 79 Years | 495 (2.7%) | 617 (3.3%) |
| 80 to 84 Years | 332 (1.8%) | 391 (2.1%) |
| 85 Years and over | 308 (1.7%) | 450 (2.4%) |
| Total | 18,548 (100.0%) | 18,545 (100.0%) |
Families and Households in Martinez
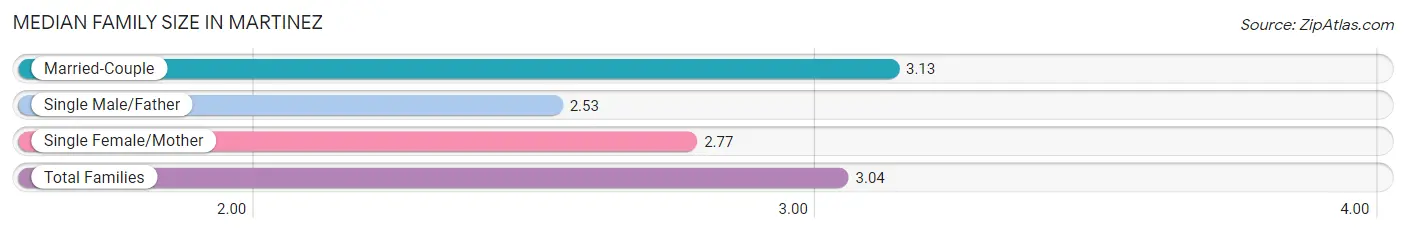
Median Family Size in Martinez
The median family size in Martinez is 3.04 persons per family, with married-couple families (7,641 | 79.3%) accounting for the largest median family size of 3.13 persons per family. On the other hand, single male/father families (767 | 8.0%) represent the smallest median family size with 2.53 persons per family.
| Family Type | # Families | Family Size |
| Married-Couple | 7,641 (79.3%) | 3.13 |
| Single Male/Father | 767 (8.0%) | 2.53 |
| Single Female/Mother | 1,230 (12.8%) | 2.77 |
| Total Families | 9,638 (100.0%) | 3.04 |
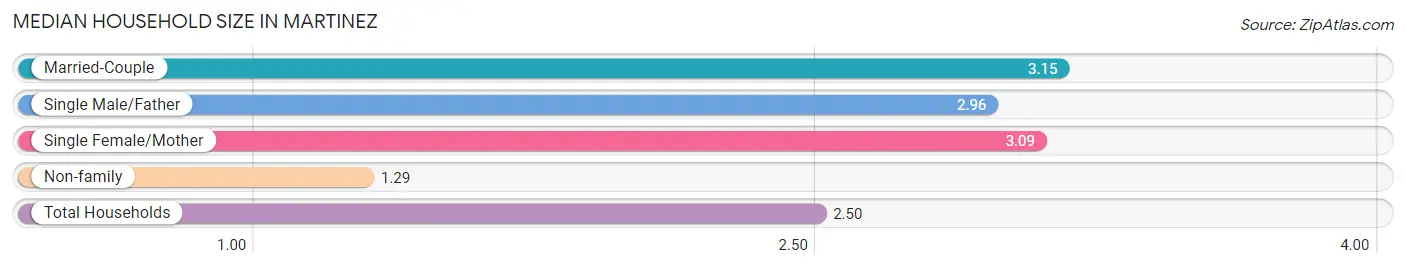
Median Household Size in Martinez
The median household size in Martinez is 2.50 persons per household, with married-couple households (7,641 | 52.3%) accounting for the largest median household size of 3.15 persons per household. non-family households (4,977 | 34.1%) represent the smallest median household size with 1.29 persons per household.
| Household Type | # Households | Household Size |
| Married-Couple | 7,641 (52.3%) | 3.15 |
| Single Male/Father | 767 (5.2%) | 2.96 |
| Single Female/Mother | 1,230 (8.4%) | 3.09 |
| Non-family | 4,977 (34.1%) | 1.29 |
| Total Households | 14,615 (100.0%) | 2.50 |
Household Size by Marriage Status in Martinez
Out of a total of 14,615 households in Martinez, 9,638 (65.9%) are family households, while 4,977 (34.1%) are nonfamily households. The most numerous type of family households are 2-person households, comprising 3,961, and the most common type of nonfamily households are 1-person households, comprising 3,778.
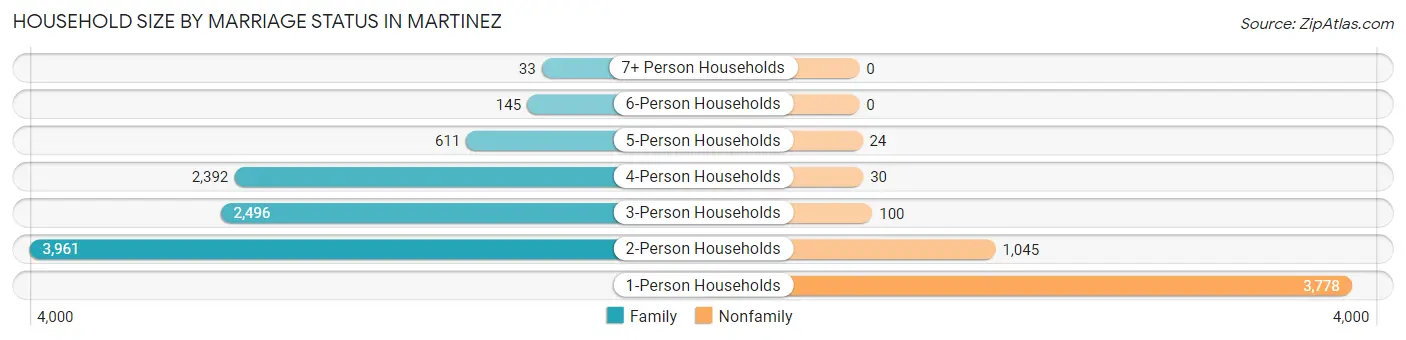
| Household Size | Family Households | Nonfamily Households |
| 1-Person Households | - | 3,778 (25.9%) |
| 2-Person Households | 3,961 (27.1%) | 1,045 (7.1%) |
| 3-Person Households | 2,496 (17.1%) | 100 (0.7%) |
| 4-Person Households | 2,392 (16.4%) | 30 (0.2%) |
| 5-Person Households | 611 (4.2%) | 24 (0.2%) |
| 6-Person Households | 145 (1.0%) | 0 (0.0%) |
| 7+ Person Households | 33 (0.2%) | 0 (0.0%) |
| Total | 9,638 (65.9%) | 4,977 (34.1%) |
Female Fertility in Martinez
Fertility by Age in Martinez
Average fertility rate in Martinez is 55.0 births per 1,000 women. Women in the age bracket of 20 to 34 years have the highest fertility rate with 100.0 births per 1,000 women. Women in the age bracket of 20 to 34 years acount for 71.0% of all women with births.
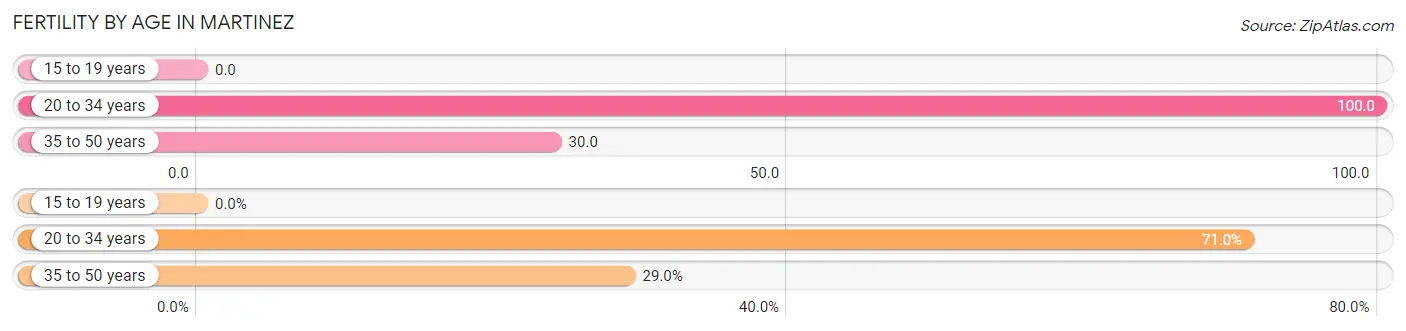
| Age Bracket | Women with Births | Births / 1,000 Women |
| 15 to 19 years | 0 (0.0%) | 0.0 |
| 20 to 34 years | 296 (71.0%) | 100.0 |
| 35 to 50 years | 121 (29.0%) | 30.0 |
| Total | 417 (100.0%) | 55.0 |
Fertility by Age by Marriage Status in Martinez
93.5% of women with births (417) in Martinez are married. The highest percentage of unmarried women with births falls into 20 to 34 years age bracket with 9.1% of them unmarried at the time of birth, while the lowest percentage of unmarried women with births belong to 35 to 50 years age bracket with 0.0% of them unmarried.
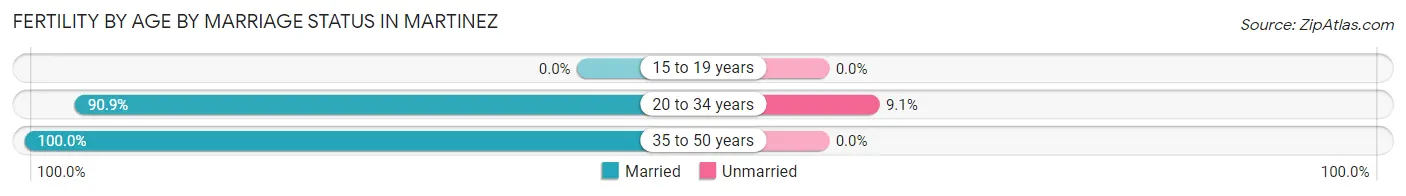
| Age Bracket | Married | Unmarried |
| 15 to 19 years | 0 (0.0%) | 0 (0.0%) |
| 20 to 34 years | 269 (90.9%) | 27 (9.1%) |
| 35 to 50 years | 121 (100.0%) | 0 (0.0%) |
| Total | 390 (93.5%) | 27 (6.5%) |
Fertility by Education in Martinez
Average fertility rate in Martinez is 55.0 births per 1,000 women. Women with the education attainment of bachelor's degree have the highest fertility rate of 81.0 births per 1,000 women, while women with the education attainment of less than high school have the lowest fertility at 26.0 births per 1,000 women. Women with the education attainment of bachelor's degree represent 46.0% of all women with births.
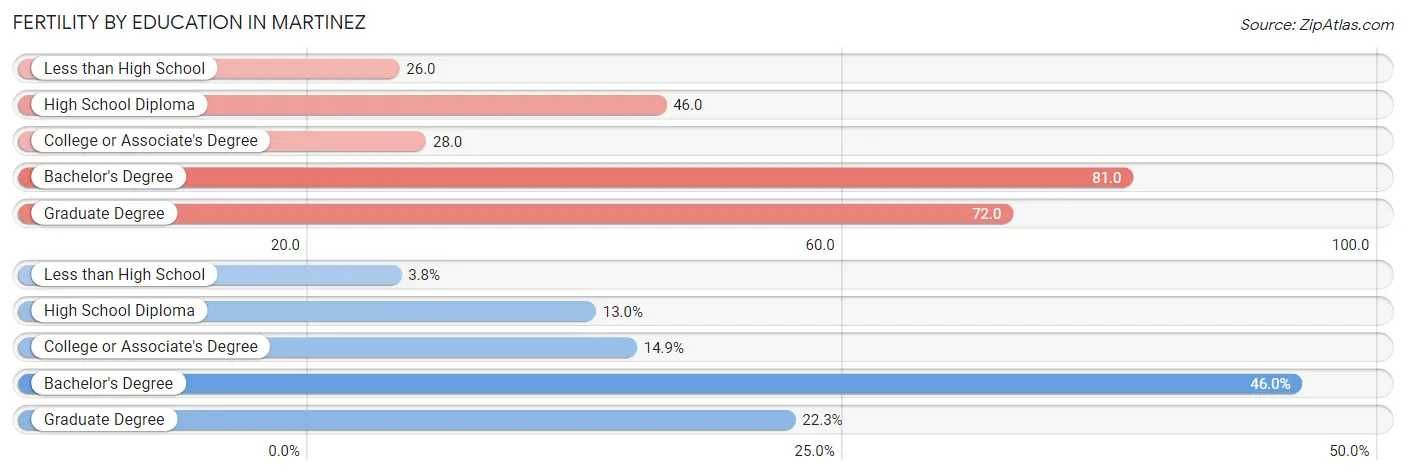
| Educational Attainment | Women with Births | Births / 1,000 Women |
| Less than High School | 16 (3.8%) | 26.0 |
| High School Diploma | 54 (13.0%) | 46.0 |
| College or Associate's Degree | 62 (14.9%) | 28.0 |
| Bachelor's Degree | 192 (46.0%) | 81.0 |
| Graduate Degree | 93 (22.3%) | 72.0 |
| Total | 417 (100.0%) | 55.0 |
Fertility by Education by Marriage Status in Martinez
6.5% of women with births in Martinez are unmarried. Women with the educational attainment of less than high school are most likely to be married with 100.0% of them married at childbirth, while women with the educational attainment of bachelor's degree are least likely to be married with 14.1% of them unmarried at childbirth.
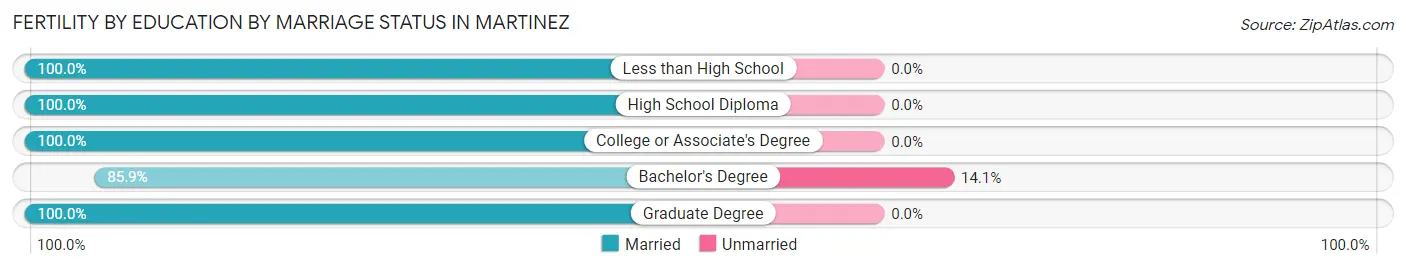
| Educational Attainment | Married | Unmarried |
| Less than High School | 16 (100.0%) | 0 (0.0%) |
| High School Diploma | 54 (100.0%) | 0 (0.0%) |
| College or Associate's Degree | 62 (100.0%) | 0 (0.0%) |
| Bachelor's Degree | 165 (85.9%) | 27 (14.1%) |
| Graduate Degree | 93 (100.0%) | 0 (0.0%) |
| Total | 390 (93.5%) | 27 (6.5%) |
Employment Characteristics in Martinez
Employment by Class of Employer in Martinez
Among the 18,955 employed individuals in Martinez, private company employees (11,331 | 59.8%), local government employees (2,685 | 14.2%), and not-for-profit organizations (1,947 | 10.3%) make up the most common classes of employment.
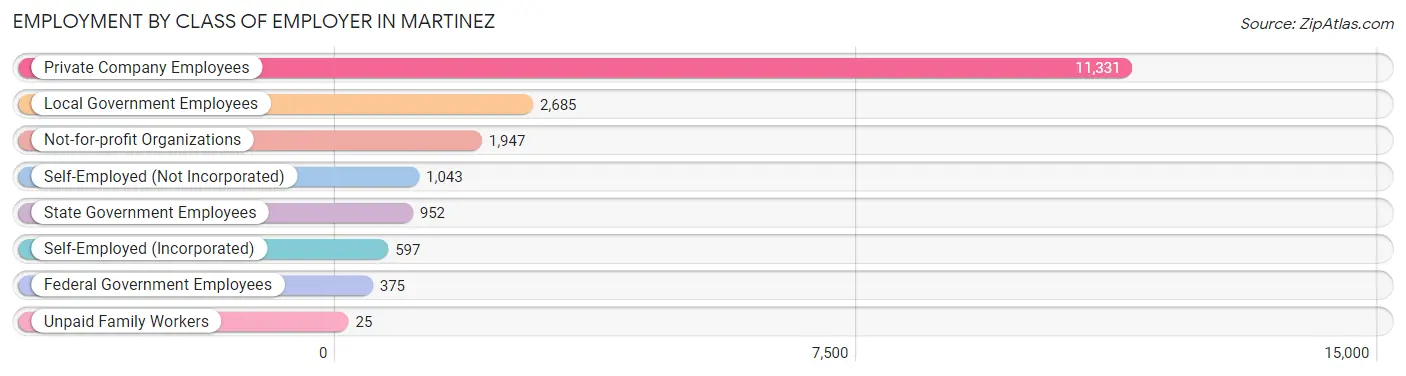
| Employer Class | # Employees | % Employees |
| Private Company Employees | 11,331 | 59.8% |
| Self-Employed (Incorporated) | 597 | 3.2% |
| Self-Employed (Not Incorporated) | 1,043 | 5.5% |
| Not-for-profit Organizations | 1,947 | 10.3% |
| Local Government Employees | 2,685 | 14.2% |
| State Government Employees | 952 | 5.0% |
| Federal Government Employees | 375 | 2.0% |
| Unpaid Family Workers | 25 | 0.1% |
| Total | 18,955 | 100.0% |
Employment Status by Age in Martinez
According to the labor force statistics for Martinez, out of the total population over 16 years of age (30,161), 67.9% or 20,479 individuals are in the labor force, with 4.9% or 1,003 of them unemployed. The age group with the highest labor force participation rate is 45 to 54 years, with 90.6% or 4,187 individuals in the labor force. Within the labor force, the 16 to 19 years age range has the highest percentage of unemployed individuals, with 21.7% or 124 of them being unemployed.
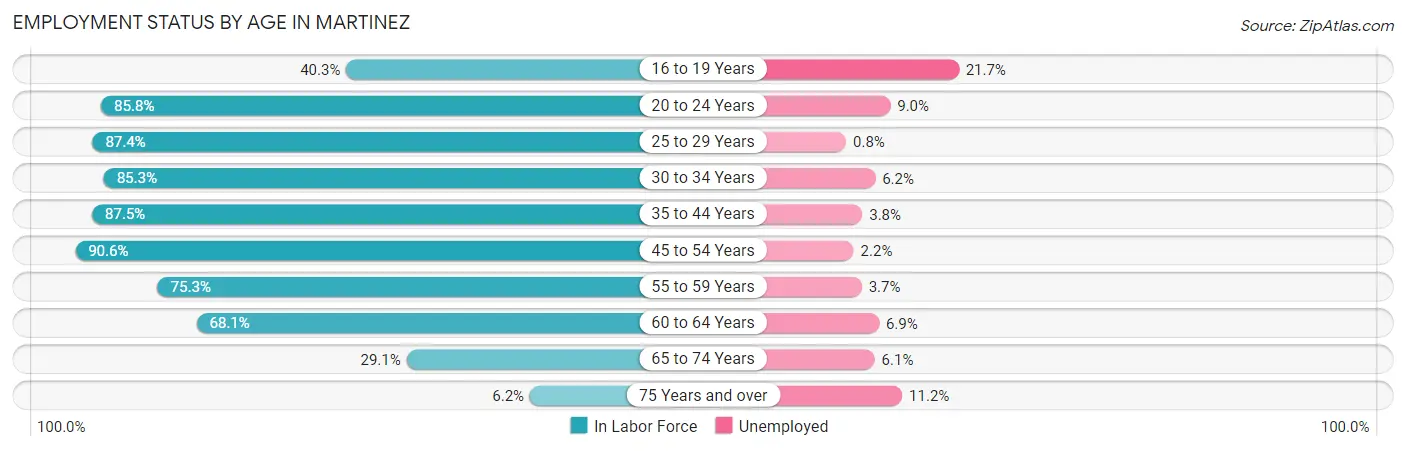
| Age Bracket | In Labor Force | Unemployed |
| 16 to 19 Years | 571 (40.3%) | 124 (21.7%) |
| 20 to 24 Years | 1,648 (85.8%) | 148 (9.0%) |
| 25 to 29 Years | 1,652 (87.4%) | 13 (0.8%) |
| 30 to 34 Years | 2,092 (85.3%) | 130 (6.2%) |
| 35 to 44 Years | 5,012 (87.5%) | 190 (3.8%) |
| 45 to 54 Years | 4,187 (90.6%) | 92 (2.2%) |
| 55 to 59 Years | 2,136 (75.3%) | 79 (3.7%) |
| 60 to 64 Years | 1,883 (68.1%) | 130 (6.9%) |
| 65 to 74 Years | 1,146 (29.1%) | 70 (6.1%) |
| 75 Years and over | 161 (6.2%) | 18 (11.2%) |
| Total | 20,479 (67.9%) | 1,003 (4.9%) |
Employment Status by Educational Attainment in Martinez
According to labor force statistics for Martinez, 83.6% of individuals (16,964) out of the total population between 25 and 64 years of age (20,292) are in the labor force, with 3.7% or 628 of them being unemployed. The group with the highest labor force participation rate are those with the educational attainment of bachelor's degree or higher, with 89.1% or 8,491 individuals in the labor force. Within the labor force, individuals with less than high school education have the highest percentage of unemployment, with 6.0% or 30 of them being unemployed.
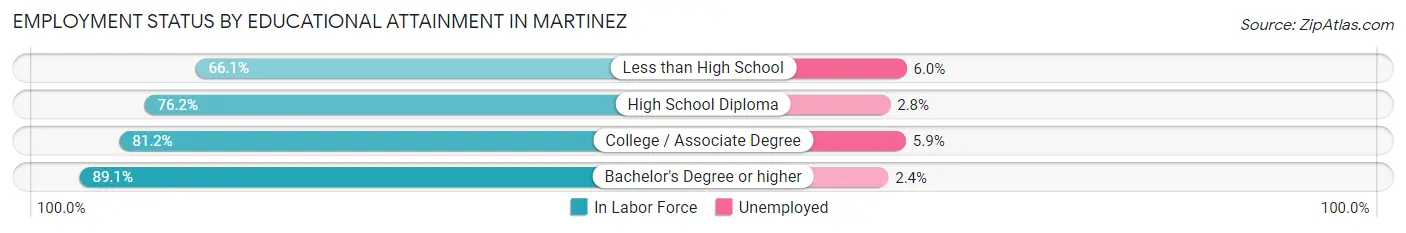
| Educational Attainment | In Labor Force | Unemployed |
| Less than High School | 502 (66.1%) | 46 (6.0%) |
| High School Diploma | 2,332 (76.2%) | 86 (2.8%) |
| College / Associate Degree | 5,637 (81.2%) | 410 (5.9%) |
| Bachelor's Degree or higher | 8,491 (89.1%) | 229 (2.4%) |
| Total | 16,964 (83.6%) | 751 (3.7%) |
Employment Occupations by Sex in Martinez
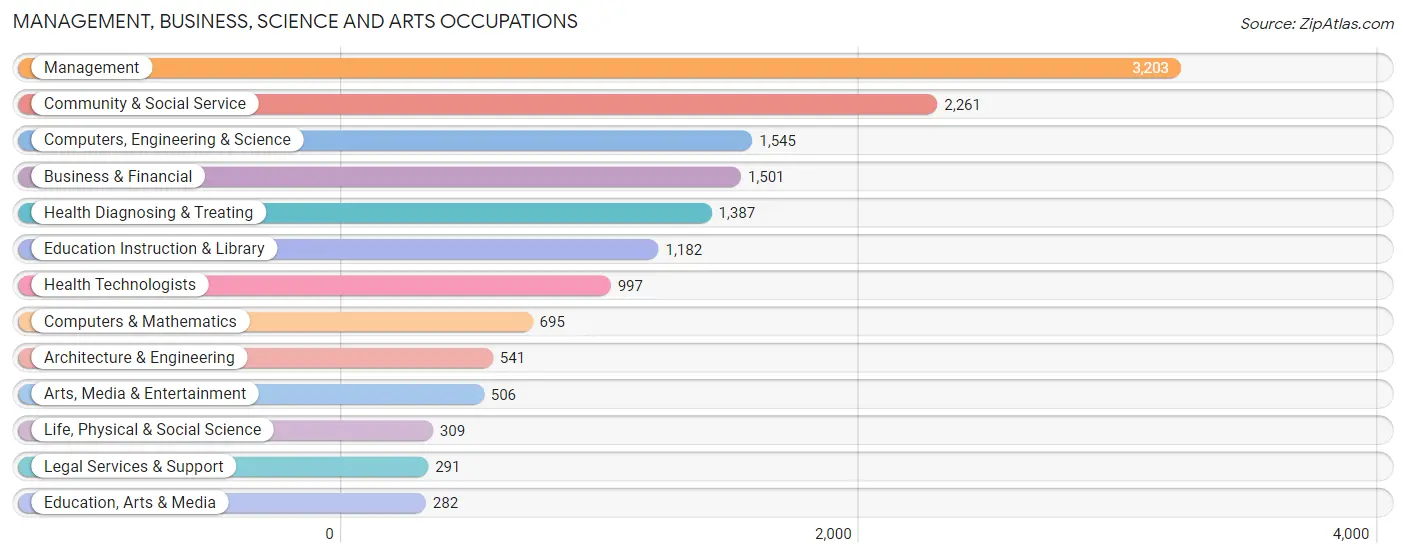
Management, Business, Science and Arts Occupations
The most common Management, Business, Science and Arts occupations in Martinez are Management (3,203 | 16.4%), Community & Social Service (2,261 | 11.6%), Computers, Engineering & Science (1,545 | 7.9%), Business & Financial (1,501 | 7.7%), and Health Diagnosing & Treating (1,387 | 7.1%).
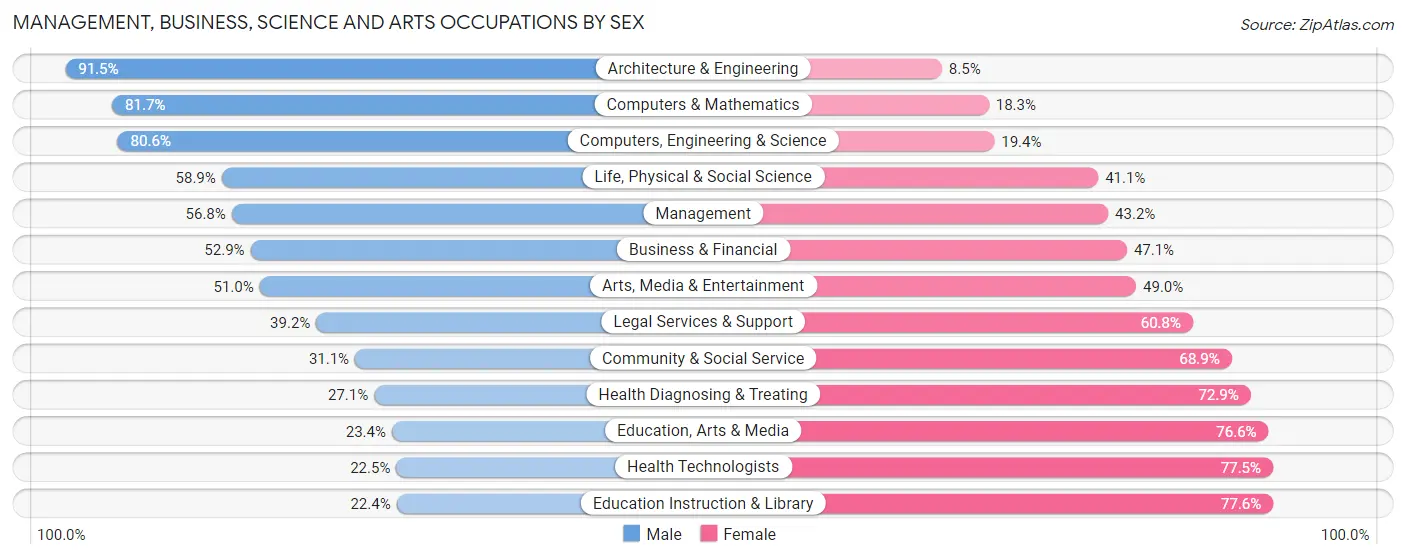
Management, Business, Science and Arts Occupations by Sex
Within the Management, Business, Science and Arts occupations in Martinez, the most male-oriented occupations are Architecture & Engineering (91.5%), Computers & Mathematics (81.7%), and Computers, Engineering & Science (80.6%), while the most female-oriented occupations are Education Instruction & Library (77.6%), Health Technologists (77.5%), and Education, Arts & Media (76.6%).
| Occupation | Male | Female |
| Management | 1,820 (56.8%) | 1,383 (43.2%) |
| Business & Financial | 794 (52.9%) | 707 (47.1%) |
| Computers, Engineering & Science | 1,245 (80.6%) | 300 (19.4%) |
| Computers & Mathematics | 568 (81.7%) | 127 (18.3%) |
| Architecture & Engineering | 495 (91.5%) | 46 (8.5%) |
| Life, Physical & Social Science | 182 (58.9%) | 127 (41.1%) |
| Community & Social Service | 703 (31.1%) | 1,558 (68.9%) |
| Education, Arts & Media | 66 (23.4%) | 216 (76.6%) |
| Legal Services & Support | 114 (39.2%) | 177 (60.8%) |
| Education Instruction & Library | 265 (22.4%) | 917 (77.6%) |
| Arts, Media & Entertainment | 258 (51.0%) | 248 (49.0%) |
| Health Diagnosing & Treating | 376 (27.1%) | 1,011 (72.9%) |
| Health Technologists | 224 (22.5%) | 773 (77.5%) |
| Total (Category) | 4,938 (49.9%) | 4,959 (50.1%) |
| Total (Overall) | 10,106 (51.8%) | 9,386 (48.1%) |
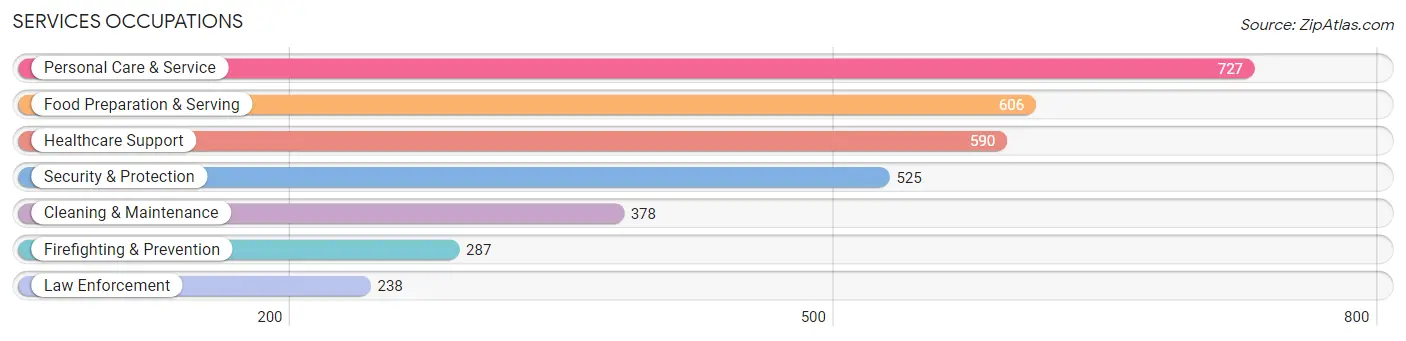
Services Occupations
The most common Services occupations in Martinez are Personal Care & Service (727 | 3.7%), Food Preparation & Serving (606 | 3.1%), Healthcare Support (590 | 3.0%), Security & Protection (525 | 2.7%), and Cleaning & Maintenance (378 | 1.9%).
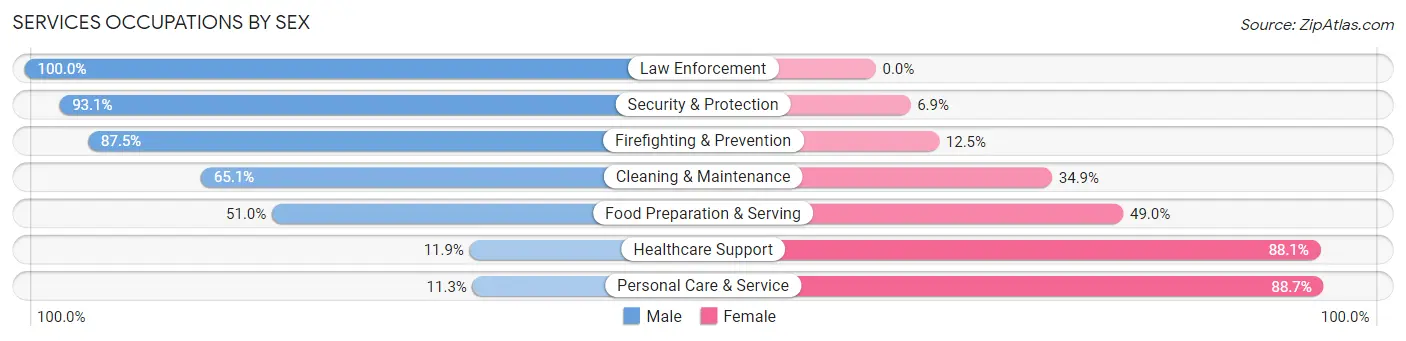
Services Occupations by Sex
Within the Services occupations in Martinez, the most male-oriented occupations are Law Enforcement (100.0%), Security & Protection (93.1%), and Firefighting & Prevention (87.5%), while the most female-oriented occupations are Personal Care & Service (88.7%), Healthcare Support (88.1%), and Food Preparation & Serving (49.0%).
| Occupation | Male | Female |
| Healthcare Support | 70 (11.9%) | 520 (88.1%) |
| Security & Protection | 489 (93.1%) | 36 (6.9%) |
| Firefighting & Prevention | 251 (87.5%) | 36 (12.5%) |
| Law Enforcement | 238 (100.0%) | 0 (0.0%) |
| Food Preparation & Serving | 309 (51.0%) | 297 (49.0%) |
| Cleaning & Maintenance | 246 (65.1%) | 132 (34.9%) |
| Personal Care & Service | 82 (11.3%) | 645 (88.7%) |
| Total (Category) | 1,196 (42.3%) | 1,630 (57.7%) |
| Total (Overall) | 10,106 (51.8%) | 9,386 (48.1%) |
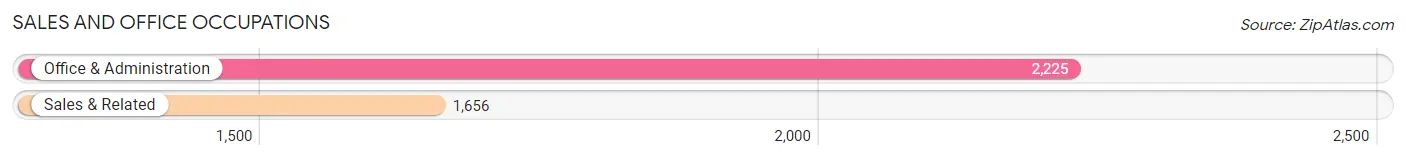
Sales and Office Occupations
The most common Sales and Office occupations in Martinez are Office & Administration (2,225 | 11.4%), and Sales & Related (1,656 | 8.5%).
Sales and Office Occupations by Sex
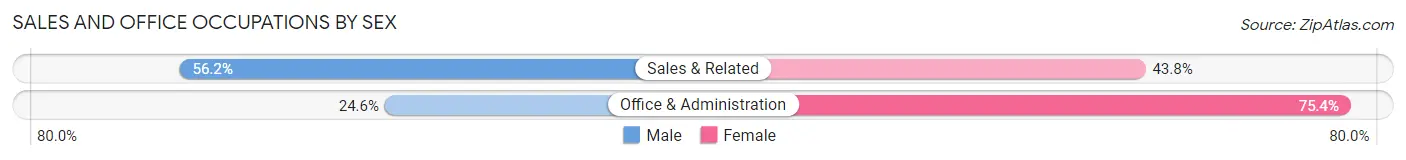
| Occupation | Male | Female |
| Sales & Related | 930 (56.2%) | 726 (43.8%) |
| Office & Administration | 547 (24.6%) | 1,678 (75.4%) |
| Total (Category) | 1,477 (38.1%) | 2,404 (61.9%) |
| Total (Overall) | 10,106 (51.8%) | 9,386 (48.1%) |
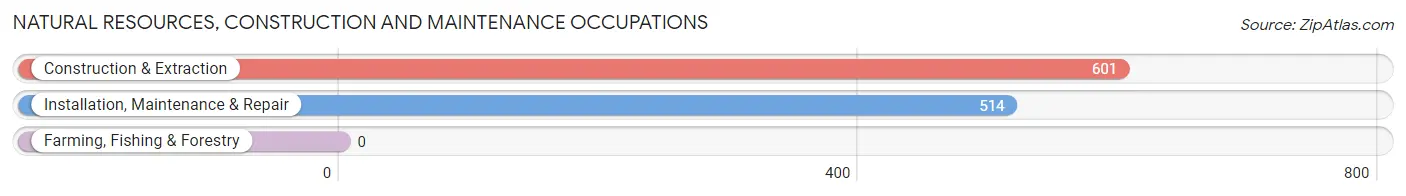
Natural Resources, Construction and Maintenance Occupations
The most common Natural Resources, Construction and Maintenance occupations in Martinez are Construction & Extraction (601 | 3.1%), and Installation, Maintenance & Repair (514 | 2.6%).
Natural Resources, Construction and Maintenance Occupations by Sex
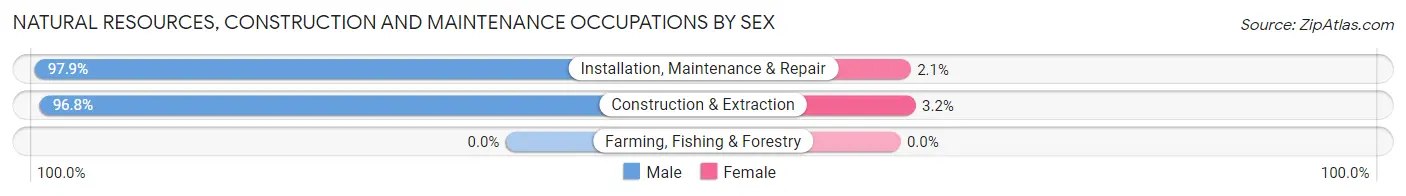
| Occupation | Male | Female |
| Farming, Fishing & Forestry | 0 (0.0%) | 0 (0.0%) |
| Construction & Extraction | 582 (96.8%) | 19 (3.2%) |
| Installation, Maintenance & Repair | 503 (97.9%) | 11 (2.1%) |
| Total (Category) | 1,085 (97.3%) | 30 (2.7%) |
| Total (Overall) | 10,106 (51.8%) | 9,386 (48.1%) |
Production, Transportation and Moving Occupations
The most common Production, Transportation and Moving occupations in Martinez are Material Moving (729 | 3.7%), Transportation (575 | 2.9%), and Production (469 | 2.4%).
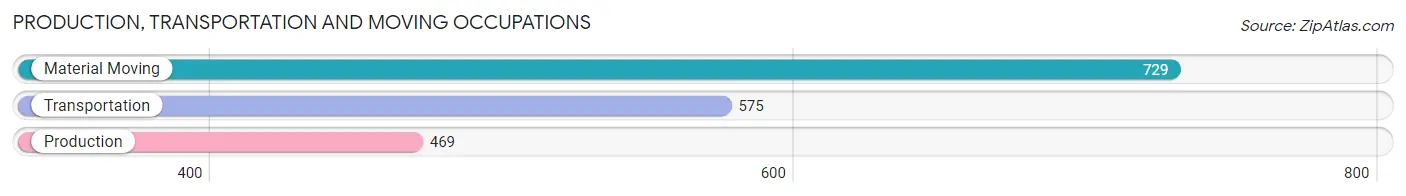
Production, Transportation and Moving Occupations by Sex
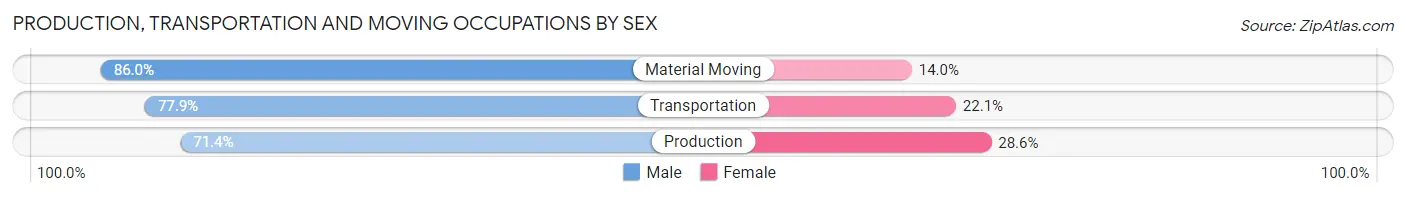
| Occupation | Male | Female |
| Production | 335 (71.4%) | 134 (28.6%) |
| Transportation | 448 (77.9%) | 127 (22.1%) |
| Material Moving | 627 (86.0%) | 102 (14.0%) |
| Total (Category) | 1,410 (79.5%) | 363 (20.5%) |
| Total (Overall) | 10,106 (51.8%) | 9,386 (48.1%) |
Employment Industries by Sex in Martinez
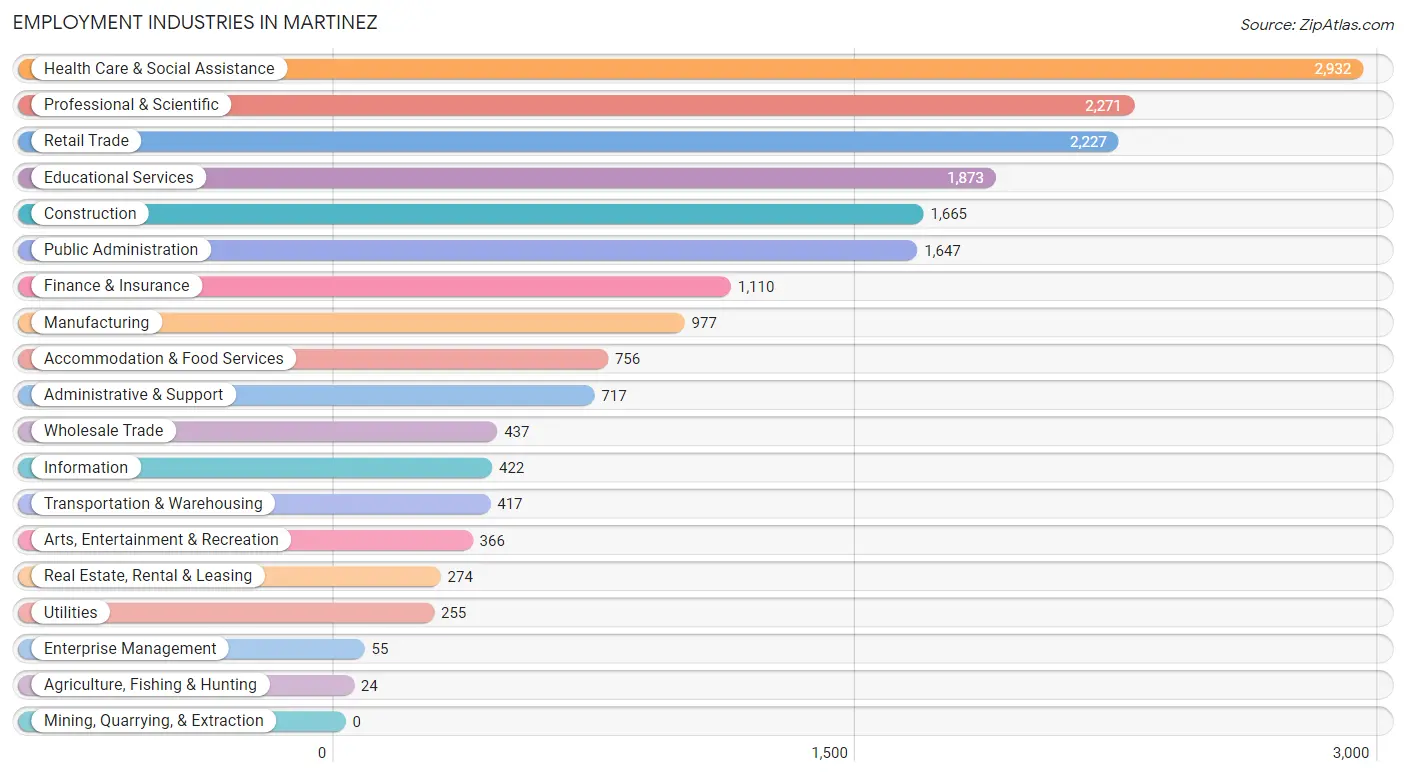
Employment Industries in Martinez
The major employment industries in Martinez include Health Care & Social Assistance (2,932 | 15.0%), Professional & Scientific (2,271 | 11.7%), Retail Trade (2,227 | 11.4%), Educational Services (1,873 | 9.6%), and Construction (1,665 | 8.5%).
Employment Industries by Sex in Martinez
The Martinez industries that see more men than women are Agriculture, Fishing & Hunting (100.0%), Construction (74.1%), and Public Administration (72.4%), whereas the industries that tend to have a higher number of women are Health Care & Social Assistance (76.6%), Finance & Insurance (64.4%), and Educational Services (61.7%).
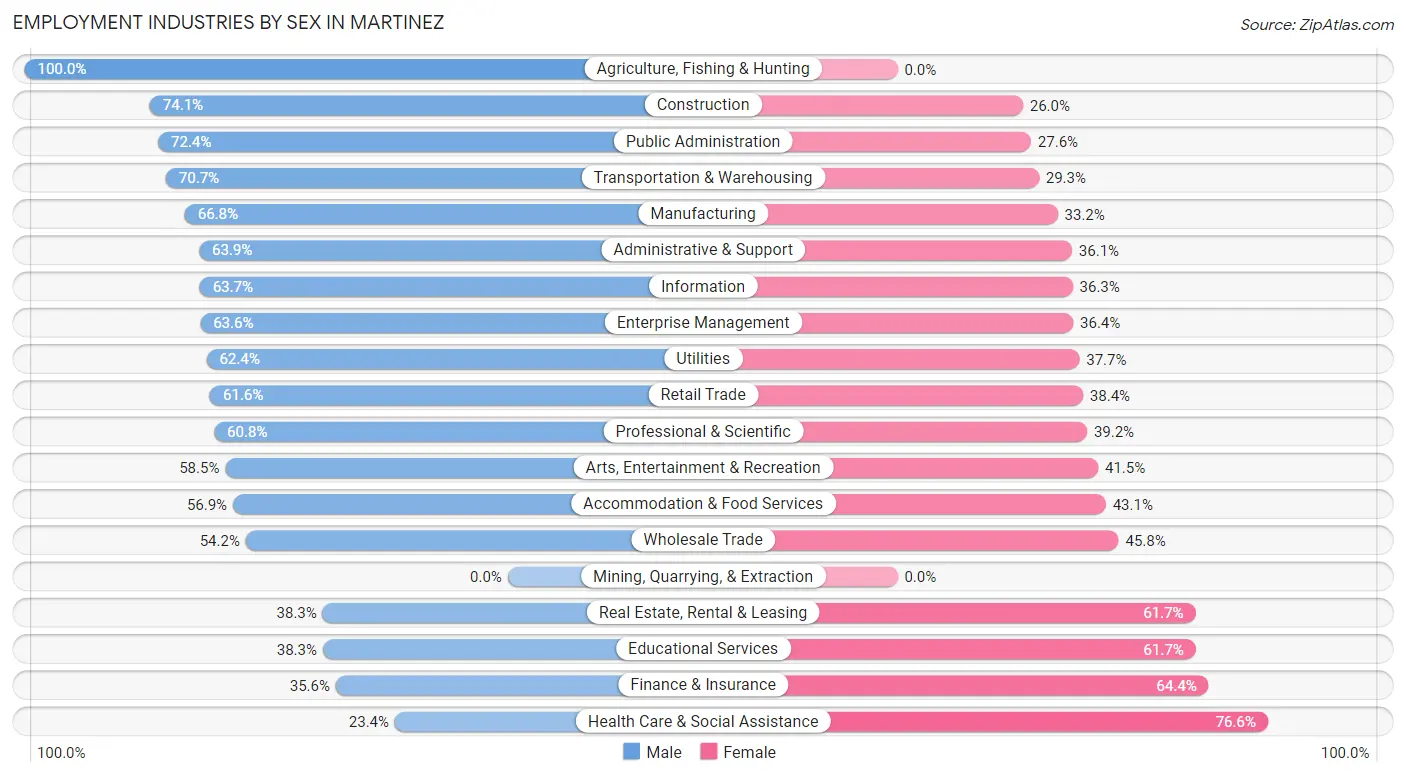
| Industry | Male | Female |
| Agriculture, Fishing & Hunting | 24 (100.0%) | 0 (0.0%) |
| Mining, Quarrying, & Extraction | 0 (0.0%) | 0 (0.0%) |
| Construction | 1,233 (74.1%) | 432 (26.0%) |
| Manufacturing | 653 (66.8%) | 324 (33.2%) |
| Wholesale Trade | 237 (54.2%) | 200 (45.8%) |
| Retail Trade | 1,372 (61.6%) | 855 (38.4%) |
| Transportation & Warehousing | 295 (70.7%) | 122 (29.3%) |
| Utilities | 159 (62.4%) | 96 (37.7%) |
| Information | 269 (63.7%) | 153 (36.3%) |
| Finance & Insurance | 395 (35.6%) | 715 (64.4%) |
| Real Estate, Rental & Leasing | 105 (38.3%) | 169 (61.7%) |
| Professional & Scientific | 1,380 (60.8%) | 891 (39.2%) |
| Enterprise Management | 35 (63.6%) | 20 (36.4%) |
| Administrative & Support | 458 (63.9%) | 259 (36.1%) |
| Educational Services | 717 (38.3%) | 1,156 (61.7%) |
| Health Care & Social Assistance | 685 (23.4%) | 2,247 (76.6%) |
| Arts, Entertainment & Recreation | 214 (58.5%) | 152 (41.5%) |
| Accommodation & Food Services | 430 (56.9%) | 326 (43.1%) |
| Public Administration | 1,192 (72.4%) | 455 (27.6%) |
| Total | 10,106 (51.8%) | 9,386 (48.1%) |
Education in Martinez
School Enrollment in Martinez
The most common levels of schooling among the 8,272 students in Martinez are elementary school (1,710 | 20.7%), college / undergraduate (1,694 | 20.5%), and high school (1,426 | 17.2%).
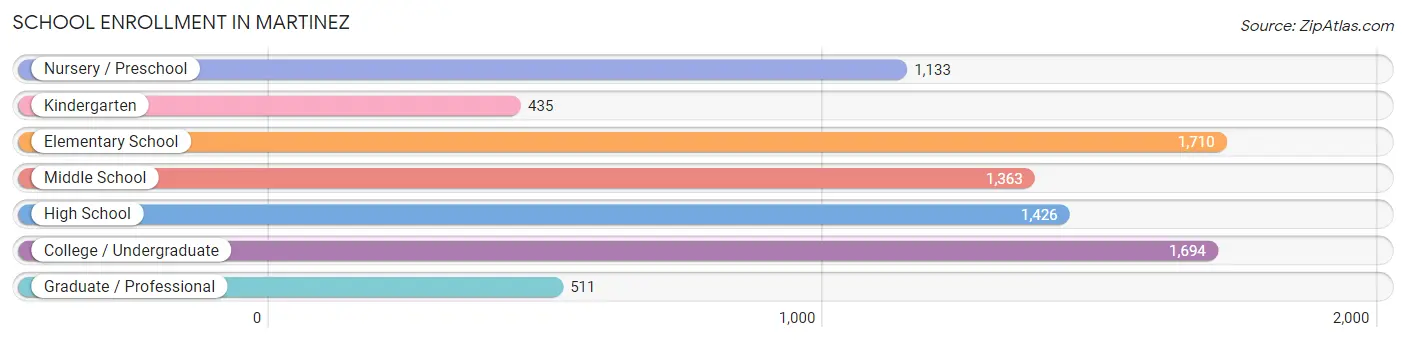
| School Level | # Students | % Students |
| Nursery / Preschool | 1,133 | 13.7% |
| Kindergarten | 435 | 5.3% |
| Elementary School | 1,710 | 20.7% |
| Middle School | 1,363 | 16.5% |
| High School | 1,426 | 17.2% |
| College / Undergraduate | 1,694 | 20.5% |
| Graduate / Professional | 511 | 6.2% |
| Total | 8,272 | 100.0% |
School Enrollment by Age by Funding Source in Martinez
Out of a total of 8,272 students who are enrolled in schools in Martinez, 1,423 (17.2%) attend a private institution, while the remaining 6,849 (82.8%) are enrolled in public schools. The age group of 3 to 4 year olds has the highest likelihood of being enrolled in private schools, with 589 (65.6% in the age bracket) enrolled. Conversely, the age group of 18 to 19 year olds has the lowest likelihood of being enrolled in a private school, with 507 (97.9% in the age bracket) attending a public institution.
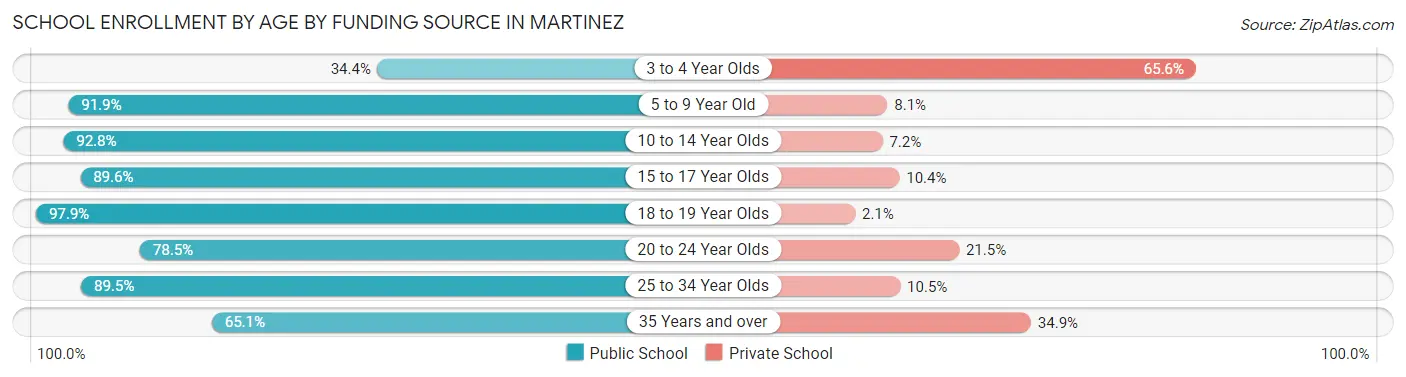
| Age Bracket | Public School | Private School |
| 3 to 4 Year Olds | 309 (34.4%) | 589 (65.6%) |
| 5 to 9 Year Old | 1,986 (91.9%) | 176 (8.1%) |
| 10 to 14 Year Olds | 1,723 (92.8%) | 134 (7.2%) |
| 15 to 17 Year Olds | 865 (89.6%) | 100 (10.4%) |
| 18 to 19 Year Olds | 507 (97.9%) | 11 (2.1%) |
| 20 to 24 Year Olds | 574 (78.5%) | 157 (21.5%) |
| 25 to 34 Year Olds | 536 (89.5%) | 63 (10.5%) |
| 35 Years and over | 353 (65.1%) | 189 (34.9%) |
| Total | 6,849 (82.8%) | 1,423 (17.2%) |
Educational Attainment by Field of Study in Martinez
Business (2,462 | 19.1%), social sciences (1,421 | 11.0%), science & technology (1,194 | 9.3%), psychology (1,074 | 8.3%), and bio, nature & agricultural (998 | 7.7%) are the most common fields of study among 12,899 individuals in Martinez who have obtained a bachelor's degree or higher.
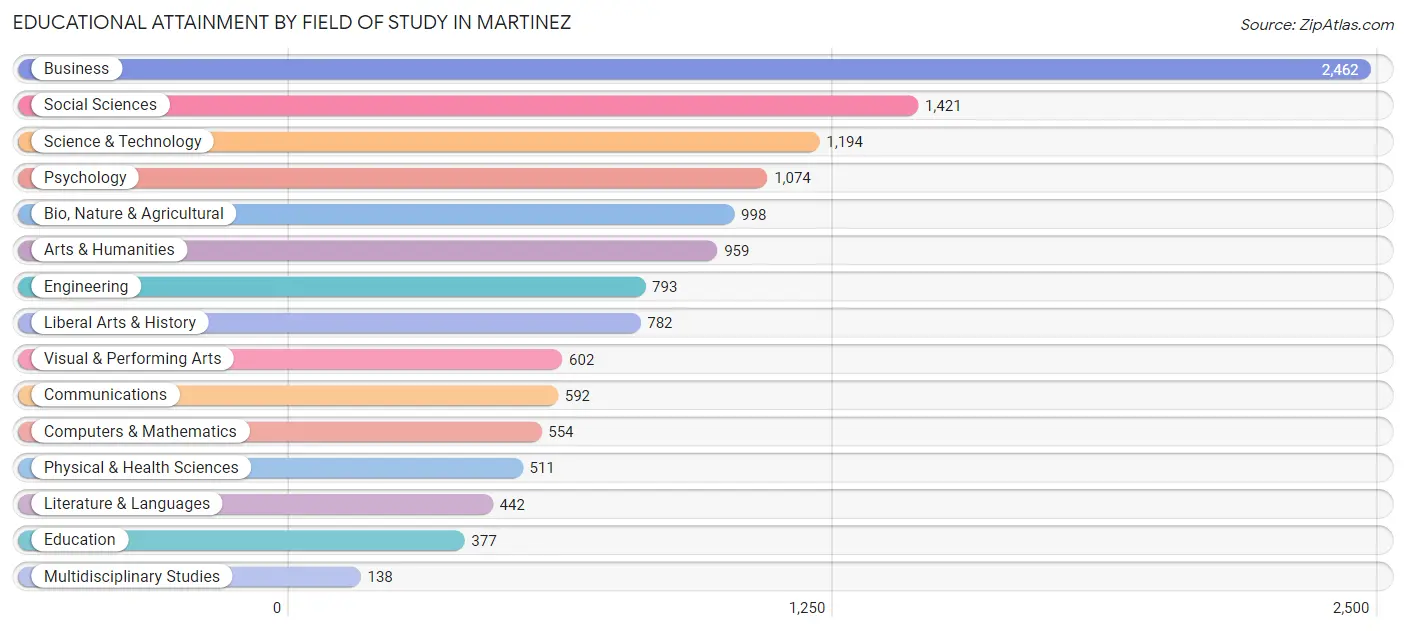
| Field of Study | # Graduates | % Graduates |
| Computers & Mathematics | 554 | 4.3% |
| Bio, Nature & Agricultural | 998 | 7.7% |
| Physical & Health Sciences | 511 | 4.0% |
| Psychology | 1,074 | 8.3% |
| Social Sciences | 1,421 | 11.0% |
| Engineering | 793 | 6.1% |
| Multidisciplinary Studies | 138 | 1.1% |
| Science & Technology | 1,194 | 9.3% |
| Business | 2,462 | 19.1% |
| Education | 377 | 2.9% |
| Literature & Languages | 442 | 3.4% |
| Liberal Arts & History | 782 | 6.1% |
| Visual & Performing Arts | 602 | 4.7% |
| Communications | 592 | 4.6% |
| Arts & Humanities | 959 | 7.4% |
| Total | 12,899 | 100.0% |
Transportation & Commute in Martinez
Vehicle Availability by Sex in Martinez
The most prevalent vehicle ownership categories in Martinez are males with 2 vehicles (4,432, accounting for 45.0%) and females with 2 vehicles (3,713, making up 48.8%).
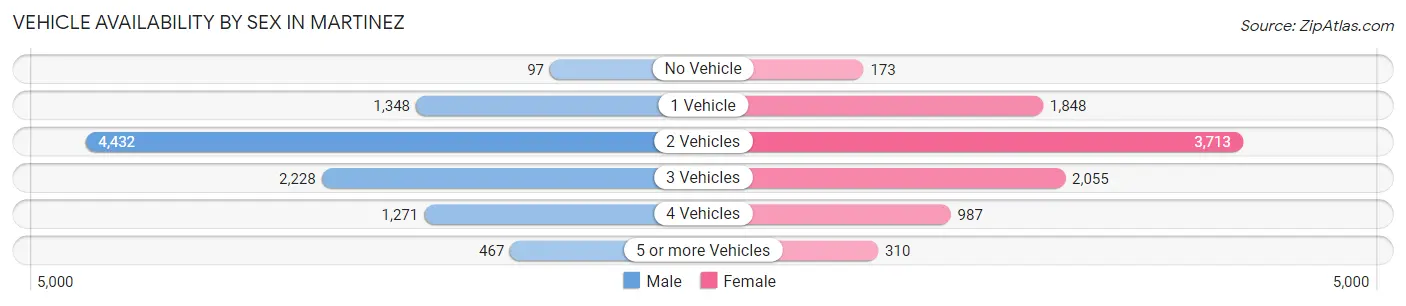
| Vehicles Available | Male | Female |
| No Vehicle | 97 (1.0%) | 173 (1.9%) |
| 1 Vehicle | 1,348 (13.7%) | 1,848 (20.3%) |
| 2 Vehicles | 4,432 (45.0%) | 3,713 (40.9%) |
| 3 Vehicles | 2,228 (22.6%) | 2,055 (22.6%) |
| 4 Vehicles | 1,271 (12.9%) | 987 (10.9%) |
| 5 or more Vehicles | 467 (4.7%) | 310 (3.4%) |
| Total | 9,843 (100.0%) | 9,086 (100.0%) |
Commute Time in Martinez
The most frequently occuring commute durations in Martinez are 15 to 19 minutes (2,233 commuters, 14.2%), 10 to 14 minutes (2,183 commuters, 13.9%), and 20 to 24 minutes (1,899 commuters, 12.1%).
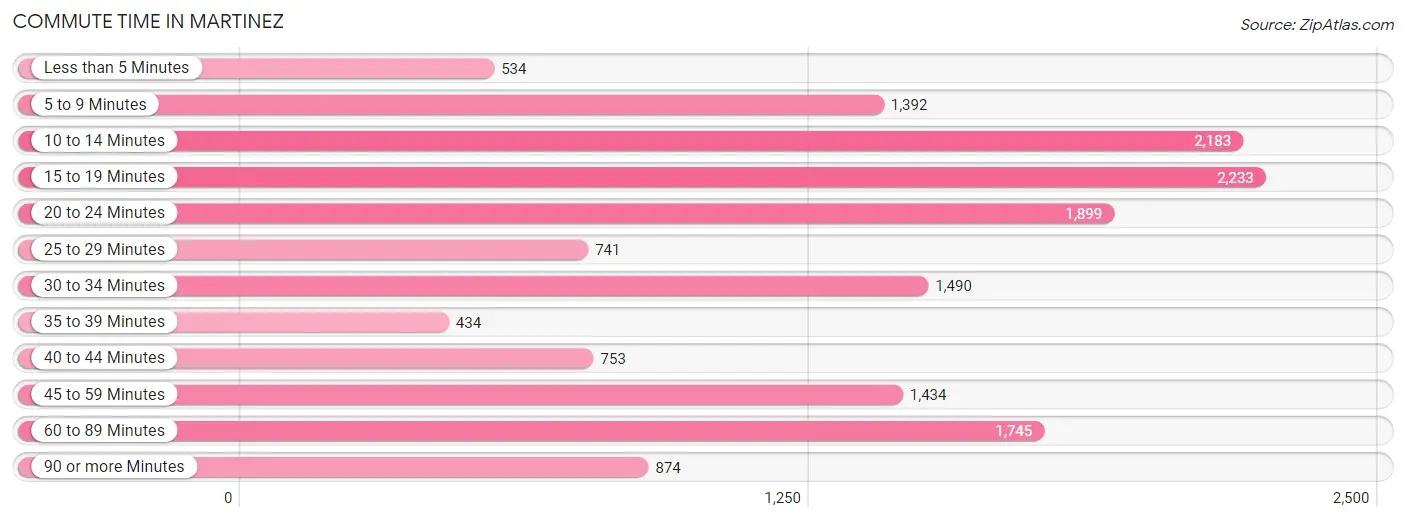
| Commute Time | # Commuters | % Commuters |
| Less than 5 Minutes | 534 | 3.4% |
| 5 to 9 Minutes | 1,392 | 8.9% |
| 10 to 14 Minutes | 2,183 | 13.9% |
| 15 to 19 Minutes | 2,233 | 14.2% |
| 20 to 24 Minutes | 1,899 | 12.1% |
| 25 to 29 Minutes | 741 | 4.7% |
| 30 to 34 Minutes | 1,490 | 9.5% |
| 35 to 39 Minutes | 434 | 2.8% |
| 40 to 44 Minutes | 753 | 4.8% |
| 45 to 59 Minutes | 1,434 | 9.1% |
| 60 to 89 Minutes | 1,745 | 11.1% |
| 90 or more Minutes | 874 | 5.6% |
Commute Time by Sex in Martinez
The most common commute times in Martinez are 60 to 89 minutes (1,133 commuters, 13.7%) for males and 10 to 14 minutes (1,261 commuters, 17.0%) for females.
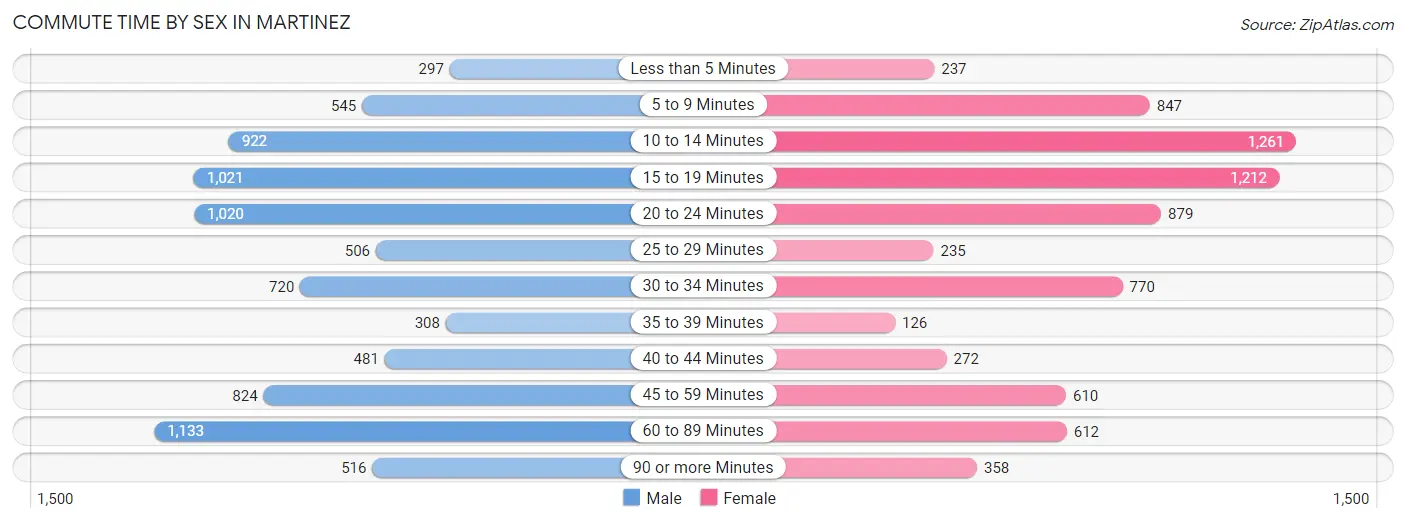
| Commute Time | Male | Female |
| Less than 5 Minutes | 297 (3.6%) | 237 (3.2%) |
| 5 to 9 Minutes | 545 (6.6%) | 847 (11.4%) |
| 10 to 14 Minutes | 922 (11.1%) | 1,261 (17.0%) |
| 15 to 19 Minutes | 1,021 (12.3%) | 1,212 (16.3%) |
| 20 to 24 Minutes | 1,020 (12.3%) | 879 (11.8%) |
| 25 to 29 Minutes | 506 (6.1%) | 235 (3.2%) |
| 30 to 34 Minutes | 720 (8.7%) | 770 (10.4%) |
| 35 to 39 Minutes | 308 (3.7%) | 126 (1.7%) |
| 40 to 44 Minutes | 481 (5.8%) | 272 (3.7%) |
| 45 to 59 Minutes | 824 (9.9%) | 610 (8.2%) |
| 60 to 89 Minutes | 1,133 (13.7%) | 612 (8.3%) |
| 90 or more Minutes | 516 (6.2%) | 358 (4.8%) |
Time of Departure to Work by Sex in Martinez
The most frequent times of departure to work in Martinez are 8:00 AM to 8:29 AM (1,060, 12.8%) for males and 7:00 AM to 7:29 AM (1,359, 18.3%) for females.
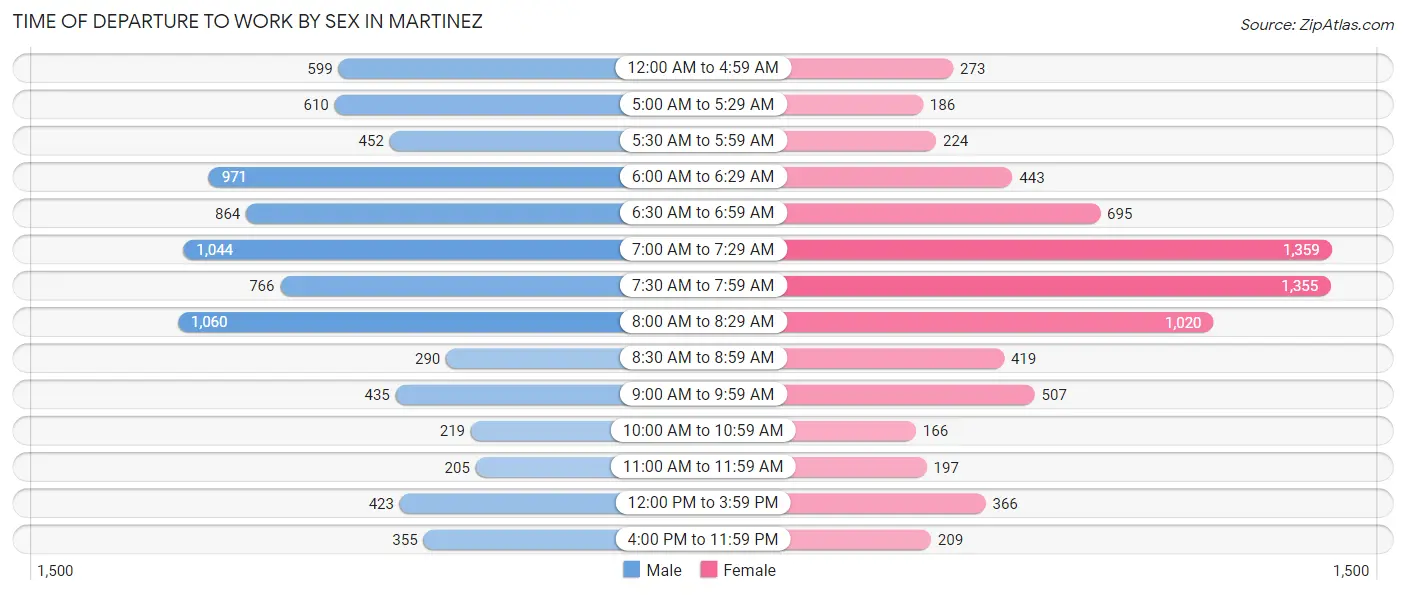
| Time of Departure | Male | Female |
| 12:00 AM to 4:59 AM | 599 (7.2%) | 273 (3.7%) |
| 5:00 AM to 5:29 AM | 610 (7.4%) | 186 (2.5%) |
| 5:30 AM to 5:59 AM | 452 (5.4%) | 224 (3.0%) |
| 6:00 AM to 6:29 AM | 971 (11.7%) | 443 (6.0%) |
| 6:30 AM to 6:59 AM | 864 (10.4%) | 695 (9.4%) |
| 7:00 AM to 7:29 AM | 1,044 (12.6%) | 1,359 (18.3%) |
| 7:30 AM to 7:59 AM | 766 (9.2%) | 1,355 (18.3%) |
| 8:00 AM to 8:29 AM | 1,060 (12.8%) | 1,020 (13.8%) |
| 8:30 AM to 8:59 AM | 290 (3.5%) | 419 (5.7%) |
| 9:00 AM to 9:59 AM | 435 (5.2%) | 507 (6.8%) |
| 10:00 AM to 10:59 AM | 219 (2.6%) | 166 (2.2%) |
| 11:00 AM to 11:59 AM | 205 (2.5%) | 197 (2.7%) |
| 12:00 PM to 3:59 PM | 423 (5.1%) | 366 (4.9%) |
| 4:00 PM to 11:59 PM | 355 (4.3%) | 209 (2.8%) |
| Total | 8,293 (100.0%) | 7,419 (100.0%) |
Housing Occupancy in Martinez
Occupancy by Ownership in Martinez
Of the total 14,615 dwellings in Martinez, owner-occupied units account for 10,378 (71.0%), while renter-occupied units make up 4,237 (29.0%).
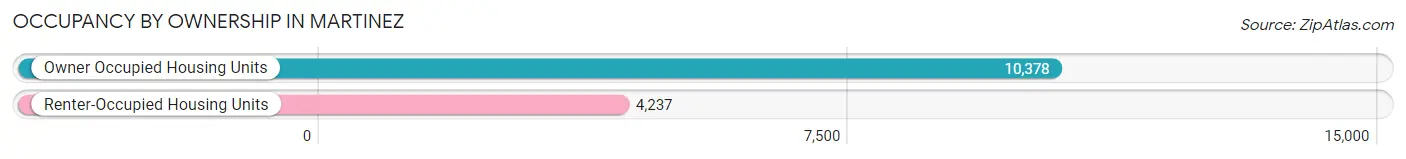
| Occupancy | # Housing Units | % Housing Units |
| Owner Occupied Housing Units | 10,378 | 71.0% |
| Renter-Occupied Housing Units | 4,237 | 29.0% |
| Total Occupied Housing Units | 14,615 | 100.0% |
Occupancy by Household Size in Martinez
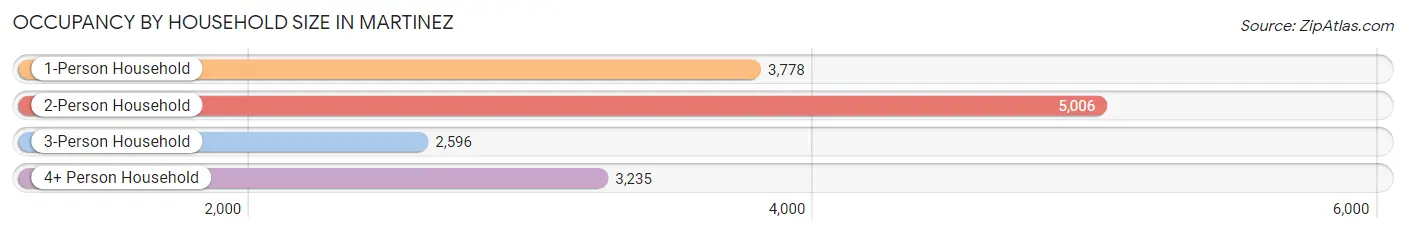
| Household Size | # Housing Units | % Housing Units |
| 1-Person Household | 3,778 | 25.9% |
| 2-Person Household | 5,006 | 34.3% |
| 3-Person Household | 2,596 | 17.8% |
| 4+ Person Household | 3,235 | 22.1% |
| Total Housing Units | 14,615 | 100.0% |
Occupancy by Ownership by Household Size in Martinez
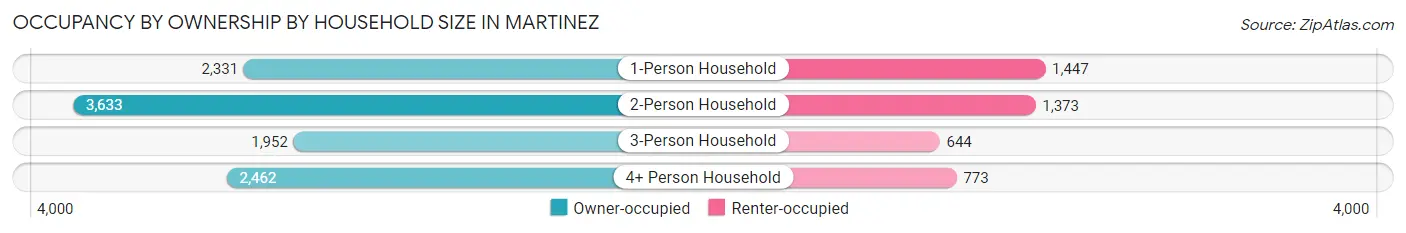
| Household Size | Owner-occupied | Renter-occupied |
| 1-Person Household | 2,331 (61.7%) | 1,447 (38.3%) |
| 2-Person Household | 3,633 (72.6%) | 1,373 (27.4%) |
| 3-Person Household | 1,952 (75.2%) | 644 (24.8%) |
| 4+ Person Household | 2,462 (76.1%) | 773 (23.9%) |
| Total Housing Units | 10,378 (71.0%) | 4,237 (29.0%) |
Occupancy by Educational Attainment in Martinez
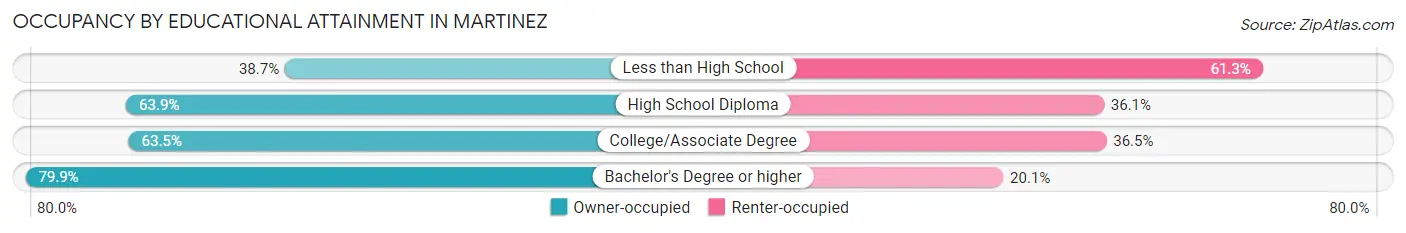
| Household Size | Owner-occupied | Renter-occupied |
| Less than High School | 178 (38.7%) | 282 (61.3%) |
| High School Diploma | 1,352 (63.9%) | 764 (36.1%) |
| College/Associate Degree | 2,975 (63.5%) | 1,710 (36.5%) |
| Bachelor's Degree or higher | 5,873 (79.9%) | 1,481 (20.1%) |
Occupancy by Age of Householder in Martinez
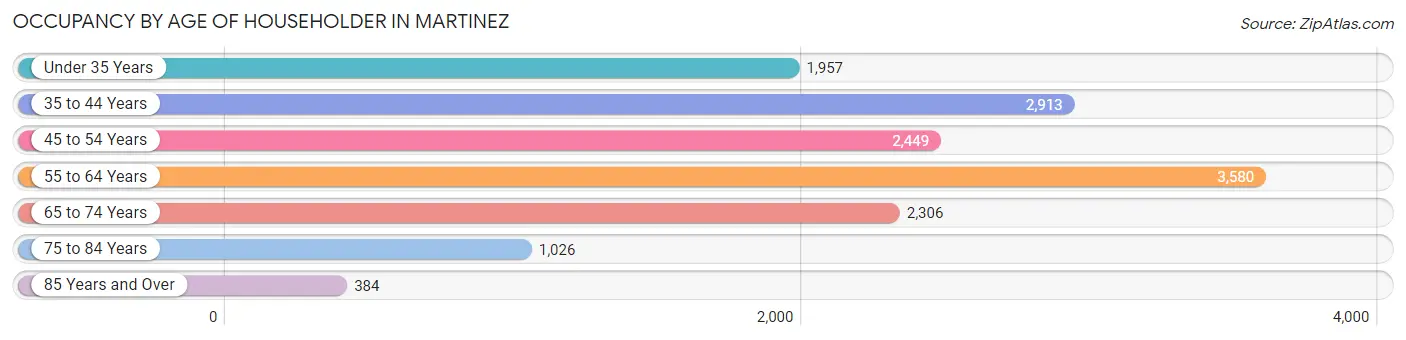
| Age Bracket | # Households | % Households |
| Under 35 Years | 1,957 | 13.4% |
| 35 to 44 Years | 2,913 | 19.9% |
| 45 to 54 Years | 2,449 | 16.8% |
| 55 to 64 Years | 3,580 | 24.5% |
| 65 to 74 Years | 2,306 | 15.8% |
| 75 to 84 Years | 1,026 | 7.0% |
| 85 Years and Over | 384 | 2.6% |
| Total | 14,615 | 100.0% |
Housing Finances in Martinez
Median Income by Occupancy in Martinez
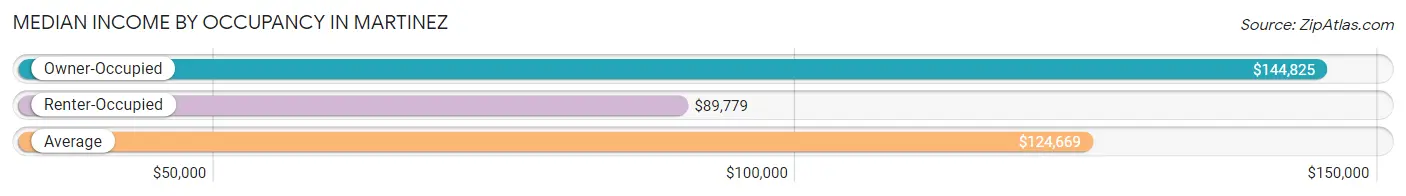
| Occupancy Type | # Households | Median Income |
| Owner-Occupied | 10,378 (71.0%) | $144,825 |
| Renter-Occupied | 4,237 (29.0%) | $89,779 |
| Average | 14,615 (100.0%) | $124,669 |
Occupancy by Householder Income Bracket in Martinez
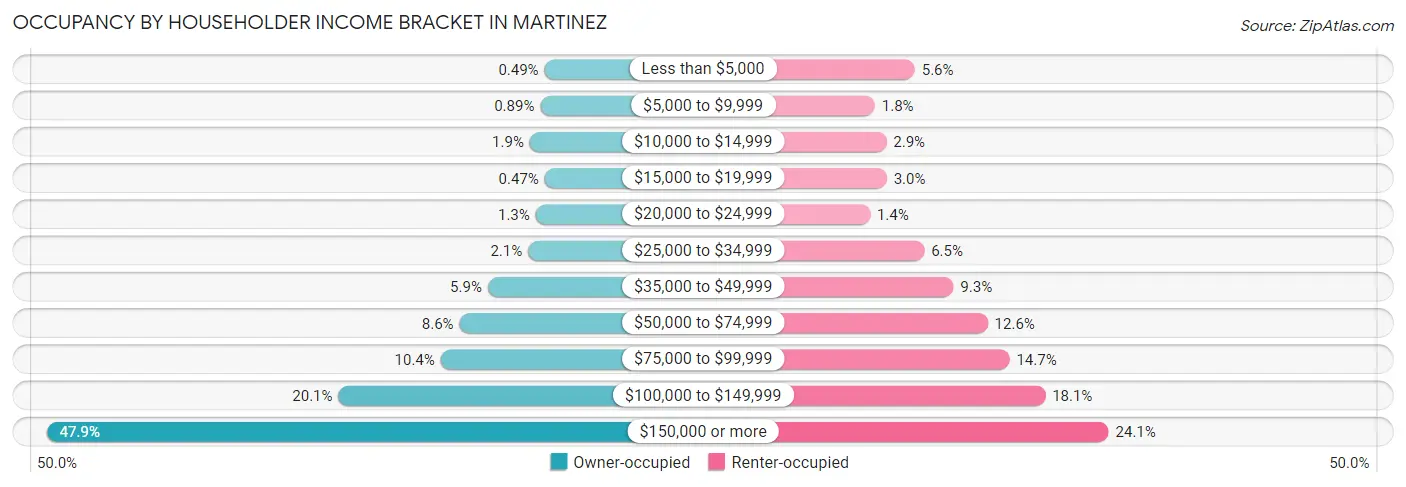
| Income Bracket | Owner-occupied | Renter-occupied |
| Less than $5,000 | 51 (0.5%) | 239 (5.6%) |
| $5,000 to $9,999 | 92 (0.9%) | 78 (1.8%) |
| $10,000 to $14,999 | 196 (1.9%) | 124 (2.9%) |
| $15,000 to $19,999 | 49 (0.5%) | 126 (3.0%) |
| $20,000 to $24,999 | 138 (1.3%) | 58 (1.4%) |
| $25,000 to $34,999 | 213 (2.1%) | 277 (6.5%) |
| $35,000 to $49,999 | 611 (5.9%) | 395 (9.3%) |
| $50,000 to $74,999 | 891 (8.6%) | 533 (12.6%) |
| $75,000 to $99,999 | 1,077 (10.4%) | 621 (14.7%) |
| $100,000 to $149,999 | 2,088 (20.1%) | 765 (18.1%) |
| $150,000 or more | 4,972 (47.9%) | 1,021 (24.1%) |
| Total | 10,378 (100.0%) | 4,237 (100.0%) |
Monthly Housing Cost Tiers in Martinez
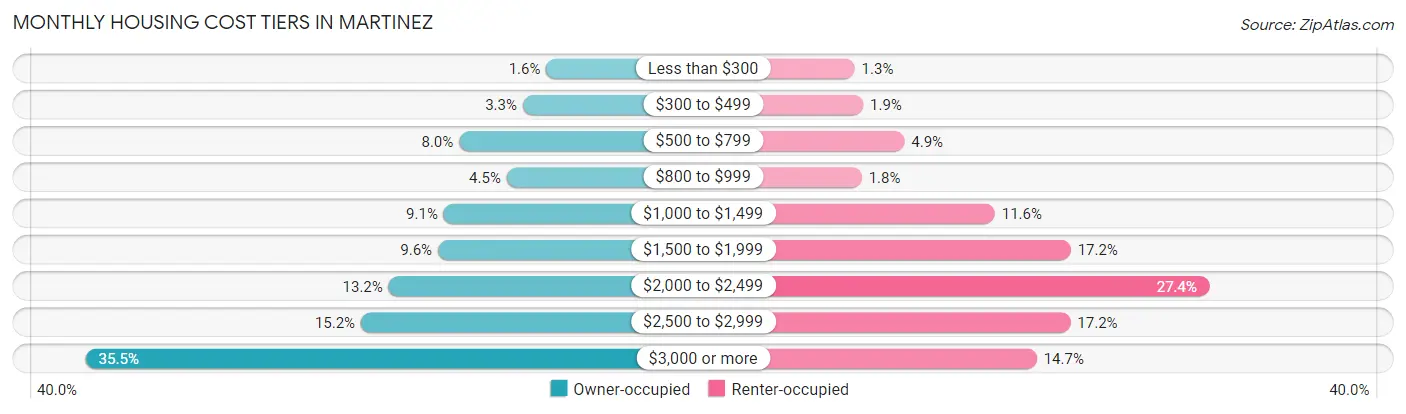
| Monthly Cost | Owner-occupied | Renter-occupied |
| Less than $300 | 164 (1.6%) | 54 (1.3%) |
| $300 to $499 | 344 (3.3%) | 80 (1.9%) |
| $500 to $799 | 830 (8.0%) | 209 (4.9%) |
| $800 to $999 | 466 (4.5%) | 76 (1.8%) |
| $1,000 to $1,499 | 948 (9.1%) | 491 (11.6%) |
| $1,500 to $1,999 | 992 (9.6%) | 728 (17.2%) |
| $2,000 to $2,499 | 1,369 (13.2%) | 1,159 (27.4%) |
| $2,500 to $2,999 | 1,581 (15.2%) | 727 (17.2%) |
| $3,000 or more | 3,684 (35.5%) | 622 (14.7%) |
| Total | 10,378 (100.0%) | 4,237 (100.0%) |
Physical Housing Characteristics in Martinez
Housing Structures in Martinez
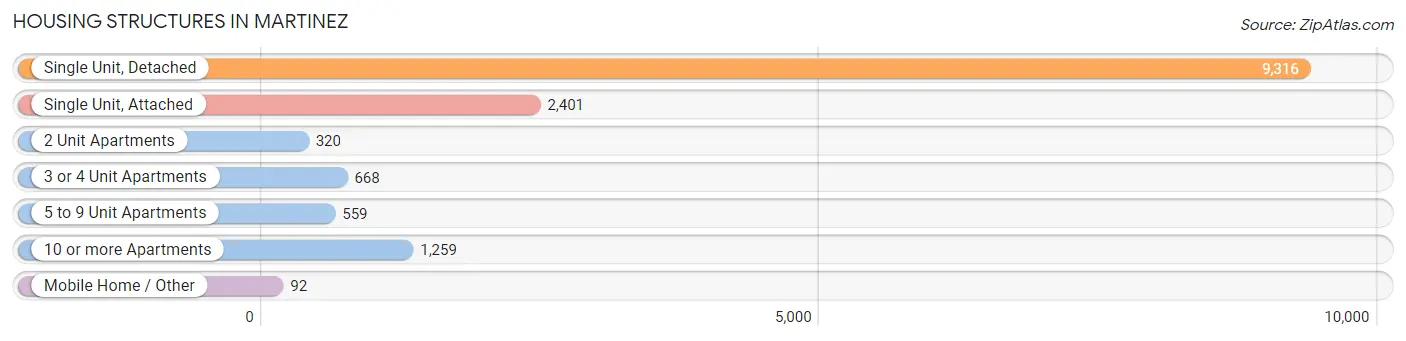
| Structure Type | # Housing Units | % Housing Units |
| Single Unit, Detached | 9,316 | 63.7% |
| Single Unit, Attached | 2,401 | 16.4% |
| 2 Unit Apartments | 320 | 2.2% |
| 3 or 4 Unit Apartments | 668 | 4.6% |
| 5 to 9 Unit Apartments | 559 | 3.8% |
| 10 or more Apartments | 1,259 | 8.6% |
| Mobile Home / Other | 92 | 0.6% |
| Total | 14,615 | 100.0% |
Housing Structures by Occupancy in Martinez
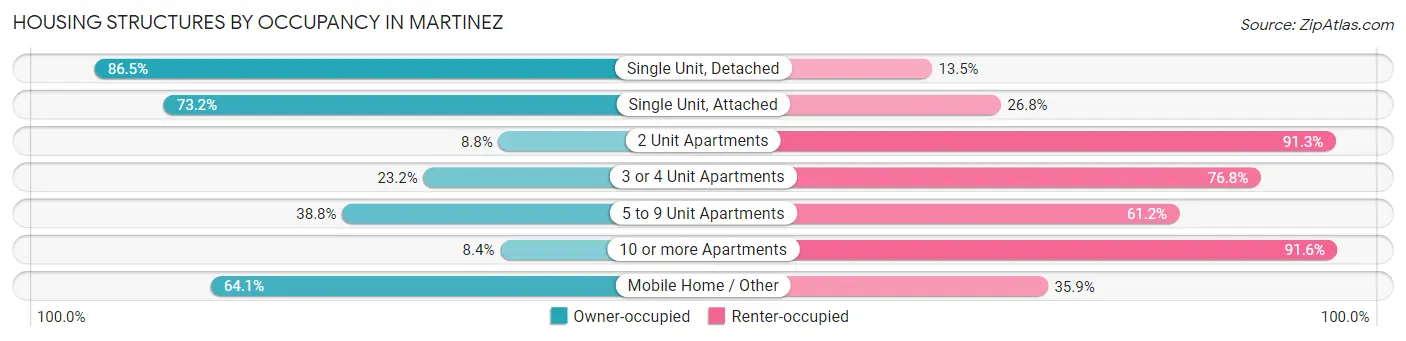
| Structure Type | Owner-occupied | Renter-occupied |
| Single Unit, Detached | 8,056 (86.5%) | 1,260 (13.5%) |
| Single Unit, Attached | 1,757 (73.2%) | 644 (26.8%) |
| 2 Unit Apartments | 28 (8.7%) | 292 (91.2%) |
| 3 or 4 Unit Apartments | 155 (23.2%) | 513 (76.8%) |
| 5 to 9 Unit Apartments | 217 (38.8%) | 342 (61.2%) |
| 10 or more Apartments | 106 (8.4%) | 1,153 (91.6%) |
| Mobile Home / Other | 59 (64.1%) | 33 (35.9%) |
| Total | 10,378 (71.0%) | 4,237 (29.0%) |
Housing Structures by Number of Rooms in Martinez
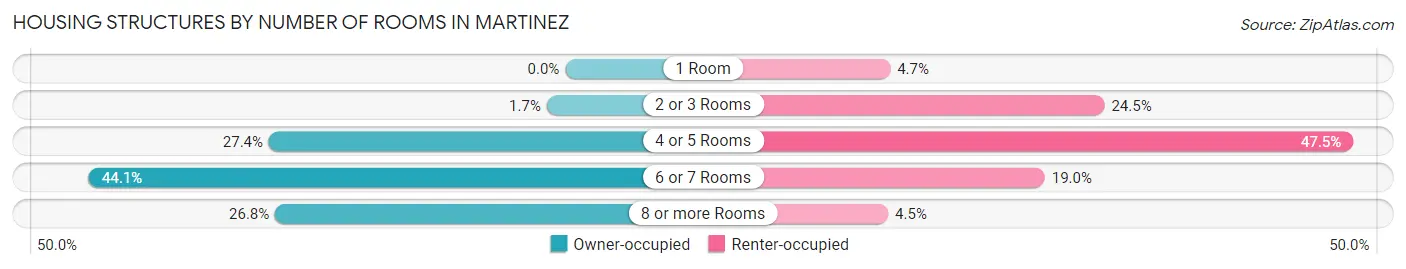
| Number of Rooms | Owner-occupied | Renter-occupied |
| 1 Room | 0 (0.0%) | 197 (4.6%) |
| 2 or 3 Rooms | 177 (1.7%) | 1,037 (24.5%) |
| 4 or 5 Rooms | 2,845 (27.4%) | 2,011 (47.5%) |
| 6 or 7 Rooms | 4,572 (44.1%) | 803 (19.0%) |
| 8 or more Rooms | 2,784 (26.8%) | 189 (4.5%) |
| Total | 10,378 (100.0%) | 4,237 (100.0%) |
Housing Structure by Heating Type in Martinez
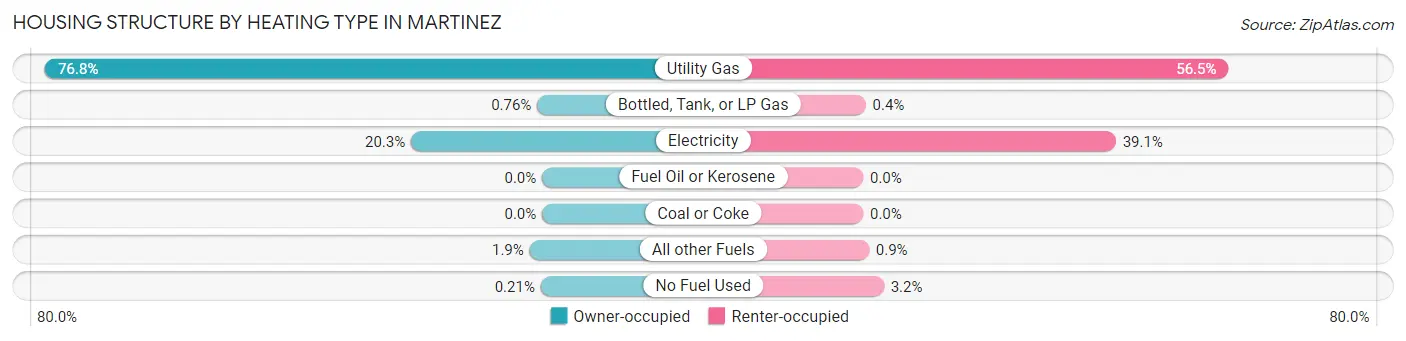
| Heating Type | Owner-occupied | Renter-occupied |
| Utility Gas | 7,974 (76.8%) | 2,392 (56.5%) |
| Bottled, Tank, or LP Gas | 79 (0.8%) | 17 (0.4%) |
| Electricity | 2,103 (20.3%) | 1,655 (39.1%) |
| Fuel Oil or Kerosene | 0 (0.0%) | 0 (0.0%) |
| Coal or Coke | 0 (0.0%) | 0 (0.0%) |
| All other Fuels | 200 (1.9%) | 38 (0.9%) |
| No Fuel Used | 22 (0.2%) | 135 (3.2%) |
| Total | 10,378 (100.0%) | 4,237 (100.0%) |
Household Vehicle Usage in Martinez
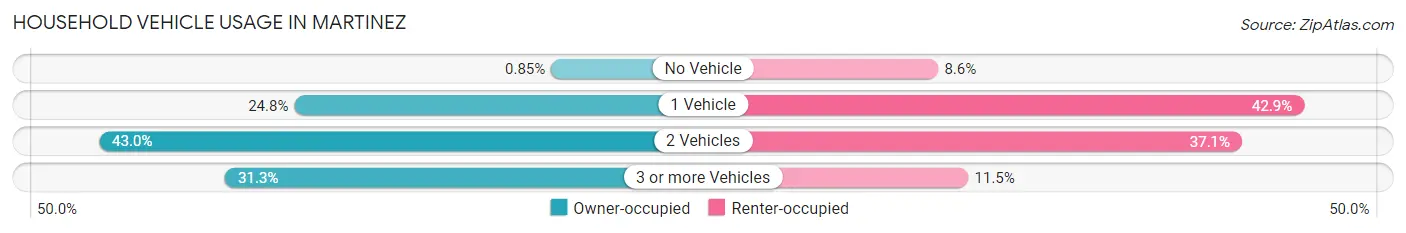
| Vehicles per Household | Owner-occupied | Renter-occupied |
| No Vehicle | 88 (0.9%) | 366 (8.6%) |
| 1 Vehicle | 2,577 (24.8%) | 1,816 (42.9%) |
| 2 Vehicles | 4,467 (43.0%) | 1,570 (37.0%) |
| 3 or more Vehicles | 3,246 (31.3%) | 485 (11.5%) |
| Total | 10,378 (100.0%) | 4,237 (100.0%) |
Real Estate & Mortgages in Martinez
Real Estate and Mortgage Overview in Martinez
| Characteristic | Without Mortgage | With Mortgage |
| Housing Units | 2,568 | 7,810 |
| Median Property Value | $793,700 | $763,100 |
| Median Household Income | $110,263 | $4,171 |
| Monthly Housing Costs | $784 | $3,655 |
| Real Estate Taxes | $4,277 | $42 |
Property Value by Mortgage Status in Martinez
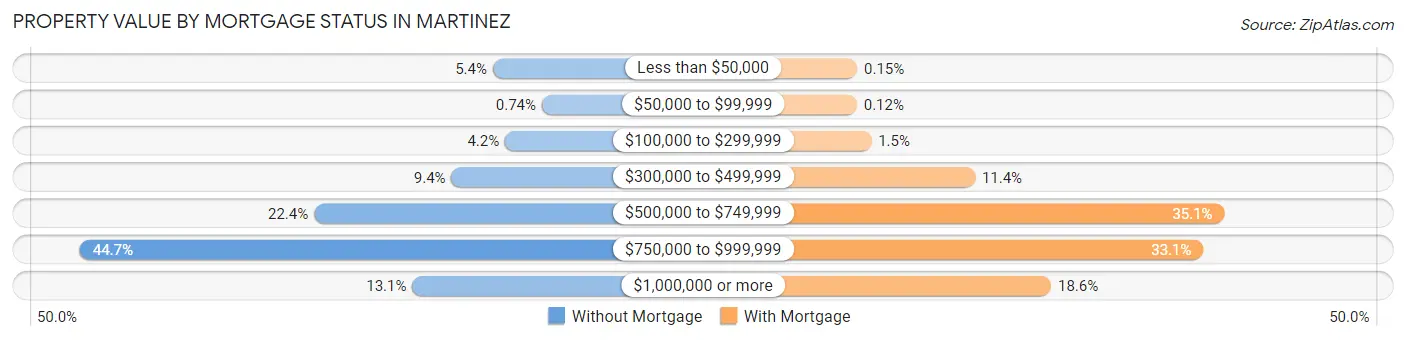
| Property Value | Without Mortgage | With Mortgage |
| Less than $50,000 | 139 (5.4%) | 12 (0.2%) |
| $50,000 to $99,999 | 19 (0.7%) | 9 (0.1%) |
| $100,000 to $299,999 | 109 (4.2%) | 116 (1.5%) |
| $300,000 to $499,999 | 240 (9.3%) | 888 (11.4%) |
| $500,000 to $749,999 | 576 (22.4%) | 2,744 (35.1%) |
| $750,000 to $999,999 | 1,149 (44.7%) | 2,587 (33.1%) |
| $1,000,000 or more | 336 (13.1%) | 1,454 (18.6%) |
| Total | 2,568 (100.0%) | 7,810 (100.0%) |
Household Income by Mortgage Status in Martinez
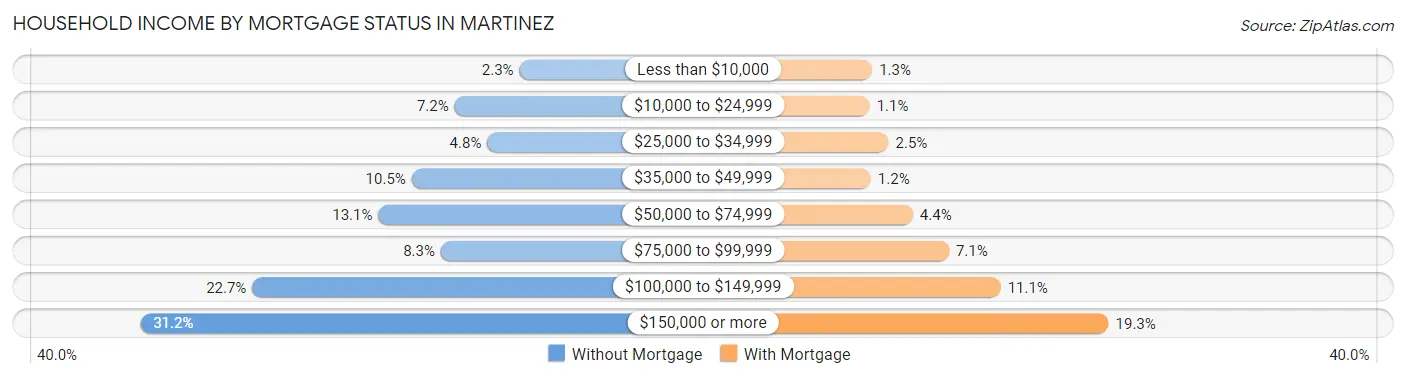
| Household Income | Without Mortgage | With Mortgage |
| Less than $10,000 | 59 (2.3%) | 99 (1.3%) |
| $10,000 to $24,999 | 186 (7.2%) | 84 (1.1%) |
| $25,000 to $34,999 | 122 (4.8%) | 197 (2.5%) |
| $35,000 to $49,999 | 270 (10.5%) | 91 (1.2%) |
| $50,000 to $74,999 | 335 (13.1%) | 341 (4.4%) |
| $75,000 to $99,999 | 213 (8.3%) | 556 (7.1%) |
| $100,000 to $149,999 | 582 (22.7%) | 864 (11.1%) |
| $150,000 or more | 801 (31.2%) | 1,506 (19.3%) |
| Total | 2,568 (100.0%) | 7,810 (100.0%) |
Property Value to Household Income Ratio in Martinez
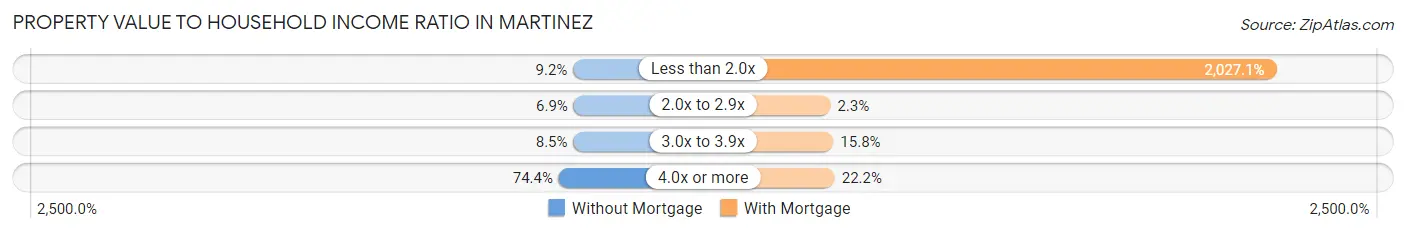
| Value-to-Income Ratio | Without Mortgage | With Mortgage |
| Less than 2.0x | 236 (9.2%) | 158,317 (2,027.1%) |
| 2.0x to 2.9x | 177 (6.9%) | 181 (2.3%) |
| 3.0x to 3.9x | 219 (8.5%) | 1,237 (15.8%) |
| 4.0x or more | 1,911 (74.4%) | 1,732 (22.2%) |
| Total | 2,568 (100.0%) | 7,810 (100.0%) |
Real Estate Taxes by Mortgage Status in Martinez
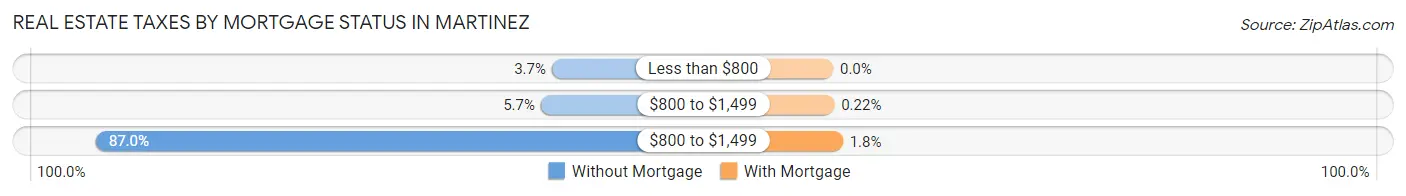
| Property Taxes | Without Mortgage | With Mortgage |
| Less than $800 | 95 (3.7%) | 0 (0.0%) |
| $800 to $1,499 | 147 (5.7%) | 17 (0.2%) |
| $800 to $1,499 | 2,234 (87.0%) | 138 (1.8%) |
| Total | 2,568 (100.0%) | 7,810 (100.0%) |
Health & Disability in Martinez
Health Insurance Coverage by Age in Martinez
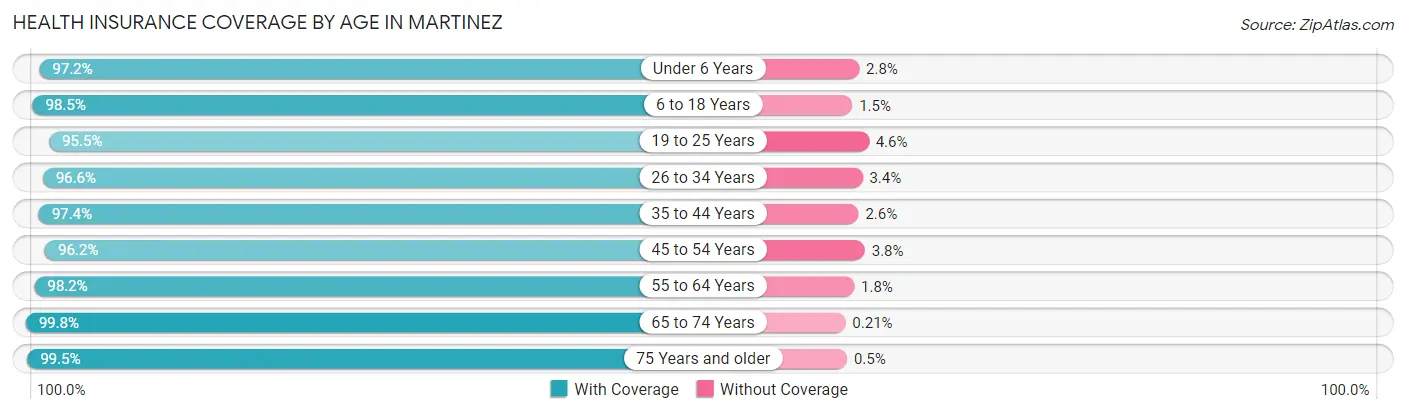
| Age Bracket | With Coverage | Without Coverage |
| Under 6 Years | 3,096 (97.2%) | 88 (2.8%) |
| 6 to 18 Years | 4,658 (98.5%) | 70 (1.5%) |
| 19 to 25 Years | 2,393 (95.5%) | 114 (4.5%) |
| 26 to 34 Years | 3,914 (96.6%) | 137 (3.4%) |
| 35 to 44 Years | 5,541 (97.4%) | 150 (2.6%) |
| 45 to 54 Years | 4,433 (96.2%) | 176 (3.8%) |
| 55 to 64 Years | 5,485 (98.2%) | 102 (1.8%) |
| 65 to 74 Years | 3,850 (99.8%) | 8 (0.2%) |
| 75 Years and older | 2,397 (99.5%) | 12 (0.5%) |
| Total | 35,767 (97.7%) | 857 (2.3%) |
Health Insurance Coverage by Citizenship Status in Martinez
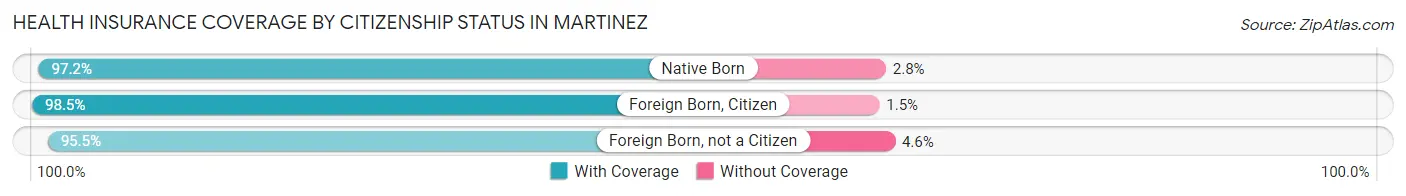
| Citizenship Status | With Coverage | Without Coverage |
| Native Born | 3,096 (97.2%) | 88 (2.8%) |
| Foreign Born, Citizen | 4,658 (98.5%) | 70 (1.5%) |
| Foreign Born, not a Citizen | 2,393 (95.5%) | 114 (4.5%) |
Health Insurance Coverage by Household Income in Martinez
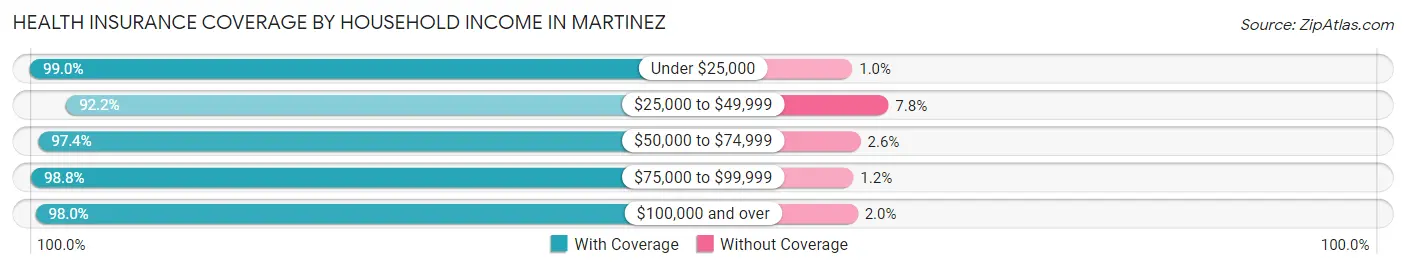
| Household Income | With Coverage | Without Coverage |
| Under $25,000 | 1,540 (99.0%) | 16 (1.0%) |
| $25,000 to $49,999 | 2,234 (92.2%) | 189 (7.8%) |
| $50,000 to $74,999 | 2,982 (97.4%) | 79 (2.6%) |
| $75,000 to $99,999 | 3,755 (98.8%) | 47 (1.2%) |
| $100,000 and over | 25,131 (98.0%) | 523 (2.0%) |
Public vs Private Health Insurance Coverage by Age in Martinez
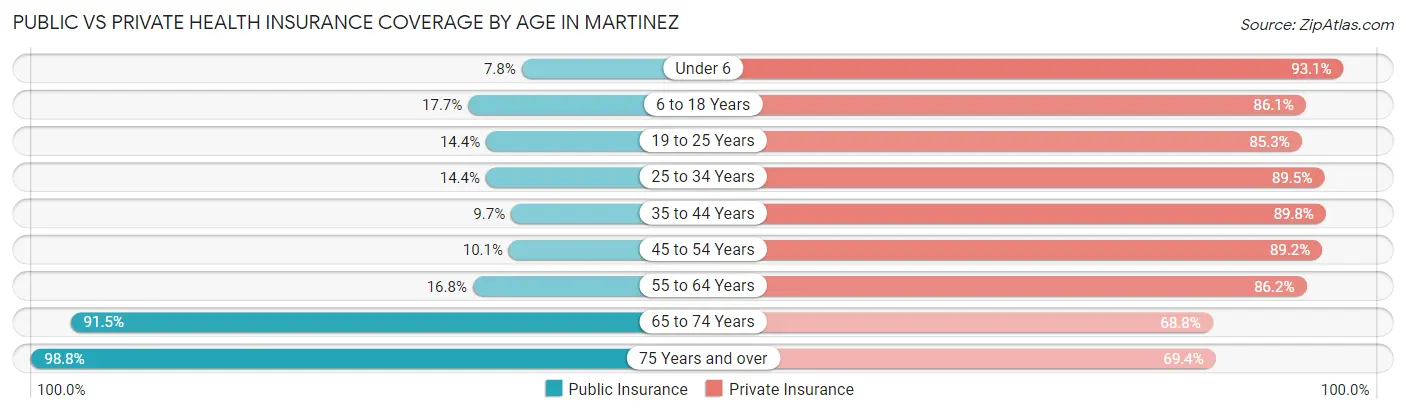
| Age Bracket | Public Insurance | Private Insurance |
| Under 6 | 247 (7.8%) | 2,964 (93.1%) |
| 6 to 18 Years | 836 (17.7%) | 4,070 (86.1%) |
| 19 to 25 Years | 360 (14.4%) | 2,139 (85.3%) |
| 25 to 34 Years | 583 (14.4%) | 3,626 (89.5%) |
| 35 to 44 Years | 553 (9.7%) | 5,111 (89.8%) |
| 45 to 54 Years | 467 (10.1%) | 4,109 (89.1%) |
| 55 to 64 Years | 940 (16.8%) | 4,816 (86.2%) |
| 65 to 74 Years | 3,528 (91.4%) | 2,655 (68.8%) |
| 75 Years and over | 2,379 (98.8%) | 1,671 (69.4%) |
| Total | 9,893 (27.0%) | 31,161 (85.1%) |
Disability Status by Sex by Age in Martinez
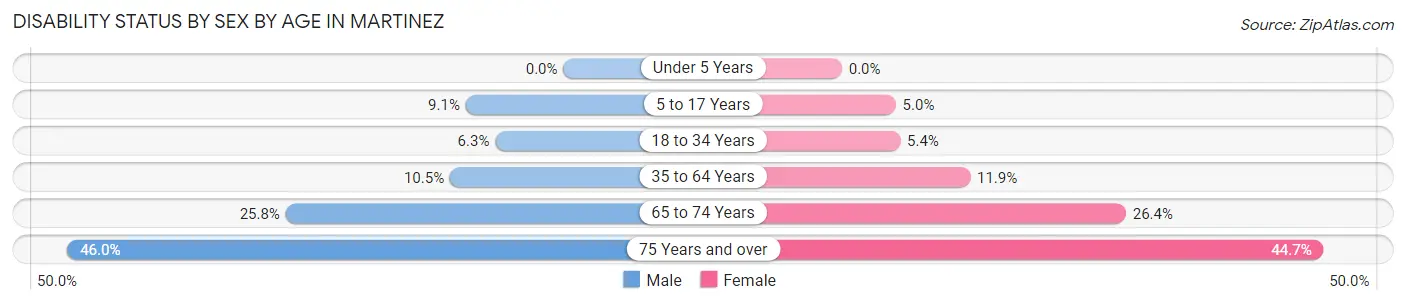
| Age Bracket | Male | Female |
| Under 5 Years | 0 (0.0%) | 0 (0.0%) |
| 5 to 17 Years | 258 (9.1%) | 109 (5.0%) |
| 18 to 34 Years | 222 (6.3%) | 178 (5.4%) |
| 35 to 64 Years | 819 (10.5%) | 964 (11.9%) |
| 65 to 74 Years | 435 (25.8%) | 572 (26.4%) |
| 75 Years and over | 453 (46.0%) | 637 (44.7%) |
Disability Class by Sex by Age in Martinez
Disability Class: Hearing Difficulty
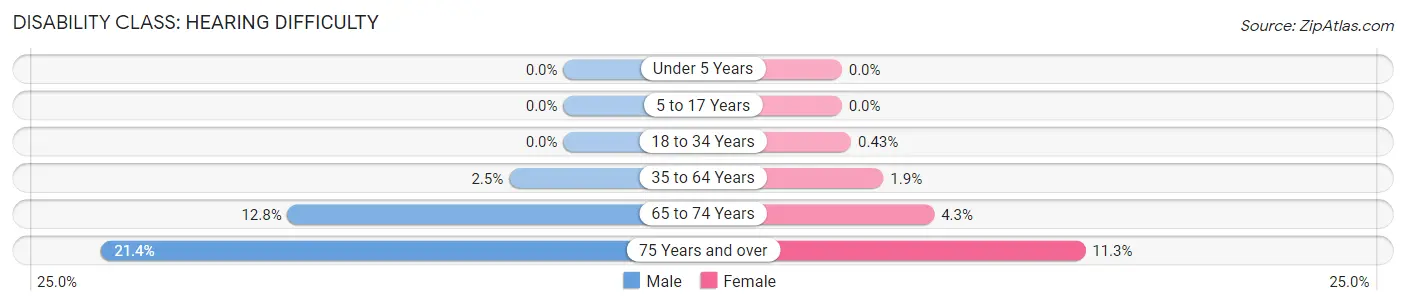
| Age Bracket | Male | Female |
| Under 5 Years | 0 (0.0%) | 0 (0.0%) |
| 5 to 17 Years | 0 (0.0%) | 0 (0.0%) |
| 18 to 34 Years | 0 (0.0%) | 14 (0.4%) |
| 35 to 64 Years | 196 (2.5%) | 156 (1.9%) |
| 65 to 74 Years | 216 (12.8%) | 93 (4.3%) |
| 75 Years and over | 211 (21.4%) | 161 (11.3%) |
Disability Class: Vision Difficulty
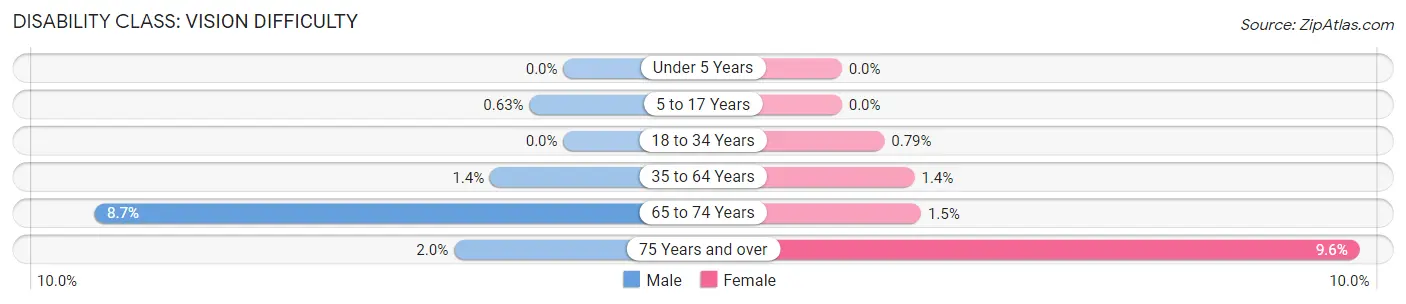
| Age Bracket | Male | Female |
| Under 5 Years | 0 (0.0%) | 0 (0.0%) |
| 5 to 17 Years | 18 (0.6%) | 0 (0.0%) |
| 18 to 34 Years | 0 (0.0%) | 26 (0.8%) |
| 35 to 64 Years | 106 (1.4%) | 109 (1.3%) |
| 65 to 74 Years | 147 (8.7%) | 32 (1.5%) |
| 75 Years and over | 20 (2.0%) | 137 (9.6%) |
Disability Class: Cognitive Difficulty
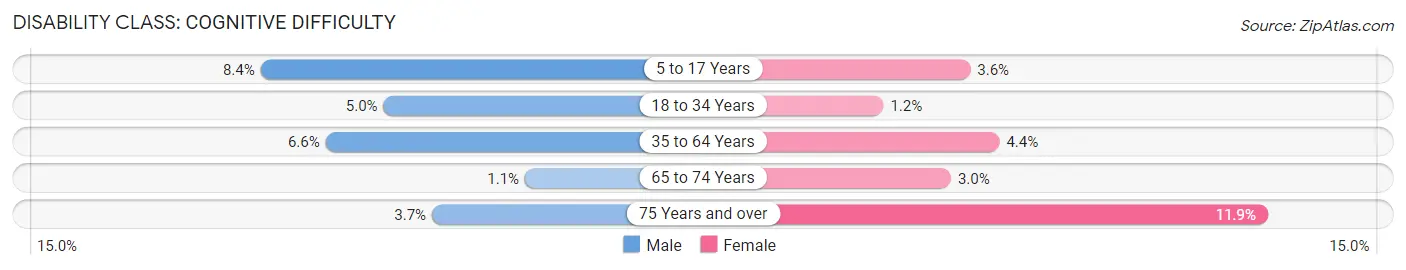
| Age Bracket | Male | Female |
| 5 to 17 Years | 240 (8.4%) | 78 (3.6%) |
| 18 to 34 Years | 176 (5.0%) | 38 (1.2%) |
| 35 to 64 Years | 515 (6.6%) | 356 (4.4%) |
| 65 to 74 Years | 18 (1.1%) | 66 (3.0%) |
| 75 Years and over | 36 (3.7%) | 169 (11.9%) |
Disability Class: Ambulatory Difficulty
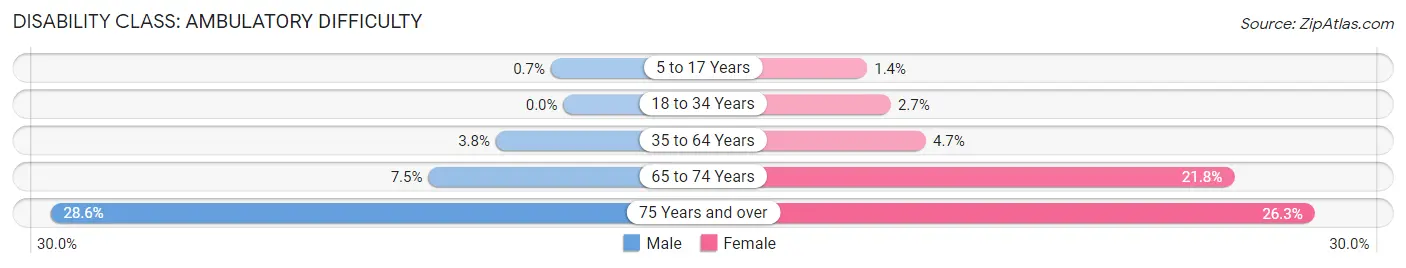
| Age Bracket | Male | Female |
| 5 to 17 Years | 20 (0.7%) | 31 (1.4%) |
| 18 to 34 Years | 0 (0.0%) | 90 (2.7%) |
| 35 to 64 Years | 293 (3.8%) | 380 (4.7%) |
| 65 to 74 Years | 127 (7.5%) | 474 (21.8%) |
| 75 Years and over | 281 (28.6%) | 375 (26.3%) |
Disability Class: Self-Care Difficulty
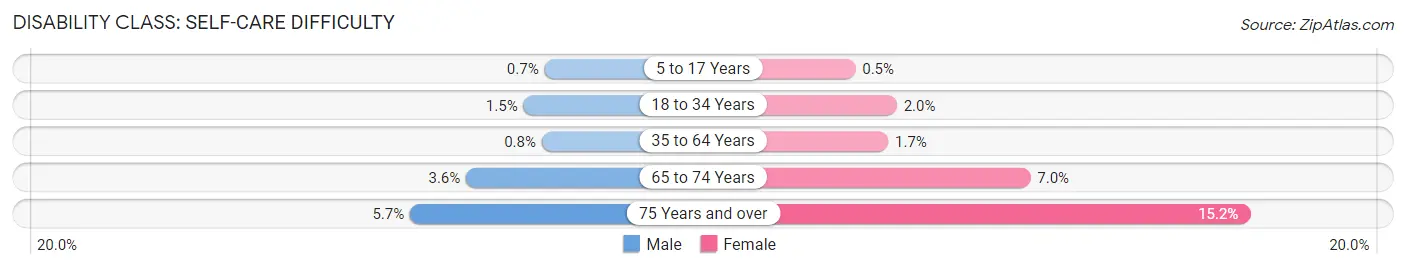
| Age Bracket | Male | Female |
| 5 to 17 Years | 20 (0.7%) | 11 (0.5%) |
| 18 to 34 Years | 52 (1.5%) | 67 (2.0%) |
| 35 to 64 Years | 62 (0.8%) | 139 (1.7%) |
| 65 to 74 Years | 61 (3.6%) | 152 (7.0%) |
| 75 Years and over | 56 (5.7%) | 216 (15.2%) |
Technology Access in Martinez
Computing Device Access in Martinez
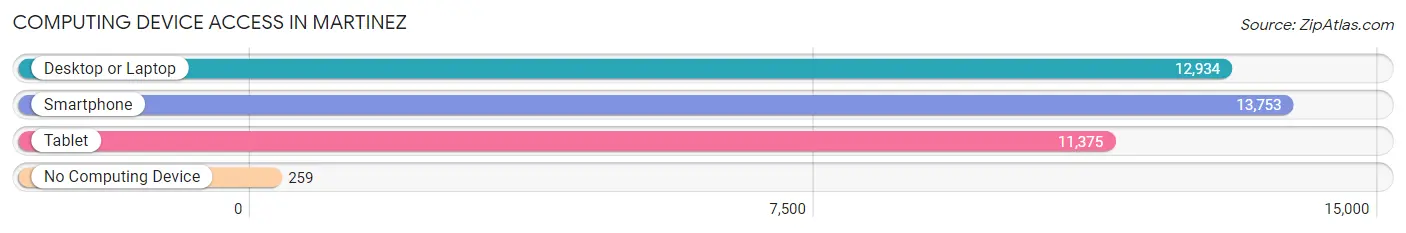
| Device Type | # Households | % Households |
| Desktop or Laptop | 12,934 | 88.5% |
| Smartphone | 13,753 | 94.1% |
| Tablet | 11,375 | 77.8% |
| No Computing Device | 259 | 1.8% |
| Total | 14,615 | 100.0% |
Internet Access in Martinez
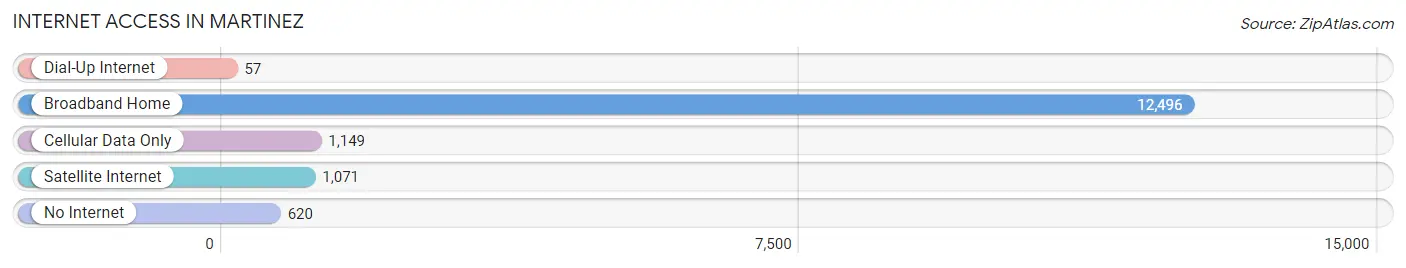
| Internet Type | # Households | % Households |
| Dial-Up Internet | 57 | 0.4% |
| Broadband Home | 12,496 | 85.5% |
| Cellular Data Only | 1,149 | 7.9% |
| Satellite Internet | 1,071 | 7.3% |
| No Internet | 620 | 4.2% |
| Total | 14,615 | 100.0% |
Martinez Summary
Martinez, California is a city located in Contra Costa County, in the San Francisco Bay Area. It is situated on the north side of the Carquinez Strait, which is part of the San Francisco Bay. The city is known for its rich history, diverse geography, vibrant economy, and diverse demographics.
History
The history of Martinez dates back to the early 1800s, when it was first settled by Spanish missionaries. The area was originally known as El Pinole, and was part of the Rancho El Pinole land grant. In 1849, the town was renamed Martinez, after Don Ygnacio Martinez, the grantee of the Rancho El Pinole.
In the late 1800s, Martinez became an important port for shipping grain and other goods. The city was also home to several large industries, including a sugar refinery, a flour mill, and a cannery.
In the early 1900s, Martinez experienced a period of growth and development. The city was incorporated in 1908, and the Martinez-Benicia Bridge was built in 1927, connecting the city to the nearby city of Benicia.
Geography
Martinez is located in the San Francisco Bay Area, on the north side of the Carquinez Strait. The city is situated on the east side of the strait, and is bordered by the cities of Benicia and Vallejo to the north, and Concord and Pleasant Hill to the south.
The city has a total area of 8.3 square miles, and is located at an elevation of 30 feet above sea level. The climate in Martinez is mild, with temperatures ranging from the mid-50s to the mid-70s throughout the year.
Economy
The economy of Martinez is largely based on the service sector, with the city’s largest employers being the Contra Costa County government, the Martinez Unified School District, and the John Muir Medical Center. Other major employers in the city include the Chevron Corporation, the Shell Oil Company, and the Valero Energy Corporation.
The city also has a thriving retail sector, with several shopping centers and malls located in the area. The city is also home to several wineries, and is a popular destination for wine tasting.
Demographics
As of the 2010 census, the population of Martinez was 35,824. The city has a diverse population, with the largest ethnic groups being White (47.3%), Hispanic or Latino (30.2%), and Asian (14.2%).
The median household income in Martinez is $76,845, and the median home value is $541,400. The city has a high rate of homeownership, with 73.3% of residents owning their own homes.
Conclusion
Martinez, California is a city with a rich history, diverse geography, vibrant economy, and diverse demographics. The city is home to several large employers, and has a thriving retail sector. The population of Martinez is diverse, with the largest ethnic groups being White, Hispanic or Latino, and Asian. The city has a high rate of homeownership, and a median household income of $76,845.
Common Questions
What is Per Capita Income in Martinez?
Per Capita income in Martinez is $61,048.
What is the Median Family Income in Martinez?
Median Family Income in Martinez is $149,100.
What is the Median Household income in Martinez?
Median Household Income in Martinez is $124,669.
What is Income or Wage Gap in Martinez?
Income or Wage Gap in Martinez is 27.3%.
Women in Martinez earn 72.7 cents for every dollar earned by a man.
What is Inequality or Gini Index in Martinez?
Inequality or Gini Index in Martinez is 0.41.
What is the Total Population of Martinez?
Total Population of Martinez is 37,093.
What is the Total Male Population of Martinez?
Total Male Population of Martinez is 18,548.
What is the Total Female Population of Martinez?
Total Female Population of Martinez is 18,545.
What is the Ratio of Males per 100 Females in Martinez?
There are 100.02 Males per 100 Females in Martinez.
What is the Ratio of Females per 100 Males in Martinez?
There are 99.98 Females per 100 Males in Martinez.
What is the Median Population Age in Martinez?
Median Population Age in Martinez is 42.1 Years.
What is the Average Family Size in Martinez
Average Family Size in Martinez is 3.0 People.
What is the Average Household Size in Martinez
Average Household Size in Martinez is 2.5 People.
How Large is the Labor Force in Martinez?
There are 20,479 People in the Labor Forcein in Martinez.
What is the Percentage of People in the Labor Force in Martinez?
67.9% of People are in the Labor Force in Martinez.
What is the Unemployment Rate in Martinez?
Unemployment Rate in Martinez is 4.9%.