Sartell, MN Map & Demographics
Sartell Map
Sartell Overview
$39,501
PER CAPITA INCOME
$95,824
AVG FAMILY INCOME
$74,177
AVG HOUSEHOLD INCOME
25.1%
WAGE / INCOME GAP [ % ]
74.9¢/ $1
WAGE / INCOME GAP [ $ ]
0.43
INEQUALITY / GINI INDEX
19,382
TOTAL POPULATION
9,522
MALE POPULATION
9,860
FEMALE POPULATION
96.57
MALES / 100 FEMALES
103.55
FEMALES / 100 MALES
32.9
MEDIAN AGE
3.3
AVG FAMILY SIZE
2.5
AVG HOUSEHOLD SIZE
10,638
LABOR FORCE [ PEOPLE ]
73.0%
PERCENT IN LABOR FORCE
2.6%
UNEMPLOYMENT RATE
Sartell Zip Codes
Sartell Area Codes
Income in Sartell
Income Overview in Sartell
Per Capita Income in Sartell is $39,501, while median incomes of families and households are $95,824 and $74,177 respectively.
| Characteristic | Number | Measure |
| Per Capita Income | 19,382 | $39,501 |
| Median Family Income | 4,412 | $95,824 |
| Mean Family Income | 4,412 | $127,918 |
| Median Household Income | 7,505 | $74,177 |
| Mean Household Income | 7,505 | $100,485 |
| Income Deficit | 4,412 | $0 |
| Wage / Income Gap (%) | 19,382 | 25.08% |
| Wage / Income Gap ($) | 19,382 | 74.92¢ per $1 |
| Gini / Inequality Index | 19,382 | 0.43 |
Earnings by Sex in Sartell
Average Earnings in Sartell are $46,993, $54,931 for men and $41,153 for women, a difference of 25.1%.

| Sex | Number | Average Earnings |
| Male | 5,755 (51.5%) | $54,931 |
| Female | 5,427 (48.5%) | $41,153 |
| Total | 11,182 (100.0%) | $46,993 |
Earnings by Sex by Income Bracket in Sartell
The most common earnings brackets in Sartell are $100,000+ for men (1,003 | 17.4%) and $45,000 to $49,999 for women (571 | 10.5%).
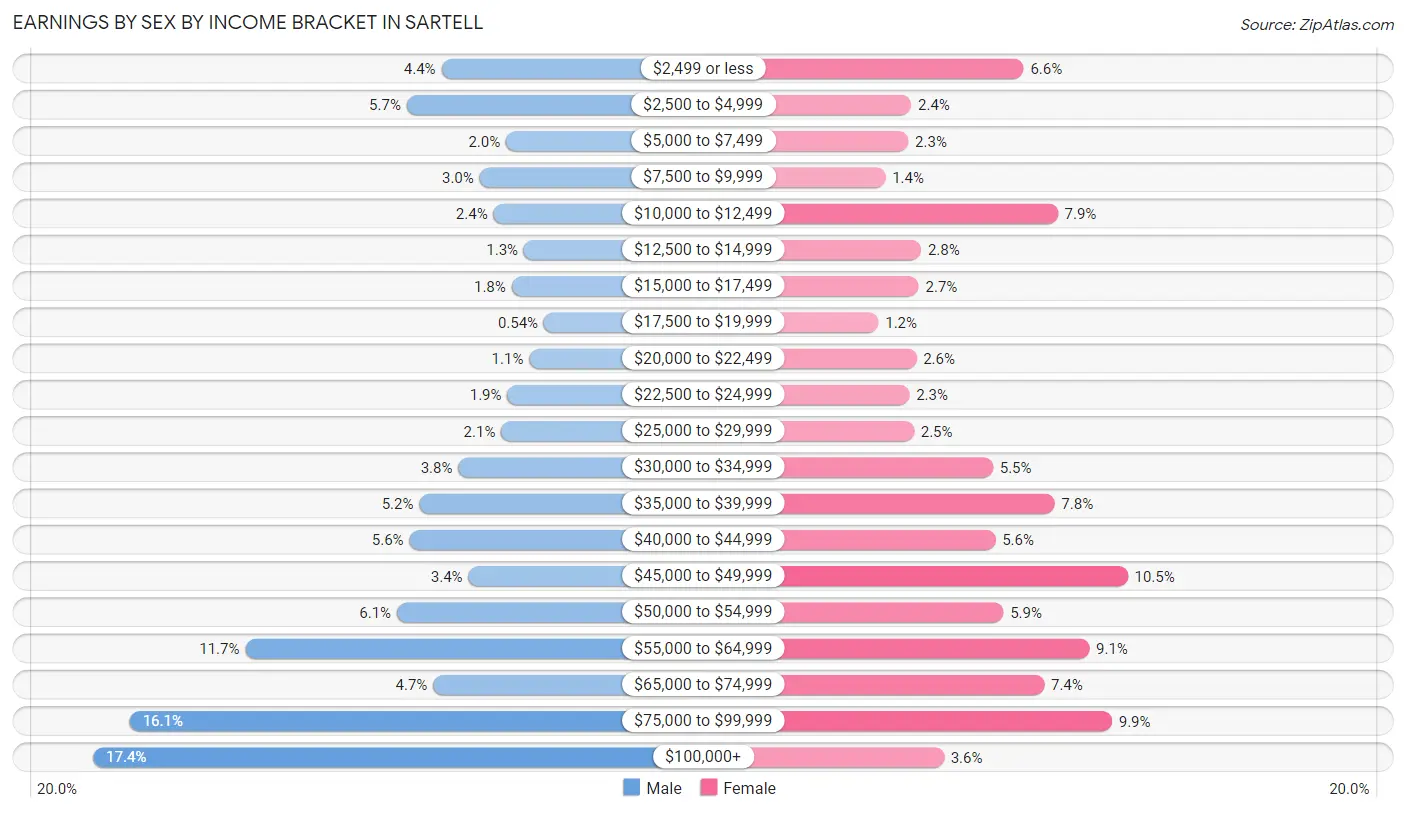
| Income | Male | Female |
| $2,499 or less | 252 (4.4%) | 359 (6.6%) |
| $2,500 to $4,999 | 327 (5.7%) | 131 (2.4%) |
| $5,000 to $7,499 | 113 (2.0%) | 125 (2.3%) |
| $7,500 to $9,999 | 170 (2.9%) | 78 (1.4%) |
| $10,000 to $12,499 | 140 (2.4%) | 429 (7.9%) |
| $12,500 to $14,999 | 74 (1.3%) | 151 (2.8%) |
| $15,000 to $17,499 | 101 (1.8%) | 146 (2.7%) |
| $17,500 to $19,999 | 31 (0.5%) | 64 (1.2%) |
| $20,000 to $22,499 | 63 (1.1%) | 141 (2.6%) |
| $22,500 to $24,999 | 110 (1.9%) | 127 (2.3%) |
| $25,000 to $29,999 | 123 (2.1%) | 136 (2.5%) |
| $30,000 to $34,999 | 216 (3.7%) | 297 (5.5%) |
| $35,000 to $39,999 | 300 (5.2%) | 422 (7.8%) |
| $40,000 to $44,999 | 321 (5.6%) | 302 (5.6%) |
| $45,000 to $49,999 | 194 (3.4%) | 571 (10.5%) |
| $50,000 to $54,999 | 348 (6.0%) | 318 (5.9%) |
| $55,000 to $64,999 | 675 (11.7%) | 493 (9.1%) |
| $65,000 to $74,999 | 270 (4.7%) | 401 (7.4%) |
| $75,000 to $99,999 | 924 (16.1%) | 539 (9.9%) |
| $100,000+ | 1,003 (17.4%) | 197 (3.6%) |
| Total | 5,755 (100.0%) | 5,427 (100.0%) |
Earnings by Sex by Educational Attainment in Sartell
Average earnings in Sartell are $63,564 for men and $48,041 for women, a difference of 24.4%. Men with an educational attainment of less than high school enjoy the highest average annual earnings of $250,001, while those with high school diploma education earn the least with $46,096. Women with an educational attainment of graduate degree earn the most with the average annual earnings of $64,105, while those with college or associate's degree education have the smallest earnings of $41,438.
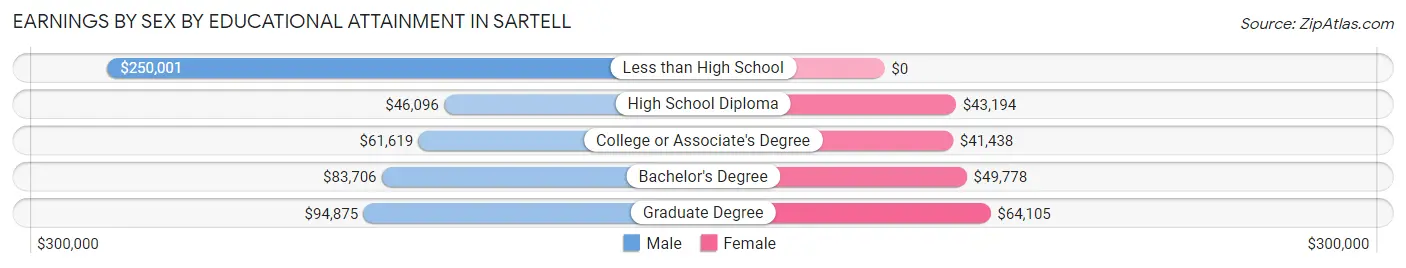
| Educational Attainment | Male Income | Female Income |
| Less than High School | $250,001 | $0 |
| High School Diploma | $46,096 | $43,194 |
| College or Associate's Degree | $61,619 | $41,438 |
| Bachelor's Degree | $83,706 | $49,778 |
| Graduate Degree | $94,875 | $64,105 |
| Total | $63,564 | $48,041 |
Family Income in Sartell
Family Income Brackets in Sartell
According to the Sartell family income data, there are 852 families falling into the $50,000 to $74,999 income range, which is the most common income bracket and makes up 19.3% of all families. Conversely, the less than $10,000 income bracket is the least frequent group with only 44 families (1.0%) belonging to this category.
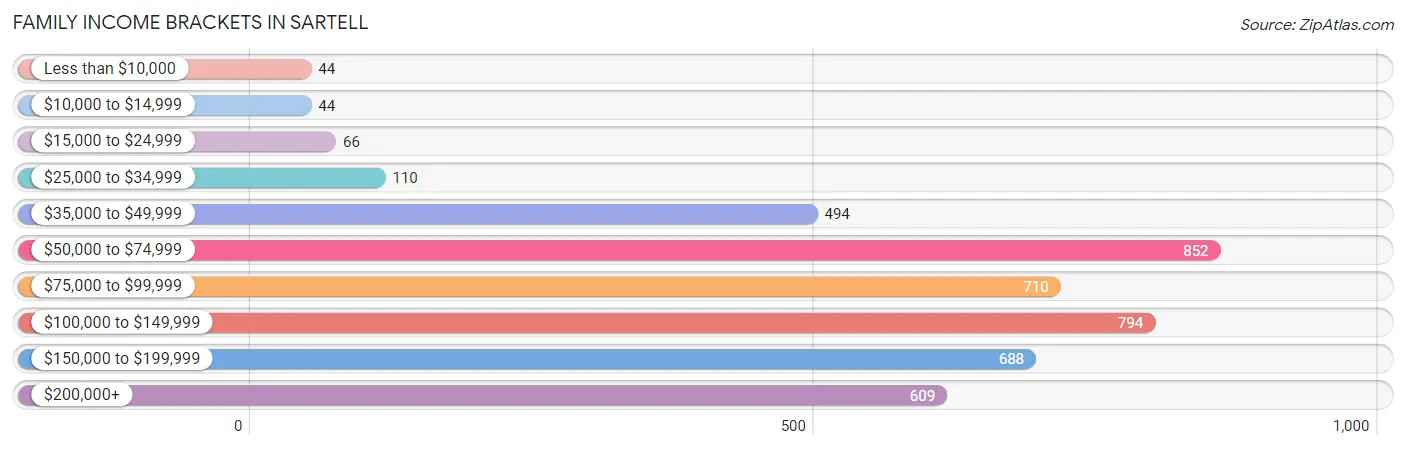
| Income Bracket | # Families | % Families |
| Less than $10,000 | 44 | 1.0% |
| $10,000 to $14,999 | 44 | 1.0% |
| $15,000 to $24,999 | 66 | 1.5% |
| $25,000 to $34,999 | 110 | 2.5% |
| $35,000 to $49,999 | 494 | 11.2% |
| $50,000 to $74,999 | 852 | 19.3% |
| $75,000 to $99,999 | 710 | 16.1% |
| $100,000 to $149,999 | 794 | 18.0% |
| $150,000 to $199,999 | 688 | 15.6% |
| $200,000+ | 609 | 13.8% |
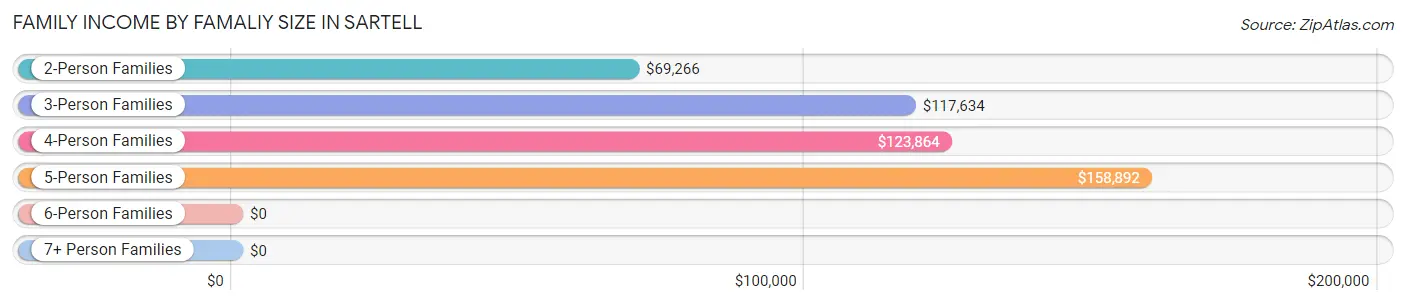
Family Income by Famaliy Size in Sartell
5-person families (599 | 13.6%) account for the highest median family income in Sartell with $158,892 per family, while 3-person families (1,079 | 24.5%) have the highest median income of $39,211 per family member.
| Income Bracket | # Families | Median Income |
| 2-Person Families | 1,672 (37.9%) | $69,266 |
| 3-Person Families | 1,079 (24.5%) | $117,634 |
| 4-Person Families | 958 (21.7%) | $123,864 |
| 5-Person Families | 599 (13.6%) | $158,892 |
| 6-Person Families | 89 (2.0%) | $0 |
| 7+ Person Families | 15 (0.3%) | $0 |
| Total | 4,412 (100.0%) | $95,824 |
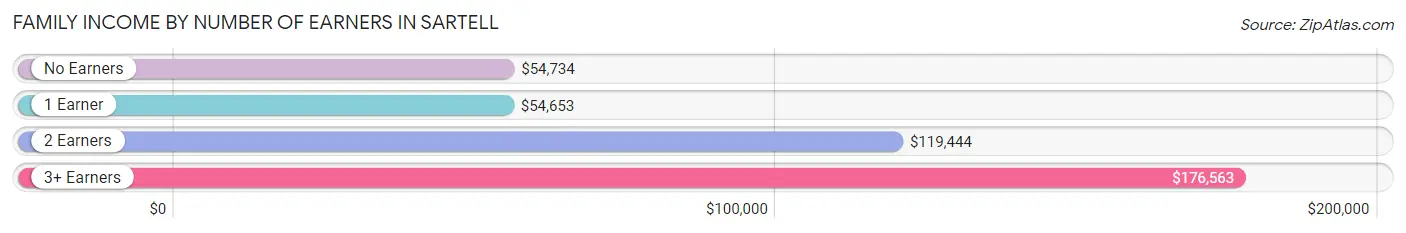
Family Income by Number of Earners in Sartell
The median family income in Sartell is $95,824, with families comprising 3+ earners (641) having the highest median family income of $176,563, while families with 1 earner (1,179) have the lowest median family income of $54,653, accounting for 14.5% and 26.7% of families, respectively.
| Number of Earners | # Families | Median Income |
| No Earners | 530 (12.0%) | $54,734 |
| 1 Earner | 1,179 (26.7%) | $54,653 |
| 2 Earners | 2,062 (46.7%) | $119,444 |
| 3+ Earners | 641 (14.5%) | $176,563 |
| Total | 4,412 (100.0%) | $95,824 |
Household Income in Sartell
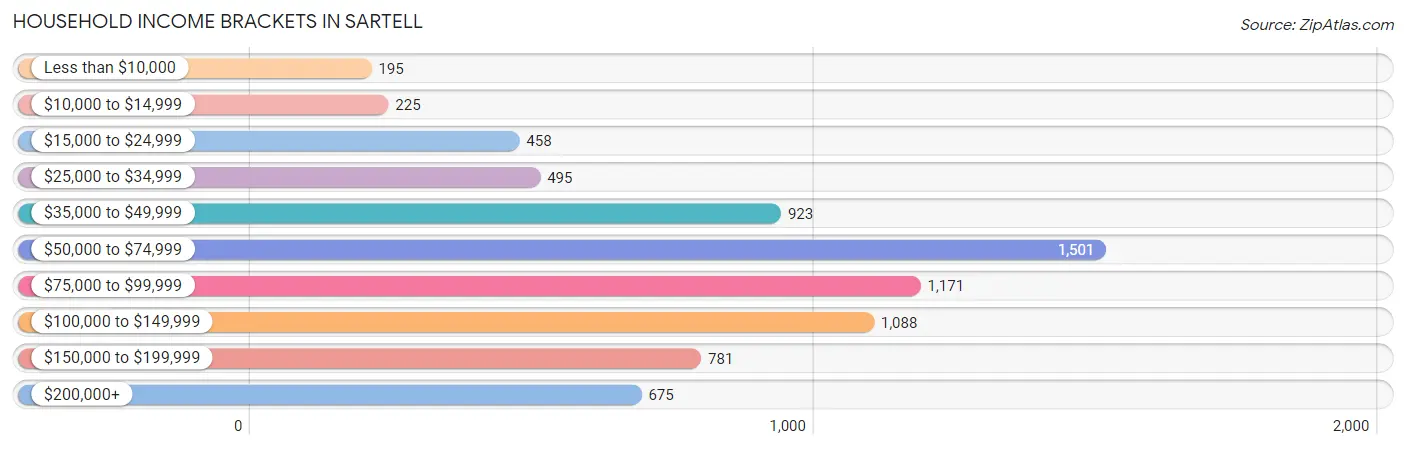
Household Income Brackets in Sartell
With 1,501 households falling in the category, the $50,000 to $74,999 income range is the most frequent in Sartell, accounting for 20.0% of all households. In contrast, only 195 households (2.6%) fall into the less than $10,000 income bracket, making it the least populous group.
| Income Bracket | # Households | % Households |
| Less than $10,000 | 195 | 2.6% |
| $10,000 to $14,999 | 225 | 3.0% |
| $15,000 to $24,999 | 458 | 6.1% |
| $25,000 to $34,999 | 495 | 6.6% |
| $35,000 to $49,999 | 923 | 12.3% |
| $50,000 to $74,999 | 1,501 | 20.0% |
| $75,000 to $99,999 | 1,171 | 15.6% |
| $100,000 to $149,999 | 1,088 | 14.5% |
| $150,000 to $199,999 | 781 | 10.4% |
| $200,000+ | 675 | 9.0% |
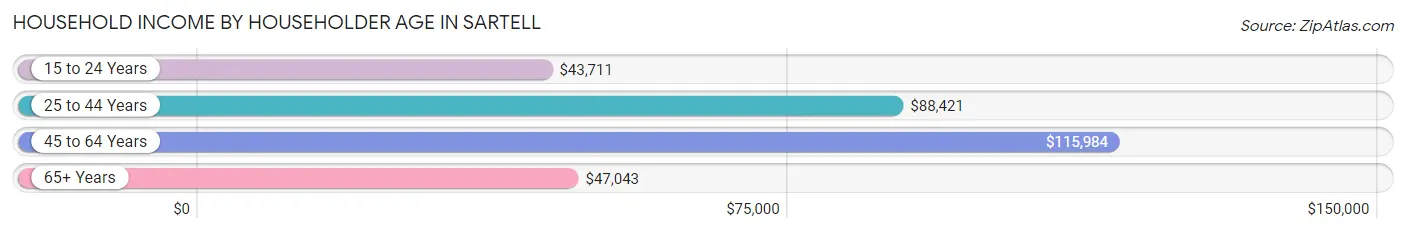
Household Income by Householder Age in Sartell
The median household income in Sartell is $74,177, with the highest median household income of $115,984 found in the 45 to 64 years age bracket for the primary householder. A total of 2,185 households (29.1%) fall into this category. Meanwhile, the 15 to 24 years age bracket for the primary householder has the lowest median household income of $43,711, with 782 households (10.4%) in this group.
| Income Bracket | # Households | Median Income |
| 15 to 24 Years | 782 (10.4%) | $43,711 |
| 25 to 44 Years | 2,962 (39.5%) | $88,421 |
| 45 to 64 Years | 2,185 (29.1%) | $115,984 |
| 65+ Years | 1,576 (21.0%) | $47,043 |
| Total | 7,505 (100.0%) | $74,177 |
Poverty in Sartell
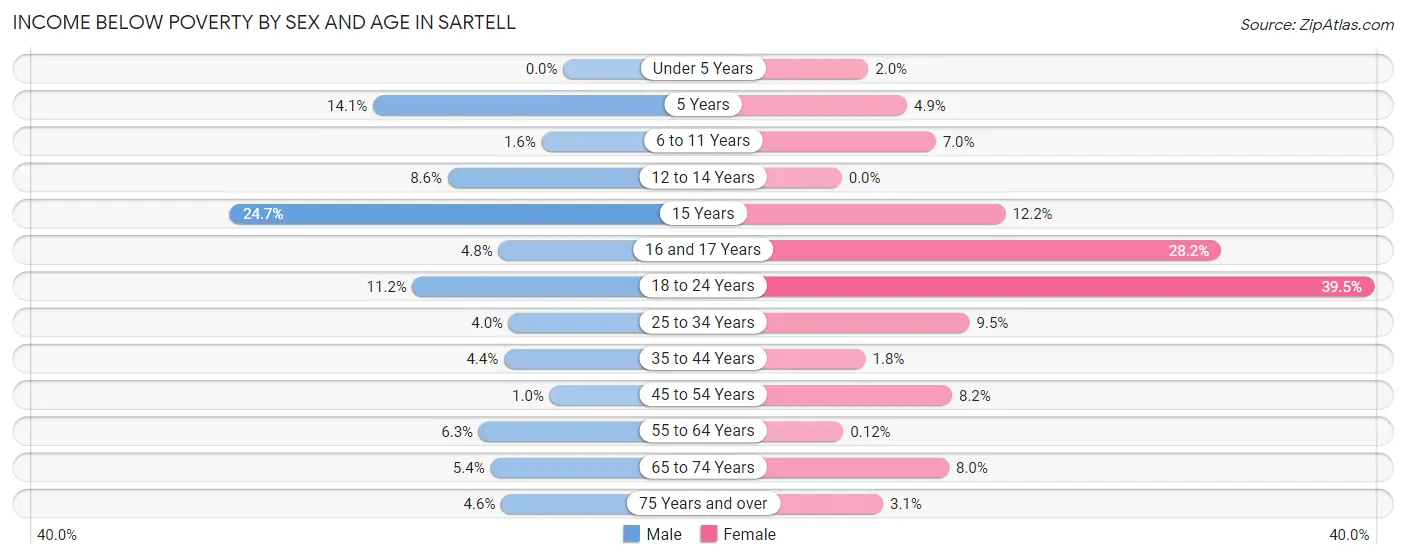
Income Below Poverty by Sex and Age in Sartell
With 5.5% poverty level for males and 10.0% for females among the residents of Sartell, 15 year old males and 18 to 24 year old females are the most vulnerable to poverty, with 71 males (24.7%) and 453 females (39.5%) in their respective age groups living below the poverty level.
| Age Bracket | Male | Female |
| Under 5 Years | 0 (0.0%) | 12 (2.0%) |
| 5 Years | 25 (14.1%) | 5 (4.9%) |
| 6 to 11 Years | 12 (1.6%) | 63 (7.0%) |
| 12 to 14 Years | 43 (8.6%) | 0 (0.0%) |
| 15 Years | 71 (24.7%) | 35 (12.1%) |
| 16 and 17 Years | 26 (4.8%) | 87 (28.2%) |
| 18 to 24 Years | 122 (11.2%) | 453 (39.5%) |
| 25 to 34 Years | 43 (4.0%) | 114 (9.5%) |
| 35 to 44 Years | 67 (4.4%) | 26 (1.8%) |
| 45 to 54 Years | 11 (1.0%) | 86 (8.2%) |
| 55 to 64 Years | 48 (6.3%) | 1 (0.1%) |
| 65 to 74 Years | 29 (5.4%) | 66 (8.0%) |
| 75 Years and over | 17 (4.6%) | 18 (3.1%) |
| Total | 514 (5.5%) | 966 (10.0%) |
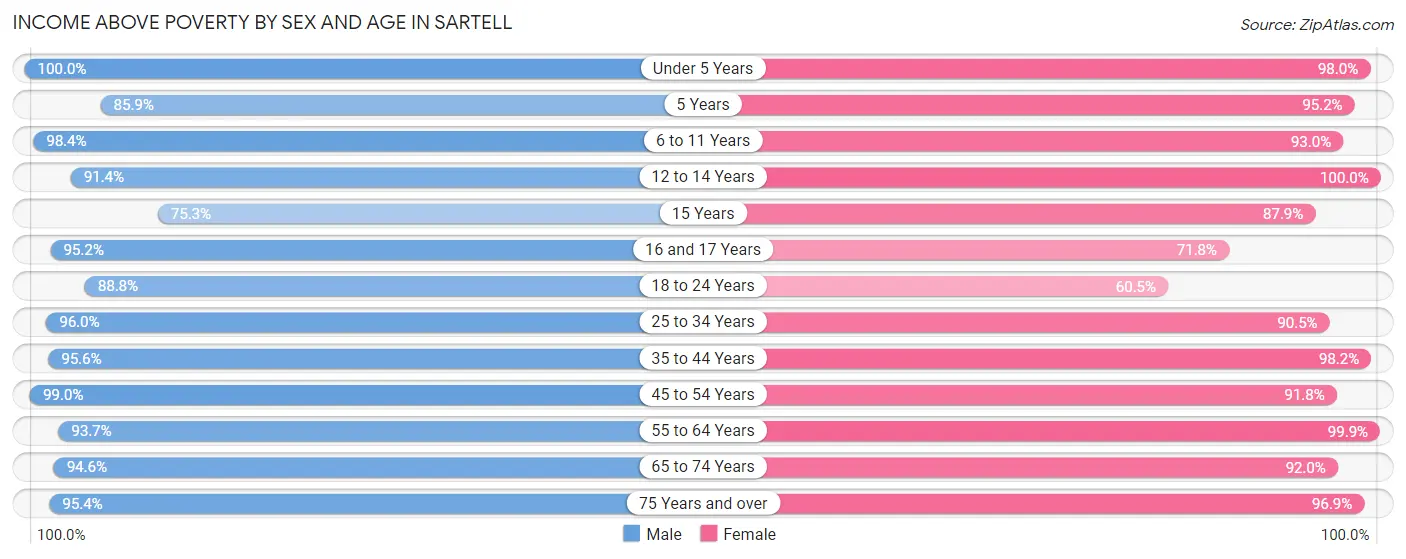
Income Above Poverty by Sex and Age in Sartell
According to the poverty statistics in Sartell, males aged under 5 years and females aged 12 to 14 years are the age groups that are most secure financially, with 100.0% of males and 100.0% of females in these age groups living above the poverty line.
| Age Bracket | Male | Female |
| Under 5 Years | 681 (100.0%) | 597 (98.0%) |
| 5 Years | 152 (85.9%) | 98 (95.2%) |
| 6 to 11 Years | 731 (98.4%) | 840 (93.0%) |
| 12 to 14 Years | 458 (91.4%) | 345 (100.0%) |
| 15 Years | 216 (75.3%) | 253 (87.8%) |
| 16 and 17 Years | 514 (95.2%) | 222 (71.8%) |
| 18 to 24 Years | 968 (88.8%) | 694 (60.5%) |
| 25 to 34 Years | 1,022 (96.0%) | 1,087 (90.5%) |
| 35 to 44 Years | 1,457 (95.6%) | 1,439 (98.2%) |
| 45 to 54 Years | 1,078 (99.0%) | 965 (91.8%) |
| 55 to 64 Years | 717 (93.7%) | 815 (99.9%) |
| 65 to 74 Years | 507 (94.6%) | 763 (92.0%) |
| 75 Years and over | 352 (95.4%) | 571 (96.9%) |
| Total | 8,853 (94.5%) | 8,689 (90.0%) |
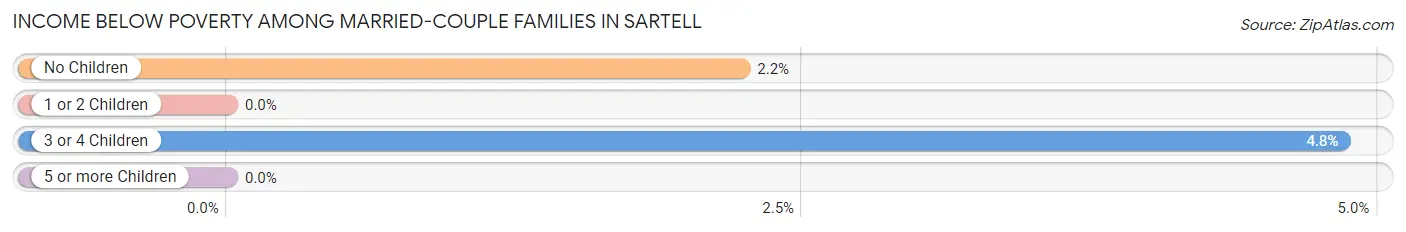
Income Below Poverty Among Married-Couple Families in Sartell
The poverty statistics for married-couple families in Sartell show that 1.8% or 62 of the total 3,514 families live below the poverty line. Families with 3 or 4 children have the highest poverty rate of 4.8%, comprising of 26 families. On the other hand, families with 1 or 2 children have the lowest poverty rate of 0.0%, which includes 0 families.
| Children | Above Poverty | Below Poverty |
| No Children | 1,580 (97.8%) | 36 (2.2%) |
| 1 or 2 Children | 1,346 (100.0%) | 0 (0.0%) |
| 3 or 4 Children | 511 (95.2%) | 26 (4.8%) |
| 5 or more Children | 15 (100.0%) | 0 (0.0%) |
| Total | 3,452 (98.2%) | 62 (1.8%) |
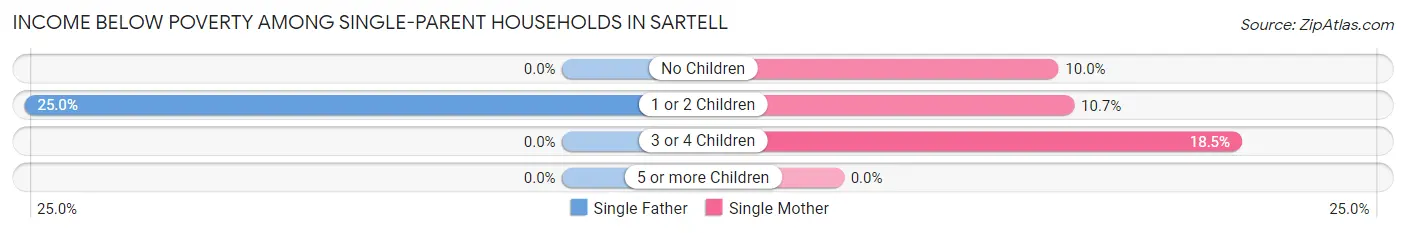
Income Below Poverty Among Single-Parent Households in Sartell
According to the poverty data in Sartell, 7.9% or 21 single-father households and 12.5% or 79 single-mother households are living below the poverty line. Among single-father households, those with 1 or 2 children have the highest poverty rate, with 21 households (25.0%) experiencing poverty. Likewise, among single-mother households, those with 3 or 4 children have the highest poverty rate, with 28 households (18.5%) falling below the poverty line.
| Children | Single Father | Single Mother |
| No Children | 0 (0.0%) | 10 (10.0%) |
| 1 or 2 Children | 21 (25.0%) | 41 (10.7%) |
| 3 or 4 Children | 0 (0.0%) | 28 (18.5%) |
| 5 or more Children | 0 (0.0%) | 0 (0.0%) |
| Total | 21 (7.9%) | 79 (12.5%) |
Income Below Poverty Among Married-Couple vs Single-Parent Households in Sartell
The poverty data for Sartell shows that 62 of the married-couple family households (1.8%) and 100 of the single-parent households (11.1%) are living below the poverty level. Within the married-couple family households, those with 3 or 4 children have the highest poverty rate, with 26 households (4.8%) falling below the poverty line. Among the single-parent households, those with 1 or 2 children have the highest poverty rate, with 62 household (13.3%) living below poverty.
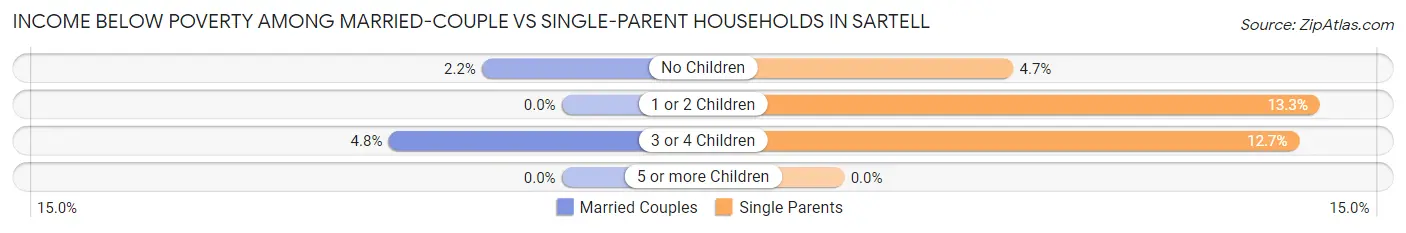
| Children | Married-Couple Families | Single-Parent Households |
| No Children | 36 (2.2%) | 10 (4.7%) |
| 1 or 2 Children | 0 (0.0%) | 62 (13.3%) |
| 3 or 4 Children | 26 (4.8%) | 28 (12.7%) |
| 5 or more Children | 0 (0.0%) | 0 (0.0%) |
| Total | 62 (1.8%) | 100 (11.1%) |
Race in Sartell
The most populous races in Sartell are White / Caucasian (17,589 | 90.7%), Two or more Races (983 | 5.1%), and Hispanic or Latino (429 | 2.2%).
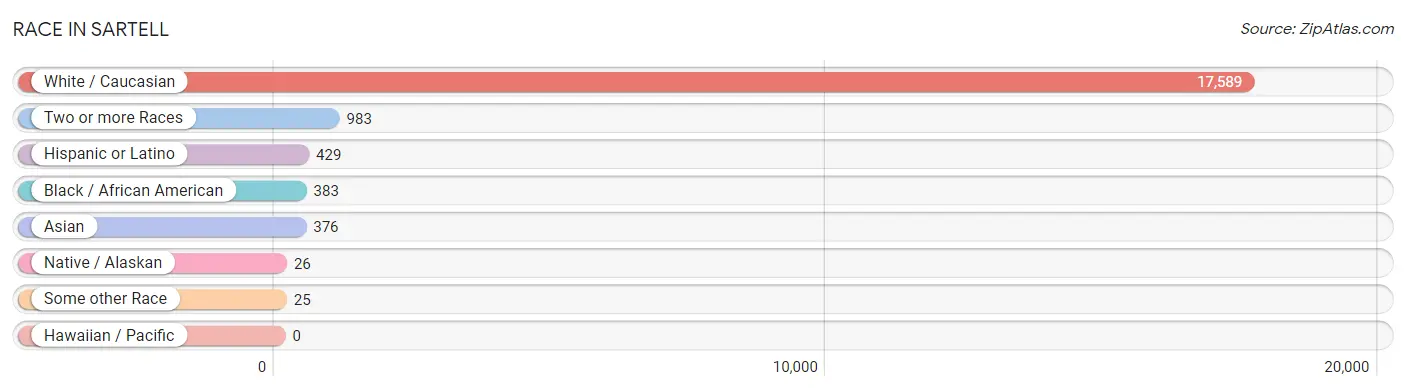
| Race | # Population | % Population |
| Asian | 376 | 1.9% |
| Black / African American | 383 | 2.0% |
| Hawaiian / Pacific | 0 | 0.0% |
| Hispanic or Latino | 429 | 2.2% |
| Native / Alaskan | 26 | 0.1% |
| White / Caucasian | 17,589 | 90.7% |
| Two or more Races | 983 | 5.1% |
| Some other Race | 25 | 0.1% |
| Total | 19,382 | 100.0% |
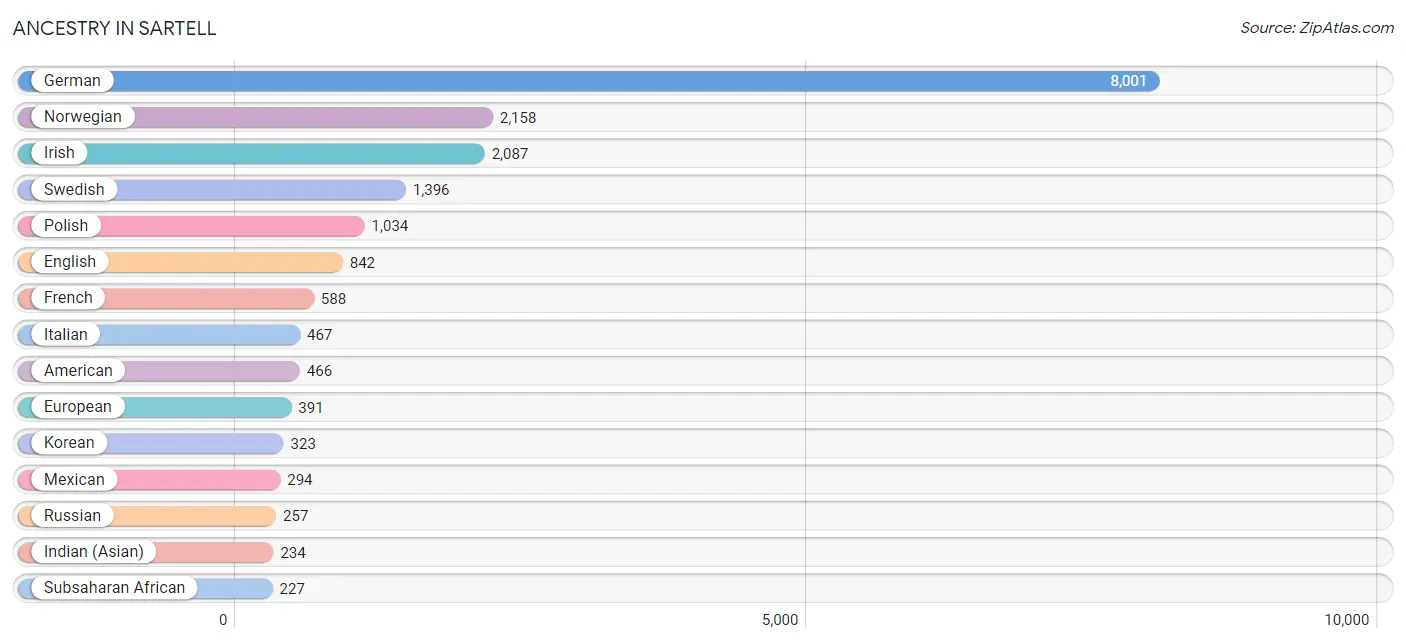
Ancestry in Sartell
The most populous ancestries reported in Sartell are German (8,001 | 41.3%), Norwegian (2,158 | 11.1%), Irish (2,087 | 10.8%), Swedish (1,396 | 7.2%), and Polish (1,034 | 5.3%), together accounting for 75.7% of all Sartell residents.
| Ancestry | # Population | % Population |
| African | 18 | 0.1% |
| American | 466 | 2.4% |
| Arab | 208 | 1.1% |
| Austrian | 9 | 0.1% |
| Bangladeshi | 84 | 0.4% |
| Belgian | 27 | 0.1% |
| Bhutanese | 98 | 0.5% |
| Burmese | 84 | 0.4% |
| Central American | 18 | 0.1% |
| Cherokee | 4 | 0.0% |
| Chilean | 12 | 0.1% |
| Chippewa | 76 | 0.4% |
| Cree | 32 | 0.2% |
| Cuban | 11 | 0.1% |
| Czech | 180 | 0.9% |
| Danish | 184 | 0.9% |
| Dutch | 170 | 0.9% |
| Eastern European | 14 | 0.1% |
| Egyptian | 80 | 0.4% |
| English | 842 | 4.3% |
| European | 391 | 2.0% |
| Filipino | 38 | 0.2% |
| Finnish | 80 | 0.4% |
| French | 588 | 3.0% |
| French Canadian | 190 | 1.0% |
| German | 8,001 | 41.3% |
| Greek | 10 | 0.1% |
| Guatemalan | 5 | 0.0% |
| Hungarian | 17 | 0.1% |
| Icelander | 53 | 0.3% |
| Indian (Asian) | 234 | 1.2% |
| Iranian | 50 | 0.3% |
| Iraqi | 101 | 0.5% |
| Irish | 2,087 | 10.8% |
| Italian | 467 | 2.4% |
| Korean | 323 | 1.7% |
| Latvian | 11 | 0.1% |
| Lithuanian | 43 | 0.2% |
| Luxembourger | 30 | 0.2% |
| Maltese | 15 | 0.1% |
| Mexican | 294 | 1.5% |
| Nicaraguan | 13 | 0.1% |
| Northern European | 36 | 0.2% |
| Norwegian | 2,158 | 11.1% |
| Pennsylvania German | 11 | 0.1% |
| Polish | 1,034 | 5.3% |
| Puerto Rican | 19 | 0.1% |
| Russian | 257 | 1.3% |
| Scandinavian | 161 | 0.8% |
| Scotch-Irish | 48 | 0.3% |
| Scottish | 172 | 0.9% |
| Sioux | 90 | 0.5% |
| Slavic | 25 | 0.1% |
| Slovak | 51 | 0.3% |
| Slovene | 59 | 0.3% |
| Somali | 209 | 1.1% |
| South American | 12 | 0.1% |
| Spaniard | 75 | 0.4% |
| Sri Lankan | 40 | 0.2% |
| Subsaharan African | 227 | 1.2% |
| Swedish | 1,396 | 7.2% |
| Thai | 40 | 0.2% |
| Ukrainian | 4 | 0.0% |
| Welsh | 114 | 0.6% | View All 64 Rows |
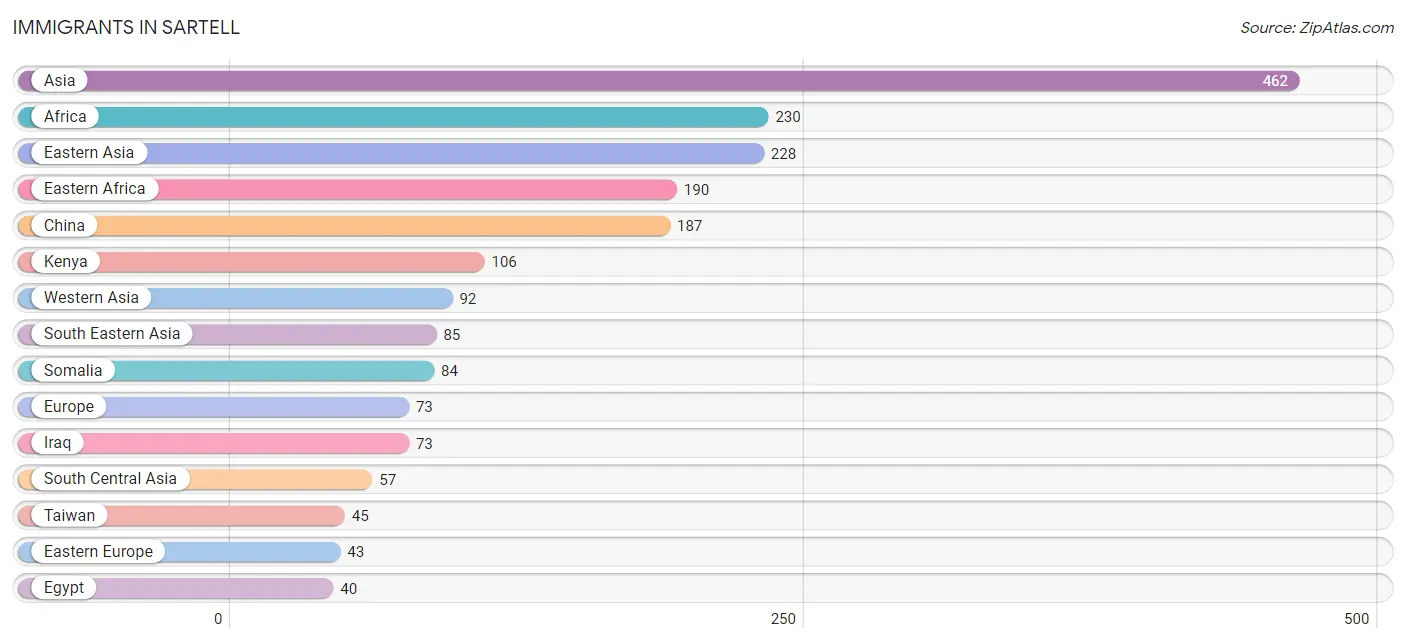
Immigrants in Sartell
The most numerous immigrant groups reported in Sartell came from Asia (462 | 2.4%), Africa (230 | 1.2%), Eastern Asia (228 | 1.2%), Eastern Africa (190 | 1.0%), and China (187 | 1.0%), together accounting for 6.7% of all Sartell residents.
| Immigration Origin | # Population | % Population |
| Africa | 230 | 1.2% |
| Asia | 462 | 2.4% |
| Canada | 4 | 0.0% |
| Central America | 29 | 0.2% |
| China | 187 | 1.0% |
| Eastern Africa | 190 | 1.0% |
| Eastern Asia | 228 | 1.2% |
| Eastern Europe | 43 | 0.2% |
| Egypt | 40 | 0.2% |
| Europe | 73 | 0.4% |
| Germany | 15 | 0.1% |
| India | 40 | 0.2% |
| Iran | 17 | 0.1% |
| Iraq | 73 | 0.4% |
| Japan | 24 | 0.1% |
| Kenya | 106 | 0.5% |
| Korea | 17 | 0.1% |
| Latin America | 29 | 0.2% |
| Lithuania | 21 | 0.1% |
| Malaysia | 9 | 0.1% |
| Mexico | 29 | 0.2% |
| Northern Africa | 40 | 0.2% |
| Philippines | 36 | 0.2% |
| Russia | 22 | 0.1% |
| Somalia | 84 | 0.4% |
| South Central Asia | 57 | 0.3% |
| South Eastern Asia | 85 | 0.4% |
| Southern Europe | 15 | 0.1% |
| Taiwan | 45 | 0.2% |
| Vietnam | 40 | 0.2% |
| Western Asia | 92 | 0.5% |
| Western Europe | 15 | 0.1% |
| Yemen | 19 | 0.1% | View All 33 Rows |
Sex and Age in Sartell
Sex and Age in Sartell
The most populous age groups in Sartell are 15 to 19 Years (1,140 | 12.0%) for men and 15 to 19 Years (883 | 9.0%) for women.
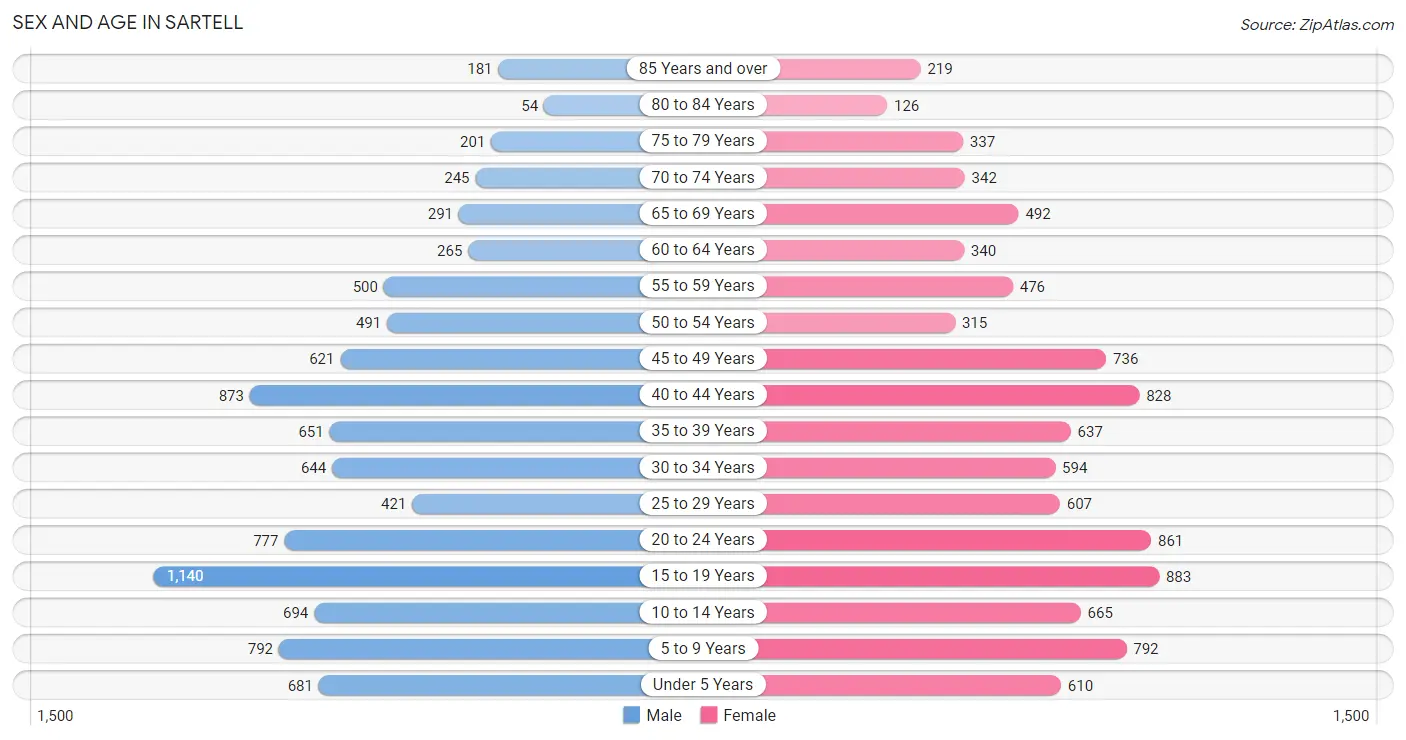
| Age Bracket | Male | Female |
| Under 5 Years | 681 (7.1%) | 610 (6.2%) |
| 5 to 9 Years | 792 (8.3%) | 792 (8.0%) |
| 10 to 14 Years | 694 (7.3%) | 665 (6.7%) |
| 15 to 19 Years | 1,140 (12.0%) | 883 (9.0%) |
| 20 to 24 Years | 777 (8.2%) | 861 (8.7%) |
| 25 to 29 Years | 421 (4.4%) | 607 (6.2%) |
| 30 to 34 Years | 644 (6.8%) | 594 (6.0%) |
| 35 to 39 Years | 651 (6.8%) | 637 (6.5%) |
| 40 to 44 Years | 873 (9.2%) | 828 (8.4%) |
| 45 to 49 Years | 621 (6.5%) | 736 (7.5%) |
| 50 to 54 Years | 491 (5.2%) | 315 (3.2%) |
| 55 to 59 Years | 500 (5.2%) | 476 (4.8%) |
| 60 to 64 Years | 265 (2.8%) | 340 (3.5%) |
| 65 to 69 Years | 291 (3.1%) | 492 (5.0%) |
| 70 to 74 Years | 245 (2.6%) | 342 (3.5%) |
| 75 to 79 Years | 201 (2.1%) | 337 (3.4%) |
| 80 to 84 Years | 54 (0.6%) | 126 (1.3%) |
| 85 Years and over | 181 (1.9%) | 219 (2.2%) |
| Total | 9,522 (100.0%) | 9,860 (100.0%) |
Families and Households in Sartell
Median Family Size in Sartell
The median family size in Sartell is 3.30 persons per family, with married-couple families (3,514 | 79.6%) accounting for the largest median family size of 3.35 persons per family. On the other hand, single male/father families (265 | 6.0%) represent the smallest median family size with 2.77 persons per family.
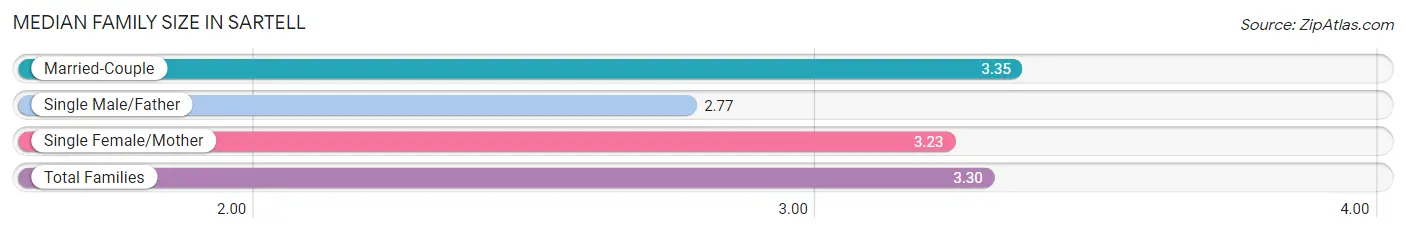
| Family Type | # Families | Family Size |
| Married-Couple | 3,514 (79.6%) | 3.35 |
| Single Male/Father | 265 (6.0%) | 2.77 |
| Single Female/Mother | 633 (14.3%) | 3.23 |
| Total Families | 4,412 (100.0%) | 3.30 |
Median Household Size in Sartell
The median household size in Sartell is 2.55 persons per household, with single female/mother households (633 | 8.4%) accounting for the largest median household size of 3.61 persons per household. non-family households (3,093 | 41.2%) represent the smallest median household size with 1.37 persons per household.
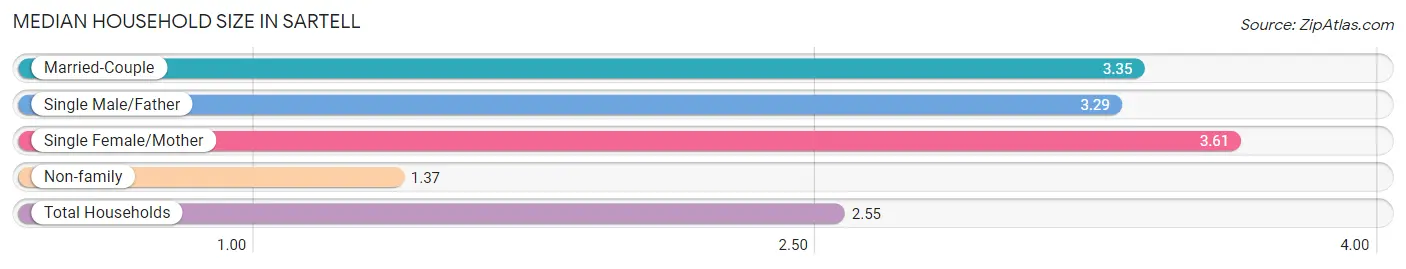
| Household Type | # Households | Household Size |
| Married-Couple | 3,514 (46.8%) | 3.35 |
| Single Male/Father | 265 (3.5%) | 3.29 |
| Single Female/Mother | 633 (8.4%) | 3.61 |
| Non-family | 3,093 (41.2%) | 1.37 |
| Total Households | 7,505 (100.0%) | 2.55 |
Household Size by Marriage Status in Sartell
Out of a total of 7,505 households in Sartell, 4,412 (58.8%) are family households, while 3,093 (41.2%) are nonfamily households. The most numerous type of family households are 2-person households, comprising 1,573, and the most common type of nonfamily households are 1-person households, comprising 2,261.
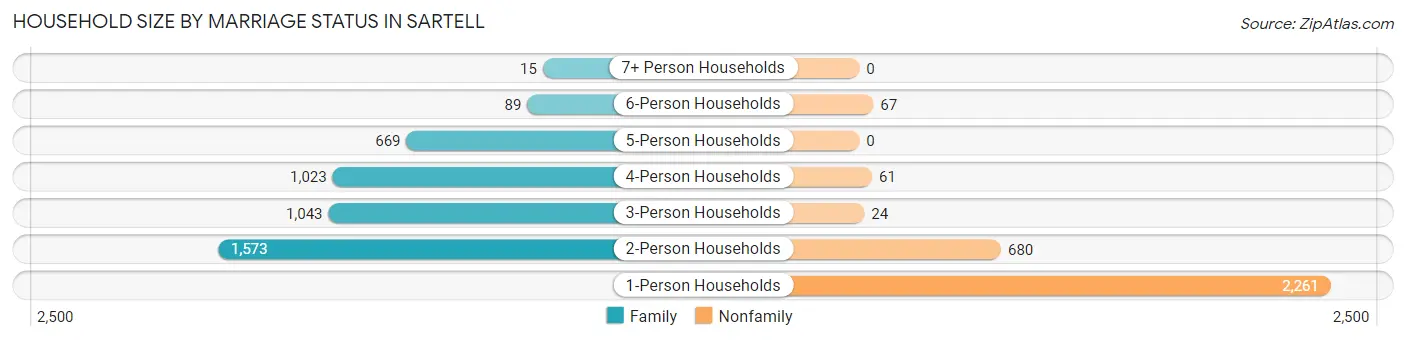
| Household Size | Family Households | Nonfamily Households |
| 1-Person Households | - | 2,261 (30.1%) |
| 2-Person Households | 1,573 (21.0%) | 680 (9.1%) |
| 3-Person Households | 1,043 (13.9%) | 24 (0.3%) |
| 4-Person Households | 1,023 (13.6%) | 61 (0.8%) |
| 5-Person Households | 669 (8.9%) | 0 (0.0%) |
| 6-Person Households | 89 (1.2%) | 67 (0.9%) |
| 7+ Person Households | 15 (0.2%) | 0 (0.0%) |
| Total | 4,412 (58.8%) | 3,093 (41.2%) |
Female Fertility in Sartell
Fertility by Age in Sartell
Average fertility rate in Sartell is 19.0 births per 1,000 women. Women in the age bracket of 35 to 50 years have the highest fertility rate with 28.0 births per 1,000 women. Women in the age bracket of 35 to 50 years acount for 63.6% of all women with births.
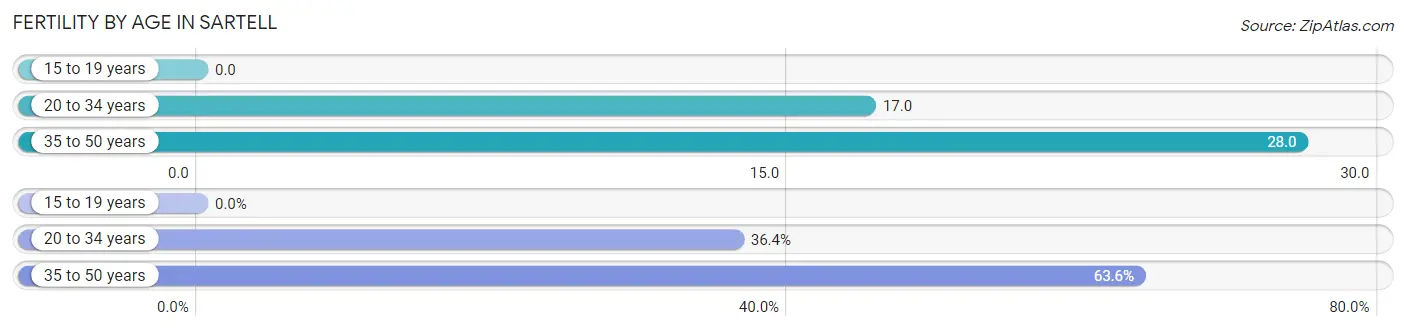
| Age Bracket | Women with Births | Births / 1,000 Women |
| 15 to 19 years | 0 (0.0%) | 0.0 |
| 20 to 34 years | 36 (36.4%) | 17.0 |
| 35 to 50 years | 63 (63.6%) | 28.0 |
| Total | 99 (100.0%) | 19.0 |
Fertility by Age by Marriage Status in Sartell
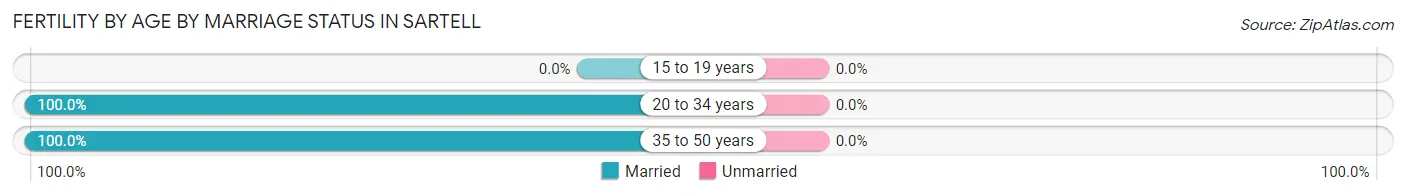
| Age Bracket | Married | Unmarried |
| 15 to 19 years | 0 (0.0%) | 0 (0.0%) |
| 20 to 34 years | 36 (100.0%) | 0 (0.0%) |
| 35 to 50 years | 63 (100.0%) | 0 (0.0%) |
| Total | 99 (100.0%) | 0 (0.0%) |
Fertility by Education in Sartell
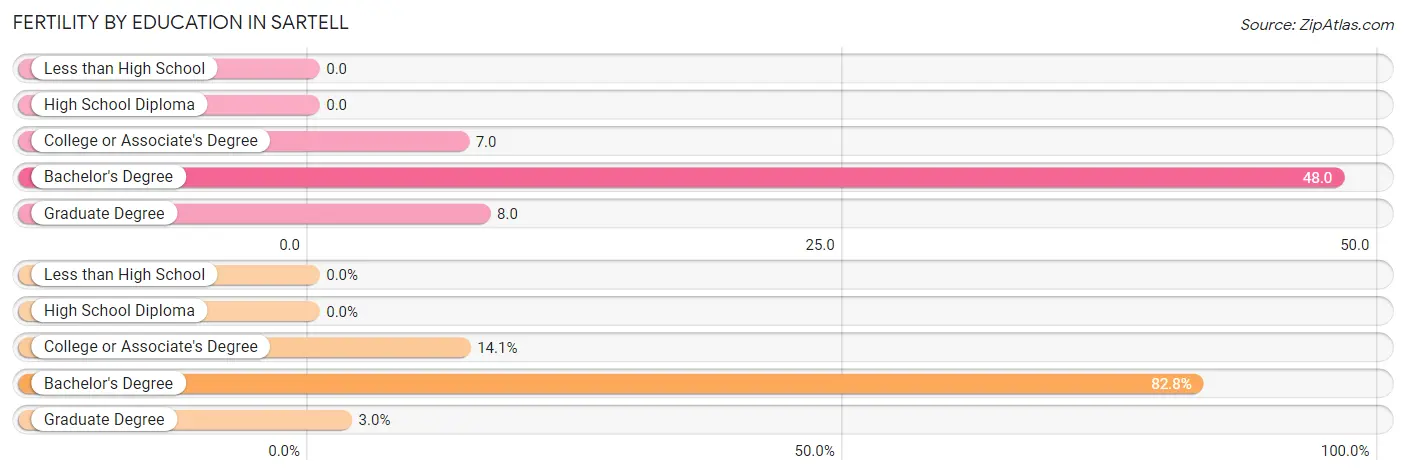
| Educational Attainment | Women with Births | Births / 1,000 Women |
| Less than High School | 0 (0.0%) | 0.0 |
| High School Diploma | 0 (0.0%) | 0.0 |
| College or Associate's Degree | 14 (14.1%) | 7.0 |
| Bachelor's Degree | 82 (82.8%) | 48.0 |
| Graduate Degree | 3 (3.0%) | 8.0 |
| Total | 99 (100.0%) | 19.0 |
Fertility by Education by Marriage Status in Sartell
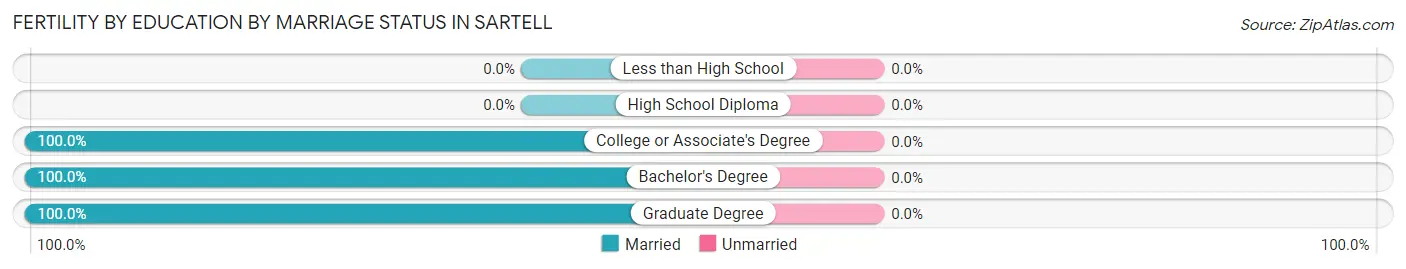
| Educational Attainment | Married | Unmarried |
| Less than High School | 0 (0.0%) | 0 (0.0%) |
| High School Diploma | 0 (0.0%) | 0 (0.0%) |
| College or Associate's Degree | 14 (100.0%) | 0 (0.0%) |
| Bachelor's Degree | 82 (100.0%) | 0 (0.0%) |
| Graduate Degree | 3 (100.0%) | 0 (0.0%) |
| Total | 99 (100.0%) | 0 (0.0%) |
Employment Characteristics in Sartell
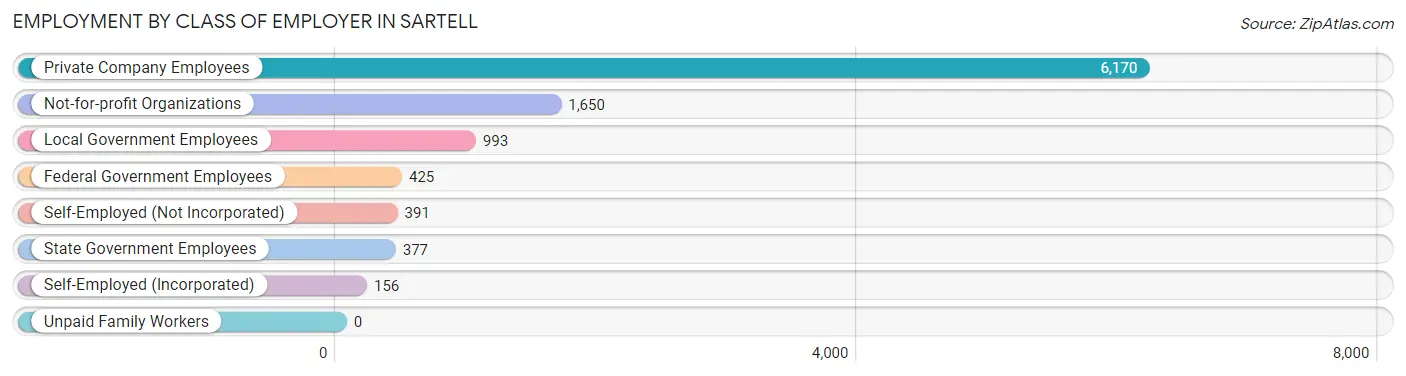
Employment by Class of Employer in Sartell
Among the 10,162 employed individuals in Sartell, private company employees (6,170 | 60.7%), not-for-profit organizations (1,650 | 16.2%), and local government employees (993 | 9.8%) make up the most common classes of employment.
| Employer Class | # Employees | % Employees |
| Private Company Employees | 6,170 | 60.7% |
| Self-Employed (Incorporated) | 156 | 1.5% |
| Self-Employed (Not Incorporated) | 391 | 3.8% |
| Not-for-profit Organizations | 1,650 | 16.2% |
| Local Government Employees | 993 | 9.8% |
| State Government Employees | 377 | 3.7% |
| Federal Government Employees | 425 | 4.2% |
| Unpaid Family Workers | 0 | 0.0% |
| Total | 10,162 | 100.0% |
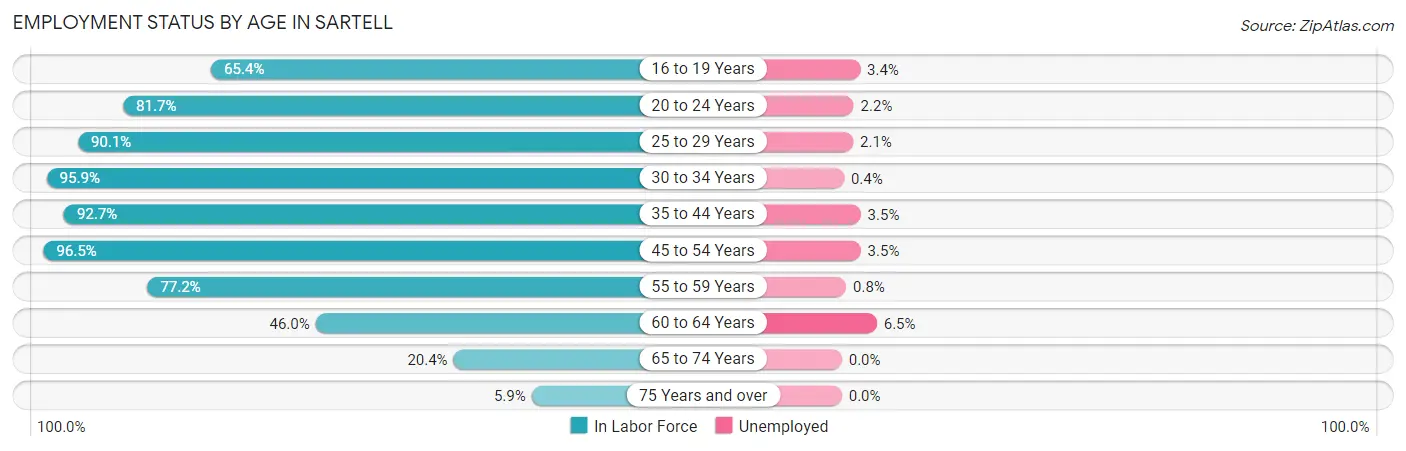
Employment Status by Age in Sartell
According to the labor force statistics for Sartell, out of the total population over 16 years of age (14,573), 73.0% or 10,638 individuals are in the labor force, with 2.6% or 277 of them unemployed. The age group with the highest labor force participation rate is 45 to 54 years, with 96.5% or 2,087 individuals in the labor force. Within the labor force, the 60 to 64 years age range has the highest percentage of unemployed individuals, with 6.5% or 18 of them being unemployed.
| Age Bracket | In Labor Force | Unemployed |
| 16 to 19 Years | 947 (65.4%) | 32 (3.4%) |
| 20 to 24 Years | 1,338 (81.7%) | 29 (2.2%) |
| 25 to 29 Years | 926 (90.1%) | 19 (2.1%) |
| 30 to 34 Years | 1,187 (95.9%) | 5 (0.4%) |
| 35 to 44 Years | 2,771 (92.7%) | 97 (3.5%) |
| 45 to 54 Years | 2,087 (96.5%) | 73 (3.5%) |
| 55 to 59 Years | 753 (77.2%) | 6 (0.8%) |
| 60 to 64 Years | 278 (46.0%) | 18 (6.5%) |
| 65 to 74 Years | 279 (20.4%) | 0 (0.0%) |
| 75 Years and over | 66 (5.9%) | 0 (0.0%) |
| Total | 10,638 (73.0%) | 277 (2.6%) |
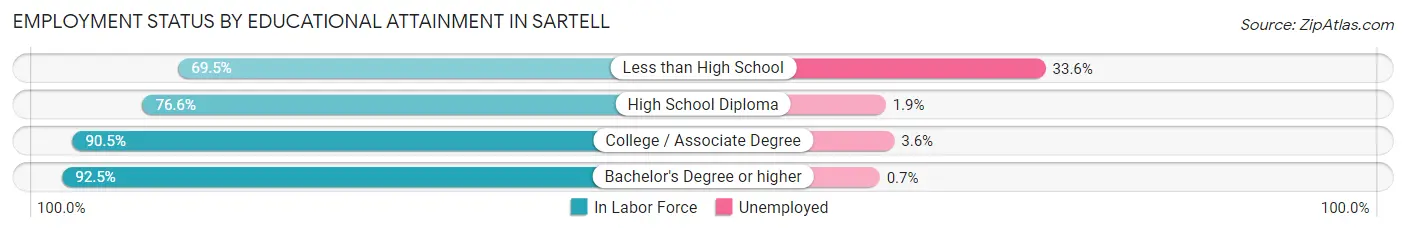
Employment Status by Educational Attainment in Sartell
According to labor force statistics for Sartell, 88.9% of individuals (8,000) out of the total population between 25 and 64 years of age (8,999) are in the labor force, with 2.7% or 216 of them being unemployed. The group with the highest labor force participation rate are those with the educational attainment of bachelor's degree or higher, with 92.5% or 3,396 individuals in the labor force. Within the labor force, individuals with less than high school education have the highest percentage of unemployment, with 33.6% or 49 of them being unemployed.
| Educational Attainment | In Labor Force | Unemployed |
| Less than High School | 146 (69.5%) | 71 (33.6%) |
| High School Diploma | 935 (76.6%) | 23 (1.9%) |
| College / Associate Degree | 3,528 (90.5%) | 140 (3.6%) |
| Bachelor's Degree or higher | 3,396 (92.5%) | 26 (0.7%) |
| Total | 8,000 (88.9%) | 243 (2.7%) |
Employment Occupations by Sex in Sartell
Management, Business, Science and Arts Occupations
The most common Management, Business, Science and Arts occupations in Sartell are Community & Social Service (1,338 | 13.0%), Health Diagnosing & Treating (1,205 | 11.7%), Management (881 | 8.6%), Health Technologists (738 | 7.2%), and Business & Financial (691 | 6.7%).
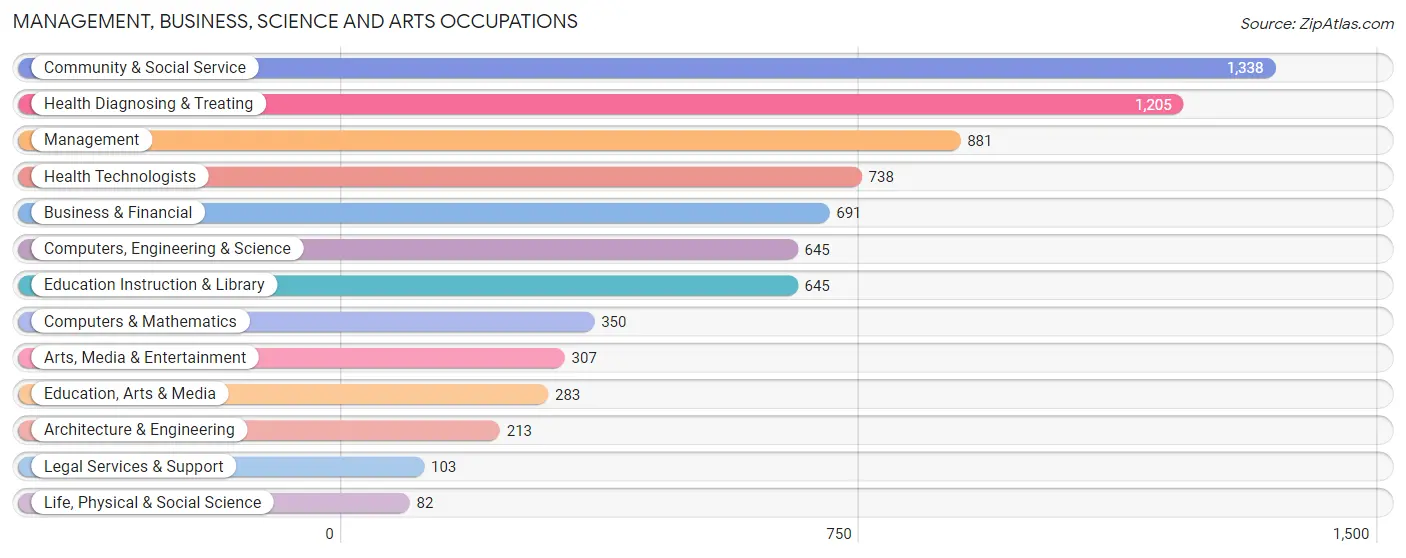
Management, Business, Science and Arts Occupations by Sex
Within the Management, Business, Science and Arts occupations in Sartell, the most male-oriented occupations are Architecture & Engineering (77.9%), Life, Physical & Social Science (68.3%), and Computers, Engineering & Science (65.0%), while the most female-oriented occupations are Education, Arts & Media (90.5%), Health Diagnosing & Treating (76.6%), and Health Technologists (71.0%).
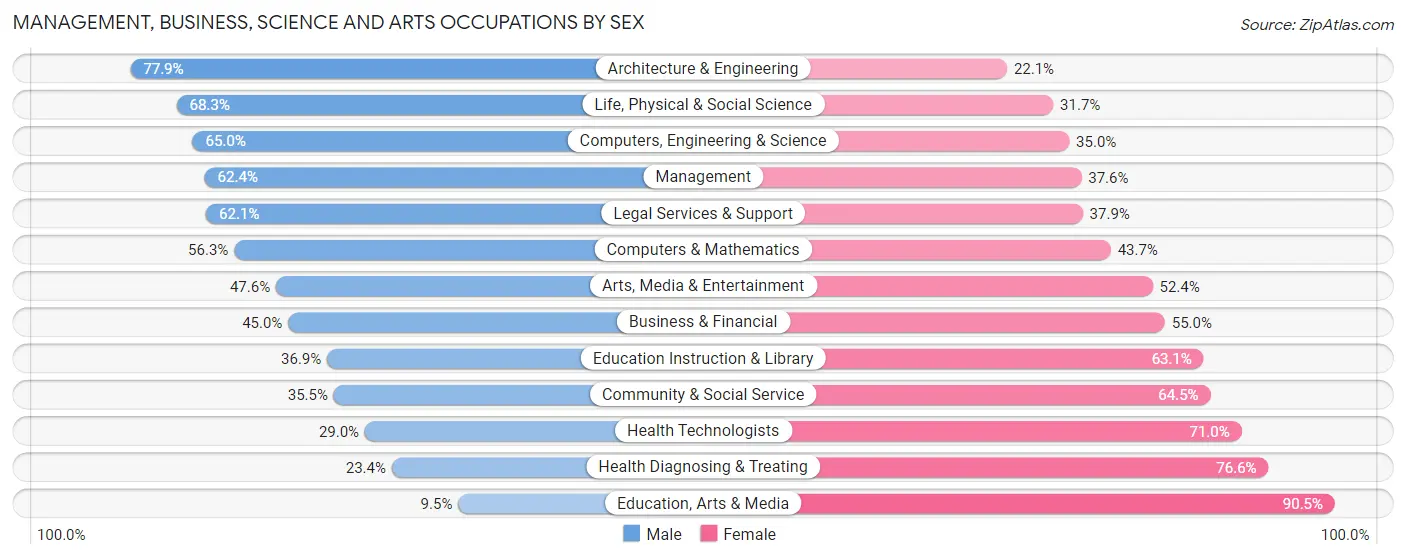
| Occupation | Male | Female |
| Management | 550 (62.4%) | 331 (37.6%) |
| Business & Financial | 311 (45.0%) | 380 (55.0%) |
| Computers, Engineering & Science | 419 (65.0%) | 226 (35.0%) |
| Computers & Mathematics | 197 (56.3%) | 153 (43.7%) |
| Architecture & Engineering | 166 (77.9%) | 47 (22.1%) |
| Life, Physical & Social Science | 56 (68.3%) | 26 (31.7%) |
| Community & Social Service | 475 (35.5%) | 863 (64.5%) |
| Education, Arts & Media | 27 (9.5%) | 256 (90.5%) |
| Legal Services & Support | 64 (62.1%) | 39 (37.9%) |
| Education Instruction & Library | 238 (36.9%) | 407 (63.1%) |
| Arts, Media & Entertainment | 146 (47.6%) | 161 (52.4%) |
| Health Diagnosing & Treating | 282 (23.4%) | 923 (76.6%) |
| Health Technologists | 214 (29.0%) | 524 (71.0%) |
| Total (Category) | 2,037 (42.8%) | 2,723 (57.2%) |
| Total (Overall) | 5,172 (50.2%) | 5,127 (49.8%) |
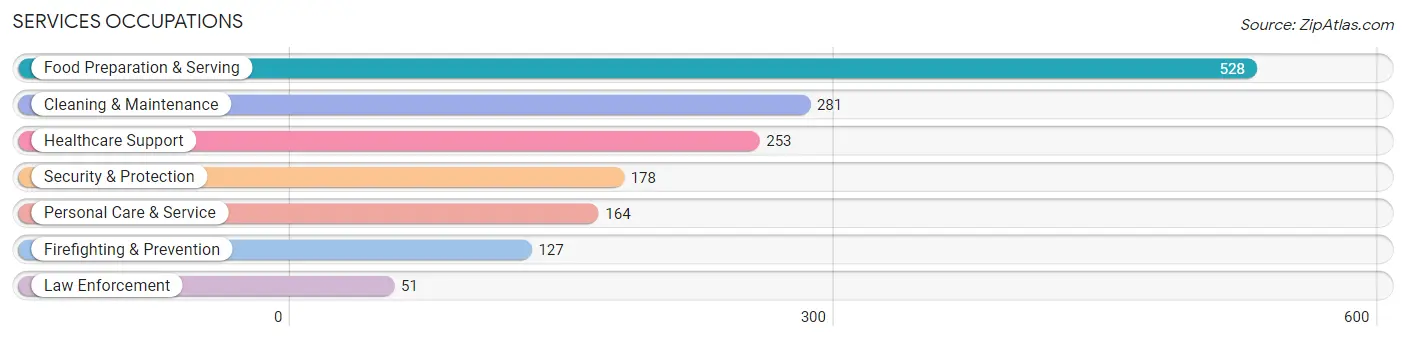
Services Occupations
The most common Services occupations in Sartell are Food Preparation & Serving (528 | 5.1%), Cleaning & Maintenance (281 | 2.7%), Healthcare Support (253 | 2.5%), Security & Protection (178 | 1.7%), and Personal Care & Service (164 | 1.6%).
Services Occupations by Sex
Within the Services occupations in Sartell, the most male-oriented occupations are Firefighting & Prevention (90.5%), Security & Protection (83.2%), and Cleaning & Maintenance (71.9%), while the most female-oriented occupations are Personal Care & Service (92.7%), Healthcare Support (85.4%), and Food Preparation & Serving (60.6%).
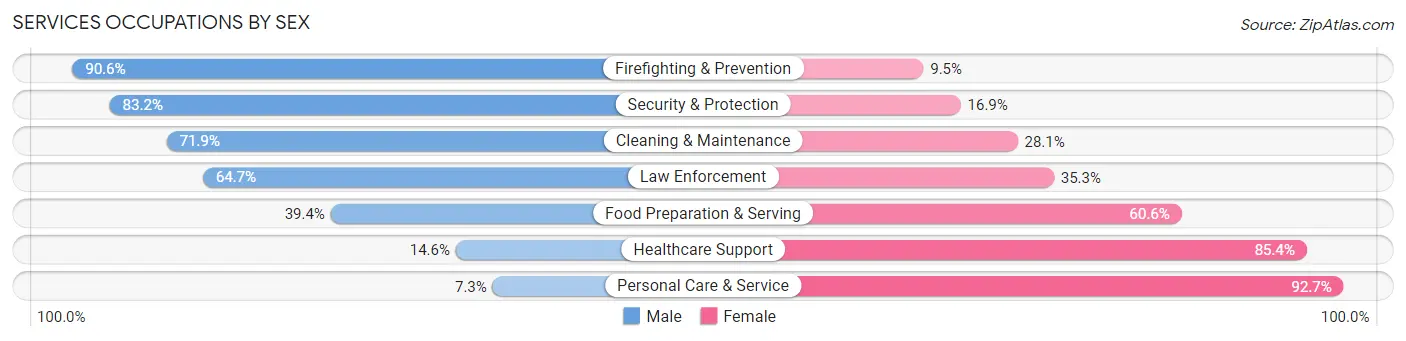
| Occupation | Male | Female |
| Healthcare Support | 37 (14.6%) | 216 (85.4%) |
| Security & Protection | 148 (83.2%) | 30 (16.9%) |
| Firefighting & Prevention | 115 (90.5%) | 12 (9.5%) |
| Law Enforcement | 33 (64.7%) | 18 (35.3%) |
| Food Preparation & Serving | 208 (39.4%) | 320 (60.6%) |
| Cleaning & Maintenance | 202 (71.9%) | 79 (28.1%) |
| Personal Care & Service | 12 (7.3%) | 152 (92.7%) |
| Total (Category) | 607 (43.2%) | 797 (56.8%) |
| Total (Overall) | 5,172 (50.2%) | 5,127 (49.8%) |
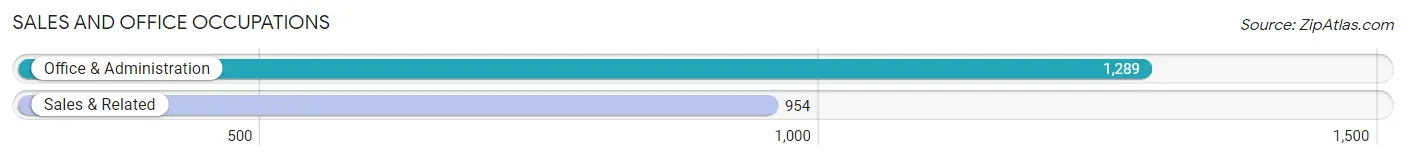
Sales and Office Occupations
The most common Sales and Office occupations in Sartell are Office & Administration (1,289 | 12.5%), and Sales & Related (954 | 9.3%).
Sales and Office Occupations by Sex
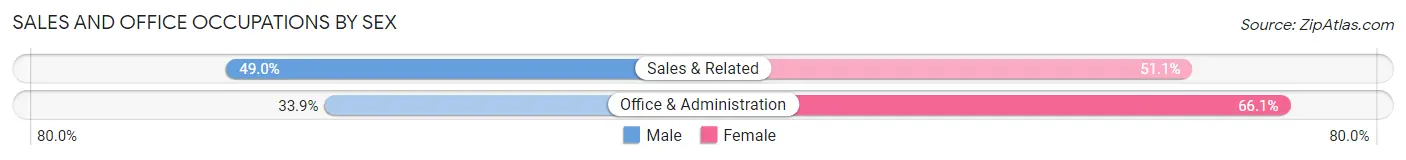
| Occupation | Male | Female |
| Sales & Related | 467 (48.9%) | 487 (51.0%) |
| Office & Administration | 437 (33.9%) | 852 (66.1%) |
| Total (Category) | 904 (40.3%) | 1,339 (59.7%) |
| Total (Overall) | 5,172 (50.2%) | 5,127 (49.8%) |
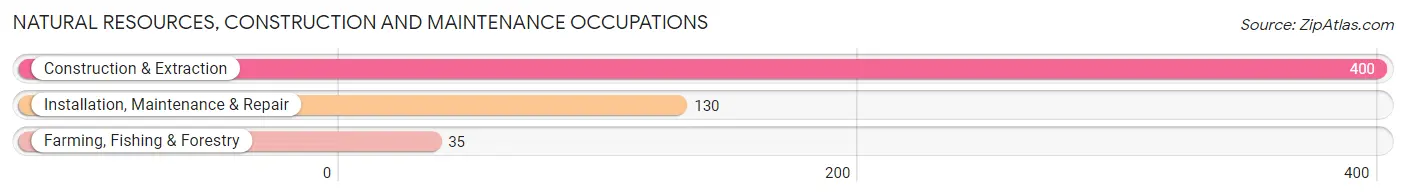
Natural Resources, Construction and Maintenance Occupations
The most common Natural Resources, Construction and Maintenance occupations in Sartell are Construction & Extraction (400 | 3.9%), Installation, Maintenance & Repair (130 | 1.3%), and Farming, Fishing & Forestry (35 | 0.3%).
Natural Resources, Construction and Maintenance Occupations by Sex
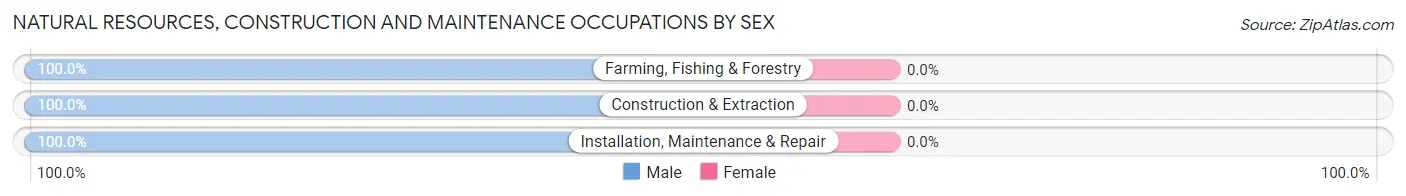
| Occupation | Male | Female |
| Farming, Fishing & Forestry | 35 (100.0%) | 0 (0.0%) |
| Construction & Extraction | 400 (100.0%) | 0 (0.0%) |
| Installation, Maintenance & Repair | 130 (100.0%) | 0 (0.0%) |
| Total (Category) | 565 (100.0%) | 0 (0.0%) |
| Total (Overall) | 5,172 (50.2%) | 5,127 (49.8%) |
Production, Transportation and Moving Occupations
The most common Production, Transportation and Moving occupations in Sartell are Material Moving (521 | 5.1%), Production (408 | 4.0%), and Transportation (398 | 3.9%).
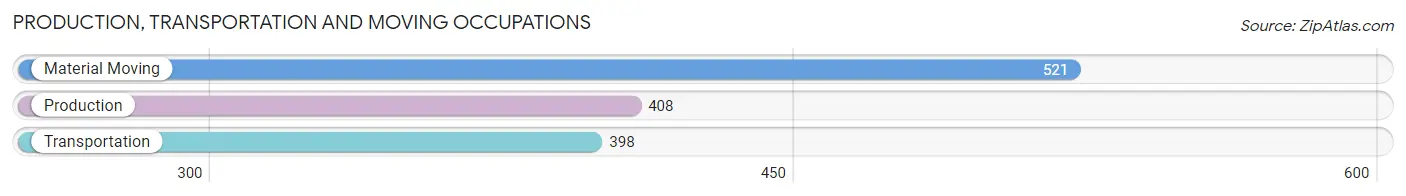
Production, Transportation and Moving Occupations by Sex
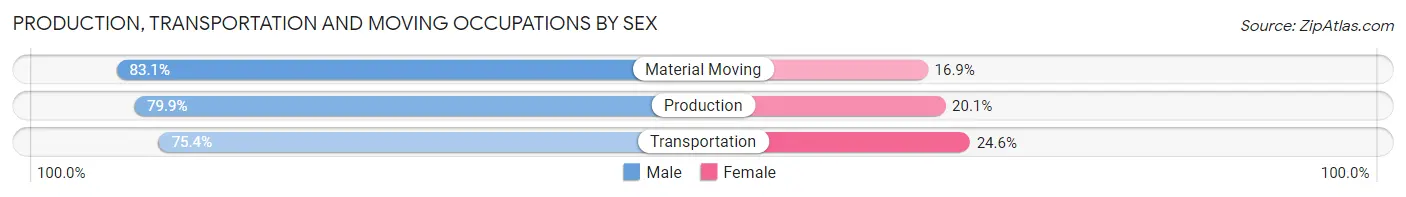
| Occupation | Male | Female |
| Production | 326 (79.9%) | 82 (20.1%) |
| Transportation | 300 (75.4%) | 98 (24.6%) |
| Material Moving | 433 (83.1%) | 88 (16.9%) |
| Total (Category) | 1,059 (79.8%) | 268 (20.2%) |
| Total (Overall) | 5,172 (50.2%) | 5,127 (49.8%) |
Employment Industries by Sex in Sartell
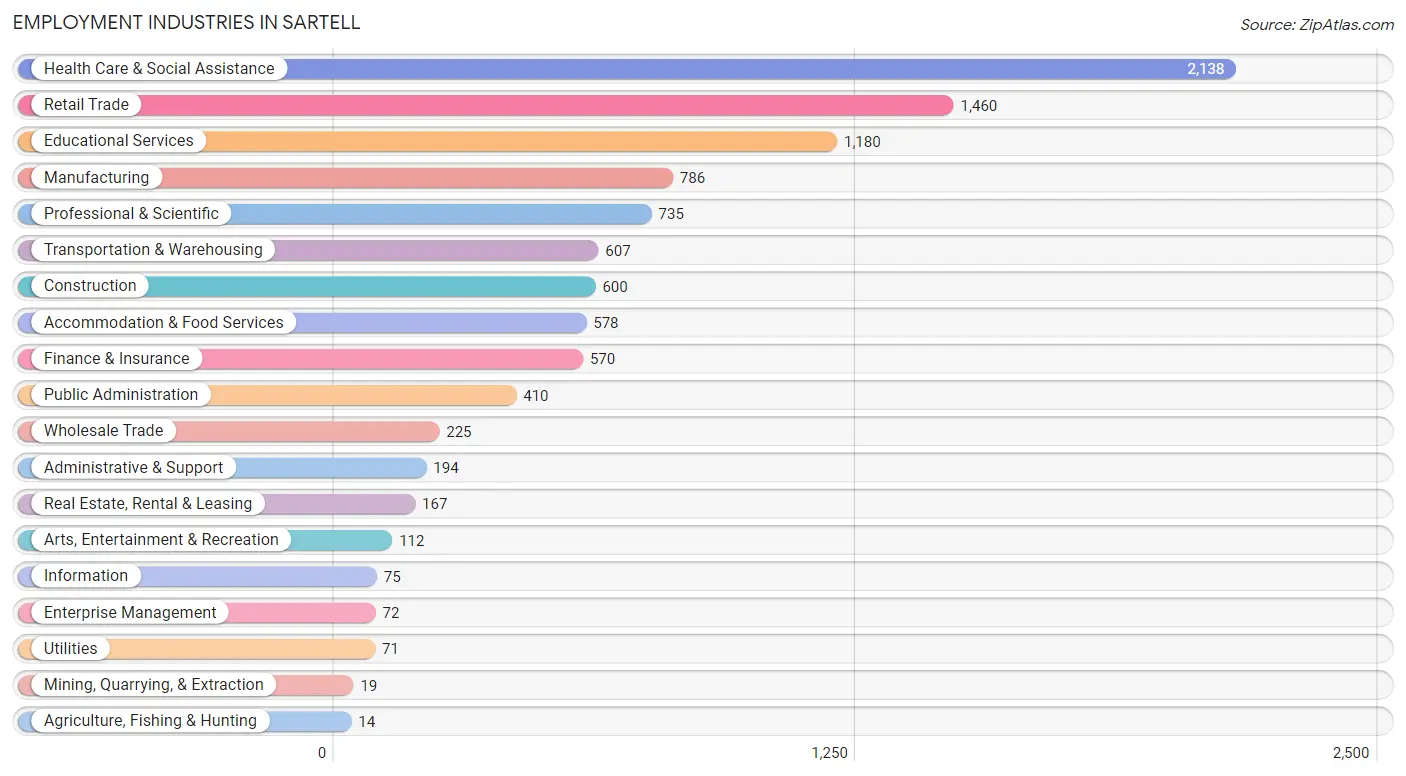
Employment Industries in Sartell
The major employment industries in Sartell include Health Care & Social Assistance (2,138 | 20.8%), Retail Trade (1,460 | 14.2%), Educational Services (1,180 | 11.5%), Manufacturing (786 | 7.6%), and Professional & Scientific (735 | 7.1%).
Employment Industries by Sex in Sartell
The Sartell industries that see more men than women are Agriculture, Fishing & Hunting (100.0%), Mining, Quarrying, & Extraction (100.0%), and Information (100.0%), whereas the industries that tend to have a higher number of women are Health Care & Social Assistance (75.3%), Arts, Entertainment & Recreation (66.1%), and Educational Services (64.8%).
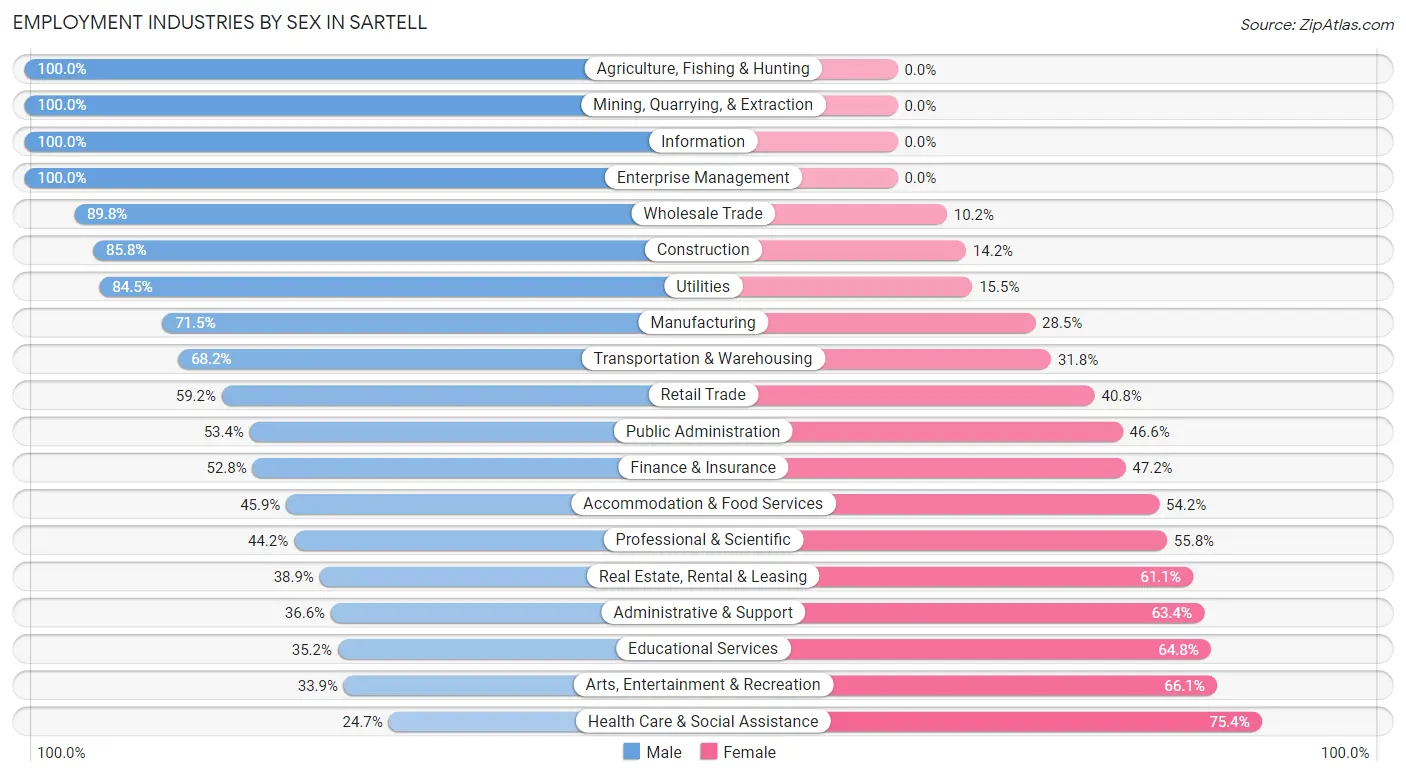
| Industry | Male | Female |
| Agriculture, Fishing & Hunting | 14 (100.0%) | 0 (0.0%) |
| Mining, Quarrying, & Extraction | 19 (100.0%) | 0 (0.0%) |
| Construction | 515 (85.8%) | 85 (14.2%) |
| Manufacturing | 562 (71.5%) | 224 (28.5%) |
| Wholesale Trade | 202 (89.8%) | 23 (10.2%) |
| Retail Trade | 864 (59.2%) | 596 (40.8%) |
| Transportation & Warehousing | 414 (68.2%) | 193 (31.8%) |
| Utilities | 60 (84.5%) | 11 (15.5%) |
| Information | 75 (100.0%) | 0 (0.0%) |
| Finance & Insurance | 301 (52.8%) | 269 (47.2%) |
| Real Estate, Rental & Leasing | 65 (38.9%) | 102 (61.1%) |
| Professional & Scientific | 325 (44.2%) | 410 (55.8%) |
| Enterprise Management | 72 (100.0%) | 0 (0.0%) |
| Administrative & Support | 71 (36.6%) | 123 (63.4%) |
| Educational Services | 415 (35.2%) | 765 (64.8%) |
| Health Care & Social Assistance | 527 (24.6%) | 1,611 (75.3%) |
| Arts, Entertainment & Recreation | 38 (33.9%) | 74 (66.1%) |
| Accommodation & Food Services | 265 (45.9%) | 313 (54.1%) |
| Public Administration | 219 (53.4%) | 191 (46.6%) |
| Total | 5,172 (50.2%) | 5,127 (49.8%) |
Education in Sartell
School Enrollment in Sartell
The most common levels of schooling among the 6,023 students in Sartell are high school (1,753 | 29.1%), elementary school (1,265 | 21.0%), and middle school (1,124 | 18.7%).
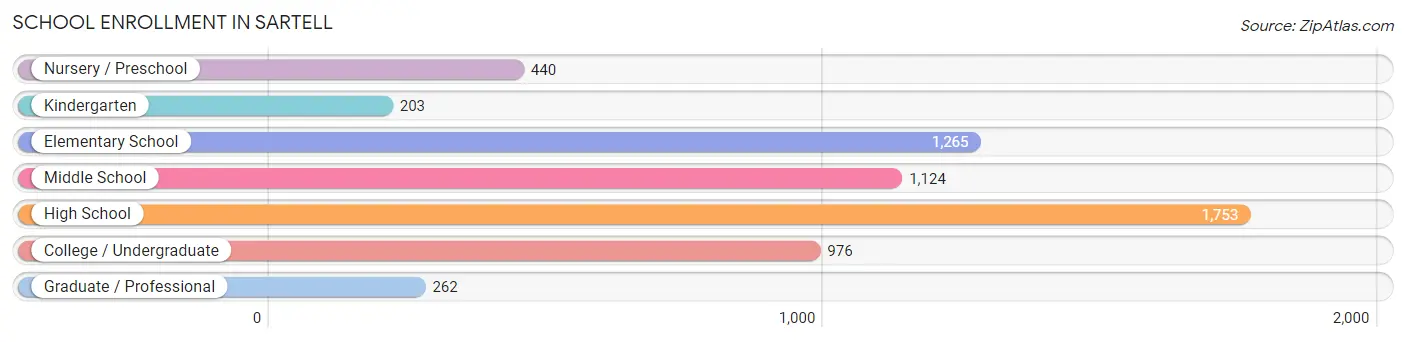
| School Level | # Students | % Students |
| Nursery / Preschool | 440 | 7.3% |
| Kindergarten | 203 | 3.4% |
| Elementary School | 1,265 | 21.0% |
| Middle School | 1,124 | 18.7% |
| High School | 1,753 | 29.1% |
| College / Undergraduate | 976 | 16.2% |
| Graduate / Professional | 262 | 4.3% |
| Total | 6,023 | 100.0% |
School Enrollment by Age by Funding Source in Sartell
Out of a total of 6,023 students who are enrolled in schools in Sartell, 536 (8.9%) attend a private institution, while the remaining 5,487 (91.1%) are enrolled in public schools. The age group of 3 to 4 year olds has the highest likelihood of being enrolled in private schools, with 92 (32.4% in the age bracket) enrolled. Conversely, the age group of 20 to 24 year olds has the lowest likelihood of being enrolled in a private school, with 714 (100.0% in the age bracket) attending a public institution.
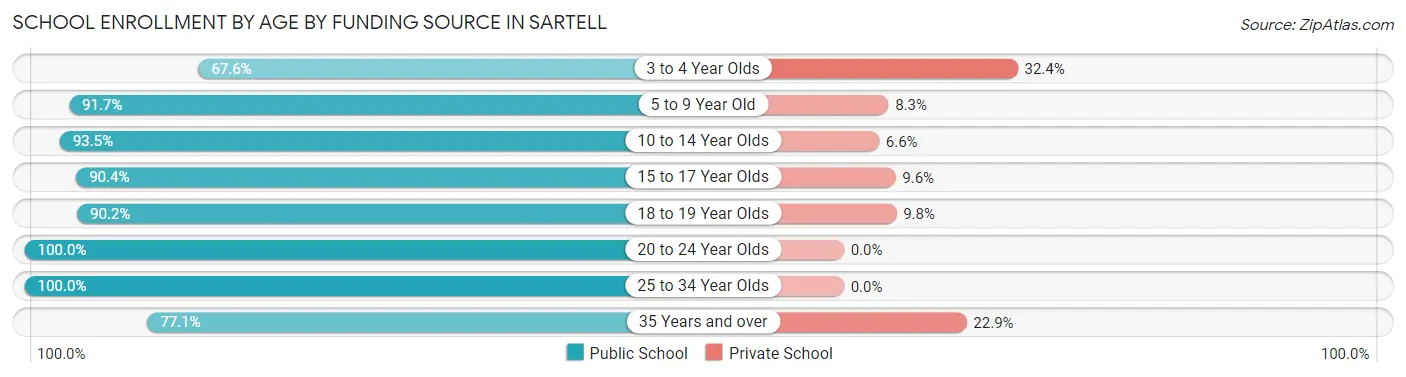
| Age Bracket | Public School | Private School |
| 3 to 4 Year Olds | 192 (67.6%) | 92 (32.4%) |
| 5 to 9 Year Old | 1,359 (91.7%) | 123 (8.3%) |
| 10 to 14 Year Olds | 1,270 (93.4%) | 89 (6.6%) |
| 15 to 17 Year Olds | 1,287 (90.4%) | 137 (9.6%) |
| 18 to 19 Year Olds | 415 (90.2%) | 45 (9.8%) |
| 20 to 24 Year Olds | 714 (100.0%) | 0 (0.0%) |
| 25 to 34 Year Olds | 90 (100.0%) | 0 (0.0%) |
| 35 Years and over | 162 (77.1%) | 48 (22.9%) |
| Total | 5,487 (91.1%) | 536 (8.9%) |
Educational Attainment by Field of Study in Sartell
Science & technology (789 | 16.5%), business (718 | 15.0%), education (563 | 11.8%), bio, nature & agricultural (395 | 8.3%), and psychology (378 | 7.9%) are the most common fields of study among 4,779 individuals in Sartell who have obtained a bachelor's degree or higher.
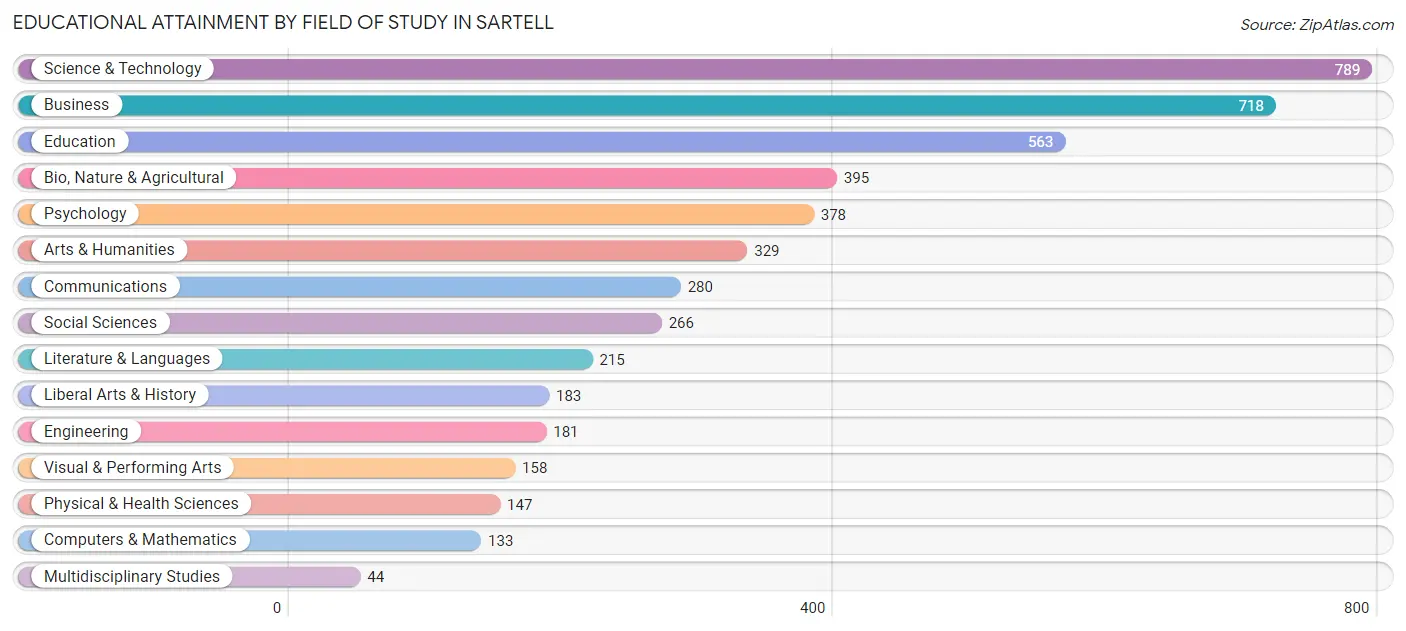
| Field of Study | # Graduates | % Graduates |
| Computers & Mathematics | 133 | 2.8% |
| Bio, Nature & Agricultural | 395 | 8.3% |
| Physical & Health Sciences | 147 | 3.1% |
| Psychology | 378 | 7.9% |
| Social Sciences | 266 | 5.6% |
| Engineering | 181 | 3.8% |
| Multidisciplinary Studies | 44 | 0.9% |
| Science & Technology | 789 | 16.5% |
| Business | 718 | 15.0% |
| Education | 563 | 11.8% |
| Literature & Languages | 215 | 4.5% |
| Liberal Arts & History | 183 | 3.8% |
| Visual & Performing Arts | 158 | 3.3% |
| Communications | 280 | 5.9% |
| Arts & Humanities | 329 | 6.9% |
| Total | 4,779 | 100.0% |
Transportation & Commute in Sartell
Vehicle Availability by Sex in Sartell
The most prevalent vehicle ownership categories in Sartell are males with 2 vehicles (2,593, accounting for 50.0%) and females with 2 vehicles (2,325, making up 52.1%).
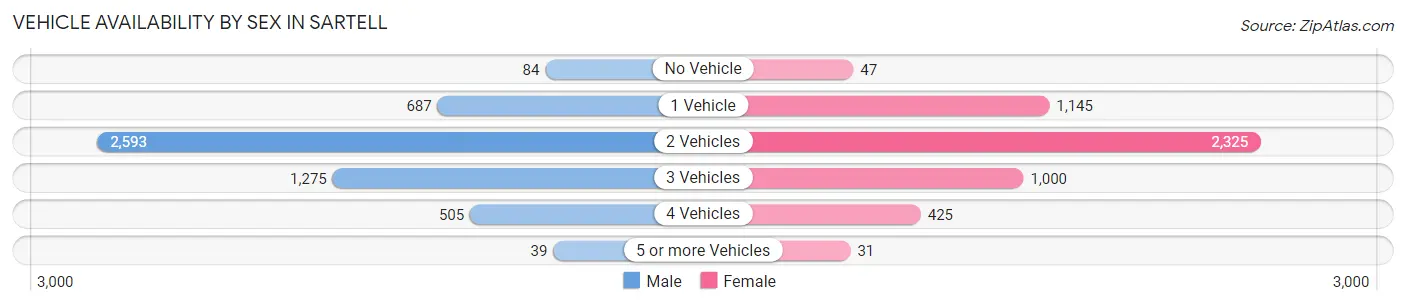
| Vehicles Available | Male | Female |
| No Vehicle | 84 (1.6%) | 47 (0.9%) |
| 1 Vehicle | 687 (13.3%) | 1,145 (23.0%) |
| 2 Vehicles | 2,593 (50.0%) | 2,325 (46.8%) |
| 3 Vehicles | 1,275 (24.6%) | 1,000 (20.1%) |
| 4 Vehicles | 505 (9.7%) | 425 (8.6%) |
| 5 or more Vehicles | 39 (0.7%) | 31 (0.6%) |
| Total | 5,183 (100.0%) | 4,973 (100.0%) |
Commute Time in Sartell
The most frequently occuring commute durations in Sartell are 15 to 19 minutes (2,190 commuters, 23.6%), 10 to 14 minutes (2,144 commuters, 23.2%), and 20 to 24 minutes (1,384 commuters, 14.9%).
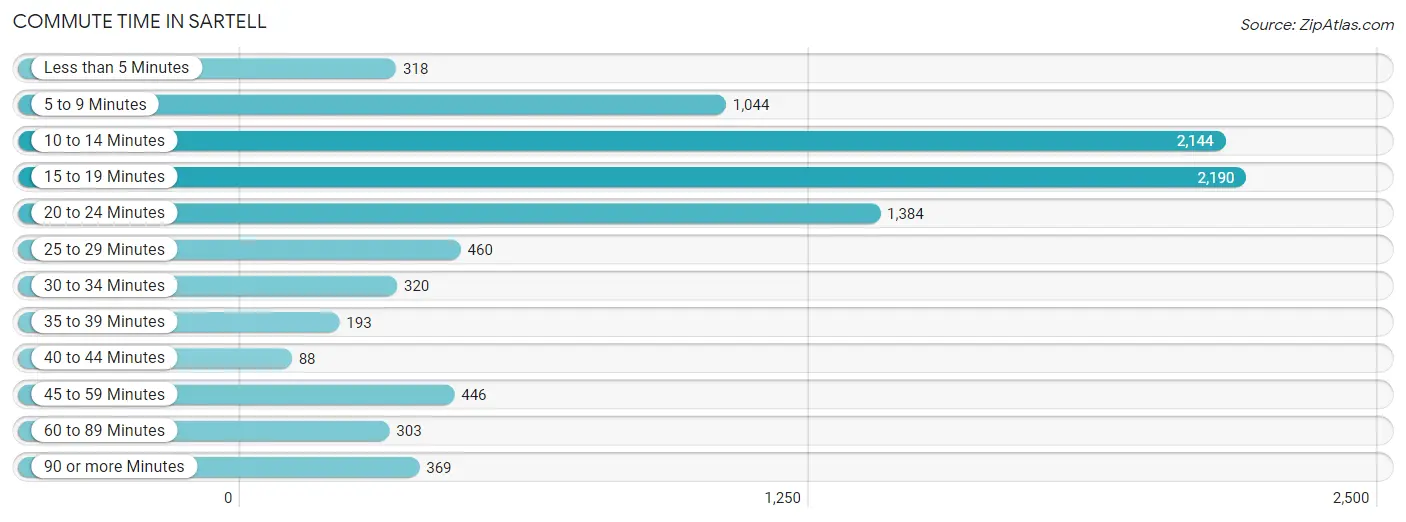
| Commute Time | # Commuters | % Commuters |
| Less than 5 Minutes | 318 | 3.4% |
| 5 to 9 Minutes | 1,044 | 11.3% |
| 10 to 14 Minutes | 2,144 | 23.2% |
| 15 to 19 Minutes | 2,190 | 23.6% |
| 20 to 24 Minutes | 1,384 | 14.9% |
| 25 to 29 Minutes | 460 | 5.0% |
| 30 to 34 Minutes | 320 | 3.5% |
| 35 to 39 Minutes | 193 | 2.1% |
| 40 to 44 Minutes | 88 | 0.9% |
| 45 to 59 Minutes | 446 | 4.8% |
| 60 to 89 Minutes | 303 | 3.3% |
| 90 or more Minutes | 369 | 4.0% |
Commute Time by Sex in Sartell
The most common commute times in Sartell are 10 to 14 minutes (1,197 commuters, 24.9%) for males and 15 to 19 minutes (1,085 commuters, 24.4%) for females.
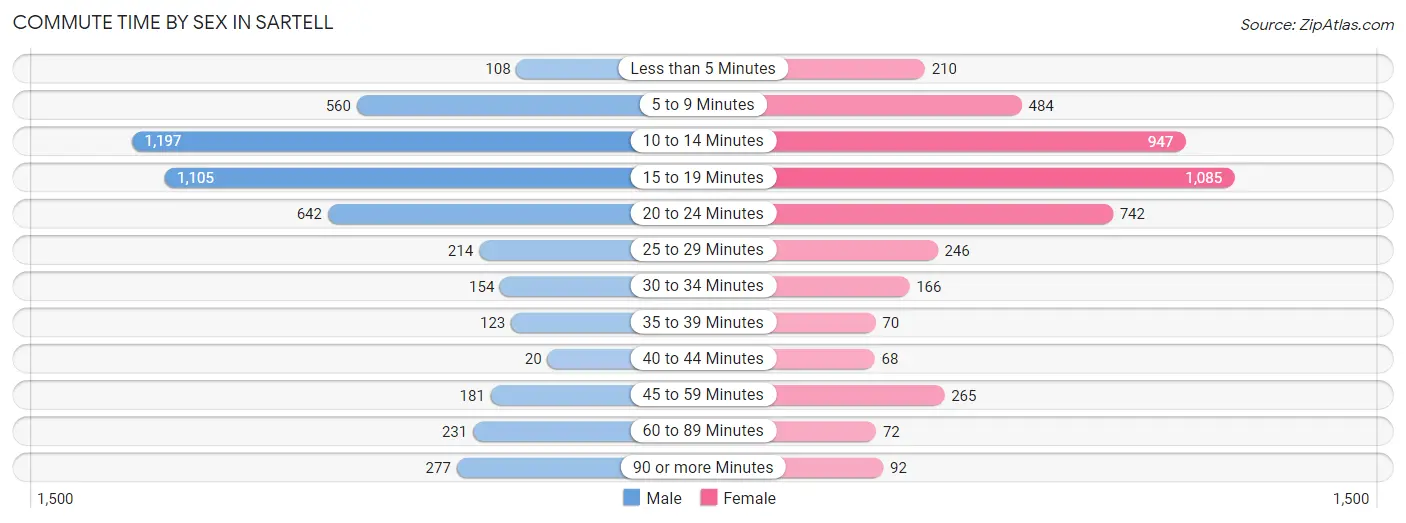
| Commute Time | Male | Female |
| Less than 5 Minutes | 108 (2.2%) | 210 (4.7%) |
| 5 to 9 Minutes | 560 (11.6%) | 484 (10.9%) |
| 10 to 14 Minutes | 1,197 (24.9%) | 947 (21.3%) |
| 15 to 19 Minutes | 1,105 (23.0%) | 1,085 (24.4%) |
| 20 to 24 Minutes | 642 (13.3%) | 742 (16.7%) |
| 25 to 29 Minutes | 214 (4.4%) | 246 (5.5%) |
| 30 to 34 Minutes | 154 (3.2%) | 166 (3.7%) |
| 35 to 39 Minutes | 123 (2.6%) | 70 (1.6%) |
| 40 to 44 Minutes | 20 (0.4%) | 68 (1.5%) |
| 45 to 59 Minutes | 181 (3.8%) | 265 (6.0%) |
| 60 to 89 Minutes | 231 (4.8%) | 72 (1.6%) |
| 90 or more Minutes | 277 (5.8%) | 92 (2.1%) |
Time of Departure to Work by Sex in Sartell
The most frequent times of departure to work in Sartell are 7:00 AM to 7:29 AM (939, 19.5%) for males and 7:30 AM to 7:59 AM (941, 21.2%) for females.
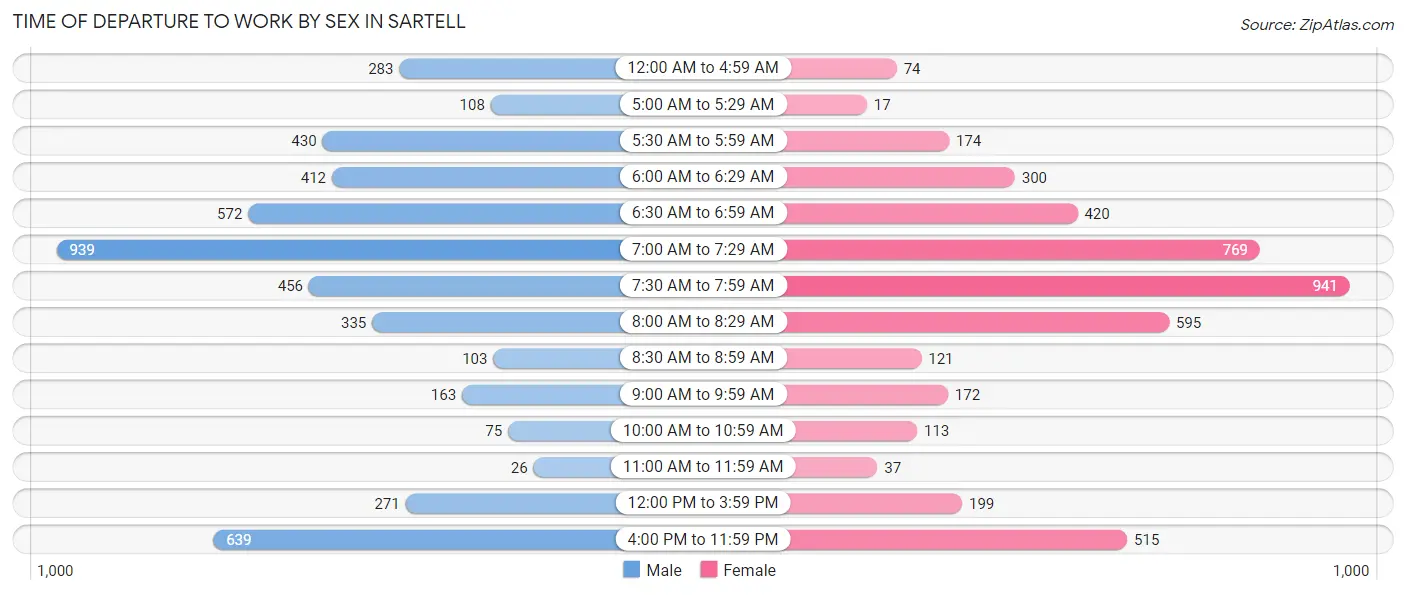
| Time of Departure | Male | Female |
| 12:00 AM to 4:59 AM | 283 (5.9%) | 74 (1.7%) |
| 5:00 AM to 5:29 AM | 108 (2.2%) | 17 (0.4%) |
| 5:30 AM to 5:59 AM | 430 (8.9%) | 174 (3.9%) |
| 6:00 AM to 6:29 AM | 412 (8.6%) | 300 (6.8%) |
| 6:30 AM to 6:59 AM | 572 (11.9%) | 420 (9.4%) |
| 7:00 AM to 7:29 AM | 939 (19.5%) | 769 (17.3%) |
| 7:30 AM to 7:59 AM | 456 (9.5%) | 941 (21.2%) |
| 8:00 AM to 8:29 AM | 335 (7.0%) | 595 (13.4%) |
| 8:30 AM to 8:59 AM | 103 (2.1%) | 121 (2.7%) |
| 9:00 AM to 9:59 AM | 163 (3.4%) | 172 (3.9%) |
| 10:00 AM to 10:59 AM | 75 (1.6%) | 113 (2.5%) |
| 11:00 AM to 11:59 AM | 26 (0.5%) | 37 (0.8%) |
| 12:00 PM to 3:59 PM | 271 (5.6%) | 199 (4.5%) |
| 4:00 PM to 11:59 PM | 639 (13.3%) | 515 (11.6%) |
| Total | 4,812 (100.0%) | 4,447 (100.0%) |
Housing Occupancy in Sartell
Occupancy by Ownership in Sartell
Of the total 7,505 dwellings in Sartell, owner-occupied units account for 4,317 (57.5%), while renter-occupied units make up 3,188 (42.5%).
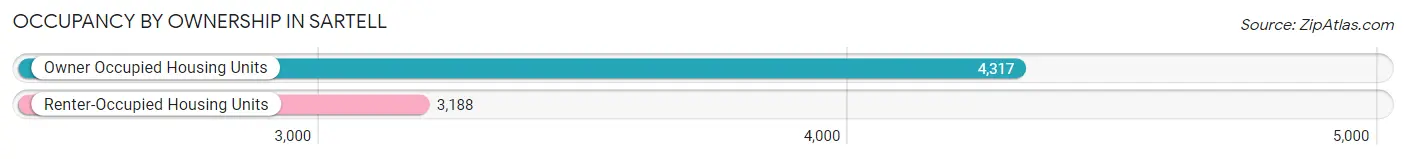
| Occupancy | # Housing Units | % Housing Units |
| Owner Occupied Housing Units | 4,317 | 57.5% |
| Renter-Occupied Housing Units | 3,188 | 42.5% |
| Total Occupied Housing Units | 7,505 | 100.0% |
Occupancy by Household Size in Sartell
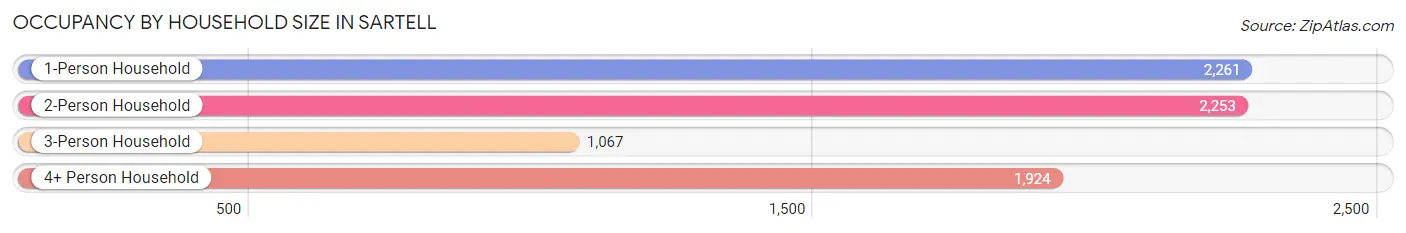
| Household Size | # Housing Units | % Housing Units |
| 1-Person Household | 2,261 | 30.1% |
| 2-Person Household | 2,253 | 30.0% |
| 3-Person Household | 1,067 | 14.2% |
| 4+ Person Household | 1,924 | 25.6% |
| Total Housing Units | 7,505 | 100.0% |
Occupancy by Ownership by Household Size in Sartell
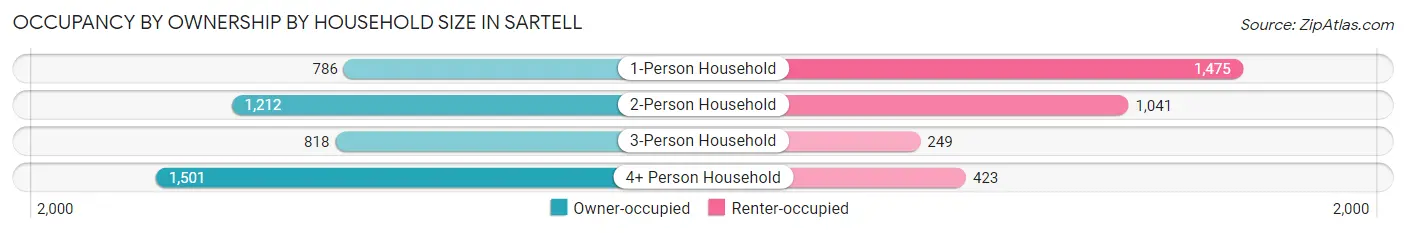
| Household Size | Owner-occupied | Renter-occupied |
| 1-Person Household | 786 (34.8%) | 1,475 (65.2%) |
| 2-Person Household | 1,212 (53.8%) | 1,041 (46.2%) |
| 3-Person Household | 818 (76.7%) | 249 (23.3%) |
| 4+ Person Household | 1,501 (78.0%) | 423 (22.0%) |
| Total Housing Units | 4,317 (57.5%) | 3,188 (42.5%) |
Occupancy by Educational Attainment in Sartell
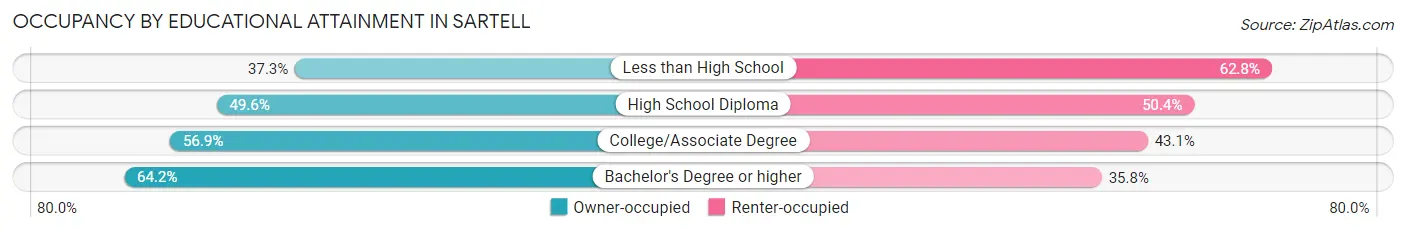
| Household Size | Owner-occupied | Renter-occupied |
| Less than High School | 171 (37.2%) | 288 (62.7%) |
| High School Diploma | 569 (49.6%) | 579 (50.4%) |
| College/Associate Degree | 1,644 (56.9%) | 1,244 (43.1%) |
| Bachelor's Degree or higher | 1,933 (64.2%) | 1,077 (35.8%) |
Occupancy by Age of Householder in Sartell
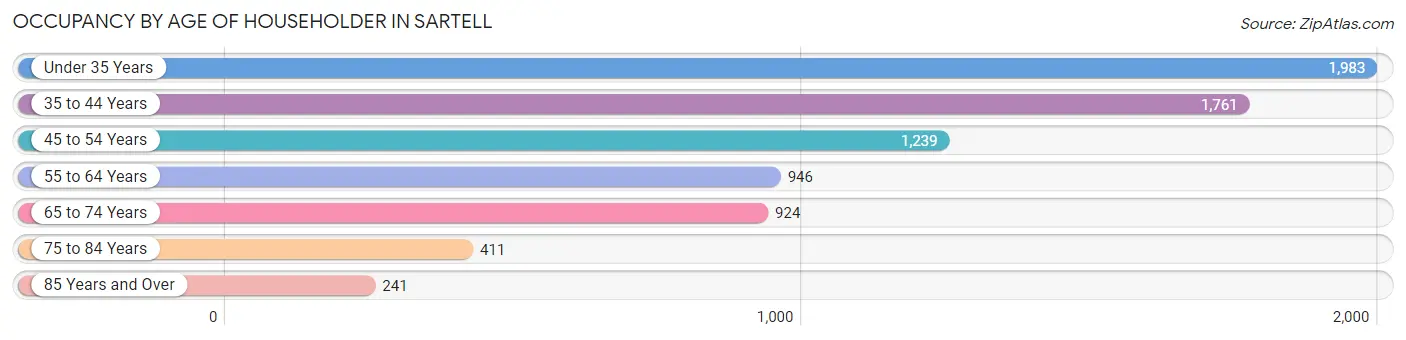
| Age Bracket | # Households | % Households |
| Under 35 Years | 1,983 | 26.4% |
| 35 to 44 Years | 1,761 | 23.5% |
| 45 to 54 Years | 1,239 | 16.5% |
| 55 to 64 Years | 946 | 12.6% |
| 65 to 74 Years | 924 | 12.3% |
| 75 to 84 Years | 411 | 5.5% |
| 85 Years and Over | 241 | 3.2% |
| Total | 7,505 | 100.0% |
Housing Finances in Sartell
Median Income by Occupancy in Sartell
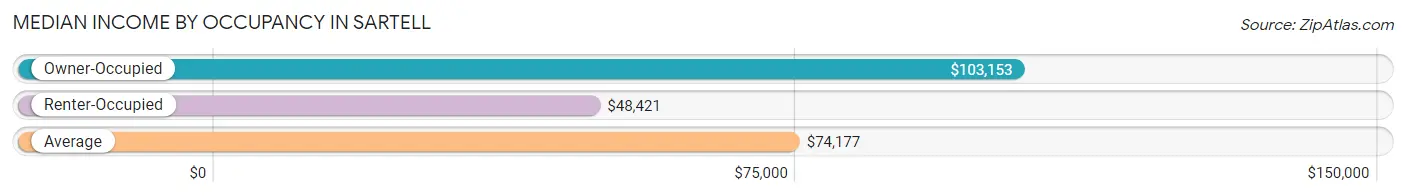
| Occupancy Type | # Households | Median Income |
| Owner-Occupied | 4,317 (57.5%) | $103,153 |
| Renter-Occupied | 3,188 (42.5%) | $48,421 |
| Average | 7,505 (100.0%) | $74,177 |
Occupancy by Householder Income Bracket in Sartell
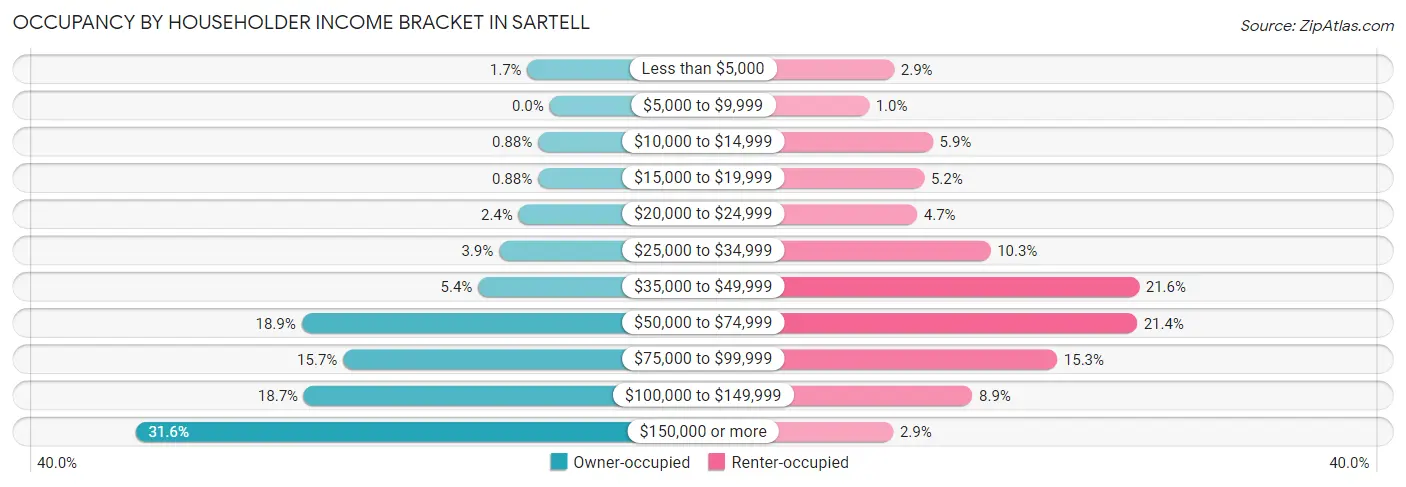
| Income Bracket | Owner-occupied | Renter-occupied |
| Less than $5,000 | 73 (1.7%) | 93 (2.9%) |
| $5,000 to $9,999 | 0 (0.0%) | 32 (1.0%) |
| $10,000 to $14,999 | 38 (0.9%) | 187 (5.9%) |
| $15,000 to $19,999 | 38 (0.9%) | 166 (5.2%) |
| $20,000 to $24,999 | 102 (2.4%) | 149 (4.7%) |
| $25,000 to $34,999 | 166 (3.8%) | 327 (10.3%) |
| $35,000 to $49,999 | 235 (5.4%) | 688 (21.6%) |
| $50,000 to $74,999 | 816 (18.9%) | 683 (21.4%) |
| $75,000 to $99,999 | 679 (15.7%) | 489 (15.3%) |
| $100,000 to $149,999 | 808 (18.7%) | 283 (8.9%) |
| $150,000 or more | 1,362 (31.6%) | 91 (2.9%) |
| Total | 4,317 (100.0%) | 3,188 (100.0%) |
Monthly Housing Cost Tiers in Sartell
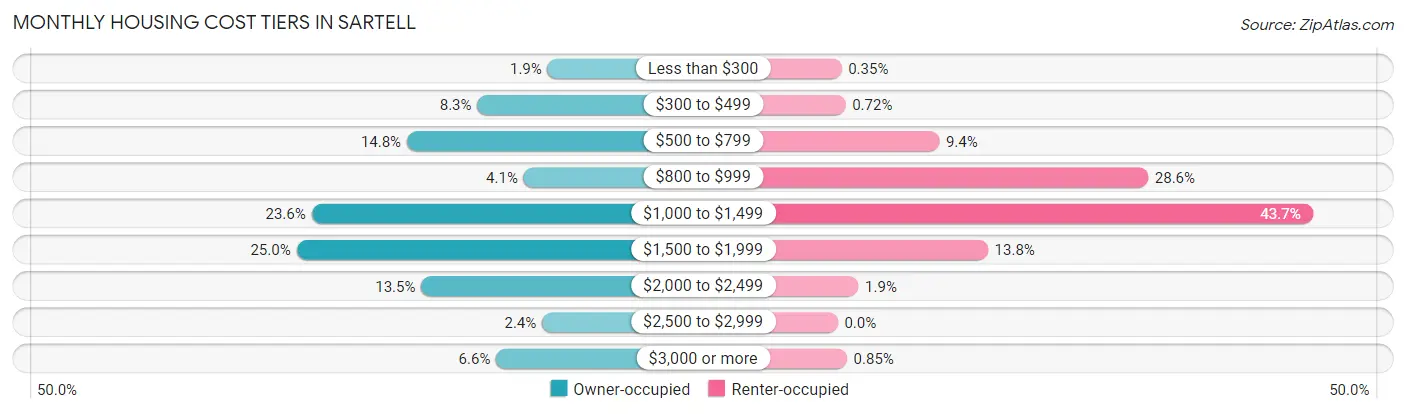
| Monthly Cost | Owner-occupied | Renter-occupied |
| Less than $300 | 80 (1.8%) | 11 (0.4%) |
| $300 to $499 | 359 (8.3%) | 23 (0.7%) |
| $500 to $799 | 639 (14.8%) | 298 (9.3%) |
| $800 to $999 | 175 (4.1%) | 911 (28.6%) |
| $1,000 to $1,499 | 1,018 (23.6%) | 1,394 (43.7%) |
| $1,500 to $1,999 | 1,078 (25.0%) | 441 (13.8%) |
| $2,000 to $2,499 | 582 (13.5%) | 61 (1.9%) |
| $2,500 to $2,999 | 102 (2.4%) | 0 (0.0%) |
| $3,000 or more | 284 (6.6%) | 27 (0.9%) |
| Total | 4,317 (100.0%) | 3,188 (100.0%) |
Physical Housing Characteristics in Sartell
Housing Structures in Sartell
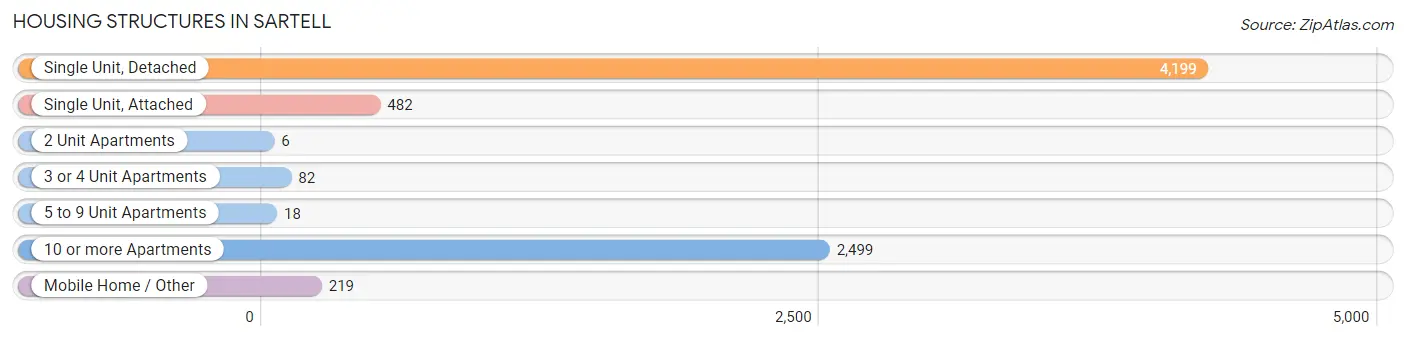
| Structure Type | # Housing Units | % Housing Units |
| Single Unit, Detached | 4,199 | 55.9% |
| Single Unit, Attached | 482 | 6.4% |
| 2 Unit Apartments | 6 | 0.1% |
| 3 or 4 Unit Apartments | 82 | 1.1% |
| 5 to 9 Unit Apartments | 18 | 0.2% |
| 10 or more Apartments | 2,499 | 33.3% |
| Mobile Home / Other | 219 | 2.9% |
| Total | 7,505 | 100.0% |
Housing Structures by Occupancy in Sartell
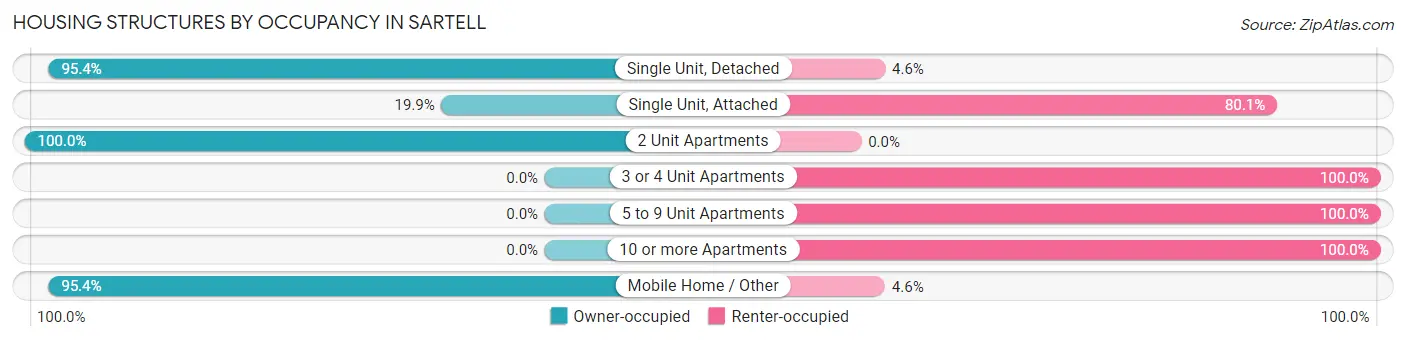
| Structure Type | Owner-occupied | Renter-occupied |
| Single Unit, Detached | 4,006 (95.4%) | 193 (4.6%) |
| Single Unit, Attached | 96 (19.9%) | 386 (80.1%) |
| 2 Unit Apartments | 6 (100.0%) | 0 (0.0%) |
| 3 or 4 Unit Apartments | 0 (0.0%) | 82 (100.0%) |
| 5 to 9 Unit Apartments | 0 (0.0%) | 18 (100.0%) |
| 10 or more Apartments | 0 (0.0%) | 2,499 (100.0%) |
| Mobile Home / Other | 209 (95.4%) | 10 (4.6%) |
| Total | 4,317 (57.5%) | 3,188 (42.5%) |
Housing Structures by Number of Rooms in Sartell
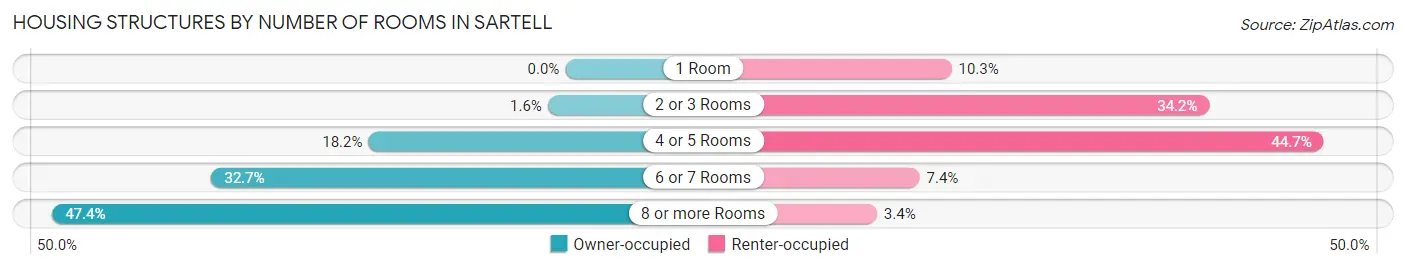
| Number of Rooms | Owner-occupied | Renter-occupied |
| 1 Room | 0 (0.0%) | 329 (10.3%) |
| 2 or 3 Rooms | 70 (1.6%) | 1,089 (34.2%) |
| 4 or 5 Rooms | 786 (18.2%) | 1,426 (44.7%) |
| 6 or 7 Rooms | 1,413 (32.7%) | 235 (7.4%) |
| 8 or more Rooms | 2,048 (47.4%) | 109 (3.4%) |
| Total | 4,317 (100.0%) | 3,188 (100.0%) |
Housing Structure by Heating Type in Sartell
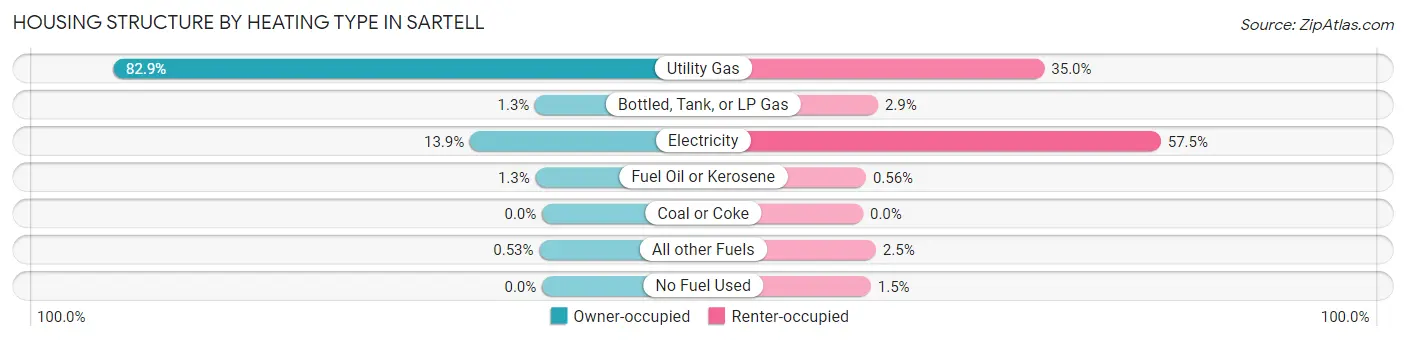
| Heating Type | Owner-occupied | Renter-occupied |
| Utility Gas | 3,580 (82.9%) | 1,117 (35.0%) |
| Bottled, Tank, or LP Gas | 58 (1.3%) | 92 (2.9%) |
| Electricity | 601 (13.9%) | 1,834 (57.5%) |
| Fuel Oil or Kerosene | 55 (1.3%) | 18 (0.6%) |
| Coal or Coke | 0 (0.0%) | 0 (0.0%) |
| All other Fuels | 23 (0.5%) | 79 (2.5%) |
| No Fuel Used | 0 (0.0%) | 48 (1.5%) |
| Total | 4,317 (100.0%) | 3,188 (100.0%) |
Household Vehicle Usage in Sartell
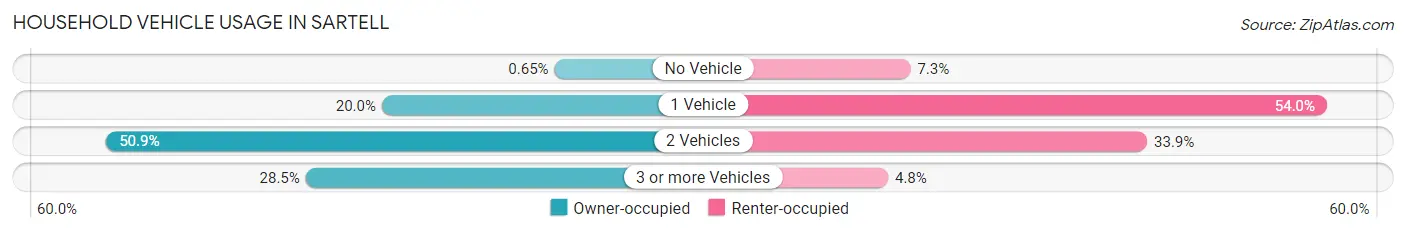
| Vehicles per Household | Owner-occupied | Renter-occupied |
| No Vehicle | 28 (0.6%) | 234 (7.3%) |
| 1 Vehicle | 863 (20.0%) | 1,721 (54.0%) |
| 2 Vehicles | 2,195 (50.8%) | 1,079 (33.9%) |
| 3 or more Vehicles | 1,231 (28.5%) | 154 (4.8%) |
| Total | 4,317 (100.0%) | 3,188 (100.0%) |
Real Estate & Mortgages in Sartell
Real Estate and Mortgage Overview in Sartell
| Characteristic | Without Mortgage | With Mortgage |
| Housing Units | 1,253 | 3,064 |
| Median Property Value | $232,800 | $272,700 |
| Median Household Income | $64,325 | $1,159 |
| Monthly Housing Costs | $575 | $284 |
| Real Estate Taxes | $2,747 | $69 |
Property Value by Mortgage Status in Sartell
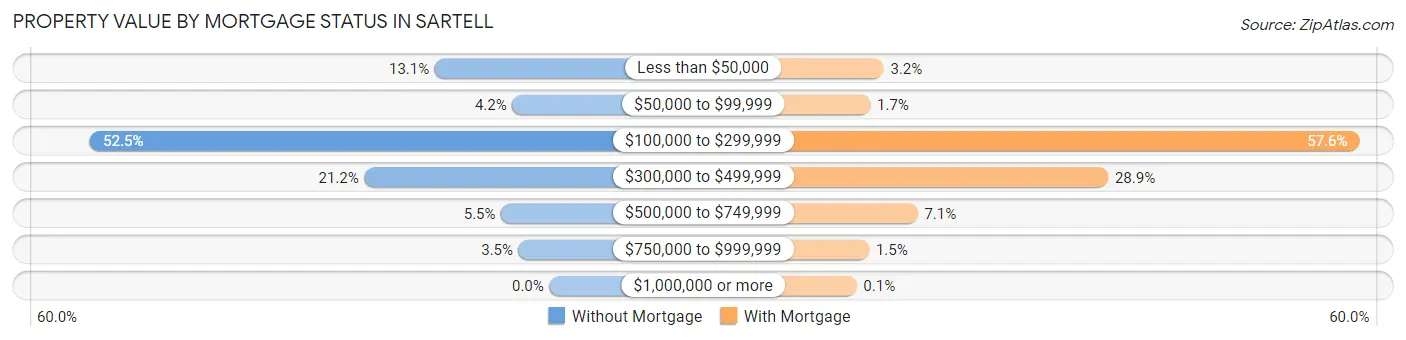
| Property Value | Without Mortgage | With Mortgage |
| Less than $50,000 | 164 (13.1%) | 98 (3.2%) |
| $50,000 to $99,999 | 53 (4.2%) | 51 (1.7%) |
| $100,000 to $299,999 | 658 (52.5%) | 1,764 (57.6%) |
| $300,000 to $499,999 | 265 (21.1%) | 884 (28.8%) |
| $500,000 to $749,999 | 69 (5.5%) | 217 (7.1%) |
| $750,000 to $999,999 | 44 (3.5%) | 47 (1.5%) |
| $1,000,000 or more | 0 (0.0%) | 3 (0.1%) |
| Total | 1,253 (100.0%) | 3,064 (100.0%) |
Household Income by Mortgage Status in Sartell
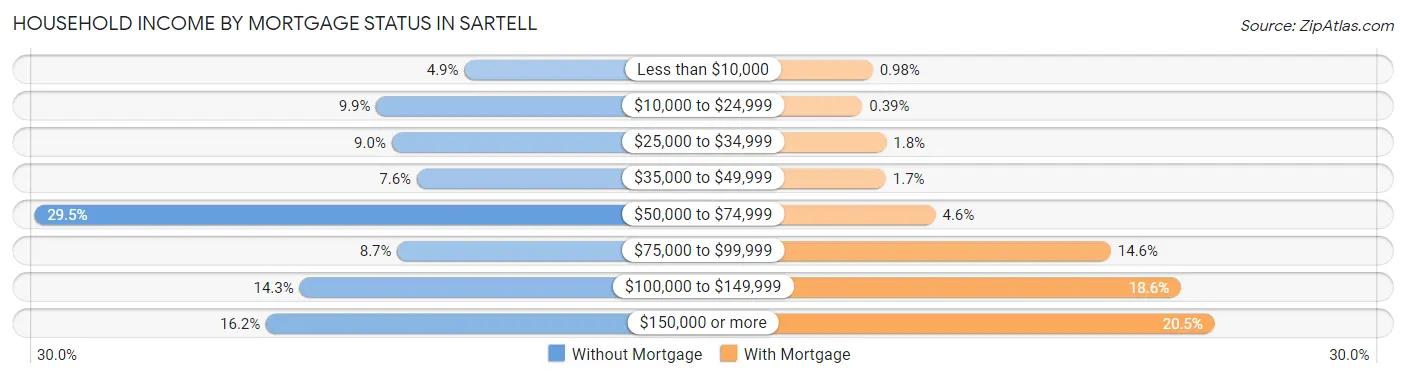
| Household Income | Without Mortgage | With Mortgage |
| Less than $10,000 | 61 (4.9%) | 30 (1.0%) |
| $10,000 to $24,999 | 124 (9.9%) | 12 (0.4%) |
| $25,000 to $34,999 | 113 (9.0%) | 54 (1.8%) |
| $35,000 to $49,999 | 95 (7.6%) | 53 (1.7%) |
| $50,000 to $74,999 | 369 (29.4%) | 140 (4.6%) |
| $75,000 to $99,999 | 109 (8.7%) | 447 (14.6%) |
| $100,000 to $149,999 | 179 (14.3%) | 570 (18.6%) |
| $150,000 or more | 203 (16.2%) | 629 (20.5%) |
| Total | 1,253 (100.0%) | 3,064 (100.0%) |
Property Value to Household Income Ratio in Sartell
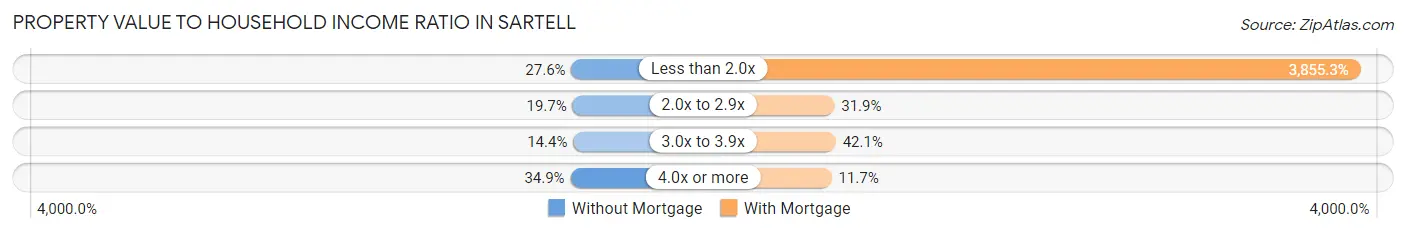
| Value-to-Income Ratio | Without Mortgage | With Mortgage |
| Less than 2.0x | 346 (27.6%) | 118,125 (3,855.3%) |
| 2.0x to 2.9x | 247 (19.7%) | 978 (31.9%) |
| 3.0x to 3.9x | 180 (14.4%) | 1,290 (42.1%) |
| 4.0x or more | 437 (34.9%) | 359 (11.7%) |
| Total | 1,253 (100.0%) | 3,064 (100.0%) |
Real Estate Taxes by Mortgage Status in Sartell
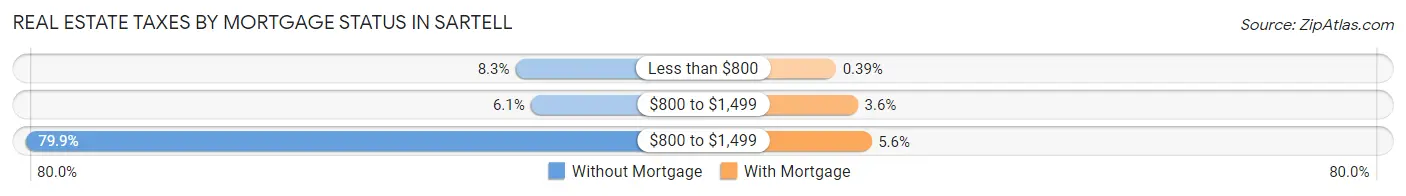
| Property Taxes | Without Mortgage | With Mortgage |
| Less than $800 | 104 (8.3%) | 12 (0.4%) |
| $800 to $1,499 | 76 (6.1%) | 110 (3.6%) |
| $800 to $1,499 | 1,001 (79.9%) | 171 (5.6%) |
| Total | 1,253 (100.0%) | 3,064 (100.0%) |
Health & Disability in Sartell
Health Insurance Coverage by Age in Sartell
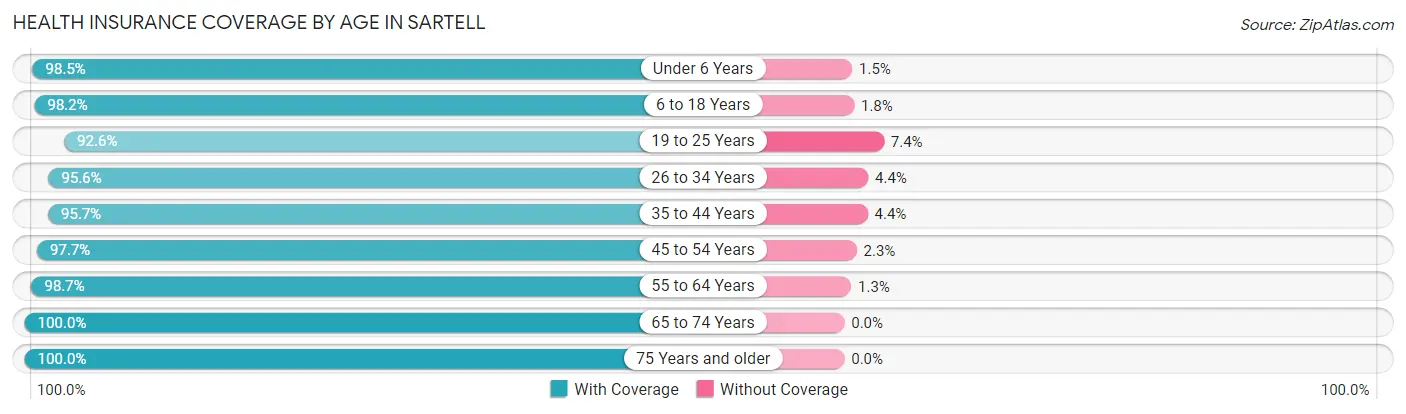
| Age Bracket | With Coverage | Without Coverage |
| Under 6 Years | 1,547 (98.5%) | 23 (1.5%) |
| 6 to 18 Years | 4,426 (98.2%) | 82 (1.8%) |
| 19 to 25 Years | 1,735 (92.6%) | 138 (7.4%) |
| 26 to 34 Years | 2,109 (95.6%) | 98 (4.4%) |
| 35 to 44 Years | 2,859 (95.7%) | 130 (4.3%) |
| 45 to 54 Years | 2,039 (97.7%) | 48 (2.3%) |
| 55 to 64 Years | 1,561 (98.7%) | 20 (1.3%) |
| 65 to 74 Years | 1,365 (100.0%) | 0 (0.0%) |
| 75 Years and older | 958 (100.0%) | 0 (0.0%) |
| Total | 18,599 (97.2%) | 539 (2.8%) |
Health Insurance Coverage by Citizenship Status in Sartell
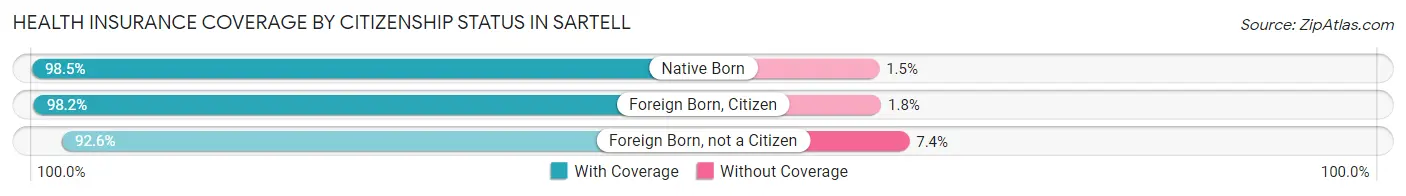
| Citizenship Status | With Coverage | Without Coverage |
| Native Born | 1,547 (98.5%) | 23 (1.5%) |
| Foreign Born, Citizen | 4,426 (98.2%) | 82 (1.8%) |
| Foreign Born, not a Citizen | 1,735 (92.6%) | 138 (7.4%) |
Health Insurance Coverage by Household Income in Sartell
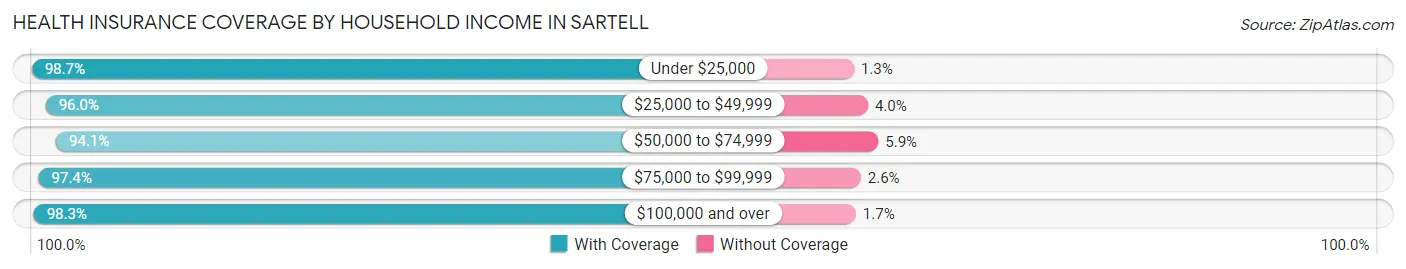
| Household Income | With Coverage | Without Coverage |
| Under $25,000 | 1,027 (98.7%) | 14 (1.3%) |
| $25,000 to $49,999 | 2,522 (96.0%) | 104 (4.0%) |
| $50,000 to $74,999 | 2,898 (94.1%) | 182 (5.9%) |
| $75,000 to $99,999 | 2,964 (97.4%) | 80 (2.6%) |
| $100,000 and over | 9,156 (98.3%) | 159 (1.7%) |
Public vs Private Health Insurance Coverage by Age in Sartell
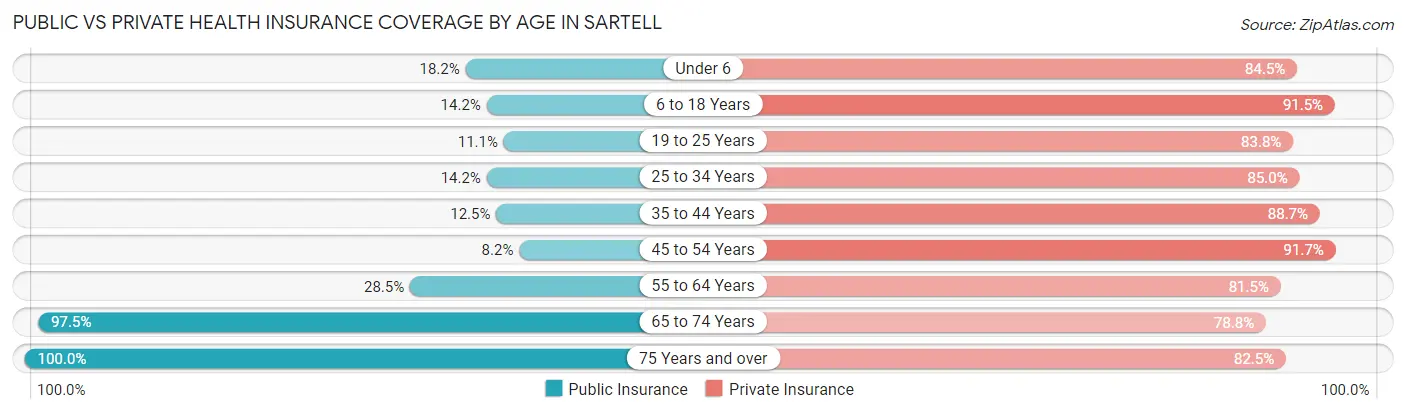
| Age Bracket | Public Insurance | Private Insurance |
| Under 6 | 285 (18.1%) | 1,327 (84.5%) |
| 6 to 18 Years | 642 (14.2%) | 4,126 (91.5%) |
| 19 to 25 Years | 207 (11.1%) | 1,569 (83.8%) |
| 25 to 34 Years | 314 (14.2%) | 1,875 (85.0%) |
| 35 to 44 Years | 372 (12.4%) | 2,652 (88.7%) |
| 45 to 54 Years | 171 (8.2%) | 1,913 (91.7%) |
| 55 to 64 Years | 450 (28.5%) | 1,288 (81.5%) |
| 65 to 74 Years | 1,331 (97.5%) | 1,075 (78.7%) |
| 75 Years and over | 958 (100.0%) | 790 (82.5%) |
| Total | 4,730 (24.7%) | 16,615 (86.8%) |
Disability Status by Sex by Age in Sartell
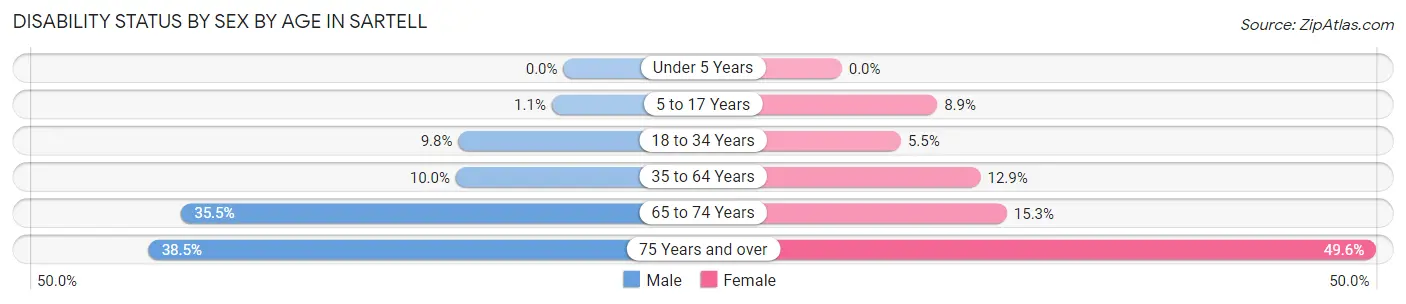
| Age Bracket | Male | Female |
| Under 5 Years | 0 (0.0%) | 0 (0.0%) |
| 5 to 17 Years | 25 (1.1%) | 182 (8.9%) |
| 18 to 34 Years | 210 (9.8%) | 129 (5.5%) |
| 35 to 64 Years | 332 (10.0%) | 429 (12.9%) |
| 65 to 74 Years | 190 (35.4%) | 127 (15.3%) |
| 75 Years and over | 142 (38.5%) | 292 (49.6%) |
Disability Class by Sex by Age in Sartell
Disability Class: Hearing Difficulty
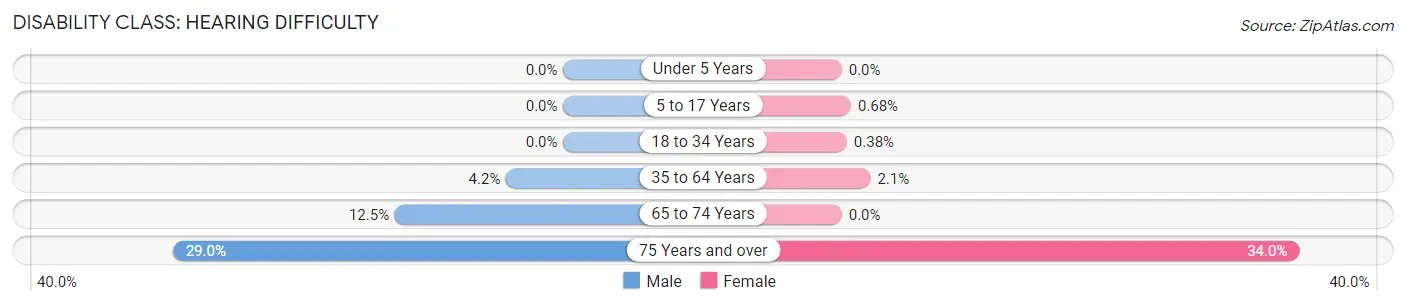
| Age Bracket | Male | Female |
| Under 5 Years | 0 (0.0%) | 0 (0.0%) |
| 5 to 17 Years | 0 (0.0%) | 14 (0.7%) |
| 18 to 34 Years | 0 (0.0%) | 9 (0.4%) |
| 35 to 64 Years | 141 (4.2%) | 71 (2.1%) |
| 65 to 74 Years | 67 (12.5%) | 0 (0.0%) |
| 75 Years and over | 107 (29.0%) | 200 (34.0%) |
Disability Class: Vision Difficulty
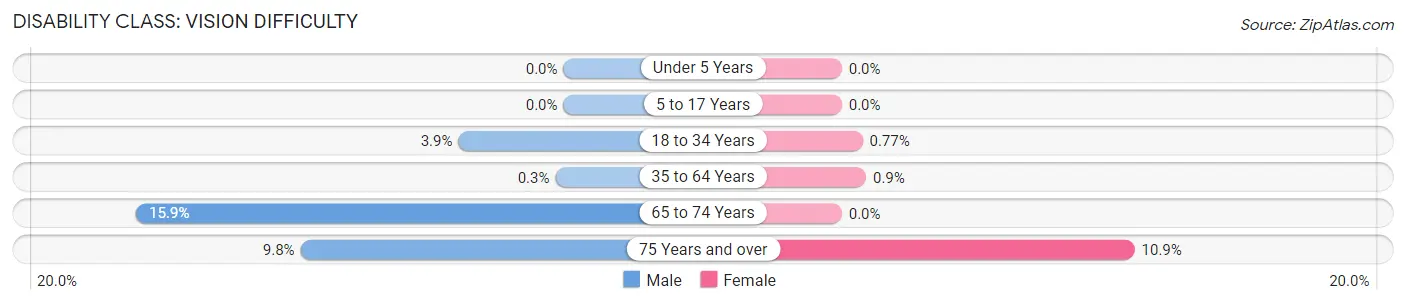
| Age Bracket | Male | Female |
| Under 5 Years | 0 (0.0%) | 0 (0.0%) |
| 5 to 17 Years | 0 (0.0%) | 0 (0.0%) |
| 18 to 34 Years | 84 (3.9%) | 18 (0.8%) |
| 35 to 64 Years | 10 (0.3%) | 30 (0.9%) |
| 65 to 74 Years | 85 (15.9%) | 0 (0.0%) |
| 75 Years and over | 36 (9.8%) | 64 (10.9%) |
Disability Class: Cognitive Difficulty
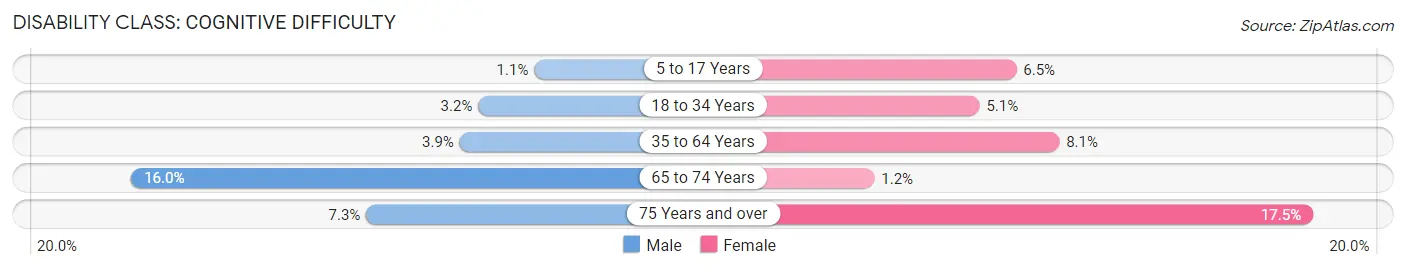
| Age Bracket | Male | Female |
| 5 to 17 Years | 25 (1.1%) | 133 (6.5%) |
| 18 to 34 Years | 68 (3.2%) | 120 (5.1%) |
| 35 to 64 Years | 128 (3.8%) | 269 (8.1%) |
| 65 to 74 Years | 86 (16.0%) | 10 (1.2%) |
| 75 Years and over | 27 (7.3%) | 103 (17.5%) |
Disability Class: Ambulatory Difficulty
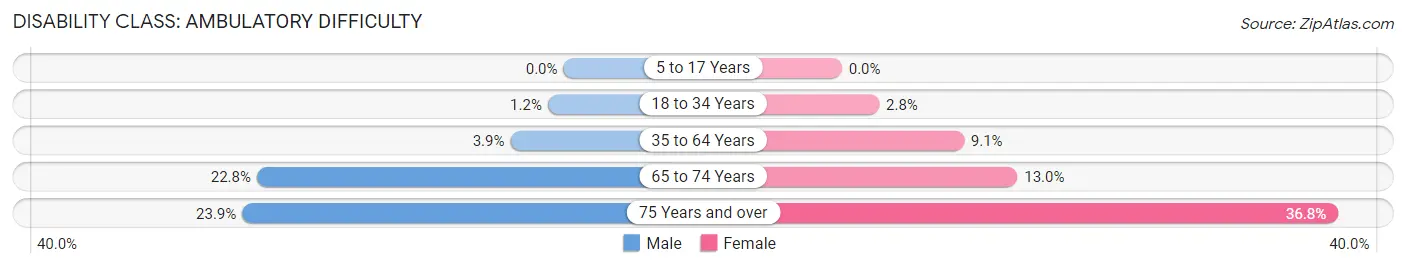
| Age Bracket | Male | Female |
| 5 to 17 Years | 0 (0.0%) | 0 (0.0%) |
| 18 to 34 Years | 25 (1.2%) | 65 (2.8%) |
| 35 to 64 Years | 131 (3.9%) | 302 (9.1%) |
| 65 to 74 Years | 122 (22.8%) | 108 (13.0%) |
| 75 Years and over | 88 (23.8%) | 217 (36.8%) |
Disability Class: Self-Care Difficulty
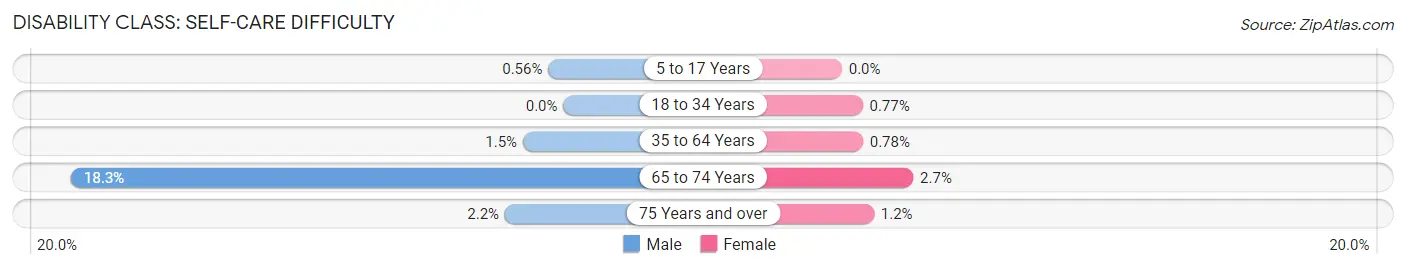
| Age Bracket | Male | Female |
| 5 to 17 Years | 13 (0.6%) | 0 (0.0%) |
| 18 to 34 Years | 0 (0.0%) | 18 (0.8%) |
| 35 to 64 Years | 50 (1.5%) | 26 (0.8%) |
| 65 to 74 Years | 98 (18.3%) | 22 (2.6%) |
| 75 Years and over | 8 (2.2%) | 7 (1.2%) |
Technology Access in Sartell
Computing Device Access in Sartell
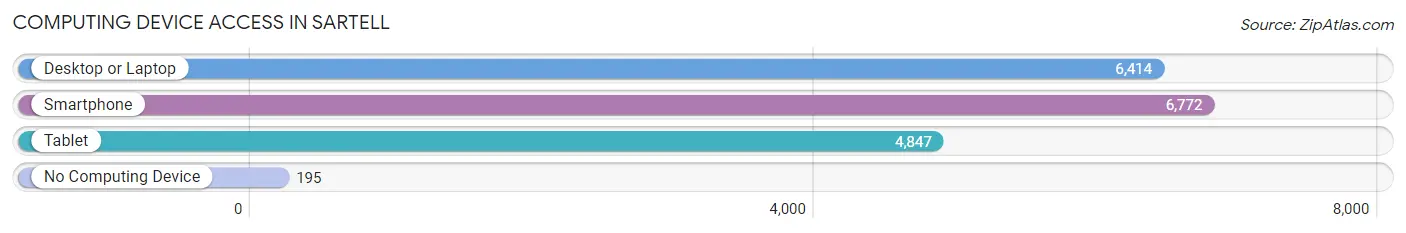
| Device Type | # Households | % Households |
| Desktop or Laptop | 6,414 | 85.5% |
| Smartphone | 6,772 | 90.2% |
| Tablet | 4,847 | 64.6% |
| No Computing Device | 195 | 2.6% |
| Total | 7,505 | 100.0% |
Internet Access in Sartell

| Internet Type | # Households | % Households |
| Dial-Up Internet | 9 | 0.1% |
| Broadband Home | 6,047 | 80.6% |
| Cellular Data Only | 462 | 6.2% |
| Satellite Internet | 329 | 4.4% |
| No Internet | 787 | 10.5% |
| Total | 7,505 | 100.0% |
Sartell Summary
Sartell is a city located in Stearns County, Minnesota, United States. The population was 15,876 at the 2010 census. It is part of the St. Cloud Metropolitan Statistical Area.
History
Sartell was founded in 1856 by a group of settlers from Sartell, Wisconsin. The city was named after the Wisconsin town, which was named after a French explorer, Pierre Charles Le Sueur. The city was incorporated in 1907.
Geography
Sartell is located at the intersection of Interstate 94 and Minnesota State Highway 15. It is located on the banks of the Mississippi River, about 10 miles northwest of St. Cloud. The city has a total area of 8.2 square miles, of which 8.1 square miles is land and 0.1 square miles is water.
Economy
Sartell is home to several large employers, including the Sartell Paper Mill, which is the largest employer in the city. Other major employers include the Sartell-St. Stephen School District, CentraCare Health System, and the Sartell-St. Stephen Community Education Center.
Demographics
As of the 2010 census, there were 15,876 people, 6,541 households, and 4,541 families residing in the city. The population density was 1,955.3 people per square mile. The racial makeup of the city was 94.2% White, 1.2% African American, 0.3% Native American, 1.7% Asian, 0.1% Pacific Islander, 1.2% from other races, and 1.4% from two or more races. Hispanic or Latino of any race were 3.2% of the population.
The median income for a household in the city was $60,945, and the median income for a family was $71,945. The per capita income for the city was $27,945. About 3.2% of families and 4.7% of the population were below the poverty line, including 5.3% of those under age 18 and 4.2% of those age 65 or over.
Conclusion
Sartell is a city located in Stearns County, Minnesota, United States. It was founded in 1856 and incorporated in 1907. The city is located at the intersection of Interstate 94 and Minnesota State Highway 15, and is situated on the banks of the Mississippi River. The city has a population of 15,876 and is home to several large employers, including the Sartell Paper Mill, the Sartell-St. Stephen School District, CentraCare Health System, and the Sartell-St. Stephen Community Education Center. The median income for a household in the city was $60,945, and the median income for a family was $71,945. The per capita income for the city was $27,945.
Common Questions
What is Per Capita Income in Sartell?
Per Capita income in Sartell is $39,501.
What is the Median Family Income in Sartell?
Median Family Income in Sartell is $95,824.
What is the Median Household income in Sartell?
Median Household Income in Sartell is $74,177.
What is Income or Wage Gap in Sartell?
Income or Wage Gap in Sartell is 25.1%.
Women in Sartell earn 74.9 cents for every dollar earned by a man.
What is Inequality or Gini Index in Sartell?
Inequality or Gini Index in Sartell is 0.43.
What is the Total Population of Sartell?
Total Population of Sartell is 19,382.
What is the Total Male Population of Sartell?
Total Male Population of Sartell is 9,522.
What is the Total Female Population of Sartell?
Total Female Population of Sartell is 9,860.
What is the Ratio of Males per 100 Females in Sartell?
There are 96.57 Males per 100 Females in Sartell.
What is the Ratio of Females per 100 Males in Sartell?
There are 103.55 Females per 100 Males in Sartell.
What is the Median Population Age in Sartell?
Median Population Age in Sartell is 32.9 Years.
What is the Average Family Size in Sartell
Average Family Size in Sartell is 3.3 People.
What is the Average Household Size in Sartell
Average Household Size in Sartell is 2.5 People.
How Large is the Labor Force in Sartell?
There are 10,638 People in the Labor Forcein in Sartell.
What is the Percentage of People in the Labor Force in Sartell?
73.0% of People are in the Labor Force in Sartell.
What is the Unemployment Rate in Sartell?
Unemployment Rate in Sartell is 2.6%.