Sparks, NV Map & Demographics
Sparks Map
Sparks Overview
$37,980
PER CAPITA INCOME
$95,739
AVG FAMILY INCOME
$82,938
AVG HOUSEHOLD INCOME
27.8%
WAGE / INCOME GAP [ % ]
72.2¢/ $1
WAGE / INCOME GAP [ $ ]
$8,523
FAMILY INCOME DEFICIT
0.40
INEQUALITY / GINI INDEX
108,025
TOTAL POPULATION
55,203
MALE POPULATION
52,822
FEMALE POPULATION
104.51
MALES / 100 FEMALES
95.69
FEMALES / 100 MALES
37.0
MEDIAN AGE
3.2
AVG FAMILY SIZE
2.7
AVG HOUSEHOLD SIZE
58,183
LABOR FORCE [ PEOPLE ]
68.2%
PERCENT IN LABOR FORCE
6.1%
UNEMPLOYMENT RATE
Sparks Area Codes
Income in Sparks
Income Overview in Sparks
Per Capita Income in Sparks is $37,980, while median incomes of families and households are $95,739 and $82,938 respectively.
| Characteristic | Number | Measure |
| Per Capita Income | 108,025 | $37,980 |
| Median Family Income | 27,093 | $95,739 |
| Mean Family Income | 27,093 | $113,918 |
| Median Household Income | 40,325 | $82,938 |
| Mean Household Income | 40,325 | $100,172 |
| Income Deficit | 27,093 | $8,523 |
| Wage / Income Gap (%) | 108,025 | 27.82% |
| Wage / Income Gap ($) | 108,025 | 72.18¢ per $1 |
| Gini / Inequality Index | 108,025 | 0.40 |
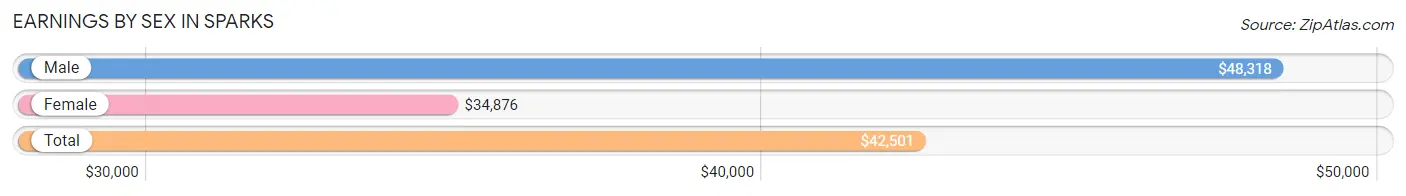
Earnings by Sex in Sparks
Average Earnings in Sparks are $42,501, $48,318 for men and $34,876 for women, a difference of 27.8%.
| Sex | Number | Average Earnings |
| Male | 32,700 (54.8%) | $48,318 |
| Female | 26,913 (45.2%) | $34,876 |
| Total | 59,613 (100.0%) | $42,501 |
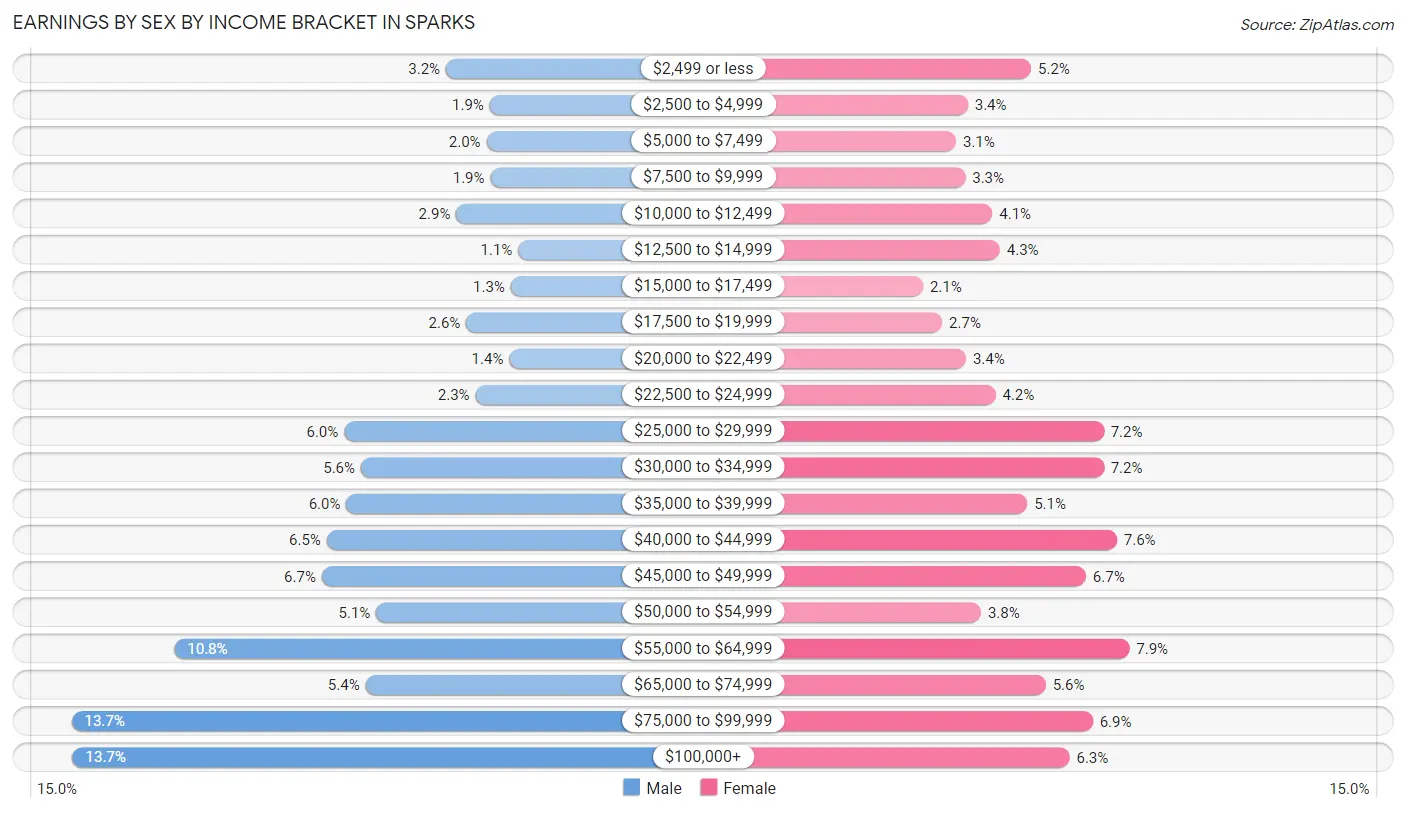
Earnings by Sex by Income Bracket in Sparks
The most common earnings brackets in Sparks are $75,000 to $99,999 for men (4,474 | 13.7%) and $55,000 to $64,999 for women (2,138 | 7.9%).
| Income | Male | Female |
| $2,499 or less | 1,033 (3.2%) | 1,395 (5.2%) |
| $2,500 to $4,999 | 632 (1.9%) | 914 (3.4%) |
| $5,000 to $7,499 | 662 (2.0%) | 825 (3.1%) |
| $7,500 to $9,999 | 626 (1.9%) | 897 (3.3%) |
| $10,000 to $12,499 | 939 (2.9%) | 1,100 (4.1%) |
| $12,500 to $14,999 | 371 (1.1%) | 1,156 (4.3%) |
| $15,000 to $17,499 | 439 (1.3%) | 576 (2.1%) |
| $17,500 to $19,999 | 846 (2.6%) | 722 (2.7%) |
| $20,000 to $22,499 | 450 (1.4%) | 902 (3.4%) |
| $22,500 to $24,999 | 762 (2.3%) | 1,126 (4.2%) |
| $25,000 to $29,999 | 1,967 (6.0%) | 1,942 (7.2%) |
| $30,000 to $34,999 | 1,814 (5.6%) | 1,943 (7.2%) |
| $35,000 to $39,999 | 1,949 (6.0%) | 1,364 (5.1%) |
| $40,000 to $44,999 | 2,128 (6.5%) | 2,043 (7.6%) |
| $45,000 to $49,999 | 2,174 (6.7%) | 1,808 (6.7%) |
| $50,000 to $54,999 | 1,673 (5.1%) | 1,014 (3.8%) |
| $55,000 to $64,999 | 3,527 (10.8%) | 2,138 (7.9%) |
| $65,000 to $74,999 | 1,771 (5.4%) | 1,505 (5.6%) |
| $75,000 to $99,999 | 4,474 (13.7%) | 1,859 (6.9%) |
| $100,000+ | 4,463 (13.7%) | 1,684 (6.3%) |
| Total | 32,700 (100.0%) | 26,913 (100.0%) |
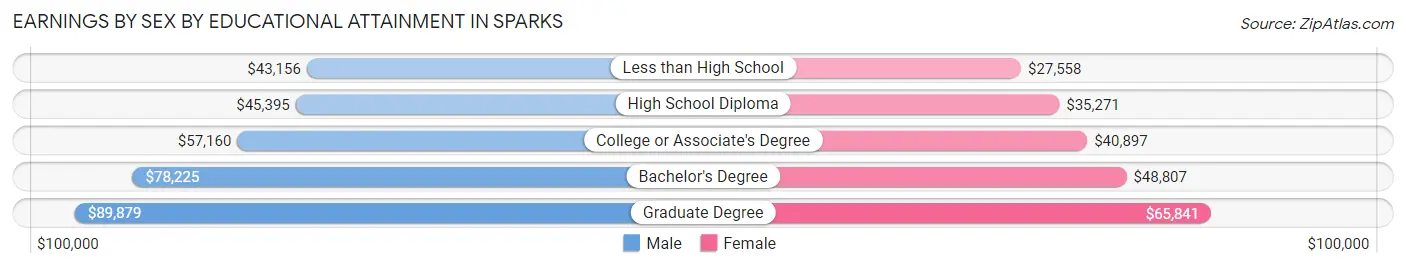
Earnings by Sex by Educational Attainment in Sparks
Average earnings in Sparks are $54,343 for men and $41,084 for women, a difference of 24.4%. Men with an educational attainment of graduate degree enjoy the highest average annual earnings of $89,879, while those with less than high school education earn the least with $43,156. Women with an educational attainment of graduate degree earn the most with the average annual earnings of $65,841, while those with less than high school education have the smallest earnings of $27,558.
| Educational Attainment | Male Income | Female Income |
| Less than High School | $43,156 | $27,558 |
| High School Diploma | $45,395 | $35,271 |
| College or Associate's Degree | $57,160 | $40,897 |
| Bachelor's Degree | $78,225 | $48,807 |
| Graduate Degree | $89,879 | $65,841 |
| Total | $54,343 | $41,084 |
Family Income in Sparks
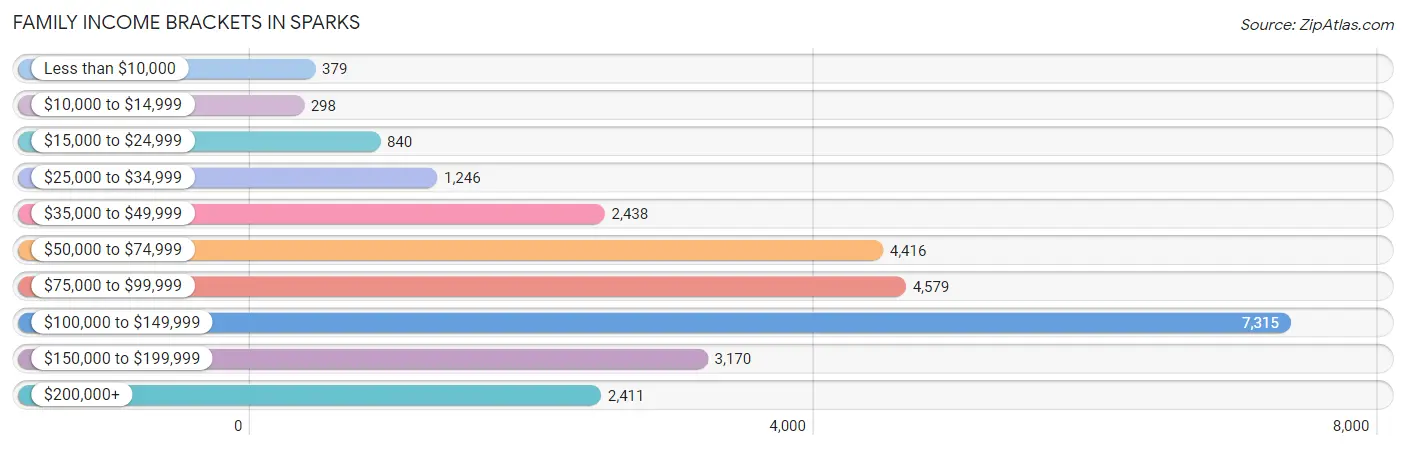
Family Income Brackets in Sparks
According to the Sparks family income data, there are 7,315 families falling into the $100,000 to $149,999 income range, which is the most common income bracket and makes up 27.0% of all families. Conversely, the $10,000 to $14,999 income bracket is the least frequent group with only 298 families (1.1%) belonging to this category.
| Income Bracket | # Families | % Families |
| Less than $10,000 | 379 | 1.4% |
| $10,000 to $14,999 | 298 | 1.1% |
| $15,000 to $24,999 | 840 | 3.1% |
| $25,000 to $34,999 | 1,246 | 4.6% |
| $35,000 to $49,999 | 2,438 | 9.0% |
| $50,000 to $74,999 | 4,416 | 16.3% |
| $75,000 to $99,999 | 4,579 | 16.9% |
| $100,000 to $149,999 | 7,315 | 27.0% |
| $150,000 to $199,999 | 3,170 | 11.7% |
| $200,000+ | 2,411 | 8.9% |
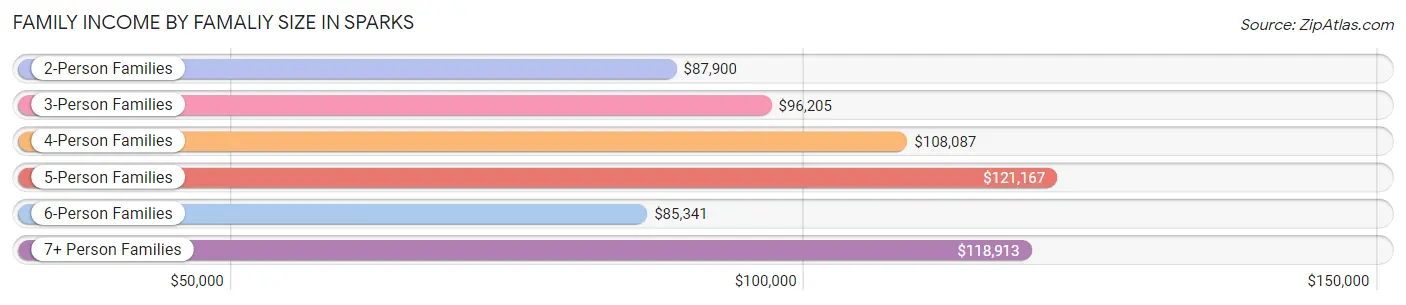
Family Income by Famaliy Size in Sparks
5-person families (2,466 | 9.1%) account for the highest median family income in Sparks with $121,167 per family, while 2-person families (11,652 | 43.0%) have the highest median income of $43,950 per family member.
| Income Bracket | # Families | Median Income |
| 2-Person Families | 11,652 (43.0%) | $87,900 |
| 3-Person Families | 5,895 (21.8%) | $96,205 |
| 4-Person Families | 5,335 (19.7%) | $108,087 |
| 5-Person Families | 2,466 (9.1%) | $121,167 |
| 6-Person Families | 1,085 (4.0%) | $85,341 |
| 7+ Person Families | 660 (2.4%) | $118,913 |
| Total | 27,093 (100.0%) | $95,739 |
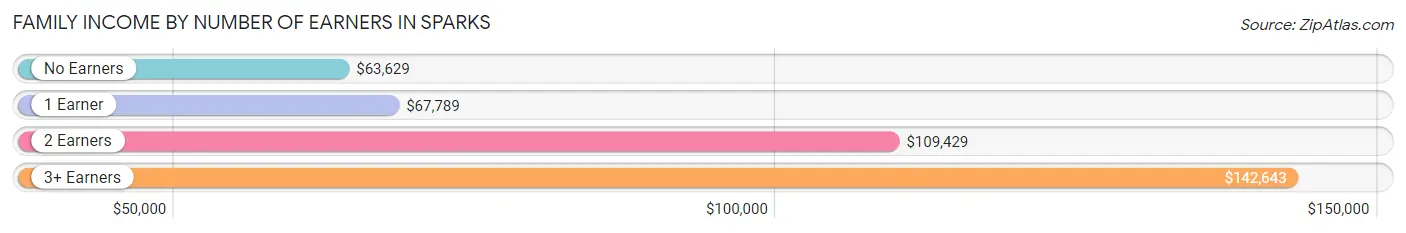
Family Income by Number of Earners in Sparks
The median family income in Sparks is $95,739, with families comprising 3+ earners (4,472) having the highest median family income of $142,643, while families with no earners (3,501) have the lowest median family income of $63,629, accounting for 16.5% and 12.9% of families, respectively.
| Number of Earners | # Families | Median Income |
| No Earners | 3,501 (12.9%) | $63,629 |
| 1 Earner | 8,722 (32.2%) | $67,789 |
| 2 Earners | 10,398 (38.4%) | $109,429 |
| 3+ Earners | 4,472 (16.5%) | $142,643 |
| Total | 27,093 (100.0%) | $95,739 |
Household Income in Sparks
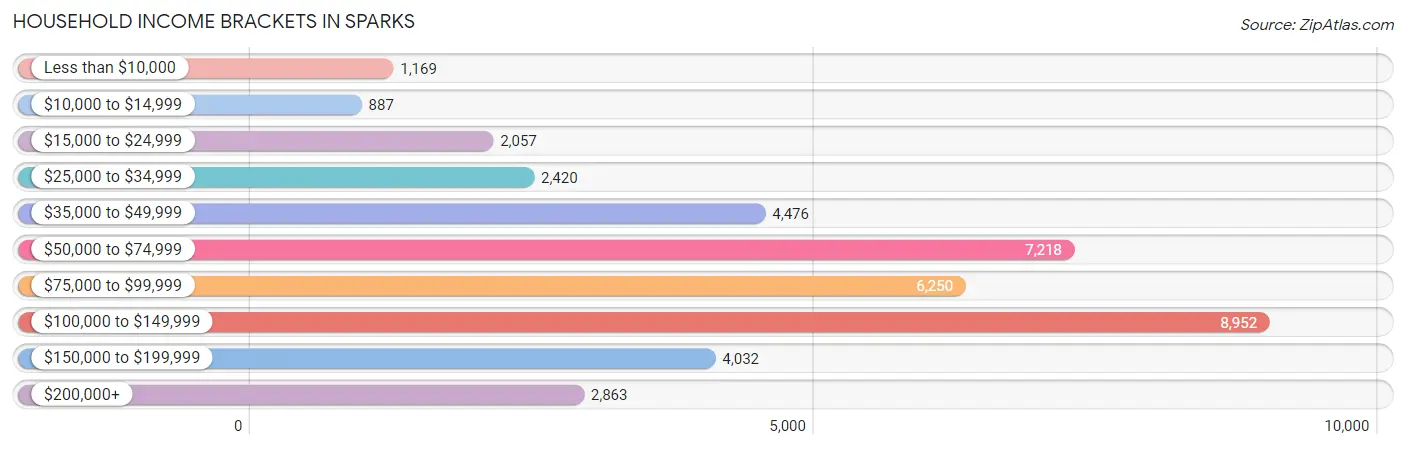
Household Income Brackets in Sparks
With 8,952 households falling in the category, the $100,000 to $149,999 income range is the most frequent in Sparks, accounting for 22.2% of all households. In contrast, only 887 households (2.2%) fall into the $10,000 to $14,999 income bracket, making it the least populous group.
| Income Bracket | # Households | % Households |
| Less than $10,000 | 1,169 | 2.9% |
| $10,000 to $14,999 | 887 | 2.2% |
| $15,000 to $24,999 | 2,057 | 5.1% |
| $25,000 to $34,999 | 2,420 | 6.0% |
| $35,000 to $49,999 | 4,476 | 11.1% |
| $50,000 to $74,999 | 7,218 | 17.9% |
| $75,000 to $99,999 | 6,250 | 15.5% |
| $100,000 to $149,999 | 8,952 | 22.2% |
| $150,000 to $199,999 | 4,032 | 10.0% |
| $200,000+ | 2,863 | 7.1% |
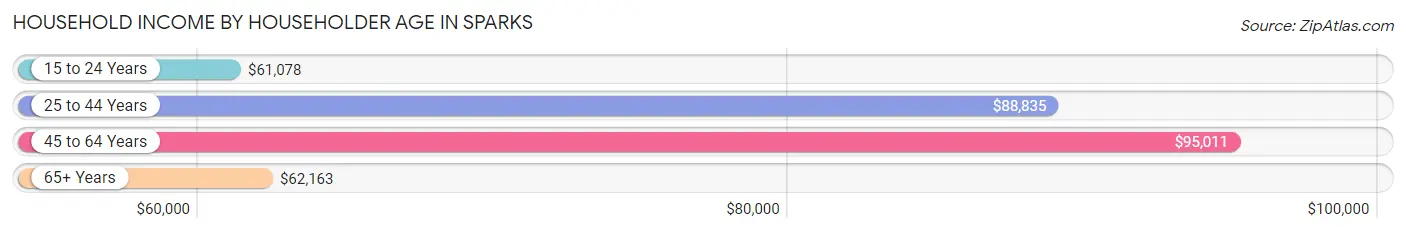
Household Income by Householder Age in Sparks
The median household income in Sparks is $82,938, with the highest median household income of $95,011 found in the 45 to 64 years age bracket for the primary householder. A total of 13,673 households (33.9%) fall into this category. Meanwhile, the 15 to 24 years age bracket for the primary householder has the lowest median household income of $61,078, with 1,873 households (4.6%) in this group.
| Income Bracket | # Households | Median Income |
| 15 to 24 Years | 1,873 (4.6%) | $61,078 |
| 25 to 44 Years | 14,796 (36.7%) | $88,835 |
| 45 to 64 Years | 13,673 (33.9%) | $95,011 |
| 65+ Years | 9,983 (24.8%) | $62,163 |
| Total | 40,325 (100.0%) | $82,938 |
Poverty in Sparks
Income Below Poverty by Sex and Age in Sparks
With 7.6% poverty level for males and 9.4% for females among the residents of Sparks, 12 to 14 year old males and 18 to 24 year old females are the most vulnerable to poverty, with 503 males (22.9%) and 717 females (15.2%) in their respective age groups living below the poverty level.
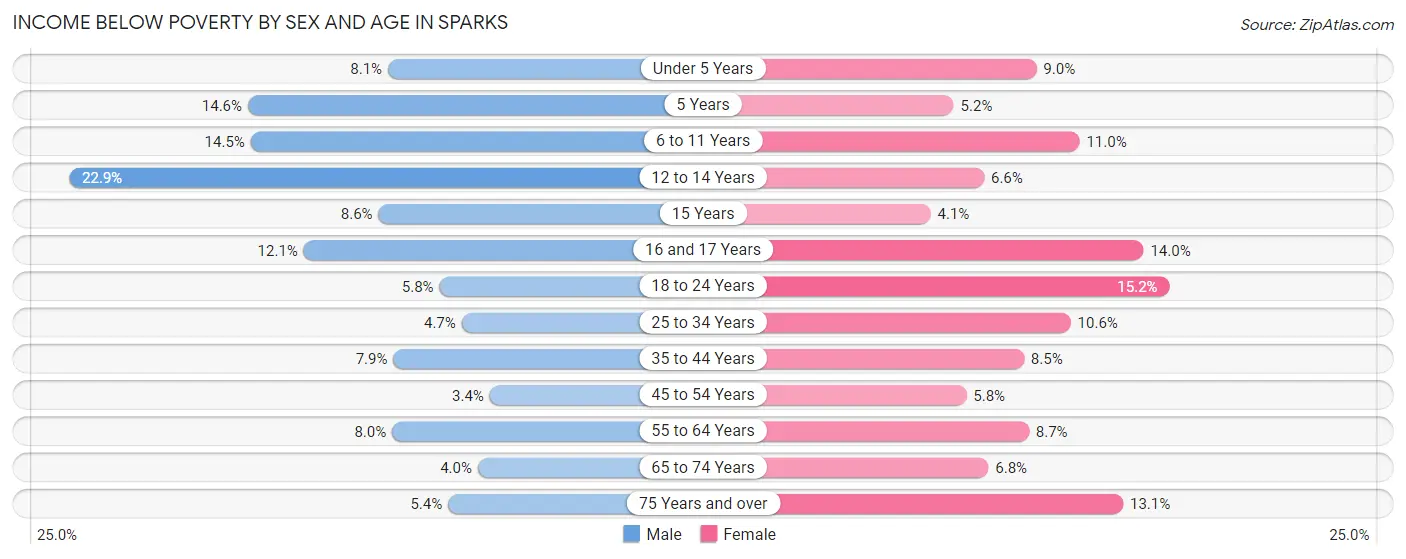
| Age Bracket | Male | Female |
| Under 5 Years | 301 (8.1%) | 253 (9.0%) |
| 5 Years | 165 (14.6%) | 27 (5.2%) |
| 6 to 11 Years | 681 (14.5%) | 426 (11.0%) |
| 12 to 14 Years | 503 (22.9%) | 147 (6.6%) |
| 15 Years | 56 (8.6%) | 18 (4.1%) |
| 16 and 17 Years | 148 (12.0%) | 202 (14.0%) |
| 18 to 24 Years | 308 (5.8%) | 717 (15.2%) |
| 25 to 34 Years | 394 (4.7%) | 811 (10.6%) |
| 35 to 44 Years | 555 (7.9%) | 614 (8.5%) |
| 45 to 54 Years | 254 (3.4%) | 385 (5.8%) |
| 55 to 64 Years | 454 (8.0%) | 496 (8.7%) |
| 65 to 74 Years | 178 (4.0%) | 371 (6.8%) |
| 75 Years and over | 153 (5.3%) | 486 (13.1%) |
| Total | 4,150 (7.6%) | 4,953 (9.4%) |
Income Above Poverty by Sex and Age in Sparks
According to the poverty statistics in Sparks, males aged 45 to 54 years and females aged 15 years are the age groups that are most secure financially, with 96.6% of males and 95.9% of females in these age groups living above the poverty line.
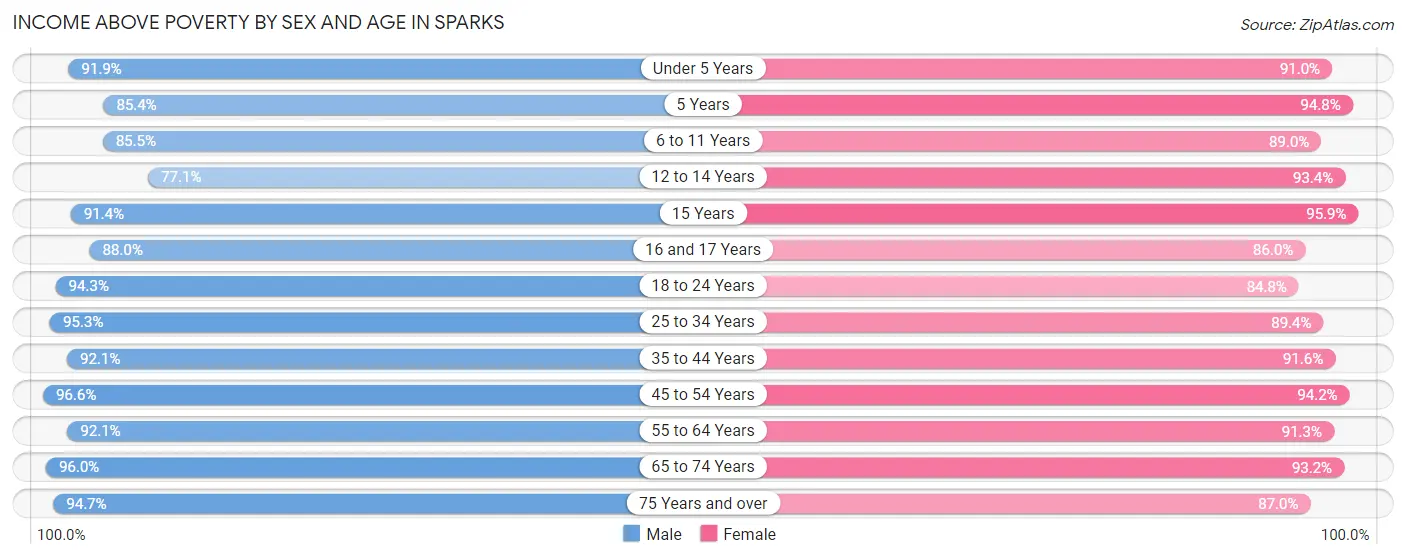
| Age Bracket | Male | Female |
| Under 5 Years | 3,397 (91.9%) | 2,550 (91.0%) |
| 5 Years | 962 (85.4%) | 493 (94.8%) |
| 6 to 11 Years | 4,012 (85.5%) | 3,437 (89.0%) |
| 12 to 14 Years | 1,690 (77.1%) | 2,079 (93.4%) |
| 15 Years | 597 (91.4%) | 419 (95.9%) |
| 16 and 17 Years | 1,080 (87.9%) | 1,241 (86.0%) |
| 18 to 24 Years | 5,045 (94.3%) | 3,999 (84.8%) |
| 25 to 34 Years | 7,957 (95.3%) | 6,824 (89.4%) |
| 35 to 44 Years | 6,480 (92.1%) | 6,650 (91.5%) |
| 45 to 54 Years | 7,165 (96.6%) | 6,275 (94.2%) |
| 55 to 64 Years | 5,257 (92.0%) | 5,221 (91.3%) |
| 65 to 74 Years | 4,311 (96.0%) | 5,086 (93.2%) |
| 75 Years and over | 2,705 (94.7%) | 3,237 (87.0%) |
| Total | 50,658 (92.4%) | 47,511 (90.6%) |
Income Below Poverty Among Married-Couple Families in Sparks
The poverty statistics for married-couple families in Sparks show that 3.8% or 717 of the total 18,809 families live below the poverty line. Families with 5 or more children have the highest poverty rate of 33.3%, comprising of 55 families. On the other hand, families with no children have the lowest poverty rate of 2.6%, which includes 287 families.
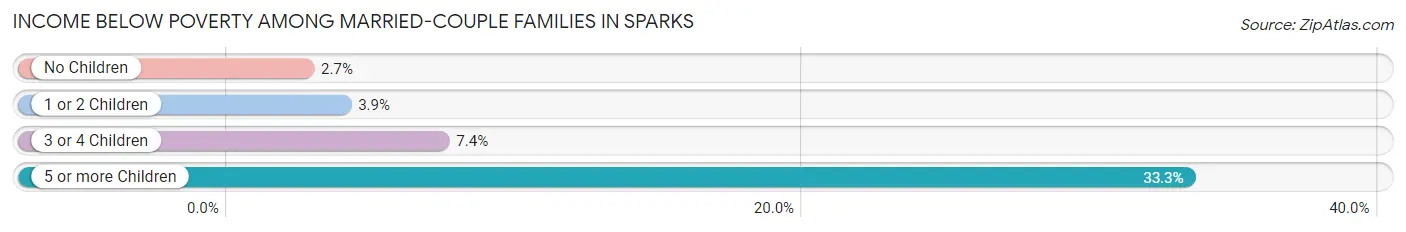
| Children | Above Poverty | Below Poverty |
| No Children | 10,535 (97.4%) | 287 (2.6%) |
| 1 or 2 Children | 5,634 (96.1%) | 231 (3.9%) |
| 3 or 4 Children | 1,813 (92.6%) | 144 (7.4%) |
| 5 or more Children | 110 (66.7%) | 55 (33.3%) |
| Total | 18,092 (96.2%) | 717 (3.8%) |
Income Below Poverty Among Single-Parent Households in Sparks
According to the poverty data in Sparks, 4.0% or 114 single-father households and 14.5% or 788 single-mother households are living below the poverty line. Among single-father households, those with 1 or 2 children have the highest poverty rate, with 93 households (6.2%) experiencing poverty. Likewise, among single-mother households, those with 5 or more children have the highest poverty rate, with 66 households (100.0%) falling below the poverty line.
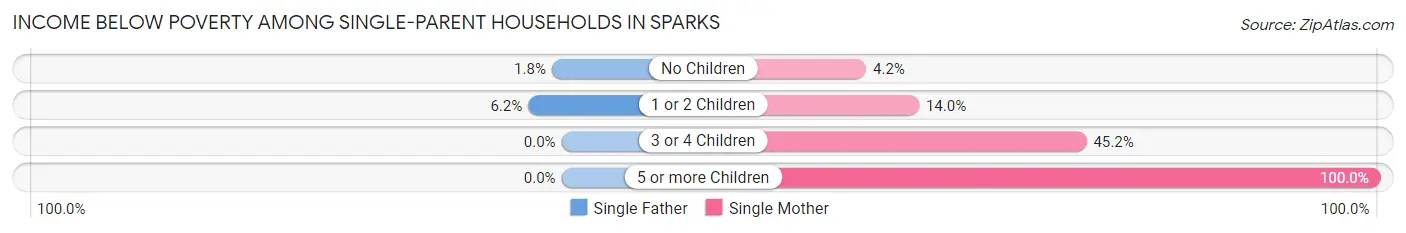
| Children | Single Father | Single Mother |
| No Children | 21 (1.8%) | 84 (4.2%) |
| 1 or 2 Children | 93 (6.2%) | 396 (14.0%) |
| 3 or 4 Children | 0 (0.0%) | 242 (45.2%) |
| 5 or more Children | 0 (0.0%) | 66 (100.0%) |
| Total | 114 (4.0%) | 788 (14.5%) |
Income Below Poverty Among Married-Couple vs Single-Parent Households in Sparks
The poverty data for Sparks shows that 717 of the married-couple family households (3.8%) and 902 of the single-parent households (10.9%) are living below the poverty level. Within the married-couple family households, those with 5 or more children have the highest poverty rate, with 55 households (33.3%) falling below the poverty line. Among the single-parent households, those with 5 or more children have the highest poverty rate, with 66 household (62.9%) living below poverty.
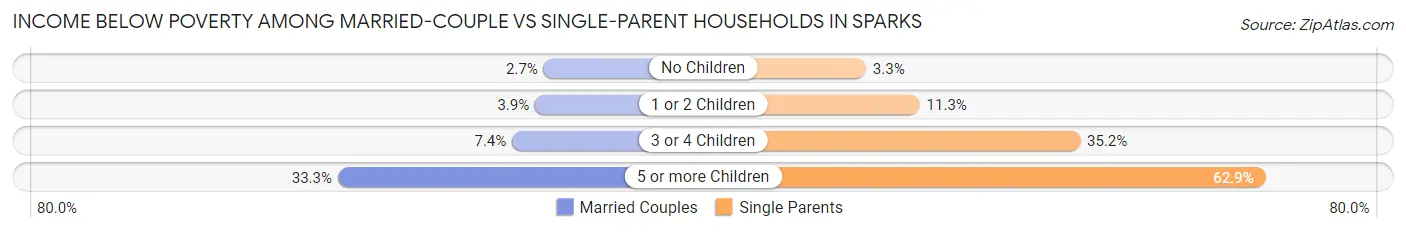
| Children | Married-Couple Families | Single-Parent Households |
| No Children | 287 (2.6%) | 105 (3.3%) |
| 1 or 2 Children | 231 (3.9%) | 489 (11.3%) |
| 3 or 4 Children | 144 (7.4%) | 242 (35.2%) |
| 5 or more Children | 55 (33.3%) | 66 (62.9%) |
| Total | 717 (3.8%) | 902 (10.9%) |
Race in Sparks
The most populous races in Sparks are White / Caucasian (69,792 | 64.6%), Hispanic or Latino (36,930 | 34.2%), and Two or more Races (16,777 | 15.5%).
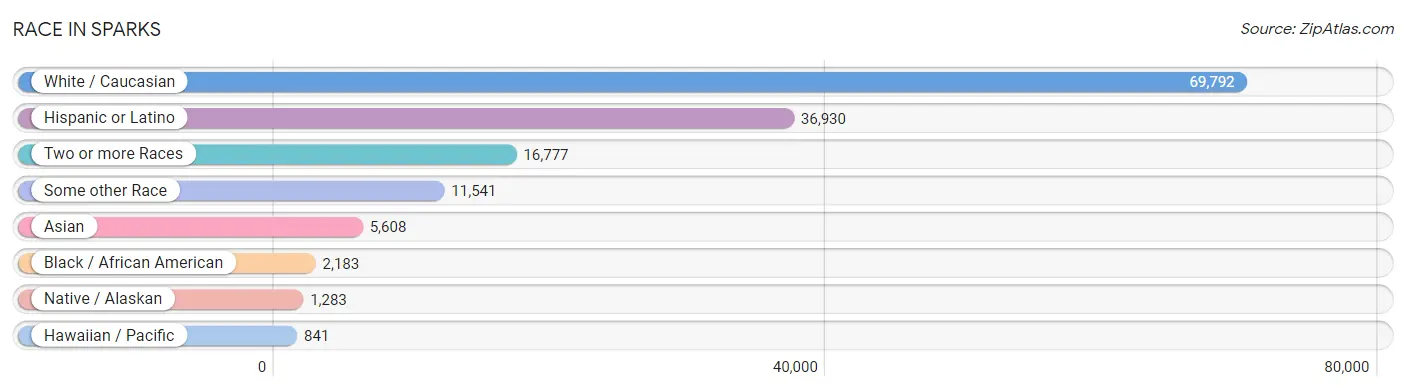
| Race | # Population | % Population |
| Asian | 5,608 | 5.2% |
| Black / African American | 2,183 | 2.0% |
| Hawaiian / Pacific | 841 | 0.8% |
| Hispanic or Latino | 36,930 | 34.2% |
| Native / Alaskan | 1,283 | 1.2% |
| White / Caucasian | 69,792 | 64.6% |
| Two or more Races | 16,777 | 15.5% |
| Some other Race | 11,541 | 10.7% |
| Total | 108,025 | 100.0% |
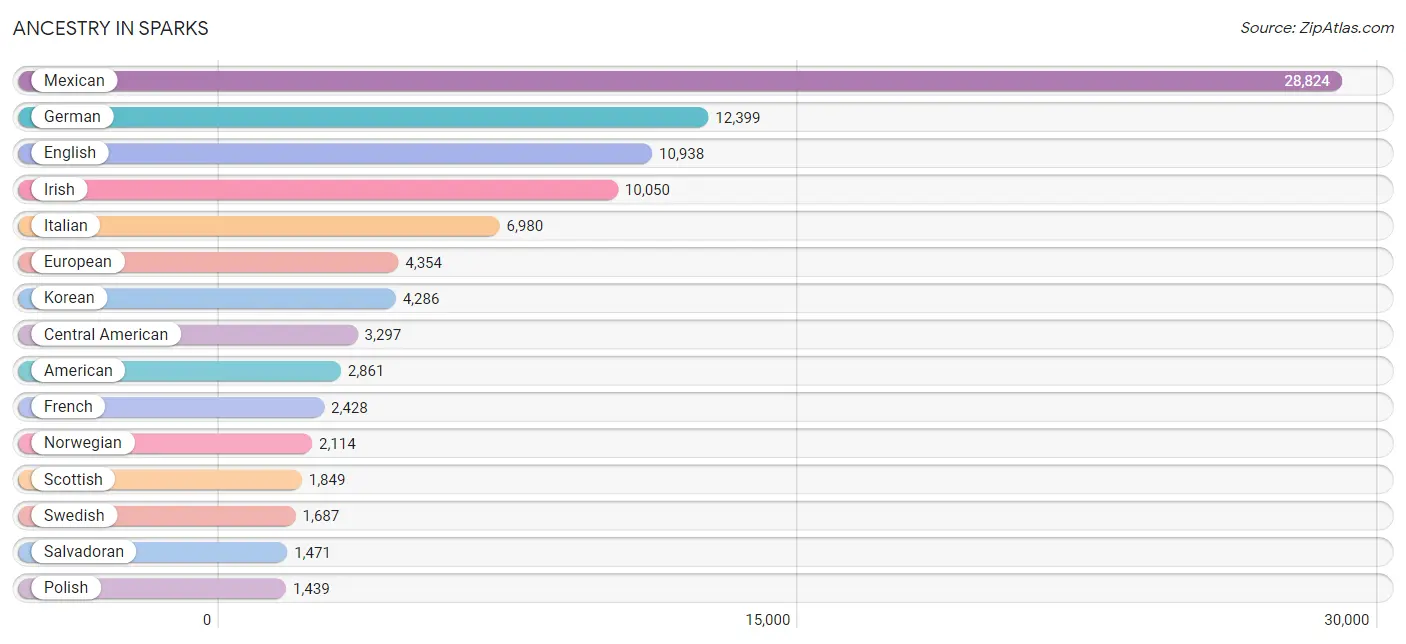
Ancestry in Sparks
The most populous ancestries reported in Sparks are Mexican (28,824 | 26.7%), German (12,399 | 11.5%), English (10,938 | 10.1%), Irish (10,050 | 9.3%), and Italian (6,980 | 6.5%), together accounting for 64.0% of all Sparks residents.
| Ancestry | # Population | % Population |
| African | 128 | 0.1% |
| Alaska Native | 62 | 0.1% |
| Aleut | 22 | 0.0% |
| American | 2,861 | 2.6% |
| Apache | 164 | 0.2% |
| Arab | 379 | 0.4% |
| Arapaho | 9 | 0.0% |
| Argentinean | 56 | 0.1% |
| Armenian | 123 | 0.1% |
| Assyrian / Chaldean / Syriac | 12 | 0.0% |
| Australian | 58 | 0.1% |
| Austrian | 171 | 0.2% |
| Basque | 307 | 0.3% |
| Belgian | 32 | 0.0% |
| Bhutanese | 374 | 0.4% |
| Blackfeet | 14 | 0.0% |
| Bolivian | 11 | 0.0% |
| Brazilian | 31 | 0.0% |
| British | 456 | 0.4% |
| Burmese | 366 | 0.3% |
| Cajun | 28 | 0.0% |
| Canadian | 334 | 0.3% |
| Central American | 3,297 | 3.0% |
| Central American Indian | 10 | 0.0% |
| Cherokee | 404 | 0.4% |
| Cheyenne | 53 | 0.1% |
| Chilean | 31 | 0.0% |
| Chinese | 10 | 0.0% |
| Chippewa | 128 | 0.1% |
| Choctaw | 97 | 0.1% |
| Colombian | 432 | 0.4% |
| Costa Rican | 218 | 0.2% |
| Cree | 12 | 0.0% |
| Creek | 67 | 0.1% |
| Croatian | 270 | 0.3% |
| Cuban | 481 | 0.4% |
| Czech | 323 | 0.3% |
| Czechoslovakian | 120 | 0.1% |
| Danish | 633 | 0.6% |
| Delaware | 22 | 0.0% |
| Dominican | 5 | 0.0% |
| Dutch | 1,213 | 1.1% |
| Eastern European | 142 | 0.1% |
| English | 10,938 | 10.1% |
| Ethiopian | 15 | 0.0% |
| European | 4,354 | 4.0% |
| Filipino | 17 | 0.0% |
| Finnish | 221 | 0.2% |
| French | 2,428 | 2.2% |
| French American Indian | 11 | 0.0% |
| French Canadian | 394 | 0.4% |
| German | 12,399 | 11.5% |
| Ghanaian | 64 | 0.1% |
| Greek | 299 | 0.3% |
| Guamanian / Chamorro | 81 | 0.1% |
| Guatemalan | 1,263 | 1.2% |
| Haitian | 67 | 0.1% |
| Honduran | 21 | 0.0% |
| Hopi | 37 | 0.0% |
| Houma | 9 | 0.0% |
| Hungarian | 171 | 0.2% |
| Indian (Asian) | 1,121 | 1.0% |
| Iranian | 138 | 0.1% |
| Irish | 10,050 | 9.3% |
| Iroquois | 14 | 0.0% |
| Italian | 6,980 | 6.5% |
| Japanese | 24 | 0.0% |
| Korean | 4,286 | 4.0% |
| Latvian | 51 | 0.1% |
| Lebanese | 58 | 0.1% |
| Lithuanian | 191 | 0.2% |
| Mexican | 28,824 | 26.7% |
| Mexican American Indian | 1,074 | 1.0% |
| Mongolian | 12 | 0.0% |
| Native Hawaiian | 335 | 0.3% |
| Navajo | 106 | 0.1% |
| Nicaraguan | 288 | 0.3% |
| Nigerian | 416 | 0.4% |
| Northern European | 753 | 0.7% |
| Norwegian | 2,114 | 2.0% |
| Okinawan | 9 | 0.0% |
| Paiute | 265 | 0.3% |
| Pakistani | 151 | 0.1% |
| Panamanian | 30 | 0.0% |
| Peruvian | 90 | 0.1% |
| Polish | 1,439 | 1.3% |
| Portuguese | 721 | 0.7% |
| Pueblo | 18 | 0.0% |
| Puerto Rican | 1,159 | 1.1% |
| Romanian | 62 | 0.1% |
| Russian | 516 | 0.5% |
| Salvadoran | 1,471 | 1.4% |
| Samoan | 613 | 0.6% |
| Scandinavian | 625 | 0.6% |
| Scotch-Irish | 881 | 0.8% |
| Scottish | 1,849 | 1.7% |
| Seminole | 146 | 0.1% |
| Serbian | 18 | 0.0% |
| Shoshone | 43 | 0.0% |
| Sioux | 97 | 0.1% |
| Slavic | 42 | 0.0% |
| Slovak | 36 | 0.0% |
| Slovene | 24 | 0.0% |
| South African | 16 | 0.0% |
| South American | 1,042 | 1.0% |
| South American Indian | 8 | 0.0% |
| Spaniard | 236 | 0.2% |
| Spanish | 639 | 0.6% |
| Sri Lankan | 483 | 0.4% |
| Subsaharan African | 680 | 0.6% |
| Swedish | 1,687 | 1.6% |
| Swiss | 416 | 0.4% |
| Thai | 512 | 0.5% |
| Tlingit-Haida | 17 | 0.0% |
| Tongan | 241 | 0.2% |
| Turkish | 22 | 0.0% |
| Ukrainian | 184 | 0.2% |
| Uruguayan | 401 | 0.4% |
| Venezuelan | 21 | 0.0% |
| Welsh | 610 | 0.6% |
| Yaqui | 34 | 0.0% |
| Yugoslavian | 79 | 0.1% | View All 122 Rows |
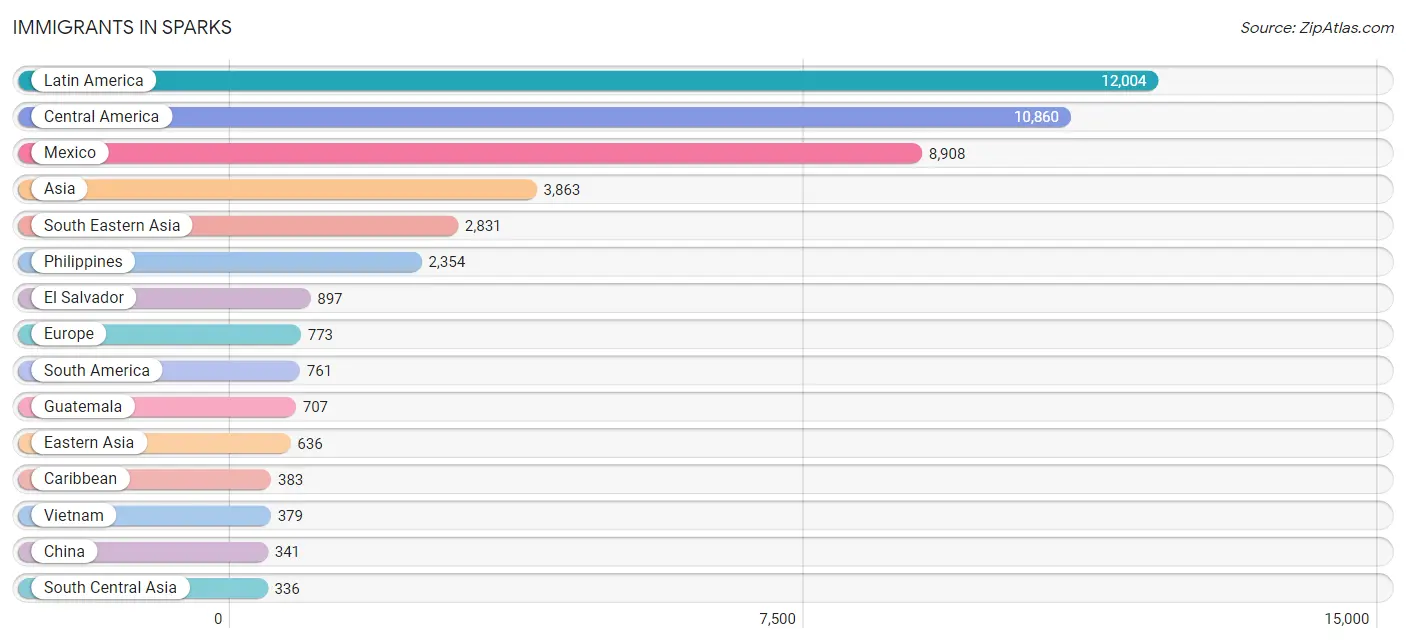
Immigrants in Sparks
The most numerous immigrant groups reported in Sparks came from Latin America (12,004 | 11.1%), Central America (10,860 | 10.1%), Mexico (8,908 | 8.3%), Asia (3,863 | 3.6%), and South Eastern Asia (2,831 | 2.6%), together accounting for 35.6% of all Sparks residents.
| Immigration Origin | # Population | % Population |
| Africa | 317 | 0.3% |
| Argentina | 38 | 0.0% |
| Asia | 3,863 | 3.6% |
| Belarus | 26 | 0.0% |
| Belgium | 10 | 0.0% |
| Bolivia | 11 | 0.0% |
| Brazil | 8 | 0.0% |
| Cambodia | 11 | 0.0% |
| Cameroon | 35 | 0.0% |
| Canada | 289 | 0.3% |
| Caribbean | 383 | 0.4% |
| Central America | 10,860 | 10.1% |
| Chile | 10 | 0.0% |
| China | 341 | 0.3% |
| Colombia | 246 | 0.2% |
| Costa Rica | 171 | 0.2% |
| Cuba | 296 | 0.3% |
| Czechoslovakia | 9 | 0.0% |
| Denmark | 5 | 0.0% |
| Eastern Africa | 100 | 0.1% |
| Eastern Asia | 636 | 0.6% |
| Eastern Europe | 318 | 0.3% |
| El Salvador | 897 | 0.8% |
| England | 141 | 0.1% |
| Ethiopia | 36 | 0.0% |
| Europe | 773 | 0.7% |
| France | 24 | 0.0% |
| Germany | 143 | 0.1% |
| Ghana | 43 | 0.0% |
| Guatemala | 707 | 0.6% |
| Haiti | 87 | 0.1% |
| Honduras | 16 | 0.0% |
| Hong Kong | 57 | 0.1% |
| India | 253 | 0.2% |
| Iran | 64 | 0.1% |
| Ireland | 80 | 0.1% |
| Japan | 59 | 0.1% |
| Korea | 236 | 0.2% |
| Latin America | 12,004 | 11.1% |
| Latvia | 13 | 0.0% |
| Mexico | 8,908 | 8.3% |
| Middle Africa | 35 | 0.0% |
| Nicaragua | 147 | 0.1% |
| Nigeria | 49 | 0.1% |
| Northern Africa | 9 | 0.0% |
| Northern Europe | 278 | 0.3% |
| Oceania | 65 | 0.1% |
| Pakistan | 8 | 0.0% |
| Panama | 14 | 0.0% |
| Peru | 76 | 0.1% |
| Philippines | 2,354 | 2.2% |
| Poland | 36 | 0.0% |
| Romania | 54 | 0.1% |
| Russia | 45 | 0.0% |
| Scotland | 17 | 0.0% |
| Singapore | 14 | 0.0% |
| Somalia | 53 | 0.1% |
| South Africa | 22 | 0.0% |
| South America | 761 | 0.7% |
| South Central Asia | 336 | 0.3% |
| South Eastern Asia | 2,831 | 2.6% |
| Sri Lanka | 11 | 0.0% |
| Taiwan | 69 | 0.1% |
| Thailand | 73 | 0.1% |
| Turkey | 11 | 0.0% |
| Ukraine | 135 | 0.1% |
| Uruguay | 307 | 0.3% |
| Venezuela | 65 | 0.1% |
| Vietnam | 379 | 0.4% |
| Western Africa | 151 | 0.1% |
| Western Asia | 60 | 0.1% |
| Western Europe | 177 | 0.2% | View All 72 Rows |
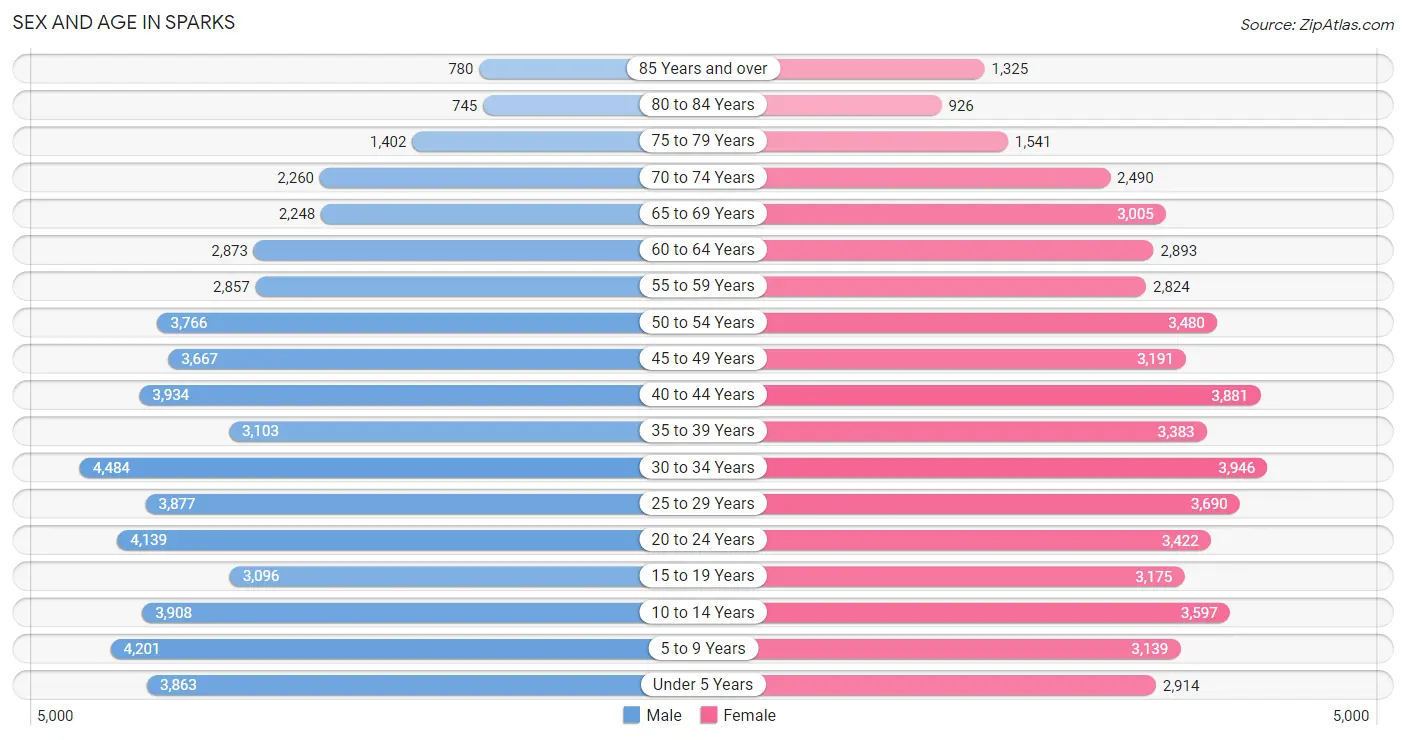
Sex and Age in Sparks
Sex and Age in Sparks
The most populous age groups in Sparks are 30 to 34 Years (4,484 | 8.1%) for men and 30 to 34 Years (3,946 | 7.5%) for women.
| Age Bracket | Male | Female |
| Under 5 Years | 3,863 (7.0%) | 2,914 (5.5%) |
| 5 to 9 Years | 4,201 (7.6%) | 3,139 (5.9%) |
| 10 to 14 Years | 3,908 (7.1%) | 3,597 (6.8%) |
| 15 to 19 Years | 3,096 (5.6%) | 3,175 (6.0%) |
| 20 to 24 Years | 4,139 (7.5%) | 3,422 (6.5%) |
| 25 to 29 Years | 3,877 (7.0%) | 3,690 (7.0%) |
| 30 to 34 Years | 4,484 (8.1%) | 3,946 (7.5%) |
| 35 to 39 Years | 3,103 (5.6%) | 3,383 (6.4%) |
| 40 to 44 Years | 3,934 (7.1%) | 3,881 (7.3%) |
| 45 to 49 Years | 3,667 (6.6%) | 3,191 (6.0%) |
| 50 to 54 Years | 3,766 (6.8%) | 3,480 (6.6%) |
| 55 to 59 Years | 2,857 (5.2%) | 2,824 (5.3%) |
| 60 to 64 Years | 2,873 (5.2%) | 2,893 (5.5%) |
| 65 to 69 Years | 2,248 (4.1%) | 3,005 (5.7%) |
| 70 to 74 Years | 2,260 (4.1%) | 2,490 (4.7%) |
| 75 to 79 Years | 1,402 (2.5%) | 1,541 (2.9%) |
| 80 to 84 Years | 745 (1.3%) | 926 (1.8%) |
| 85 Years and over | 780 (1.4%) | 1,325 (2.5%) |
| Total | 55,203 (100.0%) | 52,822 (100.0%) |
Families and Households in Sparks
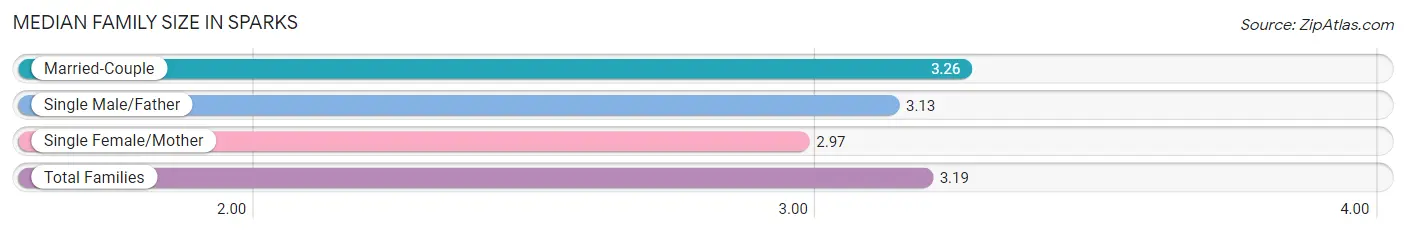
Median Family Size in Sparks
The median family size in Sparks is 3.19 persons per family, with married-couple families (18,809 | 69.4%) accounting for the largest median family size of 3.26 persons per family. On the other hand, single female/mother families (5,440 | 20.1%) represent the smallest median family size with 2.97 persons per family.
| Family Type | # Families | Family Size |
| Married-Couple | 18,809 (69.4%) | 3.26 |
| Single Male/Father | 2,844 (10.5%) | 3.13 |
| Single Female/Mother | 5,440 (20.1%) | 2.97 |
| Total Families | 27,093 (100.0%) | 3.19 |
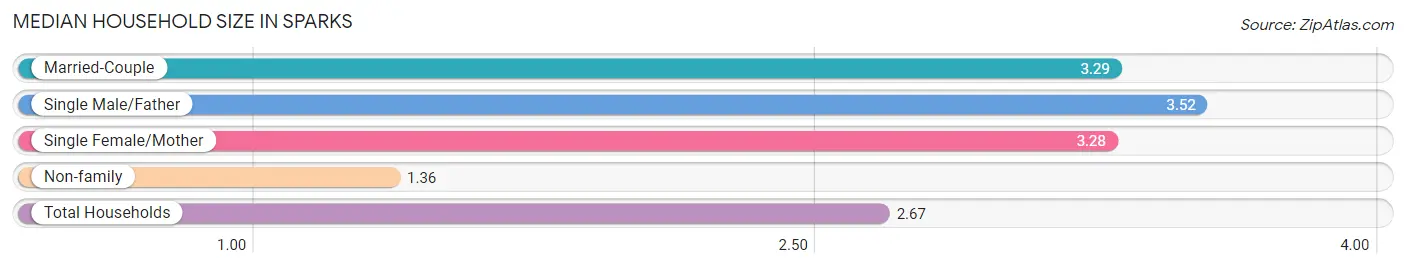
Median Household Size in Sparks
The median household size in Sparks is 2.67 persons per household, with single male/father households (2,844 | 7.0%) accounting for the largest median household size of 3.52 persons per household. non-family households (13,232 | 32.8%) represent the smallest median household size with 1.36 persons per household.
| Household Type | # Households | Household Size |
| Married-Couple | 18,809 (46.6%) | 3.29 |
| Single Male/Father | 2,844 (7.0%) | 3.52 |
| Single Female/Mother | 5,440 (13.5%) | 3.28 |
| Non-family | 13,232 (32.8%) | 1.36 |
| Total Households | 40,325 (100.0%) | 2.67 |
Household Size by Marriage Status in Sparks
Out of a total of 40,325 households in Sparks, 27,093 (67.2%) are family households, while 13,232 (32.8%) are nonfamily households. The most numerous type of family households are 2-person households, comprising 10,513, and the most common type of nonfamily households are 1-person households, comprising 10,026.
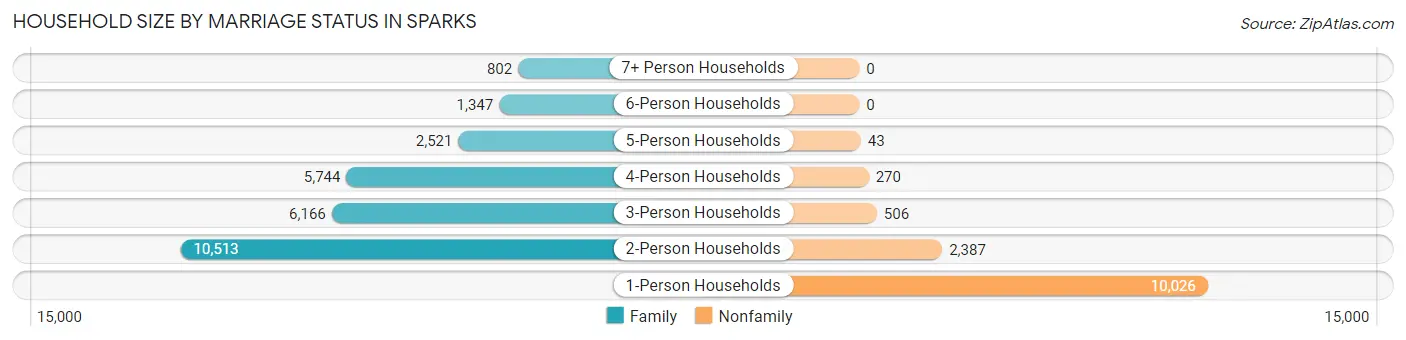
| Household Size | Family Households | Nonfamily Households |
| 1-Person Households | - | 10,026 (24.9%) |
| 2-Person Households | 10,513 (26.1%) | 2,387 (5.9%) |
| 3-Person Households | 6,166 (15.3%) | 506 (1.3%) |
| 4-Person Households | 5,744 (14.2%) | 270 (0.7%) |
| 5-Person Households | 2,521 (6.2%) | 43 (0.1%) |
| 6-Person Households | 1,347 (3.3%) | 0 (0.0%) |
| 7+ Person Households | 802 (2.0%) | 0 (0.0%) |
| Total | 27,093 (67.2%) | 13,232 (32.8%) |
Female Fertility in Sparks
Fertility by Age in Sparks
Average fertility rate in Sparks is 63.0 births per 1,000 women. Women in the age bracket of 20 to 34 years have the highest fertility rate with 95.0 births per 1,000 women. Women in the age bracket of 20 to 34 years acount for 65.5% of all women with births.
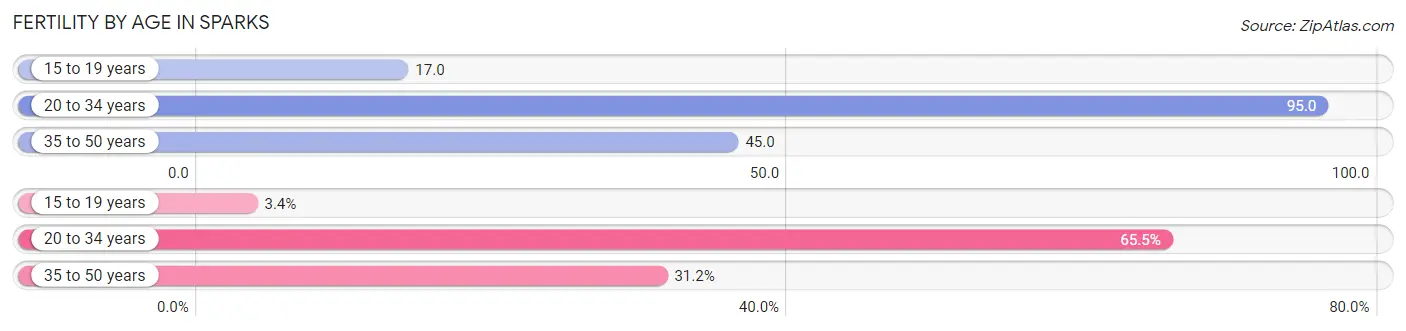
| Age Bracket | Women with Births | Births / 1,000 Women |
| 15 to 19 years | 54 (3.4%) | 17.0 |
| 20 to 34 years | 1,052 (65.5%) | 95.0 |
| 35 to 50 years | 501 (31.2%) | 45.0 |
| Total | 1,607 (100.0%) | 63.0 |
Fertility by Age by Marriage Status in Sparks
51.3% of women with births (1,607) in Sparks are married. The highest percentage of unmarried women with births falls into 15 to 19 years age bracket with 100.0% of them unmarried at the time of birth, while the lowest percentage of unmarried women with births belong to 35 to 50 years age bracket with 22.4% of them unmarried.
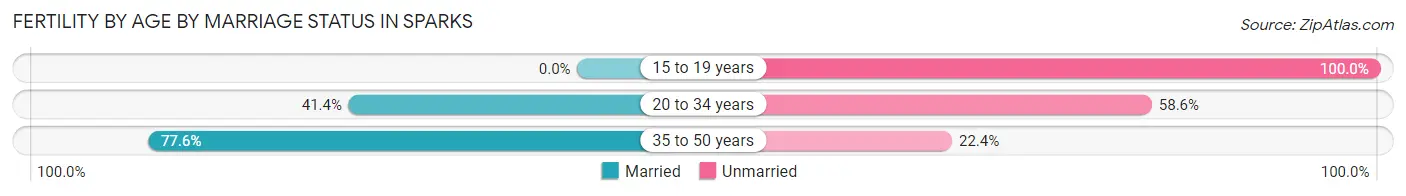
| Age Bracket | Married | Unmarried |
| 15 to 19 years | 0 (0.0%) | 54 (100.0%) |
| 20 to 34 years | 436 (41.4%) | 616 (58.6%) |
| 35 to 50 years | 389 (77.6%) | 112 (22.4%) |
| Total | 824 (51.3%) | 783 (48.7%) |
Fertility by Education in Sparks
Average fertility rate in Sparks is 63.0 births per 1,000 women. Women with the education attainment of graduate degree have the highest fertility rate of 92.0 births per 1,000 women, while women with the education attainment of less than high school have the lowest fertility at 41.0 births per 1,000 women. Women with the education attainment of college or associate's degree represent 36.8% of all women with births.
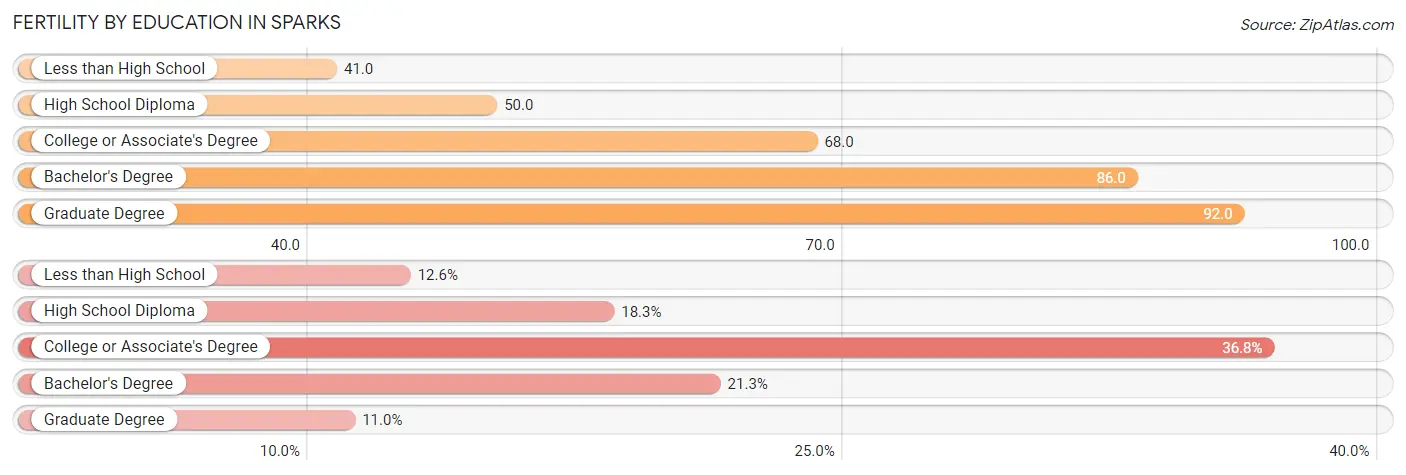
| Educational Attainment | Women with Births | Births / 1,000 Women |
| Less than High School | 202 (12.6%) | 41.0 |
| High School Diploma | 294 (18.3%) | 50.0 |
| College or Associate's Degree | 592 (36.8%) | 68.0 |
| Bachelor's Degree | 342 (21.3%) | 86.0 |
| Graduate Degree | 177 (11.0%) | 92.0 |
| Total | 1,607 (100.0%) | 63.0 |
Fertility by Education by Marriage Status in Sparks
48.7% of women with births in Sparks are unmarried. Women with the educational attainment of graduate degree are most likely to be married with 93.8% of them married at childbirth, while women with the educational attainment of high school diploma are least likely to be married with 67.0% of them unmarried at childbirth.
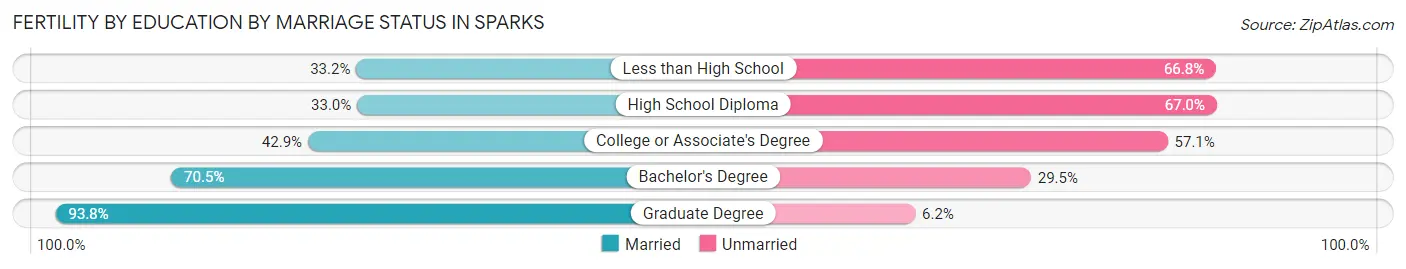
| Educational Attainment | Married | Unmarried |
| Less than High School | 67 (33.2%) | 135 (66.8%) |
| High School Diploma | 97 (33.0%) | 197 (67.0%) |
| College or Associate's Degree | 254 (42.9%) | 338 (57.1%) |
| Bachelor's Degree | 241 (70.5%) | 101 (29.5%) |
| Graduate Degree | 166 (93.8%) | 11 (6.2%) |
| Total | 824 (51.3%) | 783 (48.7%) |
Employment Characteristics in Sparks
Employment by Class of Employer in Sparks
Among the 53,689 employed individuals in Sparks, private company employees (40,084 | 74.7%), local government employees (3,714 | 6.9%), and not-for-profit organizations (2,857 | 5.3%) make up the most common classes of employment.
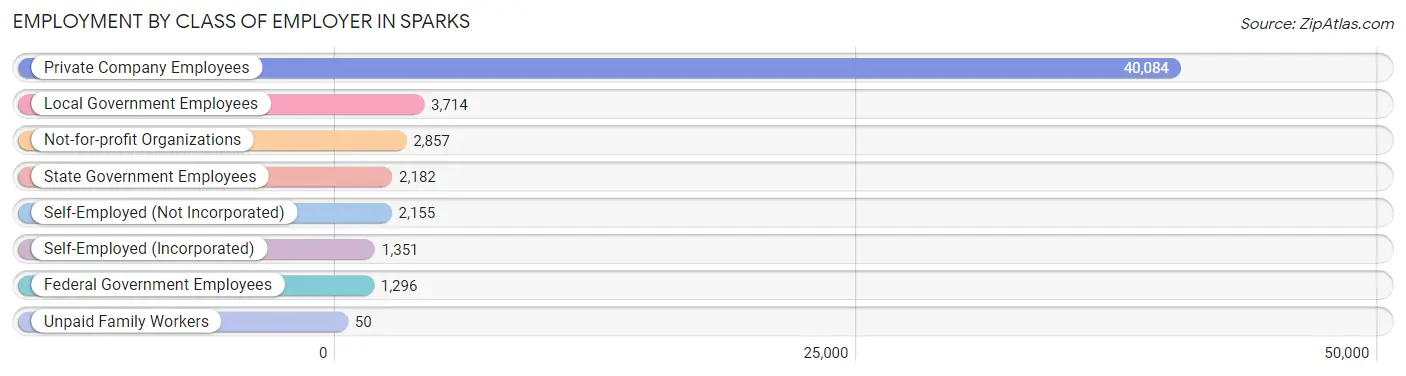
| Employer Class | # Employees | % Employees |
| Private Company Employees | 40,084 | 74.7% |
| Self-Employed (Incorporated) | 1,351 | 2.5% |
| Self-Employed (Not Incorporated) | 2,155 | 4.0% |
| Not-for-profit Organizations | 2,857 | 5.3% |
| Local Government Employees | 3,714 | 6.9% |
| State Government Employees | 2,182 | 4.1% |
| Federal Government Employees | 1,296 | 2.4% |
| Unpaid Family Workers | 50 | 0.1% |
| Total | 53,689 | 100.0% |
Employment Status by Age in Sparks
According to the labor force statistics for Sparks, out of the total population over 16 years of age (85,312), 68.2% or 58,183 individuals are in the labor force, with 6.1% or 3,549 of them unemployed. The age group with the highest labor force participation rate is 25 to 29 years, with 90.9% or 6,878 individuals in the labor force. Within the labor force, the 16 to 19 years age range has the highest percentage of unemployed individuals, with 22.8% or 628 of them being unemployed.
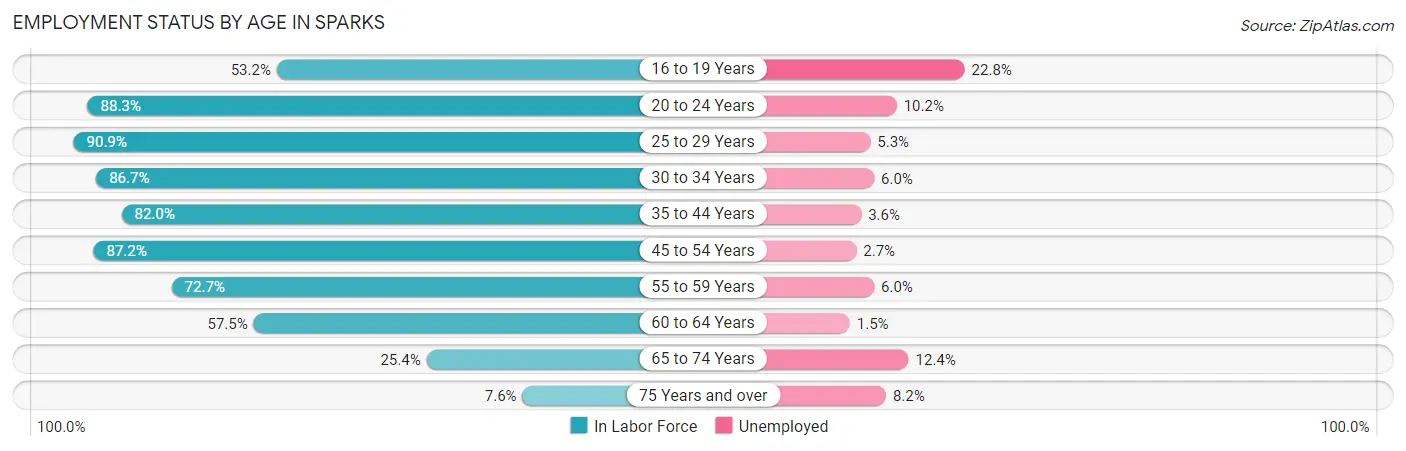
| Age Bracket | In Labor Force | Unemployed |
| 16 to 19 Years | 2,756 (53.2%) | 628 (22.8%) |
| 20 to 24 Years | 6,676 (88.3%) | 681 (10.2%) |
| 25 to 29 Years | 6,878 (90.9%) | 365 (5.3%) |
| 30 to 34 Years | 7,309 (86.7%) | 439 (6.0%) |
| 35 to 44 Years | 11,727 (82.0%) | 422 (3.6%) |
| 45 to 54 Years | 12,299 (87.2%) | 332 (2.7%) |
| 55 to 59 Years | 4,130 (72.7%) | 248 (6.0%) |
| 60 to 64 Years | 3,315 (57.5%) | 50 (1.5%) |
| 65 to 74 Years | 2,541 (25.4%) | 315 (12.4%) |
| 75 Years and over | 511 (7.6%) | 42 (8.2%) |
| Total | 58,183 (68.2%) | 3,549 (6.1%) |
Employment Status by Educational Attainment in Sparks
According to labor force statistics for Sparks, 81.8% of individuals (45,684) out of the total population between 25 and 64 years of age (55,849) are in the labor force, with 4.1% or 1,873 of them being unemployed. The group with the highest labor force participation rate are those with the educational attainment of bachelor's degree or higher, with 85.9% or 12,181 individuals in the labor force. Within the labor force, individuals with less than high school education have the highest percentage of unemployment, with 8.0% or 498 of them being unemployed.
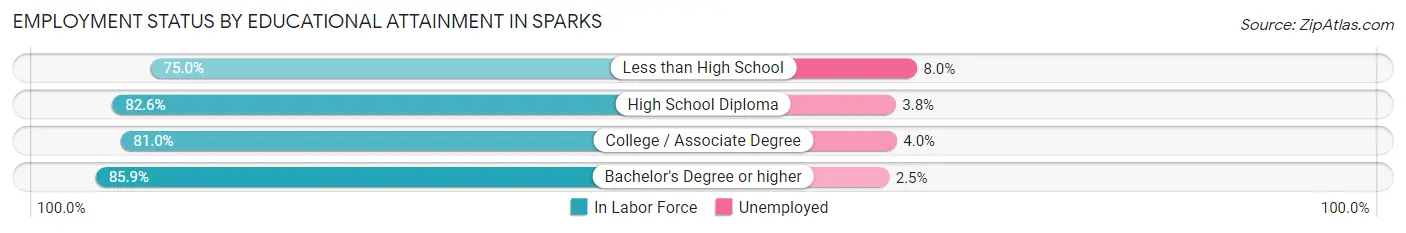
| Educational Attainment | In Labor Force | Unemployed |
| Less than High School | 6,225 (75.0%) | 664 (8.0%) |
| High School Diploma | 12,245 (82.6%) | 563 (3.8%) |
| College / Associate Degree | 15,021 (81.0%) | 742 (4.0%) |
| Bachelor's Degree or higher | 12,181 (85.9%) | 354 (2.5%) |
| Total | 45,684 (81.8%) | 2,290 (4.1%) |
Employment Occupations by Sex in Sparks
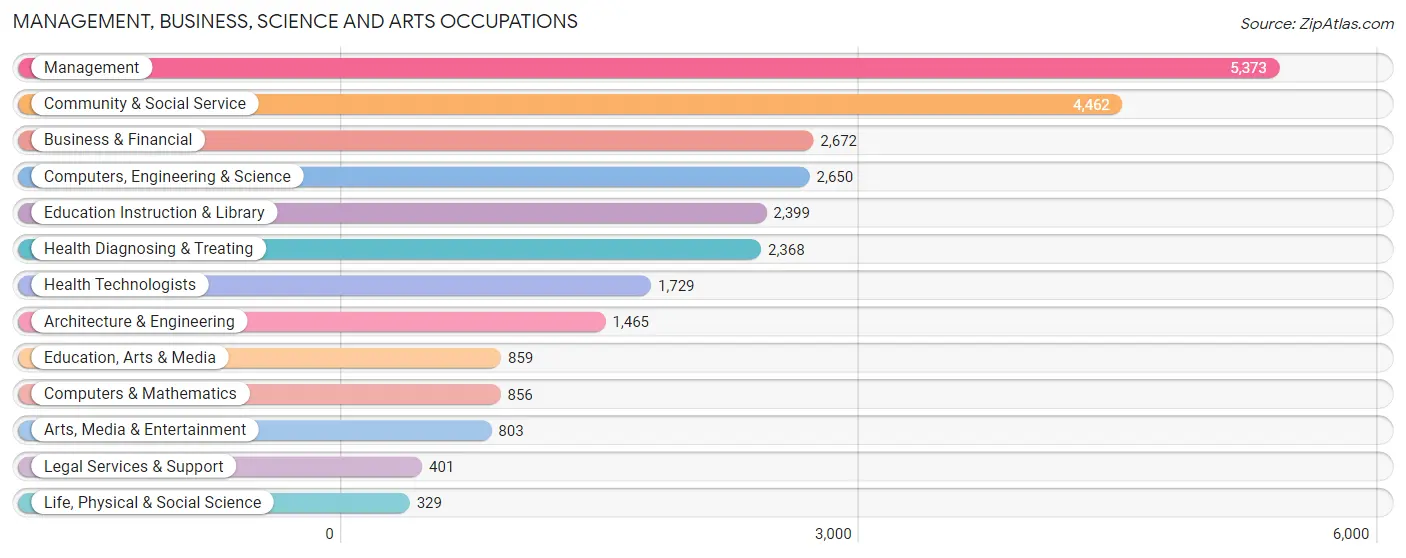
Management, Business, Science and Arts Occupations
The most common Management, Business, Science and Arts occupations in Sparks are Management (5,373 | 9.9%), Community & Social Service (4,462 | 8.2%), Business & Financial (2,672 | 4.9%), Computers, Engineering & Science (2,650 | 4.9%), and Education Instruction & Library (2,399 | 4.4%).
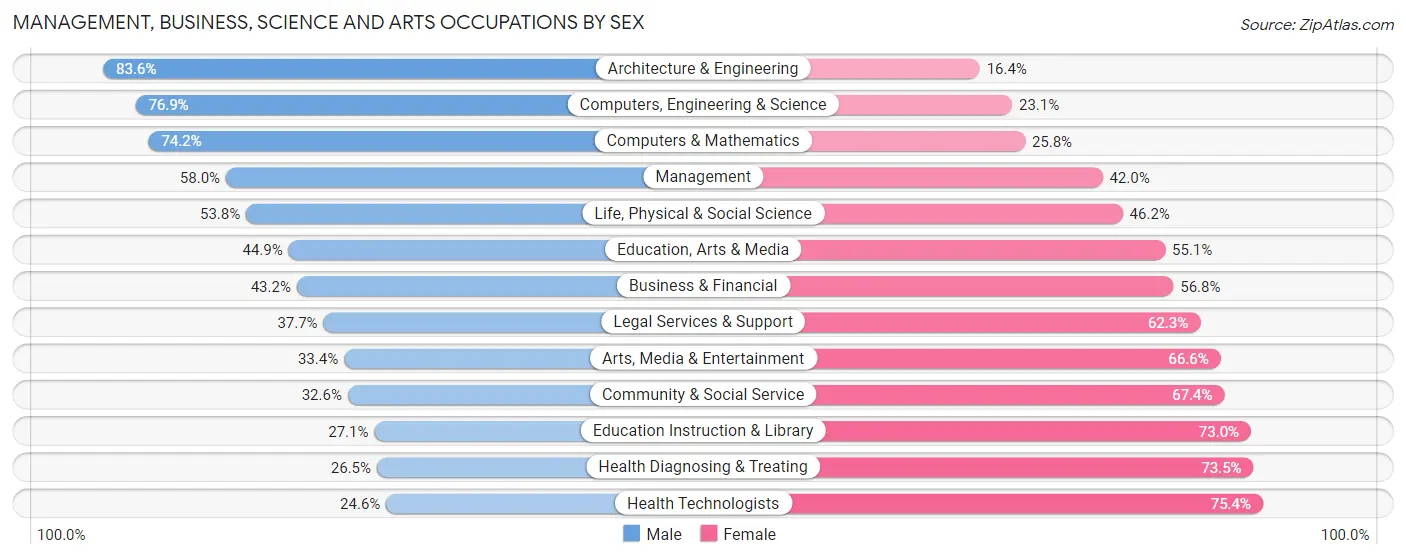
Management, Business, Science and Arts Occupations by Sex
Within the Management, Business, Science and Arts occupations in Sparks, the most male-oriented occupations are Architecture & Engineering (83.6%), Computers, Engineering & Science (76.9%), and Computers & Mathematics (74.2%), while the most female-oriented occupations are Health Technologists (75.4%), Health Diagnosing & Treating (73.5%), and Education Instruction & Library (73.0%).
| Occupation | Male | Female |
| Management | 3,117 (58.0%) | 2,256 (42.0%) |
| Business & Financial | 1,155 (43.2%) | 1,517 (56.8%) |
| Computers, Engineering & Science | 2,037 (76.9%) | 613 (23.1%) |
| Computers & Mathematics | 635 (74.2%) | 221 (25.8%) |
| Architecture & Engineering | 1,225 (83.6%) | 240 (16.4%) |
| Life, Physical & Social Science | 177 (53.8%) | 152 (46.2%) |
| Community & Social Service | 1,454 (32.6%) | 3,008 (67.4%) |
| Education, Arts & Media | 386 (44.9%) | 473 (55.1%) |
| Legal Services & Support | 151 (37.7%) | 250 (62.3%) |
| Education Instruction & Library | 649 (27.1%) | 1,750 (73.0%) |
| Arts, Media & Entertainment | 268 (33.4%) | 535 (66.6%) |
| Health Diagnosing & Treating | 628 (26.5%) | 1,740 (73.5%) |
| Health Technologists | 425 (24.6%) | 1,304 (75.4%) |
| Total (Category) | 8,391 (47.9%) | 9,134 (52.1%) |
| Total (Overall) | 29,800 (54.7%) | 24,667 (45.3%) |
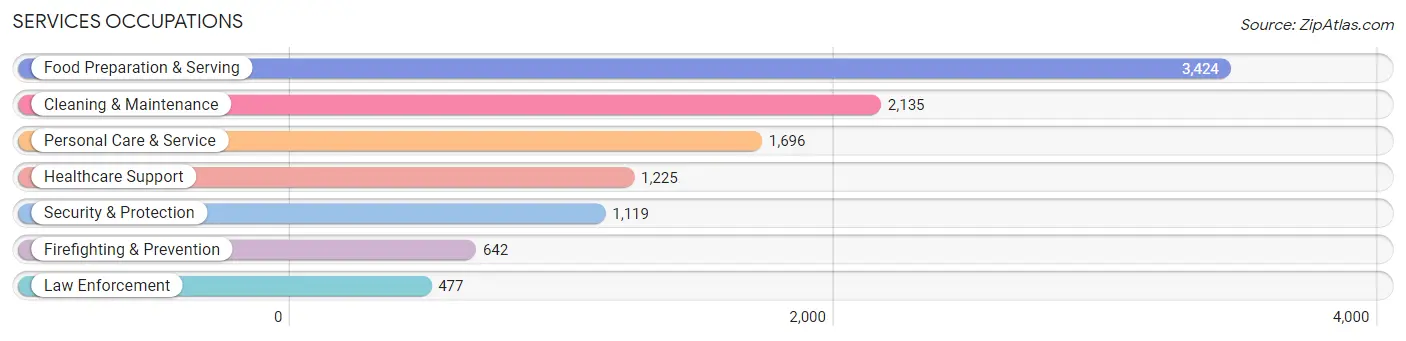
Services Occupations
The most common Services occupations in Sparks are Food Preparation & Serving (3,424 | 6.3%), Cleaning & Maintenance (2,135 | 3.9%), Personal Care & Service (1,696 | 3.1%), Healthcare Support (1,225 | 2.2%), and Security & Protection (1,119 | 2.1%).
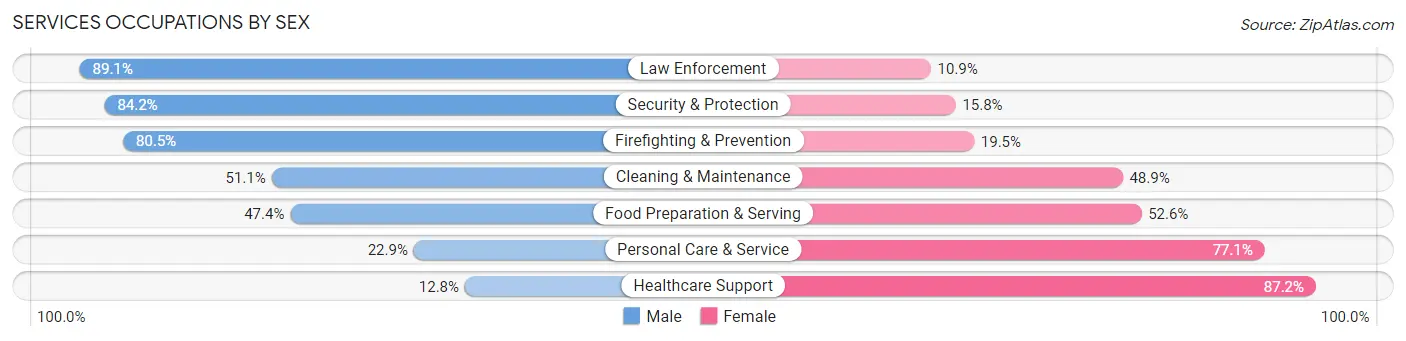
Services Occupations by Sex
Within the Services occupations in Sparks, the most male-oriented occupations are Law Enforcement (89.1%), Security & Protection (84.2%), and Firefighting & Prevention (80.5%), while the most female-oriented occupations are Healthcare Support (87.2%), Personal Care & Service (77.1%), and Food Preparation & Serving (52.6%).
| Occupation | Male | Female |
| Healthcare Support | 157 (12.8%) | 1,068 (87.2%) |
| Security & Protection | 942 (84.2%) | 177 (15.8%) |
| Firefighting & Prevention | 517 (80.5%) | 125 (19.5%) |
| Law Enforcement | 425 (89.1%) | 52 (10.9%) |
| Food Preparation & Serving | 1,623 (47.4%) | 1,801 (52.6%) |
| Cleaning & Maintenance | 1,091 (51.1%) | 1,044 (48.9%) |
| Personal Care & Service | 389 (22.9%) | 1,307 (77.1%) |
| Total (Category) | 4,202 (43.8%) | 5,397 (56.2%) |
| Total (Overall) | 29,800 (54.7%) | 24,667 (45.3%) |
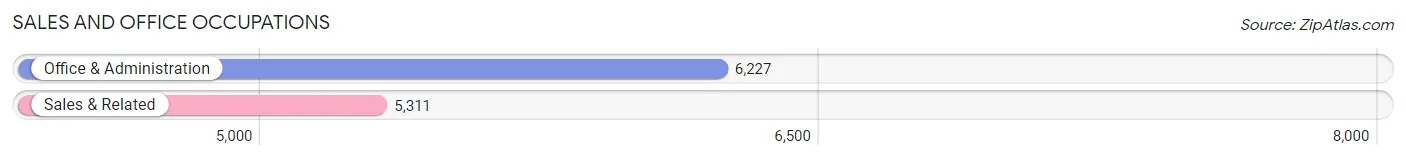
Sales and Office Occupations
The most common Sales and Office occupations in Sparks are Office & Administration (6,227 | 11.4%), and Sales & Related (5,311 | 9.8%).
Sales and Office Occupations by Sex
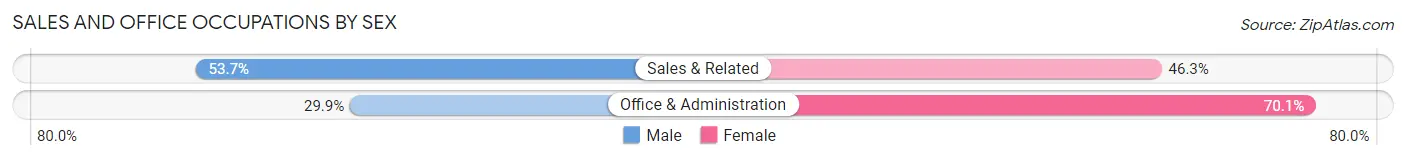
| Occupation | Male | Female |
| Sales & Related | 2,851 (53.7%) | 2,460 (46.3%) |
| Office & Administration | 1,864 (29.9%) | 4,363 (70.1%) |
| Total (Category) | 4,715 (40.9%) | 6,823 (59.1%) |
| Total (Overall) | 29,800 (54.7%) | 24,667 (45.3%) |
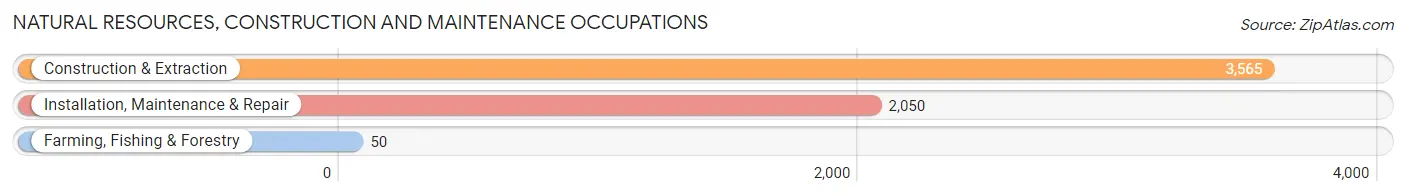
Natural Resources, Construction and Maintenance Occupations
The most common Natural Resources, Construction and Maintenance occupations in Sparks are Construction & Extraction (3,565 | 6.6%), Installation, Maintenance & Repair (2,050 | 3.8%), and Farming, Fishing & Forestry (50 | 0.1%).
Natural Resources, Construction and Maintenance Occupations by Sex
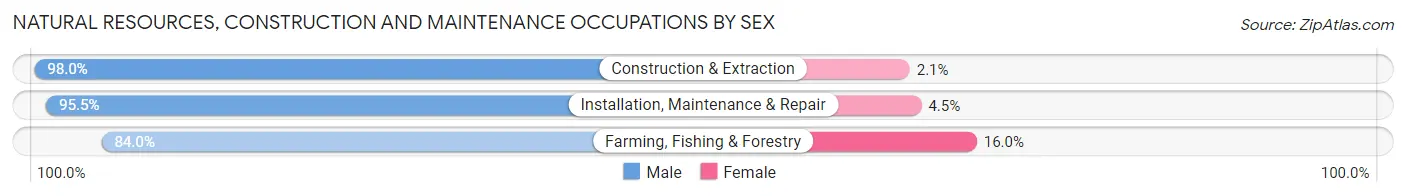
| Occupation | Male | Female |
| Farming, Fishing & Forestry | 42 (84.0%) | 8 (16.0%) |
| Construction & Extraction | 3,492 (98.0%) | 73 (2.1%) |
| Installation, Maintenance & Repair | 1,958 (95.5%) | 92 (4.5%) |
| Total (Category) | 5,492 (97.0%) | 173 (3.0%) |
| Total (Overall) | 29,800 (54.7%) | 24,667 (45.3%) |
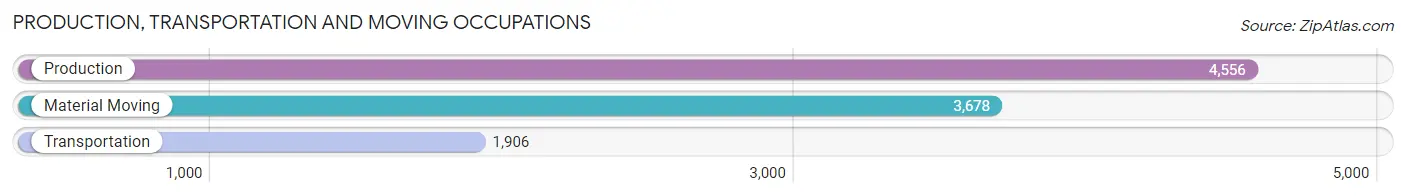
Production, Transportation and Moving Occupations
The most common Production, Transportation and Moving occupations in Sparks are Production (4,556 | 8.4%), Material Moving (3,678 | 6.8%), and Transportation (1,906 | 3.5%).
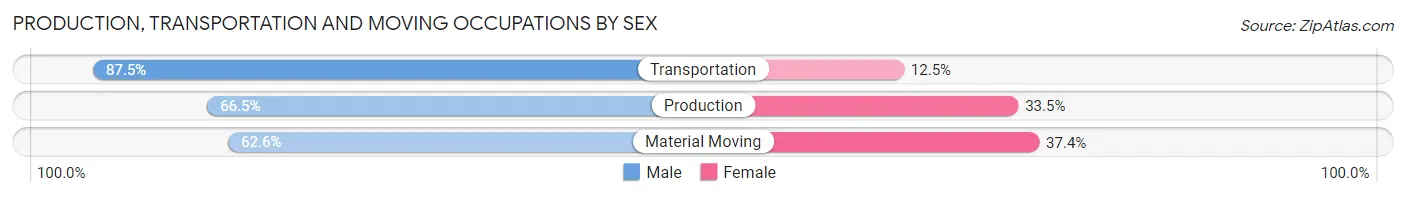
Production, Transportation and Moving Occupations by Sex
| Occupation | Male | Female |
| Production | 3,029 (66.5%) | 1,527 (33.5%) |
| Transportation | 1,667 (87.5%) | 239 (12.5%) |
| Material Moving | 2,304 (62.6%) | 1,374 (37.4%) |
| Total (Category) | 7,000 (69.0%) | 3,140 (31.0%) |
| Total (Overall) | 29,800 (54.7%) | 24,667 (45.3%) |
Employment Industries by Sex in Sparks
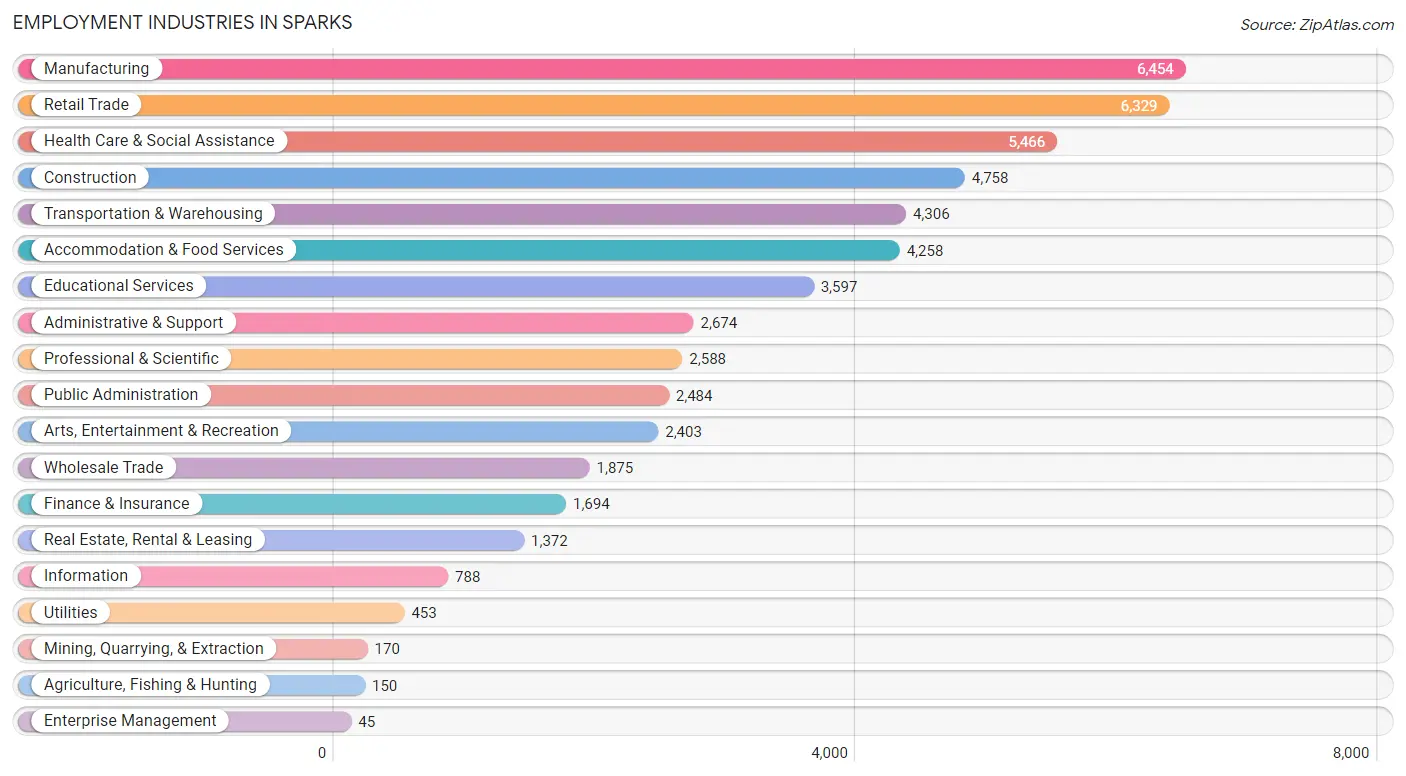
Employment Industries in Sparks
The major employment industries in Sparks include Manufacturing (6,454 | 11.8%), Retail Trade (6,329 | 11.6%), Health Care & Social Assistance (5,466 | 10.0%), Construction (4,758 | 8.7%), and Transportation & Warehousing (4,306 | 7.9%).
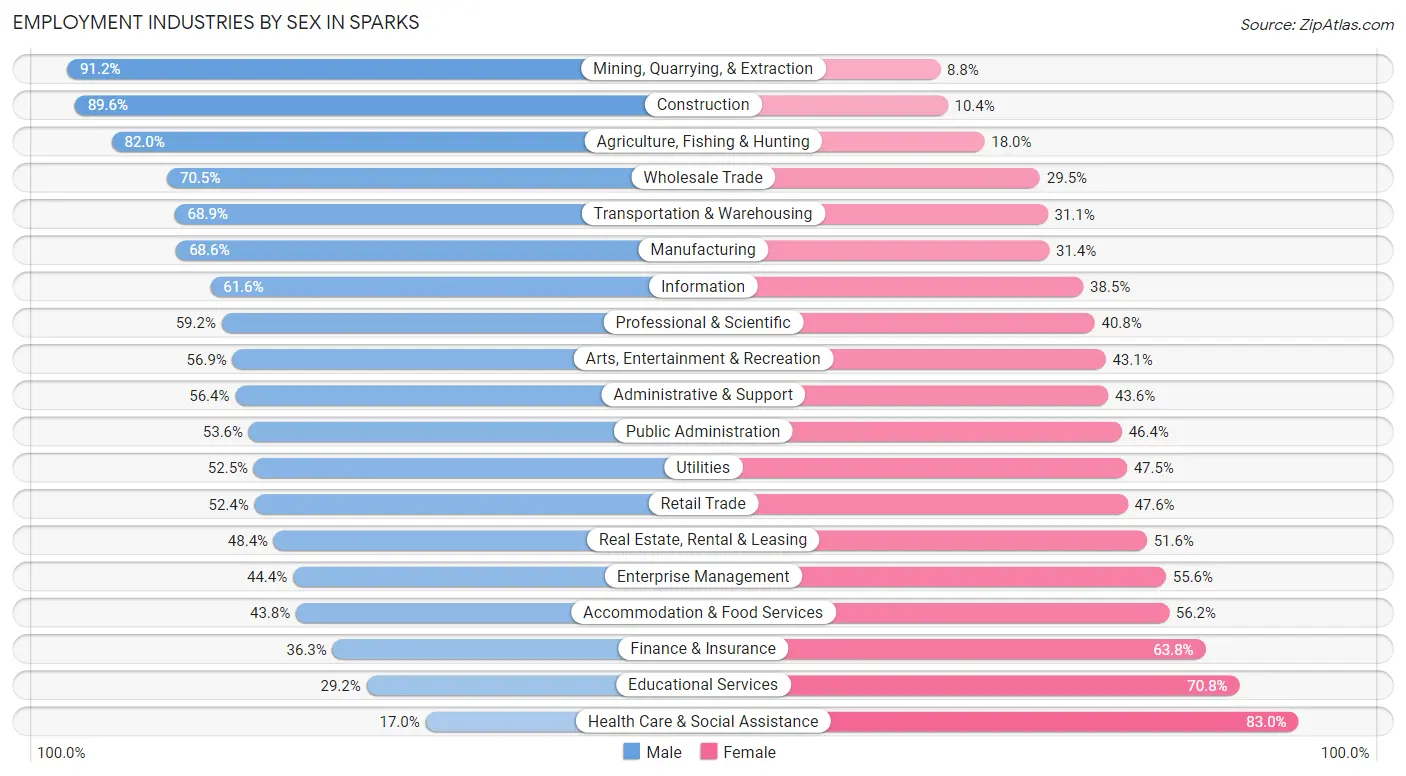
Employment Industries by Sex in Sparks
The Sparks industries that see more men than women are Mining, Quarrying, & Extraction (91.2%), Construction (89.6%), and Agriculture, Fishing & Hunting (82.0%), whereas the industries that tend to have a higher number of women are Health Care & Social Assistance (83.0%), Educational Services (70.8%), and Finance & Insurance (63.7%).
| Industry | Male | Female |
| Agriculture, Fishing & Hunting | 123 (82.0%) | 27 (18.0%) |
| Mining, Quarrying, & Extraction | 155 (91.2%) | 15 (8.8%) |
| Construction | 4,264 (89.6%) | 494 (10.4%) |
| Manufacturing | 4,428 (68.6%) | 2,026 (31.4%) |
| Wholesale Trade | 1,322 (70.5%) | 553 (29.5%) |
| Retail Trade | 3,316 (52.4%) | 3,013 (47.6%) |
| Transportation & Warehousing | 2,968 (68.9%) | 1,338 (31.1%) |
| Utilities | 238 (52.5%) | 215 (47.5%) |
| Information | 485 (61.6%) | 303 (38.5%) |
| Finance & Insurance | 614 (36.2%) | 1,080 (63.7%) |
| Real Estate, Rental & Leasing | 664 (48.4%) | 708 (51.6%) |
| Professional & Scientific | 1,532 (59.2%) | 1,056 (40.8%) |
| Enterprise Management | 20 (44.4%) | 25 (55.6%) |
| Administrative & Support | 1,508 (56.4%) | 1,166 (43.6%) |
| Educational Services | 1,051 (29.2%) | 2,546 (70.8%) |
| Health Care & Social Assistance | 930 (17.0%) | 4,536 (83.0%) |
| Arts, Entertainment & Recreation | 1,368 (56.9%) | 1,035 (43.1%) |
| Accommodation & Food Services | 1,866 (43.8%) | 2,392 (56.2%) |
| Public Administration | 1,331 (53.6%) | 1,153 (46.4%) |
| Total | 29,800 (54.7%) | 24,667 (45.3%) |
Education in Sparks
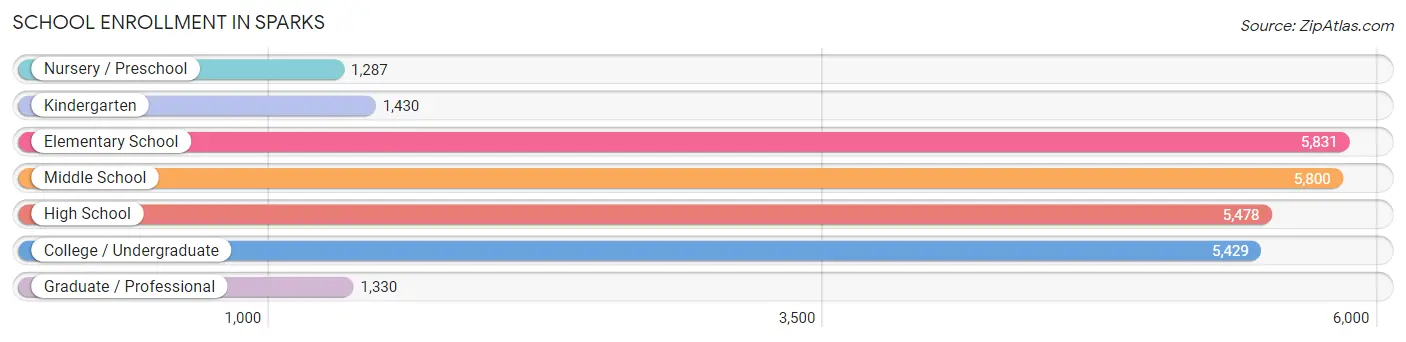
School Enrollment in Sparks
The most common levels of schooling among the 26,585 students in Sparks are elementary school (5,831 | 21.9%), middle school (5,800 | 21.8%), and high school (5,478 | 20.6%).
| School Level | # Students | % Students |
| Nursery / Preschool | 1,287 | 4.8% |
| Kindergarten | 1,430 | 5.4% |
| Elementary School | 5,831 | 21.9% |
| Middle School | 5,800 | 21.8% |
| High School | 5,478 | 20.6% |
| College / Undergraduate | 5,429 | 20.4% |
| Graduate / Professional | 1,330 | 5.0% |
| Total | 26,585 | 100.0% |
School Enrollment by Age by Funding Source in Sparks
Out of a total of 26,585 students who are enrolled in schools in Sparks, 3,509 (13.2%) attend a private institution, while the remaining 23,076 (86.8%) are enrolled in public schools. The age group of 3 to 4 year olds has the highest likelihood of being enrolled in private schools, with 505 (48.0% in the age bracket) enrolled. Conversely, the age group of 15 to 17 year olds has the lowest likelihood of being enrolled in a private school, with 3,397 (93.8% in the age bracket) attending a public institution.

| Age Bracket | Public School | Private School |
| 3 to 4 Year Olds | 547 (52.0%) | 505 (48.0%) |
| 5 to 9 Year Old | 6,233 (88.7%) | 796 (11.3%) |
| 10 to 14 Year Olds | 6,742 (91.4%) | 632 (8.6%) |
| 15 to 17 Year Olds | 3,397 (93.8%) | 223 (6.2%) |
| 18 to 19 Year Olds | 1,382 (91.9%) | 121 (8.1%) |
| 20 to 24 Year Olds | 2,097 (87.8%) | 292 (12.2%) |
| 25 to 34 Year Olds | 1,495 (77.4%) | 436 (22.6%) |
| 35 Years and over | 1,191 (70.6%) | 496 (29.4%) |
| Total | 23,076 (86.8%) | 3,509 (13.2%) |
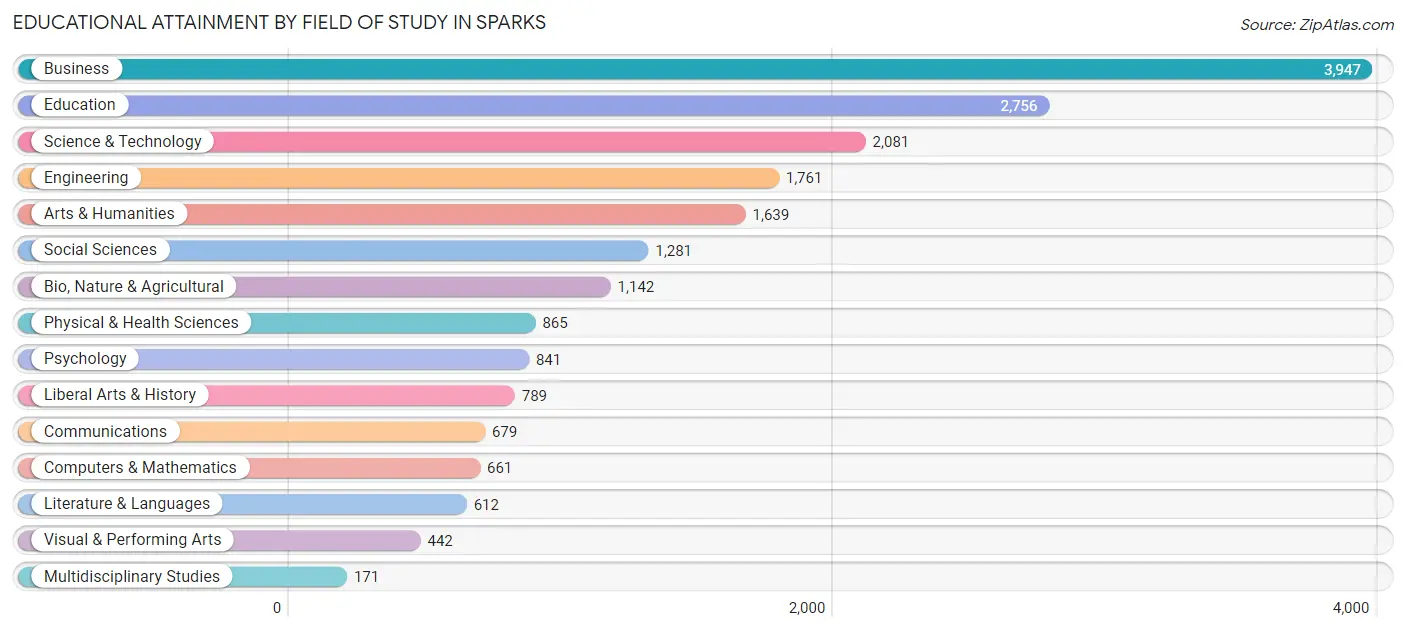
Educational Attainment by Field of Study in Sparks
Business (3,947 | 20.1%), education (2,756 | 14.0%), science & technology (2,081 | 10.6%), engineering (1,761 | 8.9%), and arts & humanities (1,639 | 8.3%) are the most common fields of study among 19,667 individuals in Sparks who have obtained a bachelor's degree or higher.
| Field of Study | # Graduates | % Graduates |
| Computers & Mathematics | 661 | 3.4% |
| Bio, Nature & Agricultural | 1,142 | 5.8% |
| Physical & Health Sciences | 865 | 4.4% |
| Psychology | 841 | 4.3% |
| Social Sciences | 1,281 | 6.5% |
| Engineering | 1,761 | 8.9% |
| Multidisciplinary Studies | 171 | 0.9% |
| Science & Technology | 2,081 | 10.6% |
| Business | 3,947 | 20.1% |
| Education | 2,756 | 14.0% |
| Literature & Languages | 612 | 3.1% |
| Liberal Arts & History | 789 | 4.0% |
| Visual & Performing Arts | 442 | 2.2% |
| Communications | 679 | 3.5% |
| Arts & Humanities | 1,639 | 8.3% |
| Total | 19,667 | 100.0% |
Transportation & Commute in Sparks
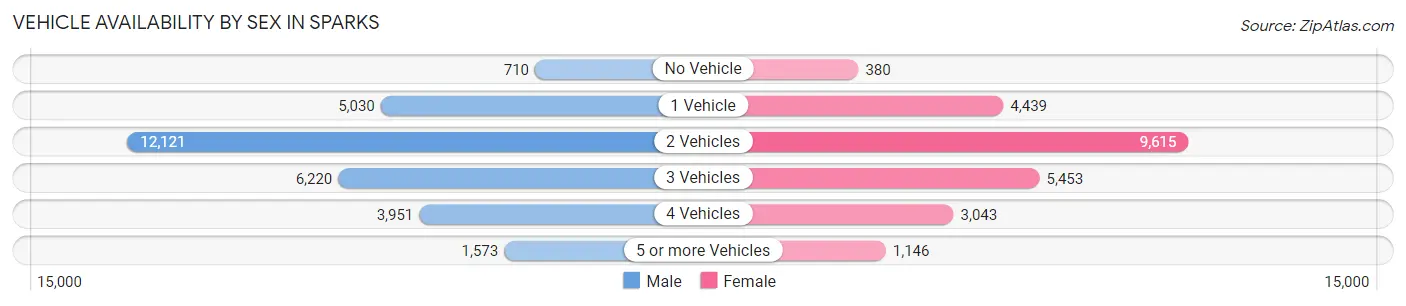
Vehicle Availability by Sex in Sparks
The most prevalent vehicle ownership categories in Sparks are males with 2 vehicles (12,121, accounting for 40.9%) and females with 2 vehicles (9,615, making up 50.3%).
| Vehicles Available | Male | Female |
| No Vehicle | 710 (2.4%) | 380 (1.6%) |
| 1 Vehicle | 5,030 (17.0%) | 4,439 (18.4%) |
| 2 Vehicles | 12,121 (40.9%) | 9,615 (39.9%) |
| 3 Vehicles | 6,220 (21.0%) | 5,453 (22.7%) |
| 4 Vehicles | 3,951 (13.4%) | 3,043 (12.6%) |
| 5 or more Vehicles | 1,573 (5.3%) | 1,146 (4.8%) |
| Total | 29,605 (100.0%) | 24,076 (100.0%) |
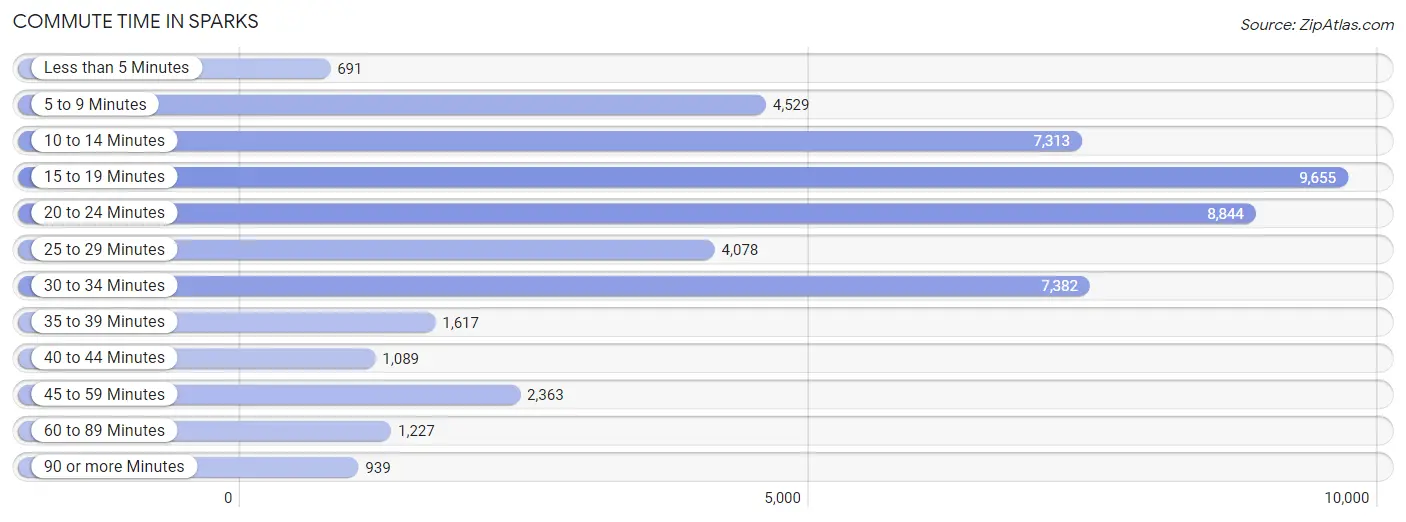
Commute Time in Sparks
The most frequently occuring commute durations in Sparks are 15 to 19 minutes (9,655 commuters, 19.4%), 20 to 24 minutes (8,844 commuters, 17.8%), and 30 to 34 minutes (7,382 commuters, 14.8%).
| Commute Time | # Commuters | % Commuters |
| Less than 5 Minutes | 691 | 1.4% |
| 5 to 9 Minutes | 4,529 | 9.1% |
| 10 to 14 Minutes | 7,313 | 14.7% |
| 15 to 19 Minutes | 9,655 | 19.4% |
| 20 to 24 Minutes | 8,844 | 17.8% |
| 25 to 29 Minutes | 4,078 | 8.2% |
| 30 to 34 Minutes | 7,382 | 14.8% |
| 35 to 39 Minutes | 1,617 | 3.3% |
| 40 to 44 Minutes | 1,089 | 2.2% |
| 45 to 59 Minutes | 2,363 | 4.8% |
| 60 to 89 Minutes | 1,227 | 2.5% |
| 90 or more Minutes | 939 | 1.9% |
Commute Time by Sex in Sparks
The most common commute times in Sparks are 15 to 19 minutes (5,358 commuters, 19.3%) for males and 15 to 19 minutes (4,297 commuters, 19.5%) for females.
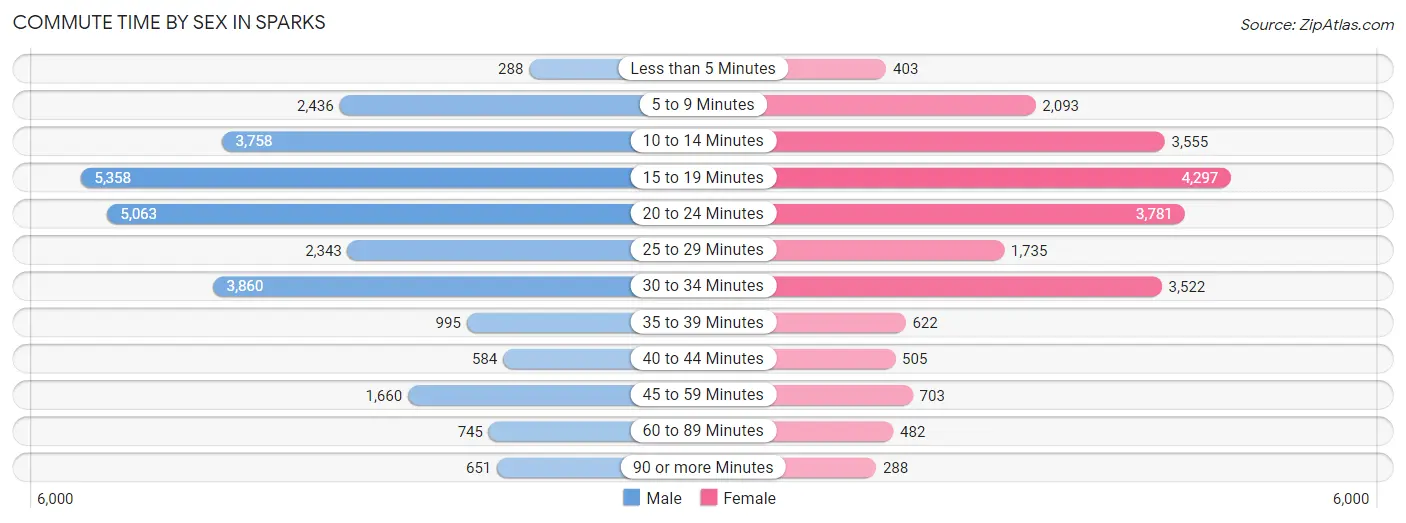
| Commute Time | Male | Female |
| Less than 5 Minutes | 288 (1.0%) | 403 (1.8%) |
| 5 to 9 Minutes | 2,436 (8.8%) | 2,093 (9.5%) |
| 10 to 14 Minutes | 3,758 (13.6%) | 3,555 (16.2%) |
| 15 to 19 Minutes | 5,358 (19.3%) | 4,297 (19.5%) |
| 20 to 24 Minutes | 5,063 (18.2%) | 3,781 (17.2%) |
| 25 to 29 Minutes | 2,343 (8.5%) | 1,735 (7.9%) |
| 30 to 34 Minutes | 3,860 (13.9%) | 3,522 (16.0%) |
| 35 to 39 Minutes | 995 (3.6%) | 622 (2.8%) |
| 40 to 44 Minutes | 584 (2.1%) | 505 (2.3%) |
| 45 to 59 Minutes | 1,660 (6.0%) | 703 (3.2%) |
| 60 to 89 Minutes | 745 (2.7%) | 482 (2.2%) |
| 90 or more Minutes | 651 (2.4%) | 288 (1.3%) |
Time of Departure to Work by Sex in Sparks
The most frequent times of departure to work in Sparks are 7:00 AM to 7:29 AM (3,900, 14.1%) for males and 7:00 AM to 7:29 AM (3,096, 14.1%) for females.
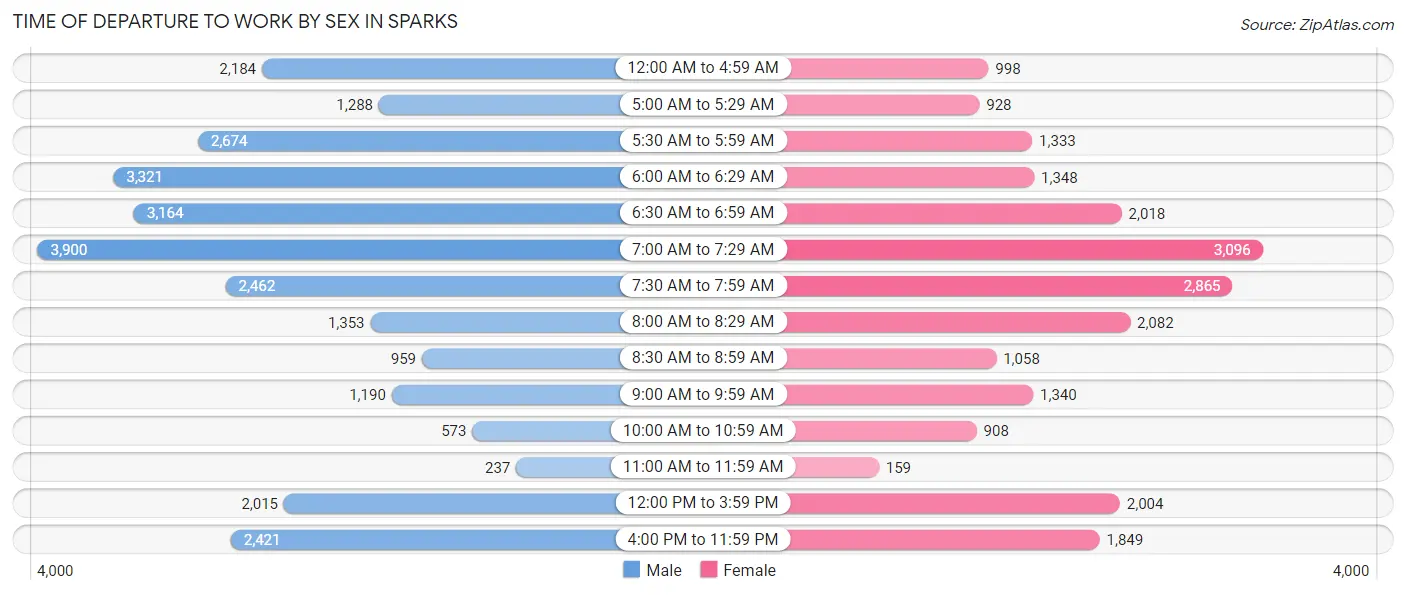
| Time of Departure | Male | Female |
| 12:00 AM to 4:59 AM | 2,184 (7.9%) | 998 (4.5%) |
| 5:00 AM to 5:29 AM | 1,288 (4.6%) | 928 (4.2%) |
| 5:30 AM to 5:59 AM | 2,674 (9.6%) | 1,333 (6.1%) |
| 6:00 AM to 6:29 AM | 3,321 (12.0%) | 1,348 (6.1%) |
| 6:30 AM to 6:59 AM | 3,164 (11.4%) | 2,018 (9.2%) |
| 7:00 AM to 7:29 AM | 3,900 (14.1%) | 3,096 (14.1%) |
| 7:30 AM to 7:59 AM | 2,462 (8.9%) | 2,865 (13.0%) |
| 8:00 AM to 8:29 AM | 1,353 (4.9%) | 2,082 (9.5%) |
| 8:30 AM to 8:59 AM | 959 (3.5%) | 1,058 (4.8%) |
| 9:00 AM to 9:59 AM | 1,190 (4.3%) | 1,340 (6.1%) |
| 10:00 AM to 10:59 AM | 573 (2.1%) | 908 (4.1%) |
| 11:00 AM to 11:59 AM | 237 (0.9%) | 159 (0.7%) |
| 12:00 PM to 3:59 PM | 2,015 (7.3%) | 2,004 (9.1%) |
| 4:00 PM to 11:59 PM | 2,421 (8.7%) | 1,849 (8.4%) |
| Total | 27,741 (100.0%) | 21,986 (100.0%) |
Housing Occupancy in Sparks
Occupancy by Ownership in Sparks
Of the total 40,325 dwellings in Sparks, owner-occupied units account for 23,952 (59.4%), while renter-occupied units make up 16,373 (40.6%).
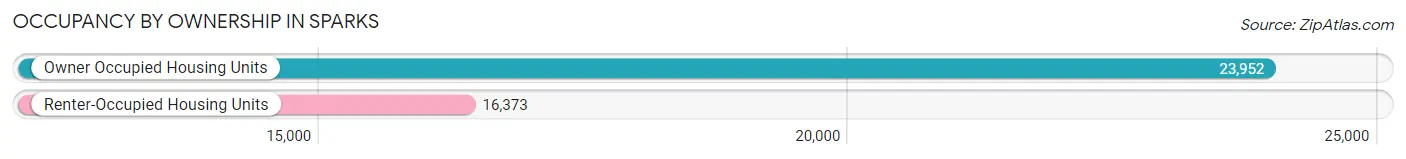
| Occupancy | # Housing Units | % Housing Units |
| Owner Occupied Housing Units | 23,952 | 59.4% |
| Renter-Occupied Housing Units | 16,373 | 40.6% |
| Total Occupied Housing Units | 40,325 | 100.0% |
Occupancy by Household Size in Sparks
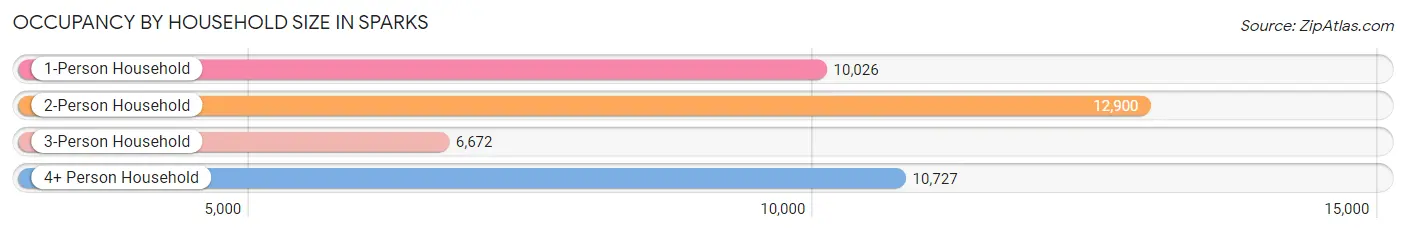
| Household Size | # Housing Units | % Housing Units |
| 1-Person Household | 10,026 | 24.9% |
| 2-Person Household | 12,900 | 32.0% |
| 3-Person Household | 6,672 | 16.6% |
| 4+ Person Household | 10,727 | 26.6% |
| Total Housing Units | 40,325 | 100.0% |
Occupancy by Ownership by Household Size in Sparks
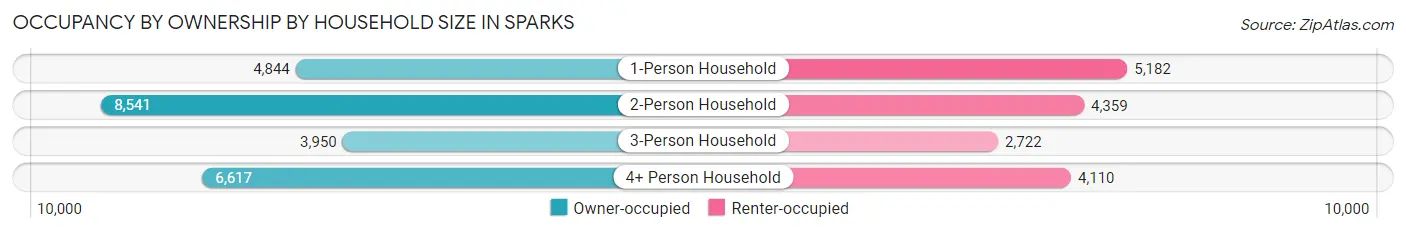
| Household Size | Owner-occupied | Renter-occupied |
| 1-Person Household | 4,844 (48.3%) | 5,182 (51.7%) |
| 2-Person Household | 8,541 (66.2%) | 4,359 (33.8%) |
| 3-Person Household | 3,950 (59.2%) | 2,722 (40.8%) |
| 4+ Person Household | 6,617 (61.7%) | 4,110 (38.3%) |
| Total Housing Units | 23,952 (59.4%) | 16,373 (40.6%) |
Occupancy by Educational Attainment in Sparks
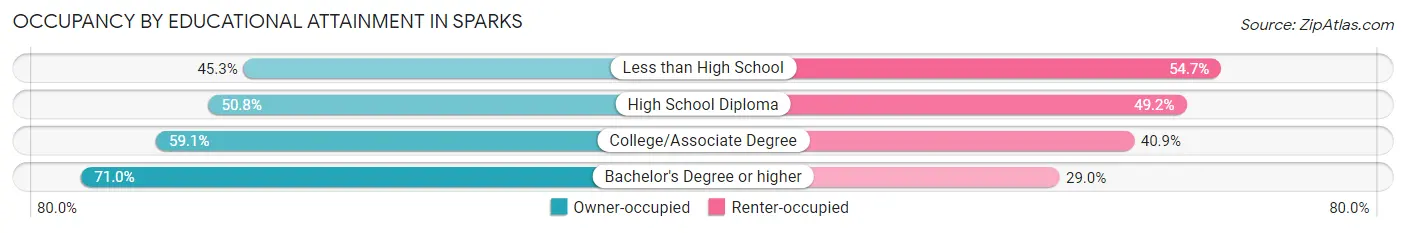
| Household Size | Owner-occupied | Renter-occupied |
| Less than High School | 1,881 (45.3%) | 2,273 (54.7%) |
| High School Diploma | 4,535 (50.8%) | 4,388 (49.2%) |
| College/Associate Degree | 9,023 (59.1%) | 6,233 (40.9%) |
| Bachelor's Degree or higher | 8,513 (71.0%) | 3,479 (29.0%) |
Occupancy by Age of Householder in Sparks
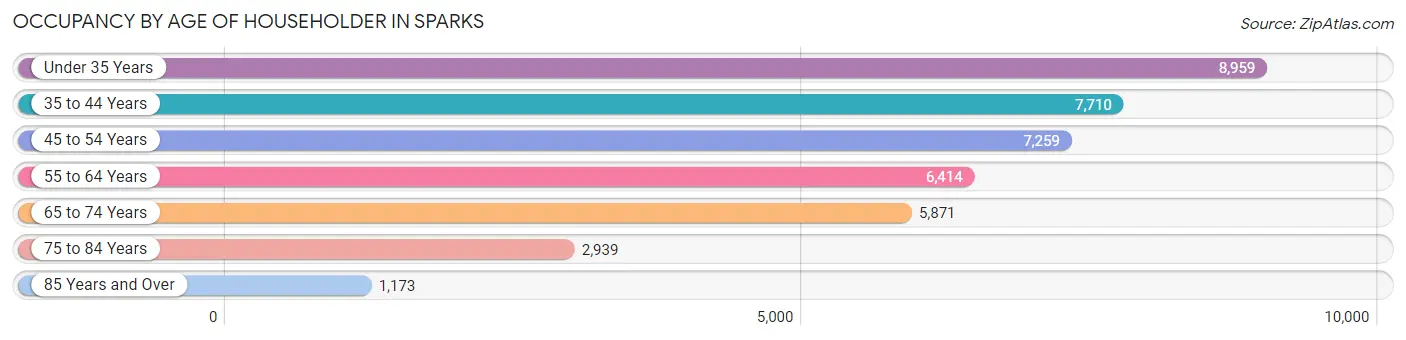
| Age Bracket | # Households | % Households |
| Under 35 Years | 8,959 | 22.2% |
| 35 to 44 Years | 7,710 | 19.1% |
| 45 to 54 Years | 7,259 | 18.0% |
| 55 to 64 Years | 6,414 | 15.9% |
| 65 to 74 Years | 5,871 | 14.6% |
| 75 to 84 Years | 2,939 | 7.3% |
| 85 Years and Over | 1,173 | 2.9% |
| Total | 40,325 | 100.0% |
Housing Finances in Sparks
Median Income by Occupancy in Sparks
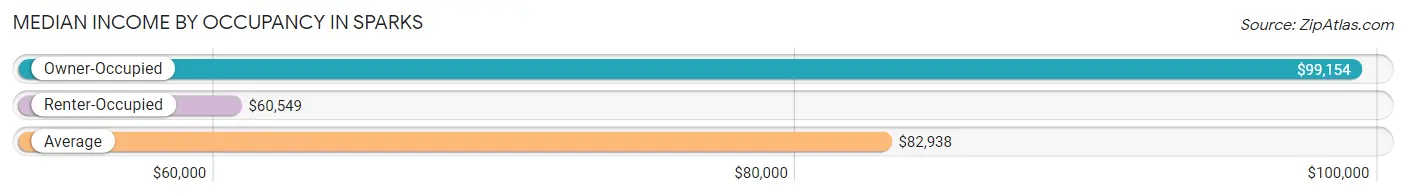
| Occupancy Type | # Households | Median Income |
| Owner-Occupied | 23,952 (59.4%) | $99,154 |
| Renter-Occupied | 16,373 (40.6%) | $60,549 |
| Average | 40,325 (100.0%) | $82,938 |
Occupancy by Householder Income Bracket in Sparks
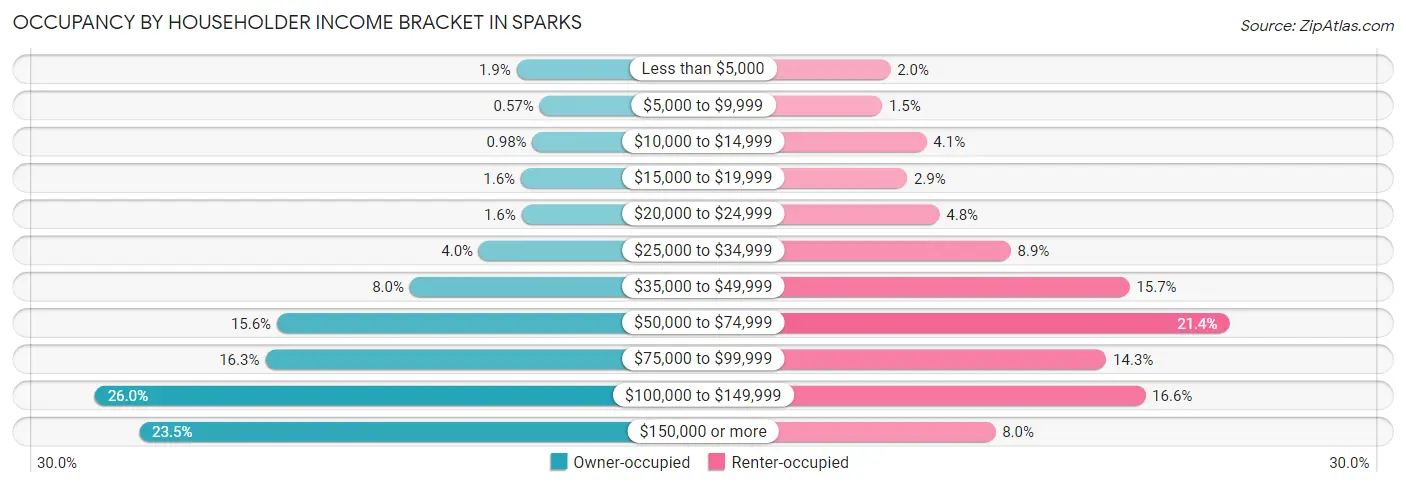
| Income Bracket | Owner-occupied | Renter-occupied |
| Less than $5,000 | 453 (1.9%) | 325 (2.0%) |
| $5,000 to $9,999 | 136 (0.6%) | 247 (1.5%) |
| $10,000 to $14,999 | 235 (1.0%) | 663 (4.1%) |
| $15,000 to $19,999 | 394 (1.6%) | 482 (2.9%) |
| $20,000 to $24,999 | 384 (1.6%) | 785 (4.8%) |
| $25,000 to $34,999 | 967 (4.0%) | 1,451 (8.9%) |
| $35,000 to $49,999 | 1,914 (8.0%) | 2,562 (15.7%) |
| $50,000 to $74,999 | 3,732 (15.6%) | 3,498 (21.4%) |
| $75,000 to $99,999 | 3,893 (16.3%) | 2,344 (14.3%) |
| $100,000 to $149,999 | 6,226 (26.0%) | 2,709 (16.6%) |
| $150,000 or more | 5,618 (23.5%) | 1,307 (8.0%) |
| Total | 23,952 (100.0%) | 16,373 (100.0%) |
Monthly Housing Cost Tiers in Sparks
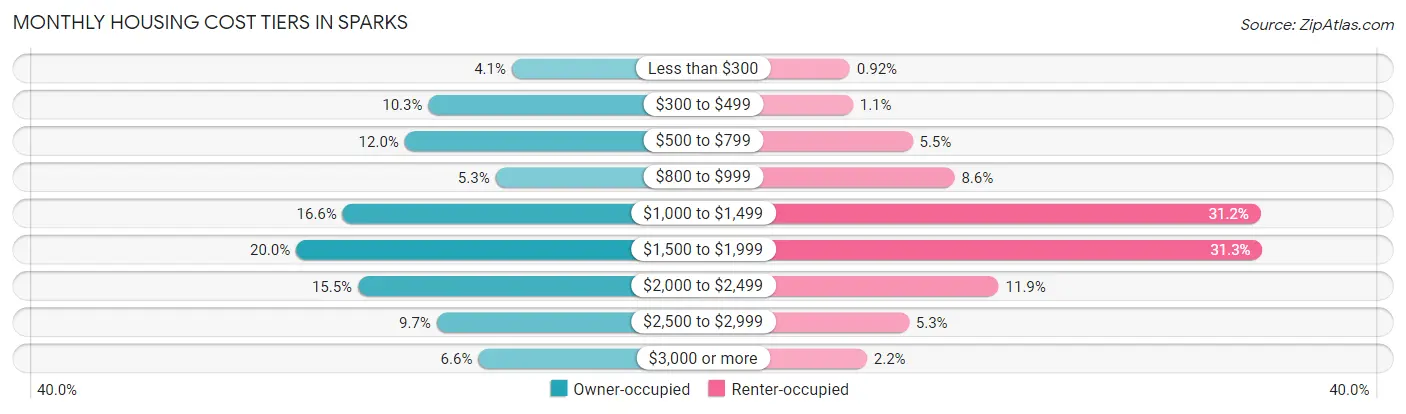
| Monthly Cost | Owner-occupied | Renter-occupied |
| Less than $300 | 987 (4.1%) | 150 (0.9%) |
| $300 to $499 | 2,459 (10.3%) | 185 (1.1%) |
| $500 to $799 | 2,877 (12.0%) | 906 (5.5%) |
| $800 to $999 | 1,275 (5.3%) | 1,412 (8.6%) |
| $1,000 to $1,499 | 3,972 (16.6%) | 5,103 (31.2%) |
| $1,500 to $1,999 | 4,792 (20.0%) | 5,124 (31.3%) |
| $2,000 to $2,499 | 3,701 (15.4%) | 1,944 (11.9%) |
| $2,500 to $2,999 | 2,311 (9.7%) | 862 (5.3%) |
| $3,000 or more | 1,578 (6.6%) | 355 (2.2%) |
| Total | 23,952 (100.0%) | 16,373 (100.0%) |
Physical Housing Characteristics in Sparks
Housing Structures in Sparks
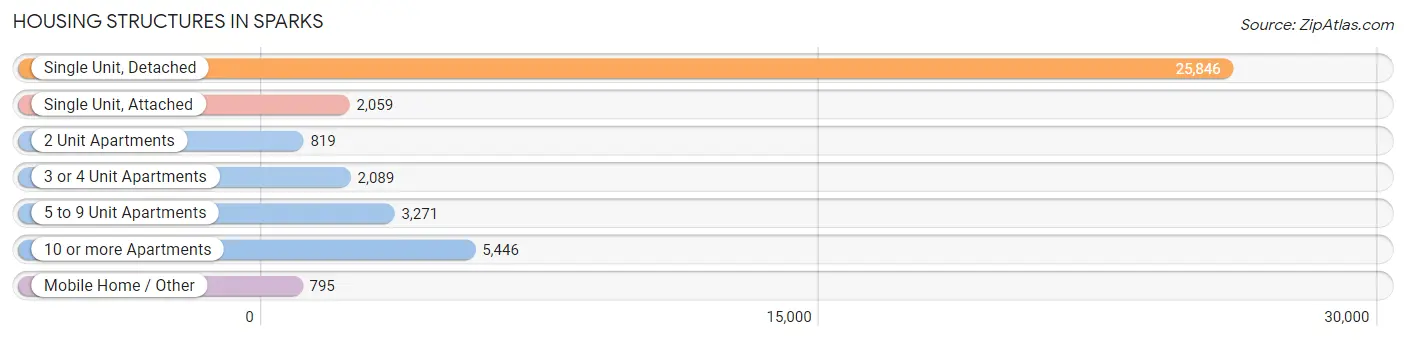
| Structure Type | # Housing Units | % Housing Units |
| Single Unit, Detached | 25,846 | 64.1% |
| Single Unit, Attached | 2,059 | 5.1% |
| 2 Unit Apartments | 819 | 2.0% |
| 3 or 4 Unit Apartments | 2,089 | 5.2% |
| 5 to 9 Unit Apartments | 3,271 | 8.1% |
| 10 or more Apartments | 5,446 | 13.5% |
| Mobile Home / Other | 795 | 2.0% |
| Total | 40,325 | 100.0% |
Housing Structures by Occupancy in Sparks
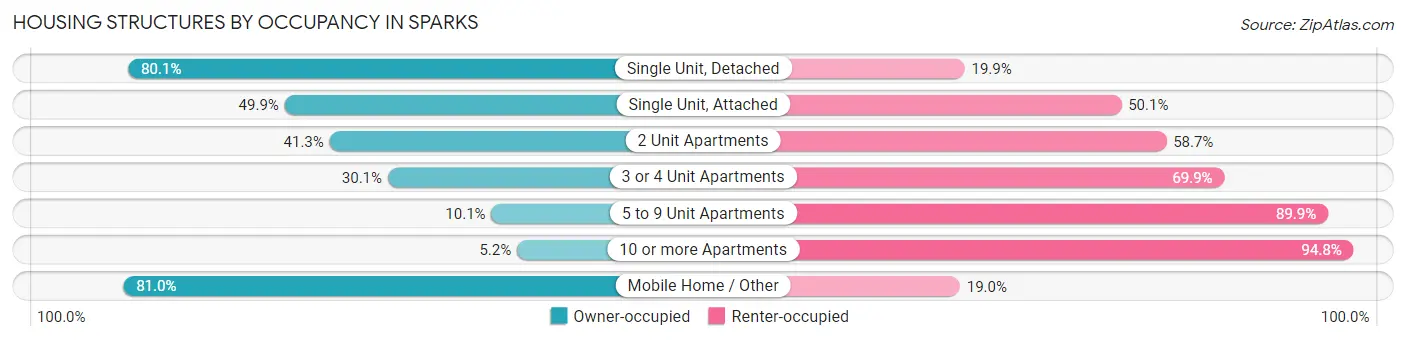
| Structure Type | Owner-occupied | Renter-occupied |
| Single Unit, Detached | 20,701 (80.1%) | 5,145 (19.9%) |
| Single Unit, Attached | 1,028 (49.9%) | 1,031 (50.1%) |
| 2 Unit Apartments | 338 (41.3%) | 481 (58.7%) |
| 3 or 4 Unit Apartments | 628 (30.1%) | 1,461 (69.9%) |
| 5 to 9 Unit Apartments | 331 (10.1%) | 2,940 (89.9%) |
| 10 or more Apartments | 282 (5.2%) | 5,164 (94.8%) |
| Mobile Home / Other | 644 (81.0%) | 151 (19.0%) |
| Total | 23,952 (59.4%) | 16,373 (40.6%) |
Housing Structures by Number of Rooms in Sparks
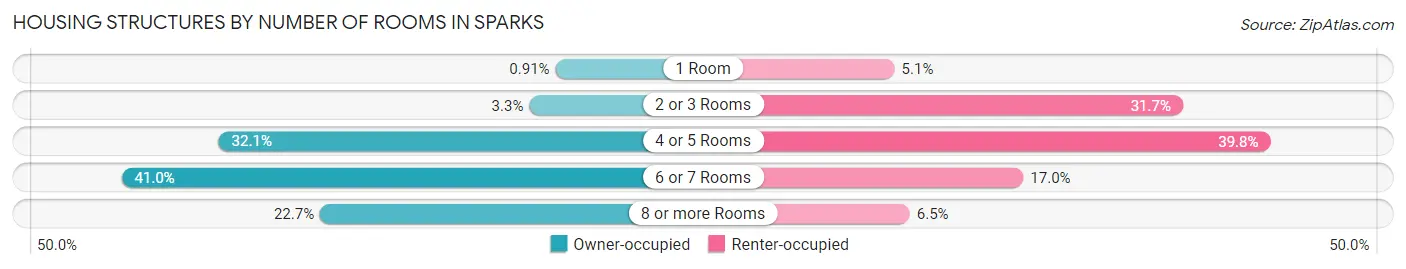
| Number of Rooms | Owner-occupied | Renter-occupied |
| 1 Room | 218 (0.9%) | 829 (5.1%) |
| 2 or 3 Rooms | 797 (3.3%) | 5,190 (31.7%) |
| 4 or 5 Rooms | 7,676 (32.1%) | 6,517 (39.8%) |
| 6 or 7 Rooms | 9,829 (41.0%) | 2,778 (17.0%) |
| 8 or more Rooms | 5,432 (22.7%) | 1,059 (6.5%) |
| Total | 23,952 (100.0%) | 16,373 (100.0%) |
Housing Structure by Heating Type in Sparks
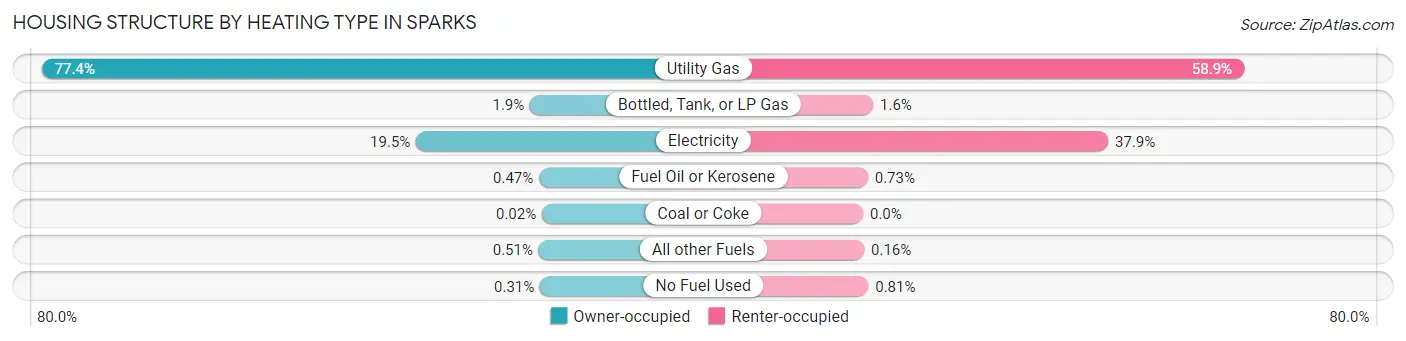
| Heating Type | Owner-occupied | Renter-occupied |
| Utility Gas | 18,532 (77.4%) | 9,638 (58.9%) |
| Bottled, Tank, or LP Gas | 444 (1.8%) | 255 (1.6%) |
| Electricity | 4,663 (19.5%) | 6,201 (37.9%) |
| Fuel Oil or Kerosene | 113 (0.5%) | 120 (0.7%) |
| Coal or Coke | 4 (0.0%) | 0 (0.0%) |
| All other Fuels | 122 (0.5%) | 26 (0.2%) |
| No Fuel Used | 74 (0.3%) | 133 (0.8%) |
| Total | 23,952 (100.0%) | 16,373 (100.0%) |
Household Vehicle Usage in Sparks
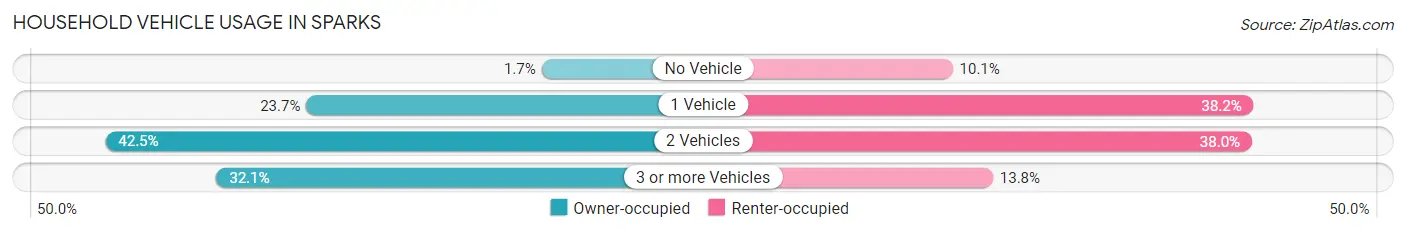
| Vehicles per Household | Owner-occupied | Renter-occupied |
| No Vehicle | 416 (1.7%) | 1,646 (10.1%) |
| 1 Vehicle | 5,679 (23.7%) | 6,246 (38.2%) |
| 2 Vehicles | 10,169 (42.5%) | 6,220 (38.0%) |
| 3 or more Vehicles | 7,688 (32.1%) | 2,261 (13.8%) |
| Total | 23,952 (100.0%) | 16,373 (100.0%) |
Real Estate & Mortgages in Sparks
Real Estate and Mortgage Overview in Sparks
| Characteristic | Without Mortgage | With Mortgage |
| Housing Units | 6,735 | 17,217 |
| Median Property Value | $388,900 | $433,900 |
| Median Household Income | $76,182 | $4,574 |
| Monthly Housing Costs | $502 | $1,568 |
| Real Estate Taxes | $2,008 | $634 |
Property Value by Mortgage Status in Sparks
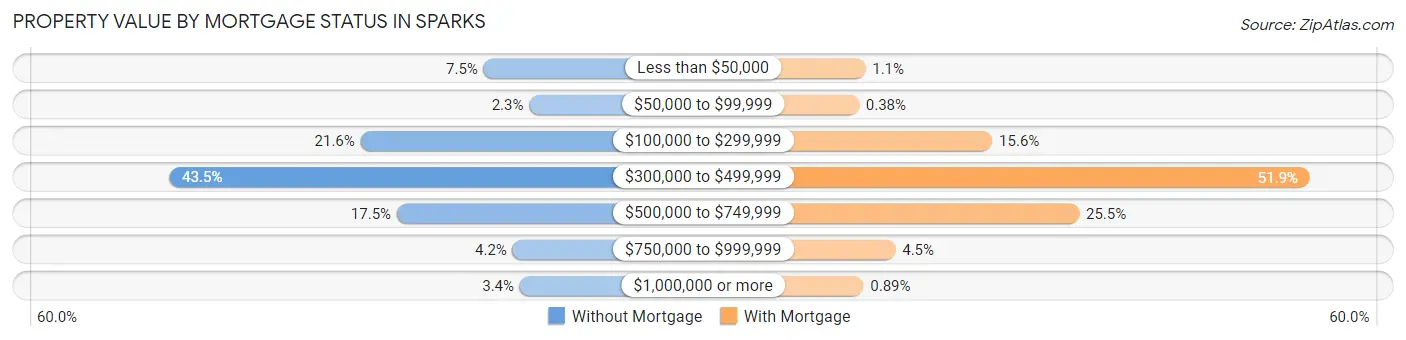
| Property Value | Without Mortgage | With Mortgage |
| Less than $50,000 | 507 (7.5%) | 191 (1.1%) |
| $50,000 to $99,999 | 156 (2.3%) | 66 (0.4%) |
| $100,000 to $299,999 | 1,455 (21.6%) | 2,688 (15.6%) |
| $300,000 to $499,999 | 2,929 (43.5%) | 8,939 (51.9%) |
| $500,000 to $749,999 | 1,175 (17.4%) | 4,398 (25.5%) |
| $750,000 to $999,999 | 284 (4.2%) | 781 (4.5%) |
| $1,000,000 or more | 229 (3.4%) | 154 (0.9%) |
| Total | 6,735 (100.0%) | 17,217 (100.0%) |
Household Income by Mortgage Status in Sparks
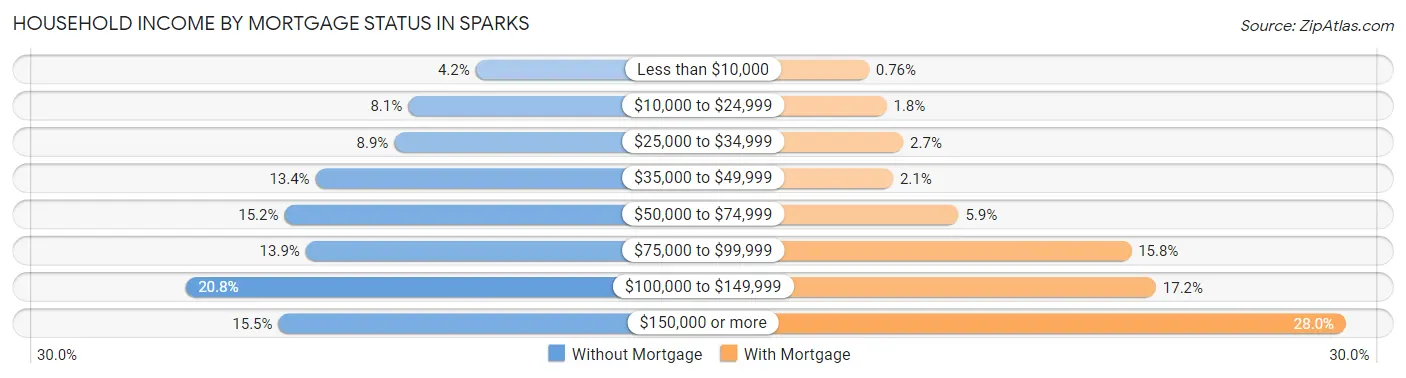
| Household Income | Without Mortgage | With Mortgage |
| Less than $10,000 | 285 (4.2%) | 130 (0.8%) |
| $10,000 to $24,999 | 545 (8.1%) | 304 (1.8%) |
| $25,000 to $34,999 | 598 (8.9%) | 468 (2.7%) |
| $35,000 to $49,999 | 901 (13.4%) | 369 (2.1%) |
| $50,000 to $74,999 | 1,021 (15.2%) | 1,013 (5.9%) |
| $75,000 to $99,999 | 939 (13.9%) | 2,711 (15.8%) |
| $100,000 to $149,999 | 1,402 (20.8%) | 2,954 (17.2%) |
| $150,000 or more | 1,044 (15.5%) | 4,824 (28.0%) |
| Total | 6,735 (100.0%) | 17,217 (100.0%) |
Property Value to Household Income Ratio in Sparks
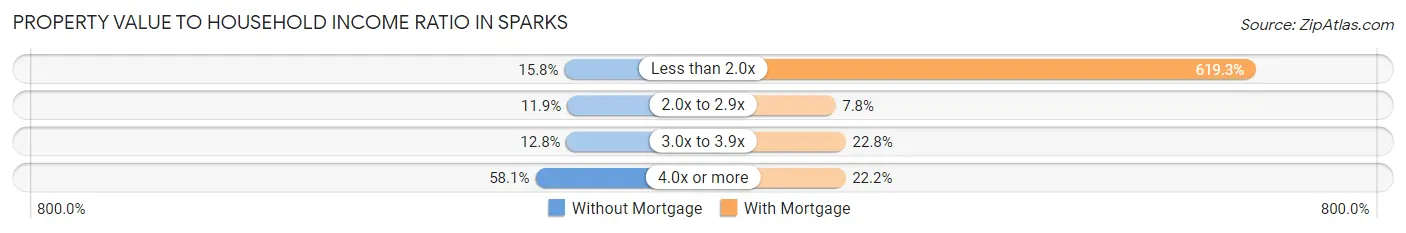
| Value-to-Income Ratio | Without Mortgage | With Mortgage |
| Less than 2.0x | 1,061 (15.8%) | 106,620 (619.3%) |
| 2.0x to 2.9x | 799 (11.9%) | 1,345 (7.8%) |
| 3.0x to 3.9x | 861 (12.8%) | 3,928 (22.8%) |
| 4.0x or more | 3,911 (58.1%) | 3,829 (22.2%) |
| Total | 6,735 (100.0%) | 17,217 (100.0%) |
Real Estate Taxes by Mortgage Status in Sparks
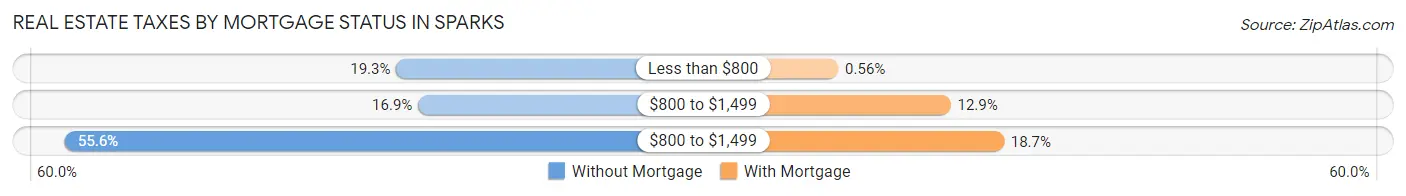
| Property Taxes | Without Mortgage | With Mortgage |
| Less than $800 | 1,298 (19.3%) | 96 (0.6%) |
| $800 to $1,499 | 1,136 (16.9%) | 2,217 (12.9%) |
| $800 to $1,499 | 3,743 (55.6%) | 3,222 (18.7%) |
| Total | 6,735 (100.0%) | 17,217 (100.0%) |
Health & Disability in Sparks
Health Insurance Coverage by Age in Sparks
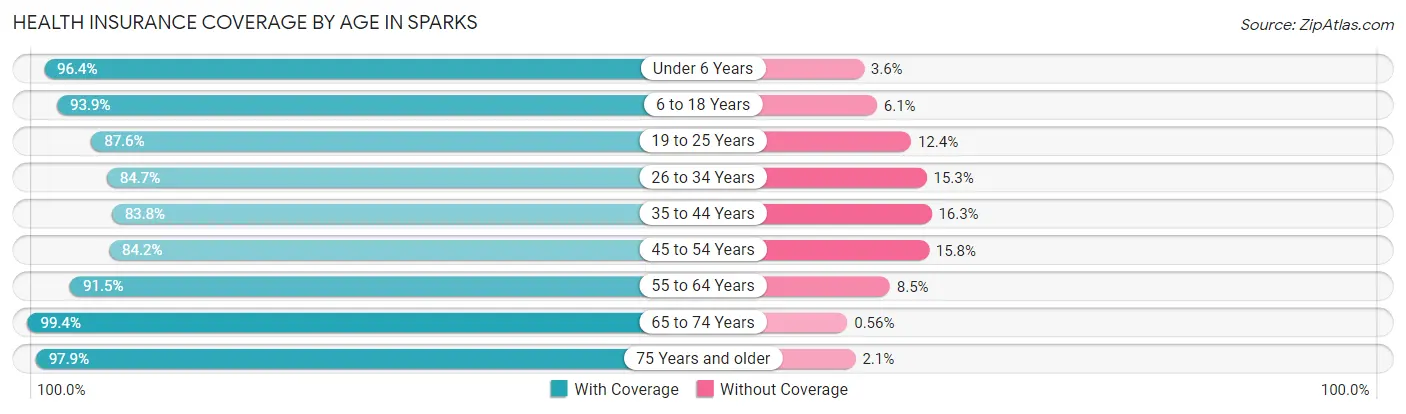
| Age Bracket | With Coverage | Without Coverage |
| Under 6 Years | 8,145 (96.4%) | 308 (3.6%) |
| 6 to 18 Years | 17,324 (93.9%) | 1,120 (6.1%) |
| 19 to 25 Years | 8,817 (87.6%) | 1,253 (12.4%) |
| 26 to 34 Years | 12,186 (84.7%) | 2,207 (15.3%) |
| 35 to 44 Years | 11,918 (83.8%) | 2,313 (16.3%) |
| 45 to 54 Years | 11,849 (84.2%) | 2,219 (15.8%) |
| 55 to 64 Years | 10,458 (91.5%) | 970 (8.5%) |
| 65 to 74 Years | 9,890 (99.4%) | 56 (0.6%) |
| 75 Years and older | 6,444 (97.9%) | 137 (2.1%) |
| Total | 97,031 (90.2%) | 10,583 (9.8%) |
Health Insurance Coverage by Citizenship Status in Sparks
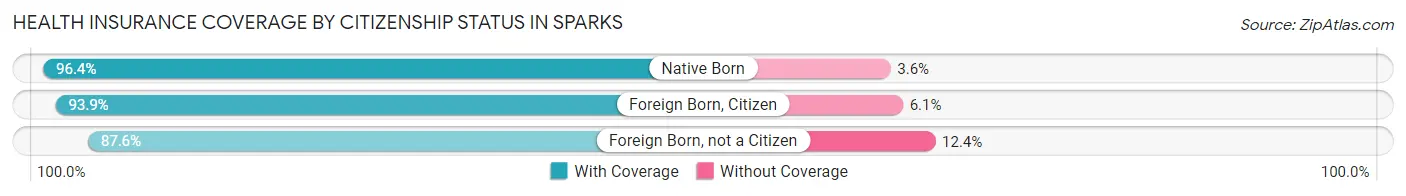
| Citizenship Status | With Coverage | Without Coverage |
| Native Born | 8,145 (96.4%) | 308 (3.6%) |
| Foreign Born, Citizen | 17,324 (93.9%) | 1,120 (6.1%) |
| Foreign Born, not a Citizen | 8,817 (87.6%) | 1,253 (12.4%) |
Health Insurance Coverage by Household Income in Sparks
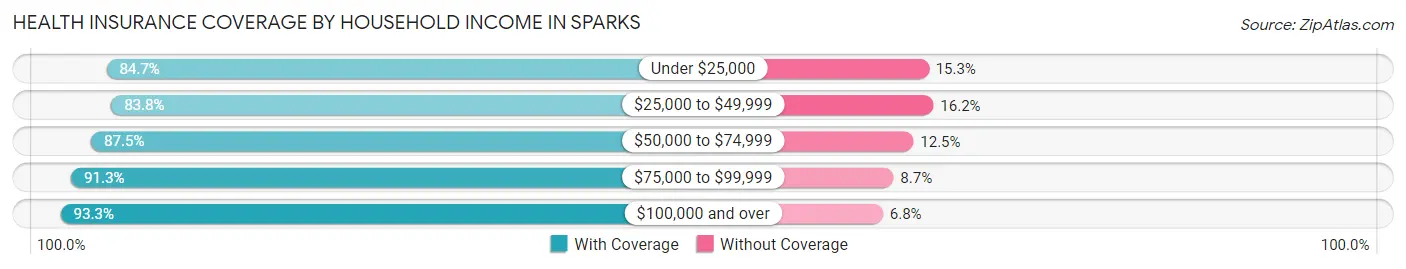
| Household Income | With Coverage | Without Coverage |
| Under $25,000 | 5,503 (84.7%) | 997 (15.3%) |
| $25,000 to $49,999 | 12,444 (83.8%) | 2,411 (16.2%) |
| $50,000 to $74,999 | 15,444 (87.5%) | 2,200 (12.5%) |
| $75,000 to $99,999 | 15,830 (91.3%) | 1,515 (8.7%) |
| $100,000 and over | 47,761 (93.2%) | 3,455 (6.8%) |
Public vs Private Health Insurance Coverage by Age in Sparks
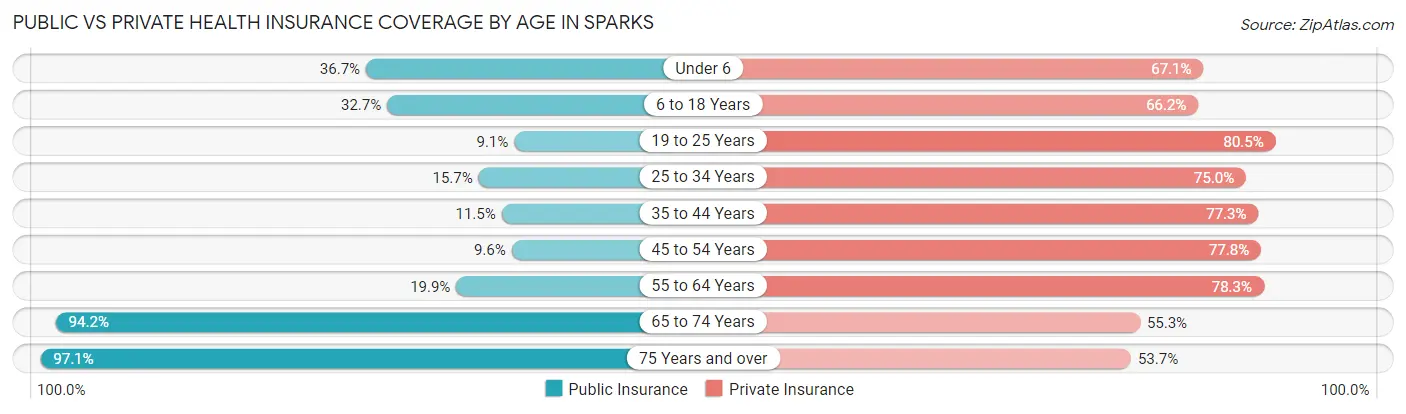
| Age Bracket | Public Insurance | Private Insurance |
| Under 6 | 3,098 (36.6%) | 5,673 (67.1%) |
| 6 to 18 Years | 6,037 (32.7%) | 12,201 (66.1%) |
| 19 to 25 Years | 920 (9.1%) | 8,106 (80.5%) |
| 25 to 34 Years | 2,266 (15.7%) | 10,801 (75.0%) |
| 35 to 44 Years | 1,633 (11.5%) | 11,001 (77.3%) |
| 45 to 54 Years | 1,354 (9.6%) | 10,947 (77.8%) |
| 55 to 64 Years | 2,273 (19.9%) | 8,951 (78.3%) |
| 65 to 74 Years | 9,372 (94.2%) | 5,504 (55.3%) |
| 75 Years and over | 6,388 (97.1%) | 3,533 (53.7%) |
| Total | 33,341 (31.0%) | 76,717 (71.3%) |
Disability Status by Sex by Age in Sparks
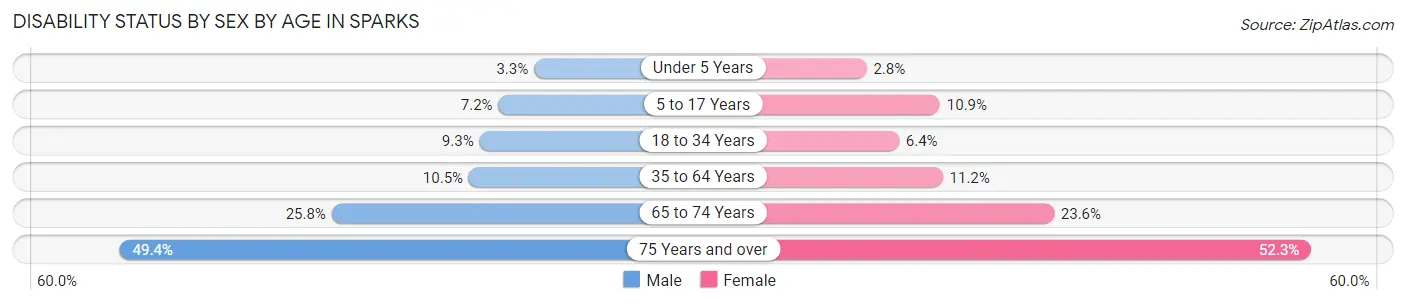
| Age Bracket | Male | Female |
| Under 5 Years | 126 (3.3%) | 80 (2.8%) |
| 5 to 17 Years | 722 (7.2%) | 941 (10.9%) |
| 18 to 34 Years | 1,273 (9.3%) | 784 (6.4%) |
| 35 to 64 Years | 2,113 (10.5%) | 2,204 (11.2%) |
| 65 to 74 Years | 1,158 (25.8%) | 1,289 (23.6%) |
| 75 Years and over | 1,412 (49.4%) | 1,946 (52.3%) |
Disability Class by Sex by Age in Sparks
Disability Class: Hearing Difficulty
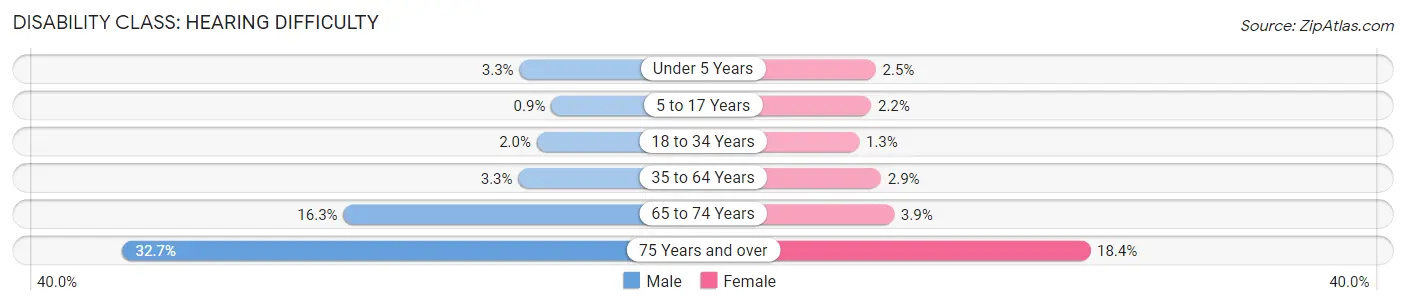
| Age Bracket | Male | Female |
| Under 5 Years | 126 (3.3%) | 73 (2.5%) |
| 5 to 17 Years | 90 (0.9%) | 187 (2.2%) |
| 18 to 34 Years | 268 (2.0%) | 158 (1.3%) |
| 35 to 64 Years | 672 (3.3%) | 570 (2.9%) |
| 65 to 74 Years | 733 (16.3%) | 211 (3.9%) |
| 75 Years and over | 935 (32.7%) | 686 (18.4%) |
Disability Class: Vision Difficulty
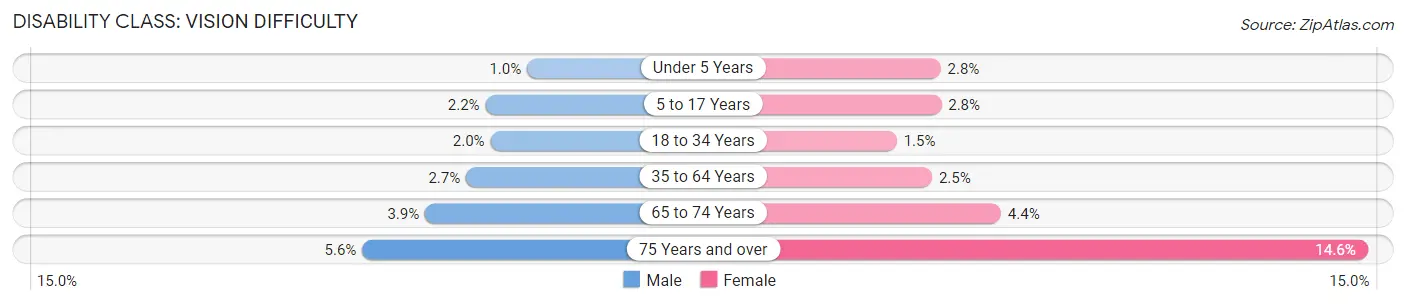
| Age Bracket | Male | Female |
| Under 5 Years | 39 (1.0%) | 80 (2.8%) |
| 5 to 17 Years | 217 (2.2%) | 239 (2.8%) |
| 18 to 34 Years | 277 (2.0%) | 189 (1.5%) |
| 35 to 64 Years | 545 (2.7%) | 492 (2.5%) |
| 65 to 74 Years | 173 (3.8%) | 242 (4.4%) |
| 75 Years and over | 160 (5.6%) | 545 (14.6%) |
Disability Class: Cognitive Difficulty
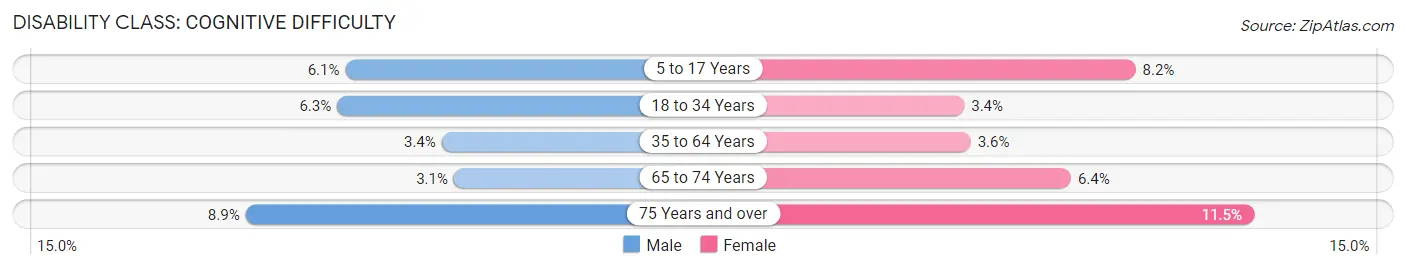
| Age Bracket | Male | Female |
| 5 to 17 Years | 606 (6.1%) | 705 (8.2%) |
| 18 to 34 Years | 859 (6.3%) | 421 (3.4%) |
| 35 to 64 Years | 681 (3.4%) | 704 (3.6%) |
| 65 to 74 Years | 137 (3.0%) | 348 (6.4%) |
| 75 Years and over | 253 (8.8%) | 427 (11.5%) |
Disability Class: Ambulatory Difficulty
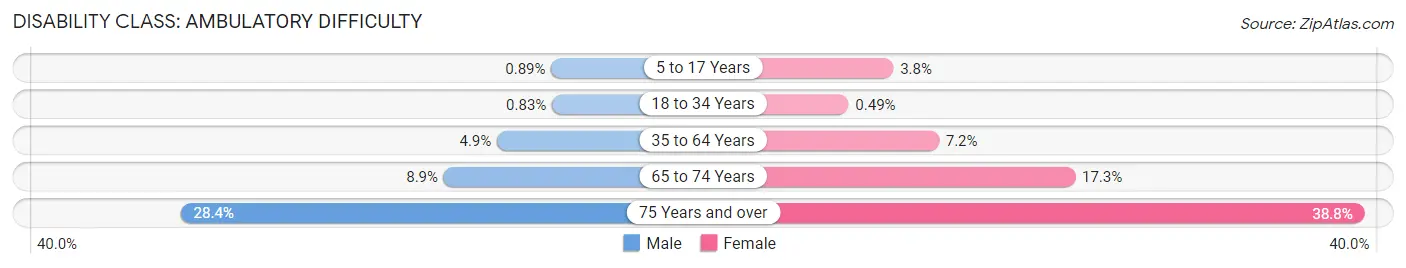
| Age Bracket | Male | Female |
| 5 to 17 Years | 89 (0.9%) | 329 (3.8%) |
| 18 to 34 Years | 113 (0.8%) | 61 (0.5%) |
| 35 to 64 Years | 988 (4.9%) | 1,413 (7.2%) |
| 65 to 74 Years | 398 (8.9%) | 945 (17.3%) |
| 75 Years and over | 812 (28.4%) | 1,445 (38.8%) |
Disability Class: Self-Care Difficulty
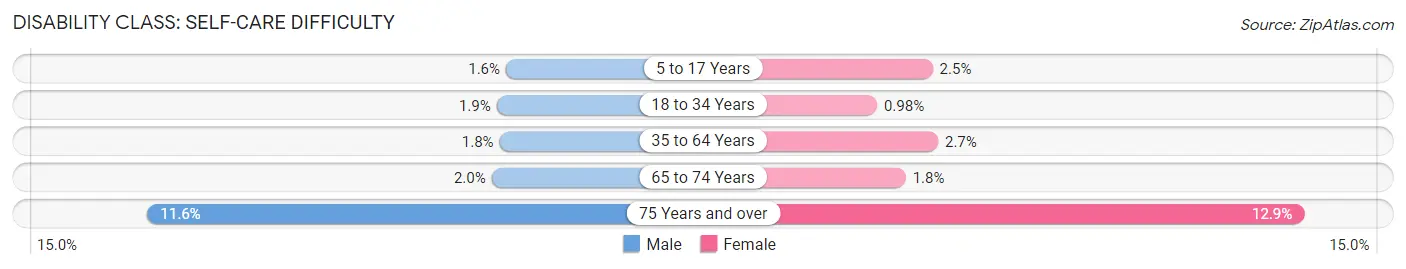
| Age Bracket | Male | Female |
| 5 to 17 Years | 160 (1.6%) | 218 (2.5%) |
| 18 to 34 Years | 254 (1.9%) | 121 (1.0%) |
| 35 to 64 Years | 358 (1.8%) | 527 (2.7%) |
| 65 to 74 Years | 90 (2.0%) | 97 (1.8%) |
| 75 Years and over | 331 (11.6%) | 479 (12.9%) |
Technology Access in Sparks
Computing Device Access in Sparks
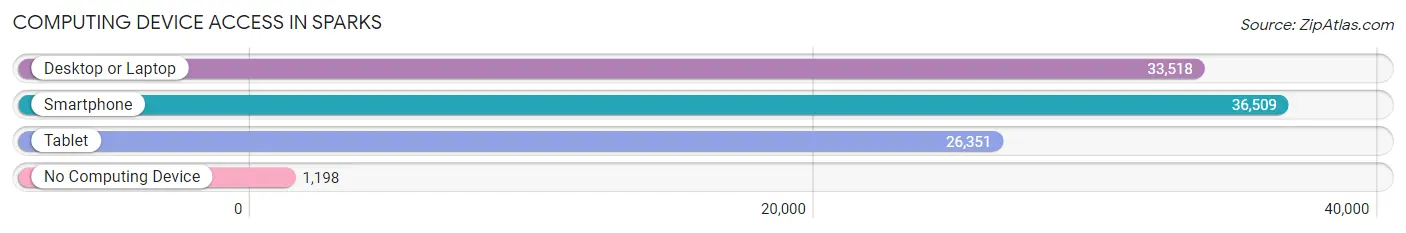
| Device Type | # Households | % Households |
| Desktop or Laptop | 33,518 | 83.1% |
| Smartphone | 36,509 | 90.5% |
| Tablet | 26,351 | 65.3% |
| No Computing Device | 1,198 | 3.0% |
| Total | 40,325 | 100.0% |
Internet Access in Sparks
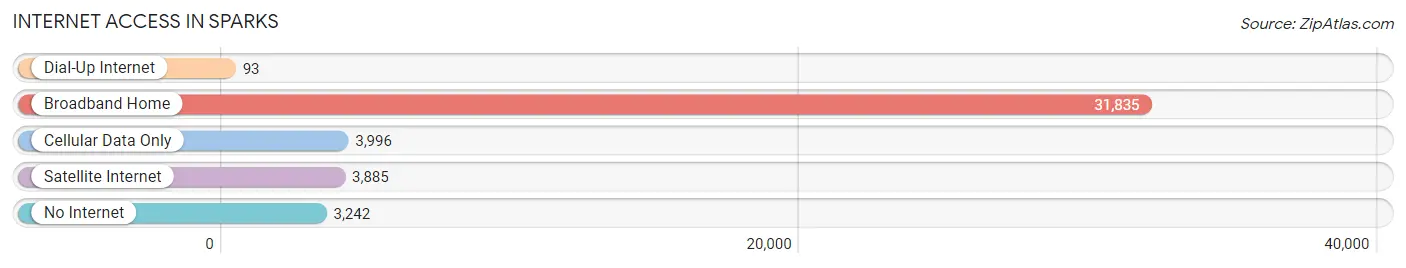
| Internet Type | # Households | % Households |
| Dial-Up Internet | 93 | 0.2% |
| Broadband Home | 31,835 | 78.9% |
| Cellular Data Only | 3,996 | 9.9% |
| Satellite Internet | 3,885 | 9.6% |
| No Internet | 3,242 | 8.0% |
| Total | 40,325 | 100.0% |
Sparks Summary
Sparks, Nevada is a city located in Washoe County, in the northwestern part of the state. It is part of the Reno-Sparks metropolitan area, and is located just east of Reno. The city has a population of approximately 100,000 people, making it the fifth-largest city in the state.
Geography
Sparks is located in the Truckee Meadows region of the Great Basin, at the base of the Sierra Nevada mountain range. The city is situated at an elevation of 4,400 feet, and is surrounded by mountains on all sides. The Truckee River runs through the city, and is a major source of water for the area. The city is located in a semi-arid climate, with hot summers and cold winters.
Economy
Sparks is a major economic center in the region, and is home to a variety of businesses and industries. The city is home to several large employers, including the University of Nevada, Reno, the Reno-Sparks Convention and Visitors Authority, and the Reno-Tahoe International Airport. The city is also home to a number of manufacturing and technology companies, including Tesla Motors, Panasonic, and Microsoft.
Demographics
As of the 2010 census, the population of Sparks was 97,988. The racial makeup of the city was 79.2% White, 4.2% African American, 1.2% Native American, 5.3% Asian, 0.3% Pacific Islander, and 8.9% from other races. Hispanic or Latino of any race were 19.2% of the population.
The median income for a household in Sparks was $50,945, and the median income for a family was $60,945. The per capita income for the city was $25,945. About 8.2% of families and 11.2% of the population were below the poverty line, including 15.2% of those under age 18 and 6.2% of those age 65 or over.
History
Sparks was founded in 1904, when the Southern Pacific Railroad built a rail line through the area. The city was named after John Sparks, the Governor of Nevada at the time. The city quickly grew, and by the 1920s, it was a major hub for the region. The city was home to a number of industries, including a large copper smelter, a sugar beet factory, and a number of other businesses.
In the 1950s, the city began to experience a period of growth and development. The city was home to a number of new businesses, including a number of casinos and resorts. The city also became a major transportation hub, with the completion of the Reno-Tahoe International Airport in the late 1960s.
Today, Sparks is a thriving city, with a diverse economy and a vibrant culture. The city is home to a number of attractions, including the Sparks Marina Park, the Sparks Heritage Museum, and the Sparks Nugget Casino. The city is also home to a number of festivals and events, including the Hot August Nights car show and the Great Reno Balloon Race.
Common Questions
What is Per Capita Income in Sparks?
Per Capita income in Sparks is $37,980.
What is the Median Family Income in Sparks?
Median Family Income in Sparks is $95,739.
What is the Median Household income in Sparks?
Median Household Income in Sparks is $82,938.
What is Income or Wage Gap in Sparks?
Income or Wage Gap in Sparks is 27.8%.
Women in Sparks earn 72.2 cents for every dollar earned by a man.
What is Family Income Deficit in Sparks?
Family Income Deficit in Sparks is $8,523.
Families that are below poverty line in Sparks earn $8,523 less on average than the poverty threshold level.
What is Inequality or Gini Index in Sparks?
Inequality or Gini Index in Sparks is 0.40.
What is the Total Population of Sparks?
Total Population of Sparks is 108,025.
What is the Total Male Population of Sparks?
Total Male Population of Sparks is 55,203.
What is the Total Female Population of Sparks?
Total Female Population of Sparks is 52,822.
What is the Ratio of Males per 100 Females in Sparks?
There are 104.51 Males per 100 Females in Sparks.
What is the Ratio of Females per 100 Males in Sparks?
There are 95.69 Females per 100 Males in Sparks.
What is the Median Population Age in Sparks?
Median Population Age in Sparks is 37.0 Years.
What is the Average Family Size in Sparks
Average Family Size in Sparks is 3.2 People.
What is the Average Household Size in Sparks
Average Household Size in Sparks is 2.7 People.
How Large is the Labor Force in Sparks?
There are 58,183 People in the Labor Forcein in Sparks.
What is the Percentage of People in the Labor Force in Sparks?
68.2% of People are in the Labor Force in Sparks.
What is the Unemployment Rate in Sparks?
Unemployment Rate in Sparks is 6.1%.