San Marcos, TX Map & Demographics
San Marcos Map
San Marcos Overview
$25,282
PER CAPITA INCOME
$60,805
AVG FAMILY INCOME
$47,394
AVG HOUSEHOLD INCOME
37.3%
WAGE / INCOME GAP [ % ]
62.7¢/ $1
WAGE / INCOME GAP [ $ ]
$9,714
FAMILY INCOME DEFICIT
0.47
INEQUALITY / GINI INDEX
67,143
TOTAL POPULATION
31,946
MALE POPULATION
35,197
FEMALE POPULATION
90.76
MALES / 100 FEMALES
110.18
FEMALES / 100 MALES
25.2
MEDIAN AGE
2.8
AVG FAMILY SIZE
2.3
AVG HOUSEHOLD SIZE
39,755
LABOR FORCE [ PEOPLE ]
66.8%
PERCENT IN LABOR FORCE
6.8%
UNEMPLOYMENT RATE
San Marcos Zip Codes
San Marcos Area Codes
Income in San Marcos
Income Overview in San Marcos
Per Capita Income in San Marcos is $25,282, while median incomes of families and households are $60,805 and $47,394 respectively.
| Characteristic | Number | Measure |
| Per Capita Income | 67,143 | $25,282 |
| Median Family Income | 11,850 | $60,805 |
| Mean Family Income | 11,850 | $80,774 |
| Median Household Income | 26,980 | $47,394 |
| Mean Household Income | 26,980 | $60,543 |
| Income Deficit | 11,850 | $9,714 |
| Wage / Income Gap (%) | 67,143 | 37.33% |
| Wage / Income Gap ($) | 67,143 | 62.67¢ per $1 |
| Gini / Inequality Index | 67,143 | 0.47 |
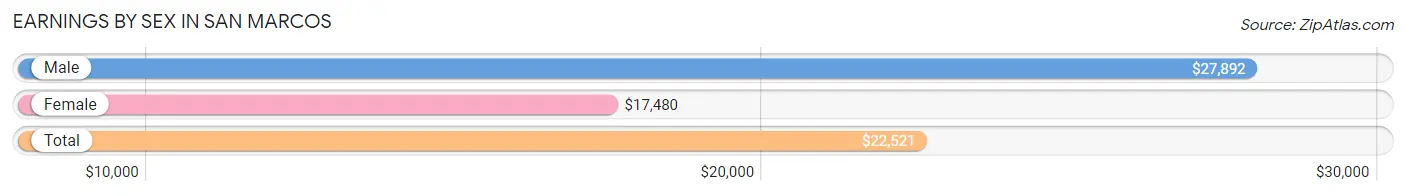
Earnings by Sex in San Marcos
Average Earnings in San Marcos are $22,521, $27,892 for men and $17,480 for women, a difference of 37.3%.
| Sex | Number | Average Earnings |
| Male | 21,983 (50.2%) | $27,892 |
| Female | 21,844 (49.8%) | $17,480 |
| Total | 43,827 (100.0%) | $22,521 |
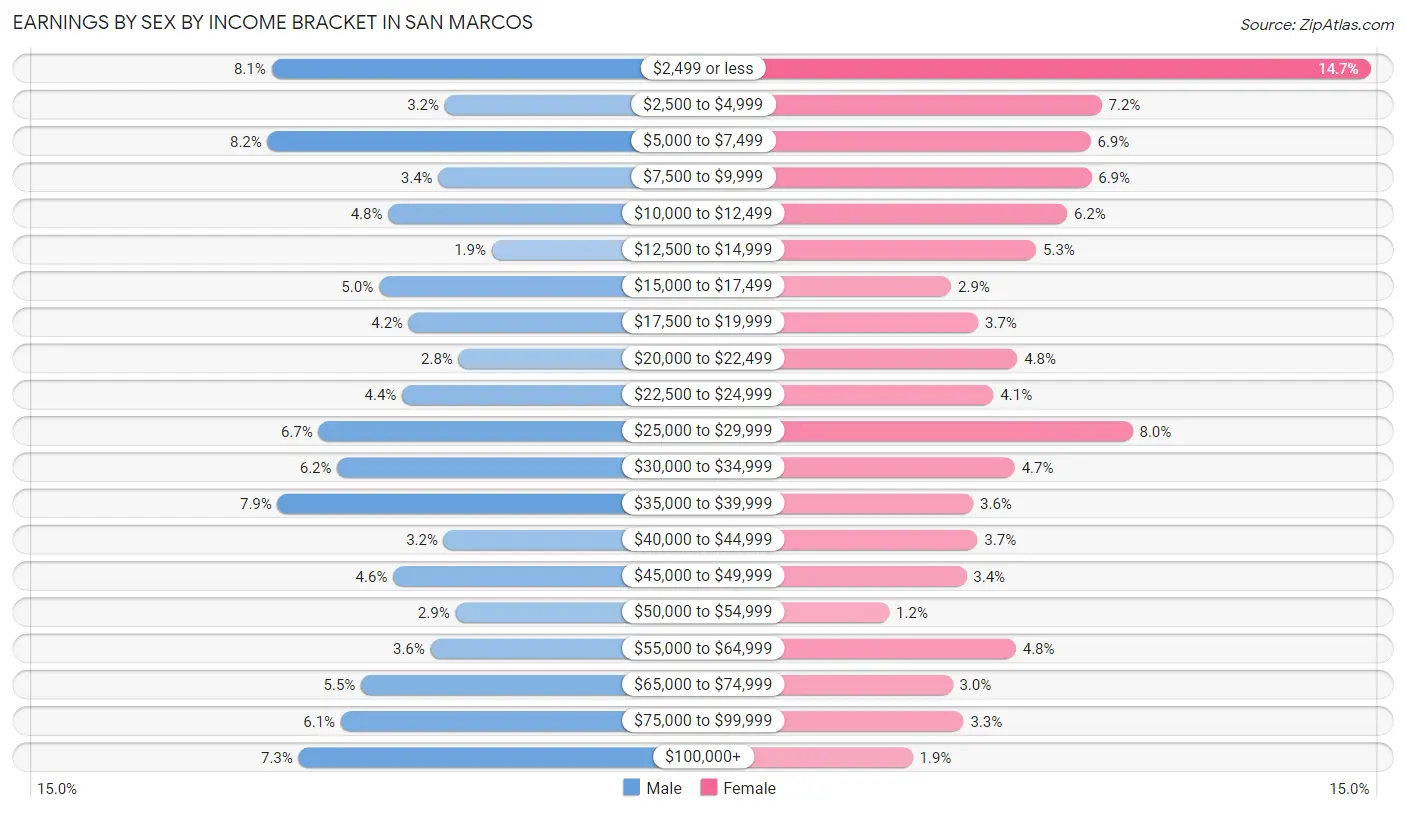
Earnings by Sex by Income Bracket in San Marcos
The most common earnings brackets in San Marcos are $5,000 to $7,499 for men (1,797 | 8.2%) and $2,499 or less for women (3,213 | 14.7%).
| Income | Male | Female |
| $2,499 or less | 1,772 (8.1%) | 3,213 (14.7%) |
| $2,500 to $4,999 | 702 (3.2%) | 1,563 (7.2%) |
| $5,000 to $7,499 | 1,797 (8.2%) | 1,496 (6.9%) |
| $7,500 to $9,999 | 740 (3.4%) | 1,500 (6.9%) |
| $10,000 to $12,499 | 1,050 (4.8%) | 1,352 (6.2%) |
| $12,500 to $14,999 | 410 (1.9%) | 1,162 (5.3%) |
| $15,000 to $17,499 | 1,108 (5.0%) | 641 (2.9%) |
| $17,500 to $19,999 | 923 (4.2%) | 807 (3.7%) |
| $20,000 to $22,499 | 616 (2.8%) | 1,046 (4.8%) |
| $22,500 to $24,999 | 964 (4.4%) | 900 (4.1%) |
| $25,000 to $29,999 | 1,482 (6.7%) | 1,753 (8.0%) |
| $30,000 to $34,999 | 1,365 (6.2%) | 1,030 (4.7%) |
| $35,000 to $39,999 | 1,735 (7.9%) | 776 (3.5%) |
| $40,000 to $44,999 | 707 (3.2%) | 801 (3.7%) |
| $45,000 to $49,999 | 1,021 (4.6%) | 735 (3.4%) |
| $50,000 to $54,999 | 636 (2.9%) | 261 (1.2%) |
| $55,000 to $64,999 | 790 (3.6%) | 1,038 (4.8%) |
| $65,000 to $74,999 | 1,217 (5.5%) | 648 (3.0%) |
| $75,000 to $99,999 | 1,344 (6.1%) | 717 (3.3%) |
| $100,000+ | 1,604 (7.3%) | 405 (1.8%) |
| Total | 21,983 (100.0%) | 21,844 (100.0%) |
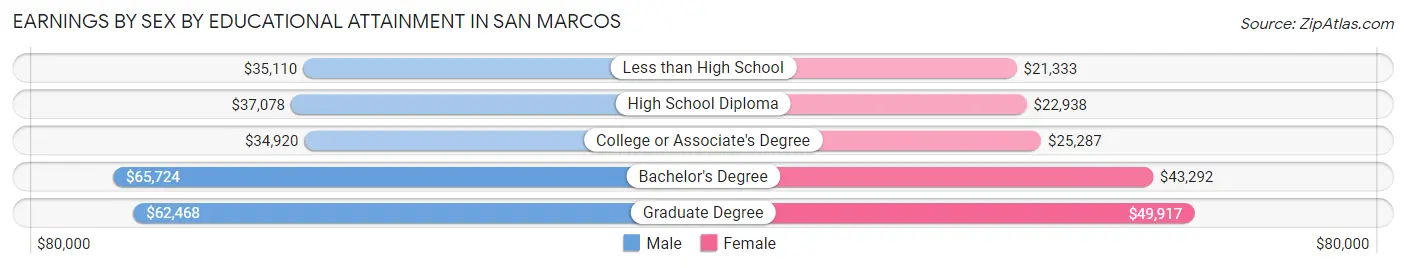
Earnings by Sex by Educational Attainment in San Marcos
Average earnings in San Marcos are $39,621 for men and $30,243 for women, a difference of 23.7%. Men with an educational attainment of bachelor's degree enjoy the highest average annual earnings of $65,724, while those with college or associate's degree education earn the least with $34,920. Women with an educational attainment of graduate degree earn the most with the average annual earnings of $49,917, while those with less than high school education have the smallest earnings of $21,333.
| Educational Attainment | Male Income | Female Income |
| Less than High School | $35,110 | $21,333 |
| High School Diploma | $37,078 | $22,938 |
| College or Associate's Degree | $34,920 | $25,287 |
| Bachelor's Degree | $65,724 | $43,292 |
| Graduate Degree | $62,468 | $49,917 |
| Total | $39,621 | $30,243 |
Family Income in San Marcos
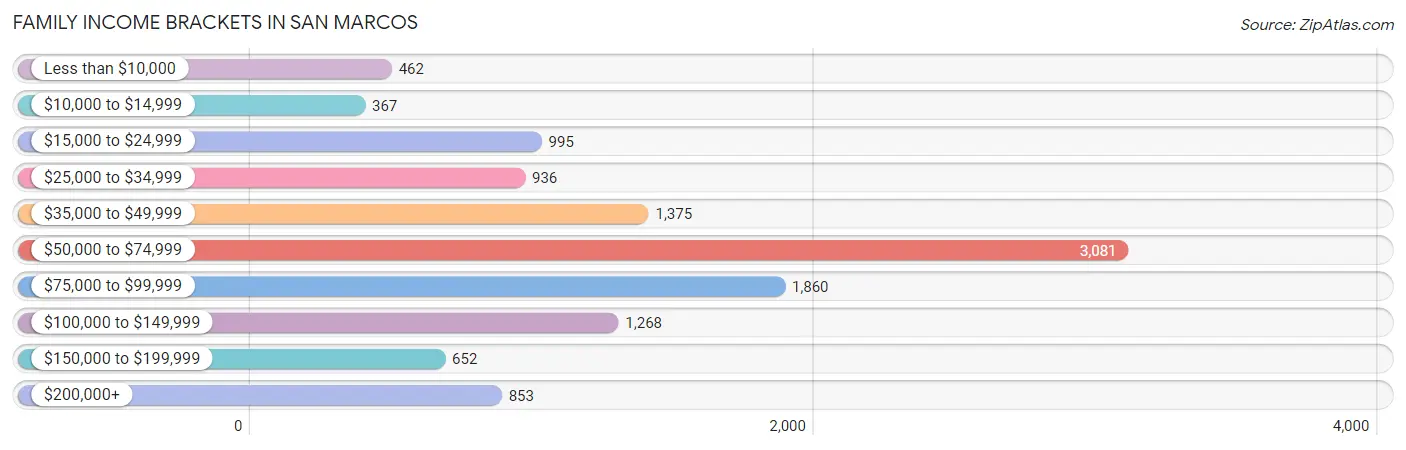
Family Income Brackets in San Marcos
According to the San Marcos family income data, there are 3,081 families falling into the $50,000 to $74,999 income range, which is the most common income bracket and makes up 26.0% of all families. Conversely, the $10,000 to $14,999 income bracket is the least frequent group with only 367 families (3.1%) belonging to this category.
| Income Bracket | # Families | % Families |
| Less than $10,000 | 462 | 3.9% |
| $10,000 to $14,999 | 367 | 3.1% |
| $15,000 to $24,999 | 995 | 8.4% |
| $25,000 to $34,999 | 936 | 7.9% |
| $35,000 to $49,999 | 1,375 | 11.6% |
| $50,000 to $74,999 | 3,081 | 26.0% |
| $75,000 to $99,999 | 1,860 | 15.7% |
| $100,000 to $149,999 | 1,268 | 10.7% |
| $150,000 to $199,999 | 652 | 5.5% |
| $200,000+ | 853 | 7.2% |
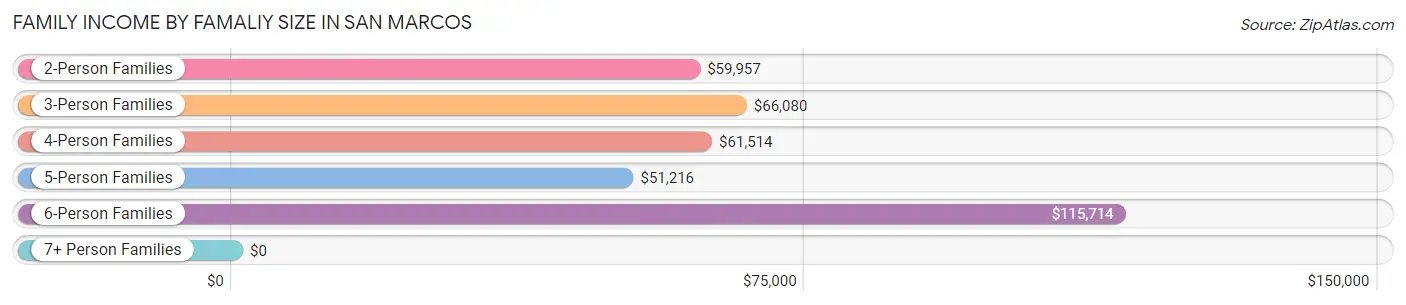
Family Income by Famaliy Size in San Marcos
6-person families (138 | 1.2%) account for the highest median family income in San Marcos with $115,714 per family, while 2-person families (6,334 | 53.4%) have the highest median income of $29,978 per family member.
| Income Bracket | # Families | Median Income |
| 2-Person Families | 6,334 (53.4%) | $59,957 |
| 3-Person Families | 2,743 (23.2%) | $66,080 |
| 4-Person Families | 1,849 (15.6%) | $61,514 |
| 5-Person Families | 650 (5.5%) | $51,216 |
| 6-Person Families | 138 (1.2%) | $115,714 |
| 7+ Person Families | 136 (1.1%) | $0 |
| Total | 11,850 (100.0%) | $60,805 |
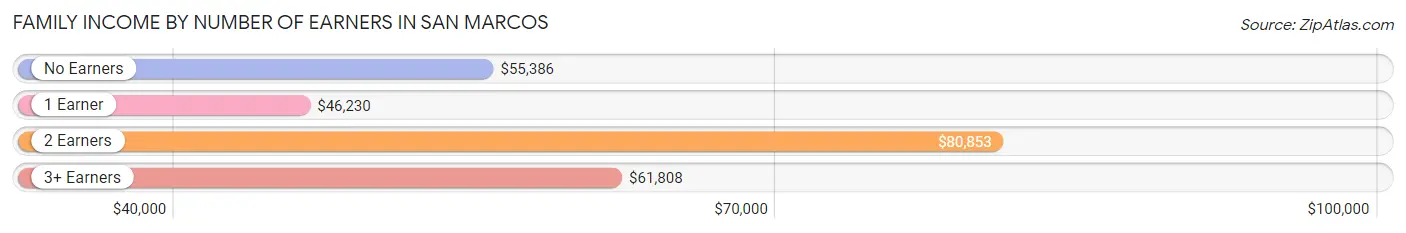
Family Income by Number of Earners in San Marcos
The median family income in San Marcos is $60,805, with families comprising 2 earners (5,858) having the highest median family income of $80,853, while families with 1 earner (3,296) have the lowest median family income of $46,230, accounting for 49.4% and 27.8% of families, respectively.
| Number of Earners | # Families | Median Income |
| No Earners | 1,382 (11.7%) | $55,386 |
| 1 Earner | 3,296 (27.8%) | $46,230 |
| 2 Earners | 5,858 (49.4%) | $80,853 |
| 3+ Earners | 1,314 (11.1%) | $61,808 |
| Total | 11,850 (100.0%) | $60,805 |
Household Income in San Marcos
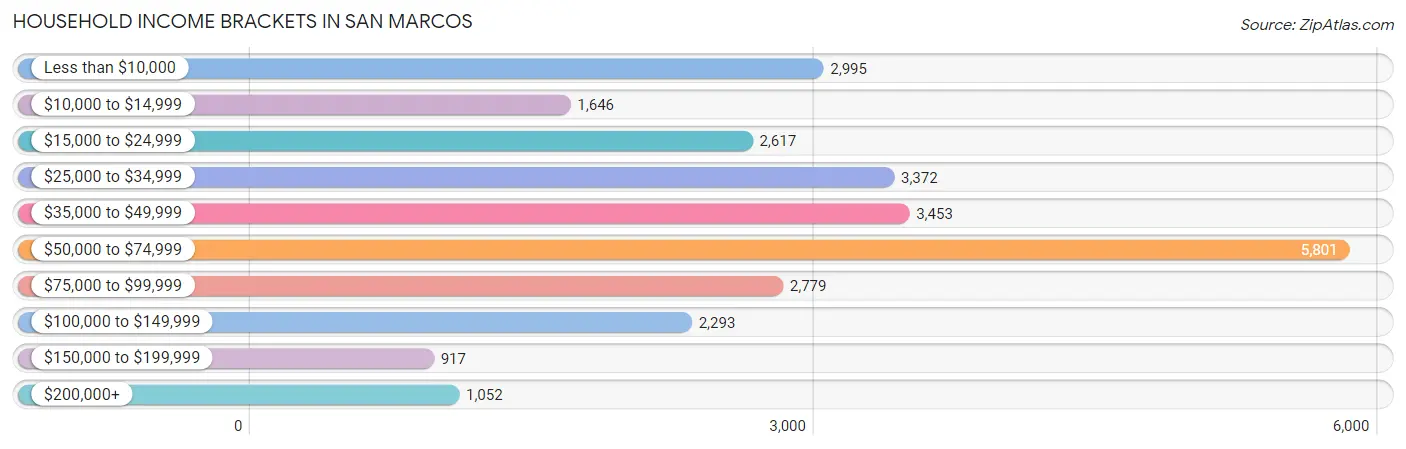
Household Income Brackets in San Marcos
With 5,801 households falling in the category, the $50,000 to $74,999 income range is the most frequent in San Marcos, accounting for 21.5% of all households. In contrast, only 917 households (3.4%) fall into the $150,000 to $199,999 income bracket, making it the least populous group.
| Income Bracket | # Households | % Households |
| Less than $10,000 | 2,995 | 11.1% |
| $10,000 to $14,999 | 1,646 | 6.1% |
| $15,000 to $24,999 | 2,617 | 9.7% |
| $25,000 to $34,999 | 3,372 | 12.5% |
| $35,000 to $49,999 | 3,453 | 12.8% |
| $50,000 to $74,999 | 5,801 | 21.5% |
| $75,000 to $99,999 | 2,779 | 10.3% |
| $100,000 to $149,999 | 2,293 | 8.5% |
| $150,000 to $199,999 | 917 | 3.4% |
| $200,000+ | 1,052 | 3.9% |
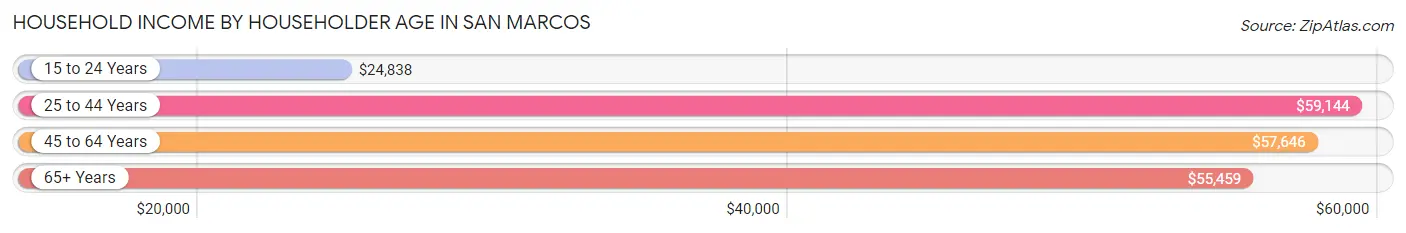
Household Income by Householder Age in San Marcos
The median household income in San Marcos is $47,394, with the highest median household income of $59,144 found in the 25 to 44 years age bracket for the primary householder. A total of 9,755 households (36.2%) fall into this category. Meanwhile, the 15 to 24 years age bracket for the primary householder has the lowest median household income of $24,838, with 8,367 households (31.0%) in this group.
| Income Bracket | # Households | Median Income |
| 15 to 24 Years | 8,367 (31.0%) | $24,838 |
| 25 to 44 Years | 9,755 (36.2%) | $59,144 |
| 45 to 64 Years | 5,378 (19.9%) | $57,646 |
| 65+ Years | 3,480 (12.9%) | $55,459 |
| Total | 26,980 (100.0%) | $47,394 |
Poverty in San Marcos
Income Below Poverty by Sex and Age in San Marcos
With 21.6% poverty level for males and 33.3% for females among the residents of San Marcos, 18 to 24 year old males and 18 to 24 year old females are the most vulnerable to poverty, with 3,419 males (39.4%) and 6,145 females (56.1%) in their respective age groups living below the poverty level.
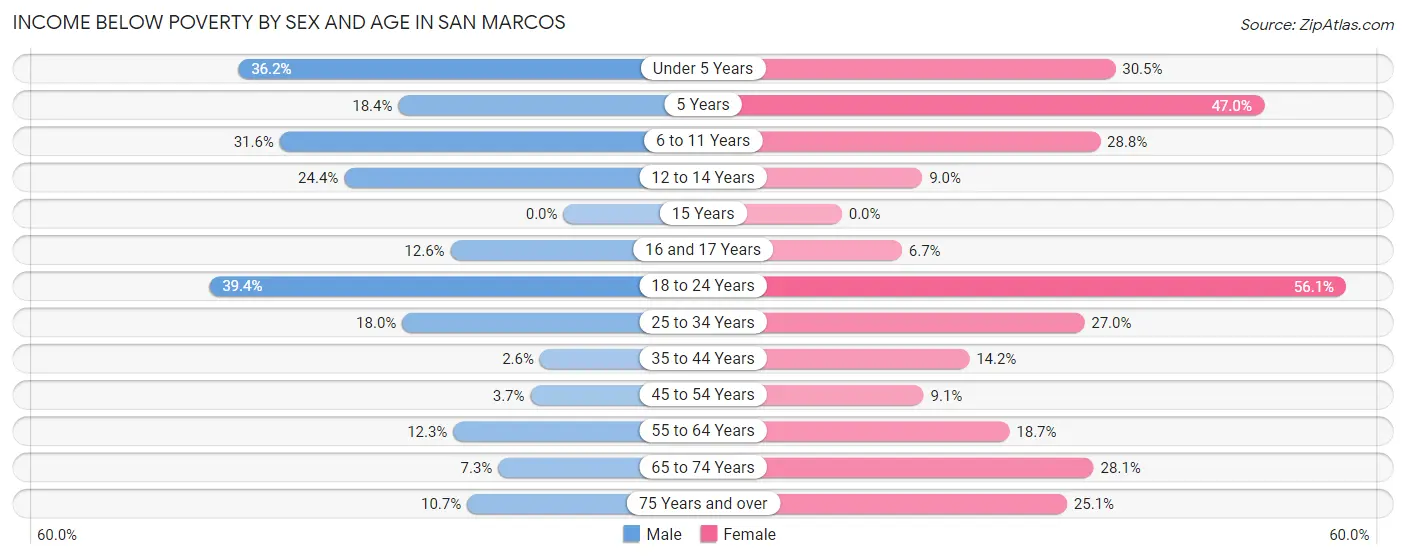
| Age Bracket | Male | Female |
| Under 5 Years | 516 (36.2%) | 392 (30.5%) |
| 5 Years | 34 (18.4%) | 117 (47.0%) |
| 6 to 11 Years | 386 (31.6%) | 317 (28.8%) |
| 12 to 14 Years | 186 (24.4%) | 62 (9.0%) |
| 15 Years | 0 (0.0%) | 0 (0.0%) |
| 16 and 17 Years | 41 (12.6%) | 17 (6.7%) |
| 18 to 24 Years | 3,419 (39.4%) | 6,145 (56.1%) |
| 25 to 34 Years | 1,101 (17.9%) | 1,363 (27.0%) |
| 35 to 44 Years | 92 (2.6%) | 480 (14.2%) |
| 45 to 54 Years | 73 (3.7%) | 232 (9.1%) |
| 55 to 64 Years | 286 (12.3%) | 420 (18.7%) |
| 65 to 74 Years | 127 (7.3%) | 706 (28.1%) |
| 75 Years and over | 79 (10.7%) | 262 (25.1%) |
| Total | 6,340 (21.6%) | 10,513 (33.3%) |
Income Above Poverty by Sex and Age in San Marcos
According to the poverty statistics in San Marcos, males aged 15 years and females aged 15 years are the age groups that are most secure financially, with 100.0% of males and 100.0% of females in these age groups living above the poverty line.
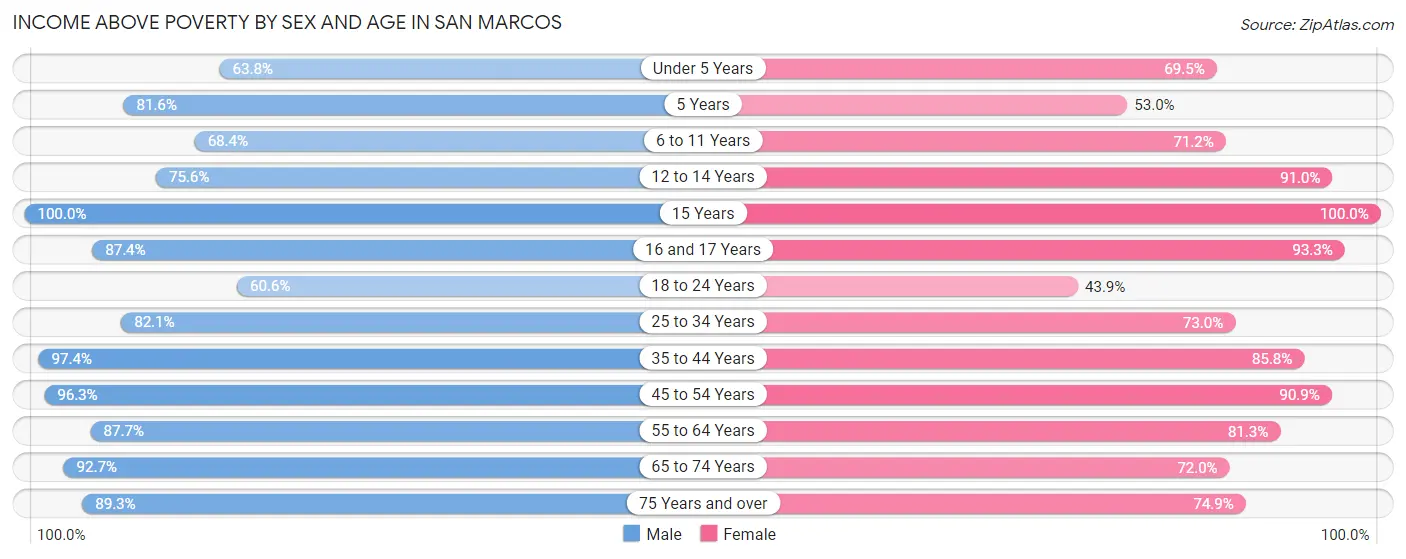
| Age Bracket | Male | Female |
| Under 5 Years | 909 (63.8%) | 895 (69.5%) |
| 5 Years | 151 (81.6%) | 132 (53.0%) |
| 6 to 11 Years | 836 (68.4%) | 785 (71.2%) |
| 12 to 14 Years | 576 (75.6%) | 630 (91.0%) |
| 15 Years | 282 (100.0%) | 301 (100.0%) |
| 16 and 17 Years | 285 (87.4%) | 237 (93.3%) |
| 18 to 24 Years | 5,250 (60.6%) | 4,800 (43.9%) |
| 25 to 34 Years | 5,034 (82.1%) | 3,683 (73.0%) |
| 35 to 44 Years | 3,419 (97.4%) | 2,903 (85.8%) |
| 45 to 54 Years | 1,917 (96.3%) | 2,315 (90.9%) |
| 55 to 64 Years | 2,045 (87.7%) | 1,831 (81.3%) |
| 65 to 74 Years | 1,623 (92.7%) | 1,811 (72.0%) |
| 75 Years and over | 657 (89.3%) | 783 (74.9%) |
| Total | 22,984 (78.4%) | 21,106 (66.7%) |
Income Below Poverty Among Married-Couple Families in San Marcos
The poverty statistics for married-couple families in San Marcos show that 5.2% or 405 of the total 7,797 families live below the poverty line. Families with 3 or 4 children have the highest poverty rate of 16.9%, comprising of 63 families. On the other hand, families with 5 or more children have the lowest poverty rate of 0.0%, which includes 0 families.
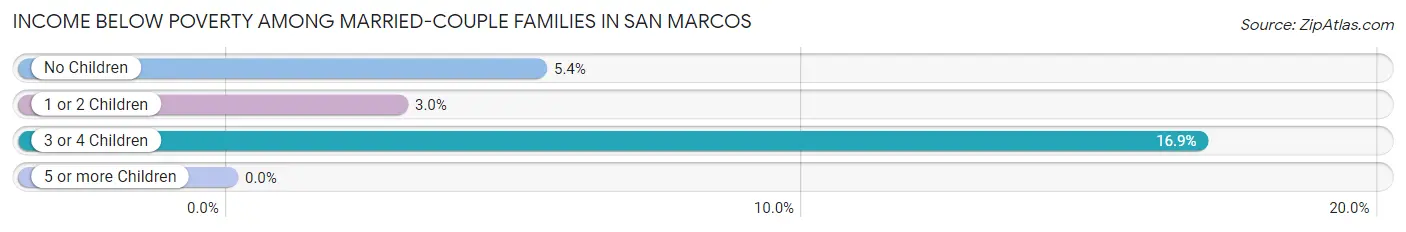
| Children | Above Poverty | Below Poverty |
| No Children | 4,797 (94.6%) | 273 (5.4%) |
| 1 or 2 Children | 2,266 (97.0%) | 69 (3.0%) |
| 3 or 4 Children | 310 (83.1%) | 63 (16.9%) |
| 5 or more Children | 19 (100.0%) | 0 (0.0%) |
| Total | 7,392 (94.8%) | 405 (5.2%) |
Income Below Poverty Among Single-Parent Households in San Marcos
According to the poverty data in San Marcos, 19.5% or 227 single-father households and 32.3% or 933 single-mother households are living below the poverty line. Among single-father households, those with 1 or 2 children have the highest poverty rate, with 137 households (31.8%) experiencing poverty. Likewise, among single-mother households, those with 5 or more children have the highest poverty rate, with 39 households (100.0%) falling below the poverty line.
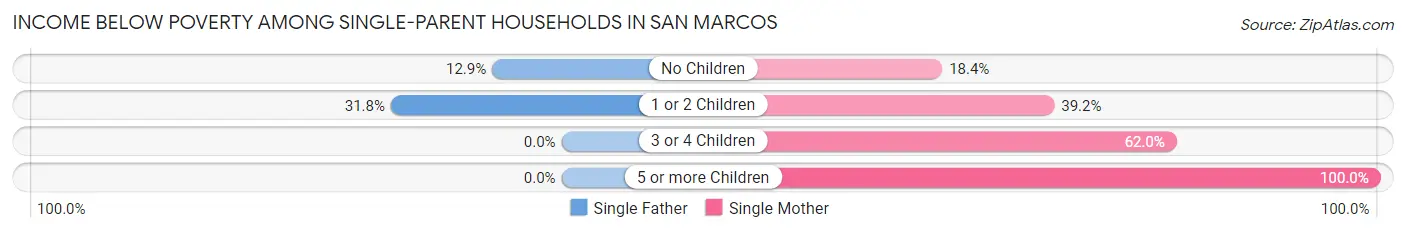
| Children | Single Father | Single Mother |
| No Children | 90 (12.9%) | 255 (18.3%) |
| 1 or 2 Children | 137 (31.8%) | 461 (39.2%) |
| 3 or 4 Children | 0 (0.0%) | 178 (62.0%) |
| 5 or more Children | 0 (0.0%) | 39 (100.0%) |
| Total | 227 (19.5%) | 933 (32.3%) |
Income Below Poverty Among Married-Couple vs Single-Parent Households in San Marcos
The poverty data for San Marcos shows that 405 of the married-couple family households (5.2%) and 1,160 of the single-parent households (28.6%) are living below the poverty level. Within the married-couple family households, those with 3 or 4 children have the highest poverty rate, with 63 households (16.9%) falling below the poverty line. Among the single-parent households, those with 5 or more children have the highest poverty rate, with 39 household (100.0%) living below poverty.
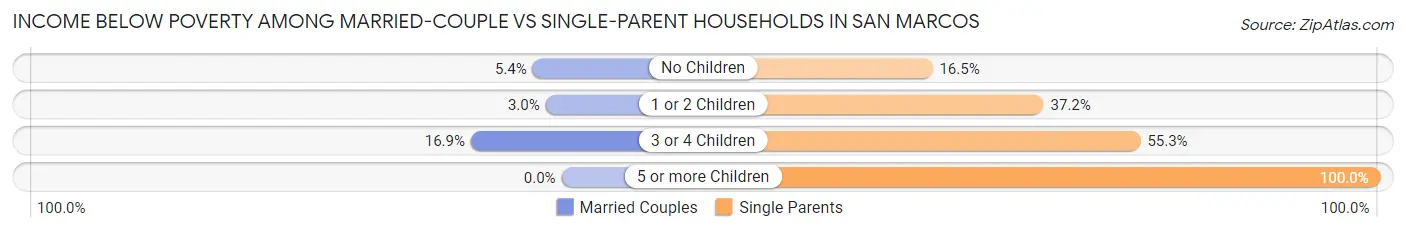
| Children | Married-Couple Families | Single-Parent Households |
| No Children | 273 (5.4%) | 345 (16.5%) |
| 1 or 2 Children | 69 (3.0%) | 598 (37.2%) |
| 3 or 4 Children | 63 (16.9%) | 178 (55.3%) |
| 5 or more Children | 0 (0.0%) | 39 (100.0%) |
| Total | 405 (5.2%) | 1,160 (28.6%) |
Race in San Marcos
The most populous races in San Marcos are White / Caucasian (44,320 | 66.0%), Hispanic or Latino (28,124 | 41.9%), and Two or more Races (11,984 | 17.8%).
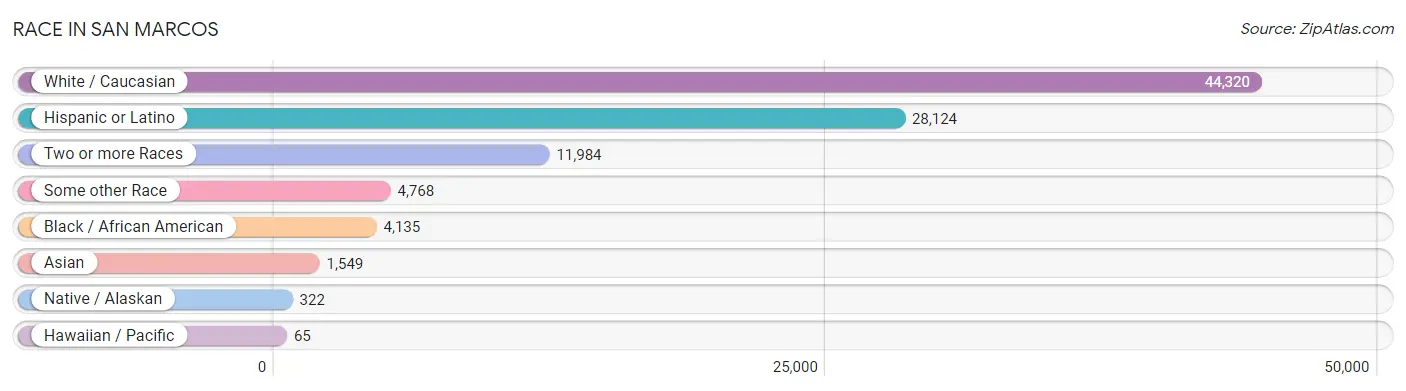
| Race | # Population | % Population |
| Asian | 1,549 | 2.3% |
| Black / African American | 4,135 | 6.2% |
| Hawaiian / Pacific | 65 | 0.1% |
| Hispanic or Latino | 28,124 | 41.9% |
| Native / Alaskan | 322 | 0.5% |
| White / Caucasian | 44,320 | 66.0% |
| Two or more Races | 11,984 | 17.8% |
| Some other Race | 4,768 | 7.1% |
| Total | 67,143 | 100.0% |
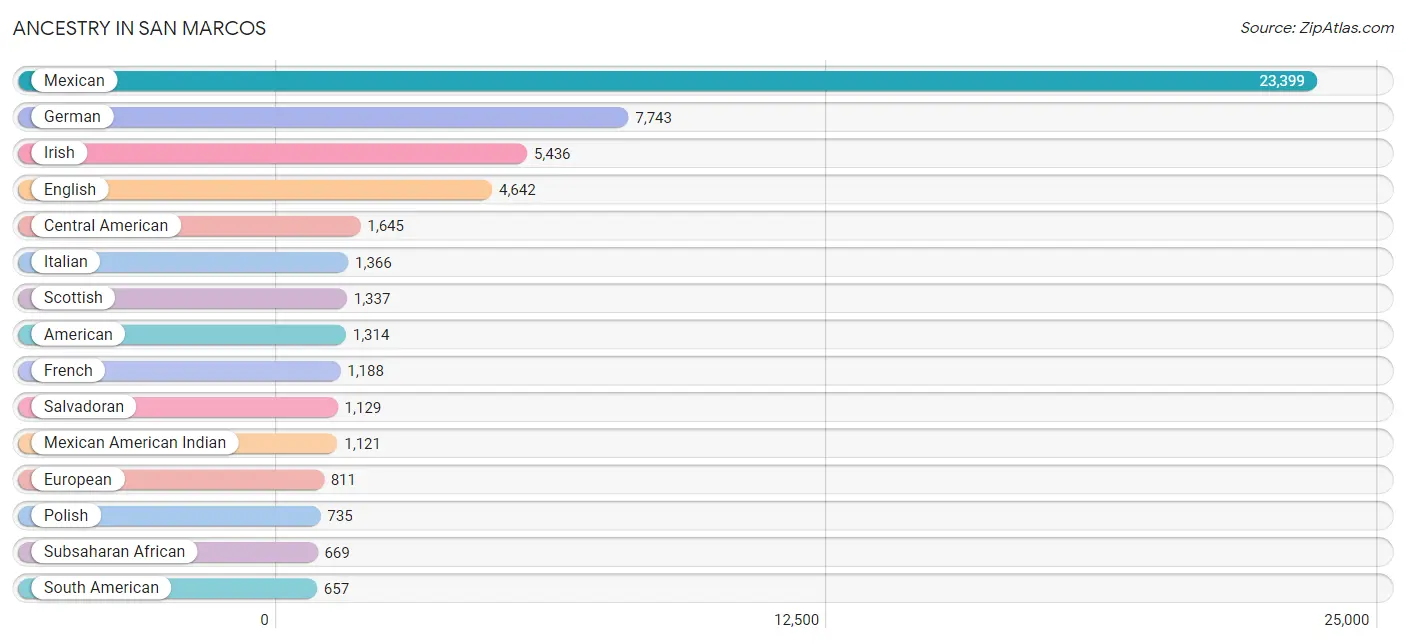
Ancestry in San Marcos
The most populous ancestries reported in San Marcos are Mexican (23,399 | 34.8%), German (7,743 | 11.5%), Irish (5,436 | 8.1%), English (4,642 | 6.9%), and Central American (1,645 | 2.5%), together accounting for 63.8% of all San Marcos residents.
| Ancestry | # Population | % Population |
| African | 481 | 0.7% |
| American | 1,314 | 2.0% |
| Apache | 99 | 0.2% |
| Arab | 359 | 0.5% |
| Argentinean | 35 | 0.1% |
| Armenian | 104 | 0.2% |
| Austrian | 54 | 0.1% |
| Belgian | 123 | 0.2% |
| Bhutanese | 181 | 0.3% |
| Blackfeet | 86 | 0.1% |
| Bolivian | 354 | 0.5% |
| Brazilian | 30 | 0.0% |
| British | 440 | 0.7% |
| Burmese | 101 | 0.2% |
| Cambodian | 5 | 0.0% |
| Canadian | 33 | 0.1% |
| Central American | 1,645 | 2.5% |
| Central American Indian | 12 | 0.0% |
| Cherokee | 179 | 0.3% |
| Cheyenne | 10 | 0.0% |
| Chilean | 21 | 0.0% |
| Choctaw | 226 | 0.3% |
| Colombian | 89 | 0.1% |
| Comanche | 15 | 0.0% |
| Costa Rican | 27 | 0.0% |
| Creek | 25 | 0.0% |
| Croatian | 7 | 0.0% |
| Cuban | 139 | 0.2% |
| Czech | 507 | 0.8% |
| Czechoslovakian | 50 | 0.1% |
| Danish | 24 | 0.0% |
| Dominican | 16 | 0.0% |
| Dutch | 350 | 0.5% |
| Eastern European | 76 | 0.1% |
| Ecuadorian | 51 | 0.1% |
| Egyptian | 85 | 0.1% |
| English | 4,642 | 6.9% |
| European | 811 | 1.2% |
| Filipino | 11 | 0.0% |
| French | 1,188 | 1.8% |
| French Canadian | 249 | 0.4% |
| German | 7,743 | 11.5% |
| Ghanaian | 11 | 0.0% |
| Greek | 57 | 0.1% |
| Guatemalan | 9 | 0.0% |
| Haitian | 18 | 0.0% |
| Honduran | 273 | 0.4% |
| Hungarian | 49 | 0.1% |
| Indian (Asian) | 313 | 0.5% |
| Indonesian | 14 | 0.0% |
| Iranian | 371 | 0.5% |
| Iraqi | 15 | 0.0% |
| Irish | 5,436 | 8.1% |
| Italian | 1,366 | 2.0% |
| Jamaican | 231 | 0.3% |
| Korean | 465 | 0.7% |
| Laotian | 30 | 0.0% |
| Latvian | 30 | 0.0% |
| Lebanese | 74 | 0.1% |
| Liberian | 6 | 0.0% |
| Lithuanian | 28 | 0.0% |
| Mexican | 23,399 | 34.8% |
| Mexican American Indian | 1,121 | 1.7% |
| Mongolian | 14 | 0.0% |
| Native Hawaiian | 155 | 0.2% |
| Navajo | 9 | 0.0% |
| Nicaraguan | 154 | 0.2% |
| Nigerian | 114 | 0.2% |
| Northern European | 50 | 0.1% |
| Norwegian | 482 | 0.7% |
| Pakistani | 44 | 0.1% |
| Palestinian | 86 | 0.1% |
| Panamanian | 53 | 0.1% |
| Pennsylvania German | 16 | 0.0% |
| Peruvian | 11 | 0.0% |
| Polish | 735 | 1.1% |
| Portuguese | 52 | 0.1% |
| Puerto Rican | 603 | 0.9% |
| Russian | 276 | 0.4% |
| Salvadoran | 1,129 | 1.7% |
| Scandinavian | 104 | 0.2% |
| Scotch-Irish | 554 | 0.8% |
| Scottish | 1,337 | 2.0% |
| Sierra Leonean | 8 | 0.0% |
| Sioux | 29 | 0.0% |
| Slavic | 23 | 0.0% |
| Slovak | 41 | 0.1% |
| Slovene | 22 | 0.0% |
| South American | 657 | 1.0% |
| Spaniard | 261 | 0.4% |
| Spanish | 119 | 0.2% |
| Sri Lankan | 330 | 0.5% |
| Subsaharan African | 669 | 1.0% |
| Swedish | 336 | 0.5% |
| Swiss | 36 | 0.1% |
| Thai | 629 | 0.9% |
| Tongan | 11 | 0.0% |
| Trinidadian and Tobagonian | 18 | 0.0% |
| Turkish | 27 | 0.0% |
| Ukrainian | 5 | 0.0% |
| Venezuelan | 96 | 0.1% |
| Vietnamese | 7 | 0.0% |
| Welsh | 406 | 0.6% |
| West Indian | 6 | 0.0% | View All 104 Rows |
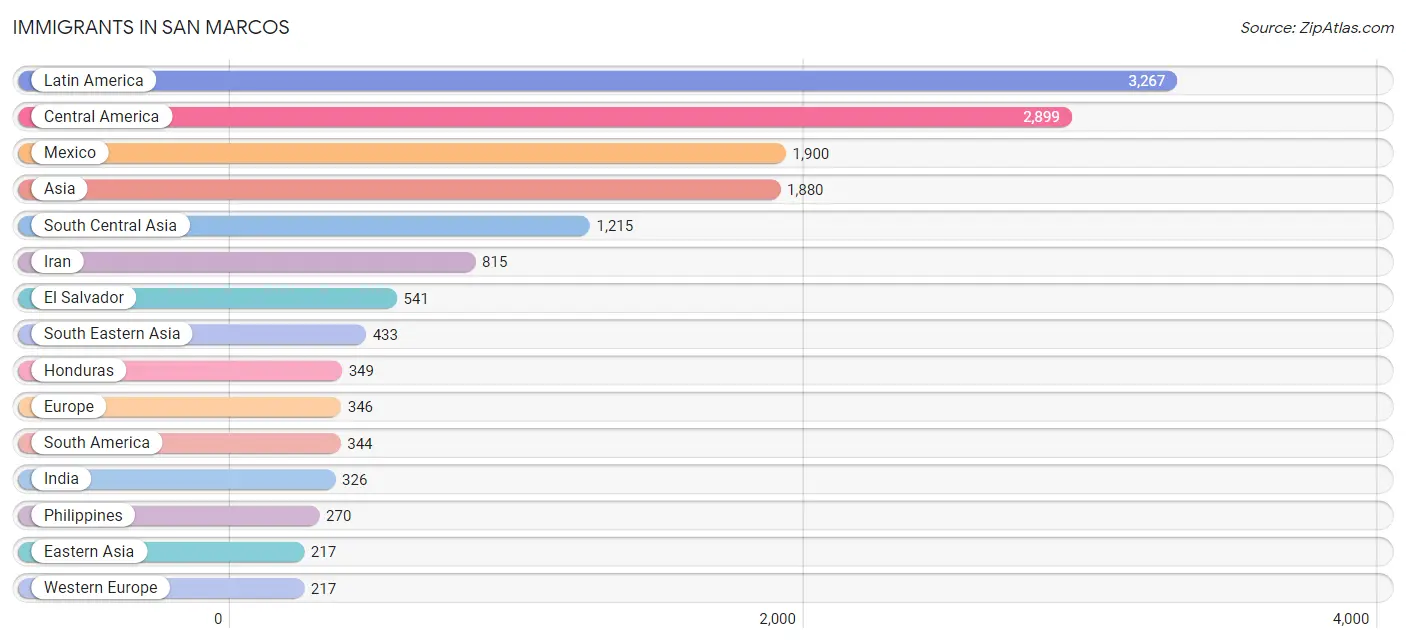
Immigrants in San Marcos
The most numerous immigrant groups reported in San Marcos came from Latin America (3,267 | 4.9%), Central America (2,899 | 4.3%), Mexico (1,900 | 2.8%), Asia (1,880 | 2.8%), and South Central Asia (1,215 | 1.8%), together accounting for 16.6% of all San Marcos residents.
| Immigration Origin | # Population | % Population |
| Africa | 191 | 0.3% |
| Asia | 1,880 | 2.8% |
| Bangladesh | 47 | 0.1% |
| Bolivia | 150 | 0.2% |
| Brazil | 71 | 0.1% |
| Cameroon | 6 | 0.0% |
| Canada | 181 | 0.3% |
| Caribbean | 24 | 0.0% |
| Central America | 2,899 | 4.3% |
| China | 113 | 0.2% |
| Colombia | 33 | 0.1% |
| Cuba | 10 | 0.0% |
| Eastern Africa | 3 | 0.0% |
| Eastern Asia | 217 | 0.3% |
| Eastern Europe | 85 | 0.1% |
| Ecuador | 13 | 0.0% |
| Egypt | 73 | 0.1% |
| El Salvador | 541 | 0.8% |
| Europe | 346 | 0.5% |
| France | 46 | 0.1% |
| Germany | 110 | 0.2% |
| Ghana | 5 | 0.0% |
| Guatemala | 60 | 0.1% |
| Honduras | 349 | 0.5% |
| Hong Kong | 65 | 0.1% |
| India | 326 | 0.5% |
| Indonesia | 8 | 0.0% |
| Iran | 815 | 1.2% |
| Iraq | 15 | 0.0% |
| Jamaica | 14 | 0.0% |
| Japan | 57 | 0.1% |
| Korea | 17 | 0.0% |
| Latin America | 3,267 | 4.9% |
| Latvia | 6 | 0.0% |
| Malaysia | 7 | 0.0% |
| Mexico | 1,900 | 2.8% |
| Middle Africa | 6 | 0.0% |
| Nepal | 20 | 0.0% |
| Netherlands | 61 | 0.1% |
| Nicaragua | 49 | 0.1% |
| Nigeria | 71 | 0.1% |
| Northern Africa | 73 | 0.1% |
| Northern Europe | 5 | 0.0% |
| Pakistan | 7 | 0.0% |
| Peru | 50 | 0.1% |
| Philippines | 270 | 0.4% |
| Poland | 5 | 0.0% |
| Russia | 60 | 0.1% |
| South Africa | 33 | 0.1% |
| South America | 344 | 0.5% |
| South Central Asia | 1,215 | 1.8% |
| South Eastern Asia | 433 | 0.6% |
| Southern Europe | 39 | 0.1% |
| Spain | 39 | 0.1% |
| Taiwan | 1 | 0.0% |
| Ukraine | 14 | 0.0% |
| Venezuela | 27 | 0.0% |
| Vietnam | 142 | 0.2% |
| Western Africa | 76 | 0.1% |
| Western Asia | 15 | 0.0% |
| Western Europe | 217 | 0.3% | View All 61 Rows |
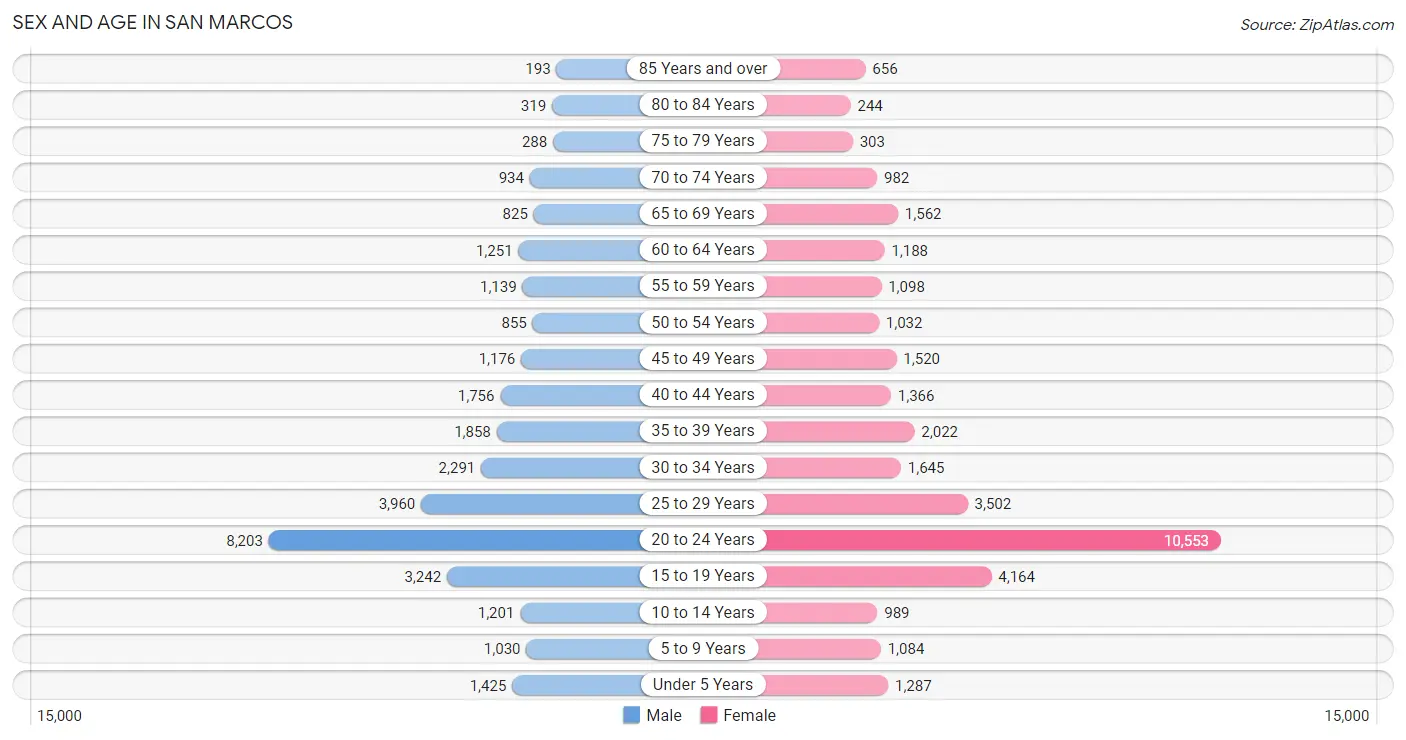
Sex and Age in San Marcos
Sex and Age in San Marcos
The most populous age groups in San Marcos are 20 to 24 Years (8,203 | 25.7%) for men and 20 to 24 Years (10,553 | 30.0%) for women.
| Age Bracket | Male | Female |
| Under 5 Years | 1,425 (4.5%) | 1,287 (3.7%) |
| 5 to 9 Years | 1,030 (3.2%) | 1,084 (3.1%) |
| 10 to 14 Years | 1,201 (3.8%) | 989 (2.8%) |
| 15 to 19 Years | 3,242 (10.2%) | 4,164 (11.8%) |
| 20 to 24 Years | 8,203 (25.7%) | 10,553 (30.0%) |
| 25 to 29 Years | 3,960 (12.4%) | 3,502 (10.0%) |
| 30 to 34 Years | 2,291 (7.2%) | 1,645 (4.7%) |
| 35 to 39 Years | 1,858 (5.8%) | 2,022 (5.7%) |
| 40 to 44 Years | 1,756 (5.5%) | 1,366 (3.9%) |
| 45 to 49 Years | 1,176 (3.7%) | 1,520 (4.3%) |
| 50 to 54 Years | 855 (2.7%) | 1,032 (2.9%) |
| 55 to 59 Years | 1,139 (3.6%) | 1,098 (3.1%) |
| 60 to 64 Years | 1,251 (3.9%) | 1,188 (3.4%) |
| 65 to 69 Years | 825 (2.6%) | 1,562 (4.4%) |
| 70 to 74 Years | 934 (2.9%) | 982 (2.8%) |
| 75 to 79 Years | 288 (0.9%) | 303 (0.9%) |
| 80 to 84 Years | 319 (1.0%) | 244 (0.7%) |
| 85 Years and over | 193 (0.6%) | 656 (1.9%) |
| Total | 31,946 (100.0%) | 35,197 (100.0%) |
Families and Households in San Marcos
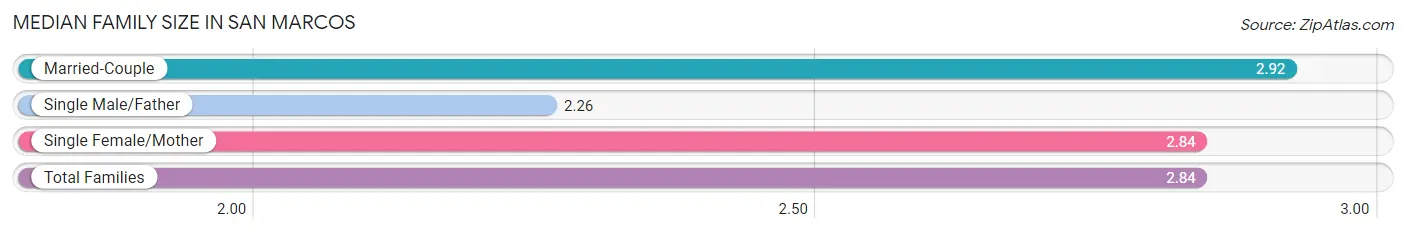
Median Family Size in San Marcos
The median family size in San Marcos is 2.84 persons per family, with married-couple families (7,797 | 65.8%) accounting for the largest median family size of 2.92 persons per family. On the other hand, single male/father families (1,162 | 9.8%) represent the smallest median family size with 2.26 persons per family.
| Family Type | # Families | Family Size |
| Married-Couple | 7,797 (65.8%) | 2.92 |
| Single Male/Father | 1,162 (9.8%) | 2.26 |
| Single Female/Mother | 2,891 (24.4%) | 2.84 |
| Total Families | 11,850 (100.0%) | 2.84 |
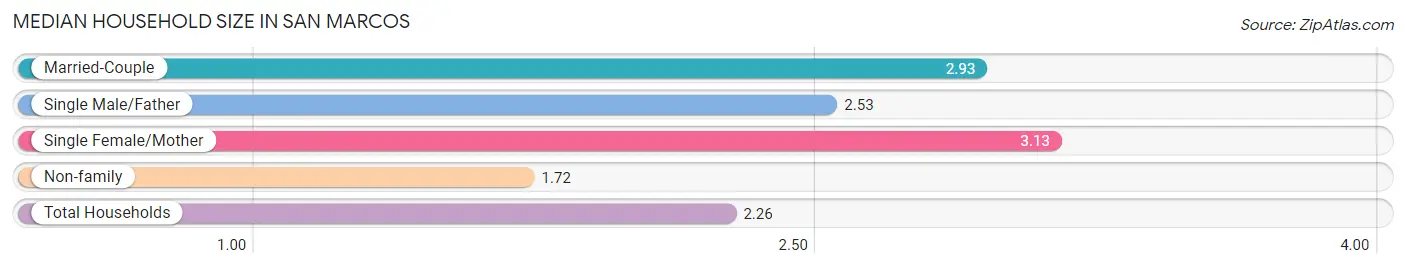
Median Household Size in San Marcos
The median household size in San Marcos is 2.26 persons per household, with single female/mother households (2,891 | 10.7%) accounting for the largest median household size of 3.13 persons per household. non-family households (15,130 | 56.1%) represent the smallest median household size with 1.72 persons per household.
| Household Type | # Households | Household Size |
| Married-Couple | 7,797 (28.9%) | 2.93 |
| Single Male/Father | 1,162 (4.3%) | 2.53 |
| Single Female/Mother | 2,891 (10.7%) | 3.13 |
| Non-family | 15,130 (56.1%) | 1.72 |
| Total Households | 26,980 (100.0%) | 2.26 |
Household Size by Marriage Status in San Marcos
Out of a total of 26,980 households in San Marcos, 11,850 (43.9%) are family households, while 15,130 (56.1%) are nonfamily households. The most numerous type of family households are 2-person households, comprising 5,795, and the most common type of nonfamily households are 1-person households, comprising 7,955.
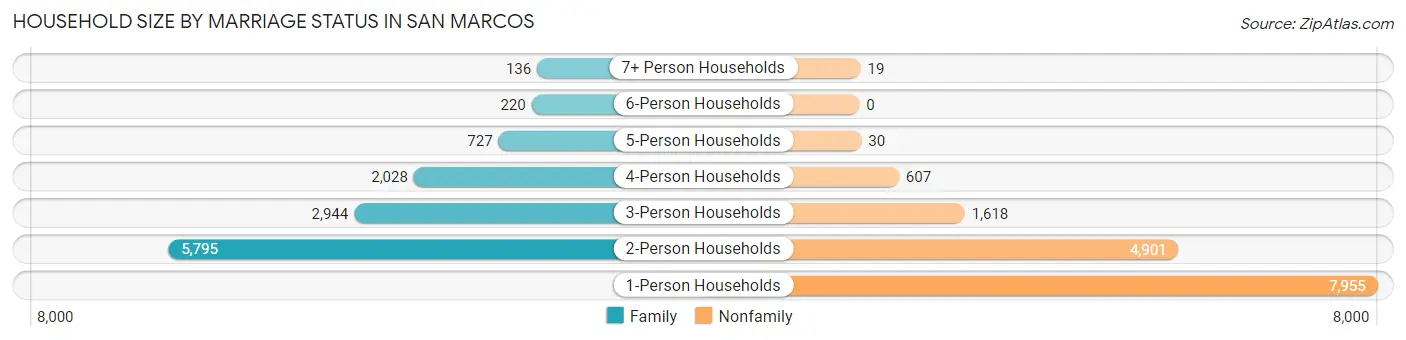
| Household Size | Family Households | Nonfamily Households |
| 1-Person Households | - | 7,955 (29.5%) |
| 2-Person Households | 5,795 (21.5%) | 4,901 (18.2%) |
| 3-Person Households | 2,944 (10.9%) | 1,618 (6.0%) |
| 4-Person Households | 2,028 (7.5%) | 607 (2.2%) |
| 5-Person Households | 727 (2.7%) | 30 (0.1%) |
| 6-Person Households | 220 (0.8%) | 0 (0.0%) |
| 7+ Person Households | 136 (0.5%) | 19 (0.1%) |
| Total | 11,850 (43.9%) | 15,130 (56.1%) |
Female Fertility in San Marcos
Fertility by Age in San Marcos
Average fertility rate in San Marcos is 23.0 births per 1,000 women. Women in the age bracket of 35 to 50 years have the highest fertility rate with 48.0 births per 1,000 women. Women in the age bracket of 20 to 34 years acount for 56.1% of all women with births.
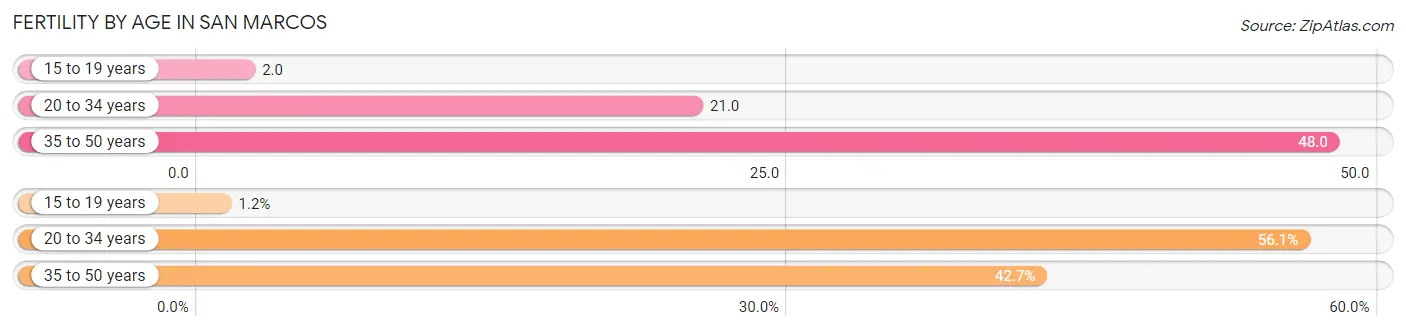
| Age Bracket | Women with Births | Births / 1,000 Women |
| 15 to 19 years | 7 (1.2%) | 2.0 |
| 20 to 34 years | 327 (56.1%) | 21.0 |
| 35 to 50 years | 249 (42.7%) | 48.0 |
| Total | 583 (100.0%) | 23.0 |
Fertility by Age by Marriage Status in San Marcos
35.8% of women with births (583) in San Marcos are married. The highest percentage of unmarried women with births falls into 15 to 19 years age bracket with 100.0% of them unmarried at the time of birth, while the lowest percentage of unmarried women with births belong to 20 to 34 years age bracket with 57.5% of them unmarried.
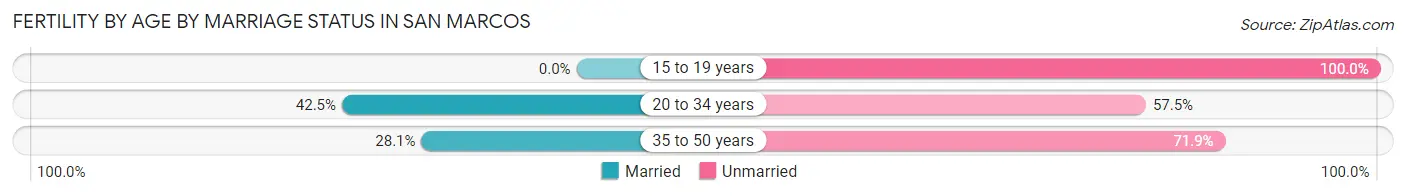
| Age Bracket | Married | Unmarried |
| 15 to 19 years | 0 (0.0%) | 7 (100.0%) |
| 20 to 34 years | 139 (42.5%) | 188 (57.5%) |
| 35 to 50 years | 70 (28.1%) | 179 (71.9%) |
| Total | 209 (35.8%) | 374 (64.1%) |
Fertility by Education in San Marcos
Average fertility rate in San Marcos is 23.0 births per 1,000 women. Women with the education attainment of less than high school have the highest fertility rate of 49.0 births per 1,000 women, while women with the education attainment of bachelor's degree have the lowest fertility at 10.0 births per 1,000 women. Women with the education attainment of college or associate's degree represent 48.9% of all women with births.
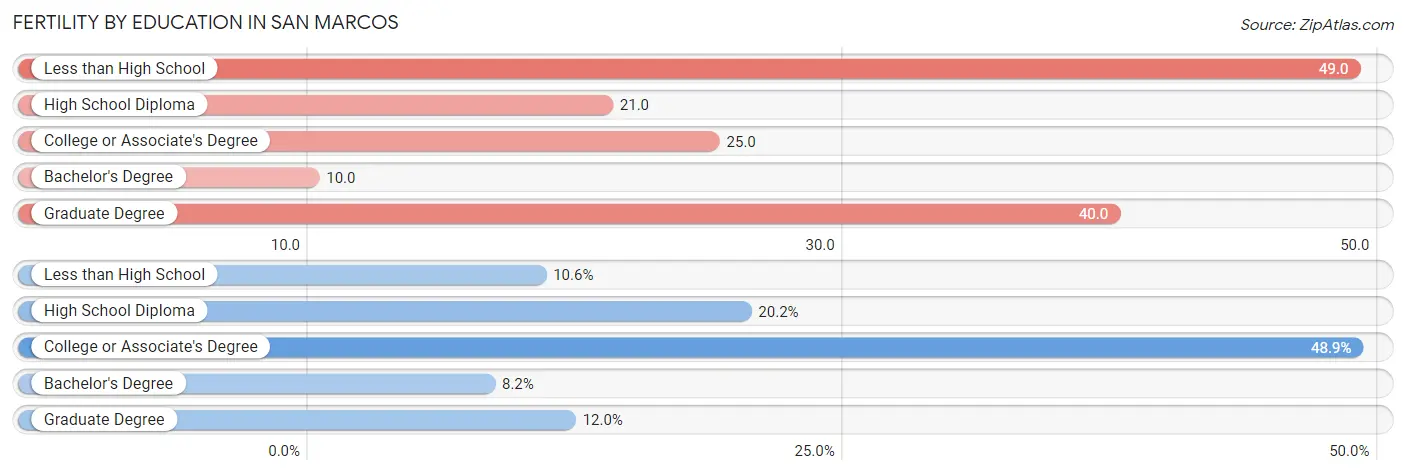
| Educational Attainment | Women with Births | Births / 1,000 Women |
| Less than High School | 62 (10.6%) | 49.0 |
| High School Diploma | 118 (20.2%) | 21.0 |
| College or Associate's Degree | 285 (48.9%) | 25.0 |
| Bachelor's Degree | 48 (8.2%) | 10.0 |
| Graduate Degree | 70 (12.0%) | 40.0 |
| Total | 583 (100.0%) | 23.0 |
Fertility by Education by Marriage Status in San Marcos
64.1% of women with births in San Marcos are unmarried. Women with the educational attainment of bachelor's degree are most likely to be married with 81.2% of them married at childbirth, while women with the educational attainment of college or associate's degree are least likely to be married with 86.0% of them unmarried at childbirth.
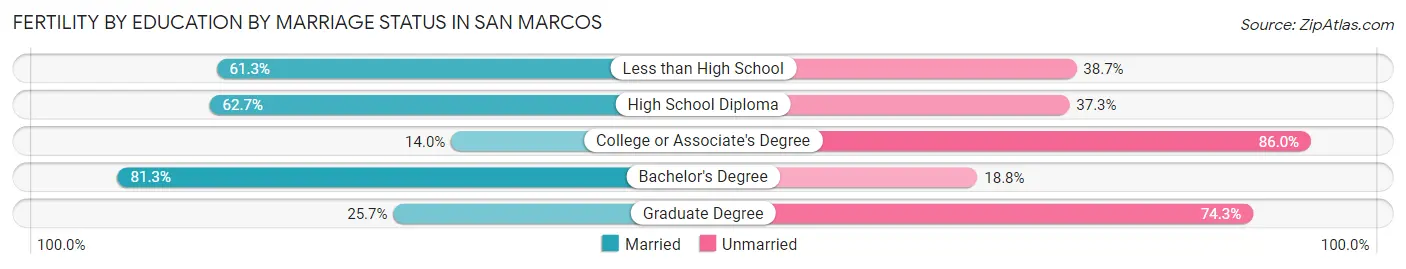
| Educational Attainment | Married | Unmarried |
| Less than High School | 38 (61.3%) | 24 (38.7%) |
| High School Diploma | 74 (62.7%) | 44 (37.3%) |
| College or Associate's Degree | 40 (14.0%) | 245 (86.0%) |
| Bachelor's Degree | 39 (81.2%) | 9 (18.8%) |
| Graduate Degree | 18 (25.7%) | 52 (74.3%) |
| Total | 209 (35.8%) | 374 (64.1%) |
Employment Characteristics in San Marcos
Employment by Class of Employer in San Marcos
Among the 36,603 employed individuals in San Marcos, private company employees (25,489 | 69.6%), state government employees (3,753 | 10.2%), and not-for-profit organizations (2,178 | 5.9%) make up the most common classes of employment.
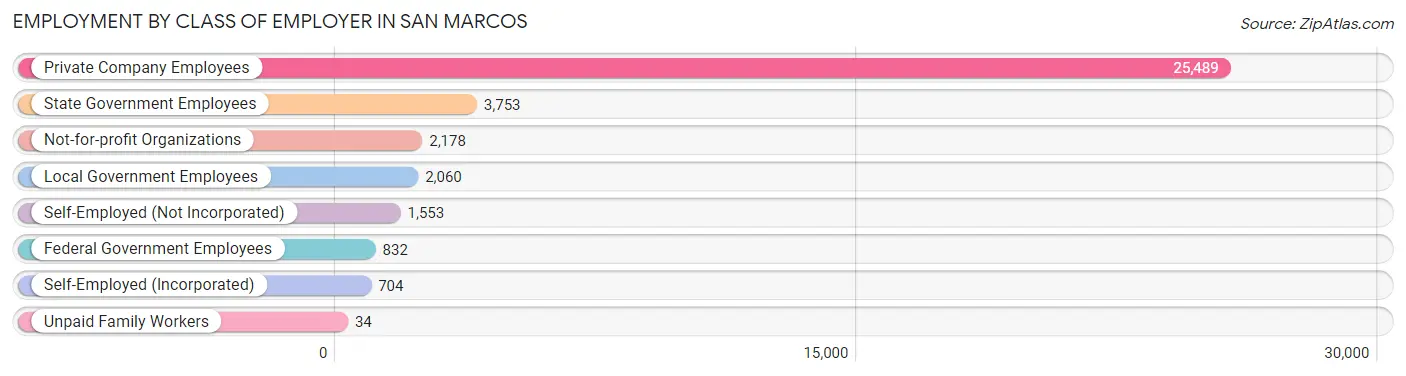
| Employer Class | # Employees | % Employees |
| Private Company Employees | 25,489 | 69.6% |
| Self-Employed (Incorporated) | 704 | 1.9% |
| Self-Employed (Not Incorporated) | 1,553 | 4.2% |
| Not-for-profit Organizations | 2,178 | 5.9% |
| Local Government Employees | 2,060 | 5.6% |
| State Government Employees | 3,753 | 10.2% |
| Federal Government Employees | 832 | 2.3% |
| Unpaid Family Workers | 34 | 0.1% |
| Total | 36,603 | 100.0% |
Employment Status by Age in San Marcos
According to the labor force statistics for San Marcos, out of the total population over 16 years of age (59,514), 66.8% or 39,755 individuals are in the labor force, with 6.8% or 2,703 of them unemployed. The age group with the highest labor force participation rate is 30 to 34 years, with 89.1% or 3,507 individuals in the labor force. Within the labor force, the 16 to 19 years age range has the highest percentage of unemployed individuals, with 13.8% or 367 of them being unemployed.
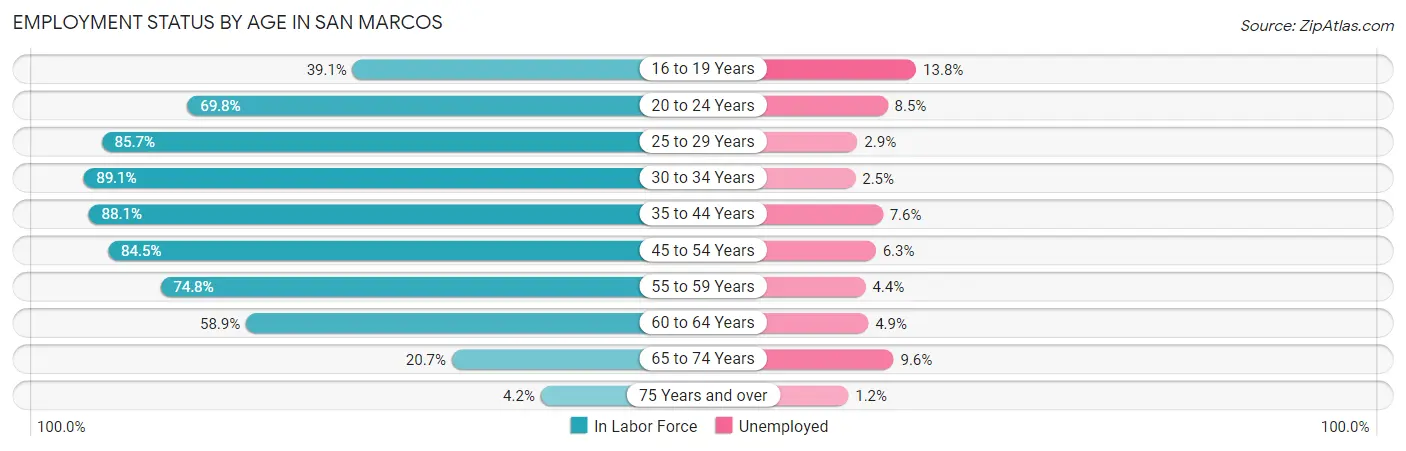
| Age Bracket | In Labor Force | Unemployed |
| 16 to 19 Years | 2,656 (39.1%) | 367 (13.8%) |
| 20 to 24 Years | 13,092 (69.8%) | 1,113 (8.5%) |
| 25 to 29 Years | 6,395 (85.7%) | 185 (2.9%) |
| 30 to 34 Years | 3,507 (89.1%) | 88 (2.5%) |
| 35 to 44 Years | 6,169 (88.1%) | 469 (7.6%) |
| 45 to 54 Years | 3,873 (84.5%) | 244 (6.3%) |
| 55 to 59 Years | 1,673 (74.8%) | 74 (4.4%) |
| 60 to 64 Years | 1,437 (58.9%) | 70 (4.9%) |
| 65 to 74 Years | 891 (20.7%) | 86 (9.6%) |
| 75 Years and over | 84 (4.2%) | 1 (1.2%) |
| Total | 39,755 (66.8%) | 2,703 (6.8%) |
Employment Status by Educational Attainment in San Marcos
According to labor force statistics for San Marcos, 83.3% of individuals (23,040) out of the total population between 25 and 64 years of age (27,659) are in the labor force, with 4.9% or 1,129 of them being unemployed. The group with the highest labor force participation rate are those with the educational attainment of bachelor's degree or higher, with 90.2% or 8,695 individuals in the labor force. Within the labor force, individuals with less than high school education have the highest percentage of unemployment, with 11.7% or 212 of them being unemployed.
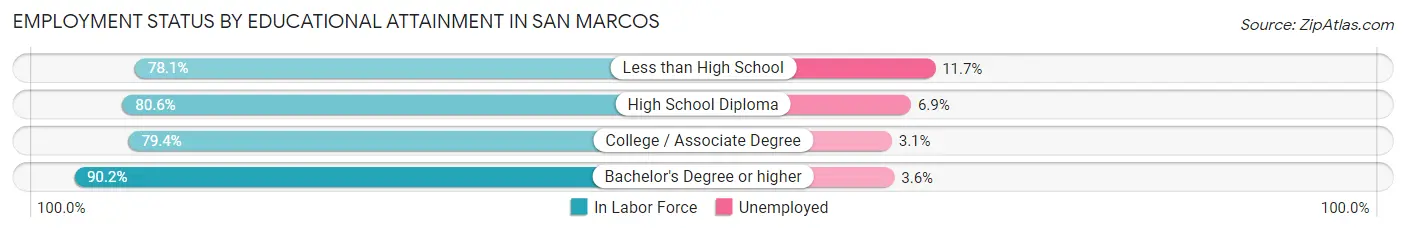
| Educational Attainment | In Labor Force | Unemployed |
| Less than High School | 1,808 (78.1%) | 271 (11.7%) |
| High School Diploma | 5,570 (80.6%) | 477 (6.9%) |
| College / Associate Degree | 6,982 (79.4%) | 273 (3.1%) |
| Bachelor's Degree or higher | 8,695 (90.2%) | 347 (3.6%) |
| Total | 23,040 (83.3%) | 1,355 (4.9%) |
Employment Occupations by Sex in San Marcos
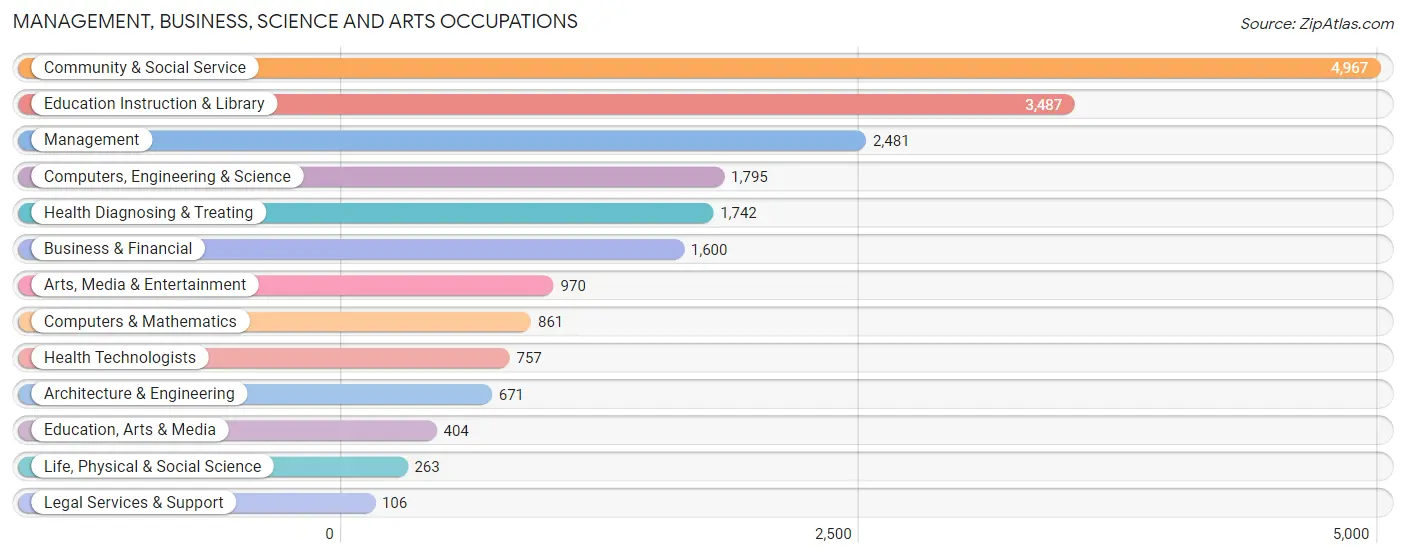
Management, Business, Science and Arts Occupations
The most common Management, Business, Science and Arts occupations in San Marcos are Community & Social Service (4,967 | 13.5%), Education Instruction & Library (3,487 | 9.5%), Management (2,481 | 6.7%), Computers, Engineering & Science (1,795 | 4.9%), and Health Diagnosing & Treating (1,742 | 4.7%).
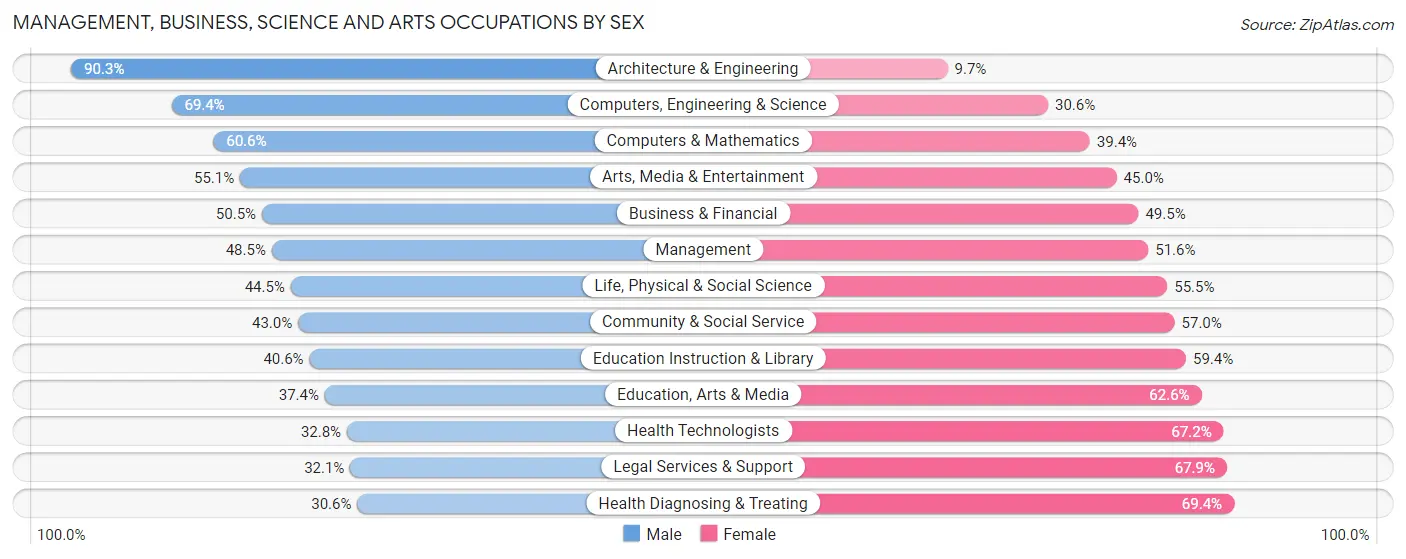
Management, Business, Science and Arts Occupations by Sex
Within the Management, Business, Science and Arts occupations in San Marcos, the most male-oriented occupations are Architecture & Engineering (90.3%), Computers, Engineering & Science (69.4%), and Computers & Mathematics (60.6%), while the most female-oriented occupations are Health Diagnosing & Treating (69.4%), Legal Services & Support (67.9%), and Health Technologists (67.2%).
| Occupation | Male | Female |
| Management | 1,202 (48.4%) | 1,279 (51.5%) |
| Business & Financial | 808 (50.5%) | 792 (49.5%) |
| Computers, Engineering & Science | 1,245 (69.4%) | 550 (30.6%) |
| Computers & Mathematics | 522 (60.6%) | 339 (39.4%) |
| Architecture & Engineering | 606 (90.3%) | 65 (9.7%) |
| Life, Physical & Social Science | 117 (44.5%) | 146 (55.5%) |
| Community & Social Service | 2,134 (43.0%) | 2,833 (57.0%) |
| Education, Arts & Media | 151 (37.4%) | 253 (62.6%) |
| Legal Services & Support | 34 (32.1%) | 72 (67.9%) |
| Education Instruction & Library | 1,415 (40.6%) | 2,072 (59.4%) |
| Arts, Media & Entertainment | 534 (55.0%) | 436 (45.0%) |
| Health Diagnosing & Treating | 533 (30.6%) | 1,209 (69.4%) |
| Health Technologists | 248 (32.8%) | 509 (67.2%) |
| Total (Category) | 5,922 (47.1%) | 6,663 (52.9%) |
| Total (Overall) | 19,317 (52.3%) | 17,582 (47.6%) |
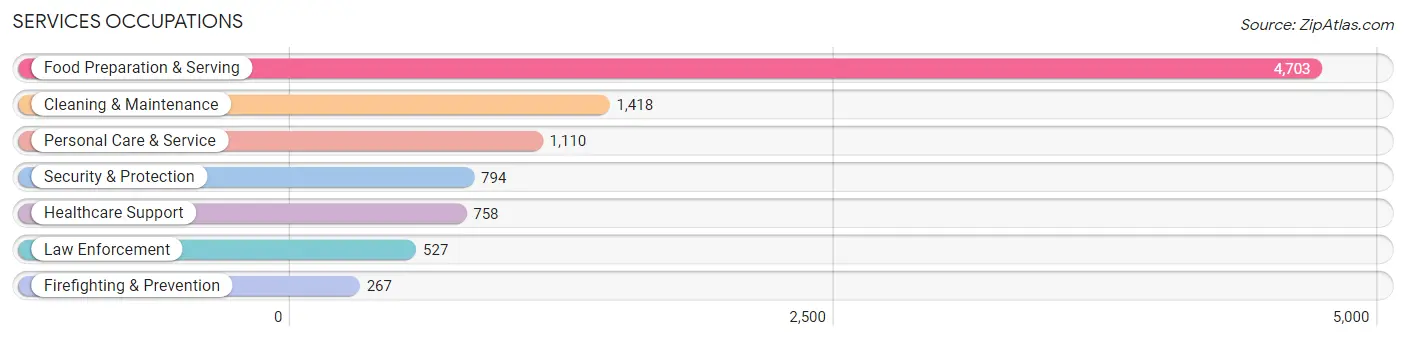
Services Occupations
The most common Services occupations in San Marcos are Food Preparation & Serving (4,703 | 12.8%), Cleaning & Maintenance (1,418 | 3.8%), Personal Care & Service (1,110 | 3.0%), Security & Protection (794 | 2.1%), and Healthcare Support (758 | 2.1%).
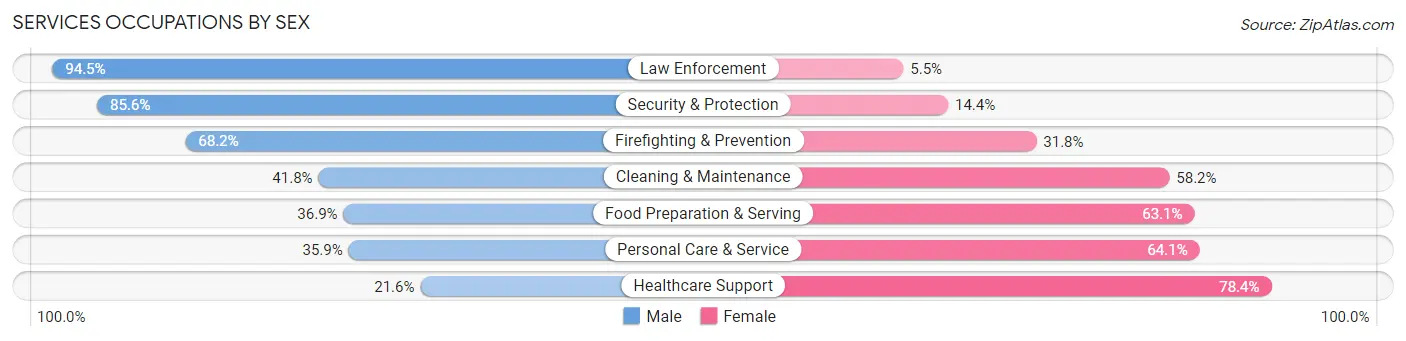
Services Occupations by Sex
Within the Services occupations in San Marcos, the most male-oriented occupations are Law Enforcement (94.5%), Security & Protection (85.6%), and Firefighting & Prevention (68.2%), while the most female-oriented occupations are Healthcare Support (78.4%), Personal Care & Service (64.1%), and Food Preparation & Serving (63.1%).
| Occupation | Male | Female |
| Healthcare Support | 164 (21.6%) | 594 (78.4%) |
| Security & Protection | 680 (85.6%) | 114 (14.4%) |
| Firefighting & Prevention | 182 (68.2%) | 85 (31.8%) |
| Law Enforcement | 498 (94.5%) | 29 (5.5%) |
| Food Preparation & Serving | 1,734 (36.9%) | 2,969 (63.1%) |
| Cleaning & Maintenance | 593 (41.8%) | 825 (58.2%) |
| Personal Care & Service | 398 (35.9%) | 712 (64.1%) |
| Total (Category) | 3,569 (40.6%) | 5,214 (59.4%) |
| Total (Overall) | 19,317 (52.3%) | 17,582 (47.6%) |
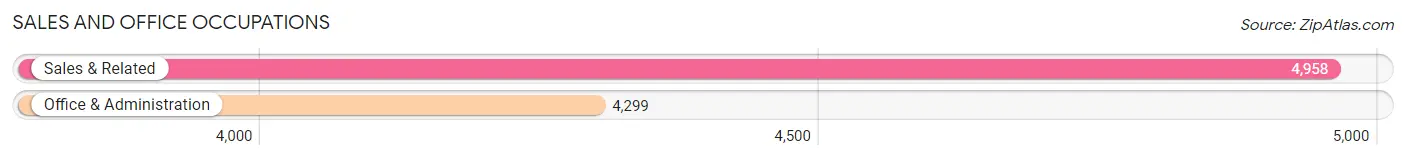
Sales and Office Occupations
The most common Sales and Office occupations in San Marcos are Sales & Related (4,958 | 13.4%), and Office & Administration (4,299 | 11.7%).
Sales and Office Occupations by Sex
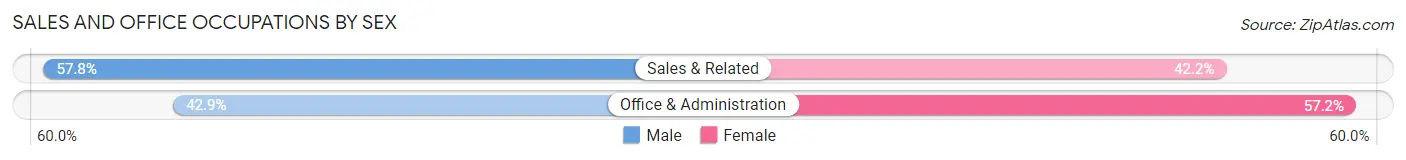
| Occupation | Male | Female |
| Sales & Related | 2,866 (57.8%) | 2,092 (42.2%) |
| Office & Administration | 1,842 (42.8%) | 2,457 (57.2%) |
| Total (Category) | 4,708 (50.9%) | 4,549 (49.1%) |
| Total (Overall) | 19,317 (52.3%) | 17,582 (47.6%) |
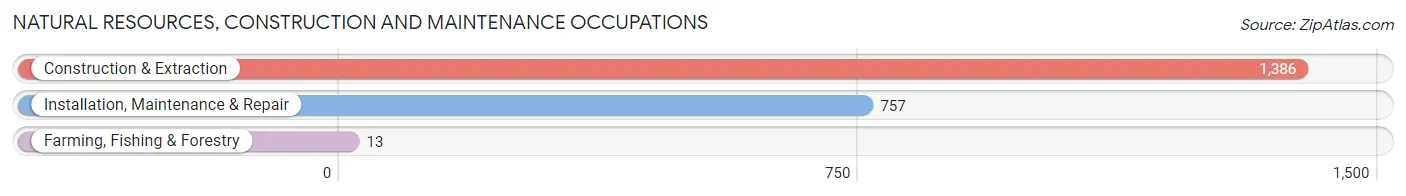
Natural Resources, Construction and Maintenance Occupations
The most common Natural Resources, Construction and Maintenance occupations in San Marcos are Construction & Extraction (1,386 | 3.8%), Installation, Maintenance & Repair (757 | 2.1%), and Farming, Fishing & Forestry (13 | 0.0%).
Natural Resources, Construction and Maintenance Occupations by Sex
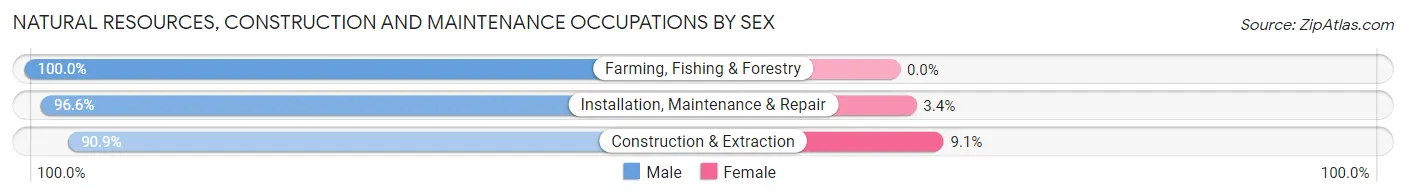
| Occupation | Male | Female |
| Farming, Fishing & Forestry | 13 (100.0%) | 0 (0.0%) |
| Construction & Extraction | 1,260 (90.9%) | 126 (9.1%) |
| Installation, Maintenance & Repair | 731 (96.6%) | 26 (3.4%) |
| Total (Category) | 2,004 (92.9%) | 152 (7.0%) |
| Total (Overall) | 19,317 (52.3%) | 17,582 (47.6%) |
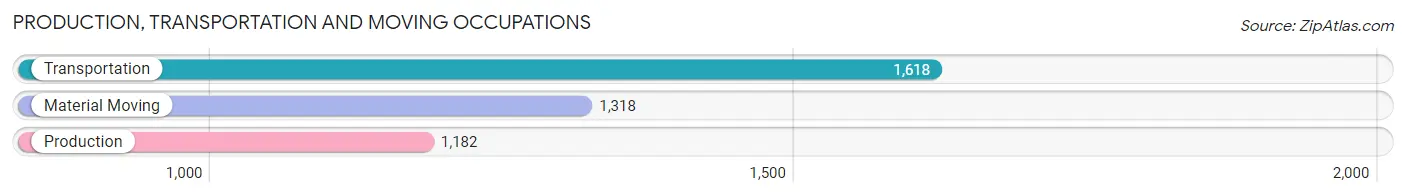
Production, Transportation and Moving Occupations
The most common Production, Transportation and Moving occupations in San Marcos are Transportation (1,618 | 4.4%), Material Moving (1,318 | 3.6%), and Production (1,182 | 3.2%).
Production, Transportation and Moving Occupations by Sex
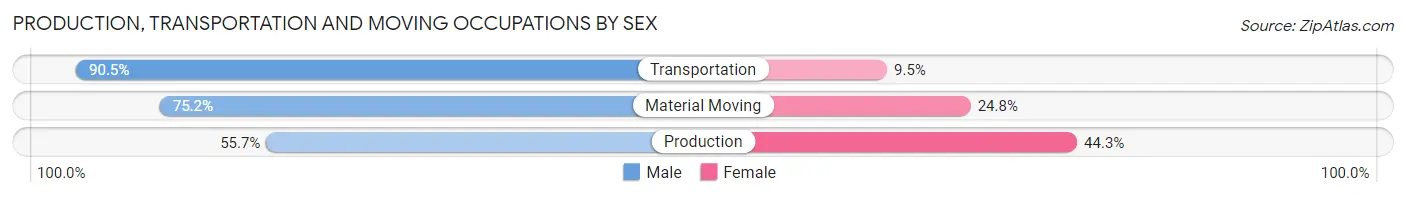
| Occupation | Male | Female |
| Production | 658 (55.7%) | 524 (44.3%) |
| Transportation | 1,465 (90.5%) | 153 (9.5%) |
| Material Moving | 991 (75.2%) | 327 (24.8%) |
| Total (Category) | 3,114 (75.6%) | 1,004 (24.4%) |
| Total (Overall) | 19,317 (52.3%) | 17,582 (47.6%) |
Employment Industries by Sex in San Marcos
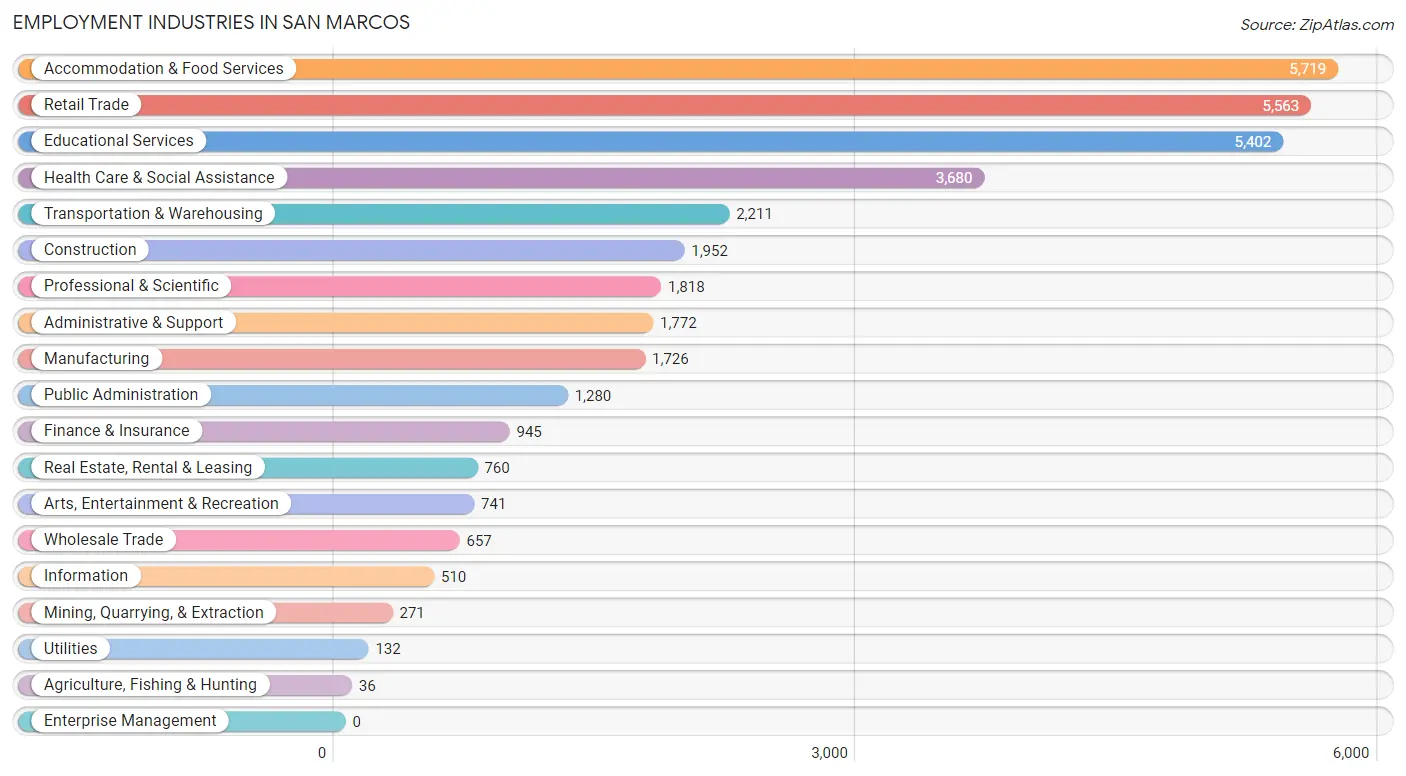
Employment Industries in San Marcos
The major employment industries in San Marcos include Accommodation & Food Services (5,719 | 15.5%), Retail Trade (5,563 | 15.1%), Educational Services (5,402 | 14.6%), Health Care & Social Assistance (3,680 | 10.0%), and Transportation & Warehousing (2,211 | 6.0%).
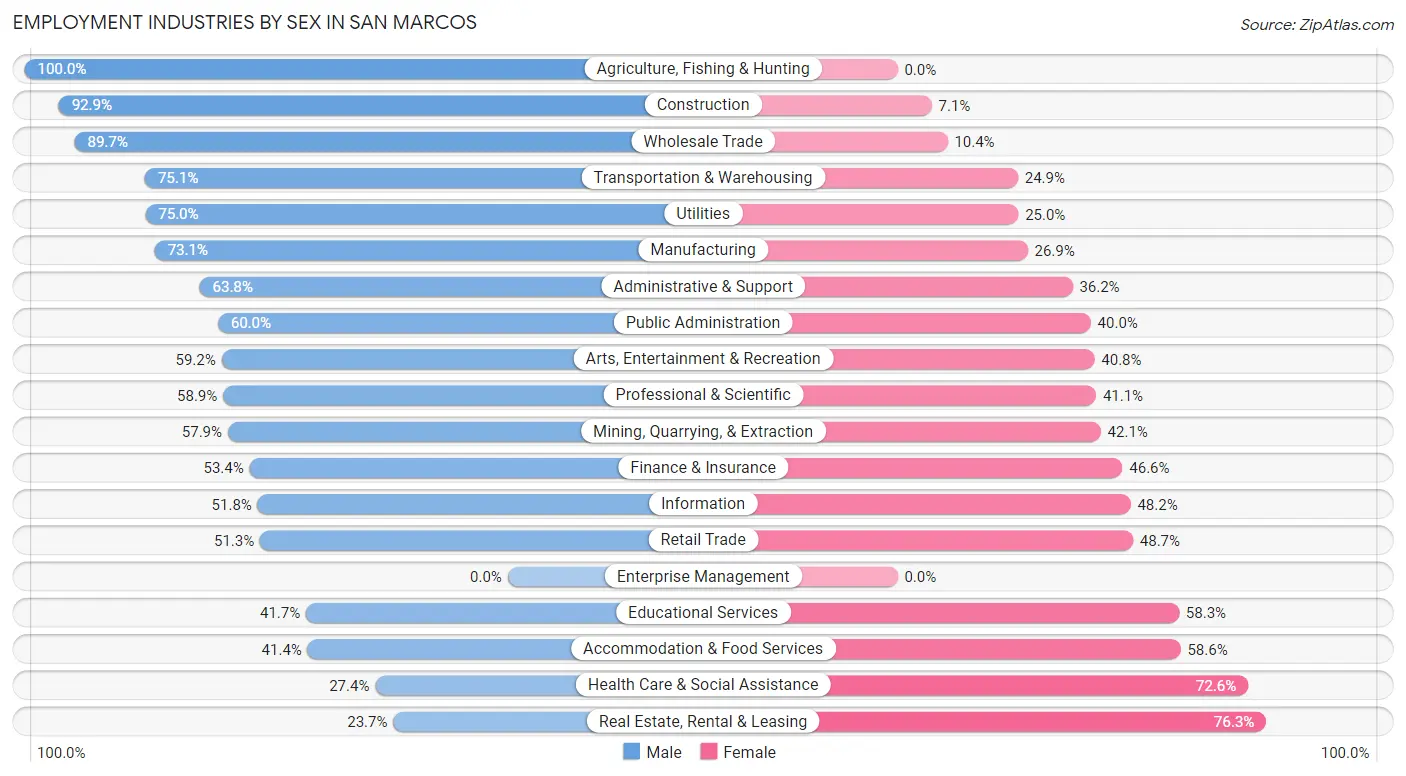
Employment Industries by Sex in San Marcos
The San Marcos industries that see more men than women are Agriculture, Fishing & Hunting (100.0%), Construction (92.9%), and Wholesale Trade (89.6%), whereas the industries that tend to have a higher number of women are Real Estate, Rental & Leasing (76.3%), Health Care & Social Assistance (72.6%), and Accommodation & Food Services (58.6%).
| Industry | Male | Female |
| Agriculture, Fishing & Hunting | 36 (100.0%) | 0 (0.0%) |
| Mining, Quarrying, & Extraction | 157 (57.9%) | 114 (42.1%) |
| Construction | 1,814 (92.9%) | 138 (7.1%) |
| Manufacturing | 1,261 (73.1%) | 465 (26.9%) |
| Wholesale Trade | 589 (89.6%) | 68 (10.3%) |
| Retail Trade | 2,852 (51.3%) | 2,711 (48.7%) |
| Transportation & Warehousing | 1,660 (75.1%) | 551 (24.9%) |
| Utilities | 99 (75.0%) | 33 (25.0%) |
| Information | 264 (51.8%) | 246 (48.2%) |
| Finance & Insurance | 505 (53.4%) | 440 (46.6%) |
| Real Estate, Rental & Leasing | 180 (23.7%) | 580 (76.3%) |
| Professional & Scientific | 1,071 (58.9%) | 747 (41.1%) |
| Enterprise Management | 0 (0.0%) | 0 (0.0%) |
| Administrative & Support | 1,130 (63.8%) | 642 (36.2%) |
| Educational Services | 2,255 (41.7%) | 3,147 (58.3%) |
| Health Care & Social Assistance | 1,009 (27.4%) | 2,671 (72.6%) |
| Arts, Entertainment & Recreation | 439 (59.2%) | 302 (40.8%) |
| Accommodation & Food Services | 2,368 (41.4%) | 3,351 (58.6%) |
| Public Administration | 768 (60.0%) | 512 (40.0%) |
| Total | 19,317 (52.3%) | 17,582 (47.6%) |
Education in San Marcos
School Enrollment in San Marcos
The most common levels of schooling among the 28,698 students in San Marcos are college / undergraduate (20,022 | 69.8%), high school (2,357 | 8.2%), and graduate / professional (2,356 | 8.2%).
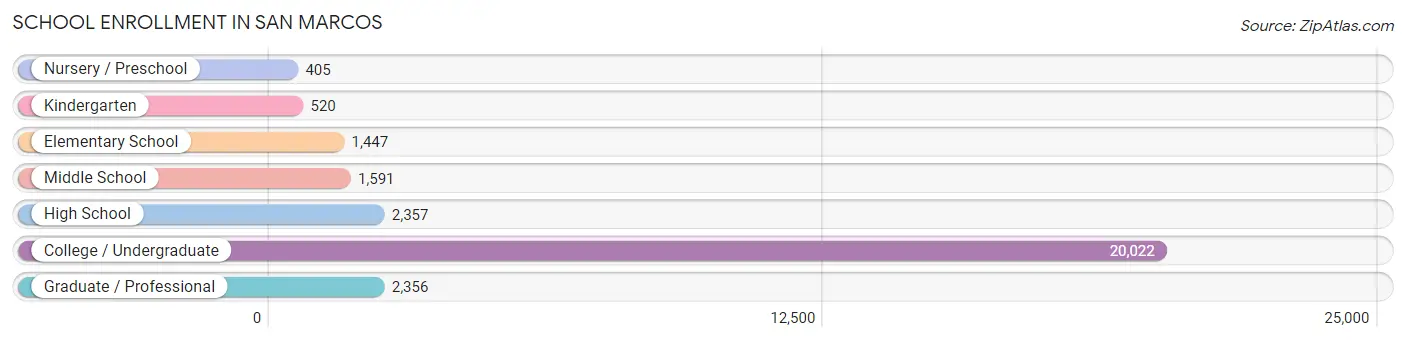
| School Level | # Students | % Students |
| Nursery / Preschool | 405 | 1.4% |
| Kindergarten | 520 | 1.8% |
| Elementary School | 1,447 | 5.0% |
| Middle School | 1,591 | 5.5% |
| High School | 2,357 | 8.2% |
| College / Undergraduate | 20,022 | 69.8% |
| Graduate / Professional | 2,356 | 8.2% |
| Total | 28,698 | 100.0% |
School Enrollment by Age by Funding Source in San Marcos
Out of a total of 28,698 students who are enrolled in schools in San Marcos, 2,525 (8.8%) attend a private institution, while the remaining 26,173 (91.2%) are enrolled in public schools. The age group of 3 to 4 year olds has the highest likelihood of being enrolled in private schools, with 124 (42.5% in the age bracket) enrolled. Conversely, the age group of 5 to 9 year old has the lowest likelihood of being enrolled in a private school, with 1,926 (96.2% in the age bracket) attending a public institution.
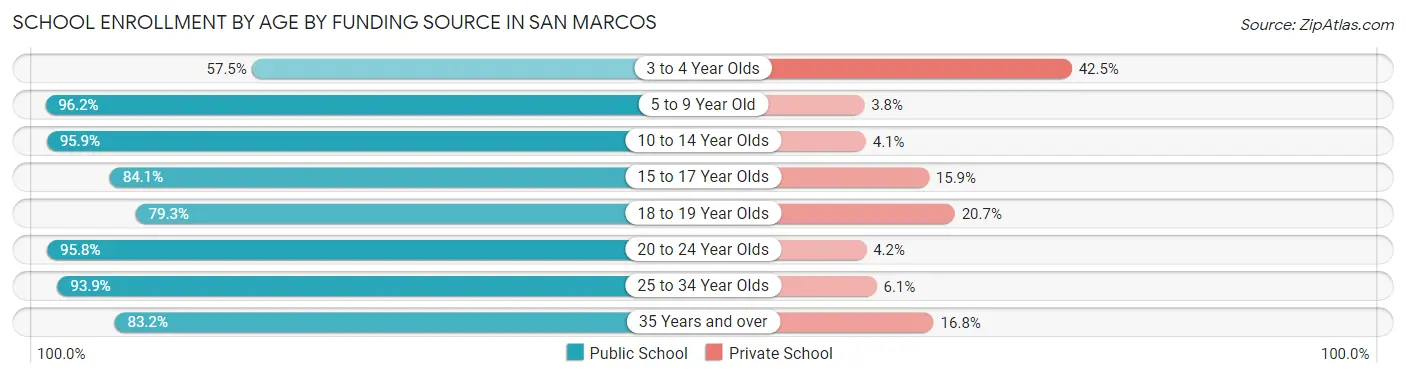
| Age Bracket | Public School | Private School |
| 3 to 4 Year Olds | 168 (57.5%) | 124 (42.5%) |
| 5 to 9 Year Old | 1,926 (96.2%) | 77 (3.8%) |
| 10 to 14 Year Olds | 1,978 (95.9%) | 85 (4.1%) |
| 15 to 17 Year Olds | 1,145 (84.1%) | 216 (15.9%) |
| 18 to 19 Year Olds | 4,416 (79.3%) | 1,152 (20.7%) |
| 20 to 24 Year Olds | 13,199 (95.8%) | 579 (4.2%) |
| 25 to 34 Year Olds | 2,761 (93.9%) | 180 (6.1%) |
| 35 Years and over | 576 (83.2%) | 116 (16.8%) |
| Total | 26,173 (91.2%) | 2,525 (8.8%) |
Educational Attainment by Field of Study in San Marcos
Business (2,243 | 17.3%), arts & humanities (1,536 | 11.8%), education (1,081 | 8.3%), science & technology (1,057 | 8.2%), and social sciences (1,047 | 8.1%) are the most common fields of study among 12,957 individuals in San Marcos who have obtained a bachelor's degree or higher.
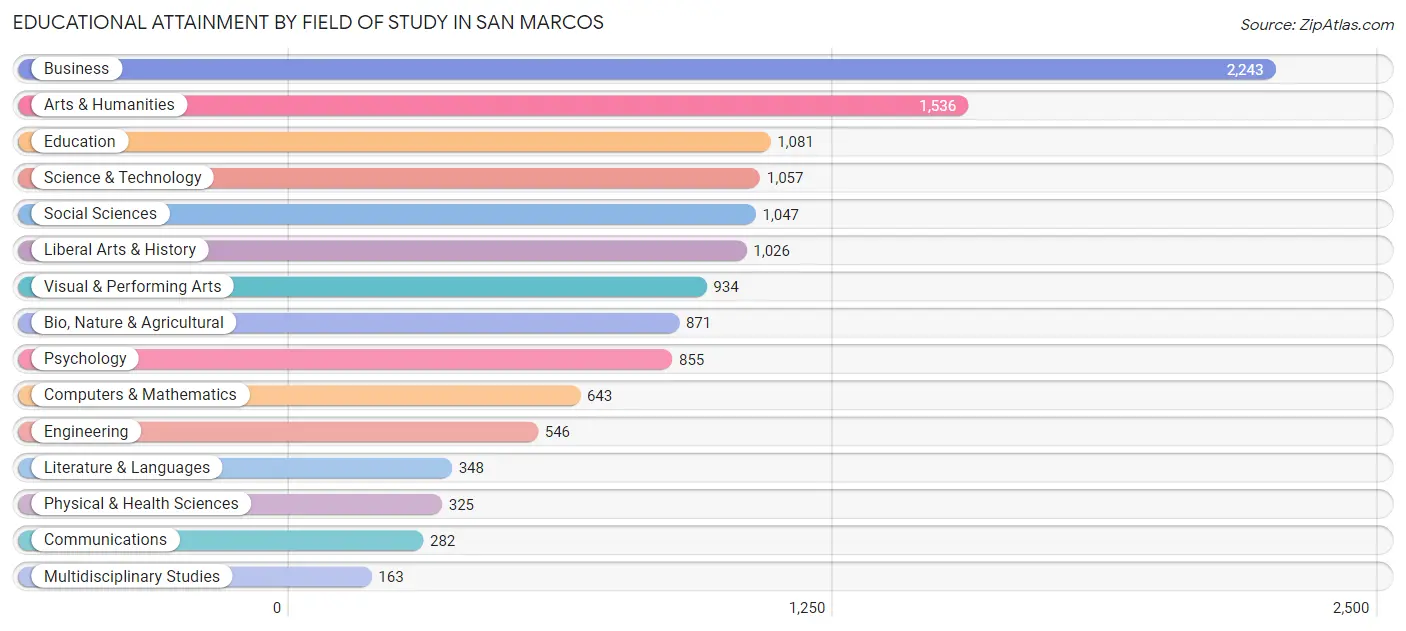
| Field of Study | # Graduates | % Graduates |
| Computers & Mathematics | 643 | 5.0% |
| Bio, Nature & Agricultural | 871 | 6.7% |
| Physical & Health Sciences | 325 | 2.5% |
| Psychology | 855 | 6.6% |
| Social Sciences | 1,047 | 8.1% |
| Engineering | 546 | 4.2% |
| Multidisciplinary Studies | 163 | 1.3% |
| Science & Technology | 1,057 | 8.2% |
| Business | 2,243 | 17.3% |
| Education | 1,081 | 8.3% |
| Literature & Languages | 348 | 2.7% |
| Liberal Arts & History | 1,026 | 7.9% |
| Visual & Performing Arts | 934 | 7.2% |
| Communications | 282 | 2.2% |
| Arts & Humanities | 1,536 | 11.8% |
| Total | 12,957 | 100.0% |
Transportation & Commute in San Marcos
Vehicle Availability by Sex in San Marcos
The most prevalent vehicle ownership categories in San Marcos are males with 2 vehicles (8,835, accounting for 47.4%) and females with 2 vehicles (8,198, making up 54.1%).
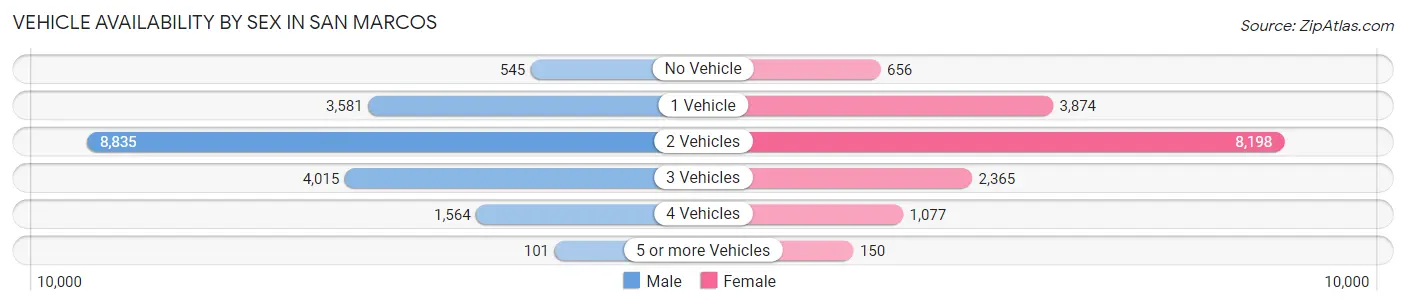
| Vehicles Available | Male | Female |
| No Vehicle | 545 (2.9%) | 656 (4.0%) |
| 1 Vehicle | 3,581 (19.2%) | 3,874 (23.7%) |
| 2 Vehicles | 8,835 (47.4%) | 8,198 (50.2%) |
| 3 Vehicles | 4,015 (21.5%) | 2,365 (14.5%) |
| 4 Vehicles | 1,564 (8.4%) | 1,077 (6.6%) |
| 5 or more Vehicles | 101 (0.5%) | 150 (0.9%) |
| Total | 18,641 (100.0%) | 16,320 (100.0%) |
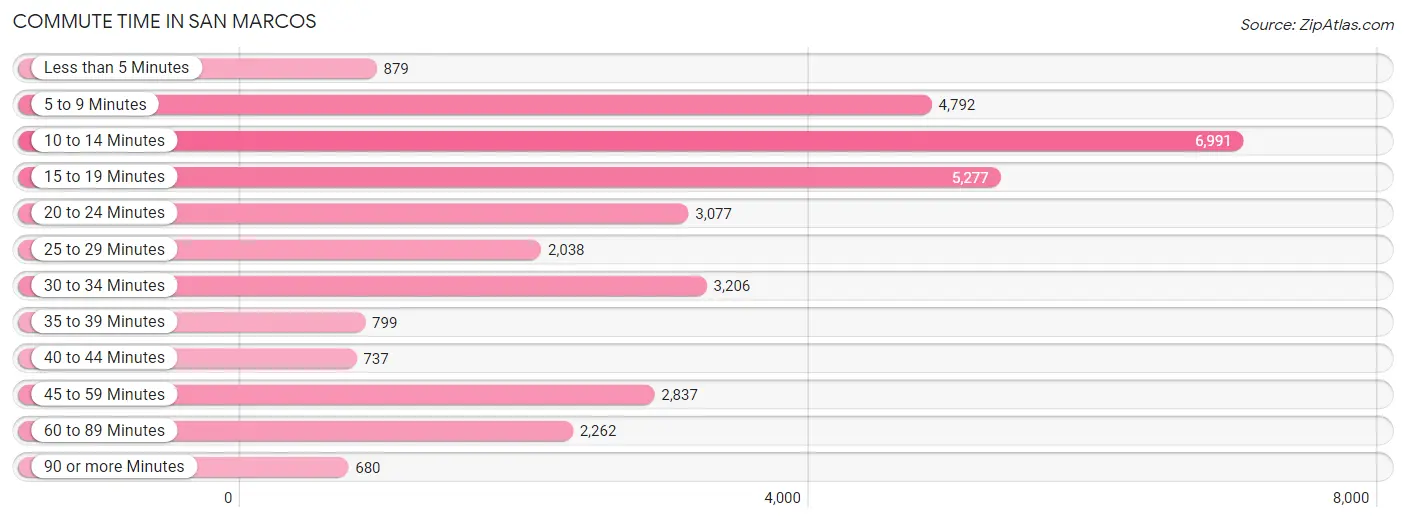
Commute Time in San Marcos
The most frequently occuring commute durations in San Marcos are 10 to 14 minutes (6,991 commuters, 20.8%), 15 to 19 minutes (5,277 commuters, 15.7%), and 5 to 9 minutes (4,792 commuters, 14.3%).
| Commute Time | # Commuters | % Commuters |
| Less than 5 Minutes | 879 | 2.6% |
| 5 to 9 Minutes | 4,792 | 14.3% |
| 10 to 14 Minutes | 6,991 | 20.8% |
| 15 to 19 Minutes | 5,277 | 15.7% |
| 20 to 24 Minutes | 3,077 | 9.2% |
| 25 to 29 Minutes | 2,038 | 6.1% |
| 30 to 34 Minutes | 3,206 | 9.6% |
| 35 to 39 Minutes | 799 | 2.4% |
| 40 to 44 Minutes | 737 | 2.2% |
| 45 to 59 Minutes | 2,837 | 8.5% |
| 60 to 89 Minutes | 2,262 | 6.7% |
| 90 or more Minutes | 680 | 2.0% |
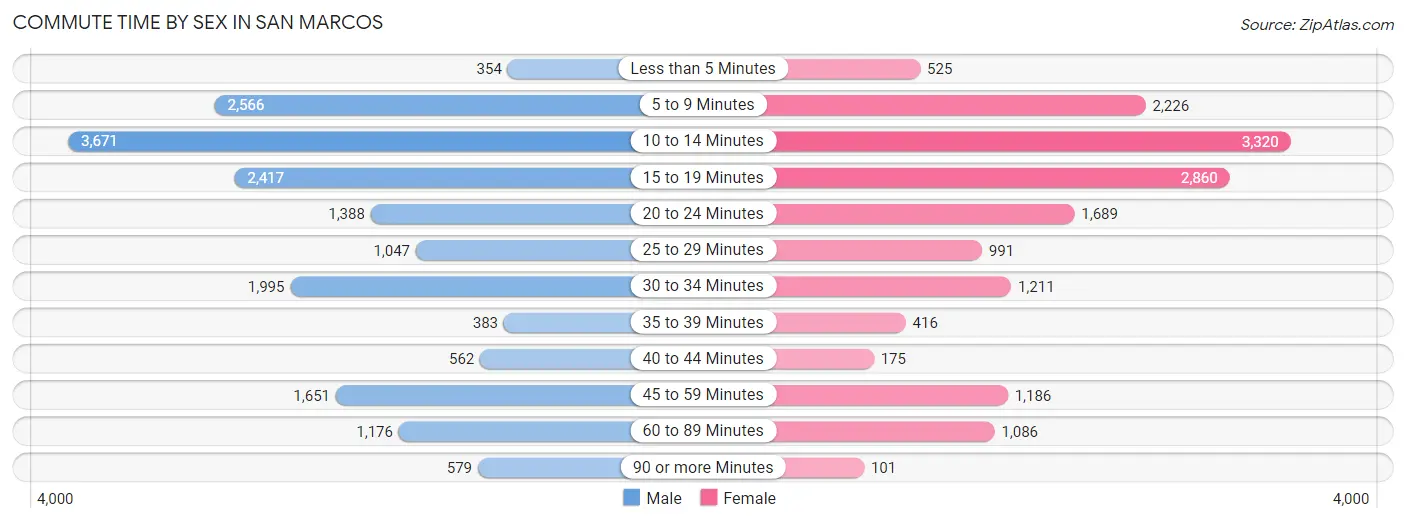
Commute Time by Sex in San Marcos
The most common commute times in San Marcos are 10 to 14 minutes (3,671 commuters, 20.6%) for males and 10 to 14 minutes (3,320 commuters, 21.0%) for females.
| Commute Time | Male | Female |
| Less than 5 Minutes | 354 (2.0%) | 525 (3.3%) |
| 5 to 9 Minutes | 2,566 (14.4%) | 2,226 (14.1%) |
| 10 to 14 Minutes | 3,671 (20.6%) | 3,320 (21.0%) |
| 15 to 19 Minutes | 2,417 (13.6%) | 2,860 (18.1%) |
| 20 to 24 Minutes | 1,388 (7.8%) | 1,689 (10.7%) |
| 25 to 29 Minutes | 1,047 (5.9%) | 991 (6.3%) |
| 30 to 34 Minutes | 1,995 (11.2%) | 1,211 (7.7%) |
| 35 to 39 Minutes | 383 (2.1%) | 416 (2.6%) |
| 40 to 44 Minutes | 562 (3.2%) | 175 (1.1%) |
| 45 to 59 Minutes | 1,651 (9.3%) | 1,186 (7.5%) |
| 60 to 89 Minutes | 1,176 (6.6%) | 1,086 (6.9%) |
| 90 or more Minutes | 579 (3.3%) | 101 (0.6%) |
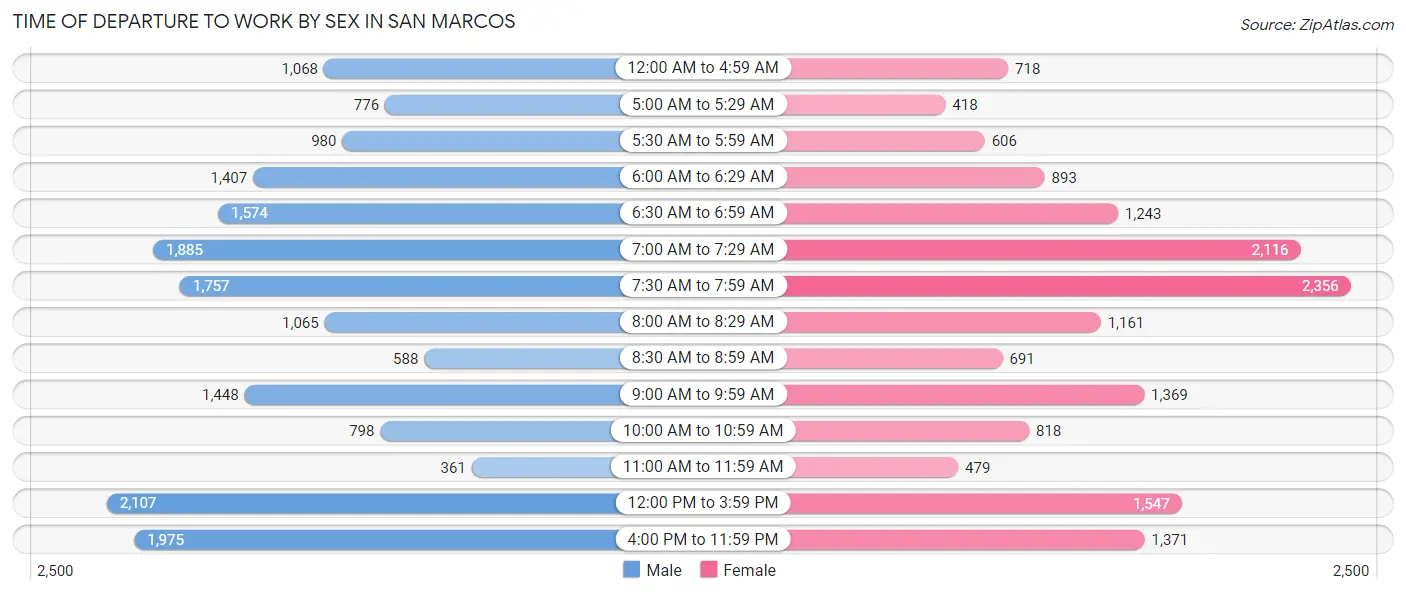
Time of Departure to Work by Sex in San Marcos
The most frequent times of departure to work in San Marcos are 12:00 PM to 3:59 PM (2,107, 11.8%) for males and 7:30 AM to 7:59 AM (2,356, 14.9%) for females.
| Time of Departure | Male | Female |
| 12:00 AM to 4:59 AM | 1,068 (6.0%) | 718 (4.5%) |
| 5:00 AM to 5:29 AM | 776 (4.4%) | 418 (2.6%) |
| 5:30 AM to 5:59 AM | 980 (5.5%) | 606 (3.8%) |
| 6:00 AM to 6:29 AM | 1,407 (7.9%) | 893 (5.7%) |
| 6:30 AM to 6:59 AM | 1,574 (8.8%) | 1,243 (7.9%) |
| 7:00 AM to 7:29 AM | 1,885 (10.6%) | 2,116 (13.4%) |
| 7:30 AM to 7:59 AM | 1,757 (9.9%) | 2,356 (14.9%) |
| 8:00 AM to 8:29 AM | 1,065 (6.0%) | 1,161 (7.3%) |
| 8:30 AM to 8:59 AM | 588 (3.3%) | 691 (4.4%) |
| 9:00 AM to 9:59 AM | 1,448 (8.1%) | 1,369 (8.7%) |
| 10:00 AM to 10:59 AM | 798 (4.5%) | 818 (5.2%) |
| 11:00 AM to 11:59 AM | 361 (2.0%) | 479 (3.0%) |
| 12:00 PM to 3:59 PM | 2,107 (11.8%) | 1,547 (9.8%) |
| 4:00 PM to 11:59 PM | 1,975 (11.1%) | 1,371 (8.7%) |
| Total | 17,789 (100.0%) | 15,786 (100.0%) |
Housing Occupancy in San Marcos
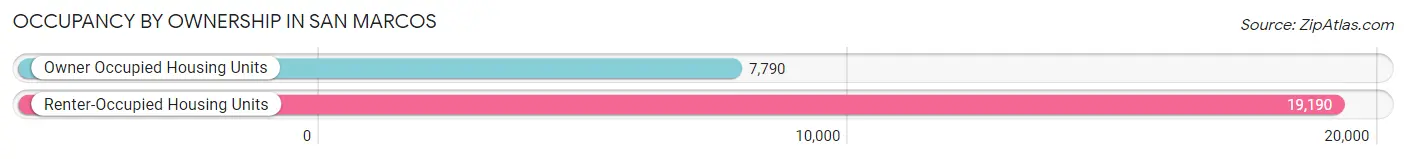
Occupancy by Ownership in San Marcos
Of the total 26,980 dwellings in San Marcos, owner-occupied units account for 7,790 (28.9%), while renter-occupied units make up 19,190 (71.1%).
| Occupancy | # Housing Units | % Housing Units |
| Owner Occupied Housing Units | 7,790 | 28.9% |
| Renter-Occupied Housing Units | 19,190 | 71.1% |
| Total Occupied Housing Units | 26,980 | 100.0% |
Occupancy by Household Size in San Marcos
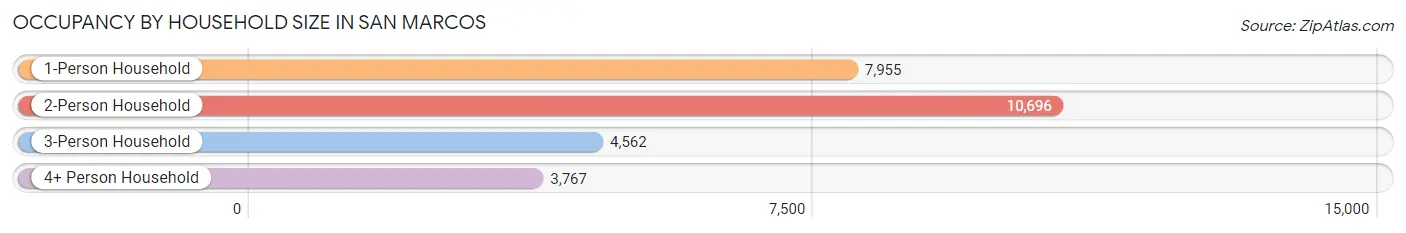
| Household Size | # Housing Units | % Housing Units |
| 1-Person Household | 7,955 | 29.5% |
| 2-Person Household | 10,696 | 39.6% |
| 3-Person Household | 4,562 | 16.9% |
| 4+ Person Household | 3,767 | 14.0% |
| Total Housing Units | 26,980 | 100.0% |
Occupancy by Ownership by Household Size in San Marcos
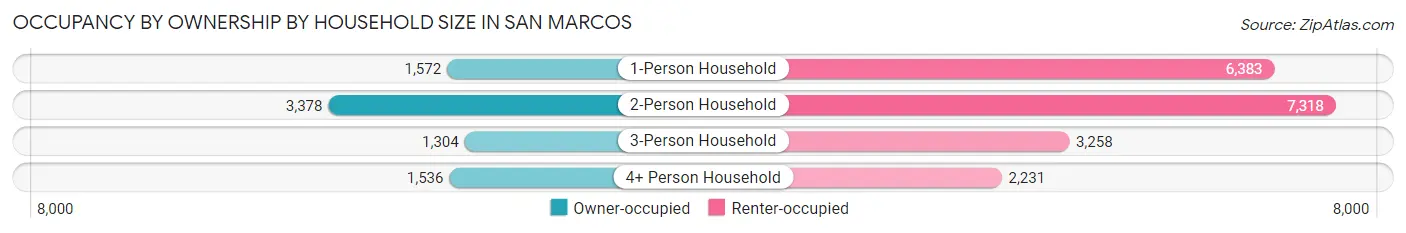
| Household Size | Owner-occupied | Renter-occupied |
| 1-Person Household | 1,572 (19.8%) | 6,383 (80.2%) |
| 2-Person Household | 3,378 (31.6%) | 7,318 (68.4%) |
| 3-Person Household | 1,304 (28.6%) | 3,258 (71.4%) |
| 4+ Person Household | 1,536 (40.8%) | 2,231 (59.2%) |
| Total Housing Units | 7,790 (28.9%) | 19,190 (71.1%) |
Occupancy by Educational Attainment in San Marcos
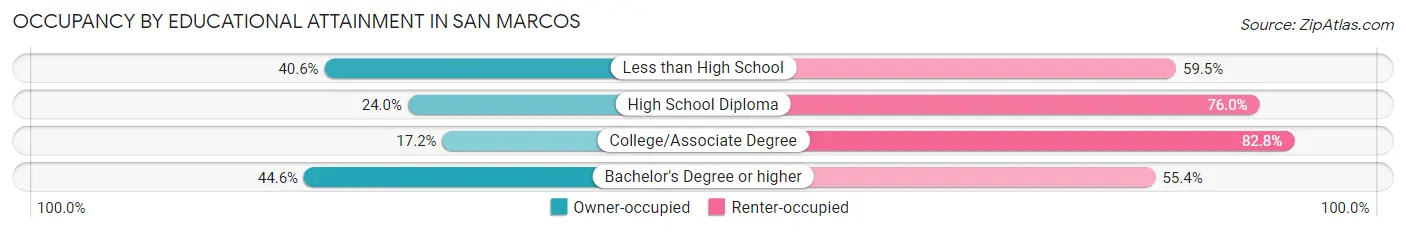
| Household Size | Owner-occupied | Renter-occupied |
| Less than High School | 878 (40.6%) | 1,287 (59.5%) |
| High School Diploma | 1,276 (24.0%) | 4,036 (76.0%) |
| College/Associate Degree | 1,917 (17.2%) | 9,252 (82.8%) |
| Bachelor's Degree or higher | 3,719 (44.6%) | 4,615 (55.4%) |
Occupancy by Age of Householder in San Marcos
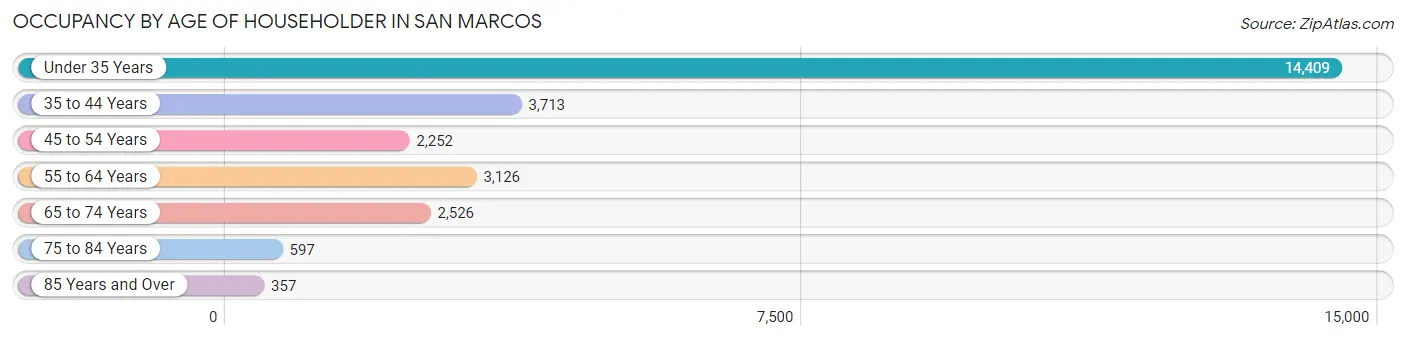
| Age Bracket | # Households | % Households |
| Under 35 Years | 14,409 | 53.4% |
| 35 to 44 Years | 3,713 | 13.8% |
| 45 to 54 Years | 2,252 | 8.4% |
| 55 to 64 Years | 3,126 | 11.6% |
| 65 to 74 Years | 2,526 | 9.4% |
| 75 to 84 Years | 597 | 2.2% |
| 85 Years and Over | 357 | 1.3% |
| Total | 26,980 | 100.0% |
Housing Finances in San Marcos
Median Income by Occupancy in San Marcos
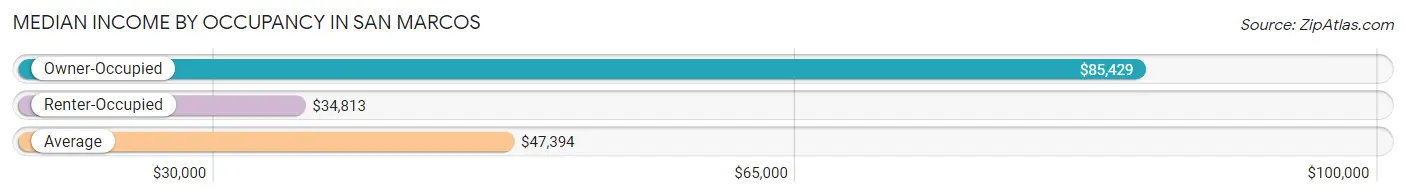
| Occupancy Type | # Households | Median Income |
| Owner-Occupied | 7,790 (28.9%) | $85,429 |
| Renter-Occupied | 19,190 (71.1%) | $34,813 |
| Average | 26,980 (100.0%) | $47,394 |
Occupancy by Householder Income Bracket in San Marcos
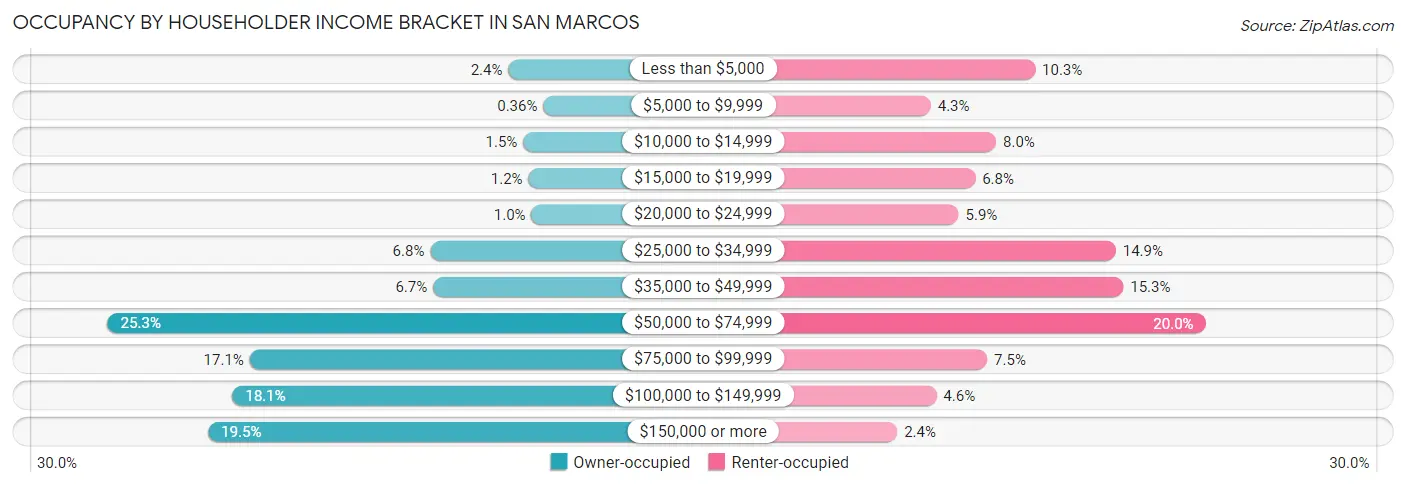
| Income Bracket | Owner-occupied | Renter-occupied |
| Less than $5,000 | 184 (2.4%) | 1,969 (10.3%) |
| $5,000 to $9,999 | 28 (0.4%) | 825 (4.3%) |
| $10,000 to $14,999 | 118 (1.5%) | 1,540 (8.0%) |
| $15,000 to $19,999 | 94 (1.2%) | 1,312 (6.8%) |
| $20,000 to $24,999 | 81 (1.0%) | 1,130 (5.9%) |
| $25,000 to $34,999 | 531 (6.8%) | 2,854 (14.9%) |
| $35,000 to $49,999 | 519 (6.7%) | 2,937 (15.3%) |
| $50,000 to $74,999 | 1,968 (25.3%) | 3,837 (20.0%) |
| $75,000 to $99,999 | 1,335 (17.1%) | 1,443 (7.5%) |
| $100,000 to $149,999 | 1,412 (18.1%) | 887 (4.6%) |
| $150,000 or more | 1,520 (19.5%) | 456 (2.4%) |
| Total | 7,790 (100.0%) | 19,190 (100.0%) |
Monthly Housing Cost Tiers in San Marcos
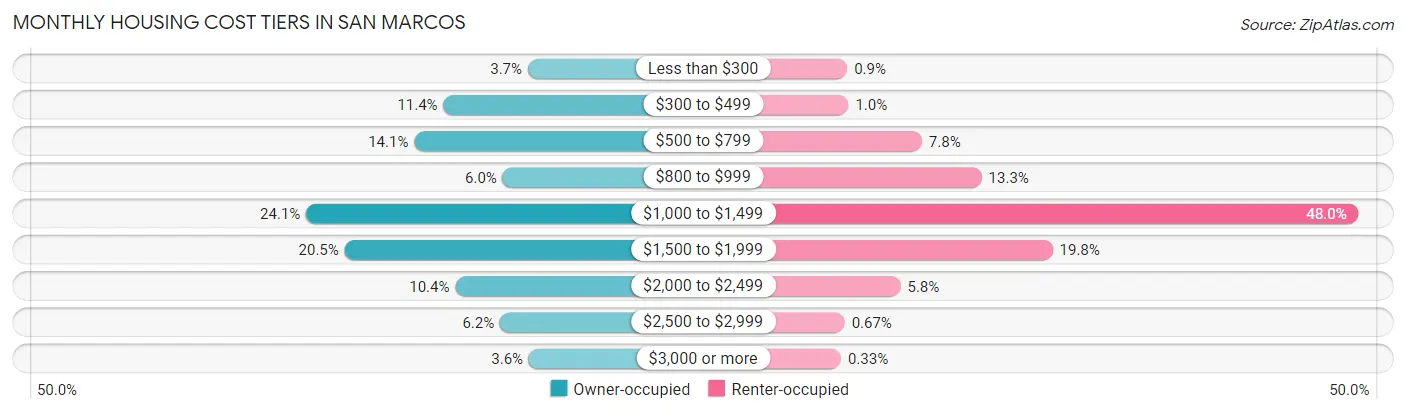
| Monthly Cost | Owner-occupied | Renter-occupied |
| Less than $300 | 286 (3.7%) | 172 (0.9%) |
| $300 to $499 | 891 (11.4%) | 195 (1.0%) |
| $500 to $799 | 1,101 (14.1%) | 1,493 (7.8%) |
| $800 to $999 | 467 (6.0%) | 2,548 (13.3%) |
| $1,000 to $1,499 | 1,876 (24.1%) | 9,206 (48.0%) |
| $1,500 to $1,999 | 1,600 (20.5%) | 3,802 (19.8%) |
| $2,000 to $2,499 | 806 (10.3%) | 1,114 (5.8%) |
| $2,500 to $2,999 | 485 (6.2%) | 129 (0.7%) |
| $3,000 or more | 278 (3.6%) | 63 (0.3%) |
| Total | 7,790 (100.0%) | 19,190 (100.0%) |
Physical Housing Characteristics in San Marcos
Housing Structures in San Marcos
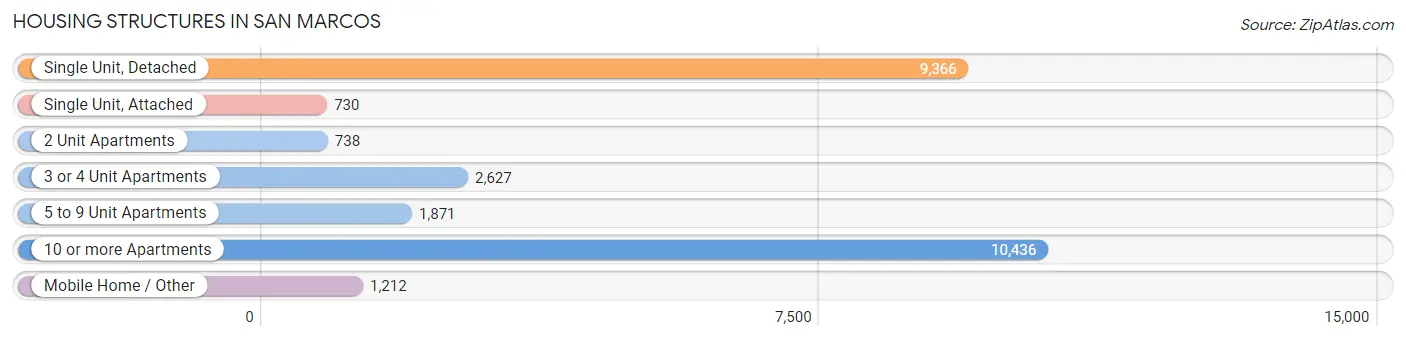
| Structure Type | # Housing Units | % Housing Units |
| Single Unit, Detached | 9,366 | 34.7% |
| Single Unit, Attached | 730 | 2.7% |
| 2 Unit Apartments | 738 | 2.7% |
| 3 or 4 Unit Apartments | 2,627 | 9.7% |
| 5 to 9 Unit Apartments | 1,871 | 6.9% |
| 10 or more Apartments | 10,436 | 38.7% |
| Mobile Home / Other | 1,212 | 4.5% |
| Total | 26,980 | 100.0% |
Housing Structures by Occupancy in San Marcos
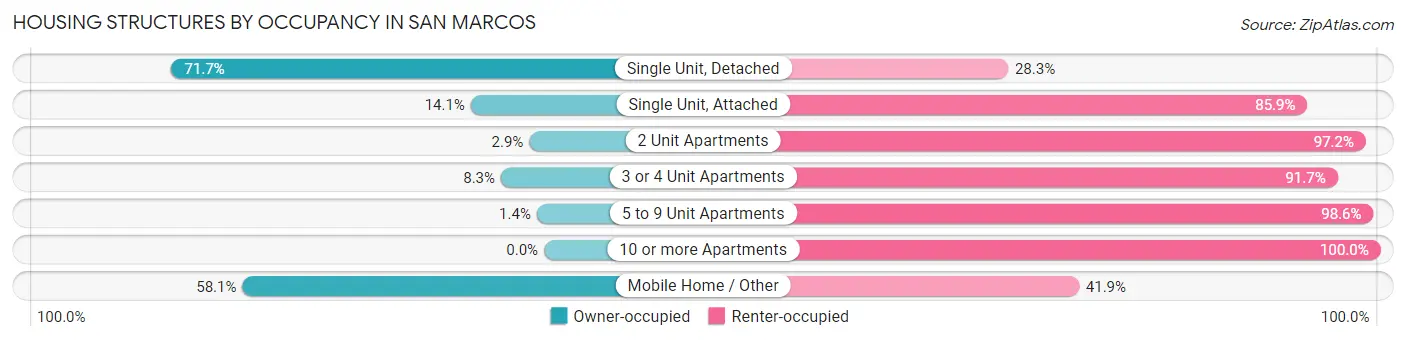
| Structure Type | Owner-occupied | Renter-occupied |
| Single Unit, Detached | 6,718 (71.7%) | 2,648 (28.3%) |
| Single Unit, Attached | 103 (14.1%) | 627 (85.9%) |
| 2 Unit Apartments | 21 (2.9%) | 717 (97.2%) |
| 3 or 4 Unit Apartments | 218 (8.3%) | 2,409 (91.7%) |
| 5 to 9 Unit Apartments | 26 (1.4%) | 1,845 (98.6%) |
| 10 or more Apartments | 0 (0.0%) | 10,436 (100.0%) |
| Mobile Home / Other | 704 (58.1%) | 508 (41.9%) |
| Total | 7,790 (28.9%) | 19,190 (71.1%) |
Housing Structures by Number of Rooms in San Marcos
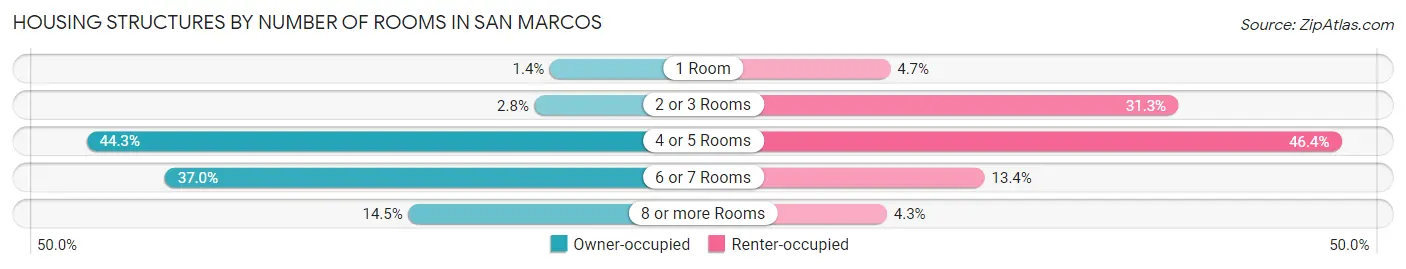
| Number of Rooms | Owner-occupied | Renter-occupied |
| 1 Room | 108 (1.4%) | 895 (4.7%) |
| 2 or 3 Rooms | 220 (2.8%) | 5,998 (31.3%) |
| 4 or 5 Rooms | 3,448 (44.3%) | 8,897 (46.4%) |
| 6 or 7 Rooms | 2,885 (37.0%) | 2,568 (13.4%) |
| 8 or more Rooms | 1,129 (14.5%) | 832 (4.3%) |
| Total | 7,790 (100.0%) | 19,190 (100.0%) |
Housing Structure by Heating Type in San Marcos
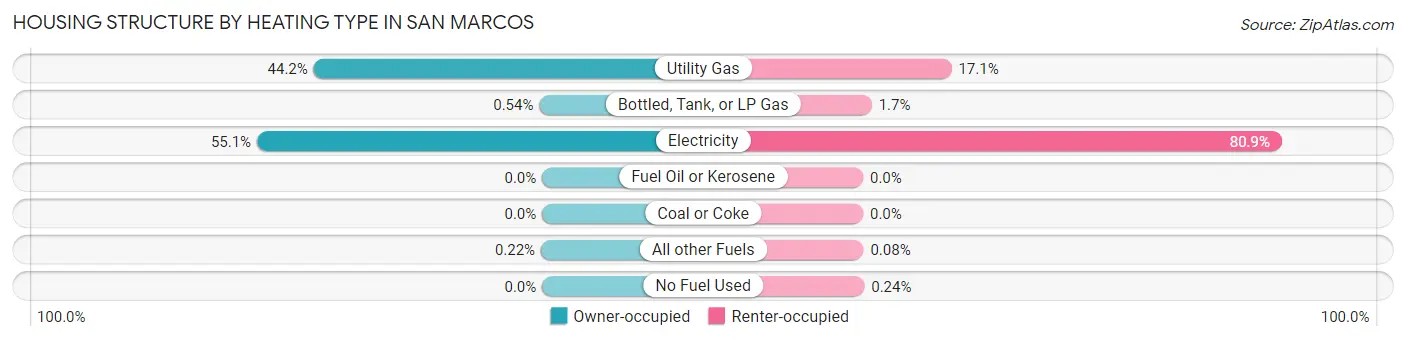
| Heating Type | Owner-occupied | Renter-occupied |
| Utility Gas | 3,439 (44.2%) | 3,280 (17.1%) |
| Bottled, Tank, or LP Gas | 42 (0.5%) | 321 (1.7%) |
| Electricity | 4,292 (55.1%) | 15,527 (80.9%) |
| Fuel Oil or Kerosene | 0 (0.0%) | 0 (0.0%) |
| Coal or Coke | 0 (0.0%) | 0 (0.0%) |
| All other Fuels | 17 (0.2%) | 15 (0.1%) |
| No Fuel Used | 0 (0.0%) | 47 (0.2%) |
| Total | 7,790 (100.0%) | 19,190 (100.0%) |
Household Vehicle Usage in San Marcos
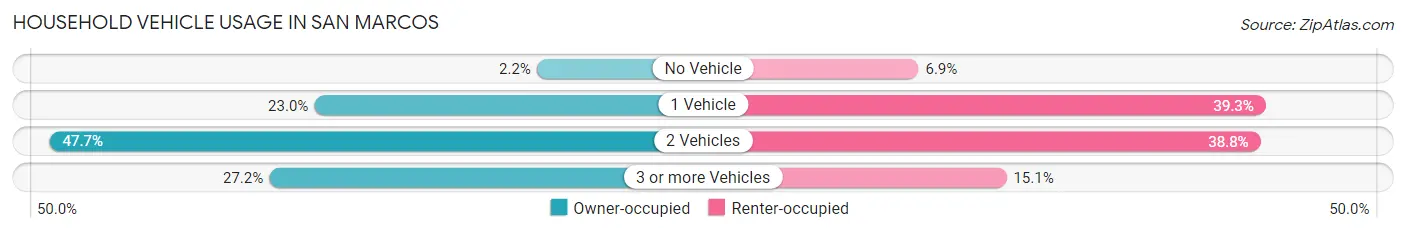
| Vehicles per Household | Owner-occupied | Renter-occupied |
| No Vehicle | 171 (2.2%) | 1,319 (6.9%) |
| 1 Vehicle | 1,789 (23.0%) | 7,536 (39.3%) |
| 2 Vehicles | 3,713 (47.7%) | 7,442 (38.8%) |
| 3 or more Vehicles | 2,117 (27.2%) | 2,893 (15.1%) |
| Total | 7,790 (100.0%) | 19,190 (100.0%) |
Real Estate & Mortgages in San Marcos
Real Estate and Mortgage Overview in San Marcos
| Characteristic | Without Mortgage | With Mortgage |
| Housing Units | 2,904 | 4,886 |
| Median Property Value | $208,200 | $263,100 |
| Median Household Income | $60,000 | $1,173 |
| Monthly Housing Costs | $627 | $278 |
| Real Estate Taxes | $3,154 | $140 |
Property Value by Mortgage Status in San Marcos
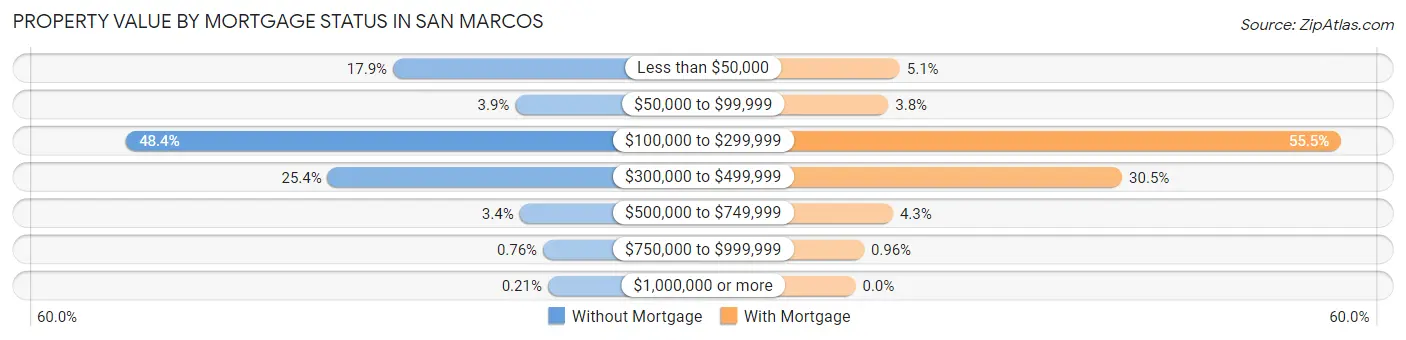
| Property Value | Without Mortgage | With Mortgage |
| Less than $50,000 | 520 (17.9%) | 247 (5.1%) |
| $50,000 to $99,999 | 114 (3.9%) | 183 (3.7%) |
| $100,000 to $299,999 | 1,405 (48.4%) | 2,711 (55.5%) |
| $300,000 to $499,999 | 737 (25.4%) | 1,489 (30.5%) |
| $500,000 to $749,999 | 100 (3.4%) | 209 (4.3%) |
| $750,000 to $999,999 | 22 (0.8%) | 47 (1.0%) |
| $1,000,000 or more | 6 (0.2%) | 0 (0.0%) |
| Total | 2,904 (100.0%) | 4,886 (100.0%) |
Household Income by Mortgage Status in San Marcos
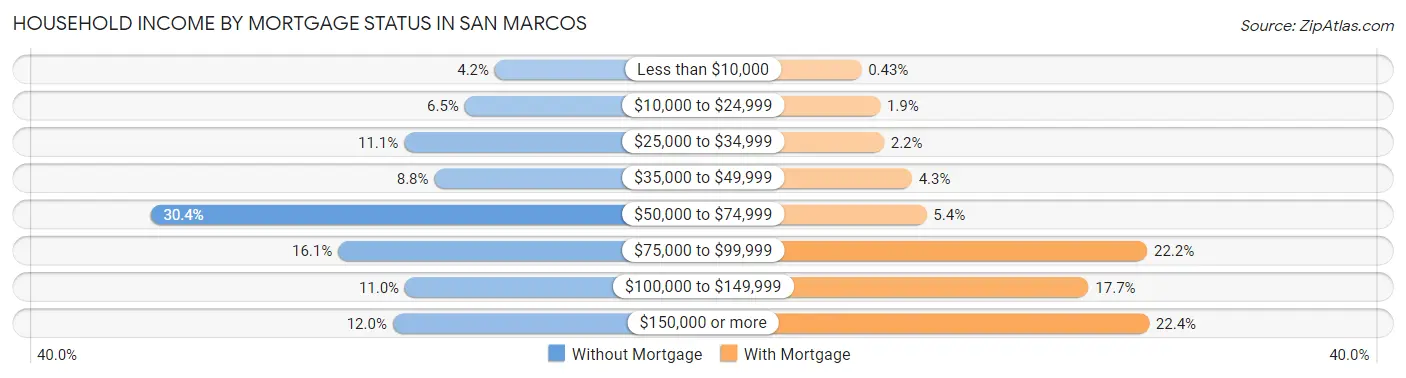
| Household Income | Without Mortgage | With Mortgage |
| Less than $10,000 | 121 (4.2%) | 21 (0.4%) |
| $10,000 to $24,999 | 188 (6.5%) | 91 (1.9%) |
| $25,000 to $34,999 | 322 (11.1%) | 105 (2.1%) |
| $35,000 to $49,999 | 255 (8.8%) | 209 (4.3%) |
| $50,000 to $74,999 | 883 (30.4%) | 264 (5.4%) |
| $75,000 to $99,999 | 468 (16.1%) | 1,085 (22.2%) |
| $100,000 to $149,999 | 320 (11.0%) | 867 (17.7%) |
| $150,000 or more | 347 (11.9%) | 1,092 (22.4%) |
| Total | 2,904 (100.0%) | 4,886 (100.0%) |
Property Value to Household Income Ratio in San Marcos
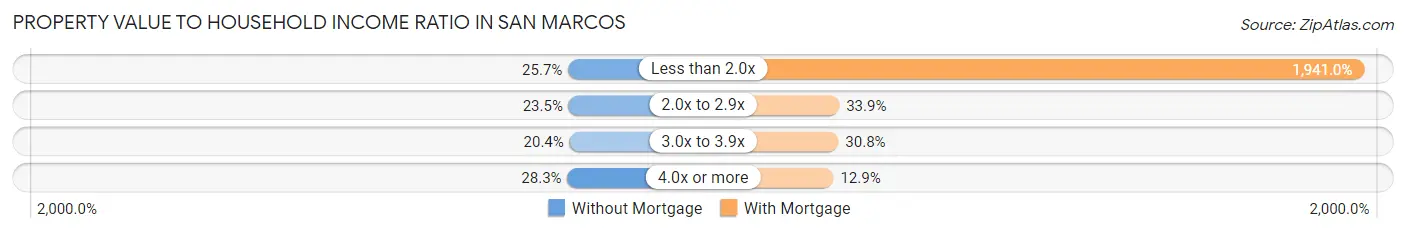
| Value-to-Income Ratio | Without Mortgage | With Mortgage |
| Less than 2.0x | 747 (25.7%) | 94,839 (1,941.0%) |
| 2.0x to 2.9x | 683 (23.5%) | 1,656 (33.9%) |
| 3.0x to 3.9x | 591 (20.3%) | 1,506 (30.8%) |
| 4.0x or more | 822 (28.3%) | 631 (12.9%) |
| Total | 2,904 (100.0%) | 4,886 (100.0%) |
Real Estate Taxes by Mortgage Status in San Marcos
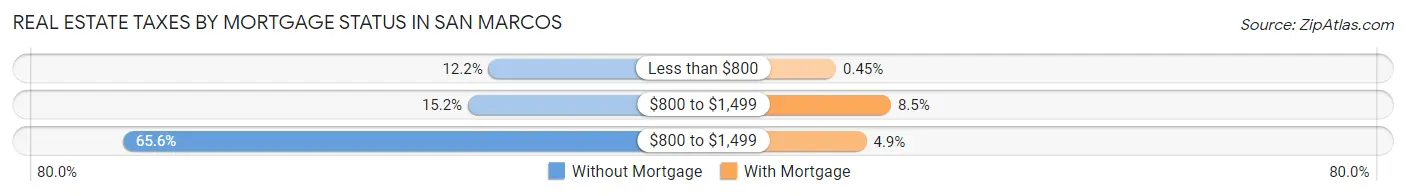
| Property Taxes | Without Mortgage | With Mortgage |
| Less than $800 | 355 (12.2%) | 22 (0.4%) |
| $800 to $1,499 | 442 (15.2%) | 414 (8.5%) |
| $800 to $1,499 | 1,906 (65.6%) | 239 (4.9%) |
| Total | 2,904 (100.0%) | 4,886 (100.0%) |
Health & Disability in San Marcos
Health Insurance Coverage by Age in San Marcos
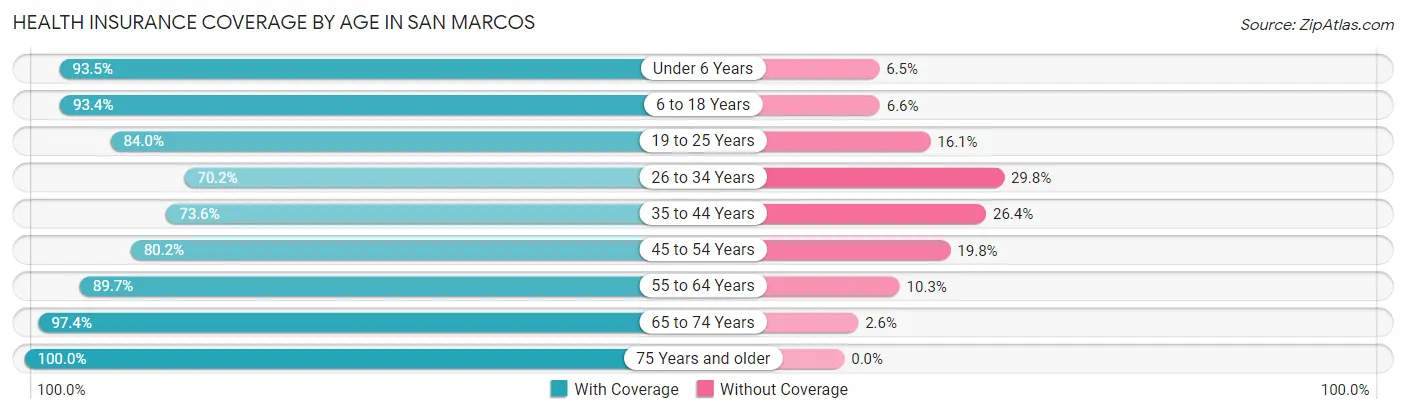
| Age Bracket | With Coverage | Without Coverage |
| Under 6 Years | 2,947 (93.5%) | 206 (6.5%) |
| 6 to 18 Years | 6,945 (93.4%) | 492 (6.6%) |
| 19 to 25 Years | 20,535 (84.0%) | 3,927 (16.1%) |
| 26 to 34 Years | 6,358 (70.2%) | 2,696 (29.8%) |
| 35 to 44 Years | 5,084 (73.6%) | 1,827 (26.4%) |
| 45 to 54 Years | 3,639 (80.2%) | 898 (19.8%) |
| 55 to 64 Years | 4,109 (89.7%) | 473 (10.3%) |
| 65 to 74 Years | 4,156 (97.4%) | 111 (2.6%) |
| 75 Years and older | 1,781 (100.0%) | 0 (0.0%) |
| Total | 55,554 (83.9%) | 10,630 (16.1%) |
Health Insurance Coverage by Citizenship Status in San Marcos
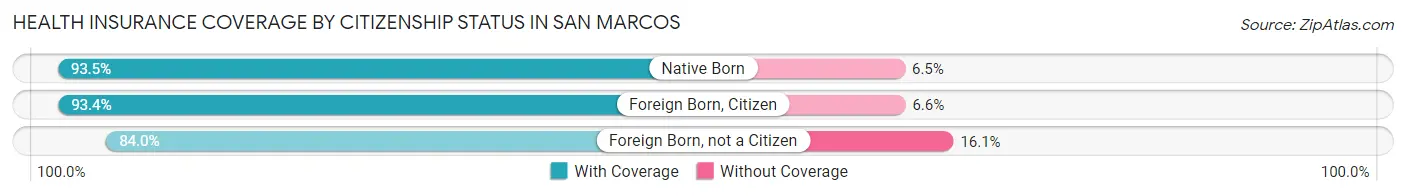
| Citizenship Status | With Coverage | Without Coverage |
| Native Born | 2,947 (93.5%) | 206 (6.5%) |
| Foreign Born, Citizen | 6,945 (93.4%) | 492 (6.6%) |
| Foreign Born, not a Citizen | 20,535 (84.0%) | 3,927 (16.1%) |
Health Insurance Coverage by Household Income in San Marcos
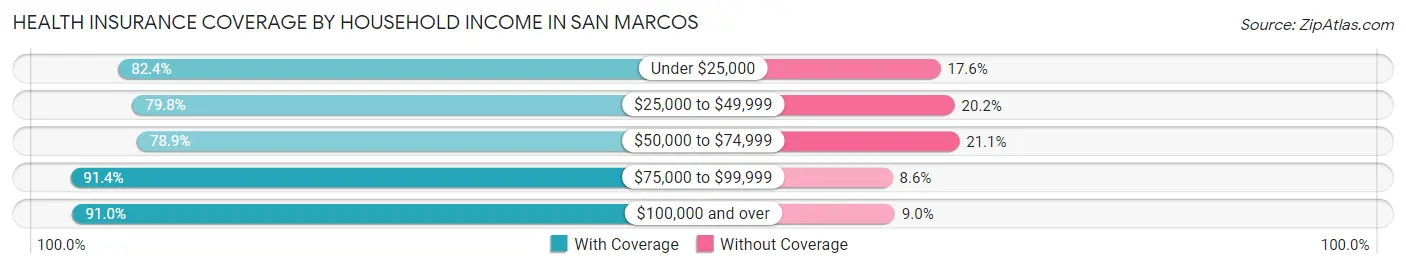
| Household Income | With Coverage | Without Coverage |
| Under $25,000 | 11,076 (82.4%) | 2,360 (17.6%) |
| $25,000 to $49,999 | 10,720 (79.8%) | 2,715 (20.2%) |
| $50,000 to $74,999 | 11,129 (78.9%) | 2,970 (21.1%) |
| $75,000 to $99,999 | 6,414 (91.4%) | 602 (8.6%) |
| $100,000 and over | 11,608 (91.0%) | 1,149 (9.0%) |
Public vs Private Health Insurance Coverage by Age in San Marcos
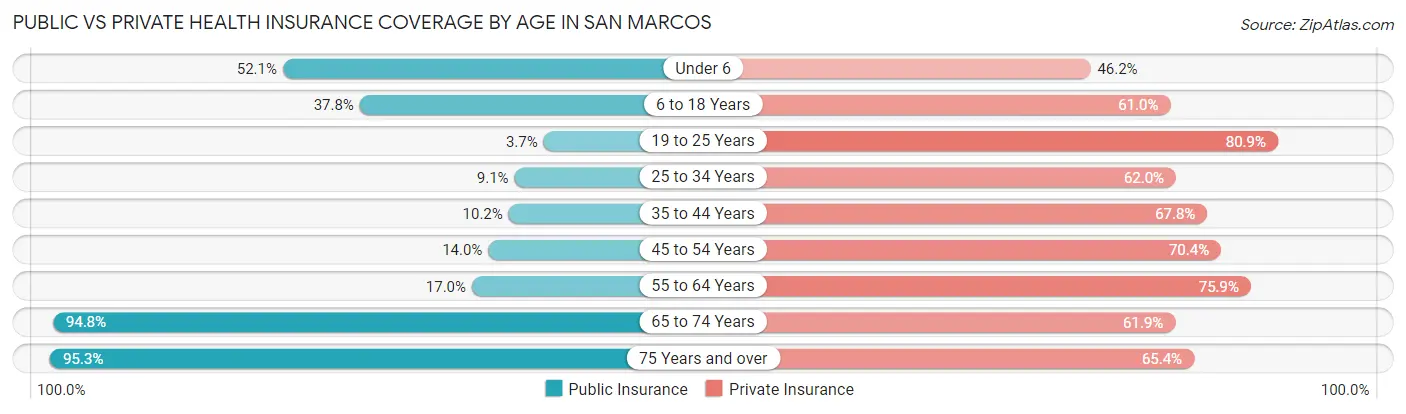
| Age Bracket | Public Insurance | Private Insurance |
| Under 6 | 1,642 (52.1%) | 1,455 (46.2%) |
| 6 to 18 Years | 2,811 (37.8%) | 4,535 (61.0%) |
| 19 to 25 Years | 898 (3.7%) | 19,795 (80.9%) |
| 25 to 34 Years | 822 (9.1%) | 5,615 (62.0%) |
| 35 to 44 Years | 702 (10.2%) | 4,687 (67.8%) |
| 45 to 54 Years | 633 (14.0%) | 3,193 (70.4%) |
| 55 to 64 Years | 778 (17.0%) | 3,478 (75.9%) |
| 65 to 74 Years | 4,043 (94.8%) | 2,640 (61.9%) |
| 75 Years and over | 1,697 (95.3%) | 1,164 (65.4%) |
| Total | 14,026 (21.2%) | 46,562 (70.4%) |
Disability Status by Sex by Age in San Marcos
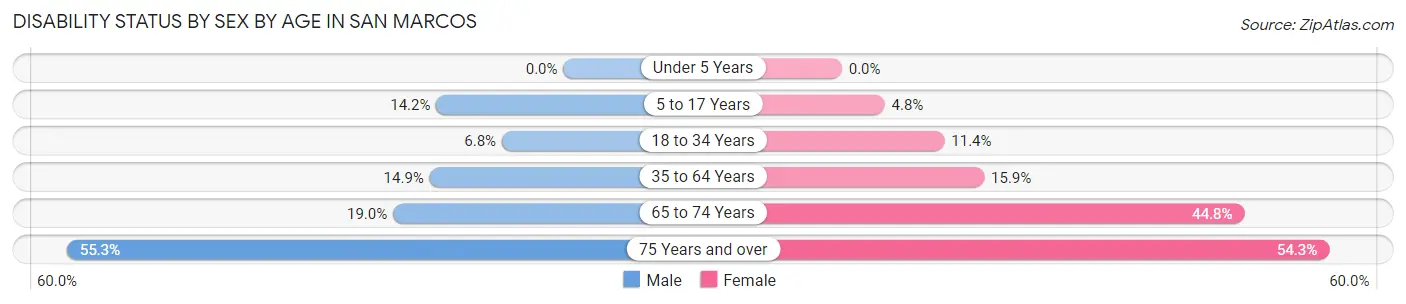
| Age Bracket | Male | Female |
| Under 5 Years | 0 (0.0%) | 0 (0.0%) |
| 5 to 17 Years | 402 (14.1%) | 130 (4.8%) |
| 18 to 34 Years | 1,147 (6.8%) | 2,176 (11.4%) |
| 35 to 64 Years | 1,169 (14.9%) | 1,297 (15.9%) |
| 65 to 74 Years | 332 (19.0%) | 1,128 (44.8%) |
| 75 Years and over | 407 (55.3%) | 567 (54.3%) |
Disability Class by Sex by Age in San Marcos
Disability Class: Hearing Difficulty
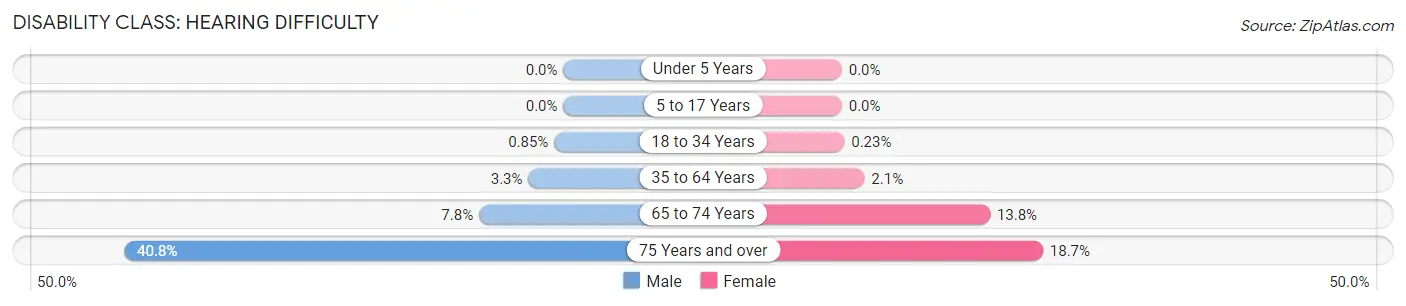
| Age Bracket | Male | Female |
| Under 5 Years | 0 (0.0%) | 0 (0.0%) |
| 5 to 17 Years | 0 (0.0%) | 0 (0.0%) |
| 18 to 34 Years | 142 (0.9%) | 44 (0.2%) |
| 35 to 64 Years | 255 (3.3%) | 172 (2.1%) |
| 65 to 74 Years | 137 (7.8%) | 346 (13.8%) |
| 75 Years and over | 300 (40.8%) | 195 (18.7%) |
Disability Class: Vision Difficulty
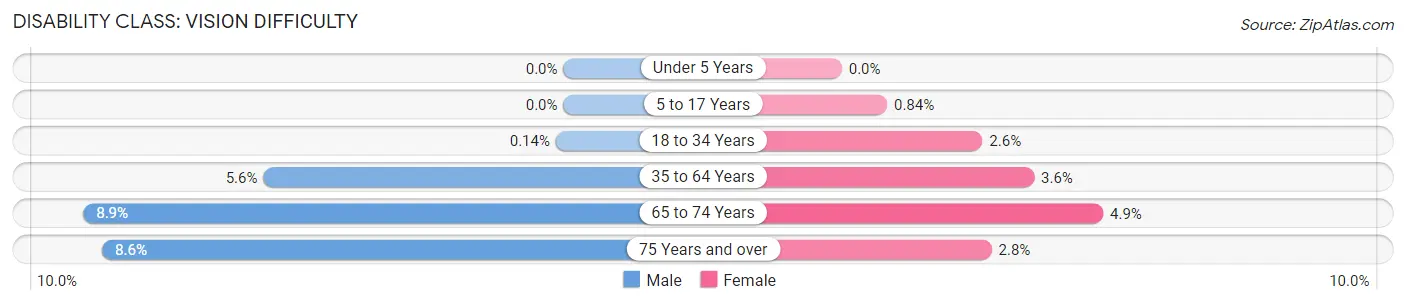
| Age Bracket | Male | Female |
| Under 5 Years | 0 (0.0%) | 0 (0.0%) |
| 5 to 17 Years | 0 (0.0%) | 23 (0.8%) |
| 18 to 34 Years | 24 (0.1%) | 498 (2.6%) |
| 35 to 64 Years | 437 (5.6%) | 292 (3.6%) |
| 65 to 74 Years | 156 (8.9%) | 122 (4.9%) |
| 75 Years and over | 63 (8.6%) | 29 (2.8%) |
Disability Class: Cognitive Difficulty
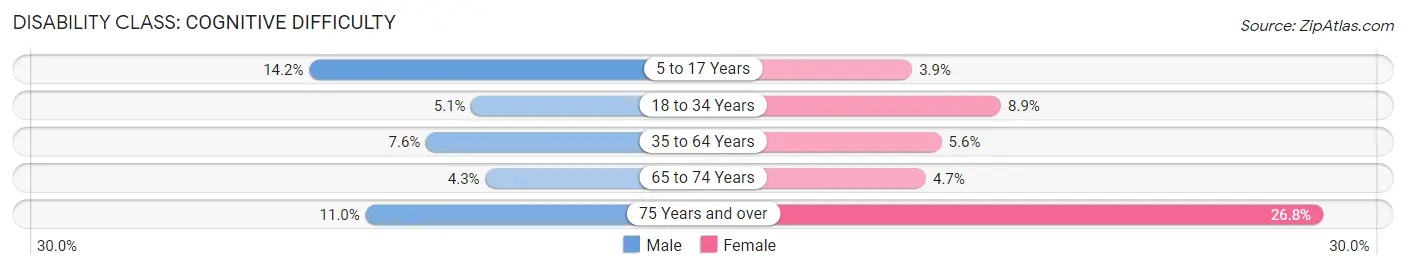
| Age Bracket | Male | Female |
| 5 to 17 Years | 402 (14.1%) | 107 (3.9%) |
| 18 to 34 Years | 859 (5.1%) | 1,691 (8.9%) |
| 35 to 64 Years | 600 (7.6%) | 455 (5.6%) |
| 65 to 74 Years | 76 (4.3%) | 118 (4.7%) |
| 75 Years and over | 81 (11.0%) | 280 (26.8%) |
Disability Class: Ambulatory Difficulty
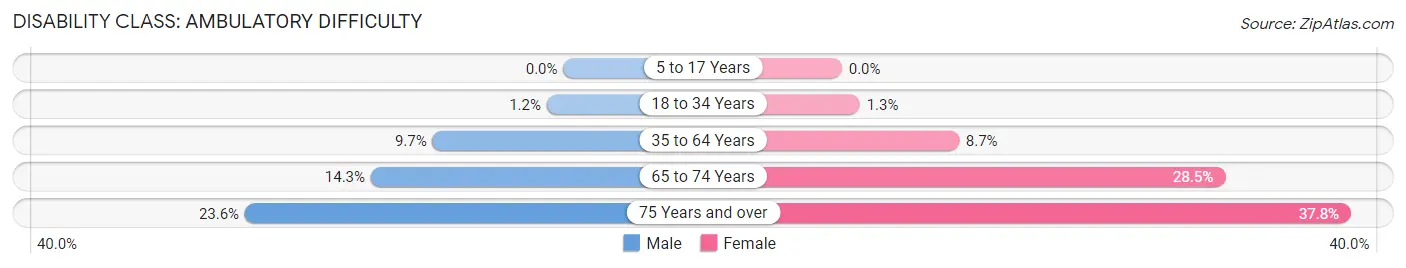
| Age Bracket | Male | Female |
| 5 to 17 Years | 0 (0.0%) | 0 (0.0%) |
| 18 to 34 Years | 207 (1.2%) | 254 (1.3%) |
| 35 to 64 Years | 762 (9.7%) | 711 (8.7%) |
| 65 to 74 Years | 250 (14.3%) | 716 (28.4%) |
| 75 Years and over | 174 (23.6%) | 395 (37.8%) |
Disability Class: Self-Care Difficulty
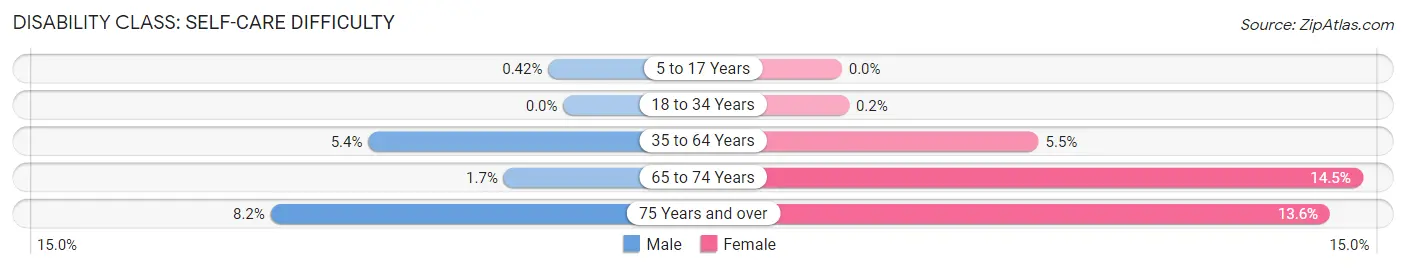
| Age Bracket | Male | Female |
| 5 to 17 Years | 12 (0.4%) | 0 (0.0%) |
| 18 to 34 Years | 0 (0.0%) | 38 (0.2%) |
| 35 to 64 Years | 426 (5.4%) | 448 (5.5%) |
| 65 to 74 Years | 29 (1.7%) | 365 (14.5%) |
| 75 Years and over | 60 (8.2%) | 142 (13.6%) |
Technology Access in San Marcos
Computing Device Access in San Marcos
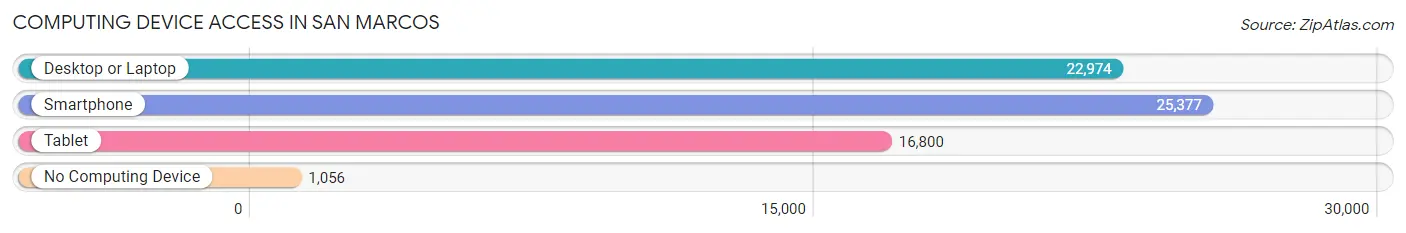
| Device Type | # Households | % Households |
| Desktop or Laptop | 22,974 | 85.2% |
| Smartphone | 25,377 | 94.1% |
| Tablet | 16,800 | 62.3% |
| No Computing Device | 1,056 | 3.9% |
| Total | 26,980 | 100.0% |
Internet Access in San Marcos
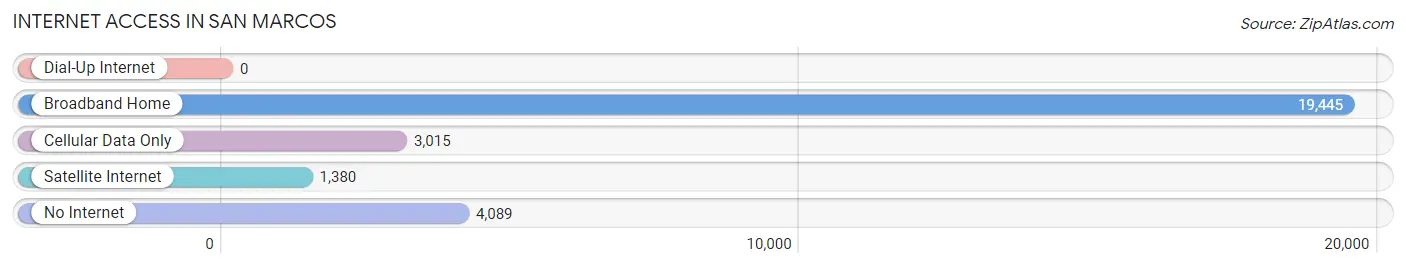
| Internet Type | # Households | % Households |
| Dial-Up Internet | 0 | 0.0% |
| Broadband Home | 19,445 | 72.1% |
| Cellular Data Only | 3,015 | 11.2% |
| Satellite Internet | 1,380 | 5.1% |
| No Internet | 4,089 | 15.2% |
| Total | 26,980 | 100.0% |
San Marcos Summary
History
The city of San Marcos, Texas is located in Hays County, about 30 miles south of Austin. It is the oldest city in Hays County, having been founded in 1851. The city was named after the San Marcos River, which was named after Saint Mark, the patron saint of Venice.
The area was originally inhabited by the Tonkawa and Comanche Native American tribes. In 1808, the Spanish established a mission in the area, which was later abandoned in 1812. In 1846, the area became part of the Republic of Texas.
In 1851, the city of San Marcos was founded by a group of settlers led by John O. Meusebach. The settlers were attracted to the area due to its fertile soil and abundant water supply. The city quickly grew and by 1853, it had a population of over 500.
In 1881, the San Marcos Normal School was established, which later became Southwest Texas State University. The university has since grown to become one of the largest universities in the state.
In the early 20th century, the city experienced a period of growth and development. The San Marcos and Eastern Railway was built in 1906, connecting the city to Austin and San Antonio. The city also became a popular tourist destination due to its proximity to the San Marcos River and the nearby Balcones Canyonlands National Wildlife Refuge.
Geography
San Marcos is located in the Hill Country region of Central Texas. The city is situated on the Balcones Escarpment, which is a geological formation that runs through the area. The city is located on the San Marcos River, which is a tributary of the Guadalupe River.
The city has a total area of 28.2 square miles, of which 28.1 square miles is land and 0.1 square miles is water. The terrain of the city is mostly flat, with some rolling hills. The climate of the city is classified as humid subtropical, with hot summers and mild winters.
Economy
San Marcos has a diverse economy, with a variety of industries represented. The city is home to several large employers, including the San Marcos Consolidated Independent School District, the San Marcos Premium Outlets, and the Central Texas Medical Center.
The city is also home to several higher education institutions, including Texas State University, Austin Community College, and the University of St. Augustine. These institutions provide a large number of jobs to the local economy.
The city is also home to several manufacturing companies, including the San Marcos Glass Company, the San Marcos Furniture Company, and the San Marcos Textile Company.
Demographics
As of the 2010 census, the population of San Marcos was 44,894. The racial makeup of the city was 73.3% White, 8.2% African American, 0.7% Native American, 5.2% Asian, 0.1% Pacific Islander, and 11.5% from other races. Hispanic or Latino of any race were 28.4% of the population.
The median household income in the city was $37,890, and the median family income was $45,945. The per capita income in the city was $20,945. About 17.2% of the population was below the poverty line.
Common Questions
What is Per Capita Income in San Marcos?
Per Capita income in San Marcos is $25,282.
What is the Median Family Income in San Marcos?
Median Family Income in San Marcos is $60,805.
What is the Median Household income in San Marcos?
Median Household Income in San Marcos is $47,394.
What is Income or Wage Gap in San Marcos?
Income or Wage Gap in San Marcos is 37.3%.
Women in San Marcos earn 62.7 cents for every dollar earned by a man.
What is Family Income Deficit in San Marcos?
Family Income Deficit in San Marcos is $9,714.
Families that are below poverty line in San Marcos earn $9,714 less on average than the poverty threshold level.
What is Inequality or Gini Index in San Marcos?
Inequality or Gini Index in San Marcos is 0.47.
What is the Total Population of San Marcos?
Total Population of San Marcos is 67,143.
What is the Total Male Population of San Marcos?
Total Male Population of San Marcos is 31,946.
What is the Total Female Population of San Marcos?
Total Female Population of San Marcos is 35,197.
What is the Ratio of Males per 100 Females in San Marcos?
There are 90.76 Males per 100 Females in San Marcos.
What is the Ratio of Females per 100 Males in San Marcos?
There are 110.18 Females per 100 Males in San Marcos.
What is the Median Population Age in San Marcos?
Median Population Age in San Marcos is 25.2 Years.
What is the Average Family Size in San Marcos
Average Family Size in San Marcos is 2.8 People.
What is the Average Household Size in San Marcos
Average Household Size in San Marcos is 2.3 People.
How Large is the Labor Force in San Marcos?
There are 39,755 People in the Labor Forcein in San Marcos.
What is the Percentage of People in the Labor Force in San Marcos?
66.8% of People are in the Labor Force in San Marcos.
What is the Unemployment Rate in San Marcos?
Unemployment Rate in San Marcos is 6.8%.