Cities with the Largest Mexican American Indian Community in Illinois
RELATED REPORTS & OPTIONS
Mexican American Indian
Illinois
Compare Cities
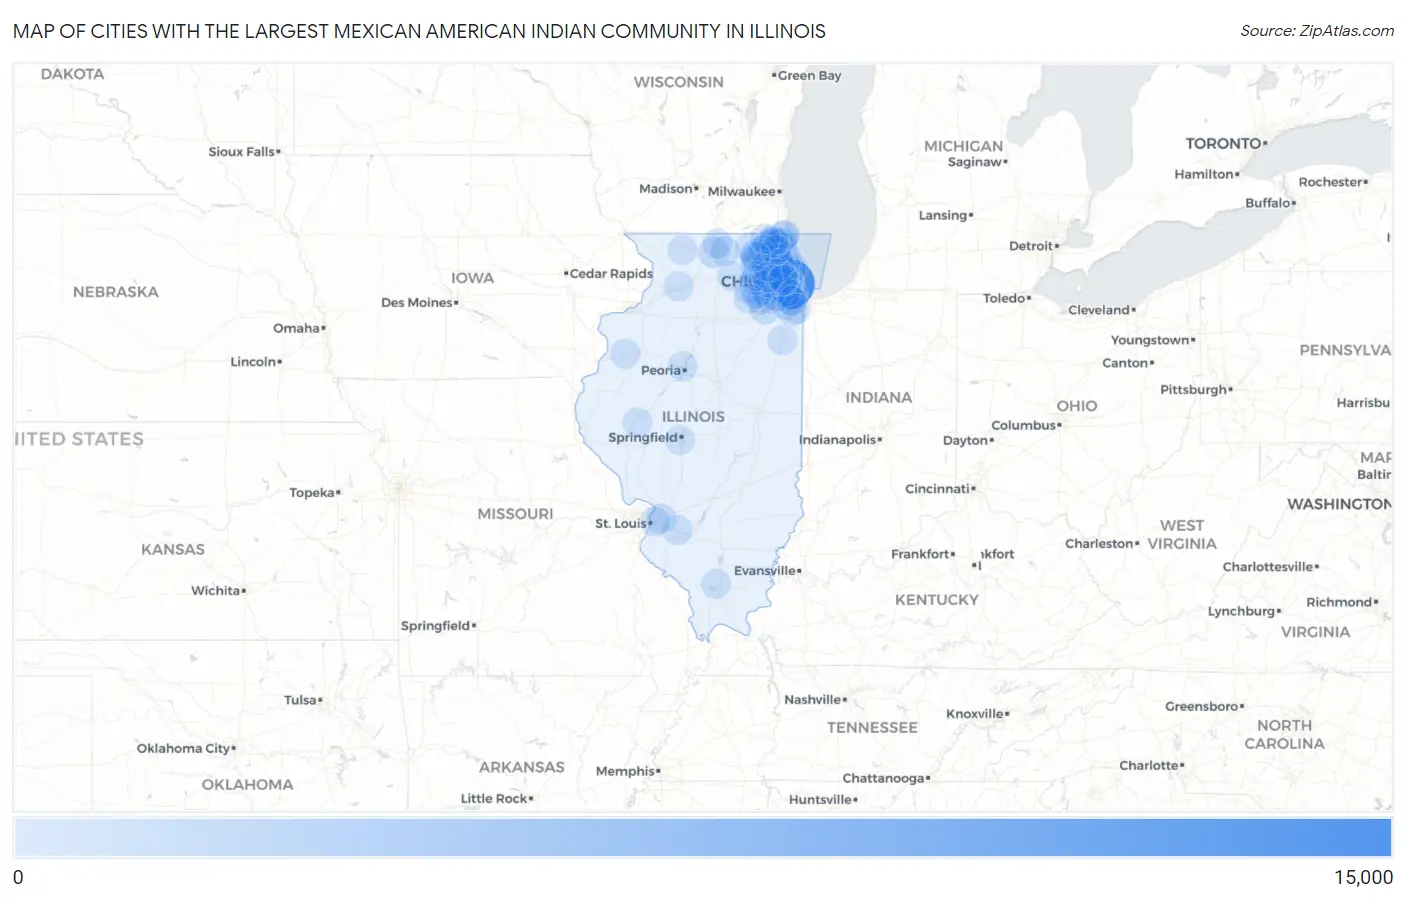
Map of Cities with the Largest Mexican American Indian Community in Illinois
0
15,000
Cities with the Largest Mexican American Indian Community in Illinois
| City | Mexican American Indian | vs State | vs National | |
| 1. | Chicago | 14,918 | 37,033(40.28%)#1 | 517,224(2.88%)#2 |
| 2. | Aurora | 1,030 | 37,033(2.78%)#2 | 517,224(0.20%)#61 |
| 3. | Elgin | 874 | 37,033(2.36%)#3 | 517,224(0.17%)#71 |
| 4. | Joliet | 761 | 37,033(2.05%)#4 | 517,224(0.15%)#85 |
| 5. | Rockford | 702 | 37,033(1.90%)#5 | 517,224(0.14%)#99 |
| 6. | Waukegan | 687 | 37,033(1.86%)#6 | 517,224(0.13%)#106 |
| 7. | Cicero | 629 | 37,033(1.70%)#7 | 517,224(0.12%)#120 |
| 8. | Mundelein | 509 | 37,033(1.37%)#8 | 517,224(0.10%)#166 |
| 9. | Carpentersville | 470 | 37,033(1.27%)#9 | 517,224(0.09%)#187 |
| 10. | Berwyn | 440 | 37,033(1.19%)#10 | 517,224(0.09%)#199 |
| 11. | Ridgewood | 427 | 37,033(1.15%)#11 | 517,224(0.08%)#206 |
| 12. | Streamwood | 391 | 37,033(1.06%)#12 | 517,224(0.08%)#234 |
| 13. | Romeoville | 385 | 37,033(1.04%)#13 | 517,224(0.07%)#238 |
| 14. | Oak Lawn | 378 | 37,033(1.02%)#14 | 517,224(0.07%)#243 |
| 15. | Addison | 371 | 37,033(1.00%)#15 | 517,224(0.07%)#248 |
| 16. | Glendale Heights | 366 | 37,033(0.99%)#16 | 517,224(0.07%)#256 |
| 17. | Franklin Park | 347 | 37,033(0.94%)#17 | 517,224(0.07%)#269 |
| 18. | Bolingbrook | 337 | 37,033(0.91%)#18 | 517,224(0.07%)#278 |
| 19. | Wheeling | 328 | 37,033(0.89%)#19 | 517,224(0.06%)#289 |
| 20. | Bartlett | 295 | 37,033(0.80%)#20 | 517,224(0.06%)#322 |
| 21. | Park City | 290 | 37,033(0.78%)#21 | 517,224(0.06%)#328 |
| 22. | Hickory Hills | 271 | 37,033(0.73%)#22 | 517,224(0.05%)#355 |
| 23. | North Chicago | 268 | 37,033(0.72%)#23 | 517,224(0.05%)#364 |
| 24. | Park Forest | 237 | 37,033(0.64%)#24 | 517,224(0.05%)#408 |
| 25. | Hanover Park | 231 | 37,033(0.62%)#25 | 517,224(0.04%)#413 |
| 26. | Zion | 228 | 37,033(0.62%)#26 | 517,224(0.04%)#419 |
| 27. | Des Plaines | 215 | 37,033(0.58%)#27 | 517,224(0.04%)#442 |
| 28. | New Baden | 213 | 37,033(0.58%)#28 | 517,224(0.04%)#451 |
| 29. | Skokie | 208 | 37,033(0.56%)#29 | 517,224(0.04%)#463 |
| 30. | Round Lake Park | 208 | 37,033(0.56%)#30 | 517,224(0.04%)#467 |
| 31. | Collinsville | 191 | 37,033(0.52%)#31 | 517,224(0.04%)#500 |
| 32. | Algonquin | 186 | 37,033(0.50%)#32 | 517,224(0.04%)#512 |
| 33. | Stickney | 185 | 37,033(0.50%)#33 | 517,224(0.04%)#515 |
| 34. | Mount Prospect | 179 | 37,033(0.48%)#34 | 517,224(0.03%)#524 |
| 35. | Burbank | 168 | 37,033(0.45%)#35 | 517,224(0.03%)#553 |
| 36. | Round Lake | 158 | 37,033(0.43%)#36 | 517,224(0.03%)#590 |
| 37. | Schaumburg | 156 | 37,033(0.42%)#37 | 517,224(0.03%)#592 |
| 38. | Oak Park | 153 | 37,033(0.41%)#38 | 517,224(0.03%)#606 |
| 39. | Bensenville | 149 | 37,033(0.40%)#39 | 517,224(0.03%)#623 |
| 40. | Evanston | 146 | 37,033(0.39%)#40 | 517,224(0.03%)#637 |
| 41. | Bloomingdale | 143 | 37,033(0.39%)#41 | 517,224(0.03%)#650 |
| 42. | Vernon Hills | 141 | 37,033(0.38%)#42 | 517,224(0.03%)#657 |
| 43. | Monmouth | 139 | 37,033(0.38%)#43 | 517,224(0.03%)#664 |
| 44. | Dekalb | 138 | 37,033(0.37%)#44 | 517,224(0.03%)#666 |
| 45. | Alsip | 137 | 37,033(0.37%)#45 | 517,224(0.03%)#671 |
| 46. | Summit | 133 | 37,033(0.36%)#46 | 517,224(0.03%)#690 |
| 47. | Warrenville | 130 | 37,033(0.35%)#47 | 517,224(0.03%)#701 |
| 48. | Niles | 127 | 37,033(0.34%)#48 | 517,224(0.02%)#711 |
| 49. | Round Lake Beach | 126 | 37,033(0.34%)#49 | 517,224(0.02%)#716 |
| 50. | Springfield | 124 | 37,033(0.33%)#50 | 517,224(0.02%)#723 |
| 51. | Highland Park | 123 | 37,033(0.33%)#51 | 517,224(0.02%)#729 |
| 52. | Sugar Grove | 123 | 37,033(0.33%)#52 | 517,224(0.02%)#732 |
| 53. | Indian Head Park | 122 | 37,033(0.33%)#53 | 517,224(0.02%)#736 |
| 54. | Gurnee | 121 | 37,033(0.33%)#54 | 517,224(0.02%)#737 |
| 55. | Woodstock | 115 | 37,033(0.31%)#55 | 517,224(0.02%)#761 |
| 56. | Cary | 111 | 37,033(0.30%)#56 | 517,224(0.02%)#783 |
| 57. | Fairmont City | 108 | 37,033(0.29%)#57 | 517,224(0.02%)#798 |
| 58. | Westmont | 107 | 37,033(0.29%)#58 | 517,224(0.02%)#801 |
| 59. | Villa Park | 104 | 37,033(0.28%)#59 | 517,224(0.02%)#819 |
| 60. | Winthrop Harbor | 98 | 37,033(0.26%)#60 | 517,224(0.02%)#855 |
| 61. | Kankakee | 97 | 37,033(0.26%)#61 | 517,224(0.02%)#860 |
| 62. | Beardstown | 96 | 37,033(0.26%)#62 | 517,224(0.02%)#865 |
| 63. | Naperville | 92 | 37,033(0.25%)#63 | 517,224(0.02%)#887 |
| 64. | Peoria | 89 | 37,033(0.24%)#64 | 517,224(0.02%)#909 |
| 65. | Herrin | 88 | 37,033(0.24%)#65 | 517,224(0.02%)#920 |
| 66. | Buffalo Grove | 85 | 37,033(0.23%)#66 | 517,224(0.02%)#943 |
| 67. | Sterling | 85 | 37,033(0.23%)#67 | 517,224(0.02%)#946 |
| 68. | Plainfield | 84 | 37,033(0.23%)#68 | 517,224(0.02%)#953 |
| 69. | Tinley Park | 78 | 37,033(0.21%)#69 | 517,224(0.02%)#994 |
| 70. | Boulder Hill | 78 | 37,033(0.21%)#70 | 517,224(0.02%)#1,000 |
| 71. | Melrose Park | 76 | 37,033(0.21%)#71 | 517,224(0.01%)#1,010 |
| 72. | Midlothian | 76 | 37,033(0.21%)#72 | 517,224(0.01%)#1,013 |
| 73. | Wheaton | 74 | 37,033(0.20%)#73 | 517,224(0.01%)#1,025 |
| 74. | Elk Grove Village | 67 | 37,033(0.18%)#74 | 517,224(0.01%)#1,086 |
| 75. | Crystal Lake | 66 | 37,033(0.18%)#75 | 517,224(0.01%)#1,097 |
| 76. | Lindenhurst | 66 | 37,033(0.18%)#76 | 517,224(0.01%)#1,101 |
| 77. | Wood Dale | 66 | 37,033(0.18%)#77 | 517,224(0.01%)#1,102 |
| 78. | Park Ridge | 64 | 37,033(0.17%)#78 | 517,224(0.01%)#1,115 |
| 79. | Geneva | 64 | 37,033(0.17%)#79 | 517,224(0.01%)#1,117 |
| 80. | St Charles | 62 | 37,033(0.17%)#80 | 517,224(0.01%)#1,135 |
| 81. | Bridgeview | 62 | 37,033(0.17%)#81 | 517,224(0.01%)#1,137 |
| 82. | Belvidere | 61 | 37,033(0.16%)#82 | 517,224(0.01%)#1,154 |
| 83. | Yorkville | 61 | 37,033(0.16%)#83 | 517,224(0.01%)#1,155 |
| 84. | Lemont | 58 | 37,033(0.16%)#84 | 517,224(0.01%)#1,191 |
| 85. | Island Lake | 56 | 37,033(0.15%)#85 | 517,224(0.01%)#1,221 |
| 86. | Hillside | 55 | 37,033(0.15%)#86 | 517,224(0.01%)#1,232 |
| 87. | Machesney Park | 53 | 37,033(0.14%)#87 | 517,224(0.01%)#1,257 |
| 88. | Prospect Heights | 53 | 37,033(0.14%)#88 | 517,224(0.01%)#1,258 |
| 89. | Freeport | 50 | 37,033(0.14%)#89 | 517,224(0.01%)#1,293 |
| 90. | Merrionette Park | 48 | 37,033(0.13%)#90 | 517,224(0.01%)#1,342 |
| 91. | Hoffman Estates | 47 | 37,033(0.13%)#91 | 517,224(0.01%)#1,344 |
| 92. | River Grove | 47 | 37,033(0.13%)#92 | 517,224(0.01%)#1,348 |
| 93. | Chicago Heights | 45 | 37,033(0.12%)#93 | 517,224(0.01%)#1,374 |
| 94. | Libertyville | 43 | 37,033(0.12%)#94 | 517,224(0.01%)#1,410 |
| 95. | Markham | 43 | 37,033(0.12%)#95 | 517,224(0.01%)#1,415 |
| 96. | Maywood | 41 | 37,033(0.11%)#96 | 517,224(0.01%)#1,437 |
| 97. | Third Lake | 41 | 37,033(0.11%)#97 | 517,224(0.01%)#1,449 |
| 98. | Carol Stream | 39 | 37,033(0.11%)#98 | 517,224(0.01%)#1,475 |
| 99. | Lake In The Hills | 39 | 37,033(0.11%)#99 | 517,224(0.01%)#1,478 |
| 100. | Fox Lake | 39 | 37,033(0.11%)#100 | 517,224(0.01%)#1,484 |
Common Questions
What are the Top 10 Cities with the Largest Mexican American Indian Community in Illinois?
Top 10 Cities with the Largest Mexican American Indian Community in Illinois are:
What city has the Largest Mexican American Indian Community in Illinois?
Chicago has the Largest Mexican American Indian Community in Illinois with 14,918.
What is the Total Mexican American Indian Population in the State of Illinois?
Total Mexican American Indian Population in Illinois is 37,033.
What is the Total Mexican American Indian Population in the United States?
Total Mexican American Indian Population in the United States is 517,224.