New Brunswick, NJ Map & Demographics
New Brunswick Map
New Brunswick Overview
$24,057
PER CAPITA INCOME
$60,590
AVG FAMILY INCOME
$57,138
AVG HOUSEHOLD INCOME
36.9%
WAGE / INCOME GAP [ % ]
63.1¢/ $1
WAGE / INCOME GAP [ $ ]
$11,826
FAMILY INCOME DEFICIT
0.52
INEQUALITY / GINI INDEX
55,718
TOTAL POPULATION
29,113
MALE POPULATION
26,605
FEMALE POPULATION
109.43
MALES / 100 FEMALES
91.39
FEMALES / 100 MALES
24.0
MEDIAN AGE
3.6
AVG FAMILY SIZE
3.0
AVG HOUSEHOLD SIZE
27,472
LABOR FORCE [ PEOPLE ]
60.2%
PERCENT IN LABOR FORCE
6.5%
UNEMPLOYMENT RATE
New Brunswick Zip Codes
Income in New Brunswick
Income Overview in New Brunswick
Per Capita Income in New Brunswick is $24,057, while median incomes of families and households are $60,590 and $57,138 respectively.
| Characteristic | Number | Measure |
| Per Capita Income | 55,718 | $24,057 |
| Median Family Income | 8,792 | $60,590 |
| Mean Family Income | 8,792 | $84,439 |
| Median Household Income | 15,626 | $57,138 |
| Mean Household Income | 15,626 | $81,409 |
| Income Deficit | 8,792 | $11,826 |
| Wage / Income Gap (%) | 55,718 | 36.88% |
| Wage / Income Gap ($) | 55,718 | 63.12¢ per $1 |
| Gini / Inequality Index | 55,718 | 0.52 |
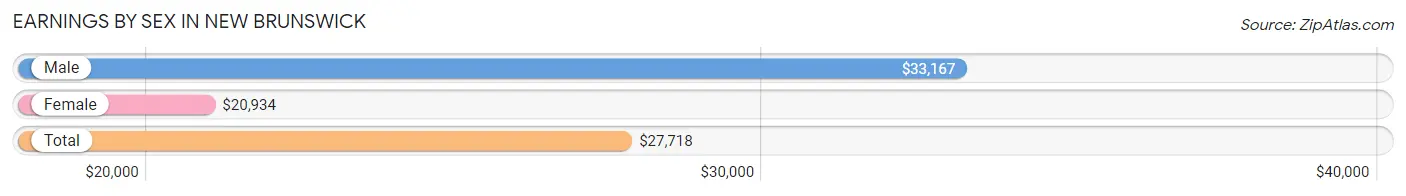
Earnings by Sex in New Brunswick
Average Earnings in New Brunswick are $27,718, $33,167 for men and $20,934 for women, a difference of 36.9%.
| Sex | Number | Average Earnings |
| Male | 16,232 (54.8%) | $33,167 |
| Female | 13,368 (45.2%) | $20,934 |
| Total | 29,600 (100.0%) | $27,718 |
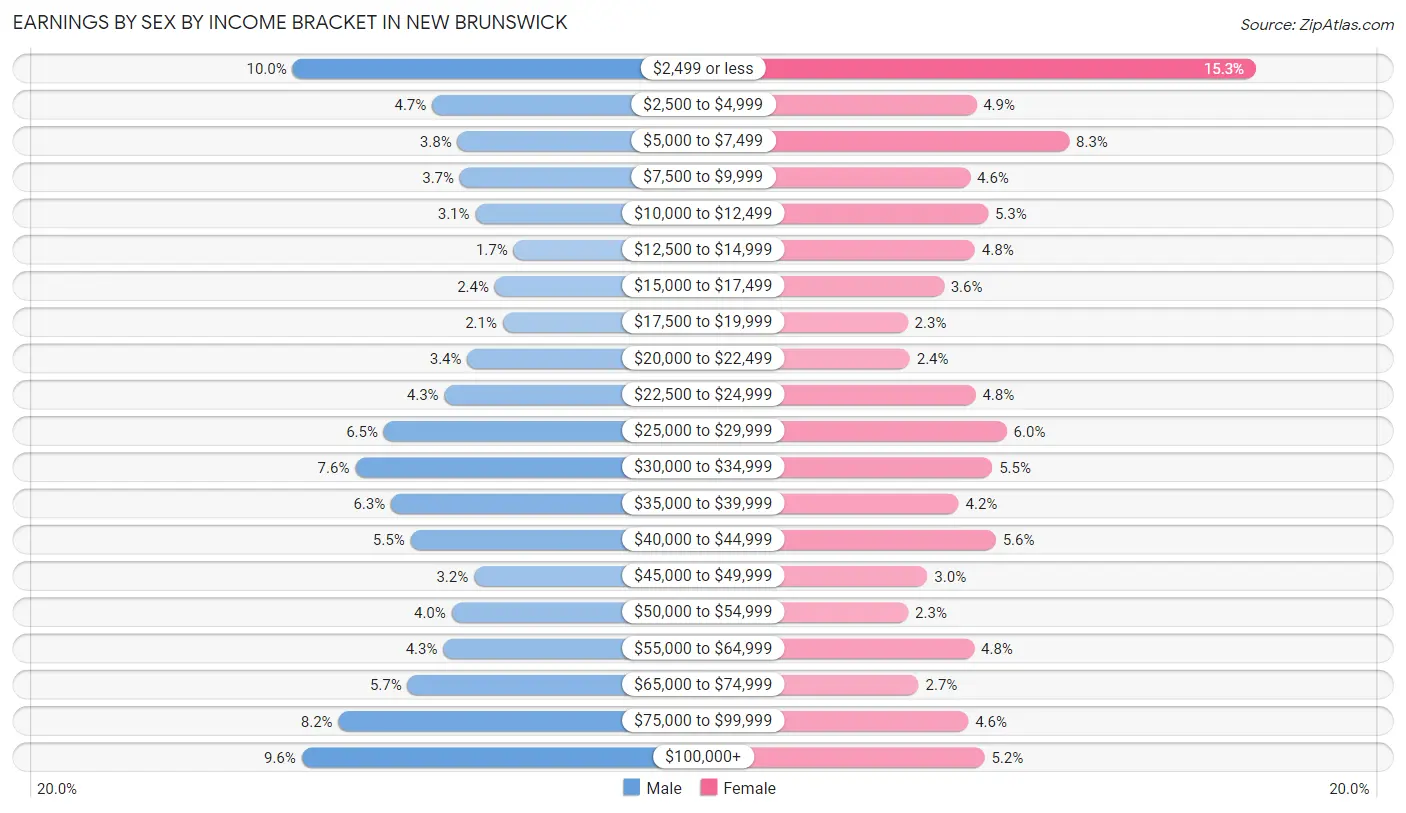
Earnings by Sex by Income Bracket in New Brunswick
The most common earnings brackets in New Brunswick are $2,499 or less for men (1,617 | 10.0%) and $2,499 or less for women (2,049 | 15.3%).
| Income | Male | Female |
| $2,499 or less | 1,617 (10.0%) | 2,049 (15.3%) |
| $2,500 to $4,999 | 767 (4.7%) | 648 (4.9%) |
| $5,000 to $7,499 | 613 (3.8%) | 1,113 (8.3%) |
| $7,500 to $9,999 | 599 (3.7%) | 618 (4.6%) |
| $10,000 to $12,499 | 505 (3.1%) | 707 (5.3%) |
| $12,500 to $14,999 | 272 (1.7%) | 641 (4.8%) |
| $15,000 to $17,499 | 386 (2.4%) | 485 (3.6%) |
| $17,500 to $19,999 | 337 (2.1%) | 305 (2.3%) |
| $20,000 to $22,499 | 553 (3.4%) | 316 (2.4%) |
| $22,500 to $24,999 | 693 (4.3%) | 645 (4.8%) |
| $25,000 to $29,999 | 1,061 (6.5%) | 801 (6.0%) |
| $30,000 to $34,999 | 1,235 (7.6%) | 728 (5.4%) |
| $35,000 to $39,999 | 1,017 (6.3%) | 560 (4.2%) |
| $40,000 to $44,999 | 899 (5.5%) | 746 (5.6%) |
| $45,000 to $49,999 | 513 (3.2%) | 404 (3.0%) |
| $50,000 to $54,999 | 650 (4.0%) | 307 (2.3%) |
| $55,000 to $64,999 | 699 (4.3%) | 638 (4.8%) |
| $65,000 to $74,999 | 917 (5.7%) | 359 (2.7%) |
| $75,000 to $99,999 | 1,338 (8.2%) | 608 (4.5%) |
| $100,000+ | 1,561 (9.6%) | 690 (5.2%) |
| Total | 16,232 (100.0%) | 13,368 (100.0%) |
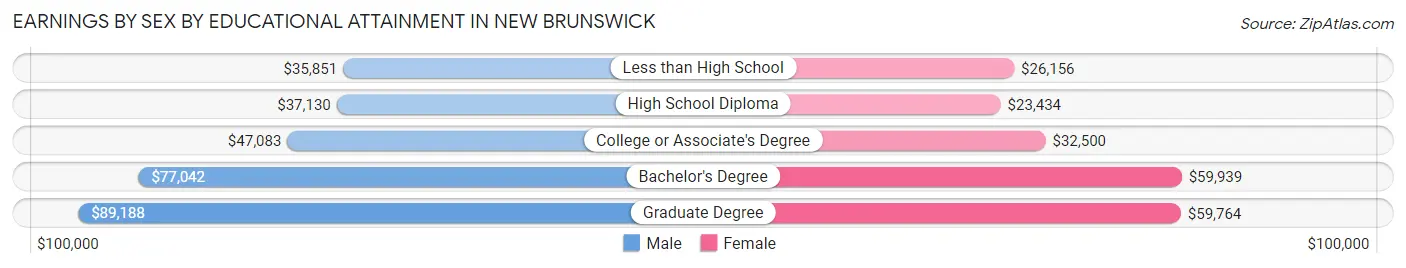
Earnings by Sex by Educational Attainment in New Brunswick
Average earnings in New Brunswick are $44,431 for men and $31,583 for women, a difference of 28.9%. Men with an educational attainment of graduate degree enjoy the highest average annual earnings of $89,188, while those with less than high school education earn the least with $35,851. Women with an educational attainment of bachelor's degree earn the most with the average annual earnings of $59,939, while those with high school diploma education have the smallest earnings of $23,434.
| Educational Attainment | Male Income | Female Income |
| Less than High School | $35,851 | $26,156 |
| High School Diploma | $37,130 | $23,434 |
| College or Associate's Degree | $47,083 | $32,500 |
| Bachelor's Degree | $77,042 | $59,939 |
| Graduate Degree | $89,188 | $59,764 |
| Total | $44,431 | $31,583 |
Family Income in New Brunswick
Family Income Brackets in New Brunswick
According to the New Brunswick family income data, there are 1,301 families falling into the $100,000 to $149,999 income range, which is the most common income bracket and makes up 14.8% of all families. Conversely, the $10,000 to $14,999 income bracket is the least frequent group with only 360 families (4.1%) belonging to this category.
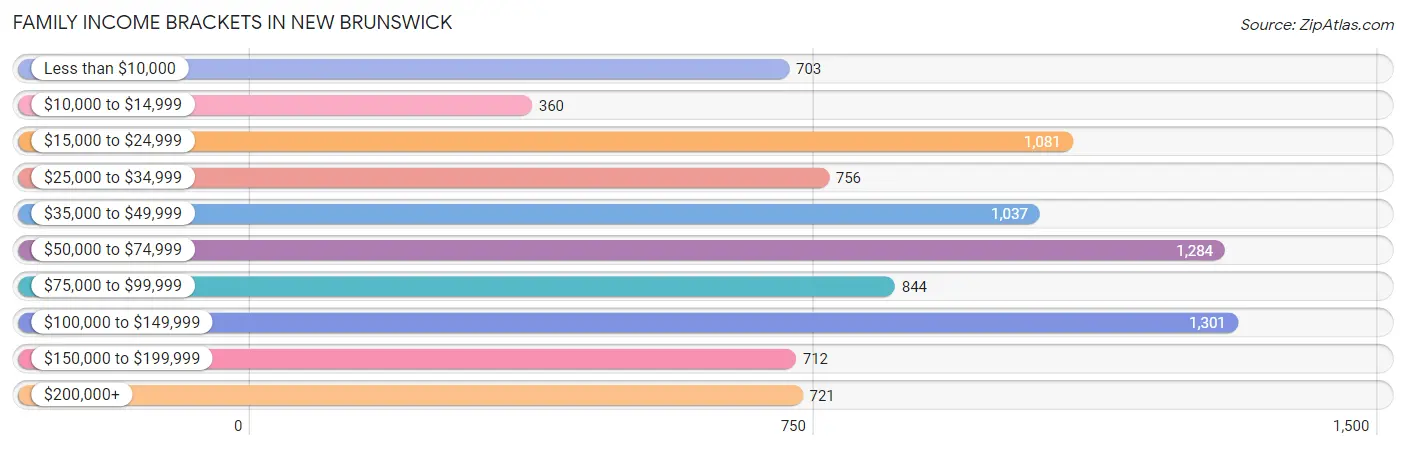
| Income Bracket | # Families | % Families |
| Less than $10,000 | 703 | 8.0% |
| $10,000 to $14,999 | 360 | 4.1% |
| $15,000 to $24,999 | 1,081 | 12.3% |
| $25,000 to $34,999 | 756 | 8.6% |
| $35,000 to $49,999 | 1,037 | 11.8% |
| $50,000 to $74,999 | 1,284 | 14.6% |
| $75,000 to $99,999 | 844 | 9.6% |
| $100,000 to $149,999 | 1,301 | 14.8% |
| $150,000 to $199,999 | 712 | 8.1% |
| $200,000+ | 721 | 8.2% |
Family Income by Famaliy Size in New Brunswick
6-person families (718 | 8.2%) account for the highest median family income in New Brunswick with $88,750 per family, while 2-person families (2,726 | 31.0%) have the highest median income of $28,702 per family member.
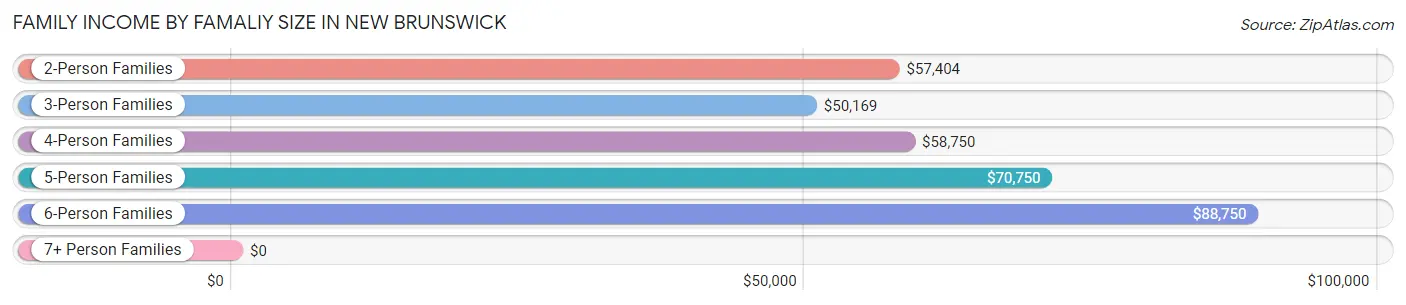
| Income Bracket | # Families | Median Income |
| 2-Person Families | 2,726 (31.0%) | $57,404 |
| 3-Person Families | 2,566 (29.2%) | $50,169 |
| 4-Person Families | 1,578 (17.9%) | $58,750 |
| 5-Person Families | 928 (10.6%) | $70,750 |
| 6-Person Families | 718 (8.2%) | $88,750 |
| 7+ Person Families | 276 (3.1%) | $0 |
| Total | 8,792 (100.0%) | $60,590 |
Family Income by Number of Earners in New Brunswick
The median family income in New Brunswick is $60,590, with families comprising 3+ earners (1,441) having the highest median family income of $123,125, while families with no earners (1,156) have the lowest median family income of $13,078, accounting for 16.4% and 13.2% of families, respectively.
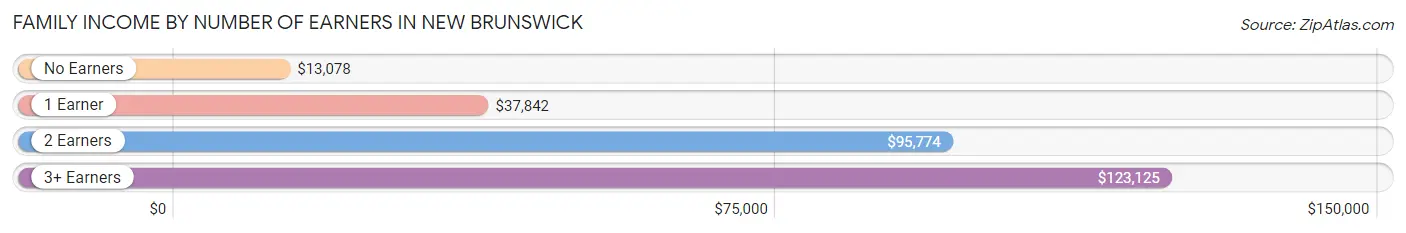
| Number of Earners | # Families | Median Income |
| No Earners | 1,156 (13.2%) | $13,078 |
| 1 Earner | 3,136 (35.7%) | $37,842 |
| 2 Earners | 3,059 (34.8%) | $95,774 |
| 3+ Earners | 1,441 (16.4%) | $123,125 |
| Total | 8,792 (100.0%) | $60,590 |
Household Income in New Brunswick
Household Income Brackets in New Brunswick
With 2,360 households falling in the category, the $100,000 to $149,999 income range is the most frequent in New Brunswick, accounting for 15.1% of all households. In contrast, only 906 households (5.8%) fall into the $10,000 to $14,999 income bracket, making it the least populous group.
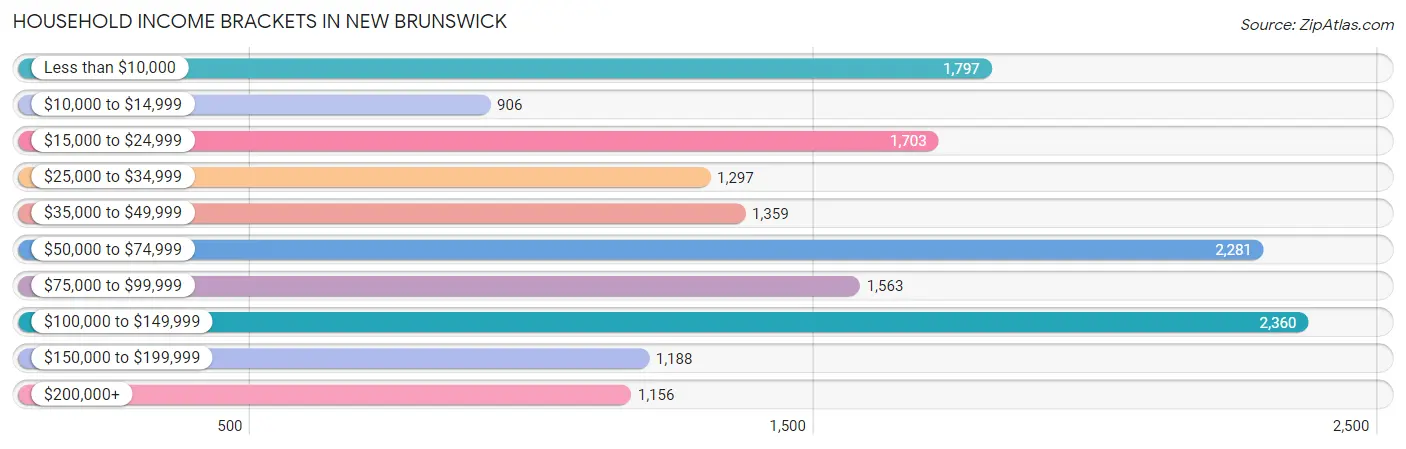
| Income Bracket | # Households | % Households |
| Less than $10,000 | 1,797 | 11.5% |
| $10,000 to $14,999 | 906 | 5.8% |
| $15,000 to $24,999 | 1,703 | 10.9% |
| $25,000 to $34,999 | 1,297 | 8.3% |
| $35,000 to $49,999 | 1,359 | 8.7% |
| $50,000 to $74,999 | 2,281 | 14.6% |
| $75,000 to $99,999 | 1,563 | 10.0% |
| $100,000 to $149,999 | 2,360 | 15.1% |
| $150,000 to $199,999 | 1,188 | 7.6% |
| $200,000+ | 1,156 | 7.4% |
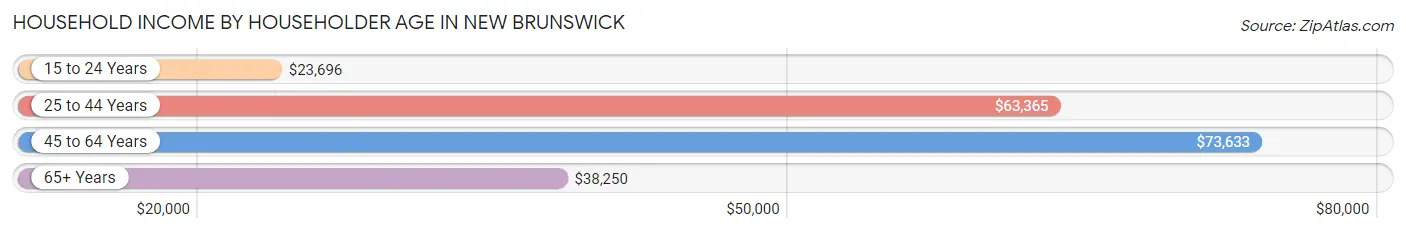
Household Income by Householder Age in New Brunswick
The median household income in New Brunswick is $57,138, with the highest median household income of $73,633 found in the 45 to 64 years age bracket for the primary householder. A total of 4,821 households (30.8%) fall into this category. Meanwhile, the 15 to 24 years age bracket for the primary householder has the lowest median household income of $23,696, with 1,970 households (12.6%) in this group.
| Income Bracket | # Households | Median Income |
| 15 to 24 Years | 1,970 (12.6%) | $23,696 |
| 25 to 44 Years | 6,611 (42.3%) | $63,365 |
| 45 to 64 Years | 4,821 (30.8%) | $73,633 |
| 65+ Years | 2,224 (14.2%) | $38,250 |
| Total | 15,626 (100.0%) | $57,138 |
Poverty in New Brunswick
Income Below Poverty by Sex and Age in New Brunswick
With 29.7% poverty level for males and 34.4% for females among the residents of New Brunswick, 18 to 24 year old males and 16 and 17 year old females are the most vulnerable to poverty, with 2,849 males (52.6%) and 325 females (54.1%) in their respective age groups living below the poverty level.
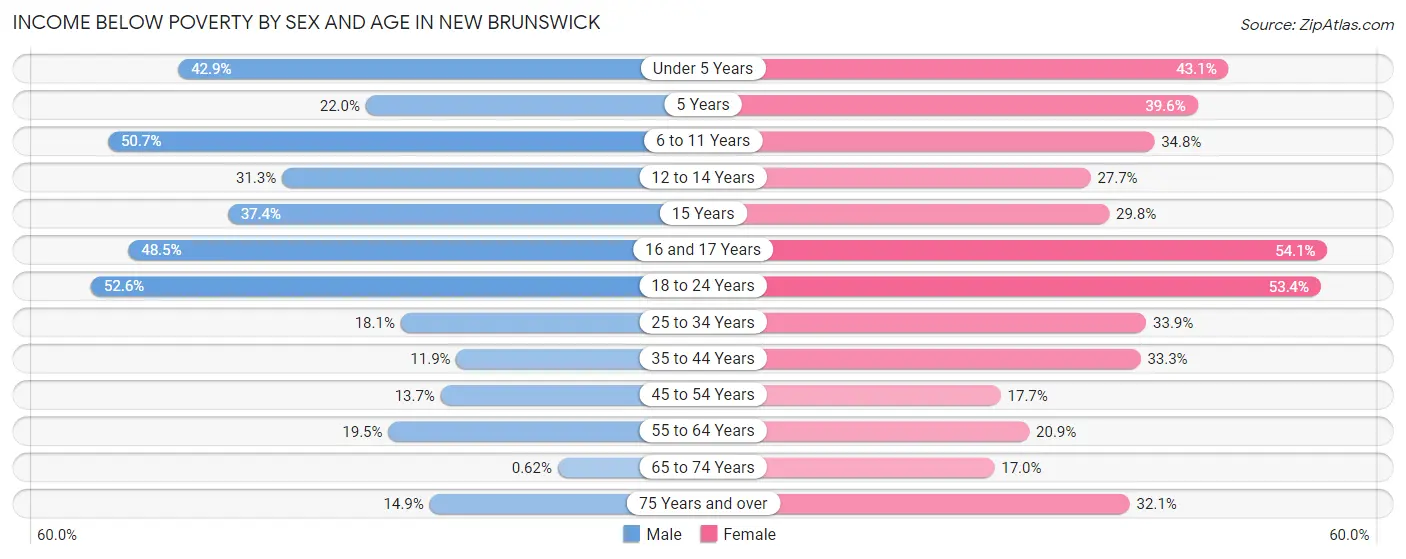
| Age Bracket | Male | Female |
| Under 5 Years | 706 (42.9%) | 524 (43.1%) |
| 5 Years | 44 (22.0%) | 122 (39.6%) |
| 6 to 11 Years | 1,146 (50.7%) | 599 (34.8%) |
| 12 to 14 Years | 364 (31.3%) | 255 (27.7%) |
| 15 Years | 80 (37.4%) | 61 (29.8%) |
| 16 and 17 Years | 406 (48.4%) | 325 (54.1%) |
| 18 to 24 Years | 2,849 (52.6%) | 1,977 (53.3%) |
| 25 to 34 Years | 723 (18.1%) | 1,233 (33.9%) |
| 35 to 44 Years | 400 (11.9%) | 1,077 (33.3%) |
| 45 to 54 Years | 407 (13.7%) | 365 (17.7%) |
| 55 to 64 Years | 393 (19.5%) | 392 (20.9%) |
| 65 to 74 Years | 6 (0.6%) | 188 (17.0%) |
| 75 Years and over | 82 (14.9%) | 278 (32.1%) |
| Total | 7,606 (29.7%) | 7,396 (34.4%) |
Income Above Poverty by Sex and Age in New Brunswick
According to the poverty statistics in New Brunswick, males aged 65 to 74 years and females aged 65 to 74 years are the age groups that are most secure financially, with 99.4% of males and 83.0% of females in these age groups living above the poverty line.
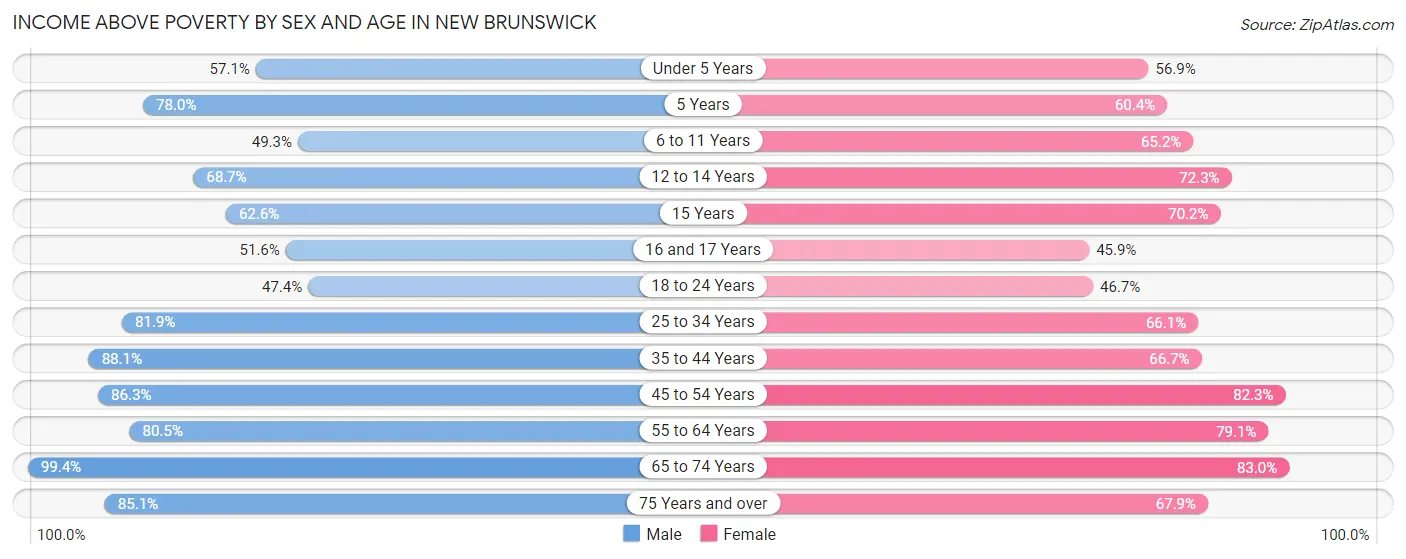
| Age Bracket | Male | Female |
| Under 5 Years | 940 (57.1%) | 693 (56.9%) |
| 5 Years | 156 (78.0%) | 186 (60.4%) |
| 6 to 11 Years | 1,114 (49.3%) | 1,123 (65.2%) |
| 12 to 14 Years | 798 (68.7%) | 666 (72.3%) |
| 15 Years | 134 (62.6%) | 144 (70.2%) |
| 16 and 17 Years | 432 (51.5%) | 276 (45.9%) |
| 18 to 24 Years | 2,566 (47.4%) | 1,729 (46.7%) |
| 25 to 34 Years | 3,269 (81.9%) | 2,405 (66.1%) |
| 35 to 44 Years | 2,959 (88.1%) | 2,161 (66.7%) |
| 45 to 54 Years | 2,572 (86.3%) | 1,698 (82.3%) |
| 55 to 64 Years | 1,623 (80.5%) | 1,487 (79.1%) |
| 65 to 74 Years | 954 (99.4%) | 919 (83.0%) |
| 75 Years and over | 468 (85.1%) | 589 (67.9%) |
| Total | 17,985 (70.3%) | 14,076 (65.6%) |
Income Below Poverty Among Married-Couple Families in New Brunswick
The poverty statistics for married-couple families in New Brunswick show that 10.2% or 435 of the total 4,272 families live below the poverty line. Families with 3 or 4 children have the highest poverty rate of 19.4%, comprising of 115 families. On the other hand, families with 5 or more children have the lowest poverty rate of 0.0%, which includes 0 families.
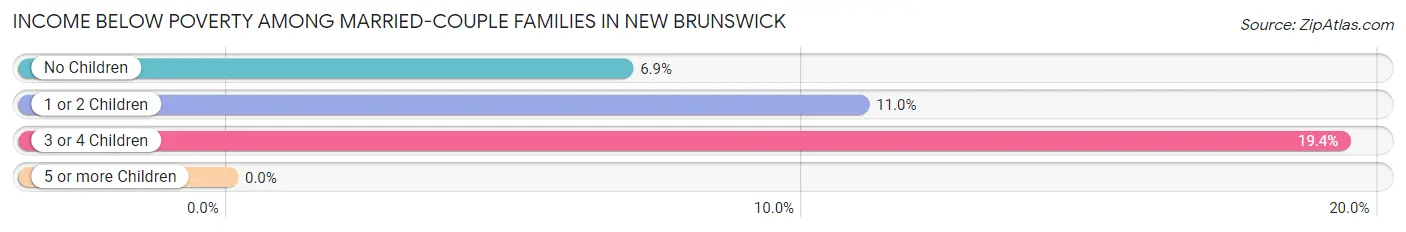
| Children | Above Poverty | Below Poverty |
| No Children | 1,880 (93.1%) | 139 (6.9%) |
| 1 or 2 Children | 1,466 (89.0%) | 181 (11.0%) |
| 3 or 4 Children | 479 (80.6%) | 115 (19.4%) |
| 5 or more Children | 12 (100.0%) | 0 (0.0%) |
| Total | 3,837 (89.8%) | 435 (10.2%) |
Income Below Poverty Among Single-Parent Households in New Brunswick
According to the poverty data in New Brunswick, 22.3% or 275 single-father households and 46.2% or 1,519 single-mother households are living below the poverty line. Among single-father households, those with 3 or 4 children have the highest poverty rate, with 180 households (83.0%) experiencing poverty. Likewise, among single-mother households, those with 5 or more children have the highest poverty rate, with 114 households (100.0%) falling below the poverty line.
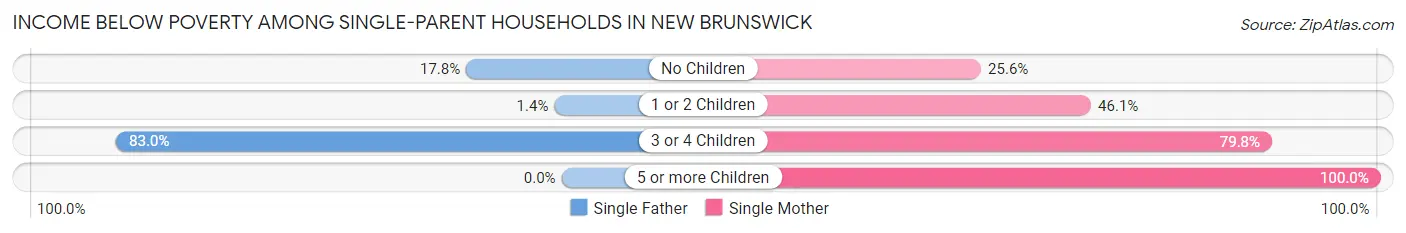
| Children | Single Father | Single Mother |
| No Children | 88 (17.8%) | 243 (25.6%) |
| 1 or 2 Children | 7 (1.3%) | 839 (46.1%) |
| 3 or 4 Children | 180 (83.0%) | 323 (79.7%) |
| 5 or more Children | 0 (0.0%) | 114 (100.0%) |
| Total | 275 (22.3%) | 1,519 (46.2%) |
Income Below Poverty Among Married-Couple vs Single-Parent Households in New Brunswick
The poverty data for New Brunswick shows that 435 of the married-couple family households (10.2%) and 1,794 of the single-parent households (39.7%) are living below the poverty level. Within the married-couple family households, those with 3 or 4 children have the highest poverty rate, with 115 households (19.4%) falling below the poverty line. Among the single-parent households, those with 5 or more children have the highest poverty rate, with 114 household (100.0%) living below poverty.
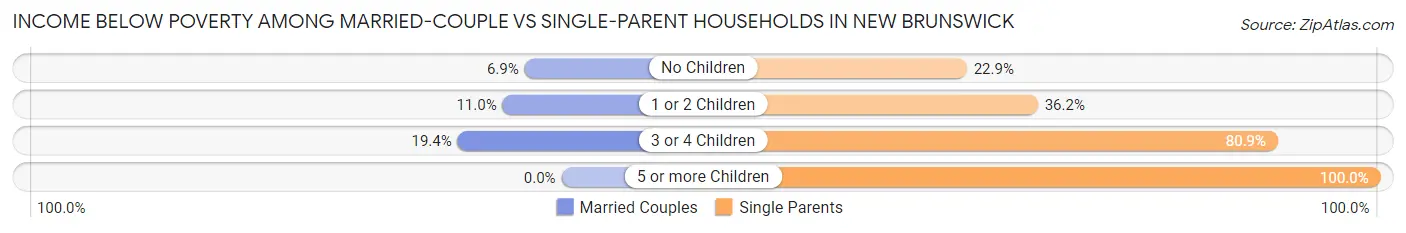
| Children | Married-Couple Families | Single-Parent Households |
| No Children | 139 (6.9%) | 331 (22.9%) |
| 1 or 2 Children | 181 (11.0%) | 846 (36.1%) |
| 3 or 4 Children | 115 (19.4%) | 503 (80.9%) |
| 5 or more Children | 0 (0.0%) | 114 (100.0%) |
| Total | 435 (10.2%) | 1,794 (39.7%) |
Race in New Brunswick
The most populous races in New Brunswick are Hispanic or Latino (26,118 | 46.9%), White / Caucasian (25,275 | 45.4%), and Some other Race (10,874 | 19.5%).
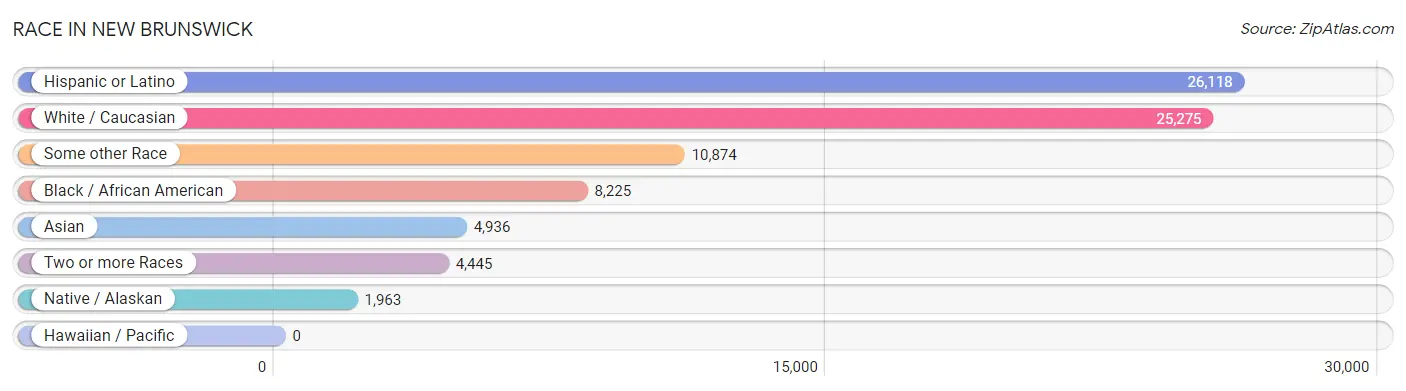
| Race | # Population | % Population |
| Asian | 4,936 | 8.9% |
| Black / African American | 8,225 | 14.8% |
| Hawaiian / Pacific | 0 | 0.0% |
| Hispanic or Latino | 26,118 | 46.9% |
| Native / Alaskan | 1,963 | 3.5% |
| White / Caucasian | 25,275 | 45.4% |
| Two or more Races | 4,445 | 8.0% |
| Some other Race | 10,874 | 19.5% |
| Total | 55,718 | 100.0% |
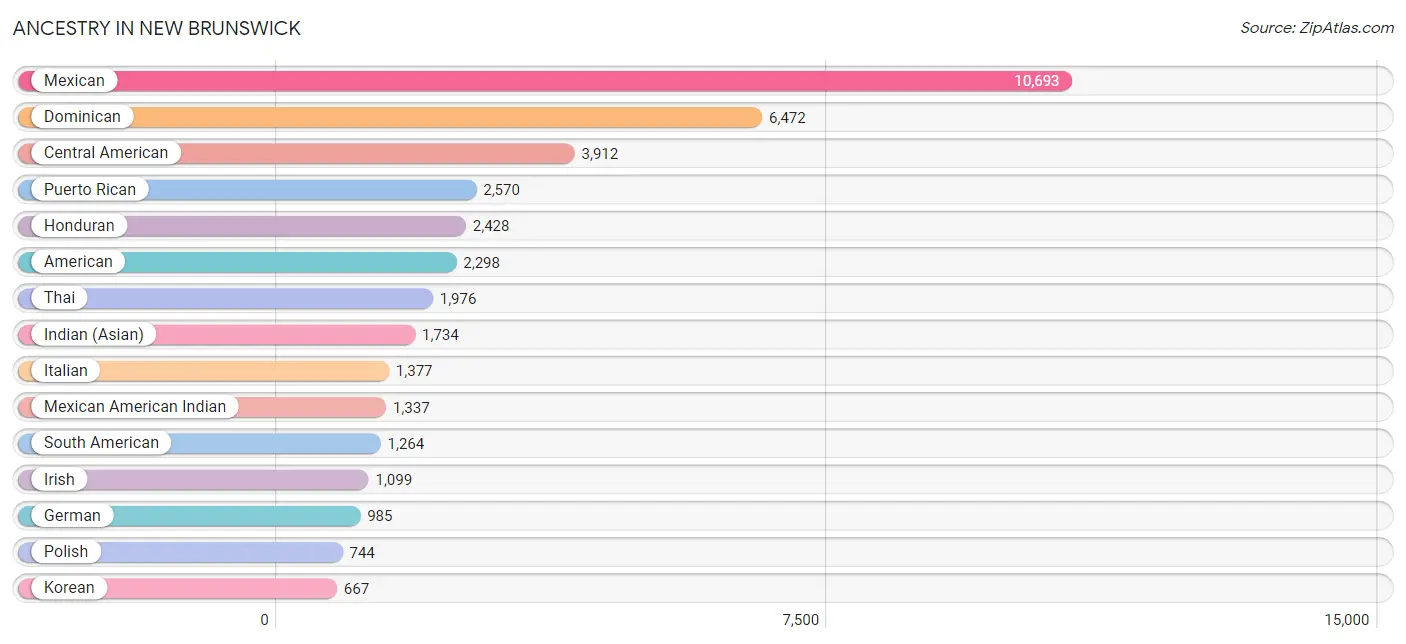
Ancestry in New Brunswick
The most populous ancestries reported in New Brunswick are Mexican (10,693 | 19.2%), Dominican (6,472 | 11.6%), Central American (3,912 | 7.0%), Puerto Rican (2,570 | 4.6%), and Honduran (2,428 | 4.4%), together accounting for 46.8% of all New Brunswick residents.
| Ancestry | # Population | % Population |
| African | 199 | 0.4% |
| Albanian | 58 | 0.1% |
| Alsatian | 17 | 0.0% |
| American | 2,298 | 4.1% |
| Arab | 559 | 1.0% |
| Argentinean | 68 | 0.1% |
| Australian | 8 | 0.0% |
| Austrian | 43 | 0.1% |
| Barbadian | 30 | 0.1% |
| Bhutanese | 151 | 0.3% |
| Brazilian | 87 | 0.2% |
| British | 59 | 0.1% |
| British West Indian | 21 | 0.0% |
| Burmese | 210 | 0.4% |
| Canadian | 15 | 0.0% |
| Carpatho Rusyn | 21 | 0.0% |
| Central American | 3,912 | 7.0% |
| Central American Indian | 321 | 0.6% |
| Cherokee | 10 | 0.0% |
| Colombian | 339 | 0.6% |
| Cuban | 184 | 0.3% |
| Czechoslovakian | 16 | 0.0% |
| Danish | 55 | 0.1% |
| Dominican | 6,472 | 11.6% |
| Dutch | 87 | 0.2% |
| Dutch West Indian | 6 | 0.0% |
| Eastern European | 28 | 0.1% |
| Ecuadorian | 560 | 1.0% |
| Egyptian | 121 | 0.2% |
| English | 424 | 0.8% |
| European | 174 | 0.3% |
| Filipino | 149 | 0.3% |
| French | 67 | 0.1% |
| French Canadian | 19 | 0.0% |
| German | 985 | 1.8% |
| Ghanaian | 87 | 0.2% |
| Greek | 83 | 0.2% |
| Guatemalan | 558 | 1.0% |
| Guyanese | 559 | 1.0% |
| Haitian | 35 | 0.1% |
| Honduran | 2,428 | 4.4% |
| Hungarian | 356 | 0.6% |
| Indian (Asian) | 1,734 | 3.1% |
| Indonesian | 16 | 0.0% |
| Iranian | 41 | 0.1% |
| Irish | 1,099 | 2.0% |
| Israeli | 14 | 0.0% |
| Italian | 1,377 | 2.5% |
| Jamaican | 263 | 0.5% |
| Japanese | 25 | 0.0% |
| Kenyan | 7 | 0.0% |
| Korean | 667 | 1.2% |
| Laotian | 1 | 0.0% |
| Lebanese | 260 | 0.5% |
| Lithuanian | 57 | 0.1% |
| Mexican | 10,693 | 19.2% |
| Mexican American Indian | 1,337 | 2.4% |
| Nicaraguan | 333 | 0.6% |
| Nigerian | 89 | 0.2% |
| Northern European | 66 | 0.1% |
| Norwegian | 22 | 0.0% |
| Okinawan | 32 | 0.1% |
| Pakistani | 93 | 0.2% |
| Palestinian | 128 | 0.2% |
| Panamanian | 216 | 0.4% |
| Paraguayan | 10 | 0.0% |
| Peruvian | 255 | 0.5% |
| Polish | 744 | 1.3% |
| Portuguese | 154 | 0.3% |
| Pueblo | 18 | 0.0% |
| Puerto Rican | 2,570 | 4.6% |
| Romanian | 53 | 0.1% |
| Russian | 305 | 0.5% |
| Salvadoran | 377 | 0.7% |
| Scottish | 47 | 0.1% |
| Slovak | 17 | 0.0% |
| South American | 1,264 | 2.3% |
| South American Indian | 51 | 0.1% |
| Spaniard | 68 | 0.1% |
| Spanish | 29 | 0.1% |
| Spanish American Indian | 12 | 0.0% |
| Sri Lankan | 145 | 0.3% |
| Subsaharan African | 382 | 0.7% |
| Swedish | 103 | 0.2% |
| Syrian | 3 | 0.0% |
| Thai | 1,976 | 3.5% |
| Trinidadian and Tobagonian | 72 | 0.1% |
| Turkish | 36 | 0.1% |
| U.S. Virgin Islander | 194 | 0.4% |
| Ukrainian | 110 | 0.2% |
| Venezuelan | 32 | 0.1% |
| Vietnamese | 20 | 0.0% |
| Welsh | 3 | 0.0% |
| West Indian | 193 | 0.4% | View All 94 Rows |
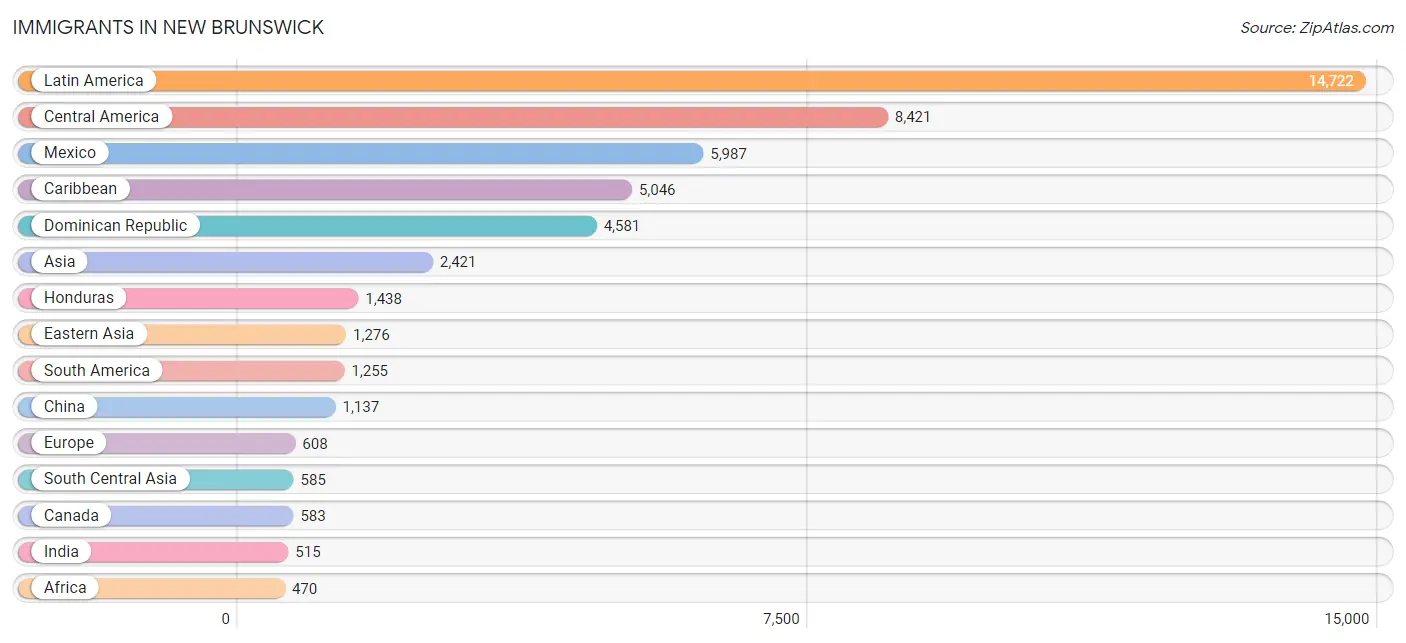
Immigrants in New Brunswick
The most numerous immigrant groups reported in New Brunswick came from Latin America (14,722 | 26.4%), Central America (8,421 | 15.1%), Mexico (5,987 | 10.7%), Caribbean (5,046 | 9.1%), and Dominican Republic (4,581 | 8.2%), together accounting for 69.6% of all New Brunswick residents.
| Immigration Origin | # Population | % Population |
| Africa | 470 | 0.8% |
| Albania | 19 | 0.0% |
| Argentina | 51 | 0.1% |
| Asia | 2,421 | 4.3% |
| Australia | 11 | 0.0% |
| Bangladesh | 10 | 0.0% |
| Barbados | 102 | 0.2% |
| Brazil | 17 | 0.0% |
| Canada | 583 | 1.1% |
| Caribbean | 5,046 | 9.1% |
| Central America | 8,421 | 15.1% |
| China | 1,137 | 2.0% |
| Colombia | 235 | 0.4% |
| Cuba | 111 | 0.2% |
| Dominica | 49 | 0.1% |
| Dominican Republic | 4,581 | 8.2% |
| Eastern Africa | 79 | 0.1% |
| Eastern Asia | 1,276 | 2.3% |
| Eastern Europe | 428 | 0.8% |
| Ecuador | 400 | 0.7% |
| Egypt | 1 | 0.0% |
| El Salvador | 284 | 0.5% |
| England | 1 | 0.0% |
| Europe | 608 | 1.1% |
| Germany | 89 | 0.2% |
| Ghana | 113 | 0.2% |
| Greece | 12 | 0.0% |
| Grenada | 31 | 0.1% |
| Guatemala | 412 | 0.7% |
| Guyana | 249 | 0.4% |
| Haiti | 44 | 0.1% |
| Honduras | 1,438 | 2.6% |
| Hungary | 68 | 0.1% |
| India | 515 | 0.9% |
| Indonesia | 1 | 0.0% |
| Iran | 27 | 0.1% |
| Israel | 14 | 0.0% |
| Italy | 10 | 0.0% |
| Jamaica | 42 | 0.1% |
| Kenya | 7 | 0.0% |
| Korea | 139 | 0.3% |
| Kuwait | 15 | 0.0% |
| Latin America | 14,722 | 26.4% |
| Lebanon | 81 | 0.2% |
| Liberia | 52 | 0.1% |
| Mexico | 5,987 | 10.7% |
| Nicaragua | 188 | 0.3% |
| Nigeria | 203 | 0.4% |
| Northern Africa | 1 | 0.0% |
| Northern Europe | 1 | 0.0% |
| Oceania | 11 | 0.0% |
| Pakistan | 33 | 0.1% |
| Panama | 112 | 0.2% |
| Peru | 267 | 0.5% |
| Philippines | 243 | 0.4% |
| Poland | 110 | 0.2% |
| Portugal | 42 | 0.1% |
| Romania | 33 | 0.1% |
| Russia | 125 | 0.2% |
| Sierra Leone | 22 | 0.0% |
| Singapore | 32 | 0.1% |
| South America | 1,255 | 2.2% |
| South Central Asia | 585 | 1.1% |
| South Eastern Asia | 326 | 0.6% |
| Southern Europe | 90 | 0.2% |
| Spain | 26 | 0.1% |
| Taiwan | 142 | 0.3% |
| Trinidad and Tobago | 60 | 0.1% |
| Turkey | 64 | 0.1% |
| Ukraine | 73 | 0.1% |
| Vietnam | 41 | 0.1% |
| Western Africa | 390 | 0.7% |
| Western Asia | 234 | 0.4% |
| Western Europe | 89 | 0.2% |
| Zimbabwe | 27 | 0.1% | View All 75 Rows |
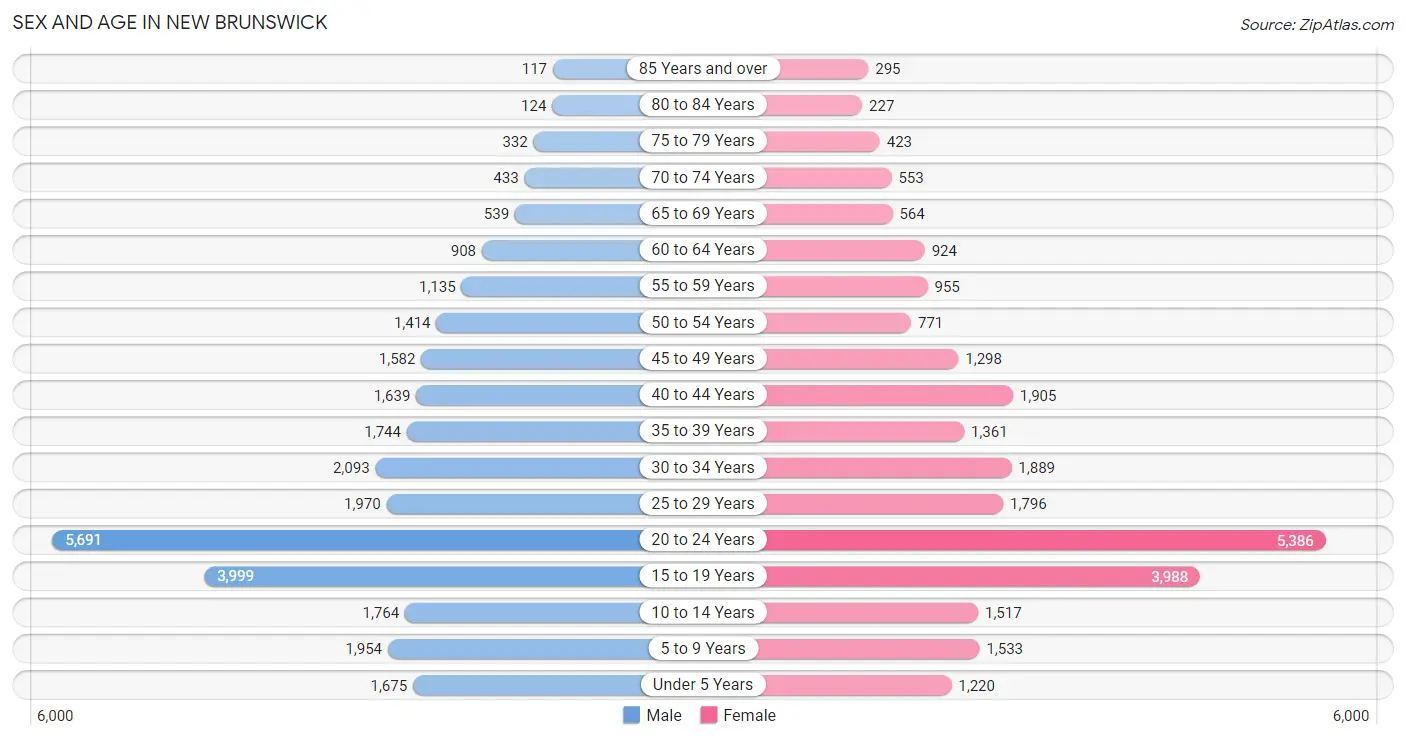
Sex and Age in New Brunswick
Sex and Age in New Brunswick
The most populous age groups in New Brunswick are 20 to 24 Years (5,691 | 19.6%) for men and 20 to 24 Years (5,386 | 20.2%) for women.
| Age Bracket | Male | Female |
| Under 5 Years | 1,675 (5.8%) | 1,220 (4.6%) |
| 5 to 9 Years | 1,954 (6.7%) | 1,533 (5.8%) |
| 10 to 14 Years | 1,764 (6.1%) | 1,517 (5.7%) |
| 15 to 19 Years | 3,999 (13.7%) | 3,988 (15.0%) |
| 20 to 24 Years | 5,691 (19.6%) | 5,386 (20.2%) |
| 25 to 29 Years | 1,970 (6.8%) | 1,796 (6.8%) |
| 30 to 34 Years | 2,093 (7.2%) | 1,889 (7.1%) |
| 35 to 39 Years | 1,744 (6.0%) | 1,361 (5.1%) |
| 40 to 44 Years | 1,639 (5.6%) | 1,905 (7.2%) |
| 45 to 49 Years | 1,582 (5.4%) | 1,298 (4.9%) |
| 50 to 54 Years | 1,414 (4.9%) | 771 (2.9%) |
| 55 to 59 Years | 1,135 (3.9%) | 955 (3.6%) |
| 60 to 64 Years | 908 (3.1%) | 924 (3.5%) |
| 65 to 69 Years | 539 (1.8%) | 564 (2.1%) |
| 70 to 74 Years | 433 (1.5%) | 553 (2.1%) |
| 75 to 79 Years | 332 (1.1%) | 423 (1.6%) |
| 80 to 84 Years | 124 (0.4%) | 227 (0.9%) |
| 85 Years and over | 117 (0.4%) | 295 (1.1%) |
| Total | 29,113 (100.0%) | 26,605 (100.0%) |
Families and Households in New Brunswick
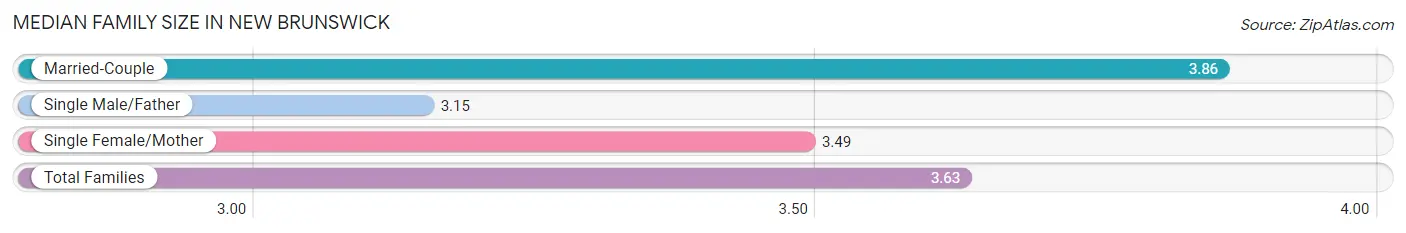
Median Family Size in New Brunswick
The median family size in New Brunswick is 3.63 persons per family, with married-couple families (4,272 | 48.6%) accounting for the largest median family size of 3.86 persons per family. On the other hand, single male/father families (1,232 | 14.0%) represent the smallest median family size with 3.15 persons per family.
| Family Type | # Families | Family Size |
| Married-Couple | 4,272 (48.6%) | 3.86 |
| Single Male/Father | 1,232 (14.0%) | 3.15 |
| Single Female/Mother | 3,288 (37.4%) | 3.49 |
| Total Families | 8,792 (100.0%) | 3.63 |
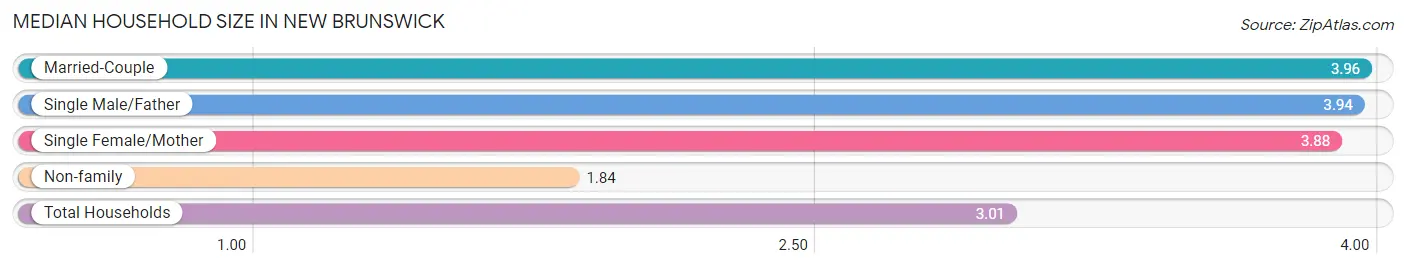
Median Household Size in New Brunswick
The median household size in New Brunswick is 3.01 persons per household, with married-couple households (4,272 | 27.3%) accounting for the largest median household size of 3.96 persons per household. non-family households (6,834 | 43.7%) represent the smallest median household size with 1.84 persons per household.
| Household Type | # Households | Household Size |
| Married-Couple | 4,272 (27.3%) | 3.96 |
| Single Male/Father | 1,232 (7.9%) | 3.94 |
| Single Female/Mother | 3,288 (21.0%) | 3.88 |
| Non-family | 6,834 (43.7%) | 1.84 |
| Total Households | 15,626 (100.0%) | 3.01 |
Household Size by Marriage Status in New Brunswick
Out of a total of 15,626 households in New Brunswick, 8,792 (56.3%) are family households, while 6,834 (43.7%) are nonfamily households. The most numerous type of family households are 2-person households, comprising 2,304, and the most common type of nonfamily households are 1-person households, comprising 4,152.
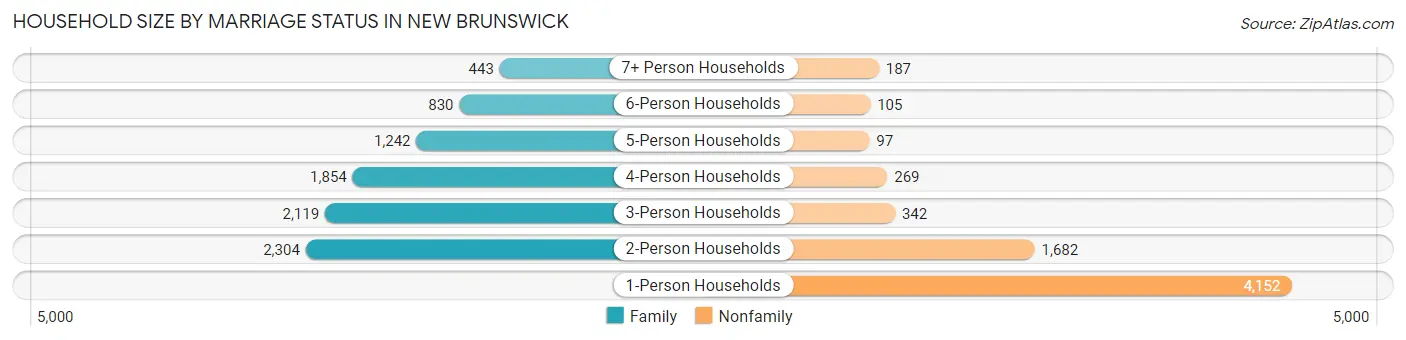
| Household Size | Family Households | Nonfamily Households |
| 1-Person Households | - | 4,152 (26.6%) |
| 2-Person Households | 2,304 (14.7%) | 1,682 (10.8%) |
| 3-Person Households | 2,119 (13.6%) | 342 (2.2%) |
| 4-Person Households | 1,854 (11.9%) | 269 (1.7%) |
| 5-Person Households | 1,242 (8.0%) | 97 (0.6%) |
| 6-Person Households | 830 (5.3%) | 105 (0.7%) |
| 7+ Person Households | 443 (2.8%) | 187 (1.2%) |
| Total | 8,792 (56.3%) | 6,834 (43.7%) |
Female Fertility in New Brunswick
Fertility by Age in New Brunswick
Average fertility rate in New Brunswick is 34.0 births per 1,000 women. Women in the age bracket of 20 to 34 years have the highest fertility rate with 46.0 births per 1,000 women. Women in the age bracket of 20 to 34 years acount for 69.4% of all women with births.
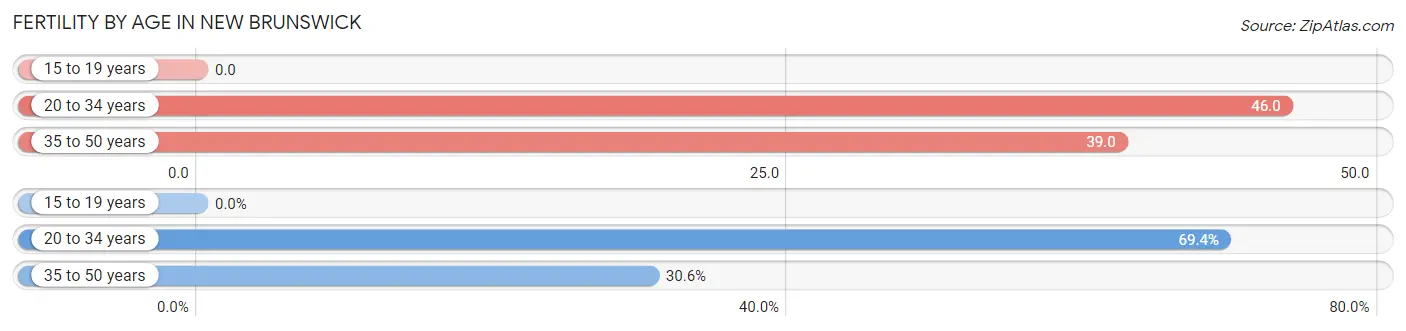
| Age Bracket | Women with Births | Births / 1,000 Women |
| 15 to 19 years | 0 (0.0%) | 0.0 |
| 20 to 34 years | 415 (69.4%) | 46.0 |
| 35 to 50 years | 183 (30.6%) | 39.0 |
| Total | 598 (100.0%) | 34.0 |
Fertility by Age by Marriage Status in New Brunswick
26.4% of women with births (598) in New Brunswick are married. The highest percentage of unmarried women with births falls into 20 to 34 years age bracket with 79.5% of them unmarried at the time of birth, while the lowest percentage of unmarried women with births belong to 35 to 50 years age bracket with 60.1% of them unmarried.
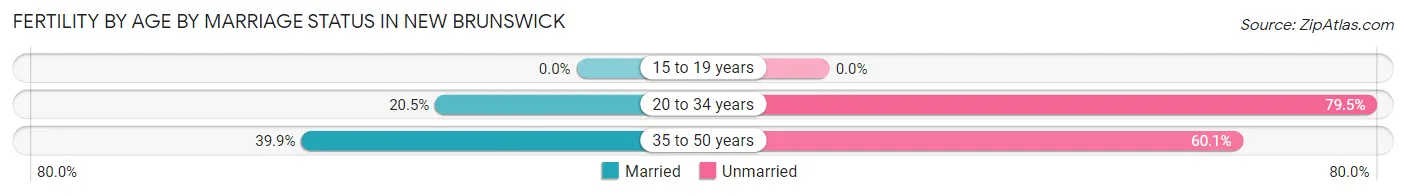
| Age Bracket | Married | Unmarried |
| 15 to 19 years | 0 (0.0%) | 0 (0.0%) |
| 20 to 34 years | 85 (20.5%) | 330 (79.5%) |
| 35 to 50 years | 73 (39.9%) | 110 (60.1%) |
| Total | 158 (26.4%) | 440 (73.6%) |
Fertility by Education in New Brunswick
Average fertility rate in New Brunswick is 34.0 births per 1,000 women. Women with the education attainment of high school diploma have the highest fertility rate of 50.0 births per 1,000 women, while women with the education attainment of graduate degree have the lowest fertility at 16.0 births per 1,000 women. Women with the education attainment of college or associate's degree represent 39.0% of all women with births.
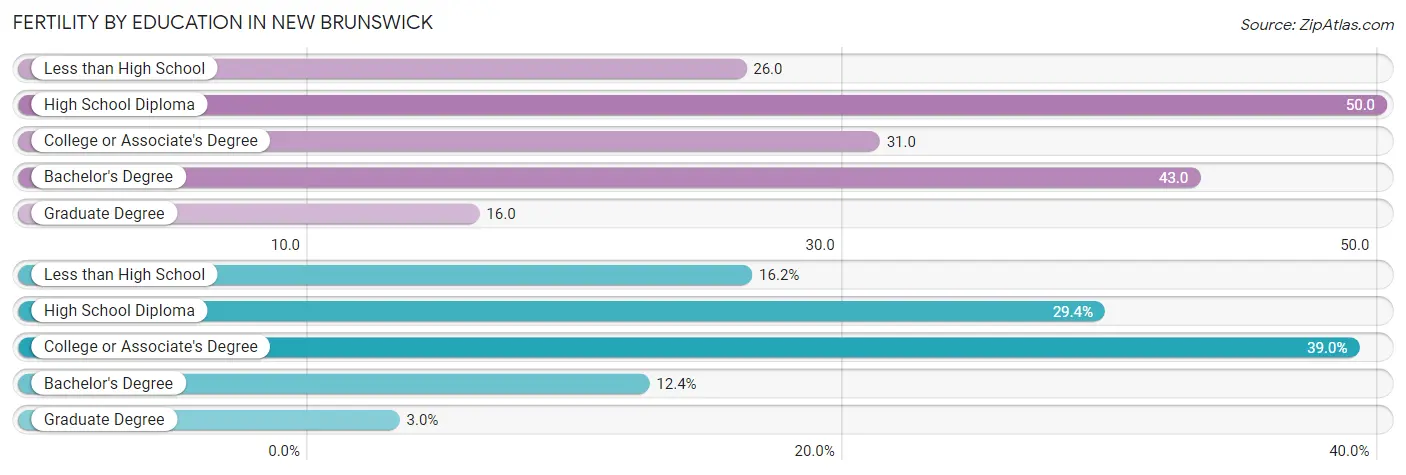
| Educational Attainment | Women with Births | Births / 1,000 Women |
| Less than High School | 97 (16.2%) | 26.0 |
| High School Diploma | 176 (29.4%) | 50.0 |
| College or Associate's Degree | 233 (39.0%) | 31.0 |
| Bachelor's Degree | 74 (12.4%) | 43.0 |
| Graduate Degree | 18 (3.0%) | 16.0 |
| Total | 598 (100.0%) | 34.0 |
Fertility by Education by Marriage Status in New Brunswick
73.6% of women with births in New Brunswick are unmarried. Women with the educational attainment of graduate degree are most likely to be married with 100.0% of them married at childbirth, while women with the educational attainment of less than high school are least likely to be married with 90.7% of them unmarried at childbirth.
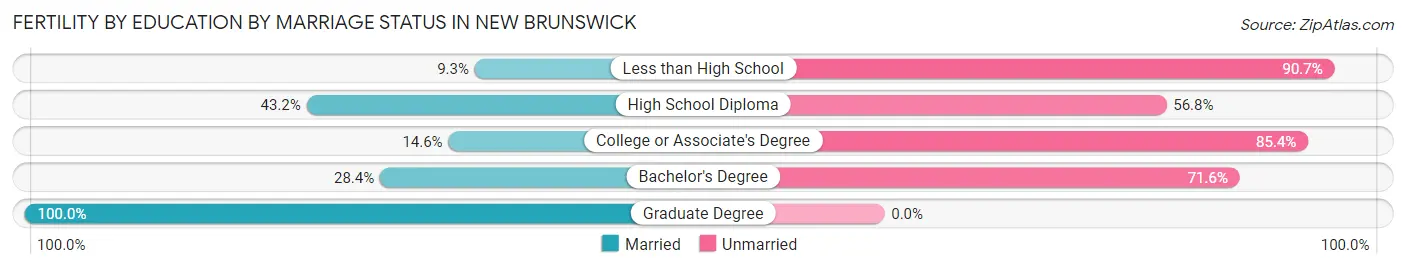
| Educational Attainment | Married | Unmarried |
| Less than High School | 9 (9.3%) | 88 (90.7%) |
| High School Diploma | 76 (43.2%) | 100 (56.8%) |
| College or Associate's Degree | 34 (14.6%) | 199 (85.4%) |
| Bachelor's Degree | 21 (28.4%) | 53 (71.6%) |
| Graduate Degree | 18 (100.0%) | 0 (0.0%) |
| Total | 158 (26.4%) | 440 (73.6%) |
Employment Characteristics in New Brunswick
Employment by Class of Employer in New Brunswick
Among the 24,366 employed individuals in New Brunswick, private company employees (17,730 | 72.8%), not-for-profit organizations (2,634 | 10.8%), and state government employees (1,456 | 6.0%) make up the most common classes of employment.
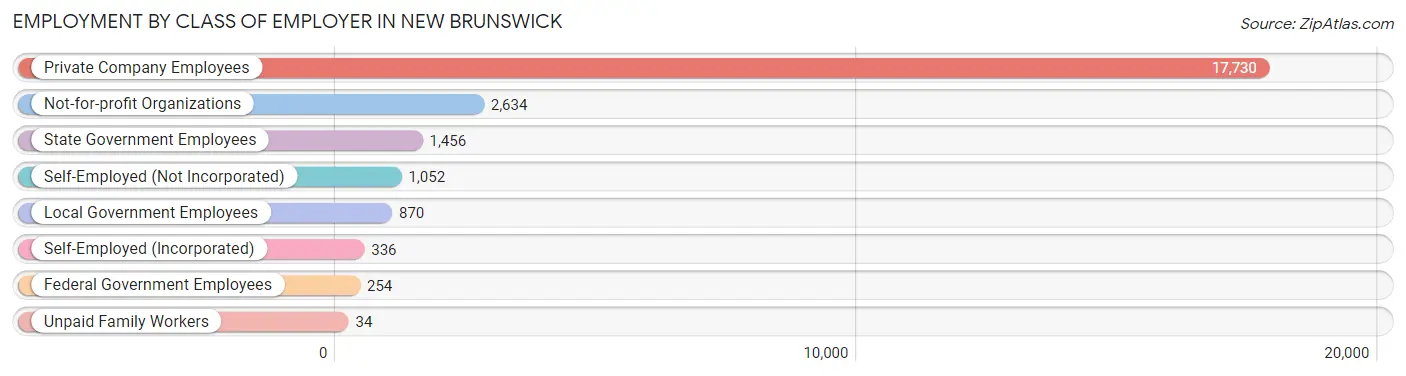
| Employer Class | # Employees | % Employees |
| Private Company Employees | 17,730 | 72.8% |
| Self-Employed (Incorporated) | 336 | 1.4% |
| Self-Employed (Not Incorporated) | 1,052 | 4.3% |
| Not-for-profit Organizations | 2,634 | 10.8% |
| Local Government Employees | 870 | 3.6% |
| State Government Employees | 1,456 | 6.0% |
| Federal Government Employees | 254 | 1.0% |
| Unpaid Family Workers | 34 | 0.1% |
| Total | 24,366 | 100.0% |
Employment Status by Age in New Brunswick
According to the labor force statistics for New Brunswick, out of the total population over 16 years of age (45,635), 60.2% or 27,472 individuals are in the labor force, with 6.5% or 1,786 of them unemployed. The age group with the highest labor force participation rate is 30 to 34 years, with 84.7% or 3,373 individuals in the labor force. Within the labor force, the 16 to 19 years age range has the highest percentage of unemployed individuals, with 15.1% or 403 of them being unemployed.
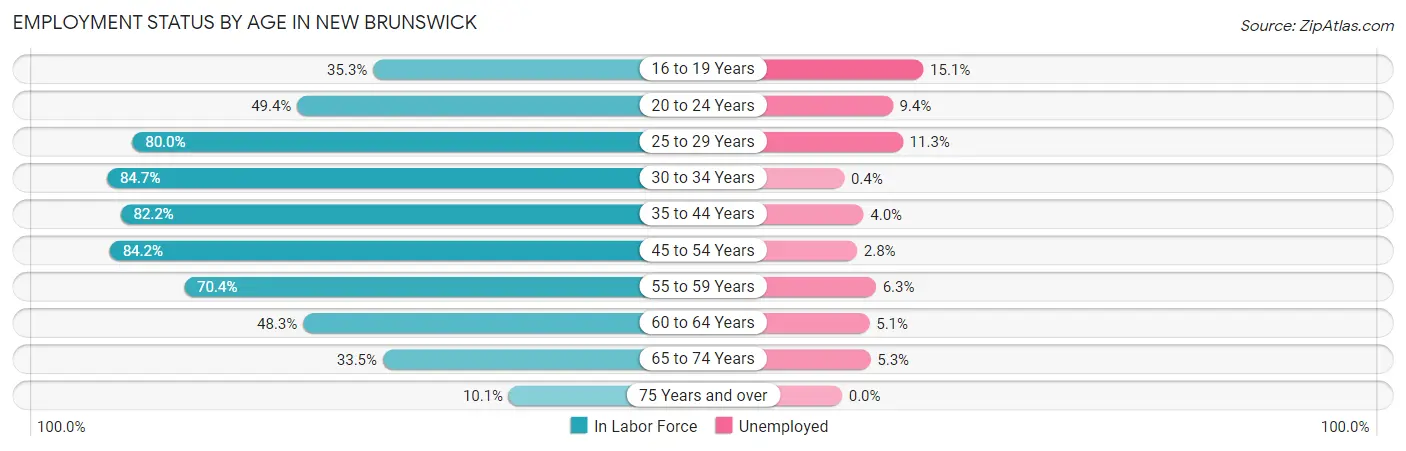
| Age Bracket | In Labor Force | Unemployed |
| 16 to 19 Years | 2,671 (35.3%) | 403 (15.1%) |
| 20 to 24 Years | 5,472 (49.4%) | 514 (9.4%) |
| 25 to 29 Years | 3,013 (80.0%) | 340 (11.3%) |
| 30 to 34 Years | 3,373 (84.7%) | 13 (0.4%) |
| 35 to 44 Years | 5,465 (82.2%) | 219 (4.0%) |
| 45 to 54 Years | 4,265 (84.2%) | 119 (2.8%) |
| 55 to 59 Years | 1,471 (70.4%) | 93 (6.3%) |
| 60 to 64 Years | 885 (48.3%) | 45 (5.1%) |
| 65 to 74 Years | 700 (33.5%) | 37 (5.3%) |
| 75 Years and over | 153 (10.1%) | 0 (0.0%) |
| Total | 27,472 (60.2%) | 1,786 (6.5%) |
Employment Status by Educational Attainment in New Brunswick
According to labor force statistics for New Brunswick, 79.0% of individuals (18,473) out of the total population between 25 and 64 years of age (23,384) are in the labor force, with 4.5% or 831 of them being unemployed. The group with the highest labor force participation rate are those with the educational attainment of bachelor's degree or higher, with 88.2% or 5,221 individuals in the labor force. Within the labor force, individuals with high school diploma education have the highest percentage of unemployment, with 7.6% or 369 of them being unemployed.
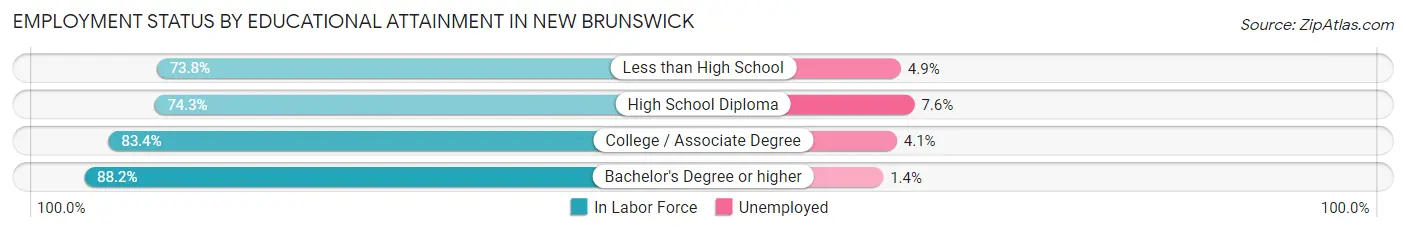
| Educational Attainment | In Labor Force | Unemployed |
| Less than High School | 5,492 (73.8%) | 365 (4.9%) |
| High School Diploma | 4,856 (74.3%) | 497 (7.6%) |
| College / Associate Degree | 2,907 (83.4%) | 143 (4.1%) |
| Bachelor's Degree or higher | 5,221 (88.2%) | 83 (1.4%) |
| Total | 18,473 (79.0%) | 1,052 (4.5%) |
Employment Occupations by Sex in New Brunswick
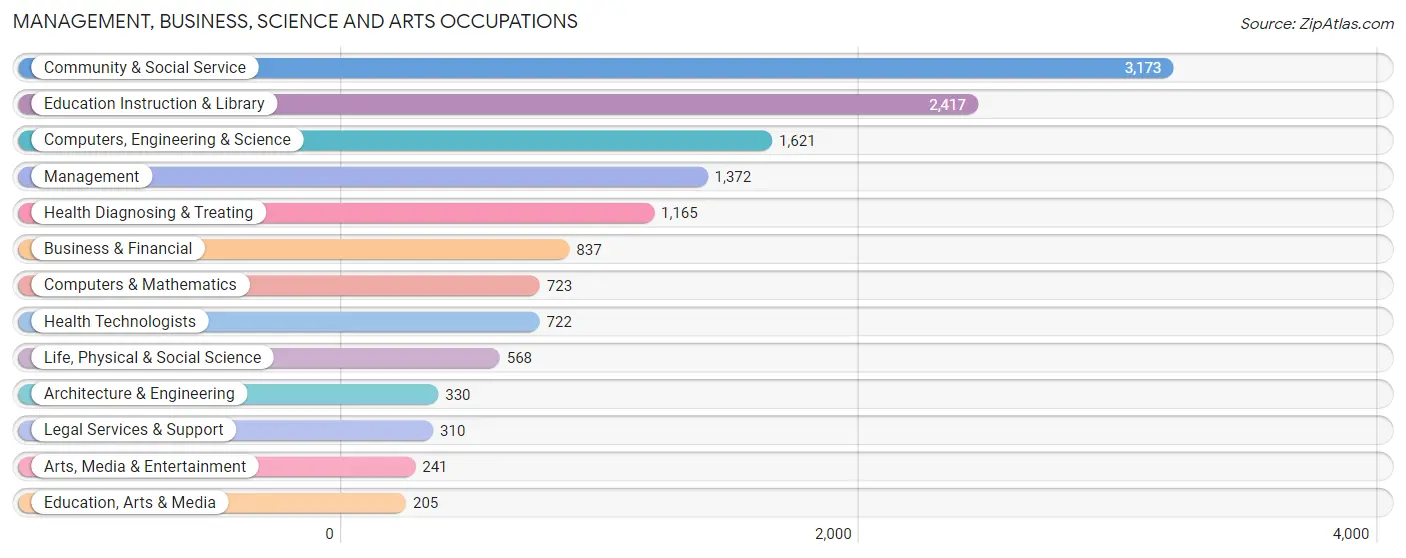
Management, Business, Science and Arts Occupations
The most common Management, Business, Science and Arts occupations in New Brunswick are Community & Social Service (3,173 | 12.3%), Education Instruction & Library (2,417 | 9.4%), Computers, Engineering & Science (1,621 | 6.3%), Management (1,372 | 5.3%), and Health Diagnosing & Treating (1,165 | 4.5%).
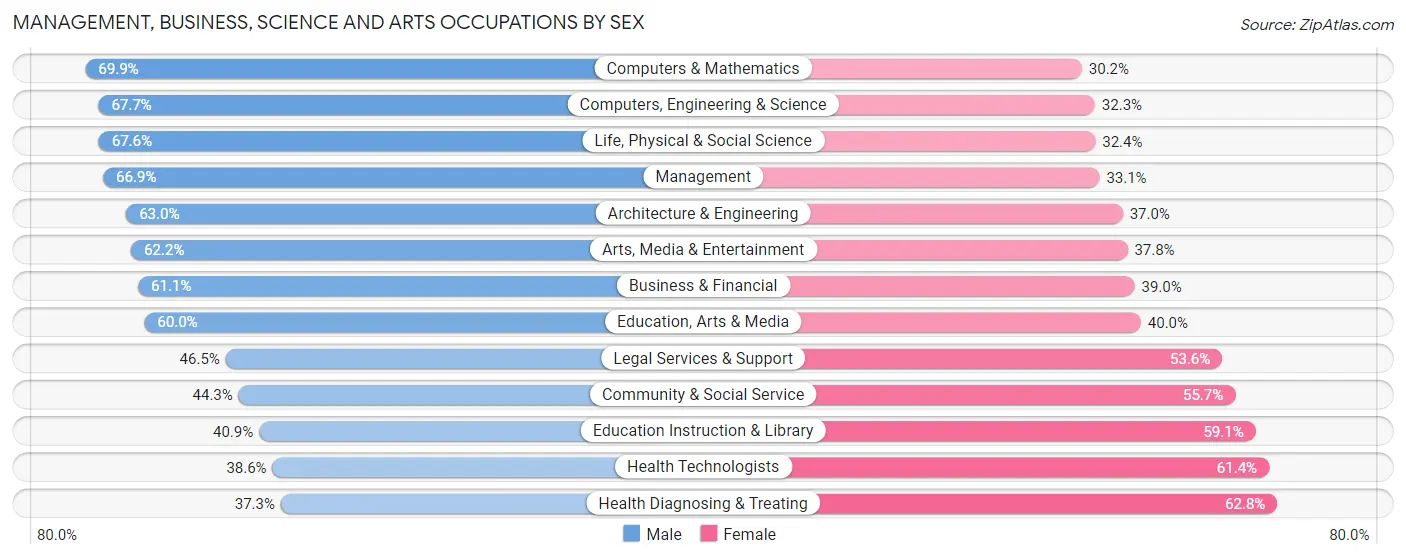
Management, Business, Science and Arts Occupations by Sex
Within the Management, Business, Science and Arts occupations in New Brunswick, the most male-oriented occupations are Computers & Mathematics (69.9%), Computers, Engineering & Science (67.7%), and Life, Physical & Social Science (67.6%), while the most female-oriented occupations are Health Diagnosing & Treating (62.7%), Health Technologists (61.4%), and Education Instruction & Library (59.1%).
| Occupation | Male | Female |
| Management | 918 (66.9%) | 454 (33.1%) |
| Business & Financial | 511 (61.1%) | 326 (39.0%) |
| Computers, Engineering & Science | 1,097 (67.7%) | 524 (32.3%) |
| Computers & Mathematics | 505 (69.9%) | 218 (30.1%) |
| Architecture & Engineering | 208 (63.0%) | 122 (37.0%) |
| Life, Physical & Social Science | 384 (67.6%) | 184 (32.4%) |
| Community & Social Service | 1,405 (44.3%) | 1,768 (55.7%) |
| Education, Arts & Media | 123 (60.0%) | 82 (40.0%) |
| Legal Services & Support | 144 (46.5%) | 166 (53.5%) |
| Education Instruction & Library | 988 (40.9%) | 1,429 (59.1%) |
| Arts, Media & Entertainment | 150 (62.2%) | 91 (37.8%) |
| Health Diagnosing & Treating | 434 (37.2%) | 731 (62.7%) |
| Health Technologists | 279 (38.6%) | 443 (61.4%) |
| Total (Category) | 4,365 (53.4%) | 3,803 (46.6%) |
| Total (Overall) | 14,669 (57.1%) | 11,014 (42.9%) |
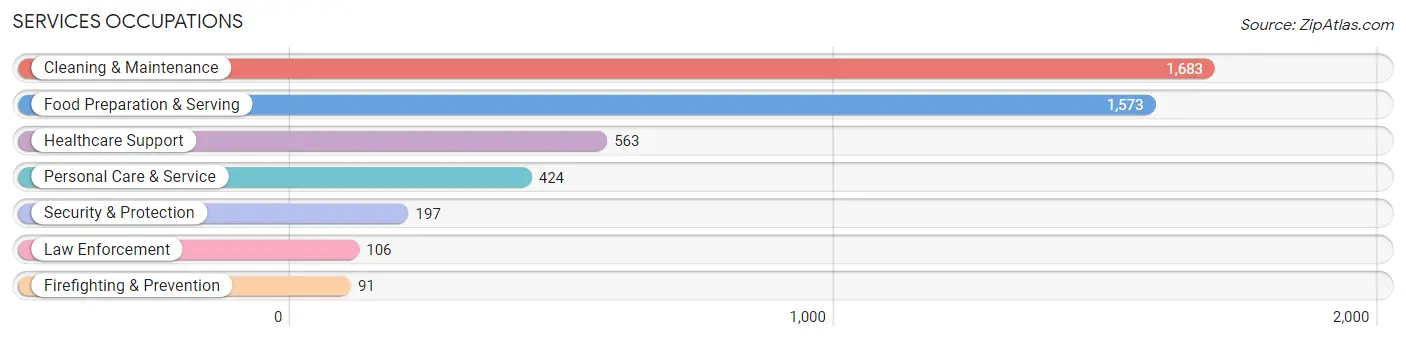
Services Occupations
The most common Services occupations in New Brunswick are Cleaning & Maintenance (1,683 | 6.6%), Food Preparation & Serving (1,573 | 6.1%), Healthcare Support (563 | 2.2%), Personal Care & Service (424 | 1.7%), and Security & Protection (197 | 0.8%).
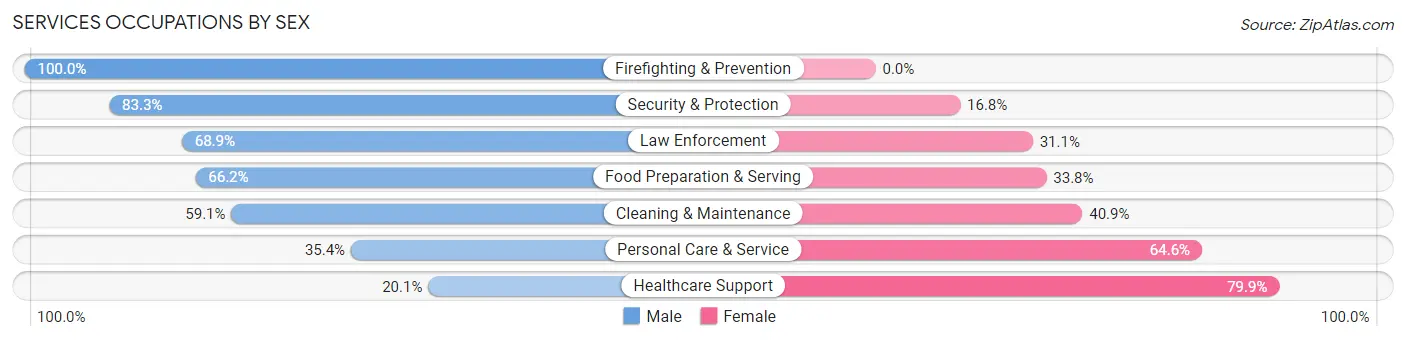
Services Occupations by Sex
Within the Services occupations in New Brunswick, the most male-oriented occupations are Firefighting & Prevention (100.0%), Security & Protection (83.3%), and Law Enforcement (68.9%), while the most female-oriented occupations are Healthcare Support (79.9%), Personal Care & Service (64.6%), and Cleaning & Maintenance (40.9%).
| Occupation | Male | Female |
| Healthcare Support | 113 (20.1%) | 450 (79.9%) |
| Security & Protection | 164 (83.3%) | 33 (16.8%) |
| Firefighting & Prevention | 91 (100.0%) | 0 (0.0%) |
| Law Enforcement | 73 (68.9%) | 33 (31.1%) |
| Food Preparation & Serving | 1,041 (66.2%) | 532 (33.8%) |
| Cleaning & Maintenance | 994 (59.1%) | 689 (40.9%) |
| Personal Care & Service | 150 (35.4%) | 274 (64.6%) |
| Total (Category) | 2,462 (55.4%) | 1,978 (44.6%) |
| Total (Overall) | 14,669 (57.1%) | 11,014 (42.9%) |
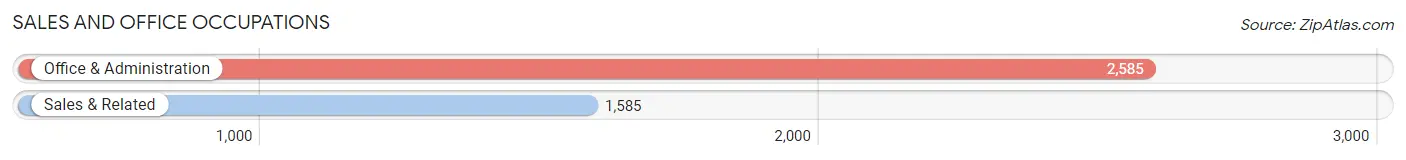
Sales and Office Occupations
The most common Sales and Office occupations in New Brunswick are Office & Administration (2,585 | 10.1%), and Sales & Related (1,585 | 6.2%).
Sales and Office Occupations by Sex
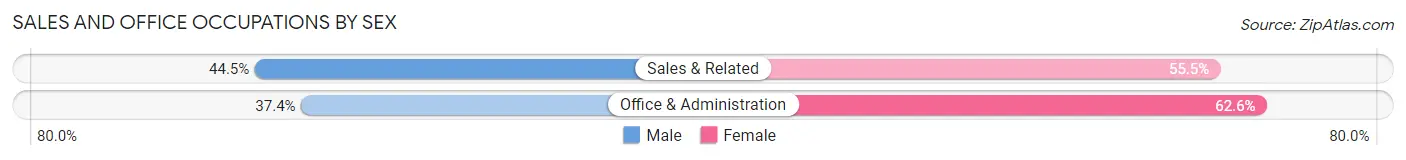
| Occupation | Male | Female |
| Sales & Related | 706 (44.5%) | 879 (55.5%) |
| Office & Administration | 967 (37.4%) | 1,618 (62.6%) |
| Total (Category) | 1,673 (40.1%) | 2,497 (59.9%) |
| Total (Overall) | 14,669 (57.1%) | 11,014 (42.9%) |
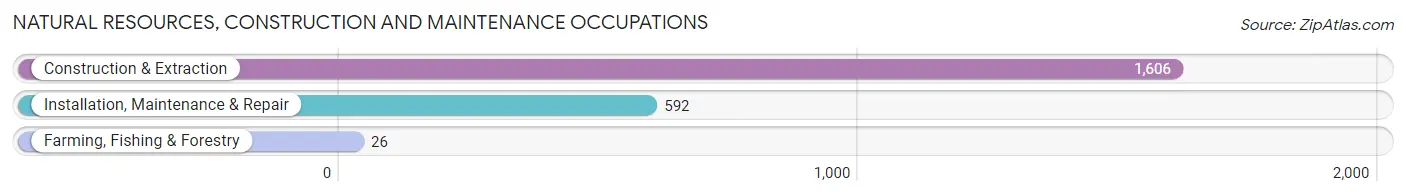
Natural Resources, Construction and Maintenance Occupations
The most common Natural Resources, Construction and Maintenance occupations in New Brunswick are Construction & Extraction (1,606 | 6.2%), Installation, Maintenance & Repair (592 | 2.3%), and Farming, Fishing & Forestry (26 | 0.1%).
Natural Resources, Construction and Maintenance Occupations by Sex
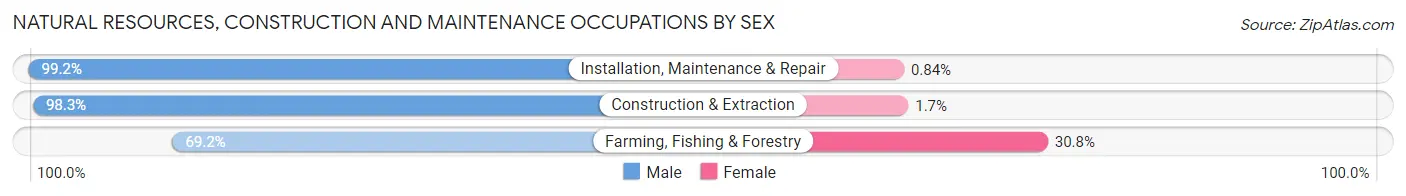
| Occupation | Male | Female |
| Farming, Fishing & Forestry | 18 (69.2%) | 8 (30.8%) |
| Construction & Extraction | 1,578 (98.3%) | 28 (1.7%) |
| Installation, Maintenance & Repair | 587 (99.2%) | 5 (0.8%) |
| Total (Category) | 2,183 (98.2%) | 41 (1.8%) |
| Total (Overall) | 14,669 (57.1%) | 11,014 (42.9%) |
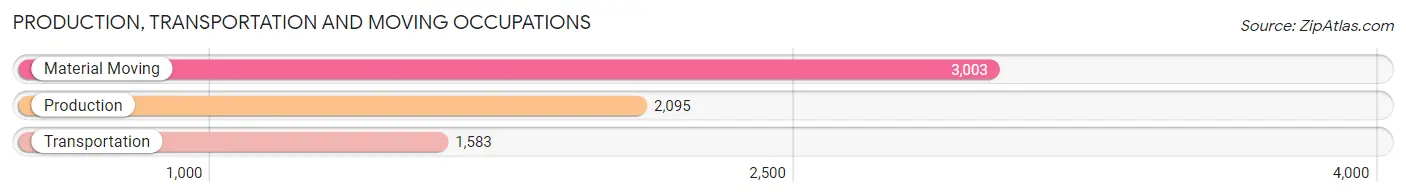
Production, Transportation and Moving Occupations
The most common Production, Transportation and Moving occupations in New Brunswick are Material Moving (3,003 | 11.7%), Production (2,095 | 8.2%), and Transportation (1,583 | 6.2%).
Production, Transportation and Moving Occupations by Sex
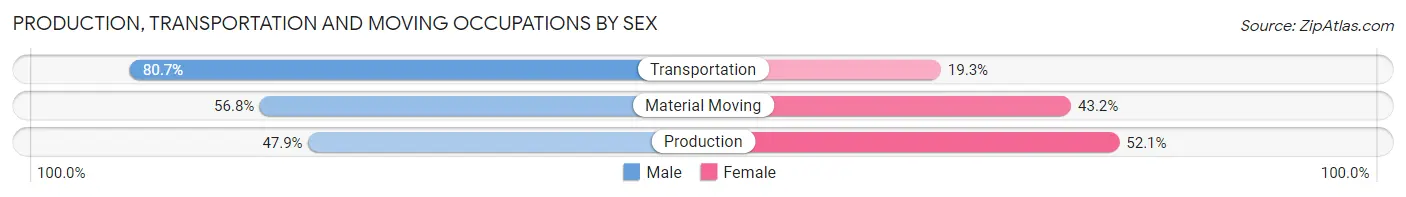
| Occupation | Male | Female |
| Production | 1,004 (47.9%) | 1,091 (52.1%) |
| Transportation | 1,277 (80.7%) | 306 (19.3%) |
| Material Moving | 1,705 (56.8%) | 1,298 (43.2%) |
| Total (Category) | 3,986 (59.7%) | 2,695 (40.3%) |
| Total (Overall) | 14,669 (57.1%) | 11,014 (42.9%) |
Employment Industries by Sex in New Brunswick
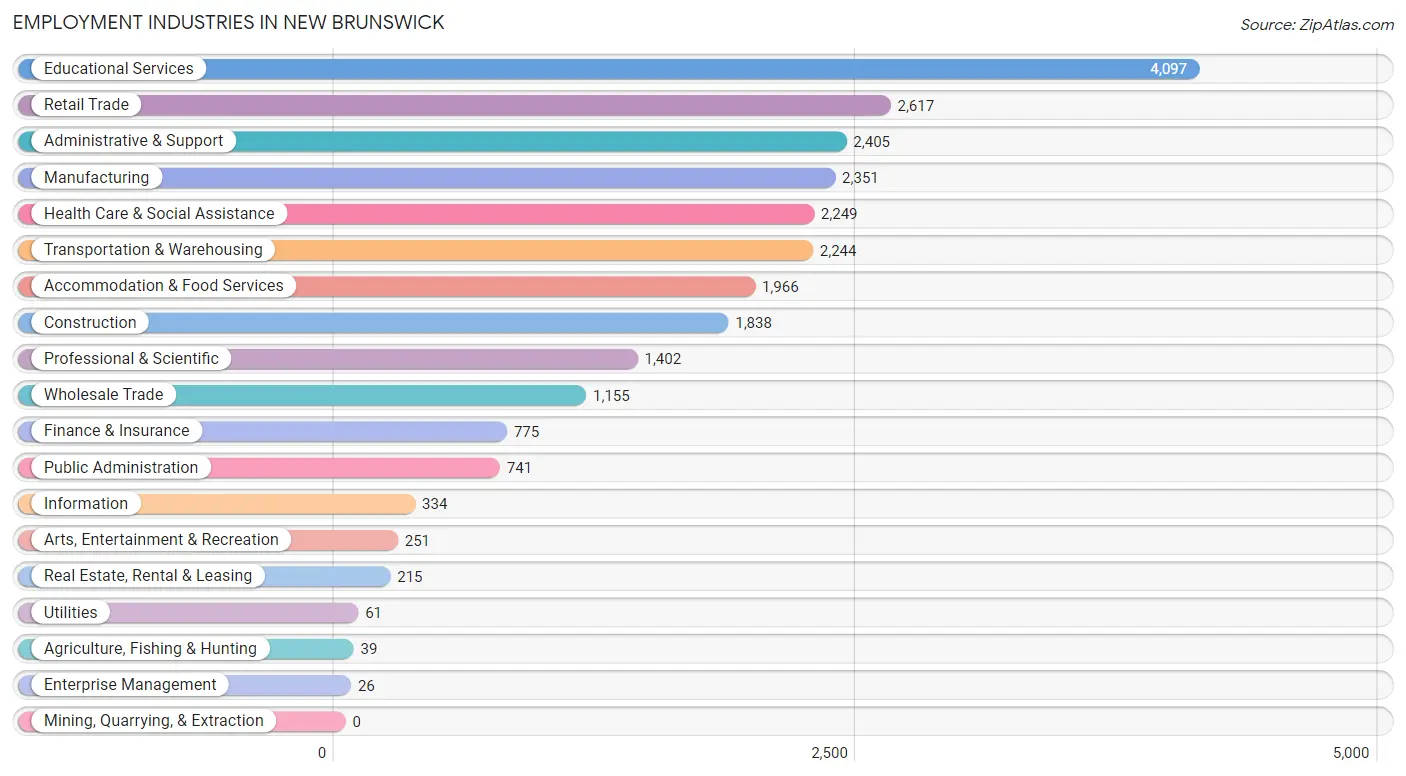
Employment Industries in New Brunswick
The major employment industries in New Brunswick include Educational Services (4,097 | 16.0%), Retail Trade (2,617 | 10.2%), Administrative & Support (2,405 | 9.4%), Manufacturing (2,351 | 9.1%), and Health Care & Social Assistance (2,249 | 8.8%).
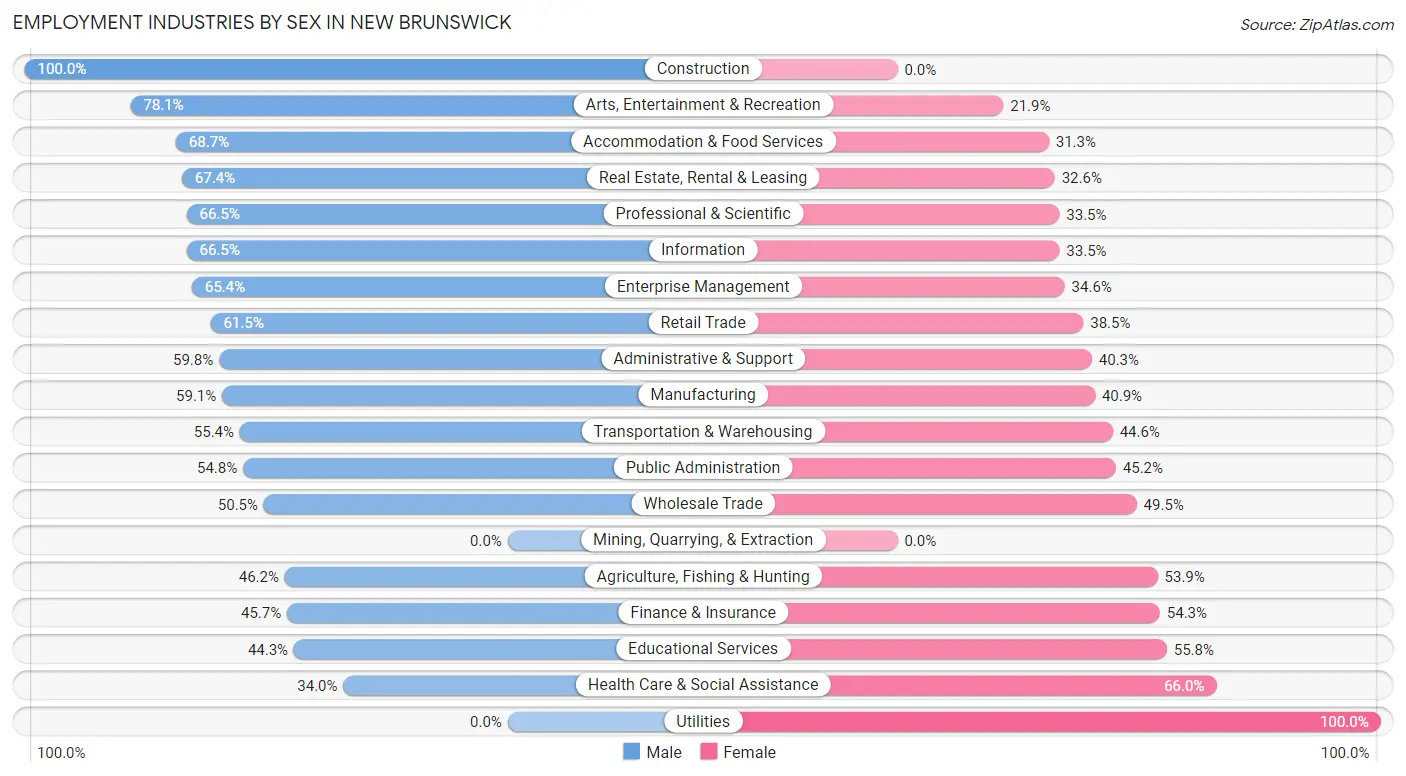
Employment Industries by Sex in New Brunswick
The New Brunswick industries that see more men than women are Construction (100.0%), Arts, Entertainment & Recreation (78.1%), and Accommodation & Food Services (68.7%), whereas the industries that tend to have a higher number of women are Utilities (100.0%), Health Care & Social Assistance (66.0%), and Educational Services (55.7%).
| Industry | Male | Female |
| Agriculture, Fishing & Hunting | 18 (46.2%) | 21 (53.8%) |
| Mining, Quarrying, & Extraction | 0 (0.0%) | 0 (0.0%) |
| Construction | 1,838 (100.0%) | 0 (0.0%) |
| Manufacturing | 1,390 (59.1%) | 961 (40.9%) |
| Wholesale Trade | 583 (50.5%) | 572 (49.5%) |
| Retail Trade | 1,610 (61.5%) | 1,007 (38.5%) |
| Transportation & Warehousing | 1,244 (55.4%) | 1,000 (44.6%) |
| Utilities | 0 (0.0%) | 61 (100.0%) |
| Information | 222 (66.5%) | 112 (33.5%) |
| Finance & Insurance | 354 (45.7%) | 421 (54.3%) |
| Real Estate, Rental & Leasing | 145 (67.4%) | 70 (32.6%) |
| Professional & Scientific | 932 (66.5%) | 470 (33.5%) |
| Enterprise Management | 17 (65.4%) | 9 (34.6%) |
| Administrative & Support | 1,437 (59.8%) | 968 (40.3%) |
| Educational Services | 1,813 (44.3%) | 2,284 (55.7%) |
| Health Care & Social Assistance | 765 (34.0%) | 1,484 (66.0%) |
| Arts, Entertainment & Recreation | 196 (78.1%) | 55 (21.9%) |
| Accommodation & Food Services | 1,350 (68.7%) | 616 (31.3%) |
| Public Administration | 406 (54.8%) | 335 (45.2%) |
| Total | 14,669 (57.1%) | 11,014 (42.9%) |
Education in New Brunswick
School Enrollment in New Brunswick
The most common levels of schooling among the 24,688 students in New Brunswick are college / undergraduate (12,871 | 52.1%), middle school (2,904 | 11.8%), and elementary school (2,892 | 11.7%).
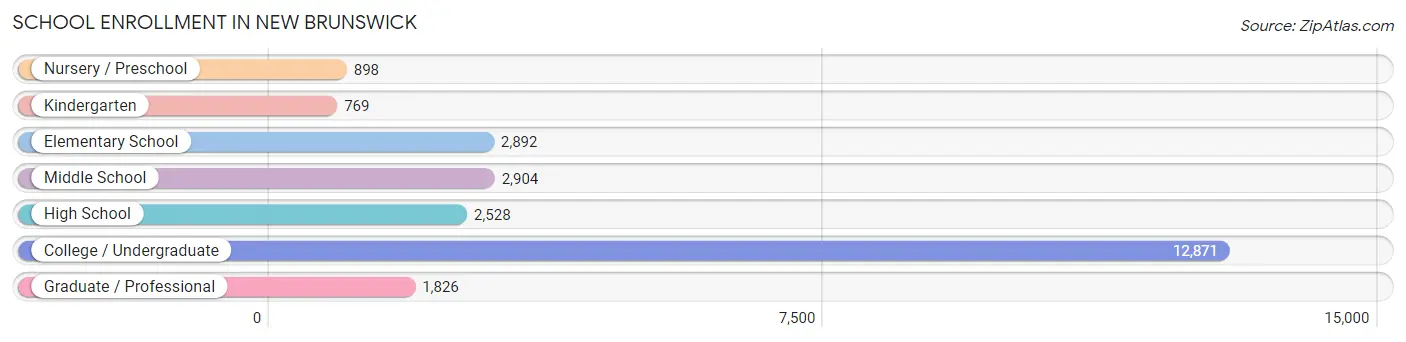
| School Level | # Students | % Students |
| Nursery / Preschool | 898 | 3.6% |
| Kindergarten | 769 | 3.1% |
| Elementary School | 2,892 | 11.7% |
| Middle School | 2,904 | 11.8% |
| High School | 2,528 | 10.2% |
| College / Undergraduate | 12,871 | 52.1% |
| Graduate / Professional | 1,826 | 7.4% |
| Total | 24,688 | 100.0% |
School Enrollment by Age by Funding Source in New Brunswick
Out of a total of 24,688 students who are enrolled in schools in New Brunswick, 4,987 (20.2%) attend a private institution, while the remaining 19,701 (79.8%) are enrolled in public schools. The age group of 18 to 19 year olds has the highest likelihood of being enrolled in private schools, with 2,468 (44.0% in the age bracket) enrolled. Conversely, the age group of 15 to 17 year olds has the lowest likelihood of being enrolled in a private school, with 1,825 (98.0% in the age bracket) attending a public institution.
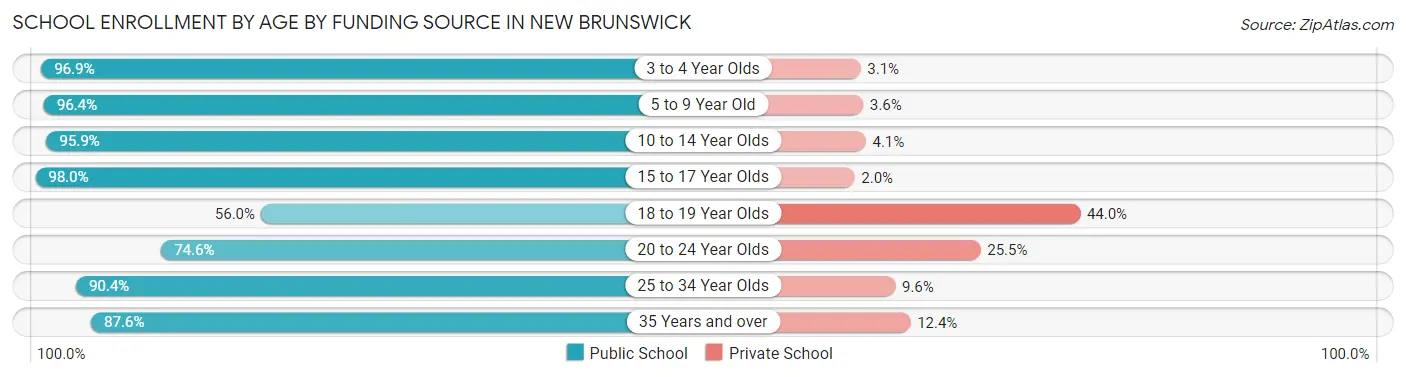
| Age Bracket | Public School | Private School |
| 3 to 4 Year Olds | 840 (96.9%) | 27 (3.1%) |
| 5 to 9 Year Old | 3,339 (96.4%) | 124 (3.6%) |
| 10 to 14 Year Olds | 3,115 (95.9%) | 132 (4.1%) |
| 15 to 17 Year Olds | 1,825 (98.0%) | 37 (2.0%) |
| 18 to 19 Year Olds | 3,140 (56.0%) | 2,468 (44.0%) |
| 20 to 24 Year Olds | 5,928 (74.6%) | 2,024 (25.5%) |
| 25 to 34 Year Olds | 1,002 (90.4%) | 106 (9.6%) |
| 35 Years and over | 509 (87.6%) | 72 (12.4%) |
| Total | 19,701 (79.8%) | 4,987 (20.2%) |
Educational Attainment by Field of Study in New Brunswick
Business (1,151 | 15.9%), social sciences (754 | 10.4%), bio, nature & agricultural (733 | 10.1%), science & technology (663 | 9.2%), and engineering (627 | 8.7%) are the most common fields of study among 7,235 individuals in New Brunswick who have obtained a bachelor's degree or higher.
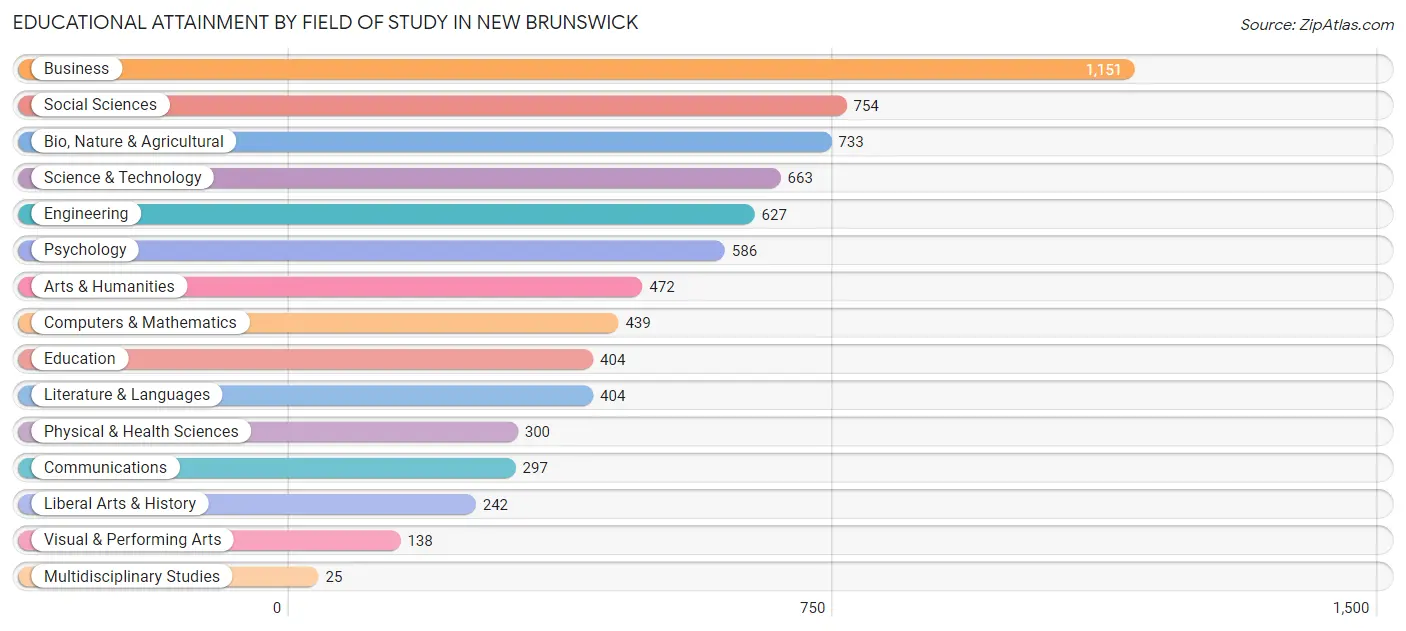
| Field of Study | # Graduates | % Graduates |
| Computers & Mathematics | 439 | 6.1% |
| Bio, Nature & Agricultural | 733 | 10.1% |
| Physical & Health Sciences | 300 | 4.2% |
| Psychology | 586 | 8.1% |
| Social Sciences | 754 | 10.4% |
| Engineering | 627 | 8.7% |
| Multidisciplinary Studies | 25 | 0.4% |
| Science & Technology | 663 | 9.2% |
| Business | 1,151 | 15.9% |
| Education | 404 | 5.6% |
| Literature & Languages | 404 | 5.6% |
| Liberal Arts & History | 242 | 3.3% |
| Visual & Performing Arts | 138 | 1.9% |
| Communications | 297 | 4.1% |
| Arts & Humanities | 472 | 6.5% |
| Total | 7,235 | 100.0% |
Transportation & Commute in New Brunswick
Vehicle Availability by Sex in New Brunswick
The most prevalent vehicle ownership categories in New Brunswick are males with 2 vehicles (3,751, accounting for 28.8%) and females with 2 vehicles (2,381, making up 41.3%).
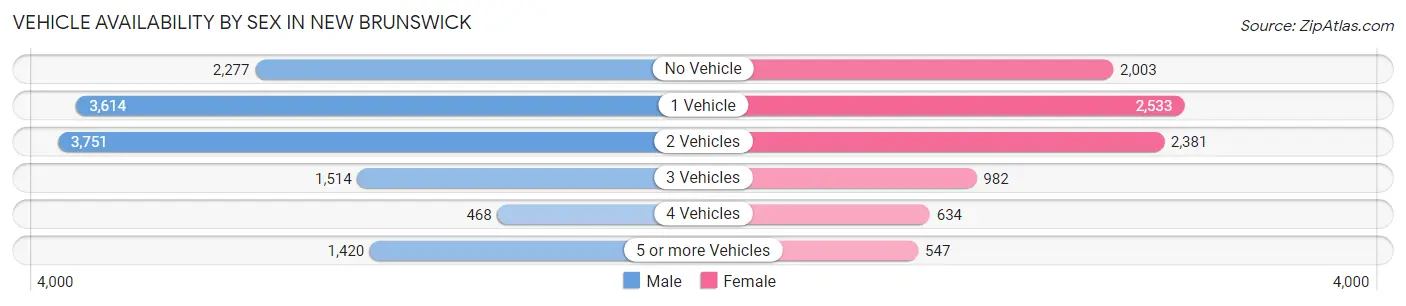
| Vehicles Available | Male | Female |
| No Vehicle | 2,277 (17.5%) | 2,003 (22.1%) |
| 1 Vehicle | 3,614 (27.7%) | 2,533 (27.9%) |
| 2 Vehicles | 3,751 (28.8%) | 2,381 (26.2%) |
| 3 Vehicles | 1,514 (11.6%) | 982 (10.8%) |
| 4 Vehicles | 468 (3.6%) | 634 (7.0%) |
| 5 or more Vehicles | 1,420 (10.9%) | 547 (6.0%) |
| Total | 13,044 (100.0%) | 9,080 (100.0%) |
Commute Time in New Brunswick
The most frequently occuring commute durations in New Brunswick are 30 to 34 minutes (4,241 commuters, 19.1%), 10 to 14 minutes (3,406 commuters, 15.4%), and 20 to 24 minutes (2,927 commuters, 13.2%).
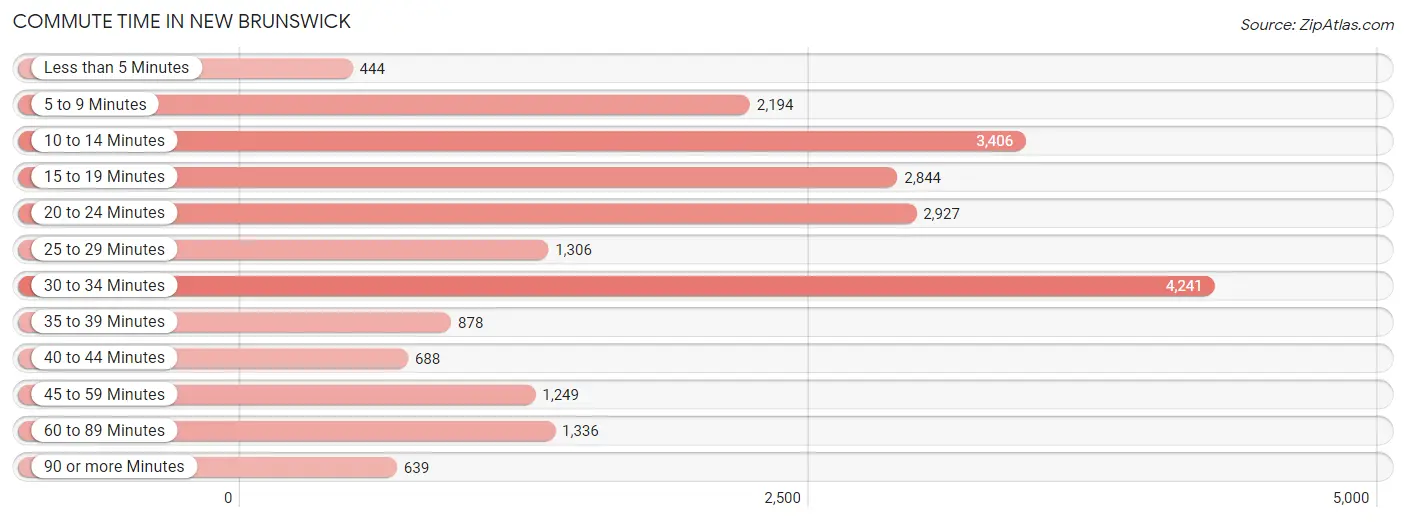
| Commute Time | # Commuters | % Commuters |
| Less than 5 Minutes | 444 | 2.0% |
| 5 to 9 Minutes | 2,194 | 9.9% |
| 10 to 14 Minutes | 3,406 | 15.4% |
| 15 to 19 Minutes | 2,844 | 12.8% |
| 20 to 24 Minutes | 2,927 | 13.2% |
| 25 to 29 Minutes | 1,306 | 5.9% |
| 30 to 34 Minutes | 4,241 | 19.1% |
| 35 to 39 Minutes | 878 | 4.0% |
| 40 to 44 Minutes | 688 | 3.1% |
| 45 to 59 Minutes | 1,249 | 5.6% |
| 60 to 89 Minutes | 1,336 | 6.0% |
| 90 or more Minutes | 639 | 2.9% |
Commute Time by Sex in New Brunswick
The most common commute times in New Brunswick are 30 to 34 minutes (2,597 commuters, 20.1%) for males and 10 to 14 minutes (1,736 commuters, 18.8%) for females.
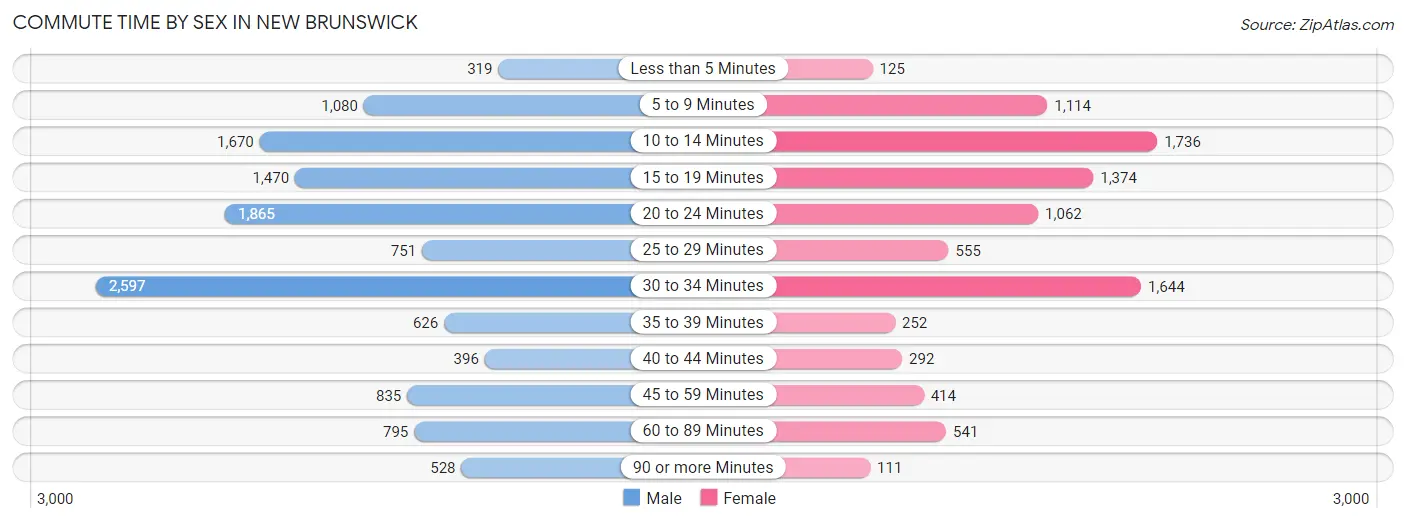
| Commute Time | Male | Female |
| Less than 5 Minutes | 319 (2.5%) | 125 (1.4%) |
| 5 to 9 Minutes | 1,080 (8.4%) | 1,114 (12.1%) |
| 10 to 14 Minutes | 1,670 (12.9%) | 1,736 (18.8%) |
| 15 to 19 Minutes | 1,470 (11.4%) | 1,374 (14.9%) |
| 20 to 24 Minutes | 1,865 (14.4%) | 1,062 (11.5%) |
| 25 to 29 Minutes | 751 (5.8%) | 555 (6.0%) |
| 30 to 34 Minutes | 2,597 (20.1%) | 1,644 (17.8%) |
| 35 to 39 Minutes | 626 (4.8%) | 252 (2.7%) |
| 40 to 44 Minutes | 396 (3.1%) | 292 (3.2%) |
| 45 to 59 Minutes | 835 (6.5%) | 414 (4.5%) |
| 60 to 89 Minutes | 795 (6.1%) | 541 (5.9%) |
| 90 or more Minutes | 528 (4.1%) | 111 (1.2%) |
Time of Departure to Work by Sex in New Brunswick
The most frequent times of departure to work in New Brunswick are 7:00 AM to 7:29 AM (2,224, 17.2%) for males and 12:00 PM to 3:59 PM (1,098, 11.9%) for females.
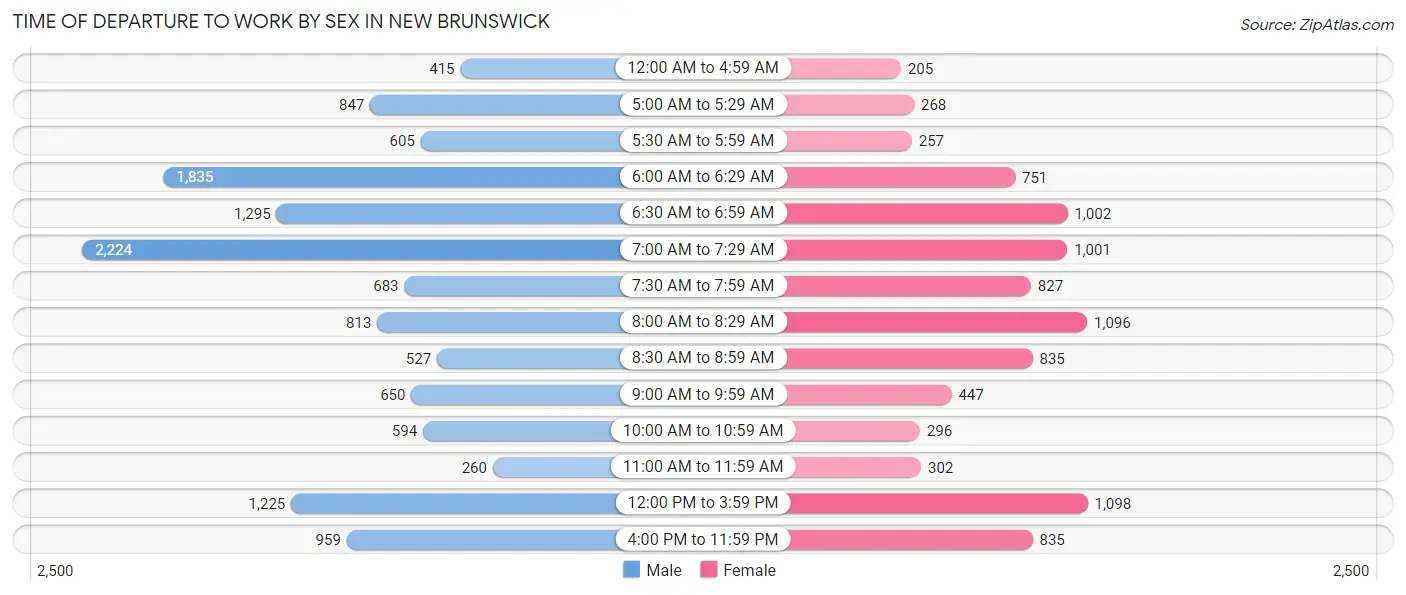
| Time of Departure | Male | Female |
| 12:00 AM to 4:59 AM | 415 (3.2%) | 205 (2.2%) |
| 5:00 AM to 5:29 AM | 847 (6.6%) | 268 (2.9%) |
| 5:30 AM to 5:59 AM | 605 (4.7%) | 257 (2.8%) |
| 6:00 AM to 6:29 AM | 1,835 (14.2%) | 751 (8.2%) |
| 6:30 AM to 6:59 AM | 1,295 (10.0%) | 1,002 (10.9%) |
| 7:00 AM to 7:29 AM | 2,224 (17.2%) | 1,001 (10.9%) |
| 7:30 AM to 7:59 AM | 683 (5.3%) | 827 (9.0%) |
| 8:00 AM to 8:29 AM | 813 (6.3%) | 1,096 (11.9%) |
| 8:30 AM to 8:59 AM | 527 (4.1%) | 835 (9.1%) |
| 9:00 AM to 9:59 AM | 650 (5.0%) | 447 (4.9%) |
| 10:00 AM to 10:59 AM | 594 (4.6%) | 296 (3.2%) |
| 11:00 AM to 11:59 AM | 260 (2.0%) | 302 (3.3%) |
| 12:00 PM to 3:59 PM | 1,225 (9.5%) | 1,098 (11.9%) |
| 4:00 PM to 11:59 PM | 959 (7.4%) | 835 (9.1%) |
| Total | 12,932 (100.0%) | 9,220 (100.0%) |
Housing Occupancy in New Brunswick
Occupancy by Ownership in New Brunswick
Of the total 15,626 dwellings in New Brunswick, owner-occupied units account for 3,156 (20.2%), while renter-occupied units make up 12,470 (79.8%).
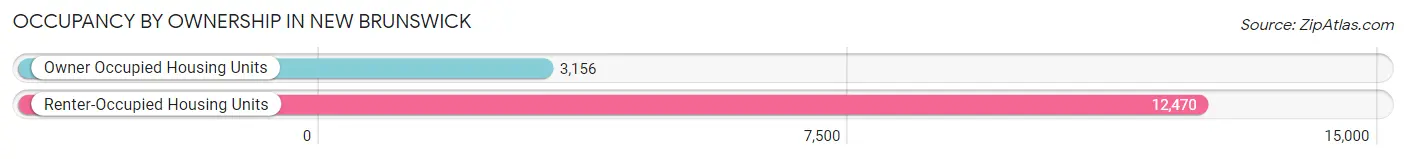
| Occupancy | # Housing Units | % Housing Units |
| Owner Occupied Housing Units | 3,156 | 20.2% |
| Renter-Occupied Housing Units | 12,470 | 79.8% |
| Total Occupied Housing Units | 15,626 | 100.0% |
Occupancy by Household Size in New Brunswick
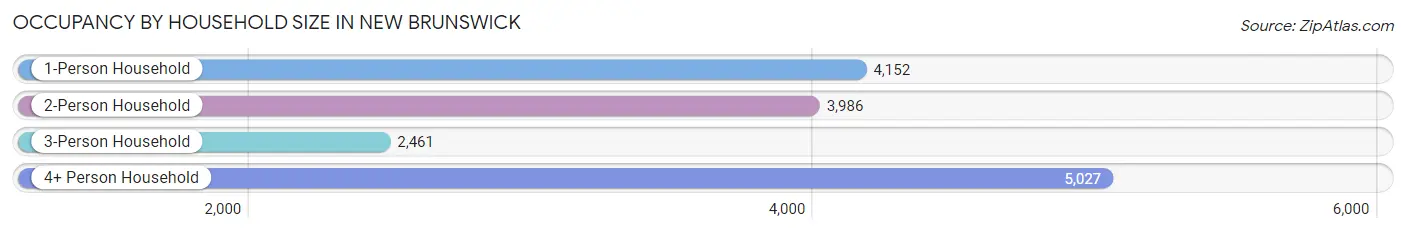
| Household Size | # Housing Units | % Housing Units |
| 1-Person Household | 4,152 | 26.6% |
| 2-Person Household | 3,986 | 25.5% |
| 3-Person Household | 2,461 | 15.8% |
| 4+ Person Household | 5,027 | 32.2% |
| Total Housing Units | 15,626 | 100.0% |
Occupancy by Ownership by Household Size in New Brunswick
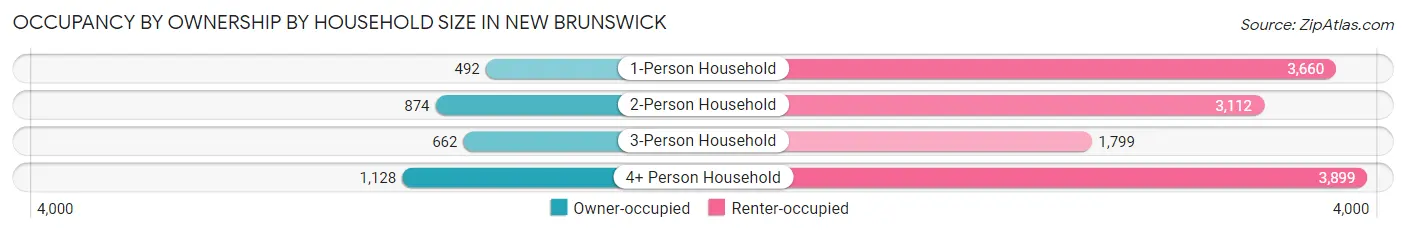
| Household Size | Owner-occupied | Renter-occupied |
| 1-Person Household | 492 (11.8%) | 3,660 (88.1%) |
| 2-Person Household | 874 (21.9%) | 3,112 (78.1%) |
| 3-Person Household | 662 (26.9%) | 1,799 (73.1%) |
| 4+ Person Household | 1,128 (22.4%) | 3,899 (77.6%) |
| Total Housing Units | 3,156 (20.2%) | 12,470 (79.8%) |
Occupancy by Educational Attainment in New Brunswick
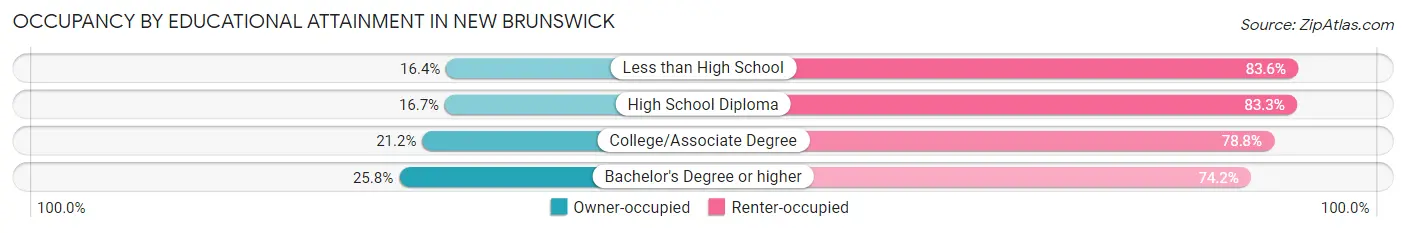
| Household Size | Owner-occupied | Renter-occupied |
| Less than High School | 712 (16.4%) | 3,623 (83.6%) |
| High School Diploma | 553 (16.7%) | 2,766 (83.3%) |
| College/Associate Degree | 750 (21.2%) | 2,794 (78.8%) |
| Bachelor's Degree or higher | 1,141 (25.8%) | 3,287 (74.2%) |
Occupancy by Age of Householder in New Brunswick
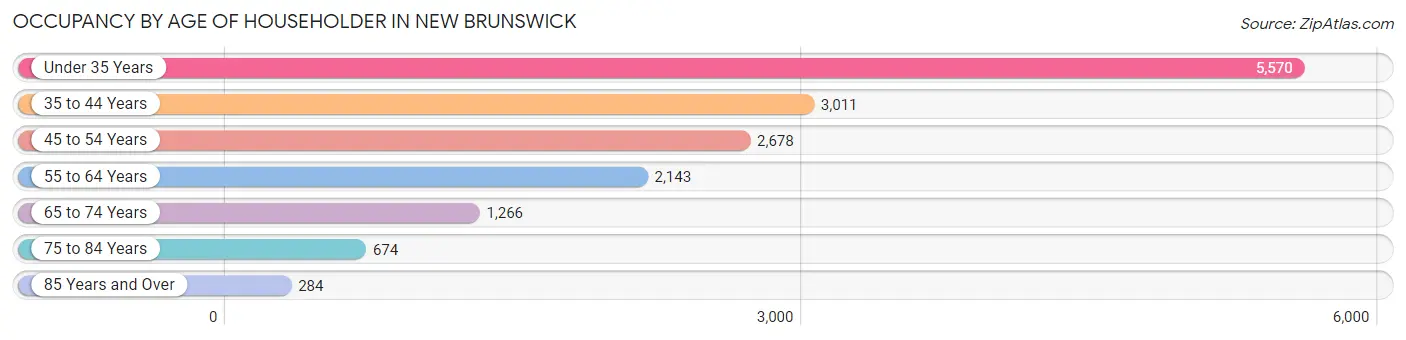
| Age Bracket | # Households | % Households |
| Under 35 Years | 5,570 | 35.6% |
| 35 to 44 Years | 3,011 | 19.3% |
| 45 to 54 Years | 2,678 | 17.1% |
| 55 to 64 Years | 2,143 | 13.7% |
| 65 to 74 Years | 1,266 | 8.1% |
| 75 to 84 Years | 674 | 4.3% |
| 85 Years and Over | 284 | 1.8% |
| Total | 15,626 | 100.0% |
Housing Finances in New Brunswick
Median Income by Occupancy in New Brunswick
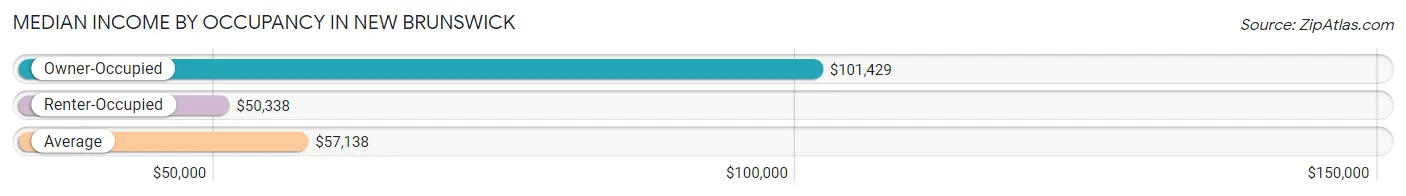
| Occupancy Type | # Households | Median Income |
| Owner-Occupied | 3,156 (20.2%) | $101,429 |
| Renter-Occupied | 12,470 (79.8%) | $50,338 |
| Average | 15,626 (100.0%) | $57,138 |
Occupancy by Householder Income Bracket in New Brunswick
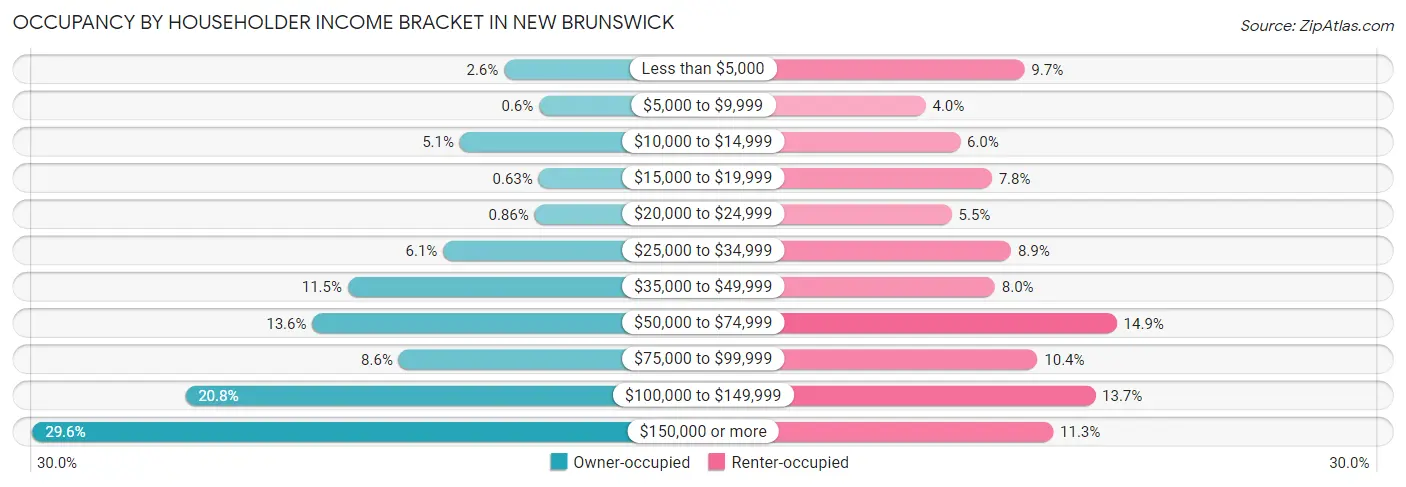
| Income Bracket | Owner-occupied | Renter-occupied |
| Less than $5,000 | 82 (2.6%) | 1,203 (9.7%) |
| $5,000 to $9,999 | 19 (0.6%) | 499 (4.0%) |
| $10,000 to $14,999 | 162 (5.1%) | 744 (6.0%) |
| $15,000 to $19,999 | 20 (0.6%) | 970 (7.8%) |
| $20,000 to $24,999 | 27 (0.9%) | 684 (5.5%) |
| $25,000 to $34,999 | 192 (6.1%) | 1,107 (8.9%) |
| $35,000 to $49,999 | 364 (11.5%) | 992 (8.0%) |
| $50,000 to $74,999 | 428 (13.6%) | 1,860 (14.9%) |
| $75,000 to $99,999 | 272 (8.6%) | 1,296 (10.4%) |
| $100,000 to $149,999 | 657 (20.8%) | 1,707 (13.7%) |
| $150,000 or more | 933 (29.6%) | 1,408 (11.3%) |
| Total | 3,156 (100.0%) | 12,470 (100.0%) |
Monthly Housing Cost Tiers in New Brunswick
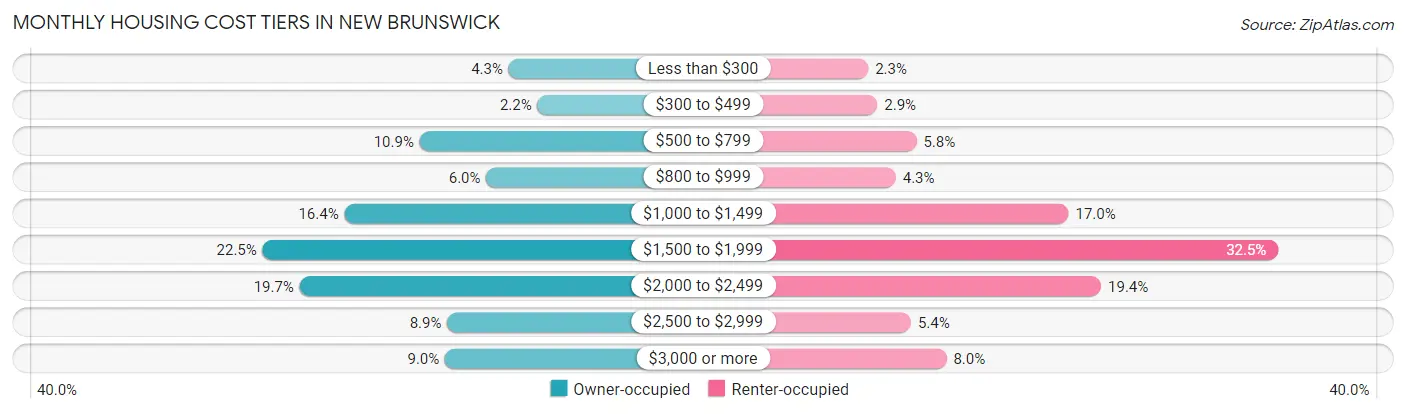
| Monthly Cost | Owner-occupied | Renter-occupied |
| Less than $300 | 137 (4.3%) | 283 (2.3%) |
| $300 to $499 | 70 (2.2%) | 366 (2.9%) |
| $500 to $799 | 344 (10.9%) | 726 (5.8%) |
| $800 to $999 | 189 (6.0%) | 536 (4.3%) |
| $1,000 to $1,499 | 519 (16.4%) | 2,123 (17.0%) |
| $1,500 to $1,999 | 709 (22.5%) | 4,048 (32.5%) |
| $2,000 to $2,499 | 623 (19.7%) | 2,422 (19.4%) |
| $2,500 to $2,999 | 280 (8.9%) | 676 (5.4%) |
| $3,000 or more | 285 (9.0%) | 1,001 (8.0%) |
| Total | 3,156 (100.0%) | 12,470 (100.0%) |
Physical Housing Characteristics in New Brunswick
Housing Structures in New Brunswick
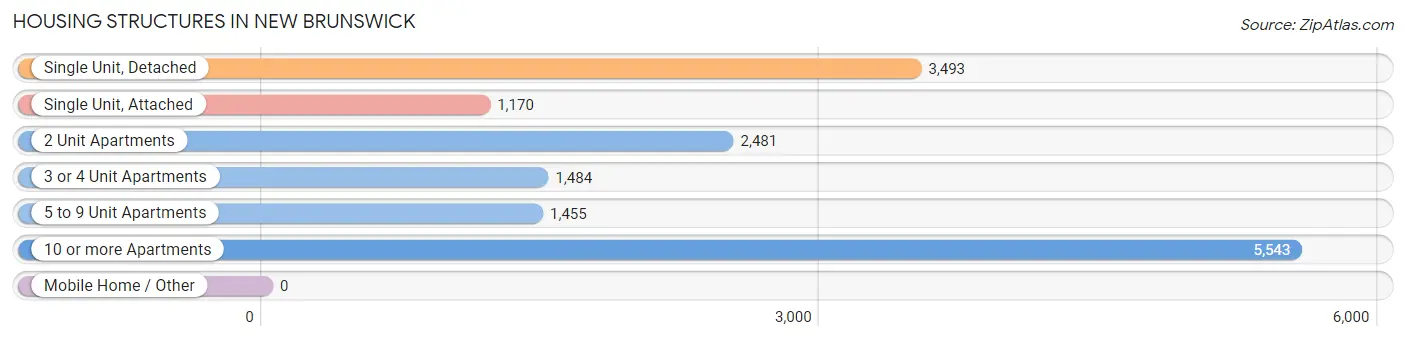
| Structure Type | # Housing Units | % Housing Units |
| Single Unit, Detached | 3,493 | 22.4% |
| Single Unit, Attached | 1,170 | 7.5% |
| 2 Unit Apartments | 2,481 | 15.9% |
| 3 or 4 Unit Apartments | 1,484 | 9.5% |
| 5 to 9 Unit Apartments | 1,455 | 9.3% |
| 10 or more Apartments | 5,543 | 35.5% |
| Mobile Home / Other | 0 | 0.0% |
| Total | 15,626 | 100.0% |
Housing Structures by Occupancy in New Brunswick
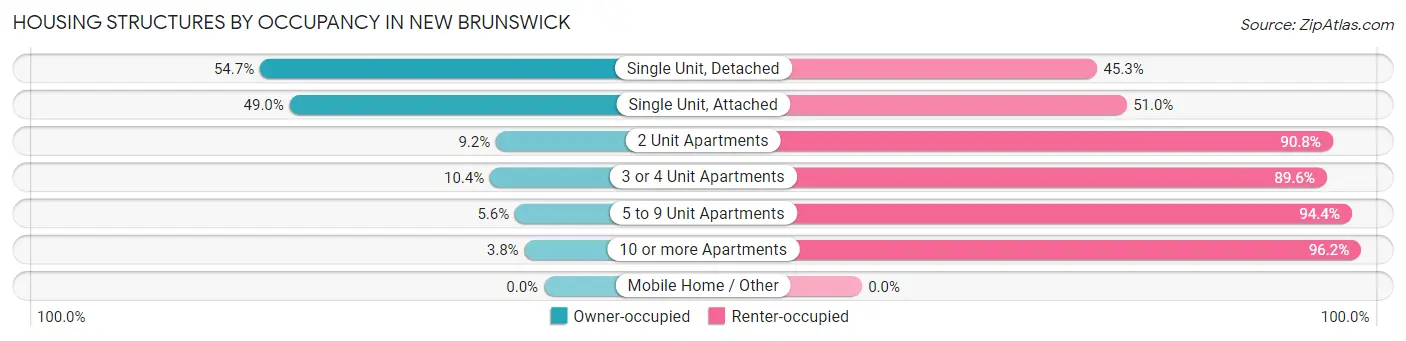
| Structure Type | Owner-occupied | Renter-occupied |
| Single Unit, Detached | 1,910 (54.7%) | 1,583 (45.3%) |
| Single Unit, Attached | 573 (49.0%) | 597 (51.0%) |
| 2 Unit Apartments | 229 (9.2%) | 2,252 (90.8%) |
| 3 or 4 Unit Apartments | 154 (10.4%) | 1,330 (89.6%) |
| 5 to 9 Unit Apartments | 81 (5.6%) | 1,374 (94.4%) |
| 10 or more Apartments | 209 (3.8%) | 5,334 (96.2%) |
| Mobile Home / Other | 0 (0.0%) | 0 (0.0%) |
| Total | 3,156 (20.2%) | 12,470 (79.8%) |
Housing Structures by Number of Rooms in New Brunswick
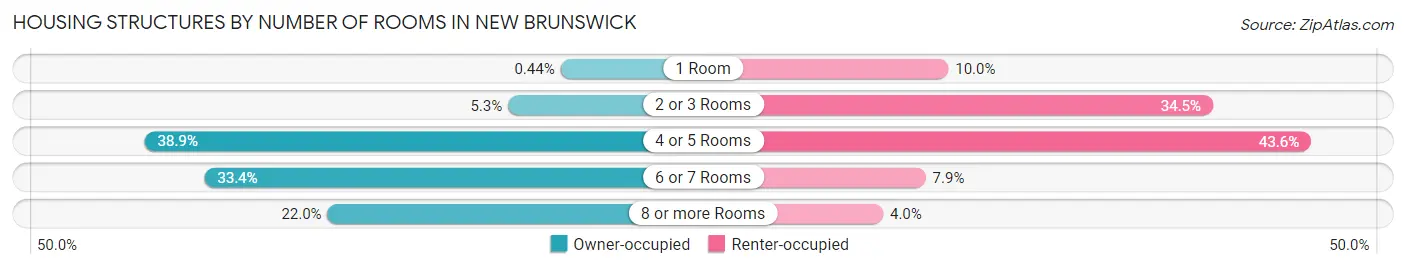
| Number of Rooms | Owner-occupied | Renter-occupied |
| 1 Room | 14 (0.4%) | 1,250 (10.0%) |
| 2 or 3 Rooms | 167 (5.3%) | 4,301 (34.5%) |
| 4 or 5 Rooms | 1,228 (38.9%) | 5,433 (43.6%) |
| 6 or 7 Rooms | 1,053 (33.4%) | 989 (7.9%) |
| 8 or more Rooms | 694 (22.0%) | 497 (4.0%) |
| Total | 3,156 (100.0%) | 12,470 (100.0%) |
Housing Structure by Heating Type in New Brunswick
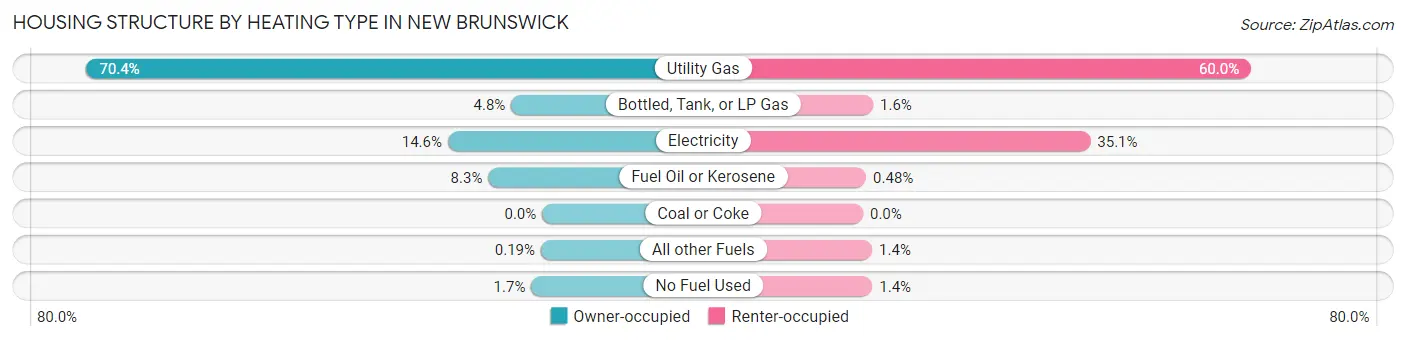
| Heating Type | Owner-occupied | Renter-occupied |
| Utility Gas | 2,223 (70.4%) | 7,480 (60.0%) |
| Bottled, Tank, or LP Gas | 151 (4.8%) | 193 (1.5%) |
| Electricity | 460 (14.6%) | 4,382 (35.1%) |
| Fuel Oil or Kerosene | 263 (8.3%) | 60 (0.5%) |
| Coal or Coke | 0 (0.0%) | 0 (0.0%) |
| All other Fuels | 6 (0.2%) | 176 (1.4%) |
| No Fuel Used | 53 (1.7%) | 179 (1.4%) |
| Total | 3,156 (100.0%) | 12,470 (100.0%) |
Household Vehicle Usage in New Brunswick
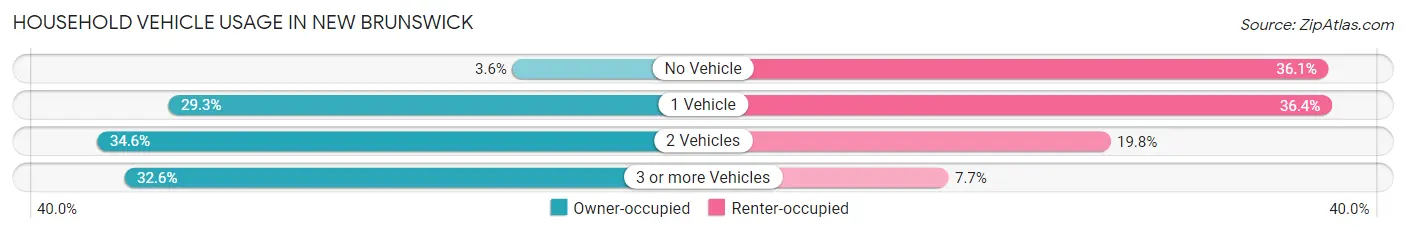
| Vehicles per Household | Owner-occupied | Renter-occupied |
| No Vehicle | 112 (3.5%) | 4,504 (36.1%) |
| 1 Vehicle | 924 (29.3%) | 4,537 (36.4%) |
| 2 Vehicles | 1,092 (34.6%) | 2,469 (19.8%) |
| 3 or more Vehicles | 1,028 (32.6%) | 960 (7.7%) |
| Total | 3,156 (100.0%) | 12,470 (100.0%) |
Real Estate & Mortgages in New Brunswick
Real Estate and Mortgage Overview in New Brunswick
| Characteristic | Without Mortgage | With Mortgage |
| Housing Units | 1,140 | 2,016 |
| Median Property Value | $301,300 | $286,500 |
| Median Household Income | $63,864 | $731 |
| Monthly Housing Costs | $909 | $285 |
| Real Estate Taxes | $5,680 | $71 |
Property Value by Mortgage Status in New Brunswick
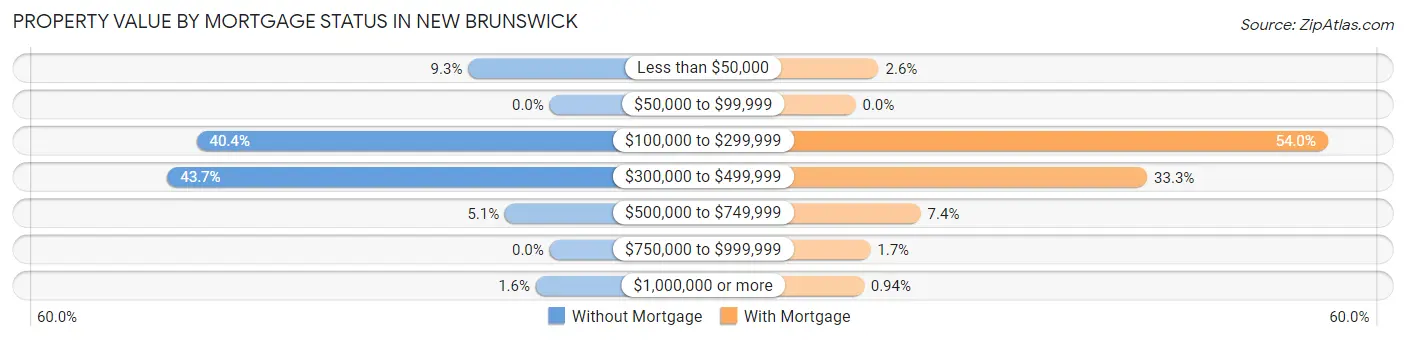
| Property Value | Without Mortgage | With Mortgage |
| Less than $50,000 | 106 (9.3%) | 53 (2.6%) |
| $50,000 to $99,999 | 0 (0.0%) | 0 (0.0%) |
| $100,000 to $299,999 | 460 (40.4%) | 1,088 (54.0%) |
| $300,000 to $499,999 | 498 (43.7%) | 672 (33.3%) |
| $500,000 to $749,999 | 58 (5.1%) | 150 (7.4%) |
| $750,000 to $999,999 | 0 (0.0%) | 34 (1.7%) |
| $1,000,000 or more | 18 (1.6%) | 19 (0.9%) |
| Total | 1,140 (100.0%) | 2,016 (100.0%) |
Household Income by Mortgage Status in New Brunswick
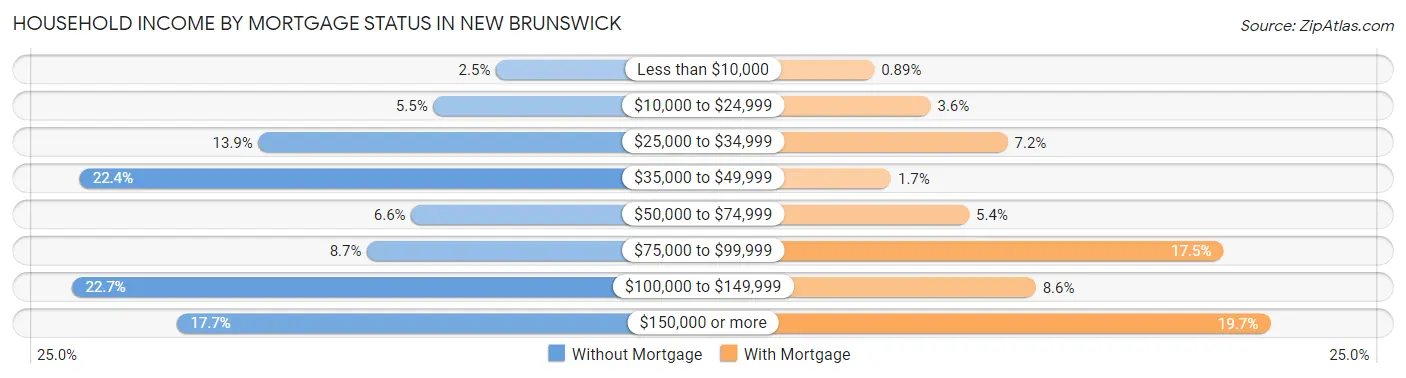
| Household Income | Without Mortgage | With Mortgage |
| Less than $10,000 | 29 (2.5%) | 18 (0.9%) |
| $10,000 to $24,999 | 63 (5.5%) | 72 (3.6%) |
| $25,000 to $34,999 | 158 (13.9%) | 146 (7.2%) |
| $35,000 to $49,999 | 255 (22.4%) | 34 (1.7%) |
| $50,000 to $74,999 | 75 (6.6%) | 109 (5.4%) |
| $75,000 to $99,999 | 99 (8.7%) | 353 (17.5%) |
| $100,000 to $149,999 | 259 (22.7%) | 173 (8.6%) |
| $150,000 or more | 202 (17.7%) | 398 (19.7%) |
| Total | 1,140 (100.0%) | 2,016 (100.0%) |
Property Value to Household Income Ratio in New Brunswick
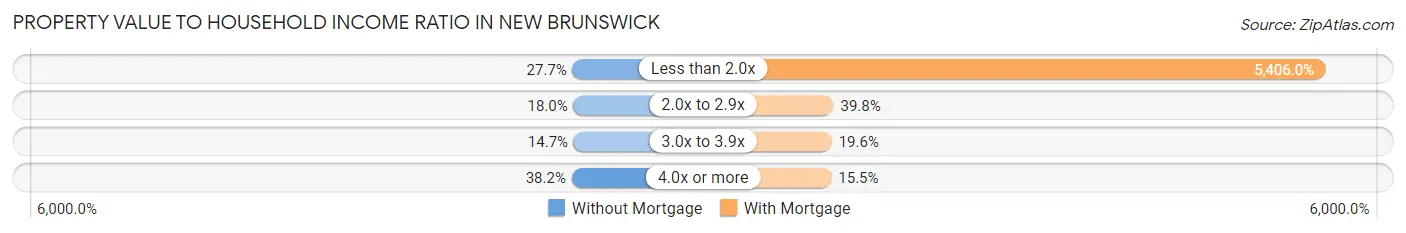
| Value-to-Income Ratio | Without Mortgage | With Mortgage |
| Less than 2.0x | 316 (27.7%) | 108,984 (5,405.9%) |
| 2.0x to 2.9x | 205 (18.0%) | 803 (39.8%) |
| 3.0x to 3.9x | 167 (14.6%) | 395 (19.6%) |
| 4.0x or more | 435 (38.2%) | 312 (15.5%) |
| Total | 1,140 (100.0%) | 2,016 (100.0%) |
Real Estate Taxes by Mortgage Status in New Brunswick
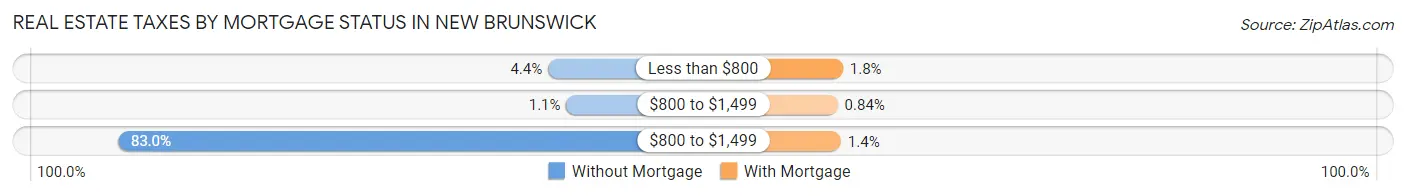
| Property Taxes | Without Mortgage | With Mortgage |
| Less than $800 | 50 (4.4%) | 36 (1.8%) |
| $800 to $1,499 | 12 (1.1%) | 17 (0.8%) |
| $800 to $1,499 | 946 (83.0%) | 29 (1.4%) |
| Total | 1,140 (100.0%) | 2,016 (100.0%) |
Health & Disability in New Brunswick
Health Insurance Coverage by Age in New Brunswick
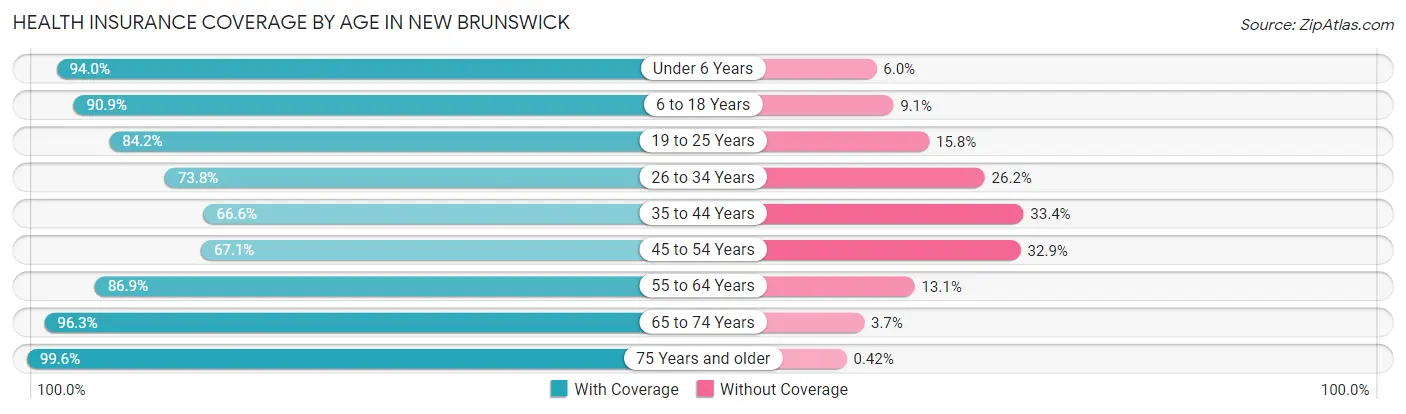
| Age Bracket | With Coverage | Without Coverage |
| Under 6 Years | 3,278 (94.0%) | 208 (6.0%) |
| 6 to 18 Years | 9,630 (90.9%) | 969 (9.1%) |
| 19 to 25 Years | 12,959 (84.2%) | 2,433 (15.8%) |
| 26 to 34 Years | 4,999 (73.8%) | 1,773 (26.2%) |
| 35 to 44 Years | 4,425 (66.6%) | 2,219 (33.4%) |
| 45 to 54 Years | 3,394 (67.1%) | 1,663 (32.9%) |
| 55 to 64 Years | 3,385 (86.9%) | 510 (13.1%) |
| 65 to 74 Years | 1,991 (96.3%) | 76 (3.7%) |
| 75 Years and older | 1,411 (99.6%) | 6 (0.4%) |
| Total | 45,472 (82.2%) | 9,857 (17.8%) |
Health Insurance Coverage by Citizenship Status in New Brunswick
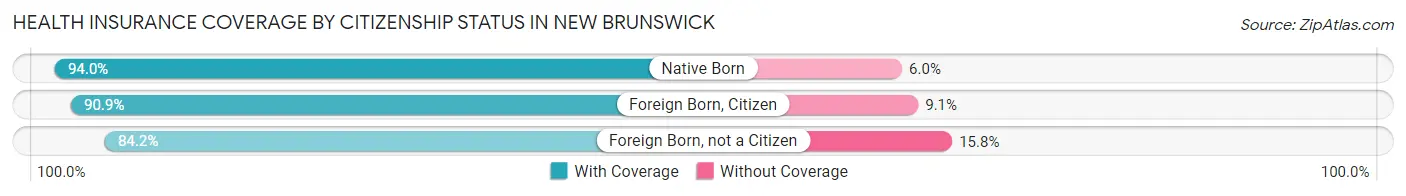
| Citizenship Status | With Coverage | Without Coverage |
| Native Born | 3,278 (94.0%) | 208 (6.0%) |
| Foreign Born, Citizen | 9,630 (90.9%) | 969 (9.1%) |
| Foreign Born, not a Citizen | 12,959 (84.2%) | 2,433 (15.8%) |
Health Insurance Coverage by Household Income in New Brunswick
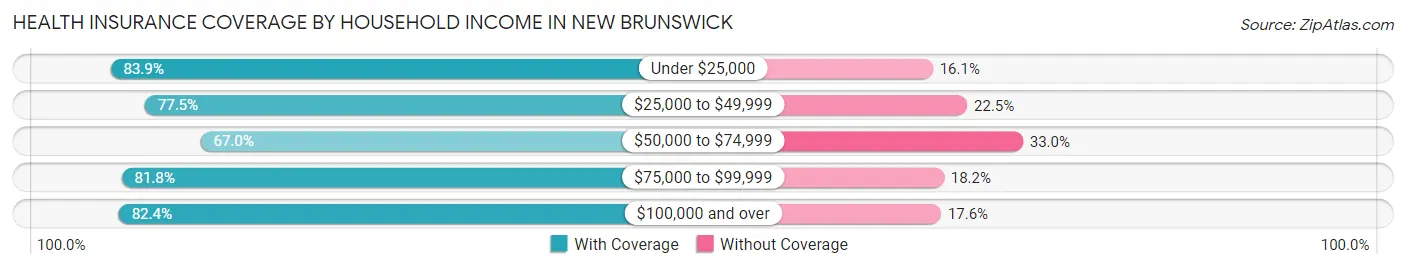
| Household Income | With Coverage | Without Coverage |
| Under $25,000 | 8,400 (83.9%) | 1,612 (16.1%) |
| $25,000 to $49,999 | 6,383 (77.5%) | 1,857 (22.5%) |
| $50,000 to $74,999 | 5,072 (67.0%) | 2,495 (33.0%) |
| $75,000 to $99,999 | 4,148 (81.8%) | 921 (18.2%) |
| $100,000 and over | 13,359 (82.4%) | 2,862 (17.6%) |
Public vs Private Health Insurance Coverage by Age in New Brunswick
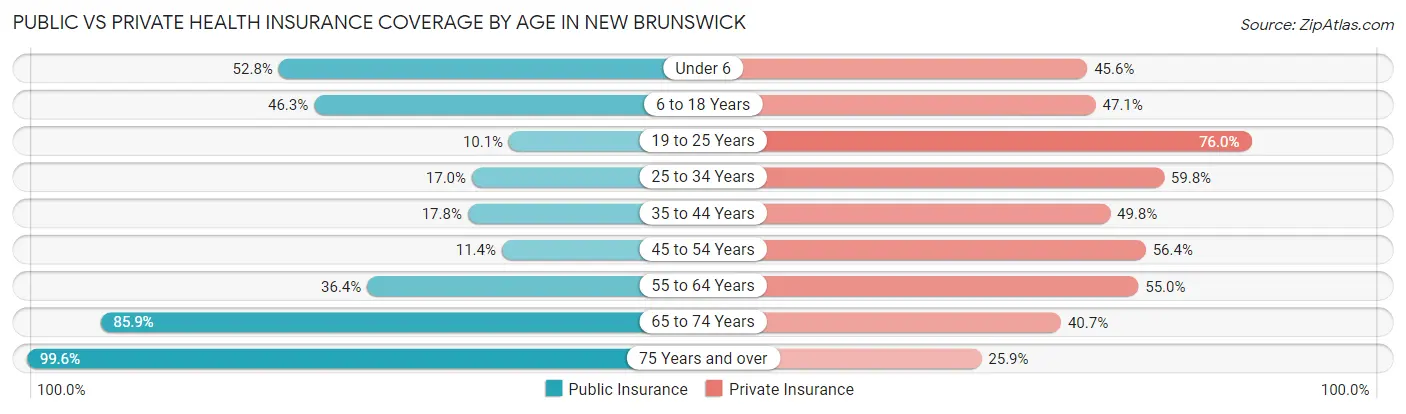
| Age Bracket | Public Insurance | Private Insurance |
| Under 6 | 1,842 (52.8%) | 1,588 (45.6%) |
| 6 to 18 Years | 4,904 (46.3%) | 4,993 (47.1%) |
| 19 to 25 Years | 1,555 (10.1%) | 11,696 (76.0%) |
| 25 to 34 Years | 1,150 (17.0%) | 4,049 (59.8%) |
| 35 to 44 Years | 1,179 (17.7%) | 3,309 (49.8%) |
| 45 to 54 Years | 578 (11.4%) | 2,853 (56.4%) |
| 55 to 64 Years | 1,419 (36.4%) | 2,144 (55.0%) |
| 65 to 74 Years | 1,776 (85.9%) | 841 (40.7%) |
| 75 Years and over | 1,411 (99.6%) | 367 (25.9%) |
| Total | 15,814 (28.6%) | 31,840 (57.6%) |
Disability Status by Sex by Age in New Brunswick
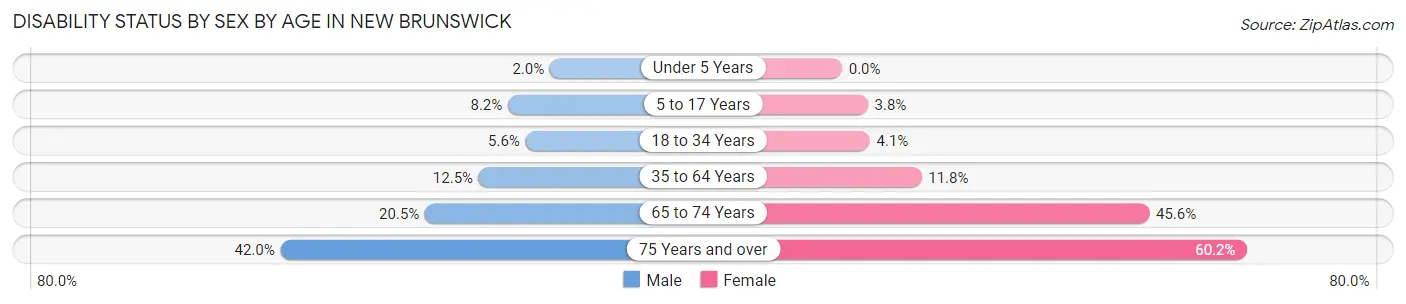
| Age Bracket | Male | Female |
| Under 5 Years | 33 (2.0%) | 0 (0.0%) |
| 5 to 17 Years | 393 (8.2%) | 148 (3.8%) |
| 18 to 34 Years | 706 (5.6%) | 500 (4.1%) |
| 35 to 64 Years | 1,051 (12.5%) | 851 (11.8%) |
| 65 to 74 Years | 197 (20.5%) | 505 (45.6%) |
| 75 Years and over | 231 (42.0%) | 522 (60.2%) |
Disability Class by Sex by Age in New Brunswick
Disability Class: Hearing Difficulty
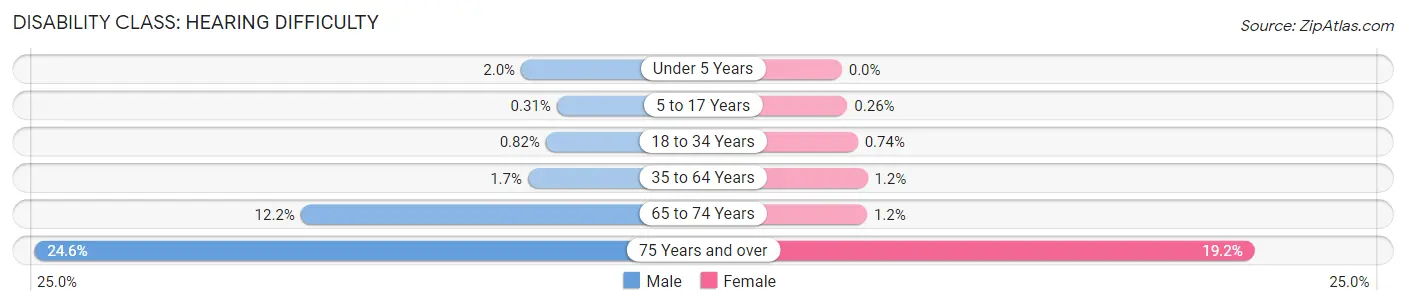
| Age Bracket | Male | Female |
| Under 5 Years | 33 (2.0%) | 0 (0.0%) |
| 5 to 17 Years | 15 (0.3%) | 10 (0.3%) |
| 18 to 34 Years | 103 (0.8%) | 89 (0.7%) |
| 35 to 64 Years | 138 (1.7%) | 86 (1.2%) |
| 65 to 74 Years | 117 (12.2%) | 13 (1.2%) |
| 75 Years and over | 135 (24.5%) | 166 (19.2%) |
Disability Class: Vision Difficulty
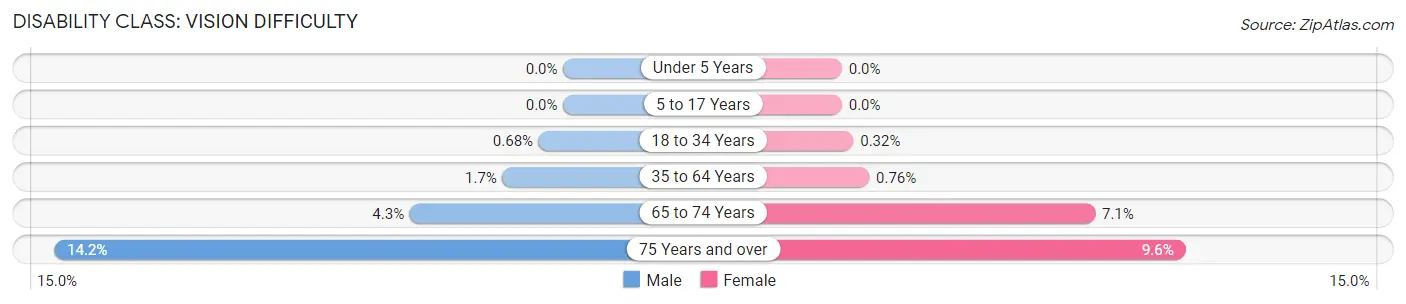
| Age Bracket | Male | Female |
| Under 5 Years | 0 (0.0%) | 0 (0.0%) |
| 5 to 17 Years | 0 (0.0%) | 0 (0.0%) |
| 18 to 34 Years | 86 (0.7%) | 39 (0.3%) |
| 35 to 64 Years | 142 (1.7%) | 55 (0.8%) |
| 65 to 74 Years | 41 (4.3%) | 78 (7.0%) |
| 75 Years and over | 78 (14.2%) | 83 (9.6%) |
Disability Class: Cognitive Difficulty
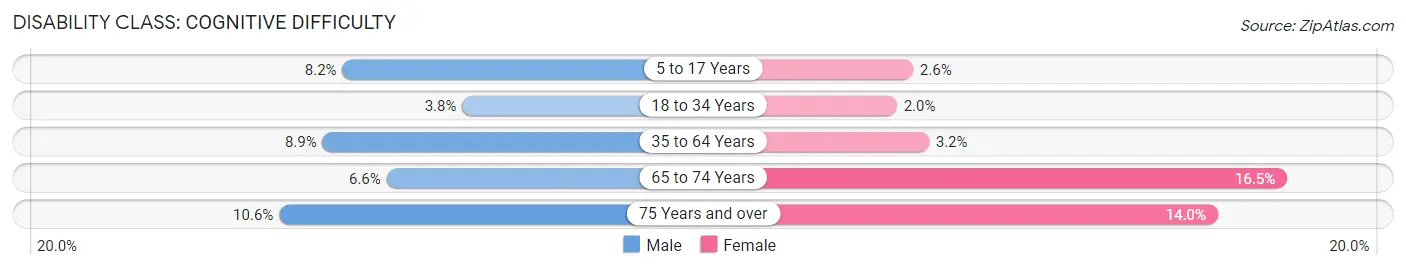
| Age Bracket | Male | Female |
| 5 to 17 Years | 393 (8.2%) | 102 (2.6%) |
| 18 to 34 Years | 473 (3.7%) | 247 (2.0%) |
| 35 to 64 Years | 749 (8.9%) | 233 (3.2%) |
| 65 to 74 Years | 63 (6.6%) | 183 (16.5%) |
| 75 Years and over | 58 (10.5%) | 121 (14.0%) |
Disability Class: Ambulatory Difficulty
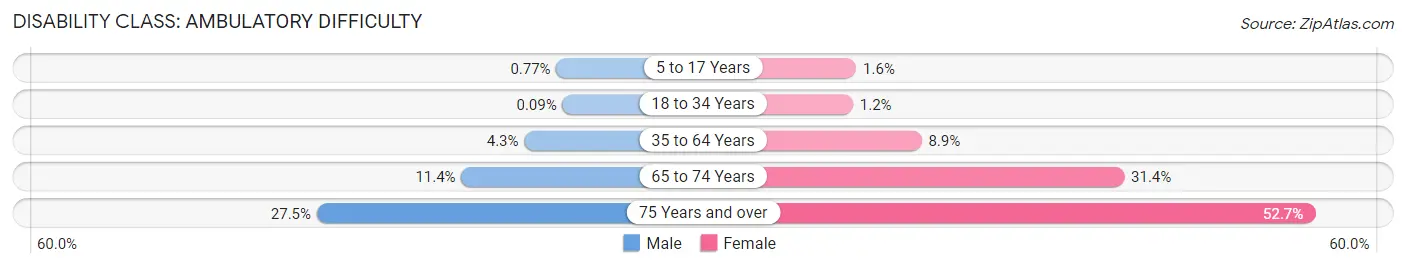
| Age Bracket | Male | Female |
| 5 to 17 Years | 37 (0.8%) | 62 (1.6%) |
| 18 to 34 Years | 11 (0.1%) | 149 (1.2%) |
| 35 to 64 Years | 364 (4.3%) | 640 (8.9%) |
| 65 to 74 Years | 109 (11.4%) | 348 (31.4%) |
| 75 Years and over | 151 (27.5%) | 457 (52.7%) |
Disability Class: Self-Care Difficulty
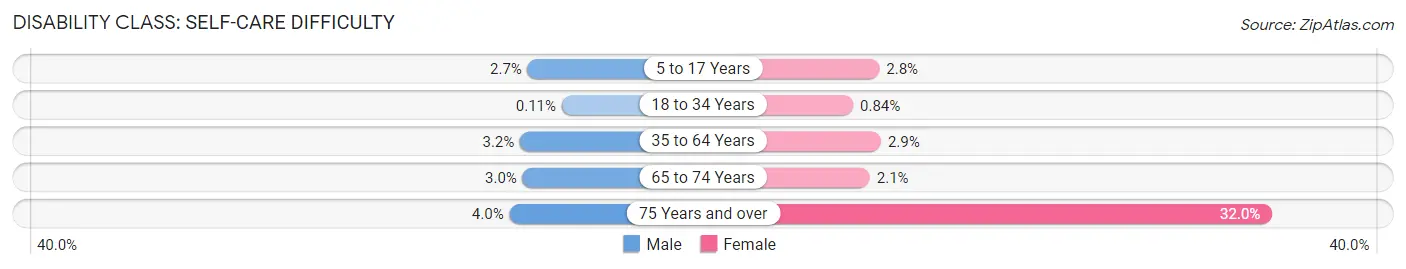
| Age Bracket | Male | Female |
| 5 to 17 Years | 127 (2.6%) | 108 (2.8%) |
| 18 to 34 Years | 14 (0.1%) | 102 (0.8%) |
| 35 to 64 Years | 269 (3.2%) | 210 (2.9%) |
| 65 to 74 Years | 29 (3.0%) | 23 (2.1%) |
| 75 Years and over | 22 (4.0%) | 277 (32.0%) |
Technology Access in New Brunswick
Computing Device Access in New Brunswick
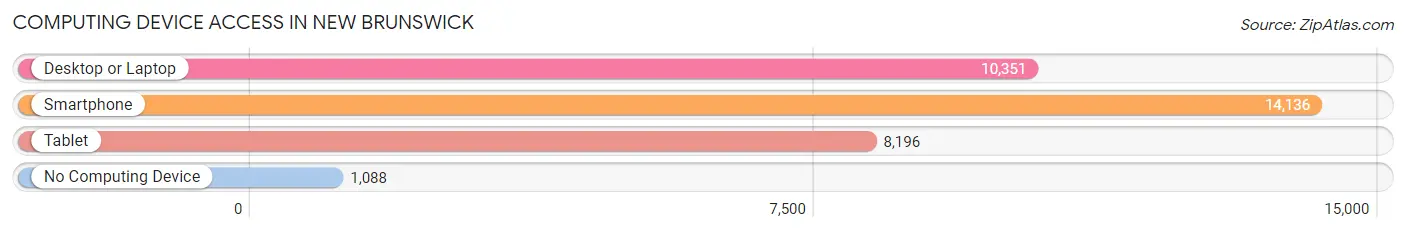
| Device Type | # Households | % Households |
| Desktop or Laptop | 10,351 | 66.2% |
| Smartphone | 14,136 | 90.5% |
| Tablet | 8,196 | 52.4% |
| No Computing Device | 1,088 | 7.0% |
| Total | 15,626 | 100.0% |
Internet Access in New Brunswick
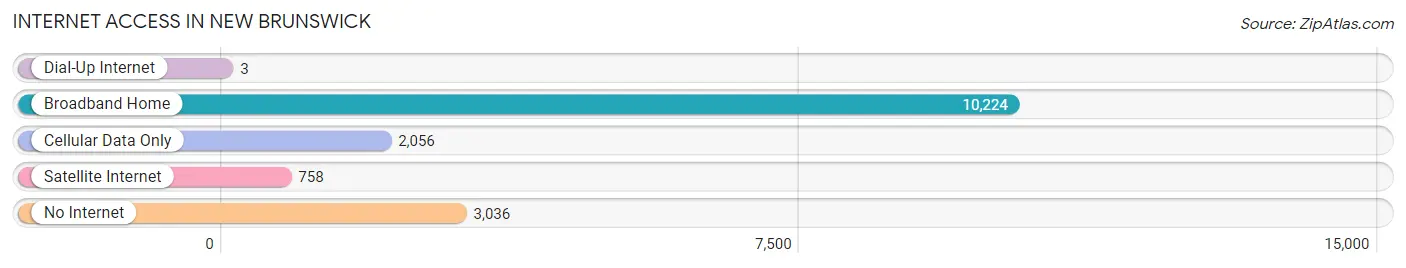
| Internet Type | # Households | % Households |
| Dial-Up Internet | 3 | 0.0% |
| Broadband Home | 10,224 | 65.4% |
| Cellular Data Only | 2,056 | 13.2% |
| Satellite Internet | 758 | 4.9% |
| No Internet | 3,036 | 19.4% |
| Total | 15,626 | 100.0% |
New Brunswick Summary
New Brunswick, NJ is a city located in Middlesex County, New Jersey. It is the county seat of Middlesex County and is part of the New York metropolitan area. The city has a population of 56,910 as of the 2010 census, making it the fifth-largest city in the state.
History
New Brunswick was founded in 1730 by European settlers, primarily from the Netherlands and England. The city was originally known as Prigmore's Swamp, named after the original settler, John Prigmore. The city was incorporated in 1784 and was named after the city of Brunswick in Germany.
In the 19th century, New Brunswick became an important industrial center, with several factories and mills located in the city. The city was also home to several important educational institutions, including Rutgers University, which was founded in 1766.
Geography
New Brunswick is located in central New Jersey, approximately 25 miles southwest of New York City. The city is situated on the Raritan River, which flows through the city and into the Raritan Bay. The city has a total area of 5.9 square miles, of which 5.7 square miles is land and 0.2 square miles is water.
Economy
New Brunswick is home to a diverse economy, with a variety of industries represented in the city. The city is home to several major corporations, including Johnson & Johnson, which has its world headquarters in the city. Other major employers in the city include Rutgers University, Robert Wood Johnson University Hospital, and Saint Peter's University Hospital.
The city is also home to a vibrant arts and culture scene, with several theaters, museums, and galleries located in the city. The city is also home to several festivals and events throughout the year, including the New Brunswick Jazz Festival and the New Brunswick Cultural Center's Summer Arts Festival.
Demographics
As of the 2010 census, the population of New Brunswick was 56,910, with a population density of 9,717 people per square mile. The racial makeup of the city was 44.3% White, 28.3% African American, 0.3% Native American, 15.2% Asian, 0.1% Pacific Islander, 8.2% from other races, and 3.6% from two or more races. Hispanic or Latino of any race were 24.7% of the population.
The median income for a household in the city was $41,919, and the median income for a family was $50,919. The per capita income for the city was $21,919. About 17.3% of the population was below the poverty line.
New Brunswick is a diverse city, with a variety of cultures and backgrounds represented in the city. The city is home to a large Hispanic population, with nearly 25% of the population identifying as Hispanic or Latino. The city is also home to a large Asian population, with 15.2% of the population identifying as Asian.
Common Questions
What is Per Capita Income in New Brunswick?
Per Capita income in New Brunswick is $24,057.
What is the Median Family Income in New Brunswick?
Median Family Income in New Brunswick is $60,590.
What is the Median Household income in New Brunswick?
Median Household Income in New Brunswick is $57,138.
What is Income or Wage Gap in New Brunswick?
Income or Wage Gap in New Brunswick is 36.9%.
Women in New Brunswick earn 63.1 cents for every dollar earned by a man.
What is Family Income Deficit in New Brunswick?
Family Income Deficit in New Brunswick is $11,826.
Families that are below poverty line in New Brunswick earn $11,826 less on average than the poverty threshold level.
What is Inequality or Gini Index in New Brunswick?
Inequality or Gini Index in New Brunswick is 0.52.
What is the Total Population of New Brunswick?
Total Population of New Brunswick is 55,718.
What is the Total Male Population of New Brunswick?
Total Male Population of New Brunswick is 29,113.
What is the Total Female Population of New Brunswick?
Total Female Population of New Brunswick is 26,605.
What is the Ratio of Males per 100 Females in New Brunswick?
There are 109.43 Males per 100 Females in New Brunswick.
What is the Ratio of Females per 100 Males in New Brunswick?
There are 91.39 Females per 100 Males in New Brunswick.
What is the Median Population Age in New Brunswick?
Median Population Age in New Brunswick is 24.0 Years.
What is the Average Family Size in New Brunswick
Average Family Size in New Brunswick is 3.6 People.
What is the Average Household Size in New Brunswick
Average Household Size in New Brunswick is 3.0 People.
How Large is the Labor Force in New Brunswick?
There are 27,472 People in the Labor Forcein in New Brunswick.
What is the Percentage of People in the Labor Force in New Brunswick?
60.2% of People are in the Labor Force in New Brunswick.
What is the Unemployment Rate in New Brunswick?
Unemployment Rate in New Brunswick is 6.5%.