Minnesota City, MN Map & Demographics
Minnesota City Map
Minnesota City Overview
$31,317
PER CAPITA INCOME
$86,111
AVG FAMILY INCOME
$62,500
AVG HOUSEHOLD INCOME
2.2%
WAGE / INCOME GAP [ % ]
97.8¢/ $1
WAGE / INCOME GAP [ $ ]
0.34
INEQUALITY / GINI INDEX
172
TOTAL POPULATION
94
MALE POPULATION
78
FEMALE POPULATION
120.51
MALES / 100 FEMALES
82.98
FEMALES / 100 MALES
41.9
MEDIAN AGE
2.9
AVG FAMILY SIZE
2.4
AVG HOUSEHOLD SIZE
103
LABOR FORCE [ PEOPLE ]
70.1%
PERCENT IN LABOR FORCE
10.7%
UNEMPLOYMENT RATE
Minnesota City Zip Codes
Minnesota City Area Codes
Income in Minnesota City
Income Overview in Minnesota City
Per Capita Income in Minnesota City is $31,317, while median incomes of families and households are $86,111 and $62,500 respectively.
| Characteristic | Number | Measure |
| Per Capita Income | 172 | $31,317 |
| Median Family Income | 46 | $86,111 |
| Mean Family Income | 46 | $90,372 |
| Median Household Income | 72 | $62,500 |
| Mean Household Income | 72 | $73,333 |
| Income Deficit | 46 | $0 |
| Wage / Income Gap (%) | 172 | 2.18% |
| Wage / Income Gap ($) | 172 | 97.82¢ per $1 |
| Gini / Inequality Index | 172 | 0.34 |
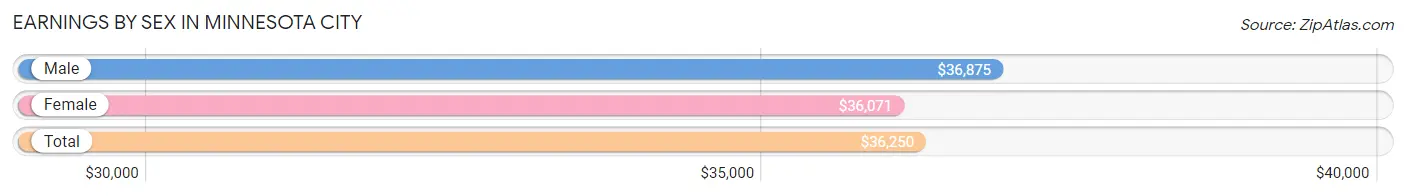
Earnings by Sex in Minnesota City
Average Earnings in Minnesota City are $36,250, $36,875 for men and $36,071 for women, a difference of 2.2%.
| Sex | Number | Average Earnings |
| Male | 65 (58.6%) | $36,875 |
| Female | 46 (41.4%) | $36,071 |
| Total | 111 (100.0%) | $36,250 |
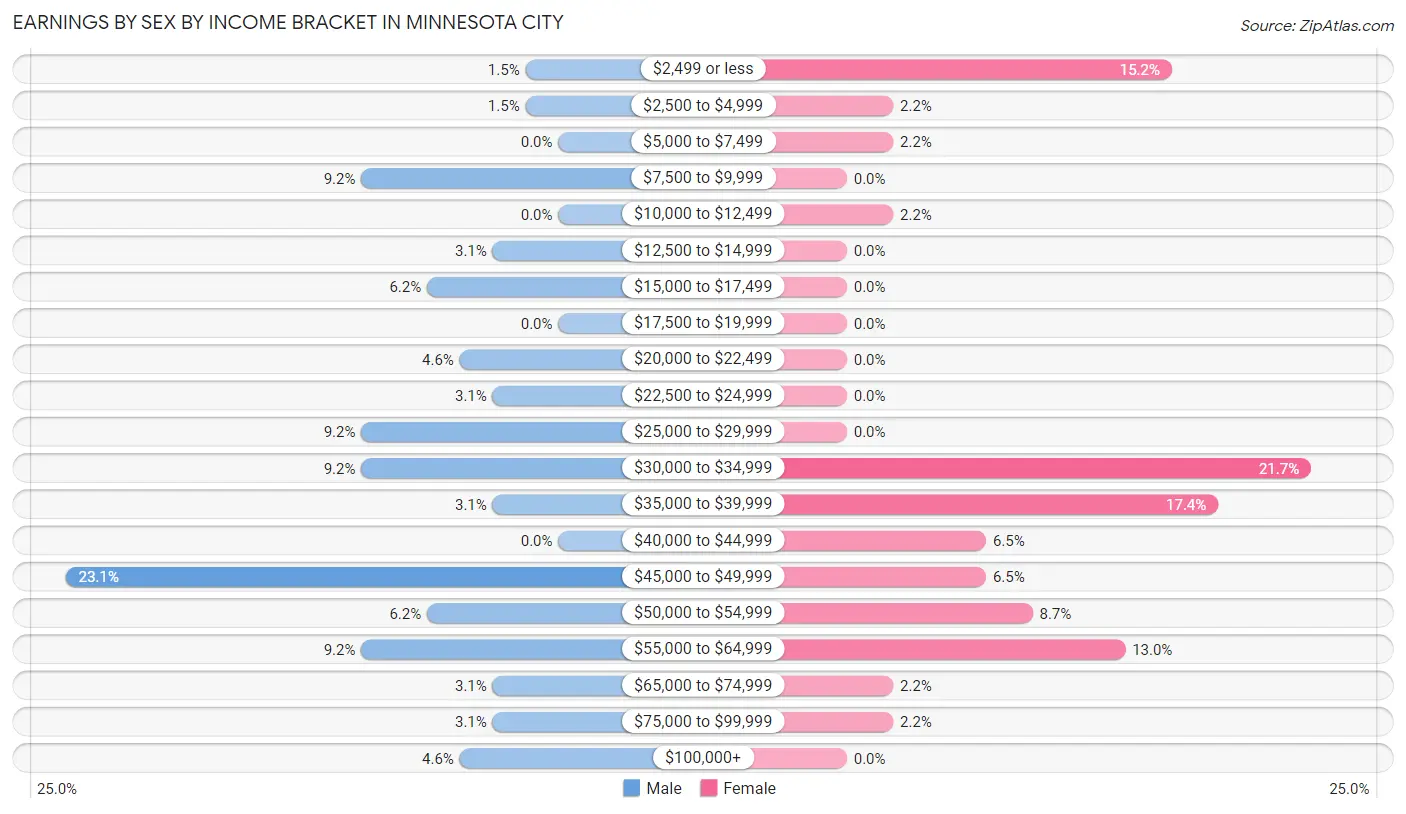
Earnings by Sex by Income Bracket in Minnesota City
The most common earnings brackets in Minnesota City are $45,000 to $49,999 for men (15 | 23.1%) and $30,000 to $34,999 for women (10 | 21.7%).
| Income | Male | Female |
| $2,499 or less | 1 (1.5%) | 7 (15.2%) |
| $2,500 to $4,999 | 1 (1.5%) | 1 (2.2%) |
| $5,000 to $7,499 | 0 (0.0%) | 1 (2.2%) |
| $7,500 to $9,999 | 6 (9.2%) | 0 (0.0%) |
| $10,000 to $12,499 | 0 (0.0%) | 1 (2.2%) |
| $12,500 to $14,999 | 2 (3.1%) | 0 (0.0%) |
| $15,000 to $17,499 | 4 (6.1%) | 0 (0.0%) |
| $17,500 to $19,999 | 0 (0.0%) | 0 (0.0%) |
| $20,000 to $22,499 | 3 (4.6%) | 0 (0.0%) |
| $22,500 to $24,999 | 2 (3.1%) | 0 (0.0%) |
| $25,000 to $29,999 | 6 (9.2%) | 0 (0.0%) |
| $30,000 to $34,999 | 6 (9.2%) | 10 (21.7%) |
| $35,000 to $39,999 | 2 (3.1%) | 8 (17.4%) |
| $40,000 to $44,999 | 0 (0.0%) | 3 (6.5%) |
| $45,000 to $49,999 | 15 (23.1%) | 3 (6.5%) |
| $50,000 to $54,999 | 4 (6.1%) | 4 (8.7%) |
| $55,000 to $64,999 | 6 (9.2%) | 6 (13.0%) |
| $65,000 to $74,999 | 2 (3.1%) | 1 (2.2%) |
| $75,000 to $99,999 | 2 (3.1%) | 1 (2.2%) |
| $100,000+ | 3 (4.6%) | 0 (0.0%) |
| Total | 65 (100.0%) | 46 (100.0%) |
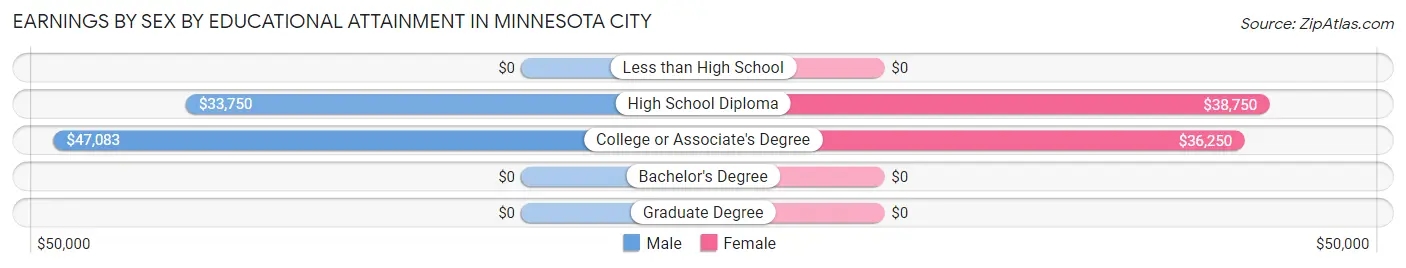
Earnings by Sex by Educational Attainment in Minnesota City
Average earnings in Minnesota City are $46,071 for men and $37,083 for women, a difference of 19.5%. Men with an educational attainment of college or associate's degree enjoy the highest average annual earnings of $47,083, while those with high school diploma education earn the least with $33,750. Women with an educational attainment of high school diploma earn the most with the average annual earnings of $38,750, while those with college or associate's degree education have the smallest earnings of $36,250.
| Educational Attainment | Male Income | Female Income |
| Less than High School | - | - |
| High School Diploma | $33,750 | $38,750 |
| College or Associate's Degree | $47,083 | $36,250 |
| Bachelor's Degree | - | - |
| Graduate Degree | - | - |
| Total | $46,071 | $37,083 |
Family Income in Minnesota City
Family Income Brackets in Minnesota City
According to the Minnesota City family income data, there are 16 families falling into the $75,000 to $99,999 income range, which is the most common income bracket and makes up 34.8% of all families.
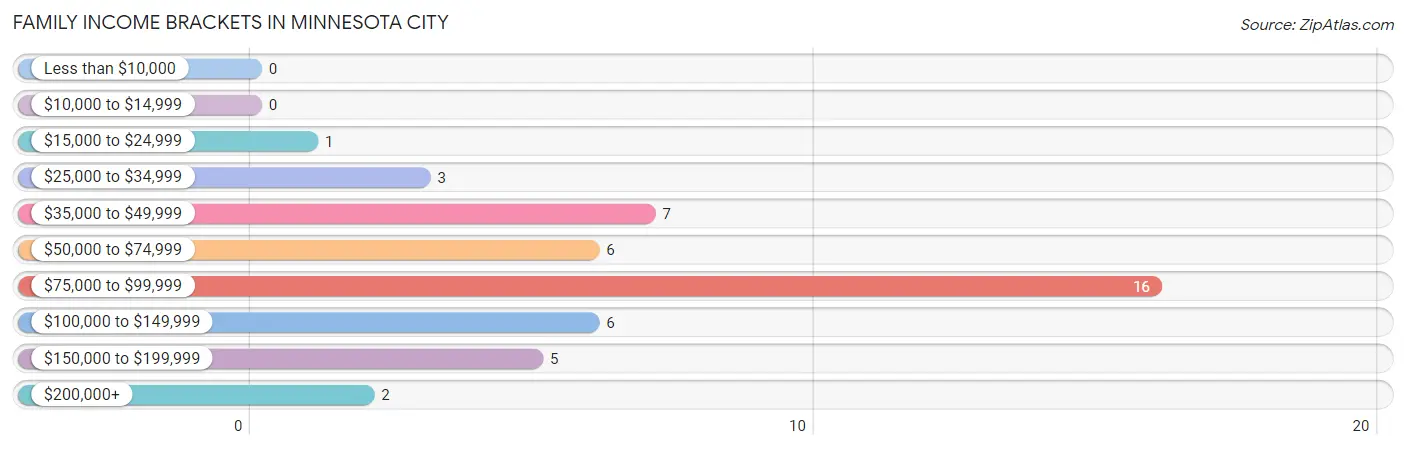
| Income Bracket | # Families | % Families |
| Less than $10,000 | 0 | 0.0% |
| $10,000 to $14,999 | 0 | 0.0% |
| $15,000 to $24,999 | 1 | 2.2% |
| $25,000 to $34,999 | 3 | 6.5% |
| $35,000 to $49,999 | 7 | 15.2% |
| $50,000 to $74,999 | 6 | 13.0% |
| $75,000 to $99,999 | 16 | 34.8% |
| $100,000 to $149,999 | 6 | 13.0% |
| $150,000 to $199,999 | 5 | 10.9% |
| $200,000+ | 2 | 4.3% |
Family Income by Famaliy Size in Minnesota City
2-person families (25 | 54.3%) account for the highest median family income in Minnesota City with $87,813 per family, while 2-person families (25 | 54.3%) have the highest median income of $43,906 per family member.
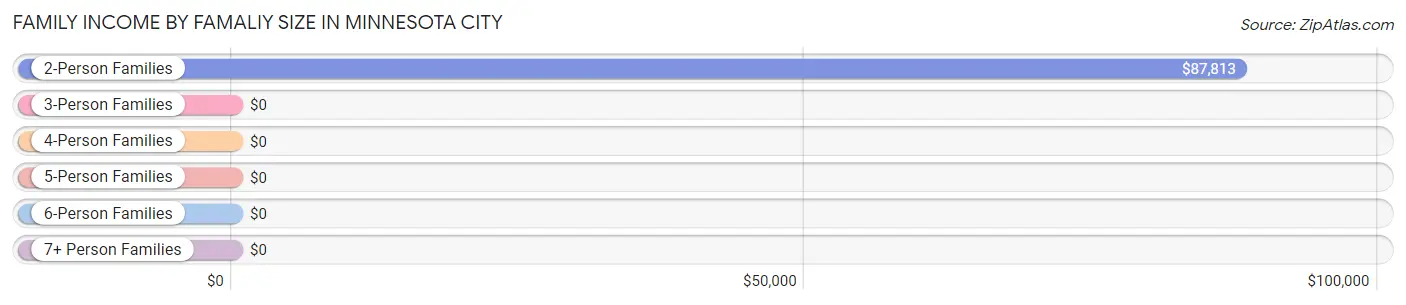
| Income Bracket | # Families | Median Income |
| 2-Person Families | 25 (54.3%) | $87,813 |
| 3-Person Families | 15 (32.6%) | $0 |
| 4-Person Families | 2 (4.3%) | $0 |
| 5-Person Families | 4 (8.7%) | $0 |
| 6-Person Families | 0 (0.0%) | $0 |
| 7+ Person Families | 0 (0.0%) | $0 |
| Total | 46 (100.0%) | $86,111 |
Family Income by Number of Earners in Minnesota City
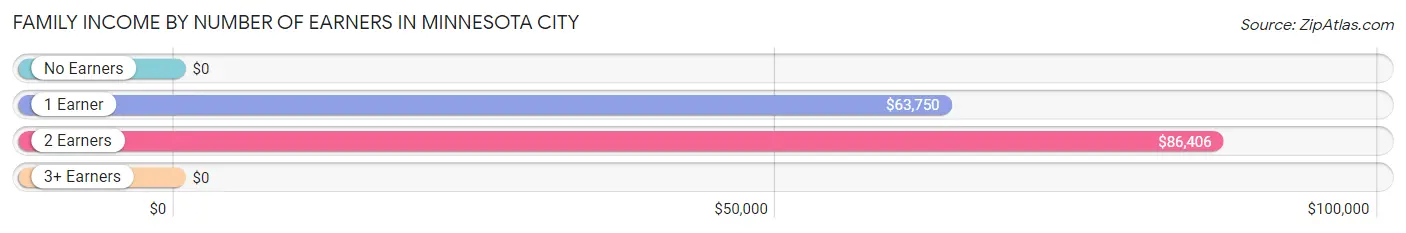
| Number of Earners | # Families | Median Income |
| No Earners | 3 (6.5%) | $0 |
| 1 Earner | 7 (15.2%) | $63,750 |
| 2 Earners | 33 (71.7%) | $86,406 |
| 3+ Earners | 3 (6.5%) | $0 |
| Total | 46 (100.0%) | $86,111 |
Household Income in Minnesota City
Household Income Brackets in Minnesota City
With 18 households falling in the category, the $50,000 to $74,999 income range is the most frequent in Minnesota City, accounting for 25.0% of all households. In contrast, only 2 households (2.8%) fall into the less than $10,000 income bracket, making it the least populous group.
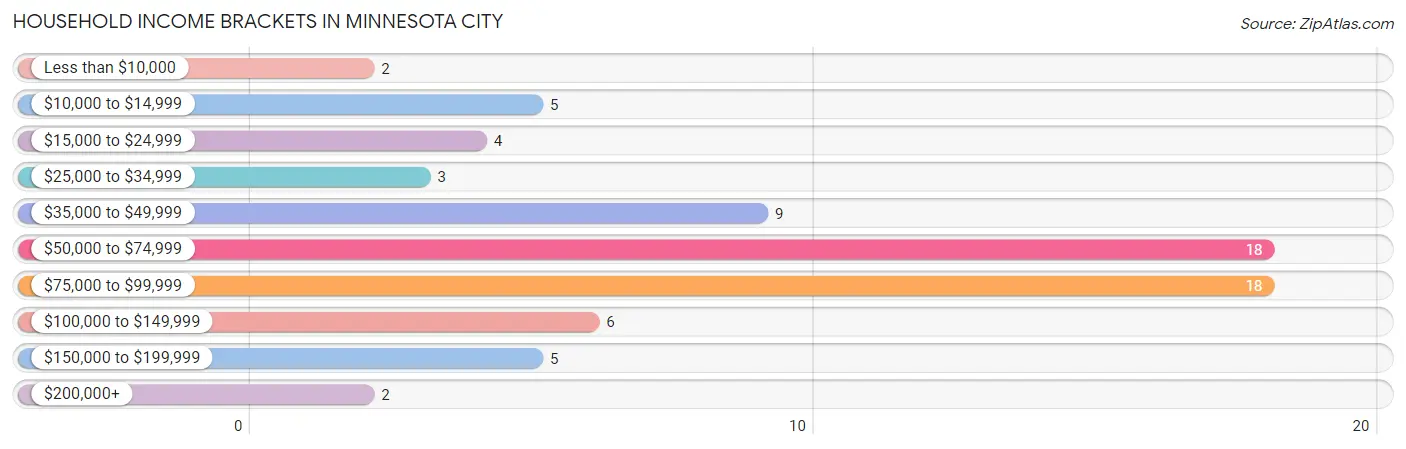
| Income Bracket | # Households | % Households |
| Less than $10,000 | 2 | 2.8% |
| $10,000 to $14,999 | 5 | 6.9% |
| $15,000 to $24,999 | 4 | 5.6% |
| $25,000 to $34,999 | 3 | 4.2% |
| $35,000 to $49,999 | 9 | 12.5% |
| $50,000 to $74,999 | 18 | 25.0% |
| $75,000 to $99,999 | 18 | 25.0% |
| $100,000 to $149,999 | 6 | 8.3% |
| $150,000 to $199,999 | 5 | 6.9% |
| $200,000+ | 2 | 2.8% |
Household Income by Householder Age in Minnesota City
The median household income in Minnesota City is $62,500, with the highest median household income of $88,438 found in the 45 to 64 years age bracket for the primary householder. A total of 15 households (20.8%) fall into this category. Meanwhile, the 65+ years age bracket for the primary householder has the lowest median household income of $51,875, with 25 households (34.7%) in this group.
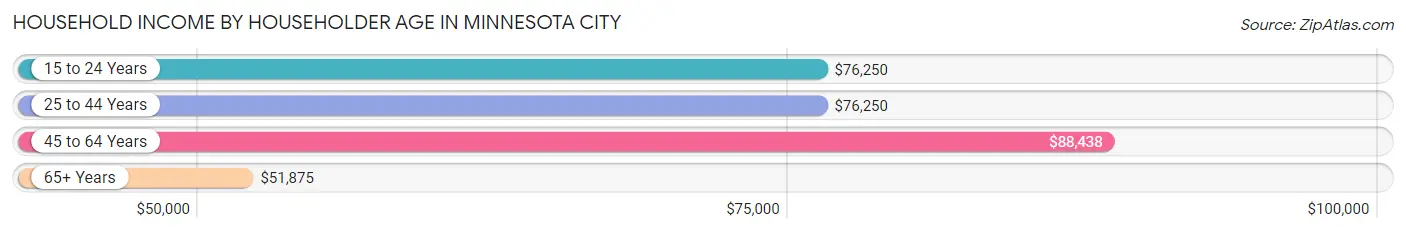
| Income Bracket | # Households | Median Income |
| 15 to 24 Years | 6 (8.3%) | $76,250 |
| 25 to 44 Years | 26 (36.1%) | $76,250 |
| 45 to 64 Years | 15 (20.8%) | $88,438 |
| 65+ Years | 25 (34.7%) | $51,875 |
| Total | 72 (100.0%) | $62,500 |
Poverty in Minnesota City
Income Below Poverty by Sex and Age in Minnesota City
With 10.6% poverty level for males and 11.1% for females among the residents of Minnesota City, 5 year old males and 65 to 74 year old females are the most vulnerable to poverty, with 2 males (100.0%) and 4 females (57.1%) in their respective age groups living below the poverty level.
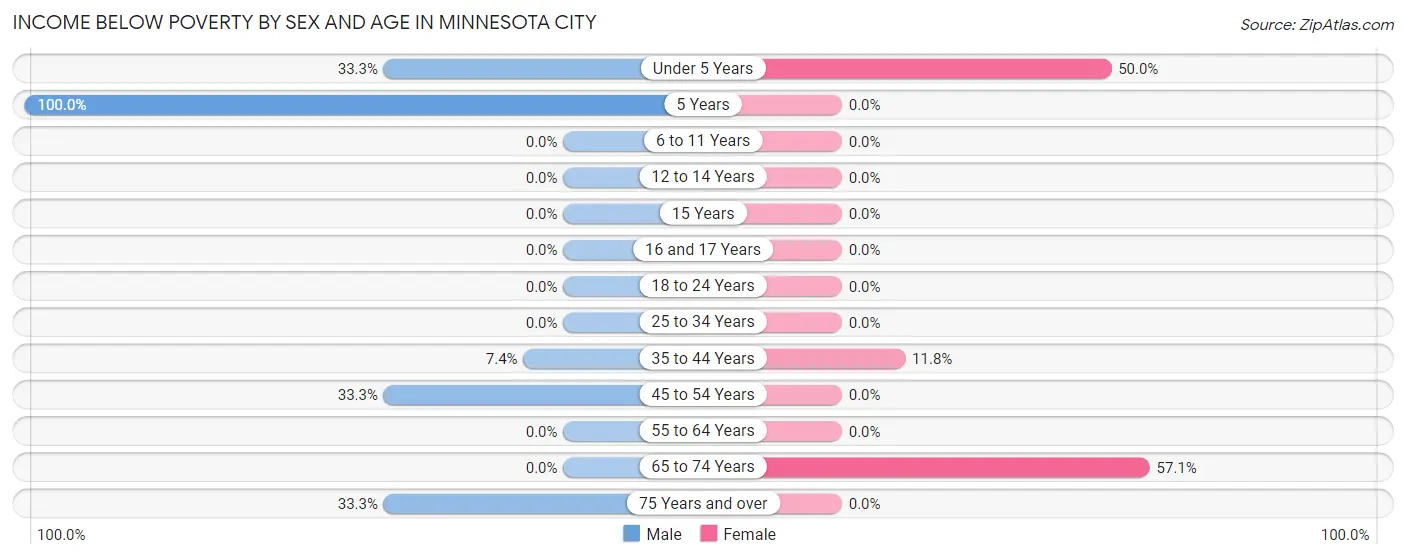
| Age Bracket | Male | Female |
| Under 5 Years | 3 (33.3%) | 2 (50.0%) |
| 5 Years | 2 (100.0%) | 0 (0.0%) |
| 6 to 11 Years | 0 (0.0%) | 0 (0.0%) |
| 12 to 14 Years | 0 (0.0%) | 0 (0.0%) |
| 15 Years | 0 (0.0%) | 0 (0.0%) |
| 16 and 17 Years | 0 (0.0%) | 0 (0.0%) |
| 18 to 24 Years | 0 (0.0%) | 0 (0.0%) |
| 25 to 34 Years | 0 (0.0%) | 0 (0.0%) |
| 35 to 44 Years | 2 (7.4%) | 2 (11.8%) |
| 45 to 54 Years | 1 (33.3%) | 0 (0.0%) |
| 55 to 64 Years | 0 (0.0%) | 0 (0.0%) |
| 65 to 74 Years | 0 (0.0%) | 4 (57.1%) |
| 75 Years and over | 2 (33.3%) | 0 (0.0%) |
| Total | 10 (10.6%) | 8 (11.1%) |
Income Above Poverty by Sex and Age in Minnesota City
According to the poverty statistics in Minnesota City, males aged 16 and 17 years and females aged 6 to 11 years are the age groups that are most secure financially, with 100.0% of males and 100.0% of females in these age groups living above the poverty line.
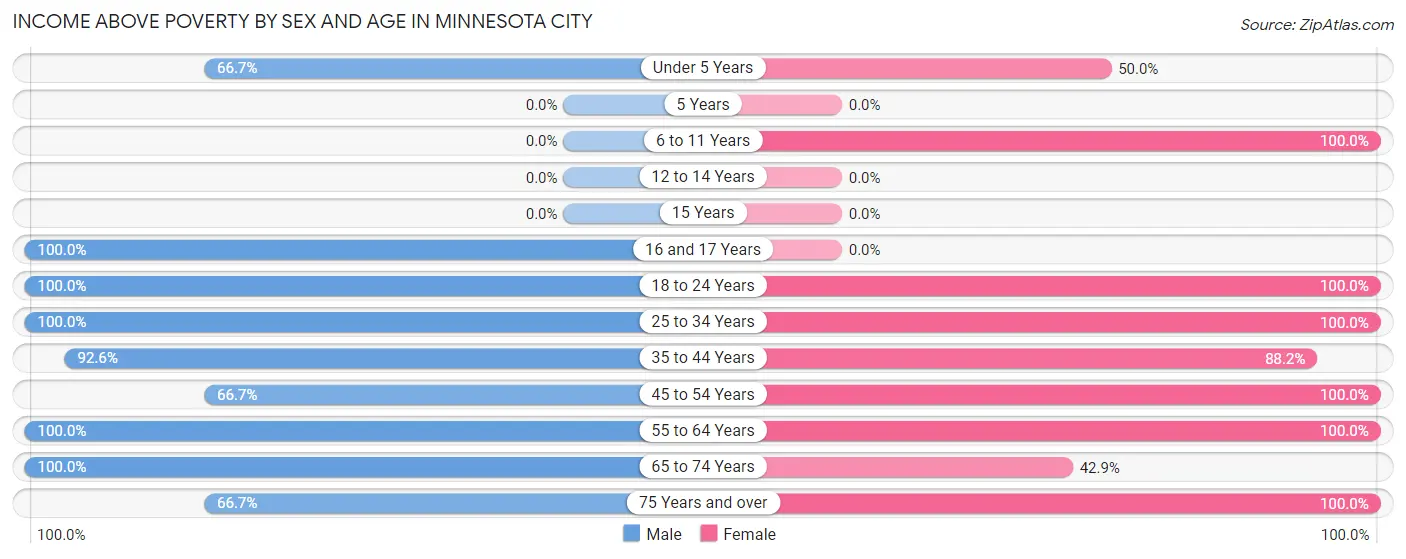
| Age Bracket | Male | Female |
| Under 5 Years | 6 (66.7%) | 2 (50.0%) |
| 5 Years | 0 (0.0%) | 0 (0.0%) |
| 6 to 11 Years | 0 (0.0%) | 4 (100.0%) |
| 12 to 14 Years | 0 (0.0%) | 0 (0.0%) |
| 15 Years | 0 (0.0%) | 0 (0.0%) |
| 16 and 17 Years | 11 (100.0%) | 0 (0.0%) |
| 18 to 24 Years | 11 (100.0%) | 6 (100.0%) |
| 25 to 34 Years | 9 (100.0%) | 4 (100.0%) |
| 35 to 44 Years | 25 (92.6%) | 15 (88.2%) |
| 45 to 54 Years | 2 (66.7%) | 2 (100.0%) |
| 55 to 64 Years | 7 (100.0%) | 17 (100.0%) |
| 65 to 74 Years | 9 (100.0%) | 3 (42.9%) |
| 75 Years and over | 4 (66.7%) | 11 (100.0%) |
| Total | 84 (89.4%) | 64 (88.9%) |
Income Below Poverty Among Married-Couple Families in Minnesota City
The poverty statistics for married-couple families in Minnesota City show that 5.1% or 2 of the total 39 families live below the poverty line. Families with 3 or 4 children have the highest poverty rate of 100.0%, comprising of 2 families. On the other hand, families with no children have the lowest poverty rate of 0.0%, which includes 0 families.
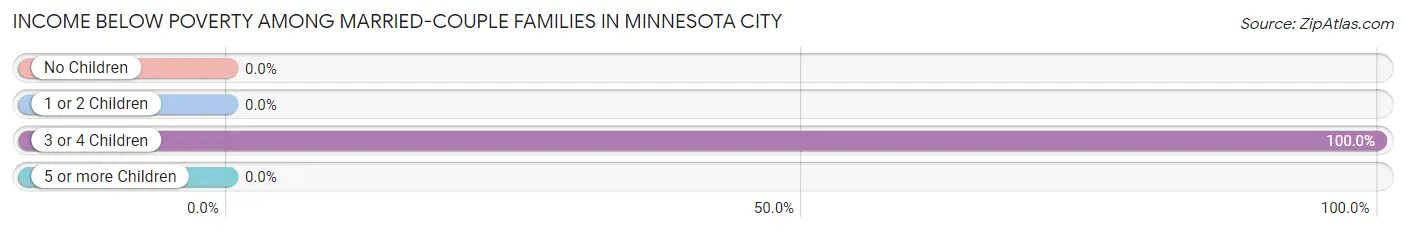
| Children | Above Poverty | Below Poverty |
| No Children | 22 (100.0%) | 0 (0.0%) |
| 1 or 2 Children | 15 (100.0%) | 0 (0.0%) |
| 3 or 4 Children | 0 (0.0%) | 2 (100.0%) |
| 5 or more Children | 0 (0.0%) | 0 (0.0%) |
| Total | 37 (94.9%) | 2 (5.1%) |
Income Below Poverty Among Single-Parent Households in Minnesota City
| Children | Single Father | Single Mother |
| No Children | 0 (0.0%) | 0 (0.0%) |
| 1 or 2 Children | 0 (0.0%) | 0 (0.0%) |
| 3 or 4 Children | 0 (0.0%) | 0 (0.0%) |
| 5 or more Children | 0 (0.0%) | 0 (0.0%) |
| Total | 0 (0.0%) | 0 (0.0%) |
Income Below Poverty Among Married-Couple vs Single-Parent Households in Minnesota City
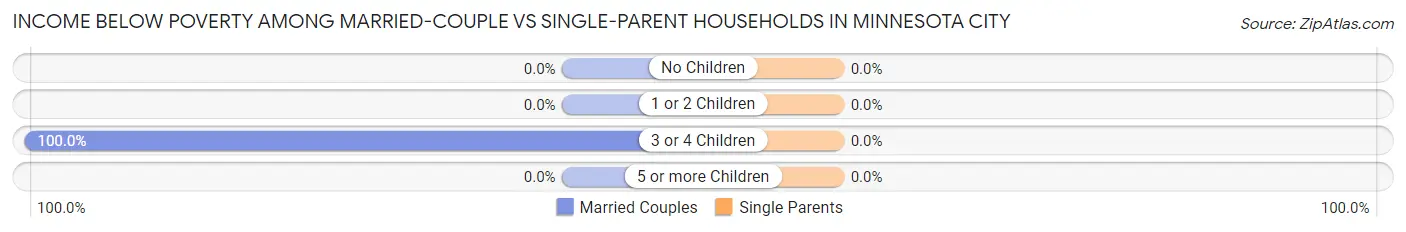
| Children | Married-Couple Families | Single-Parent Households |
| No Children | 0 (0.0%) | 0 (0.0%) |
| 1 or 2 Children | 0 (0.0%) | 0 (0.0%) |
| 3 or 4 Children | 2 (100.0%) | 0 (0.0%) |
| 5 or more Children | 0 (0.0%) | 0 (0.0%) |
| Total | 2 (5.1%) | 0 (0.0%) |
Race in Minnesota City
The most populous races in Minnesota City are White / Caucasian (166 | 96.5%), Hispanic or Latino (4 | 2.3%), and Some other Race (4 | 2.3%).
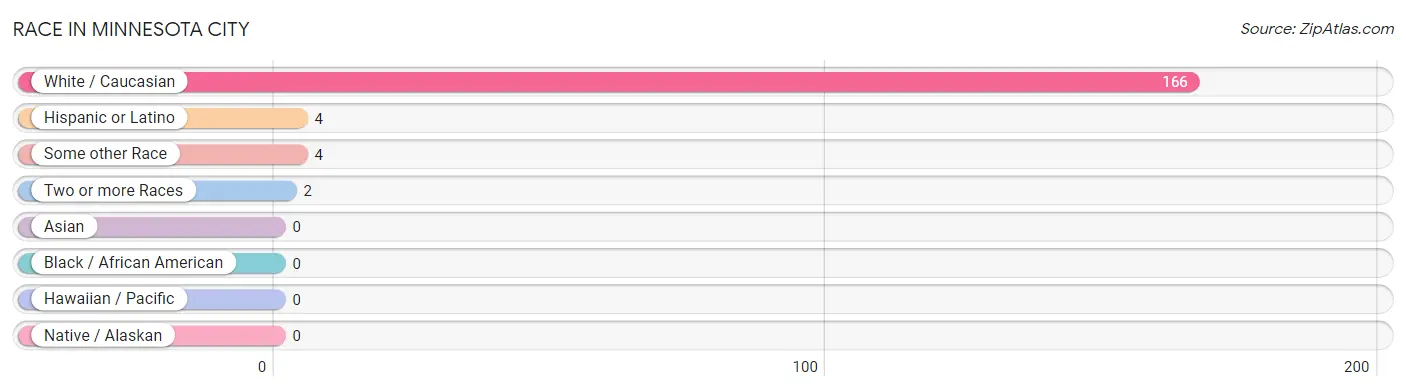
| Race | # Population | % Population |
| Asian | 0 | 0.0% |
| Black / African American | 0 | 0.0% |
| Hawaiian / Pacific | 0 | 0.0% |
| Hispanic or Latino | 4 | 2.3% |
| Native / Alaskan | 0 | 0.0% |
| White / Caucasian | 166 | 96.5% |
| Two or more Races | 2 | 1.2% |
| Some other Race | 4 | 2.3% |
| Total | 172 | 100.0% |
Ancestry in Minnesota City
The most populous ancestries reported in Minnesota City are German (92 | 53.5%), Norwegian (26 | 15.1%), Polish (21 | 12.2%), Irish (20 | 11.6%), and English (8 | 4.6%), together accounting for 97.1% of all Minnesota City residents.
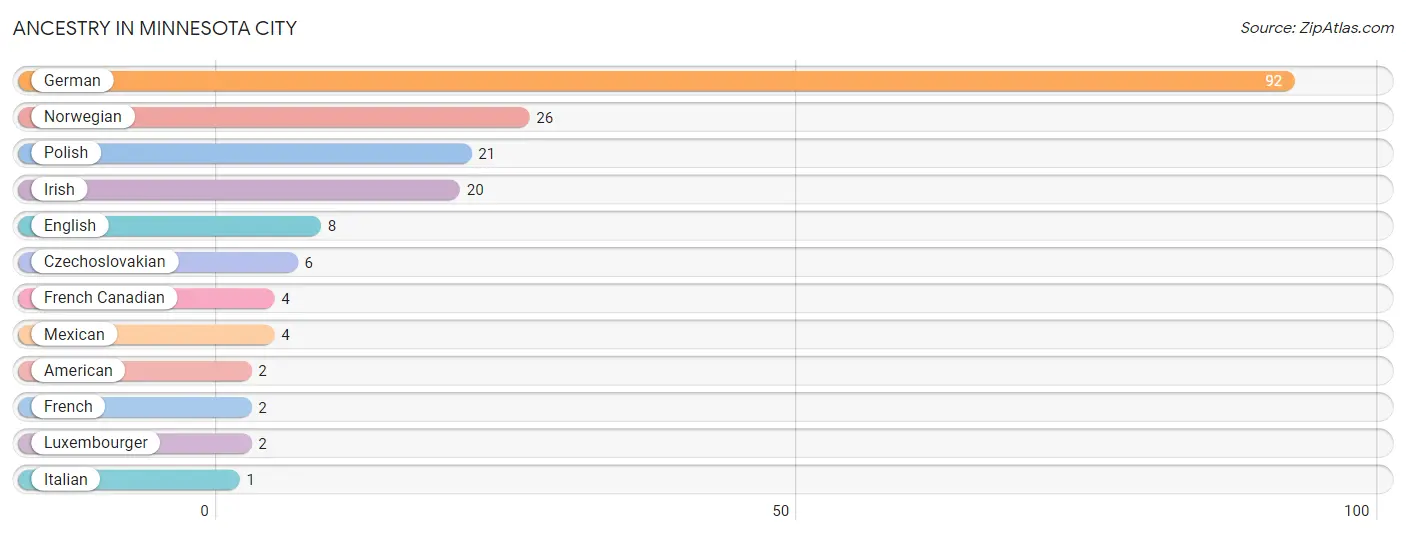
| Ancestry | # Population | % Population |
| American | 2 | 1.2% |
| Czechoslovakian | 6 | 3.5% |
| English | 8 | 4.6% |
| French | 2 | 1.2% |
| French Canadian | 4 | 2.3% |
| German | 92 | 53.5% |
| Irish | 20 | 11.6% |
| Italian | 1 | 0.6% |
| Luxembourger | 2 | 1.2% |
| Mexican | 4 | 2.3% |
| Norwegian | 26 | 15.1% |
| Polish | 21 | 12.2% | View All 12 Rows |
Immigrants in Minnesota City

| Immigration Origin | # Population | % Population | View All 0 Rows |
Sex and Age in Minnesota City
Sex and Age in Minnesota City
The most populous age groups in Minnesota City are 40 to 44 Years (27 | 28.7%) for men and 75 to 79 Years (11 | 14.1%) for women.
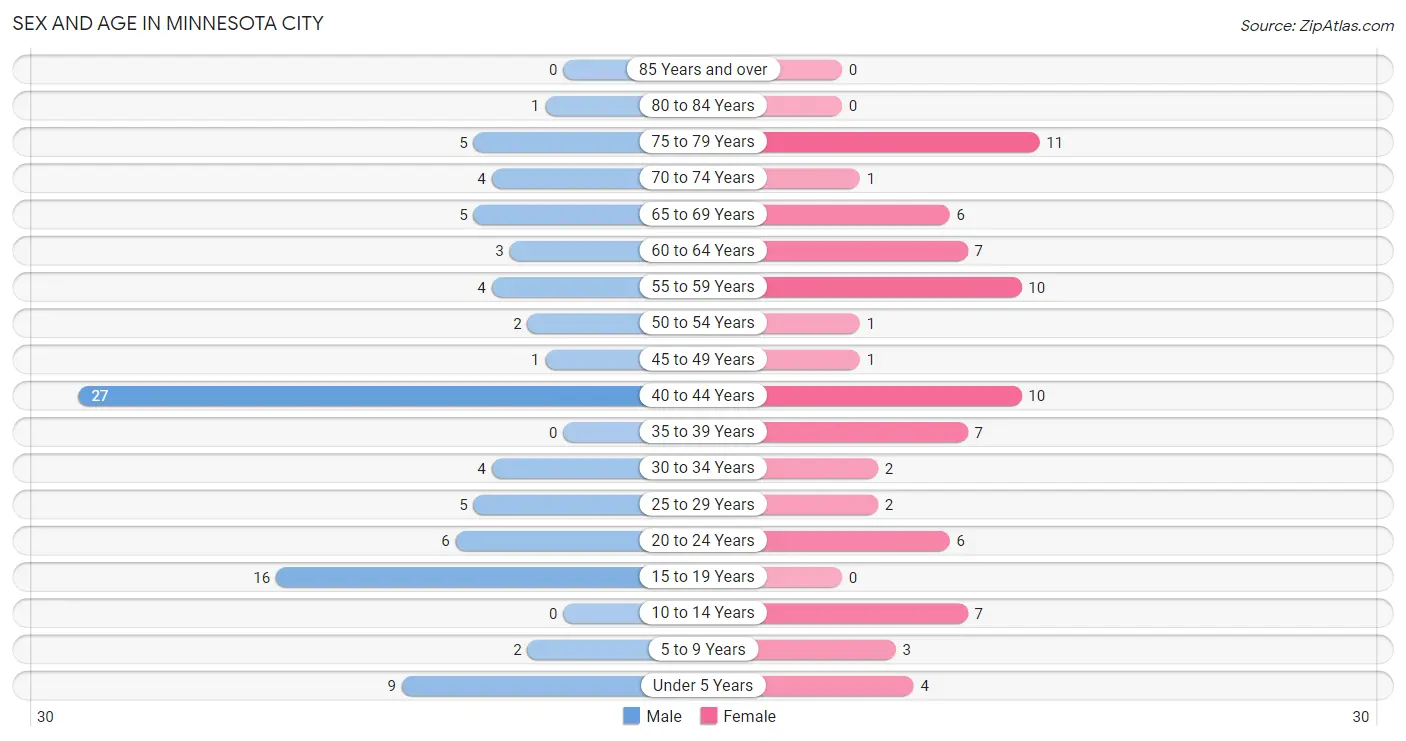
| Age Bracket | Male | Female |
| Under 5 Years | 9 (9.6%) | 4 (5.1%) |
| 5 to 9 Years | 2 (2.1%) | 3 (3.8%) |
| 10 to 14 Years | 0 (0.0%) | 7 (9.0%) |
| 15 to 19 Years | 16 (17.0%) | 0 (0.0%) |
| 20 to 24 Years | 6 (6.4%) | 6 (7.7%) |
| 25 to 29 Years | 5 (5.3%) | 2 (2.6%) |
| 30 to 34 Years | 4 (4.3%) | 2 (2.6%) |
| 35 to 39 Years | 0 (0.0%) | 7 (9.0%) |
| 40 to 44 Years | 27 (28.7%) | 10 (12.8%) |
| 45 to 49 Years | 1 (1.1%) | 1 (1.3%) |
| 50 to 54 Years | 2 (2.1%) | 1 (1.3%) |
| 55 to 59 Years | 4 (4.3%) | 10 (12.8%) |
| 60 to 64 Years | 3 (3.2%) | 7 (9.0%) |
| 65 to 69 Years | 5 (5.3%) | 6 (7.7%) |
| 70 to 74 Years | 4 (4.3%) | 1 (1.3%) |
| 75 to 79 Years | 5 (5.3%) | 11 (14.1%) |
| 80 to 84 Years | 1 (1.1%) | 0 (0.0%) |
| 85 Years and over | 0 (0.0%) | 0 (0.0%) |
| Total | 94 (100.0%) | 78 (100.0%) |
Families and Households in Minnesota City
Median Family Size in Minnesota City
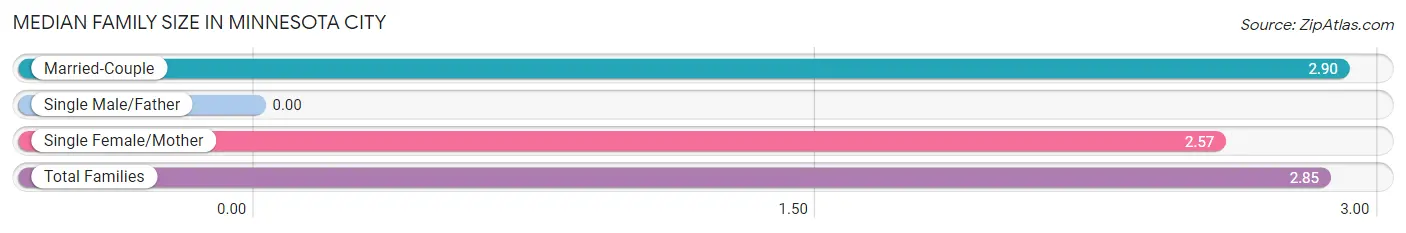
| Family Type | # Families | Family Size |
| Married-Couple | 39 (84.8%) | 2.90 |
| Single Male/Father | 0 (0.0%) | - |
| Single Female/Mother | 7 (15.2%) | 2.57 |
| Total Families | 46 (100.0%) | 2.85 |
Median Household Size in Minnesota City

| Household Type | # Households | Household Size |
| Married-Couple | 39 (54.2%) | 2.90 |
| Single Male/Father | 0 (0.0%) | - |
| Single Female/Mother | 7 (9.7%) | 2.57 |
| Non-family | 26 (36.1%) | 1.58 |
| Total Households | 72 (100.0%) | 2.39 |
Household Size by Marriage Status in Minnesota City
Out of a total of 72 households in Minnesota City, 46 (63.9%) are family households, while 26 (36.1%) are nonfamily households. The most numerous type of family households are 2-person households, comprising 25, and the most common type of nonfamily households are 1-person households, comprising 19.
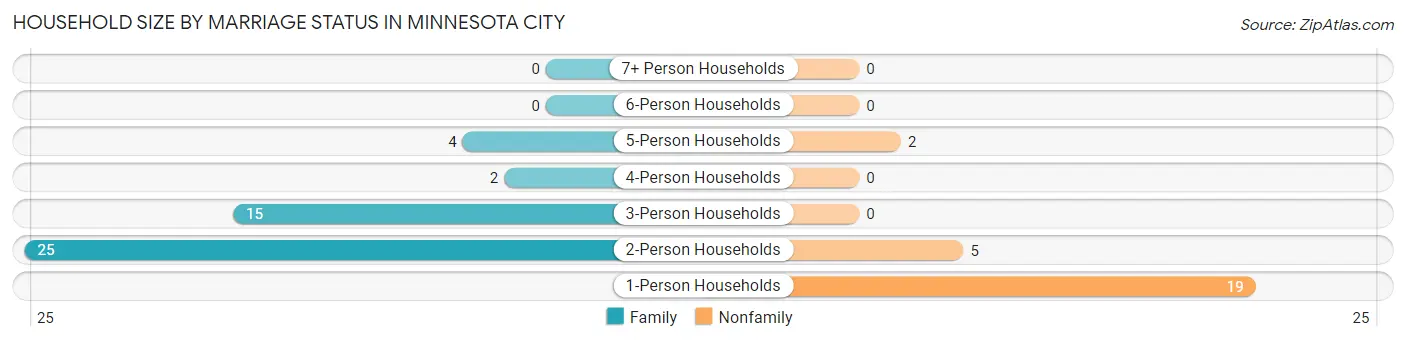
| Household Size | Family Households | Nonfamily Households |
| 1-Person Households | - | 19 (26.4%) |
| 2-Person Households | 25 (34.7%) | 5 (6.9%) |
| 3-Person Households | 15 (20.8%) | 0 (0.0%) |
| 4-Person Households | 2 (2.8%) | 0 (0.0%) |
| 5-Person Households | 4 (5.6%) | 2 (2.8%) |
| 6-Person Households | 0 (0.0%) | 0 (0.0%) |
| 7+ Person Households | 0 (0.0%) | 0 (0.0%) |
| Total | 46 (63.9%) | 26 (36.1%) |
Female Fertility in Minnesota City
Fertility by Age in Minnesota City
Average fertility rate in Minnesota City is 71.0 births per 1,000 women. Women in the age bracket of 35 to 50 years have the highest fertility rate with 111.0 births per 1,000 women. Women in the age bracket of 35 to 50 years acount for 100.0% of all women with births.
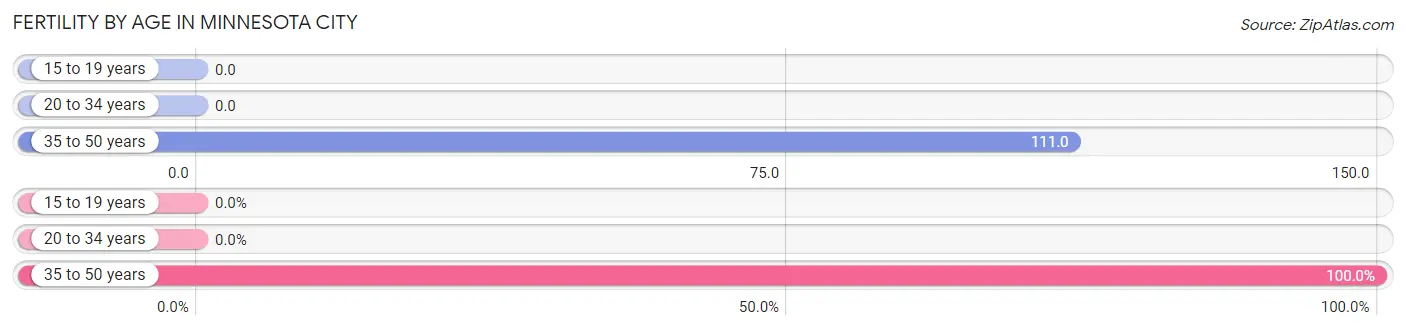
| Age Bracket | Women with Births | Births / 1,000 Women |
| 15 to 19 years | 0 (0.0%) | 0.0 |
| 20 to 34 years | 0 (0.0%) | 0.0 |
| 35 to 50 years | 2 (100.0%) | 111.0 |
| Total | 2 (100.0%) | 71.0 |
Fertility by Age by Marriage Status in Minnesota City
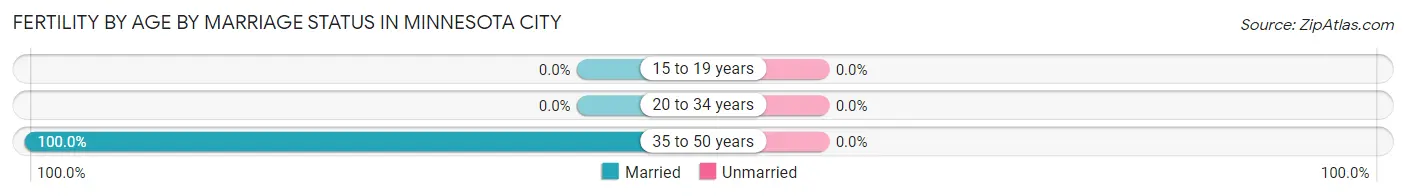
| Age Bracket | Married | Unmarried |
| 15 to 19 years | 0 (0.0%) | 0 (0.0%) |
| 20 to 34 years | 0 (0.0%) | 0 (0.0%) |
| 35 to 50 years | 2 (100.0%) | 0 (0.0%) |
| Total | 2 (100.0%) | 0 (0.0%) |
Fertility by Education in Minnesota City
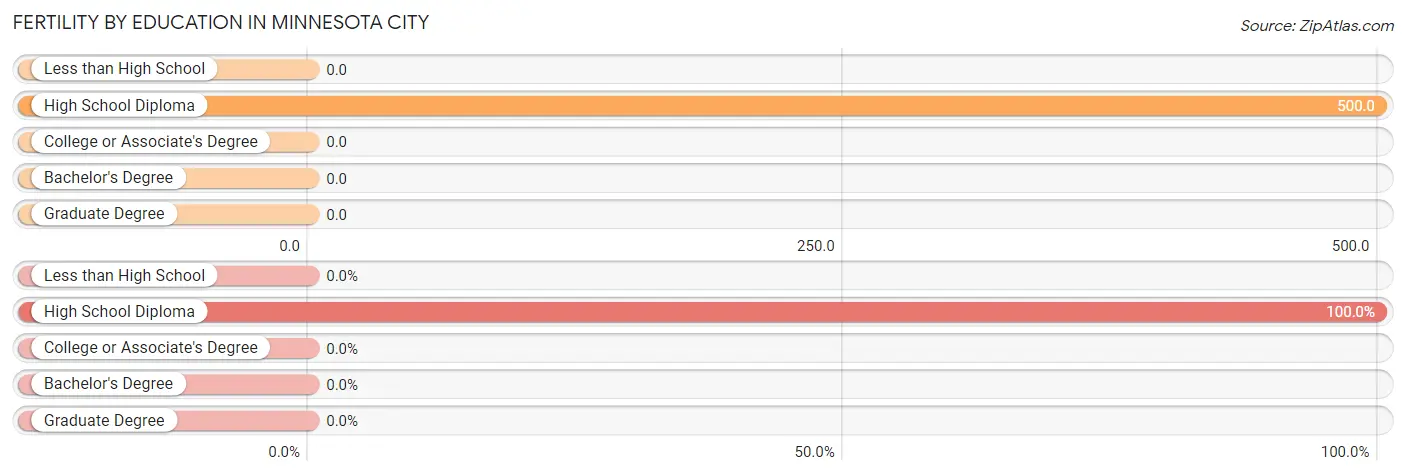
| Educational Attainment | Women with Births | Births / 1,000 Women |
| Less than High School | 0 (0.0%) | 0.0 |
| High School Diploma | 2 (100.0%) | 500.0 |
| College or Associate's Degree | 0 (0.0%) | 0.0 |
| Bachelor's Degree | 0 (0.0%) | 0.0 |
| Graduate Degree | 0 (0.0%) | 0.0 |
| Total | 2 (100.0%) | 71.0 |
Fertility by Education by Marriage Status in Minnesota City
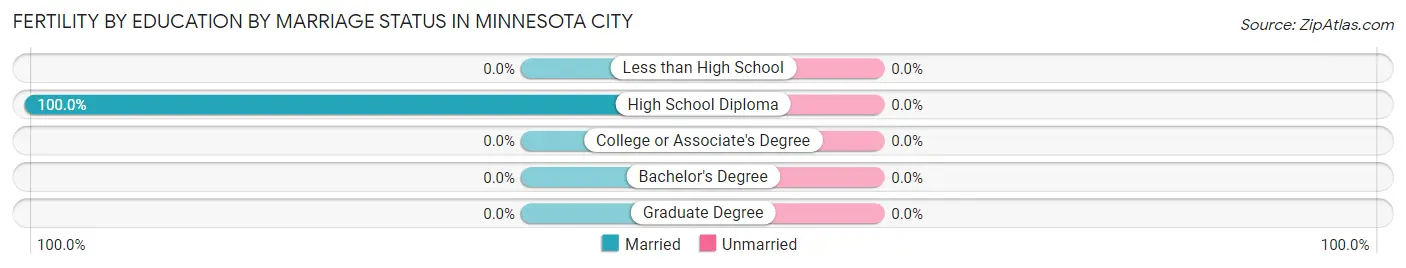
| Educational Attainment | Married | Unmarried |
| Less than High School | 0 (0.0%) | 0 (0.0%) |
| High School Diploma | 2 (100.0%) | 0 (0.0%) |
| College or Associate's Degree | 0 (0.0%) | 0 (0.0%) |
| Bachelor's Degree | 0 (0.0%) | 0 (0.0%) |
| Graduate Degree | 0 (0.0%) | 0 (0.0%) |
| Total | 2 (100.0%) | 0 (0.0%) |
Employment Characteristics in Minnesota City
Employment by Class of Employer in Minnesota City
Among the 92 employed individuals in Minnesota City, private company employees (68 | 73.9%), self-employed (not incorporated) (10 | 10.9%), and not-for-profit organizations (9 | 9.8%) make up the most common classes of employment.
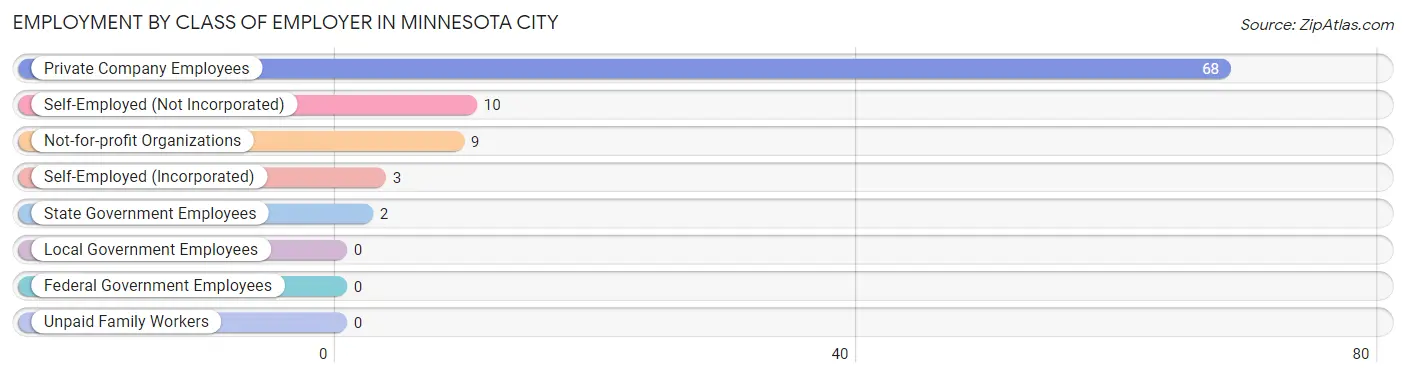
| Employer Class | # Employees | % Employees |
| Private Company Employees | 68 | 73.9% |
| Self-Employed (Incorporated) | 3 | 3.3% |
| Self-Employed (Not Incorporated) | 10 | 10.9% |
| Not-for-profit Organizations | 9 | 9.8% |
| Local Government Employees | 0 | 0.0% |
| State Government Employees | 2 | 2.2% |
| Federal Government Employees | 0 | 0.0% |
| Unpaid Family Workers | 0 | 0.0% |
| Total | 92 | 100.0% |
Employment Status by Age in Minnesota City
According to the labor force statistics for Minnesota City, out of the total population over 16 years of age (147), 70.1% or 103 individuals are in the labor force, with 10.7% or 11 of them unemployed. The age group with the highest labor force participation rate is 20 to 24 years, with 100.0% or 12 individuals in the labor force. Within the labor force, the 16 to 19 years age range has the highest percentage of unemployed individuals, with 100.0% or 9 of them being unemployed.
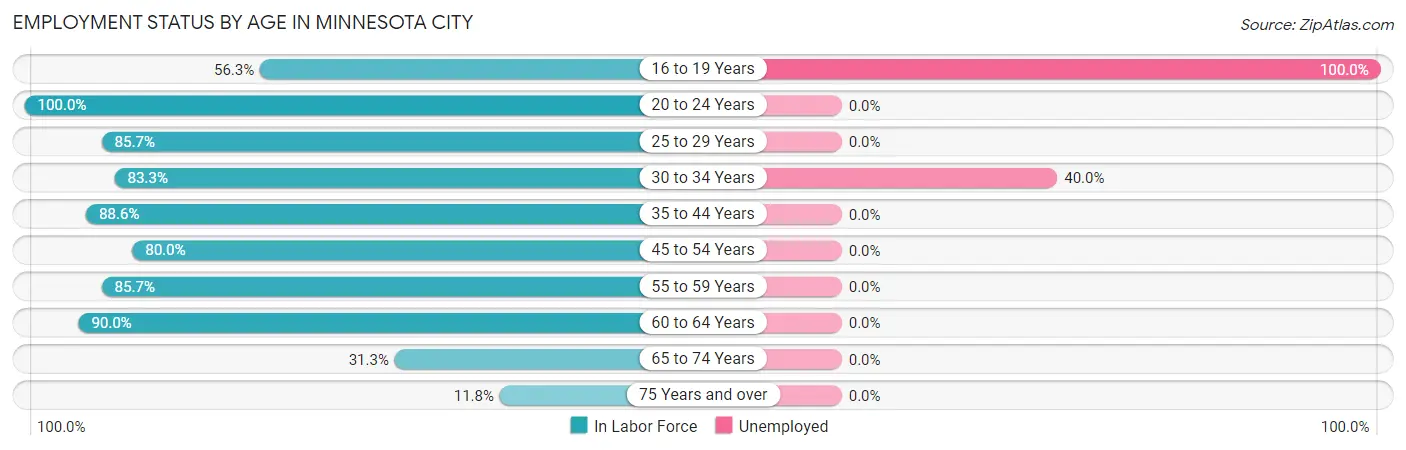
| Age Bracket | In Labor Force | Unemployed |
| 16 to 19 Years | 9 (56.3%) | 9 (100.0%) |
| 20 to 24 Years | 12 (100.0%) | 0 (0.0%) |
| 25 to 29 Years | 6 (85.7%) | 0 (0.0%) |
| 30 to 34 Years | 5 (83.3%) | 2 (40.0%) |
| 35 to 44 Years | 39 (88.6%) | 0 (0.0%) |
| 45 to 54 Years | 4 (80.0%) | 0 (0.0%) |
| 55 to 59 Years | 12 (85.7%) | 0 (0.0%) |
| 60 to 64 Years | 9 (90.0%) | 0 (0.0%) |
| 65 to 74 Years | 5 (31.3%) | 0 (0.0%) |
| 75 Years and over | 2 (11.8%) | 0 (0.0%) |
| Total | 103 (70.1%) | 11 (10.7%) |
Employment Status by Educational Attainment in Minnesota City
According to labor force statistics for Minnesota City, 87.2% of individuals (75) out of the total population between 25 and 64 years of age (86) are in the labor force, with 2.7% or 2 of them being unemployed. The group with the highest labor force participation rate are those with the educational attainment of high school diploma, with 100.0% or 26 individuals in the labor force. Within the labor force, individuals with less than high school education have the highest percentage of unemployment, with 22.2% or 2 of them being unemployed.
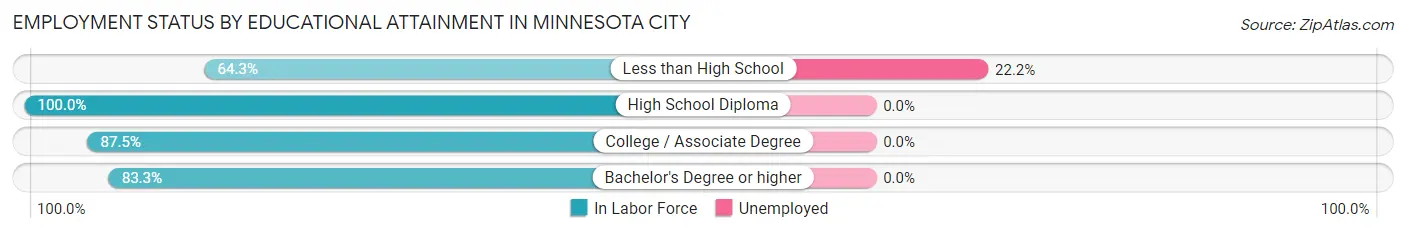
| Educational Attainment | In Labor Force | Unemployed |
| Less than High School | 9 (64.3%) | 3 (22.2%) |
| High School Diploma | 26 (100.0%) | 0 (0.0%) |
| College / Associate Degree | 35 (87.5%) | 0 (0.0%) |
| Bachelor's Degree or higher | 5 (83.3%) | 0 (0.0%) |
| Total | 75 (87.2%) | 2 (2.7%) |
Employment Occupations by Sex in Minnesota City
Management, Business, Science and Arts Occupations
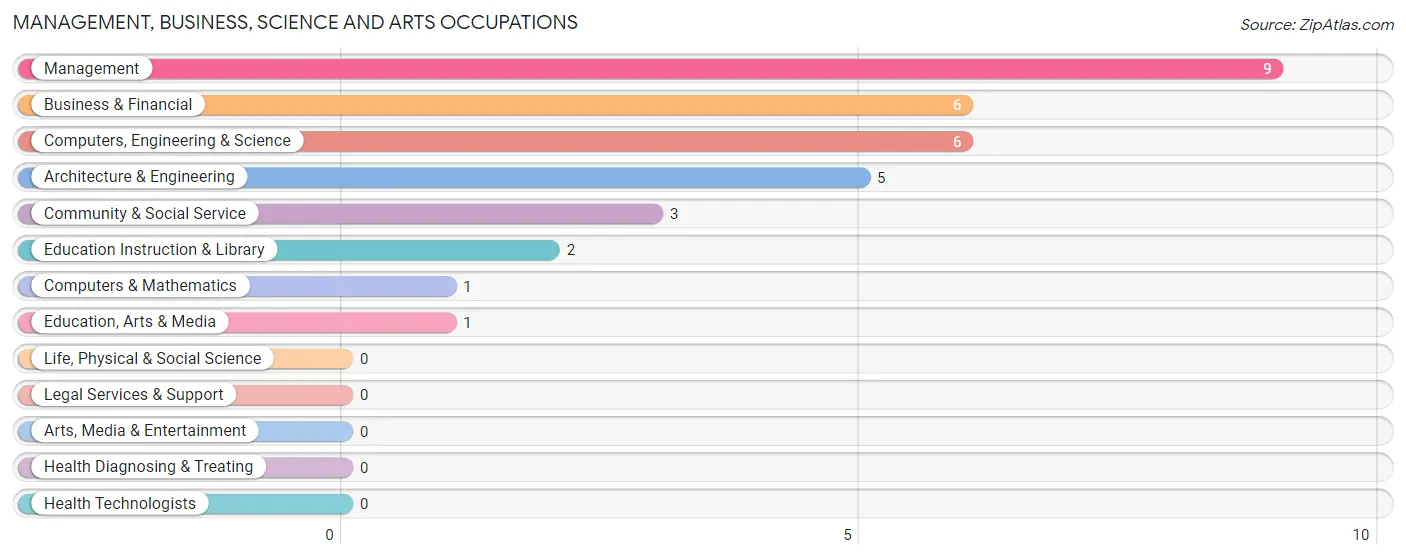
The most common Management, Business, Science and Arts occupations in Minnesota City are Management (9 | 9.8%), Business & Financial (6 | 6.5%), Computers, Engineering & Science (6 | 6.5%), Architecture & Engineering (5 | 5.4%), and Community & Social Service (3 | 3.3%).
Management, Business, Science and Arts Occupations by Sex
Within the Management, Business, Science and Arts occupations in Minnesota City, the most male-oriented occupations are Business & Financial (100.0%), Computers & Mathematics (100.0%), and Education, Arts & Media (100.0%), while the most female-oriented occupations are Education Instruction & Library (100.0%), Community & Social Service (66.7%), and Architecture & Engineering (60.0%).
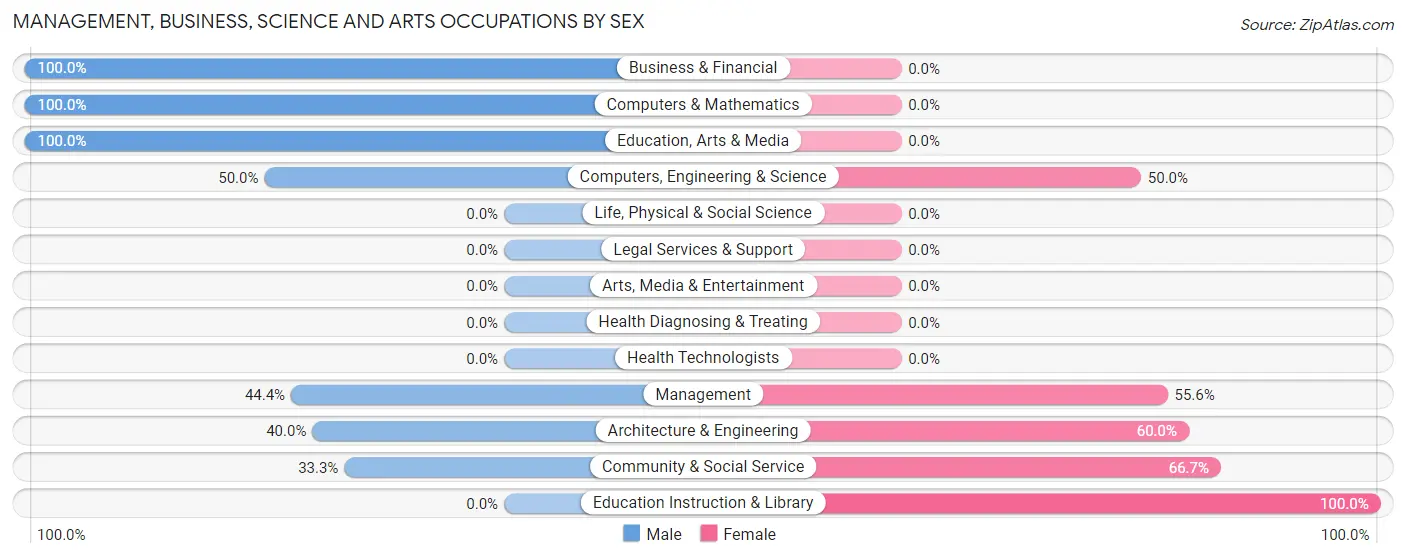
| Occupation | Male | Female |
| Management | 4 (44.4%) | 5 (55.6%) |
| Business & Financial | 6 (100.0%) | 0 (0.0%) |
| Computers, Engineering & Science | 3 (50.0%) | 3 (50.0%) |
| Computers & Mathematics | 1 (100.0%) | 0 (0.0%) |
| Architecture & Engineering | 2 (40.0%) | 3 (60.0%) |
| Life, Physical & Social Science | 0 (0.0%) | 0 (0.0%) |
| Community & Social Service | 1 (33.3%) | 2 (66.7%) |
| Education, Arts & Media | 1 (100.0%) | 0 (0.0%) |
| Legal Services & Support | 0 (0.0%) | 0 (0.0%) |
| Education Instruction & Library | 0 (0.0%) | 2 (100.0%) |
| Arts, Media & Entertainment | 0 (0.0%) | 0 (0.0%) |
| Health Diagnosing & Treating | 0 (0.0%) | 0 (0.0%) |
| Health Technologists | 0 (0.0%) | 0 (0.0%) |
| Total (Category) | 14 (58.3%) | 10 (41.7%) |
| Total (Overall) | 52 (56.5%) | 40 (43.5%) |
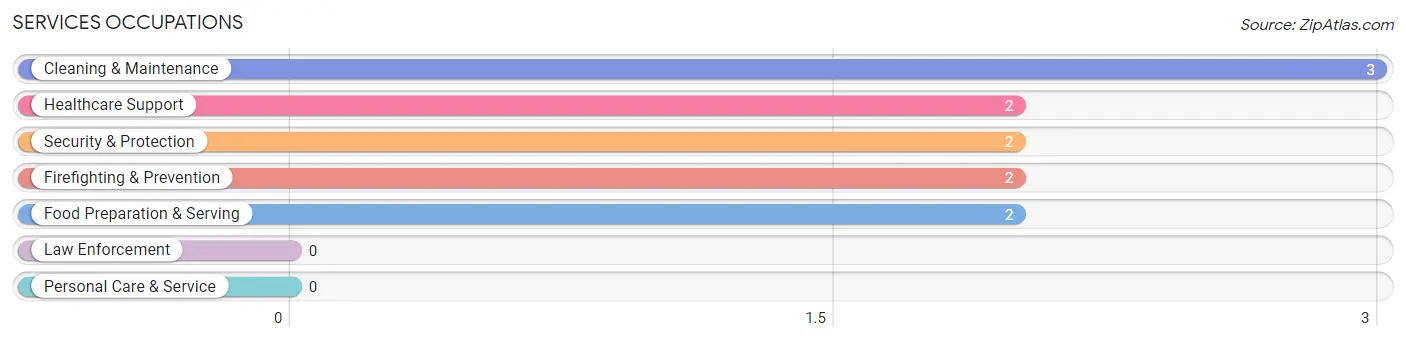
Services Occupations
The most common Services occupations in Minnesota City are Cleaning & Maintenance (3 | 3.3%), Healthcare Support (2 | 2.2%), Security & Protection (2 | 2.2%), Firefighting & Prevention (2 | 2.2%), and Food Preparation & Serving (2 | 2.2%).
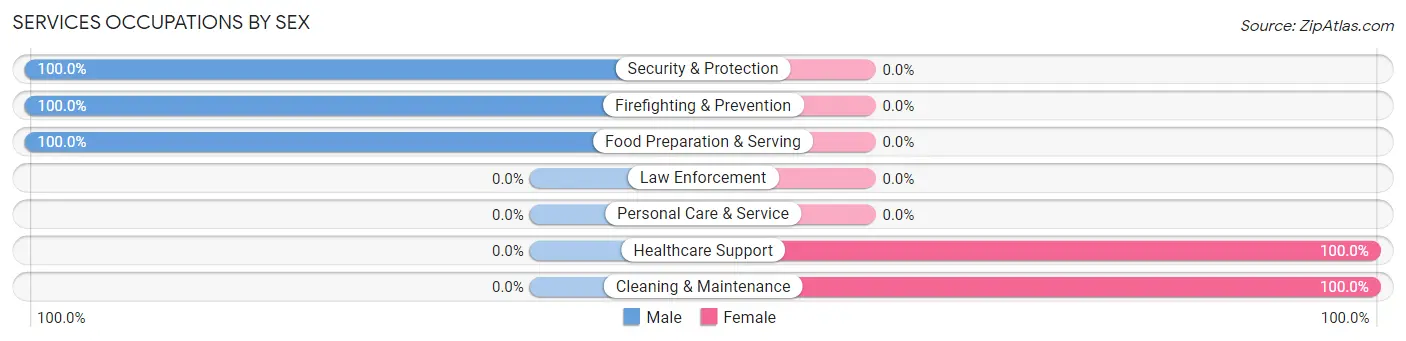
Services Occupations by Sex
Within the Services occupations in Minnesota City, the most male-oriented occupations are Security & Protection (100.0%), Firefighting & Prevention (100.0%), and Food Preparation & Serving (100.0%), while the most female-oriented occupations are Healthcare Support (100.0%), and Cleaning & Maintenance (100.0%).
| Occupation | Male | Female |
| Healthcare Support | 0 (0.0%) | 2 (100.0%) |
| Security & Protection | 2 (100.0%) | 0 (0.0%) |
| Firefighting & Prevention | 2 (100.0%) | 0 (0.0%) |
| Law Enforcement | 0 (0.0%) | 0 (0.0%) |
| Food Preparation & Serving | 2 (100.0%) | 0 (0.0%) |
| Cleaning & Maintenance | 0 (0.0%) | 3 (100.0%) |
| Personal Care & Service | 0 (0.0%) | 0 (0.0%) |
| Total (Category) | 4 (44.4%) | 5 (55.6%) |
| Total (Overall) | 52 (56.5%) | 40 (43.5%) |
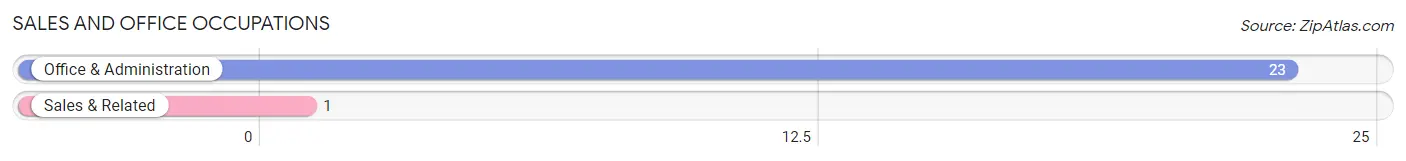
Sales and Office Occupations
The most common Sales and Office occupations in Minnesota City are Office & Administration (23 | 25.0%), and Sales & Related (1 | 1.1%).
Sales and Office Occupations by Sex

| Occupation | Male | Female |
| Sales & Related | 0 (0.0%) | 1 (100.0%) |
| Office & Administration | 4 (17.4%) | 19 (82.6%) |
| Total (Category) | 4 (16.7%) | 20 (83.3%) |
| Total (Overall) | 52 (56.5%) | 40 (43.5%) |
Natural Resources, Construction and Maintenance Occupations
The most common Natural Resources, Construction and Maintenance occupations in Minnesota City are Construction & Extraction (9 | 9.8%), and Installation, Maintenance & Repair (4 | 4.3%).

Natural Resources, Construction and Maintenance Occupations by Sex

| Occupation | Male | Female |
| Farming, Fishing & Forestry | 0 (0.0%) | 0 (0.0%) |
| Construction & Extraction | 9 (100.0%) | 0 (0.0%) |
| Installation, Maintenance & Repair | 2 (50.0%) | 2 (50.0%) |
| Total (Category) | 11 (84.6%) | 2 (15.4%) |
| Total (Overall) | 52 (56.5%) | 40 (43.5%) |
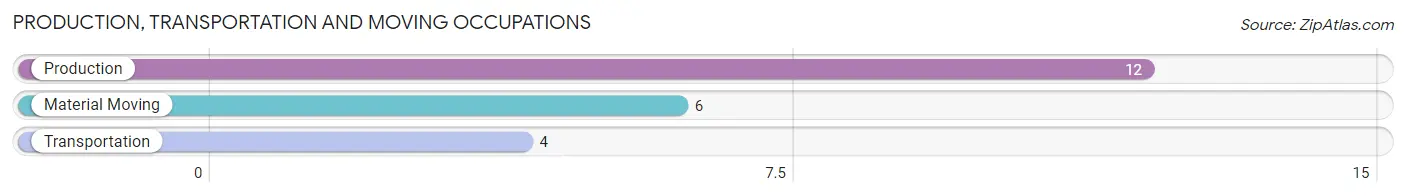
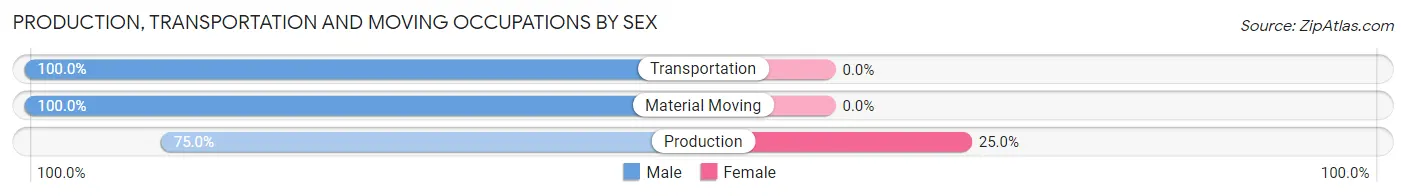
Production, Transportation and Moving Occupations
The most common Production, Transportation and Moving occupations in Minnesota City are Production (12 | 13.0%), Material Moving (6 | 6.5%), and Transportation (4 | 4.3%).
Production, Transportation and Moving Occupations by Sex
| Occupation | Male | Female |
| Production | 9 (75.0%) | 3 (25.0%) |
| Transportation | 4 (100.0%) | 0 (0.0%) |
| Material Moving | 6 (100.0%) | 0 (0.0%) |
| Total (Category) | 19 (86.4%) | 3 (13.6%) |
| Total (Overall) | 52 (56.5%) | 40 (43.5%) |
Employment Industries by Sex in Minnesota City
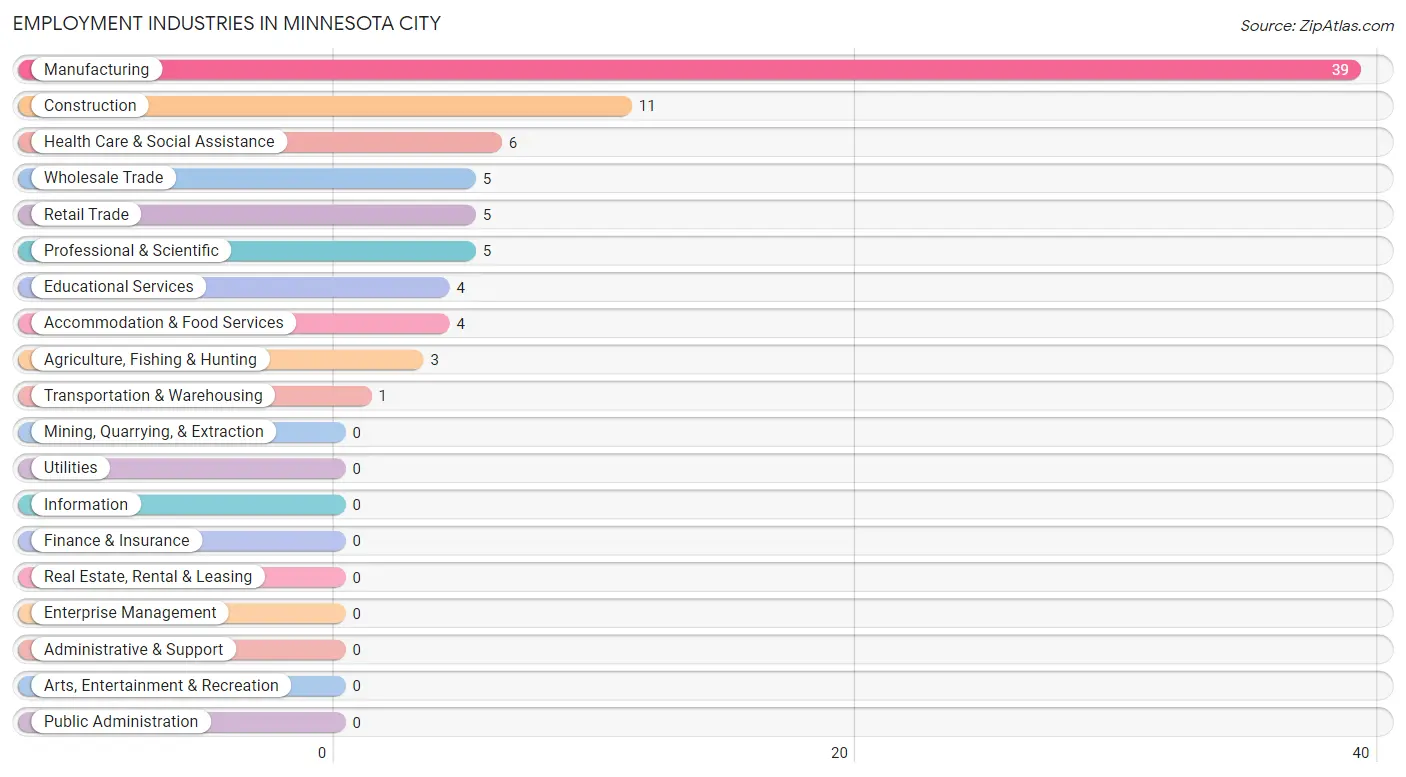
Employment Industries in Minnesota City
The major employment industries in Minnesota City include Manufacturing (39 | 42.4%), Construction (11 | 12.0%), Health Care & Social Assistance (6 | 6.5%), Wholesale Trade (5 | 5.4%), and Retail Trade (5 | 5.4%).
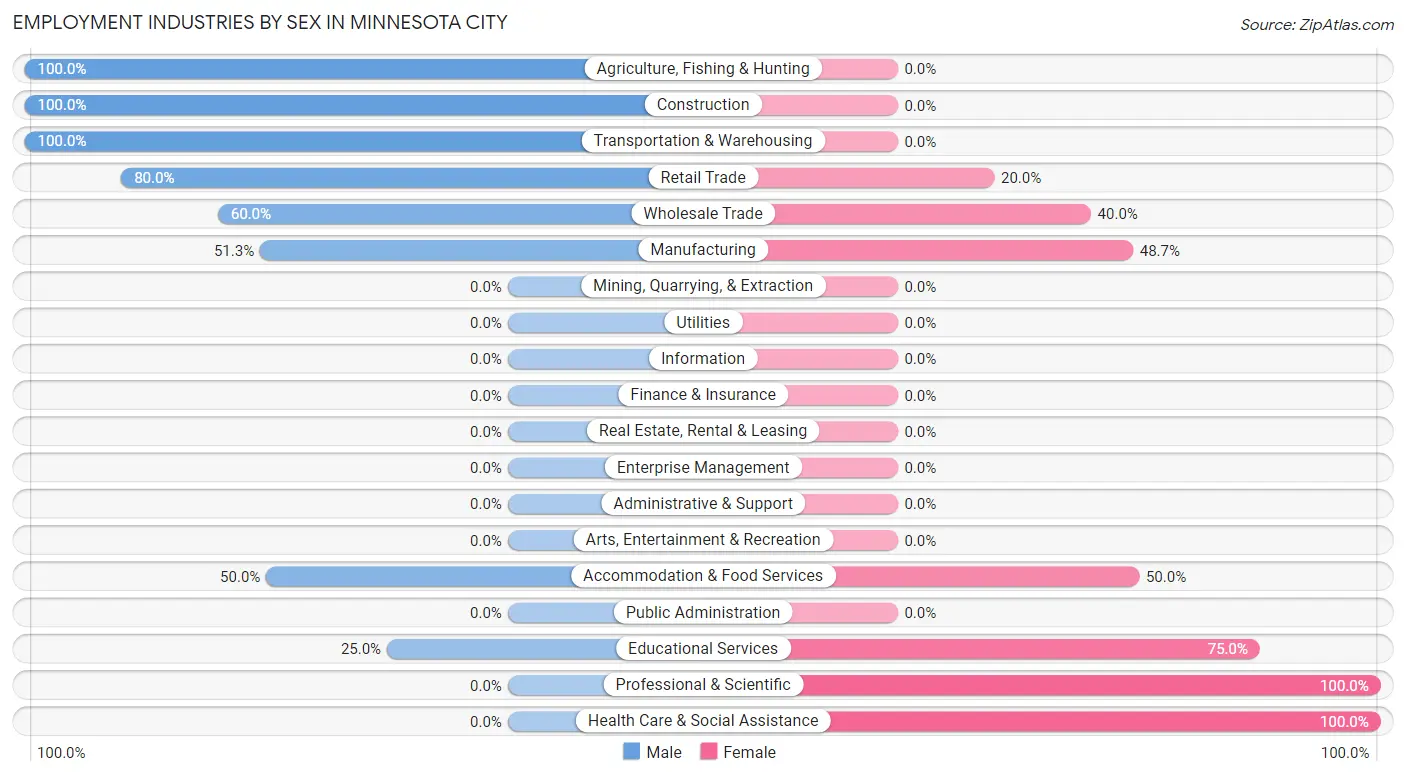
Employment Industries by Sex in Minnesota City
The Minnesota City industries that see more men than women are Agriculture, Fishing & Hunting (100.0%), Construction (100.0%), and Transportation & Warehousing (100.0%), whereas the industries that tend to have a higher number of women are Professional & Scientific (100.0%), Health Care & Social Assistance (100.0%), and Educational Services (75.0%).
| Industry | Male | Female |
| Agriculture, Fishing & Hunting | 3 (100.0%) | 0 (0.0%) |
| Mining, Quarrying, & Extraction | 0 (0.0%) | 0 (0.0%) |
| Construction | 11 (100.0%) | 0 (0.0%) |
| Manufacturing | 20 (51.3%) | 19 (48.7%) |
| Wholesale Trade | 3 (60.0%) | 2 (40.0%) |
| Retail Trade | 4 (80.0%) | 1 (20.0%) |
| Transportation & Warehousing | 1 (100.0%) | 0 (0.0%) |
| Utilities | 0 (0.0%) | 0 (0.0%) |
| Information | 0 (0.0%) | 0 (0.0%) |
| Finance & Insurance | 0 (0.0%) | 0 (0.0%) |
| Real Estate, Rental & Leasing | 0 (0.0%) | 0 (0.0%) |
| Professional & Scientific | 0 (0.0%) | 5 (100.0%) |
| Enterprise Management | 0 (0.0%) | 0 (0.0%) |
| Administrative & Support | 0 (0.0%) | 0 (0.0%) |
| Educational Services | 1 (25.0%) | 3 (75.0%) |
| Health Care & Social Assistance | 0 (0.0%) | 6 (100.0%) |
| Arts, Entertainment & Recreation | 0 (0.0%) | 0 (0.0%) |
| Accommodation & Food Services | 2 (50.0%) | 2 (50.0%) |
| Public Administration | 0 (0.0%) | 0 (0.0%) |
| Total | 52 (56.5%) | 40 (43.5%) |
Education in Minnesota City
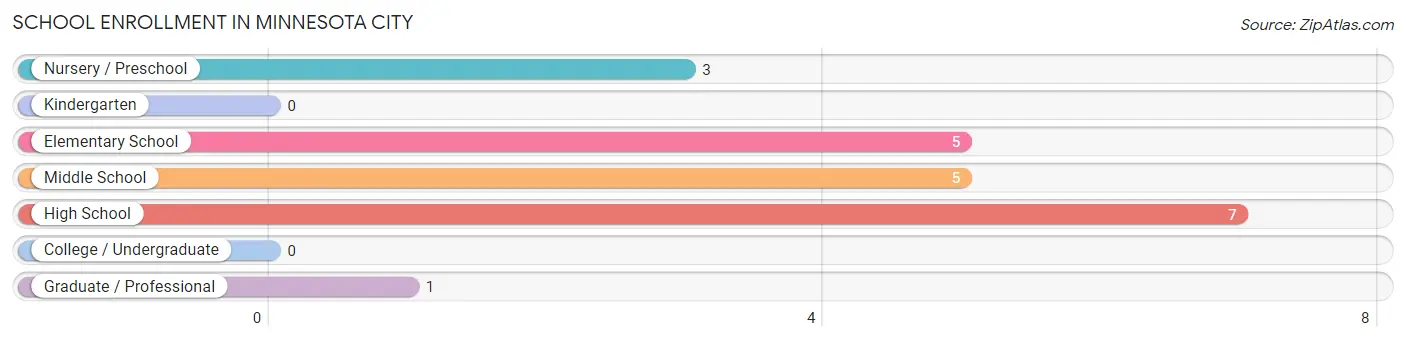
School Enrollment in Minnesota City
The most common levels of schooling among the 21 students in Minnesota City are high school (7 | 33.3%), elementary school (5 | 23.8%), and middle school (5 | 23.8%).
| School Level | # Students | % Students |
| Nursery / Preschool | 3 | 14.3% |
| Kindergarten | 0 | 0.0% |
| Elementary School | 5 | 23.8% |
| Middle School | 5 | 23.8% |
| High School | 7 | 33.3% |
| College / Undergraduate | 0 | 0.0% |
| Graduate / Professional | 1 | 4.8% |
| Total | 21 | 100.0% |
School Enrollment by Age by Funding Source in Minnesota City
Out of a total of 21 students who are enrolled in schools in Minnesota City, 3 (14.3%) attend a private institution, while the remaining 18 (85.7%) are enrolled in public schools. The age group of 20 to 24 year olds has the highest likelihood of being enrolled in private schools, with 1 (100.0% in the age bracket) enrolled. Conversely, the age group of 3 to 4 year olds has the lowest likelihood of being enrolled in a private school, with 1 (100.0% in the age bracket) attending a public institution.
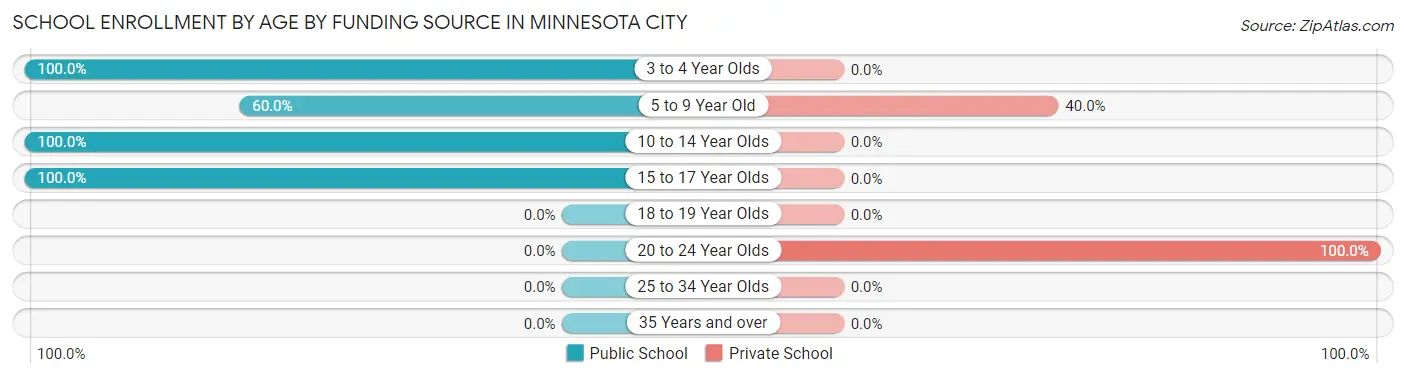
| Age Bracket | Public School | Private School |
| 3 to 4 Year Olds | 1 (100.0%) | 0 (0.0%) |
| 5 to 9 Year Old | 3 (60.0%) | 2 (40.0%) |
| 10 to 14 Year Olds | 7 (100.0%) | 0 (0.0%) |
| 15 to 17 Year Olds | 7 (100.0%) | 0 (0.0%) |
| 18 to 19 Year Olds | 0 (0.0%) | 0 (0.0%) |
| 20 to 24 Year Olds | 0 (0.0%) | 1 (100.0%) |
| 25 to 34 Year Olds | 0 (0.0%) | 0 (0.0%) |
| 35 Years and over | 0 (0.0%) | 0 (0.0%) |
| Total | 18 (85.7%) | 3 (14.3%) |
Educational Attainment by Field of Study in Minnesota City
Business (5 | 38.5%), education (4 | 30.8%), psychology (1 | 7.7%), engineering (1 | 7.7%), and liberal arts & history (1 | 7.7%) are the most common fields of study among 13 individuals in Minnesota City who have obtained a bachelor's degree or higher.
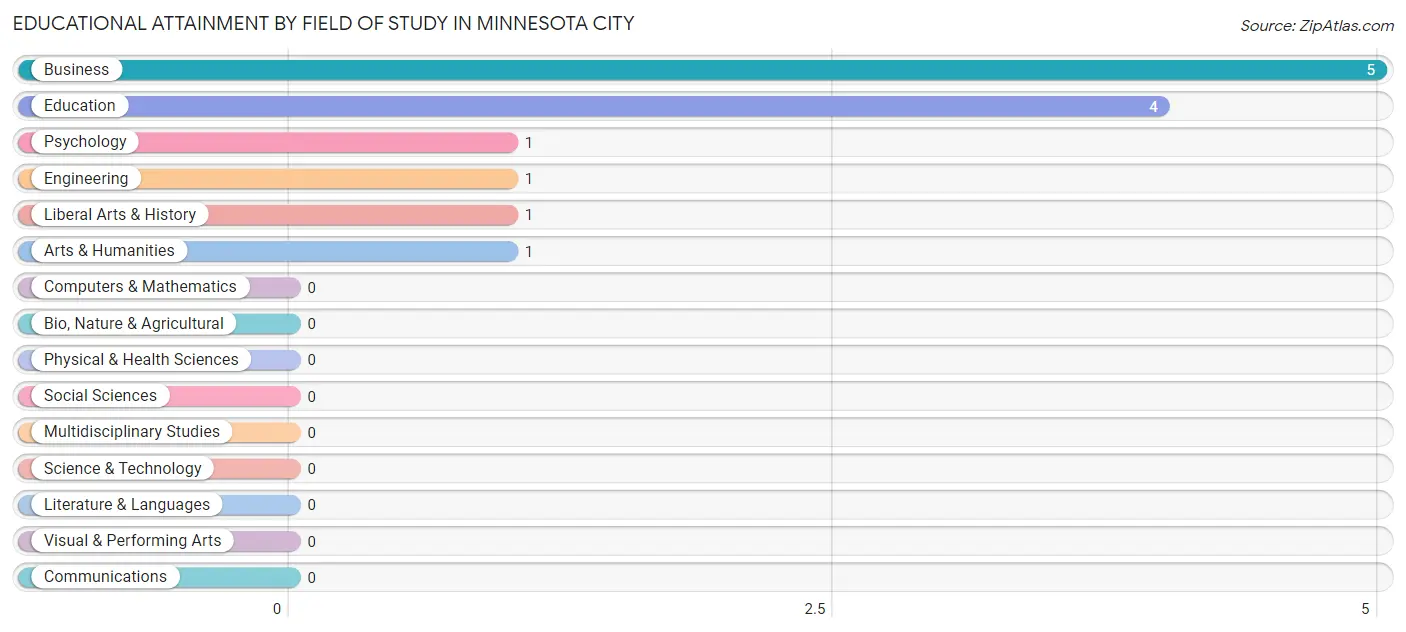
| Field of Study | # Graduates | % Graduates |
| Computers & Mathematics | 0 | 0.0% |
| Bio, Nature & Agricultural | 0 | 0.0% |
| Physical & Health Sciences | 0 | 0.0% |
| Psychology | 1 | 7.7% |
| Social Sciences | 0 | 0.0% |
| Engineering | 1 | 7.7% |
| Multidisciplinary Studies | 0 | 0.0% |
| Science & Technology | 0 | 0.0% |
| Business | 5 | 38.5% |
| Education | 4 | 30.8% |
| Literature & Languages | 0 | 0.0% |
| Liberal Arts & History | 1 | 7.7% |
| Visual & Performing Arts | 0 | 0.0% |
| Communications | 0 | 0.0% |
| Arts & Humanities | 1 | 7.7% |
| Total | 13 | 100.0% |
Transportation & Commute in Minnesota City
Vehicle Availability by Sex in Minnesota City
The most prevalent vehicle ownership categories in Minnesota City are males with 2 vehicles (31, accounting for 59.6%) and females with 2 vehicles (19, making up 77.5%).
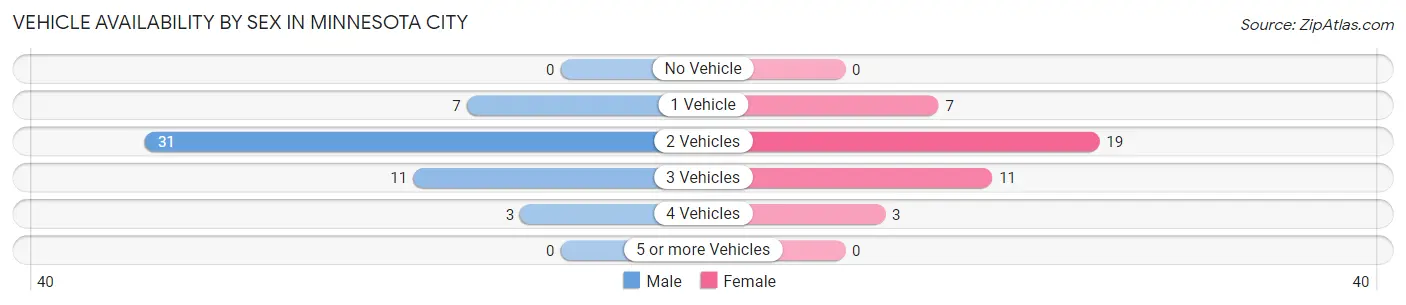
| Vehicles Available | Male | Female |
| No Vehicle | 0 (0.0%) | 0 (0.0%) |
| 1 Vehicle | 7 (13.5%) | 7 (17.5%) |
| 2 Vehicles | 31 (59.6%) | 19 (47.5%) |
| 3 Vehicles | 11 (21.1%) | 11 (27.5%) |
| 4 Vehicles | 3 (5.8%) | 3 (7.5%) |
| 5 or more Vehicles | 0 (0.0%) | 0 (0.0%) |
| Total | 52 (100.0%) | 40 (100.0%) |
Commute Time in Minnesota City
The most frequently occuring commute durations in Minnesota City are 15 to 19 minutes (36 commuters, 40.0%), 20 to 24 minutes (21 commuters, 23.3%), and 5 to 9 minutes (11 commuters, 12.2%).
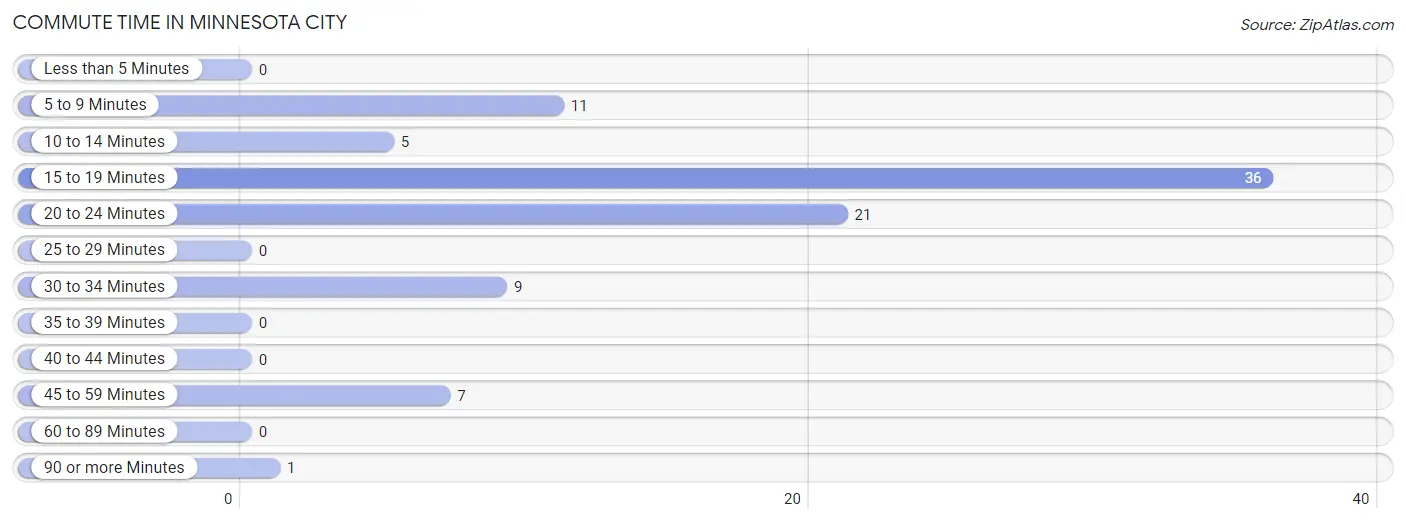
| Commute Time | # Commuters | % Commuters |
| Less than 5 Minutes | 0 | 0.0% |
| 5 to 9 Minutes | 11 | 12.2% |
| 10 to 14 Minutes | 5 | 5.6% |
| 15 to 19 Minutes | 36 | 40.0% |
| 20 to 24 Minutes | 21 | 23.3% |
| 25 to 29 Minutes | 0 | 0.0% |
| 30 to 34 Minutes | 9 | 10.0% |
| 35 to 39 Minutes | 0 | 0.0% |
| 40 to 44 Minutes | 0 | 0.0% |
| 45 to 59 Minutes | 7 | 7.8% |
| 60 to 89 Minutes | 0 | 0.0% |
| 90 or more Minutes | 1 | 1.1% |
Commute Time by Sex in Minnesota City
The most common commute times in Minnesota City are 15 to 19 minutes (21 commuters, 41.2%) for males and 15 to 19 minutes (15 commuters, 38.5%) for females.
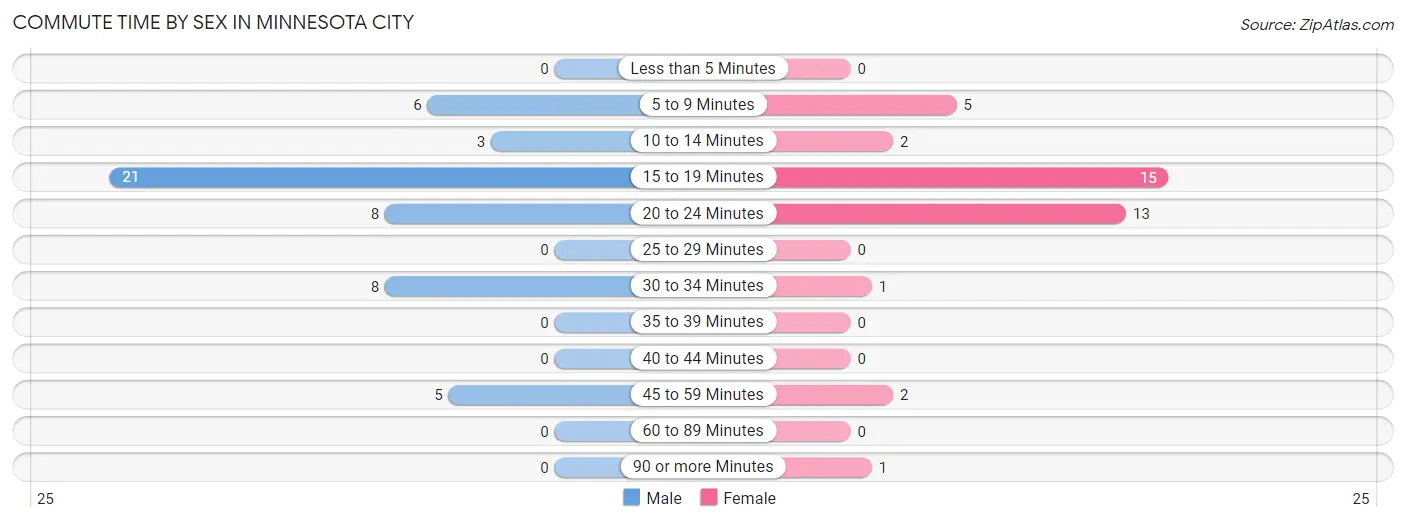
| Commute Time | Male | Female |
| Less than 5 Minutes | 0 (0.0%) | 0 (0.0%) |
| 5 to 9 Minutes | 6 (11.8%) | 5 (12.8%) |
| 10 to 14 Minutes | 3 (5.9%) | 2 (5.1%) |
| 15 to 19 Minutes | 21 (41.2%) | 15 (38.5%) |
| 20 to 24 Minutes | 8 (15.7%) | 13 (33.3%) |
| 25 to 29 Minutes | 0 (0.0%) | 0 (0.0%) |
| 30 to 34 Minutes | 8 (15.7%) | 1 (2.6%) |
| 35 to 39 Minutes | 0 (0.0%) | 0 (0.0%) |
| 40 to 44 Minutes | 0 (0.0%) | 0 (0.0%) |
| 45 to 59 Minutes | 5 (9.8%) | 2 (5.1%) |
| 60 to 89 Minutes | 0 (0.0%) | 0 (0.0%) |
| 90 or more Minutes | 0 (0.0%) | 1 (2.6%) |
Time of Departure to Work by Sex in Minnesota City
The most frequent times of departure to work in Minnesota City are 7:00 AM to 7:29 AM (14, 27.5%) for males and 7:30 AM to 7:59 AM (9, 23.1%) for females.
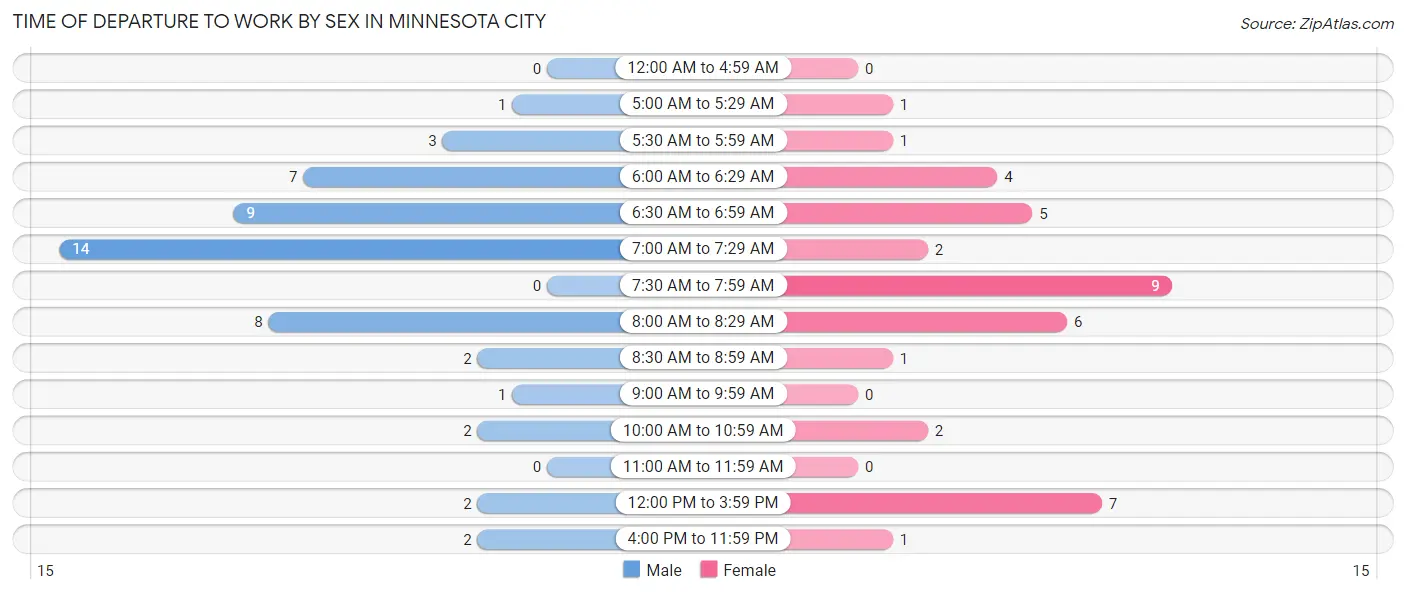
| Time of Departure | Male | Female |
| 12:00 AM to 4:59 AM | 0 (0.0%) | 0 (0.0%) |
| 5:00 AM to 5:29 AM | 1 (2.0%) | 1 (2.6%) |
| 5:30 AM to 5:59 AM | 3 (5.9%) | 1 (2.6%) |
| 6:00 AM to 6:29 AM | 7 (13.7%) | 4 (10.3%) |
| 6:30 AM to 6:59 AM | 9 (17.6%) | 5 (12.8%) |
| 7:00 AM to 7:29 AM | 14 (27.5%) | 2 (5.1%) |
| 7:30 AM to 7:59 AM | 0 (0.0%) | 9 (23.1%) |
| 8:00 AM to 8:29 AM | 8 (15.7%) | 6 (15.4%) |
| 8:30 AM to 8:59 AM | 2 (3.9%) | 1 (2.6%) |
| 9:00 AM to 9:59 AM | 1 (2.0%) | 0 (0.0%) |
| 10:00 AM to 10:59 AM | 2 (3.9%) | 2 (5.1%) |
| 11:00 AM to 11:59 AM | 0 (0.0%) | 0 (0.0%) |
| 12:00 PM to 3:59 PM | 2 (3.9%) | 7 (17.9%) |
| 4:00 PM to 11:59 PM | 2 (3.9%) | 1 (2.6%) |
| Total | 51 (100.0%) | 39 (100.0%) |
Housing Occupancy in Minnesota City
Occupancy by Ownership in Minnesota City
Of the total 72 dwellings in Minnesota City, owner-occupied units account for 60 (83.3%), while renter-occupied units make up 12 (16.7%).
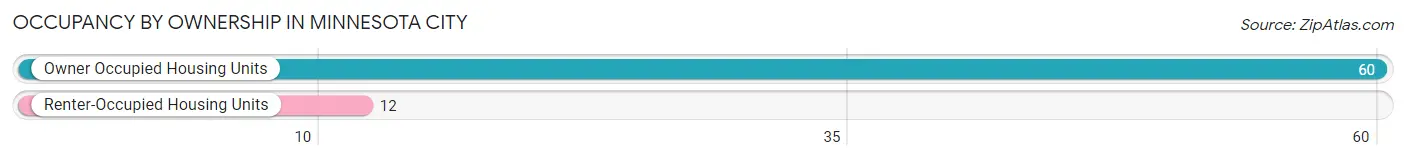
| Occupancy | # Housing Units | % Housing Units |
| Owner Occupied Housing Units | 60 | 83.3% |
| Renter-Occupied Housing Units | 12 | 16.7% |
| Total Occupied Housing Units | 72 | 100.0% |
Occupancy by Household Size in Minnesota City
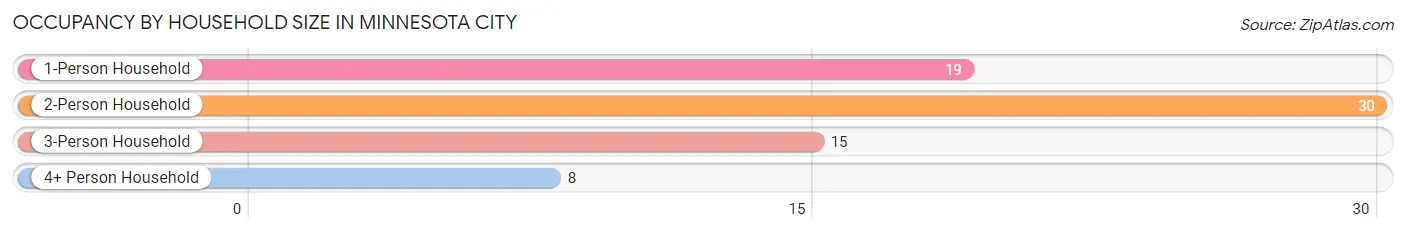
| Household Size | # Housing Units | % Housing Units |
| 1-Person Household | 19 | 26.4% |
| 2-Person Household | 30 | 41.7% |
| 3-Person Household | 15 | 20.8% |
| 4+ Person Household | 8 | 11.1% |
| Total Housing Units | 72 | 100.0% |
Occupancy by Ownership by Household Size in Minnesota City
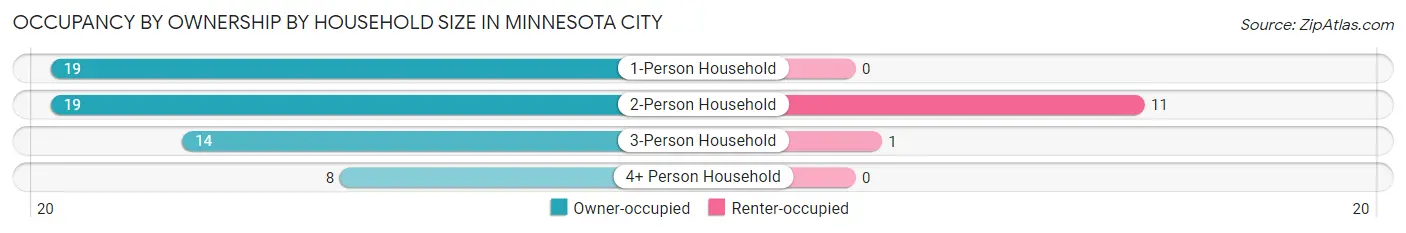
| Household Size | Owner-occupied | Renter-occupied |
| 1-Person Household | 19 (100.0%) | 0 (0.0%) |
| 2-Person Household | 19 (63.3%) | 11 (36.7%) |
| 3-Person Household | 14 (93.3%) | 1 (6.7%) |
| 4+ Person Household | 8 (100.0%) | 0 (0.0%) |
| Total Housing Units | 60 (83.3%) | 12 (16.7%) |
Occupancy by Educational Attainment in Minnesota City
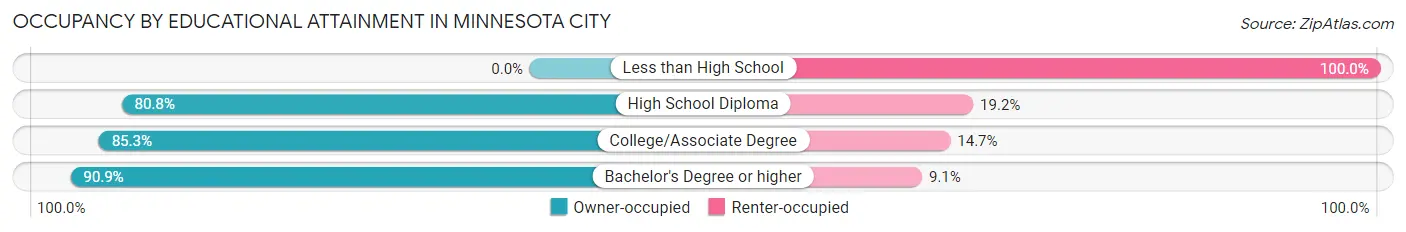
| Household Size | Owner-occupied | Renter-occupied |
| Less than High School | 0 (0.0%) | 1 (100.0%) |
| High School Diploma | 21 (80.8%) | 5 (19.2%) |
| College/Associate Degree | 29 (85.3%) | 5 (14.7%) |
| Bachelor's Degree or higher | 10 (90.9%) | 1 (9.1%) |
Occupancy by Age of Householder in Minnesota City
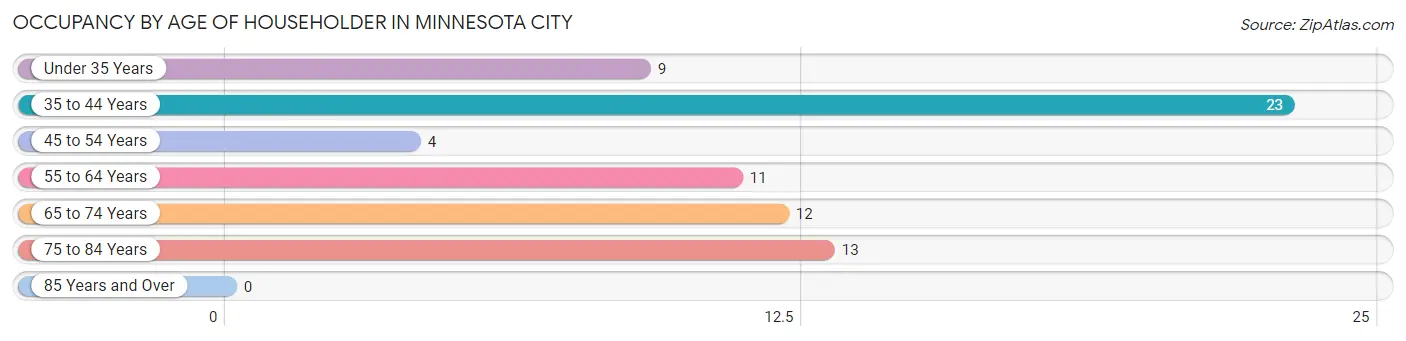
| Age Bracket | # Households | % Households |
| Under 35 Years | 9 | 12.5% |
| 35 to 44 Years | 23 | 31.9% |
| 45 to 54 Years | 4 | 5.6% |
| 55 to 64 Years | 11 | 15.3% |
| 65 to 74 Years | 12 | 16.7% |
| 75 to 84 Years | 13 | 18.1% |
| 85 Years and Over | 0 | 0.0% |
| Total | 72 | 100.0% |
Housing Finances in Minnesota City
Median Income by Occupancy in Minnesota City
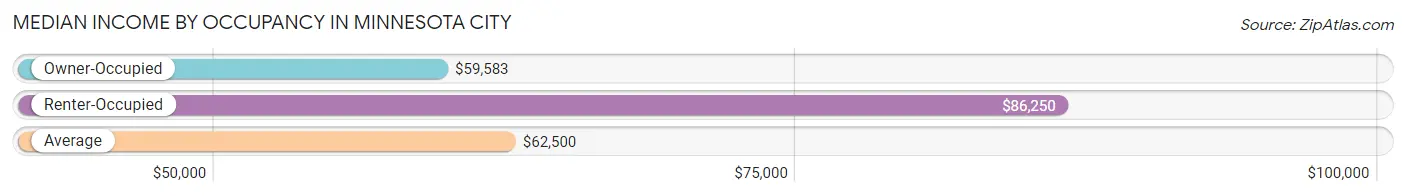
| Occupancy Type | # Households | Median Income |
| Owner-Occupied | 60 (83.3%) | $59,583 |
| Renter-Occupied | 12 (16.7%) | $86,250 |
| Average | 72 (100.0%) | $62,500 |
Occupancy by Householder Income Bracket in Minnesota City
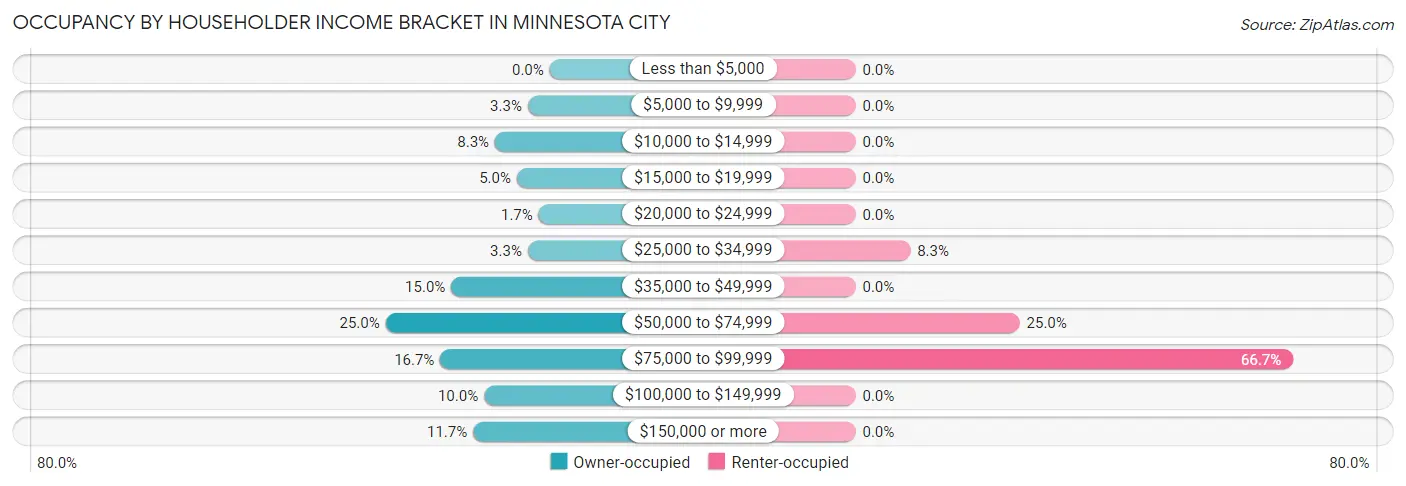
| Income Bracket | Owner-occupied | Renter-occupied |
| Less than $5,000 | 0 (0.0%) | 0 (0.0%) |
| $5,000 to $9,999 | 2 (3.3%) | 0 (0.0%) |
| $10,000 to $14,999 | 5 (8.3%) | 0 (0.0%) |
| $15,000 to $19,999 | 3 (5.0%) | 0 (0.0%) |
| $20,000 to $24,999 | 1 (1.7%) | 0 (0.0%) |
| $25,000 to $34,999 | 2 (3.3%) | 1 (8.3%) |
| $35,000 to $49,999 | 9 (15.0%) | 0 (0.0%) |
| $50,000 to $74,999 | 15 (25.0%) | 3 (25.0%) |
| $75,000 to $99,999 | 10 (16.7%) | 8 (66.7%) |
| $100,000 to $149,999 | 6 (10.0%) | 0 (0.0%) |
| $150,000 or more | 7 (11.7%) | 0 (0.0%) |
| Total | 60 (100.0%) | 12 (100.0%) |
Monthly Housing Cost Tiers in Minnesota City
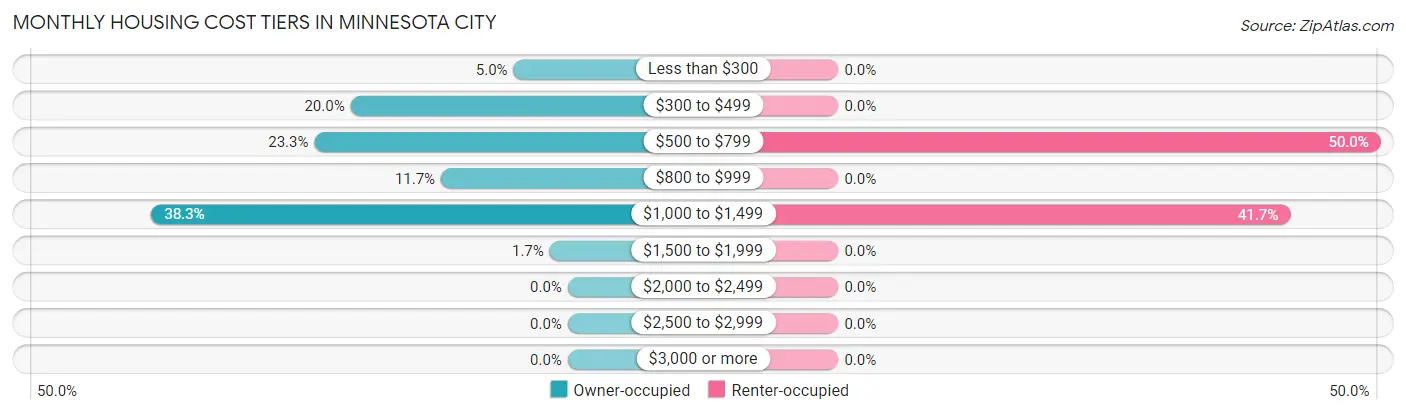
| Monthly Cost | Owner-occupied | Renter-occupied |
| Less than $300 | 3 (5.0%) | 0 (0.0%) |
| $300 to $499 | 12 (20.0%) | 0 (0.0%) |
| $500 to $799 | 14 (23.3%) | 6 (50.0%) |
| $800 to $999 | 7 (11.7%) | 0 (0.0%) |
| $1,000 to $1,499 | 23 (38.3%) | 5 (41.7%) |
| $1,500 to $1,999 | 1 (1.7%) | 0 (0.0%) |
| $2,000 to $2,499 | 0 (0.0%) | 0 (0.0%) |
| $2,500 to $2,999 | 0 (0.0%) | 0 (0.0%) |
| $3,000 or more | 0 (0.0%) | 0 (0.0%) |
| Total | 60 (100.0%) | 12 (100.0%) |
Physical Housing Characteristics in Minnesota City
Housing Structures in Minnesota City
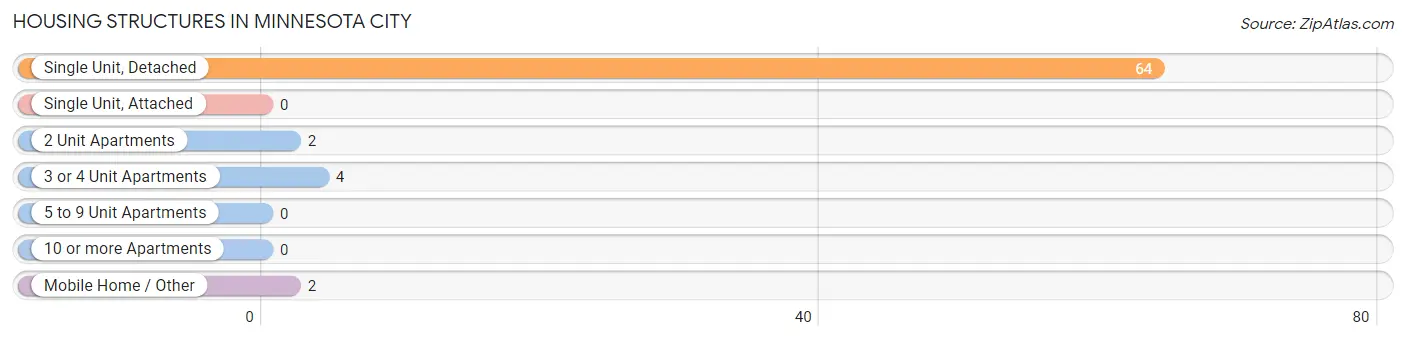
| Structure Type | # Housing Units | % Housing Units |
| Single Unit, Detached | 64 | 88.9% |
| Single Unit, Attached | 0 | 0.0% |
| 2 Unit Apartments | 2 | 2.8% |
| 3 or 4 Unit Apartments | 4 | 5.6% |
| 5 to 9 Unit Apartments | 0 | 0.0% |
| 10 or more Apartments | 0 | 0.0% |
| Mobile Home / Other | 2 | 2.8% |
| Total | 72 | 100.0% |
Housing Structures by Occupancy in Minnesota City
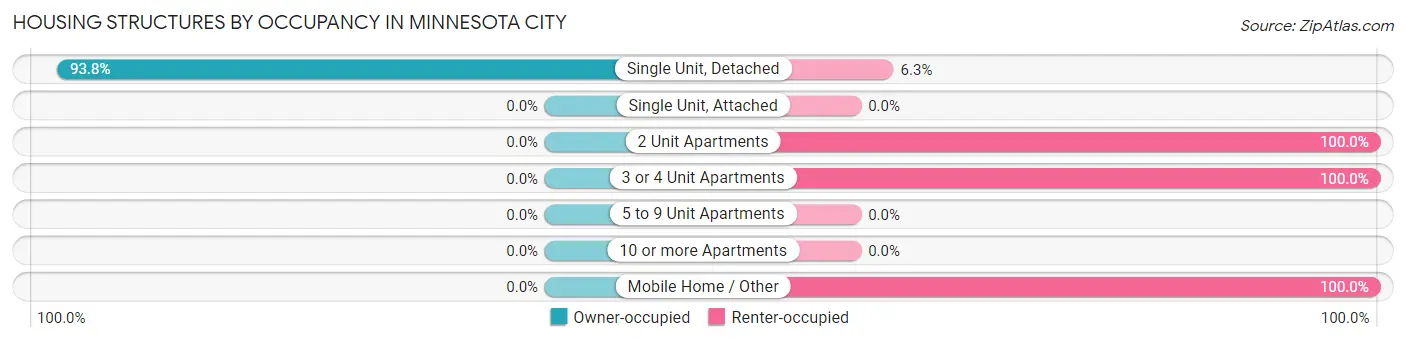
| Structure Type | Owner-occupied | Renter-occupied |
| Single Unit, Detached | 60 (93.8%) | 4 (6.2%) |
| Single Unit, Attached | 0 (0.0%) | 0 (0.0%) |
| 2 Unit Apartments | 0 (0.0%) | 2 (100.0%) |
| 3 or 4 Unit Apartments | 0 (0.0%) | 4 (100.0%) |
| 5 to 9 Unit Apartments | 0 (0.0%) | 0 (0.0%) |
| 10 or more Apartments | 0 (0.0%) | 0 (0.0%) |
| Mobile Home / Other | 0 (0.0%) | 2 (100.0%) |
| Total | 60 (83.3%) | 12 (16.7%) |
Housing Structures by Number of Rooms in Minnesota City
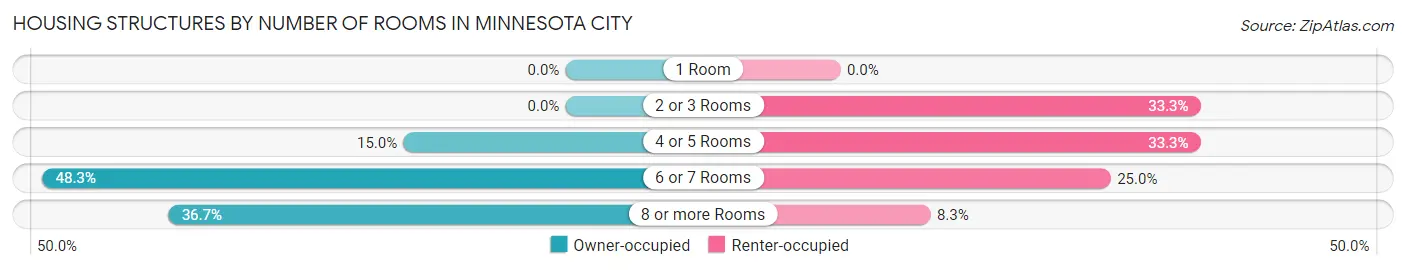
| Number of Rooms | Owner-occupied | Renter-occupied |
| 1 Room | 0 (0.0%) | 0 (0.0%) |
| 2 or 3 Rooms | 0 (0.0%) | 4 (33.3%) |
| 4 or 5 Rooms | 9 (15.0%) | 4 (33.3%) |
| 6 or 7 Rooms | 29 (48.3%) | 3 (25.0%) |
| 8 or more Rooms | 22 (36.7%) | 1 (8.3%) |
| Total | 60 (100.0%) | 12 (100.0%) |
Housing Structure by Heating Type in Minnesota City
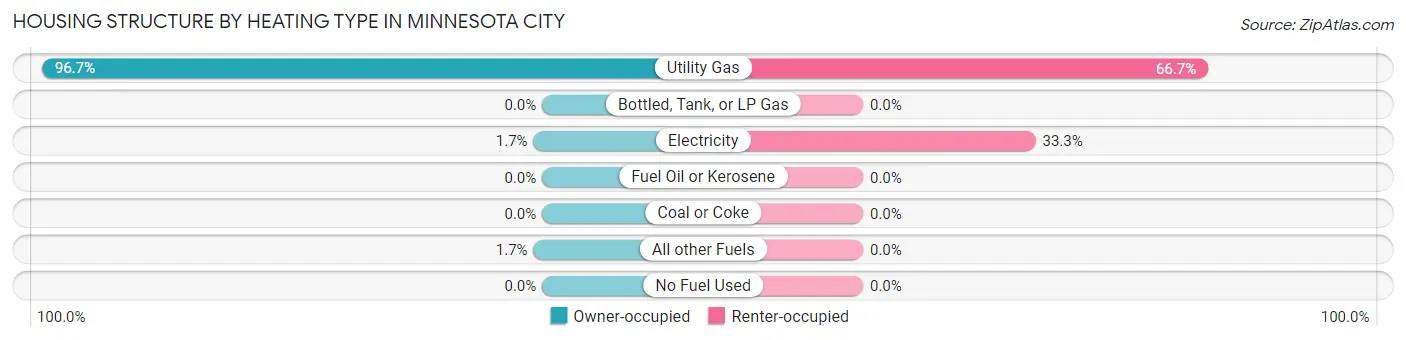
| Heating Type | Owner-occupied | Renter-occupied |
| Utility Gas | 58 (96.7%) | 8 (66.7%) |
| Bottled, Tank, or LP Gas | 0 (0.0%) | 0 (0.0%) |
| Electricity | 1 (1.7%) | 4 (33.3%) |
| Fuel Oil or Kerosene | 0 (0.0%) | 0 (0.0%) |
| Coal or Coke | 0 (0.0%) | 0 (0.0%) |
| All other Fuels | 1 (1.7%) | 0 (0.0%) |
| No Fuel Used | 0 (0.0%) | 0 (0.0%) |
| Total | 60 (100.0%) | 12 (100.0%) |
Household Vehicle Usage in Minnesota City
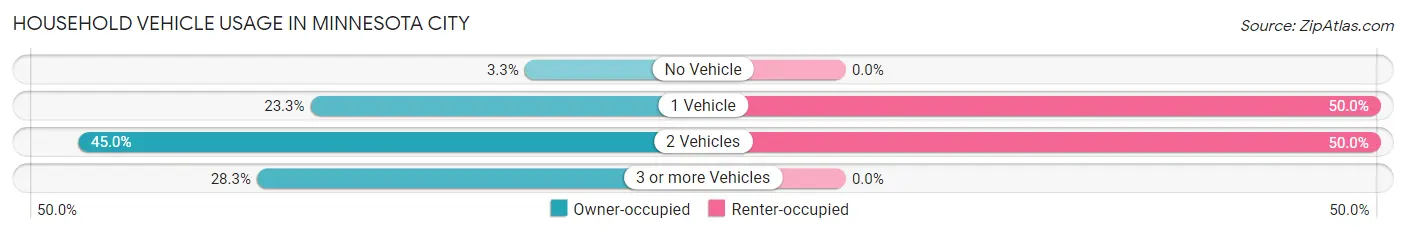
| Vehicles per Household | Owner-occupied | Renter-occupied |
| No Vehicle | 2 (3.3%) | 0 (0.0%) |
| 1 Vehicle | 14 (23.3%) | 6 (50.0%) |
| 2 Vehicles | 27 (45.0%) | 6 (50.0%) |
| 3 or more Vehicles | 17 (28.3%) | 0 (0.0%) |
| Total | 60 (100.0%) | 12 (100.0%) |
Real Estate & Mortgages in Minnesota City
Real Estate and Mortgage Overview in Minnesota City
| Characteristic | Without Mortgage | With Mortgage |
| Housing Units | 27 | 33 |
| Median Property Value | $187,500 | $158,700 |
| Median Household Income | $58,542 | $4 |
| Monthly Housing Costs | $479 | $0 |
| Real Estate Taxes | $1,656 | $0 |
Property Value by Mortgage Status in Minnesota City
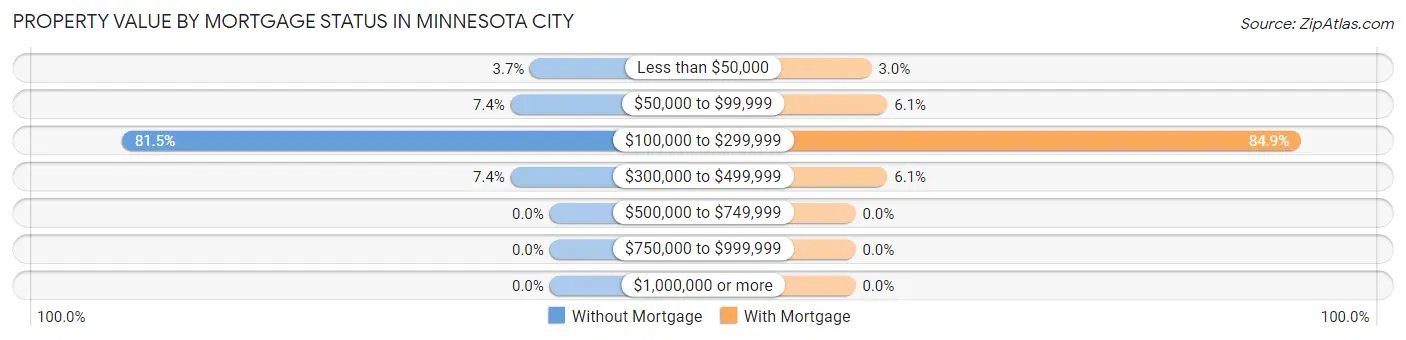
| Property Value | Without Mortgage | With Mortgage |
| Less than $50,000 | 1 (3.7%) | 1 (3.0%) |
| $50,000 to $99,999 | 2 (7.4%) | 2 (6.1%) |
| $100,000 to $299,999 | 22 (81.5%) | 28 (84.9%) |
| $300,000 to $499,999 | 2 (7.4%) | 2 (6.1%) |
| $500,000 to $749,999 | 0 (0.0%) | 0 (0.0%) |
| $750,000 to $999,999 | 0 (0.0%) | 0 (0.0%) |
| $1,000,000 or more | 0 (0.0%) | 0 (0.0%) |
| Total | 27 (100.0%) | 33 (100.0%) |
Household Income by Mortgage Status in Minnesota City
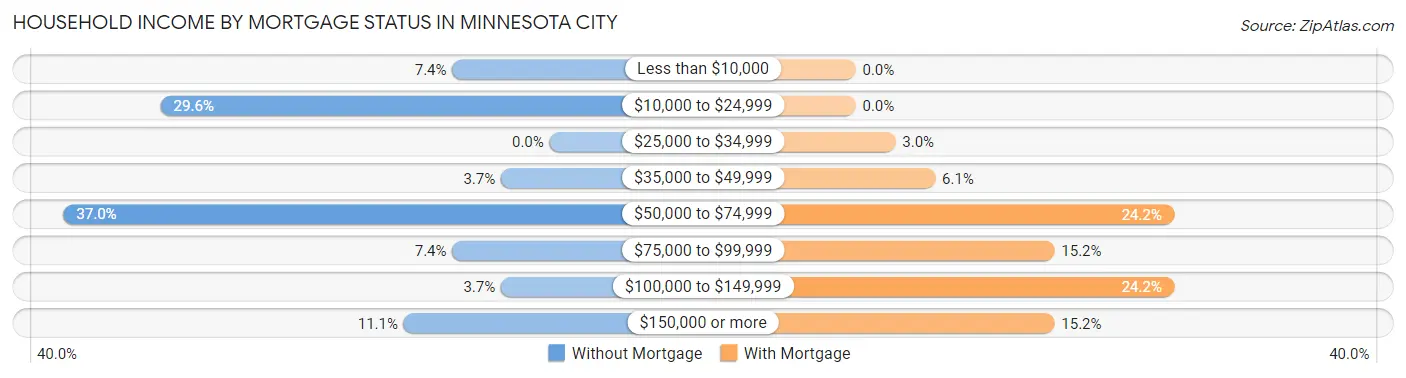
| Household Income | Without Mortgage | With Mortgage |
| Less than $10,000 | 2 (7.4%) | 0 (0.0%) |
| $10,000 to $24,999 | 8 (29.6%) | 0 (0.0%) |
| $25,000 to $34,999 | 0 (0.0%) | 1 (3.0%) |
| $35,000 to $49,999 | 1 (3.7%) | 2 (6.1%) |
| $50,000 to $74,999 | 10 (37.0%) | 8 (24.2%) |
| $75,000 to $99,999 | 2 (7.4%) | 5 (15.1%) |
| $100,000 to $149,999 | 1 (3.7%) | 8 (24.2%) |
| $150,000 or more | 3 (11.1%) | 5 (15.1%) |
| Total | 27 (100.0%) | 33 (100.0%) |
Property Value to Household Income Ratio in Minnesota City
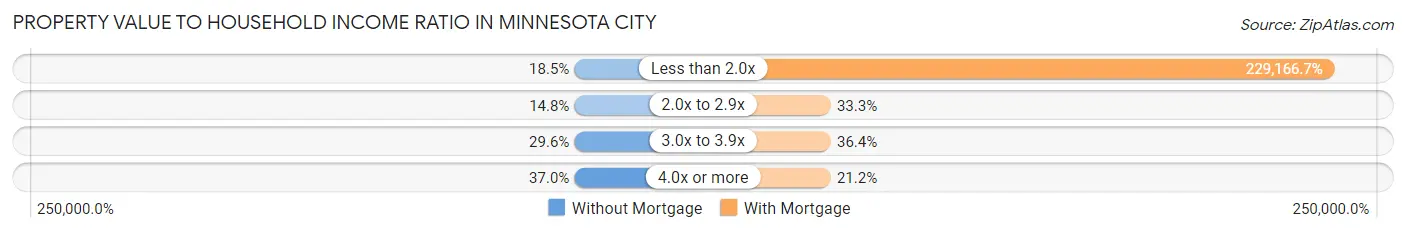
| Value-to-Income Ratio | Without Mortgage | With Mortgage |
| Less than 2.0x | 5 (18.5%) | 75,625 (229,166.7%) |
| 2.0x to 2.9x | 4 (14.8%) | 11 (33.3%) |
| 3.0x to 3.9x | 8 (29.6%) | 12 (36.4%) |
| 4.0x or more | 10 (37.0%) | 7 (21.2%) |
| Total | 27 (100.0%) | 33 (100.0%) |
Real Estate Taxes by Mortgage Status in Minnesota City
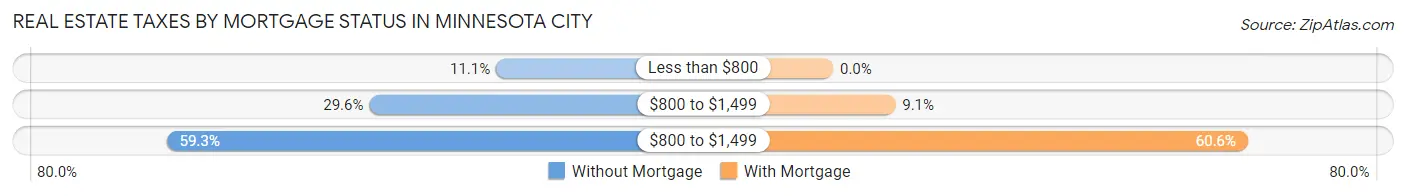
| Property Taxes | Without Mortgage | With Mortgage |
| Less than $800 | 3 (11.1%) | 0 (0.0%) |
| $800 to $1,499 | 8 (29.6%) | 3 (9.1%) |
| $800 to $1,499 | 16 (59.3%) | 20 (60.6%) |
| Total | 27 (100.0%) | 33 (100.0%) |
Health & Disability in Minnesota City
Health Insurance Coverage by Age in Minnesota City
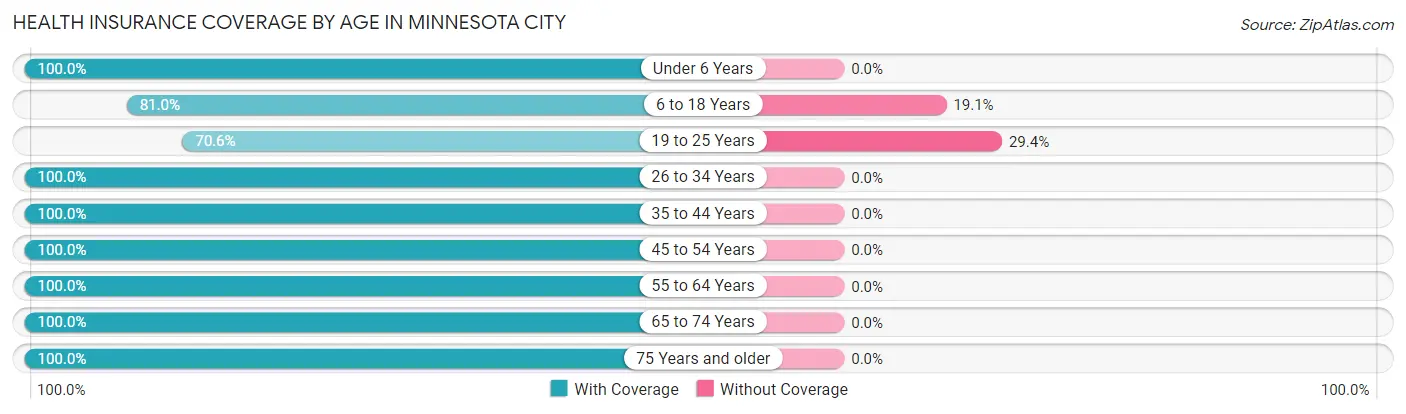
| Age Bracket | With Coverage | Without Coverage |
| Under 6 Years | 15 (100.0%) | 0 (0.0%) |
| 6 to 18 Years | 17 (80.9%) | 4 (19.1%) |
| 19 to 25 Years | 12 (70.6%) | 5 (29.4%) |
| 26 to 34 Years | 13 (100.0%) | 0 (0.0%) |
| 35 to 44 Years | 44 (100.0%) | 0 (0.0%) |
| 45 to 54 Years | 5 (100.0%) | 0 (0.0%) |
| 55 to 64 Years | 24 (100.0%) | 0 (0.0%) |
| 65 to 74 Years | 16 (100.0%) | 0 (0.0%) |
| 75 Years and older | 17 (100.0%) | 0 (0.0%) |
| Total | 163 (94.8%) | 9 (5.2%) |
Health Insurance Coverage by Citizenship Status in Minnesota City
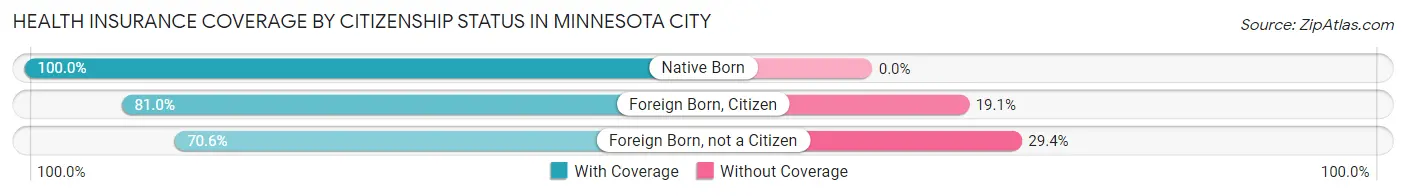
| Citizenship Status | With Coverage | Without Coverage |
| Native Born | 15 (100.0%) | 0 (0.0%) |
| Foreign Born, Citizen | 17 (80.9%) | 4 (19.1%) |
| Foreign Born, not a Citizen | 12 (70.6%) | 5 (29.4%) |
Health Insurance Coverage by Household Income in Minnesota City
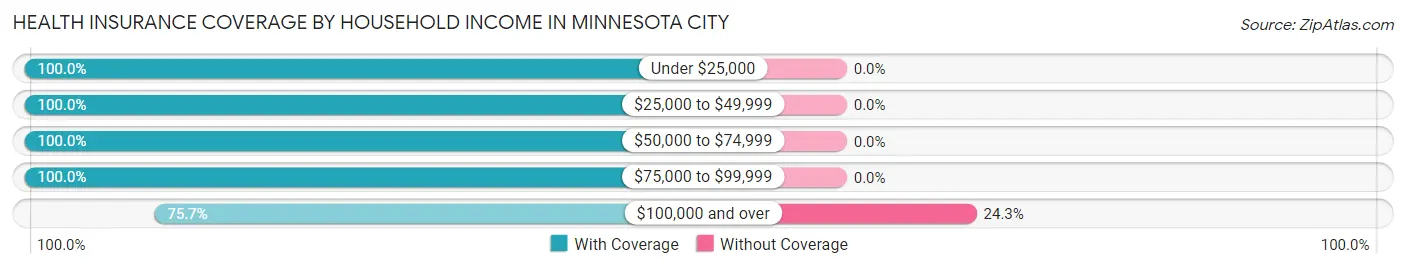
| Household Income | With Coverage | Without Coverage |
| Under $25,000 | 12 (100.0%) | 0 (0.0%) |
| $25,000 to $49,999 | 37 (100.0%) | 0 (0.0%) |
| $50,000 to $74,999 | 38 (100.0%) | 0 (0.0%) |
| $75,000 to $99,999 | 48 (100.0%) | 0 (0.0%) |
| $100,000 and over | 28 (75.7%) | 9 (24.3%) |
Public vs Private Health Insurance Coverage by Age in Minnesota City
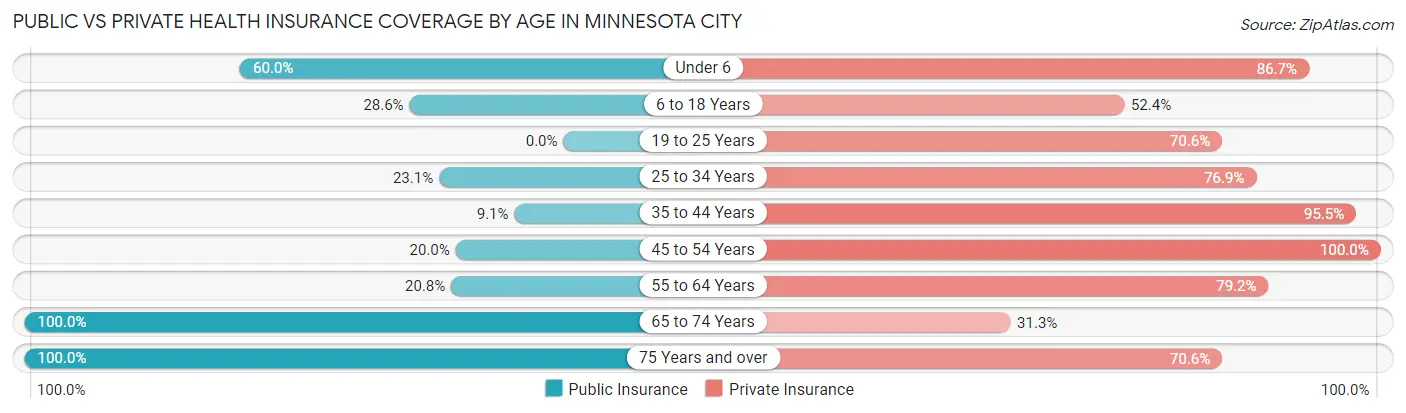
| Age Bracket | Public Insurance | Private Insurance |
| Under 6 | 9 (60.0%) | 13 (86.7%) |
| 6 to 18 Years | 6 (28.6%) | 11 (52.4%) |
| 19 to 25 Years | 0 (0.0%) | 12 (70.6%) |
| 25 to 34 Years | 3 (23.1%) | 10 (76.9%) |
| 35 to 44 Years | 4 (9.1%) | 42 (95.5%) |
| 45 to 54 Years | 1 (20.0%) | 5 (100.0%) |
| 55 to 64 Years | 5 (20.8%) | 19 (79.2%) |
| 65 to 74 Years | 16 (100.0%) | 5 (31.2%) |
| 75 Years and over | 17 (100.0%) | 12 (70.6%) |
| Total | 61 (35.5%) | 129 (75.0%) |
Disability Status by Sex by Age in Minnesota City
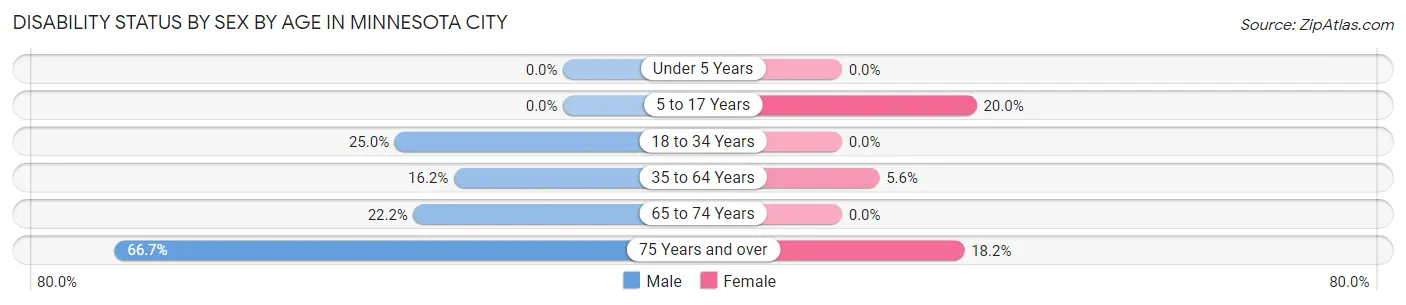
| Age Bracket | Male | Female |
| Under 5 Years | 0 (0.0%) | 0 (0.0%) |
| 5 to 17 Years | 0 (0.0%) | 2 (20.0%) |
| 18 to 34 Years | 5 (25.0%) | 0 (0.0%) |
| 35 to 64 Years | 6 (16.2%) | 2 (5.6%) |
| 65 to 74 Years | 2 (22.2%) | 0 (0.0%) |
| 75 Years and over | 4 (66.7%) | 2 (18.2%) |
Disability Class by Sex by Age in Minnesota City
Disability Class: Hearing Difficulty
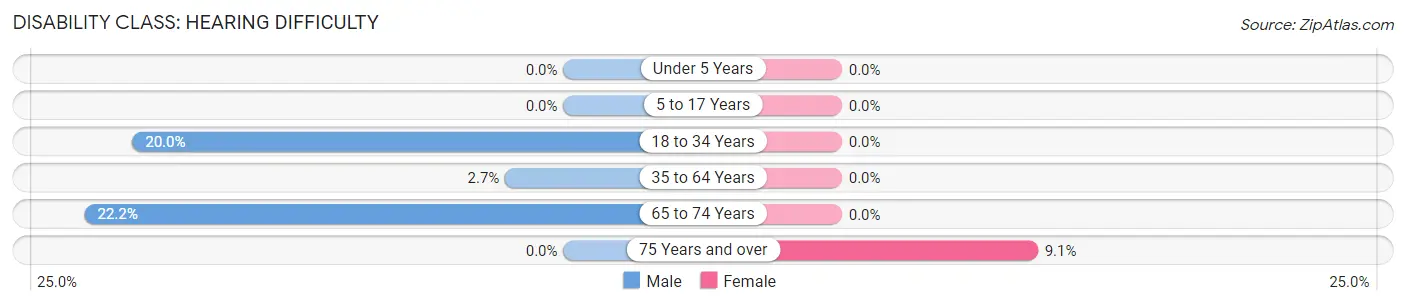
| Age Bracket | Male | Female |
| Under 5 Years | 0 (0.0%) | 0 (0.0%) |
| 5 to 17 Years | 0 (0.0%) | 0 (0.0%) |
| 18 to 34 Years | 4 (20.0%) | 0 (0.0%) |
| 35 to 64 Years | 1 (2.7%) | 0 (0.0%) |
| 65 to 74 Years | 2 (22.2%) | 0 (0.0%) |
| 75 Years and over | 0 (0.0%) | 1 (9.1%) |
Disability Class: Vision Difficulty
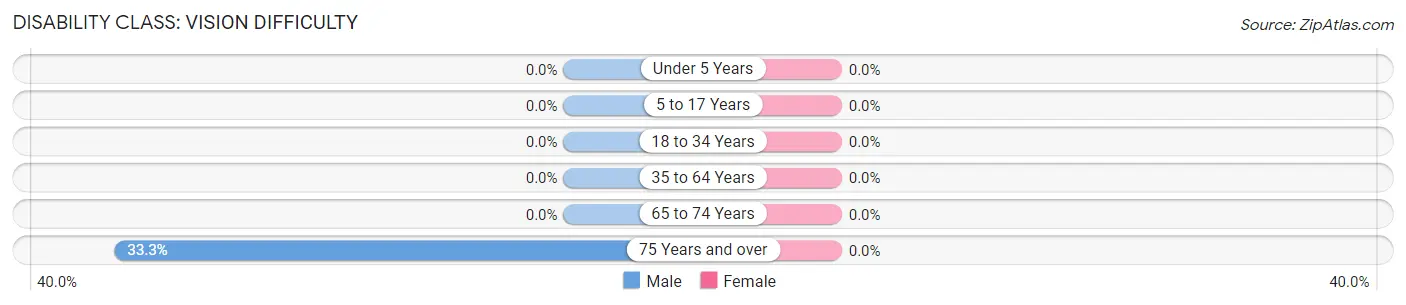
| Age Bracket | Male | Female |
| Under 5 Years | 0 (0.0%) | 0 (0.0%) |
| 5 to 17 Years | 0 (0.0%) | 0 (0.0%) |
| 18 to 34 Years | 0 (0.0%) | 0 (0.0%) |
| 35 to 64 Years | 0 (0.0%) | 0 (0.0%) |
| 65 to 74 Years | 0 (0.0%) | 0 (0.0%) |
| 75 Years and over | 2 (33.3%) | 0 (0.0%) |
Disability Class: Cognitive Difficulty
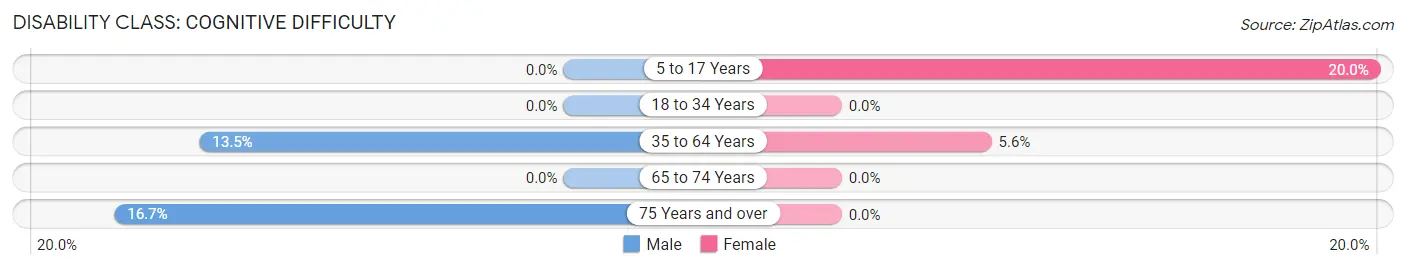
| Age Bracket | Male | Female |
| 5 to 17 Years | 0 (0.0%) | 2 (20.0%) |
| 18 to 34 Years | 0 (0.0%) | 0 (0.0%) |
| 35 to 64 Years | 5 (13.5%) | 2 (5.6%) |
| 65 to 74 Years | 0 (0.0%) | 0 (0.0%) |
| 75 Years and over | 1 (16.7%) | 0 (0.0%) |
Disability Class: Ambulatory Difficulty
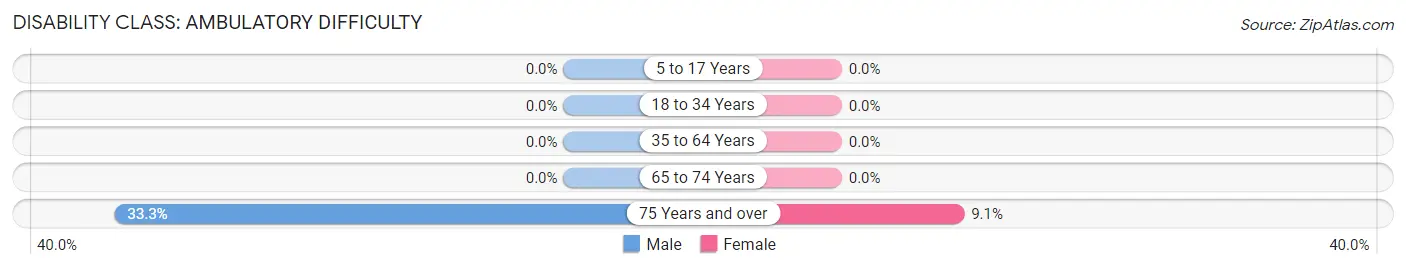
| Age Bracket | Male | Female |
| 5 to 17 Years | 0 (0.0%) | 0 (0.0%) |
| 18 to 34 Years | 0 (0.0%) | 0 (0.0%) |
| 35 to 64 Years | 0 (0.0%) | 0 (0.0%) |
| 65 to 74 Years | 0 (0.0%) | 0 (0.0%) |
| 75 Years and over | 2 (33.3%) | 1 (9.1%) |
Disability Class: Self-Care Difficulty
| Age Bracket | Male | Female |
| 5 to 17 Years | 0 (0.0%) | 0 (0.0%) |
| 18 to 34 Years | 0 (0.0%) | 0 (0.0%) |
| 35 to 64 Years | 0 (0.0%) | 0 (0.0%) |
| 65 to 74 Years | 0 (0.0%) | 0 (0.0%) |
| 75 Years and over | 0 (0.0%) | 0 (0.0%) |
Technology Access in Minnesota City
Computing Device Access in Minnesota City
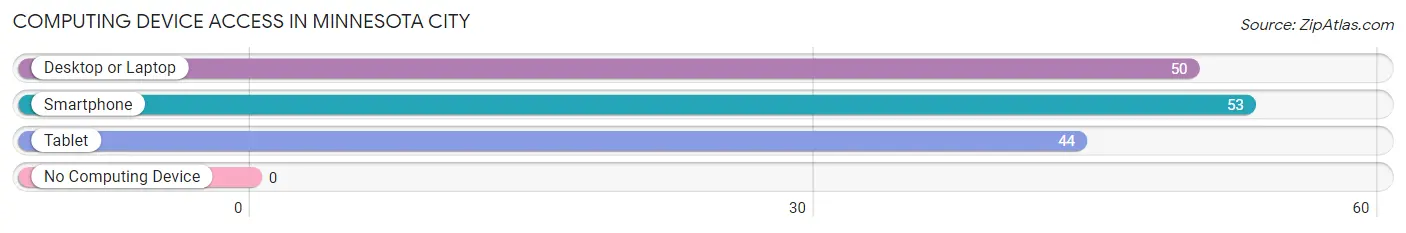
| Device Type | # Households | % Households |
| Desktop or Laptop | 50 | 69.4% |
| Smartphone | 53 | 73.6% |
| Tablet | 44 | 61.1% |
| No Computing Device | 0 | 0.0% |
| Total | 72 | 100.0% |
Internet Access in Minnesota City
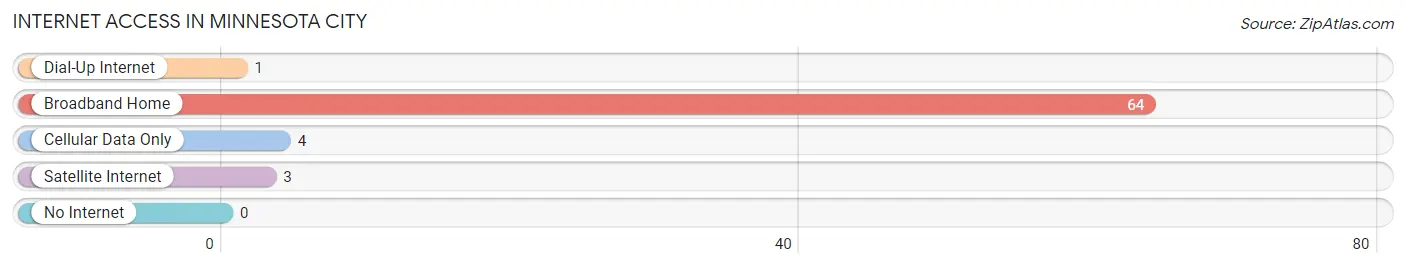
| Internet Type | # Households | % Households |
| Dial-Up Internet | 1 | 1.4% |
| Broadband Home | 64 | 88.9% |
| Cellular Data Only | 4 | 5.6% |
| Satellite Internet | 3 | 4.2% |
| No Internet | 0 | 0.0% |
| Total | 72 | 100.0% |
Minnesota City Summary
City of Minneapolis
The City of Minneapolis is the largest city in the state of Minnesota and the county seat of Hennepin County. It is located in the Twin Cities metropolitan area, along the Mississippi River. The city is known for its vibrant culture, diverse economy, and its many parks and lakes. Minneapolis is home to a variety of industries, including finance, healthcare, technology, and manufacturing.
History
The area that is now Minneapolis was first settled by the Dakota and Ojibwe Native American tribes. The first European settlers arrived in the area in the late 1700s, and the city was officially incorporated in 1867. The city was named after the Minneapolis Mill Company, which was founded in 1867.
The city quickly grew in the late 1800s and early 1900s, becoming a major industrial center. The city was home to a variety of industries, including flour milling, lumber, and railroads. The city was also home to a large immigrant population, with many coming from Germany, Scandinavia, and Eastern Europe.
In the mid-1900s, the city began to diversify its economy, becoming a major center for finance, healthcare, and technology. The city also became a major center for the arts, with a variety of museums, theaters, and galleries.
Geography
The City of Minneapolis is located in the Twin Cities metropolitan area, along the Mississippi River. The city is located in the center of the state, and is bordered by the cities of St. Paul, Bloomington, and Brooklyn Park. The city covers an area of 58.4 square miles, and has a population of over 400,000 people.
The city is divided into a number of neighborhoods, including Downtown, Uptown, North Minneapolis, and South Minneapolis. The city is also home to a number of parks and lakes, including Lake Calhoun, Lake Harriet, and Minnehaha Park.
Economy
The City of Minneapolis is home to a diverse economy, with a variety of industries. The city is home to a number of major corporations, including Target, Best Buy, and U.S. Bank. The city is also home to a number of healthcare and technology companies, including Allina Health, Medtronic, and UnitedHealth Group.
The city is also home to a number of educational institutions, including the University of Minnesota, Augsburg University, and the Minneapolis College of Art and Design. The city is also home to a number of cultural institutions, including the Walker Art Center, the Minneapolis Institute of Art, and the Guthrie Theater.
Demographics
As of the 2020 census, the City of Minneapolis had a population of over 400,000 people. The city is home to a diverse population, with a variety of racial and ethnic backgrounds. The city is majority white, with a population of over 70%. The city is also home to a large African American population, with a population of over 20%. The city is also home to a large Asian population, with a population of over 10%.
The city is also home to a variety of religious backgrounds, with a population of over 40%. The city is also home to a large LGBT population, with a population of over 10%. The city is also home to a large immigrant population, with a population of over 20%.
Common Questions
What is Per Capita Income in Minnesota City?
Per Capita income in Minnesota City is $31,317.
What is the Median Family Income in Minnesota City?
Median Family Income in Minnesota City is $86,111.
What is the Median Household income in Minnesota City?
Median Household Income in Minnesota City is $62,500.
What is Income or Wage Gap in Minnesota City?
Income or Wage Gap in Minnesota City is 2.2%.
Women in Minnesota City earn 97.8 cents for every dollar earned by a man.
What is Inequality or Gini Index in Minnesota City?
Inequality or Gini Index in Minnesota City is 0.34.
What is the Total Population of Minnesota City?
Total Population of Minnesota City is 172.
What is the Total Male Population of Minnesota City?
Total Male Population of Minnesota City is 94.
What is the Total Female Population of Minnesota City?
Total Female Population of Minnesota City is 78.
What is the Ratio of Males per 100 Females in Minnesota City?
There are 120.51 Males per 100 Females in Minnesota City.
What is the Ratio of Females per 100 Males in Minnesota City?
There are 82.98 Females per 100 Males in Minnesota City.
What is the Median Population Age in Minnesota City?
Median Population Age in Minnesota City is 41.9 Years.
What is the Average Family Size in Minnesota City
Average Family Size in Minnesota City is 2.9 People.
What is the Average Household Size in Minnesota City
Average Household Size in Minnesota City is 2.4 People.
How Large is the Labor Force in Minnesota City?
There are 103 People in the Labor Forcein in Minnesota City.
What is the Percentage of People in the Labor Force in Minnesota City?
70.1% of People are in the Labor Force in Minnesota City.
What is the Unemployment Rate in Minnesota City?
Unemployment Rate in Minnesota City is 10.7%.