Silver Creek, MN Map & Demographics
Silver Creek Map
Silver Creek Overview
$39,440
PER CAPITA INCOME
$71,458
AVG FAMILY INCOME
$69,286
AVG HOUSEHOLD INCOME
0.34
INEQUALITY / GINI INDEX
141
TOTAL POPULATION
73
MALE POPULATION
68
FEMALE POPULATION
107.35
MALES / 100 FEMALES
93.15
FEMALES / 100 MALES
63.9
MEDIAN AGE
2.3
AVG FAMILY SIZE
2.1
AVG HOUSEHOLD SIZE
71
LABOR FORCE [ PEOPLE ]
52.6%
PERCENT IN LABOR FORCE
7.0%
UNEMPLOYMENT RATE
Income in Silver Creek
Income Overview in Silver Creek
Per Capita Income in Silver Creek is $39,440, while median incomes of families and households are $71,458 and $69,286 respectively.
| Characteristic | Number | Measure |
| Per Capita Income | 141 | $39,440 |
| Median Family Income | 51 | $71,458 |
| Mean Family Income | 51 | $96,625 |
| Median Household Income | 68 | $69,286 |
| Mean Household Income | 68 | $82,341 |
| Income Deficit | 51 | $0 |
| Wage / Income Gap (%) | 141 | 0.00% |
| Wage / Income Gap ($) | 141 | 100.00¢ per $1 |
| Gini / Inequality Index | 141 | 0.34 |
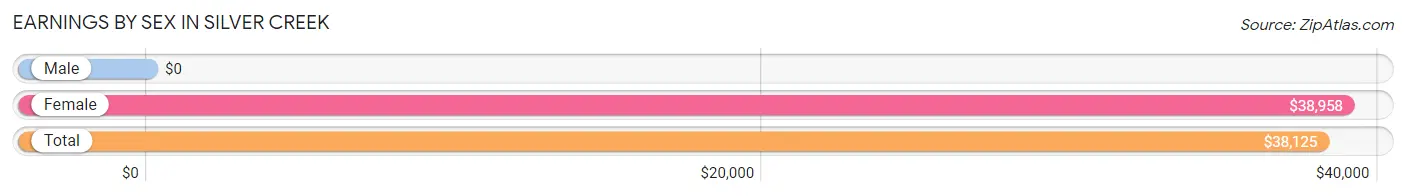
Earnings by Sex in Silver Creek
| Sex | Number | Average Earnings |
| Male | 36 (50.7%) | $0 |
| Female | 35 (49.3%) | $38,958 |
| Total | 71 (100.0%) | $38,125 |
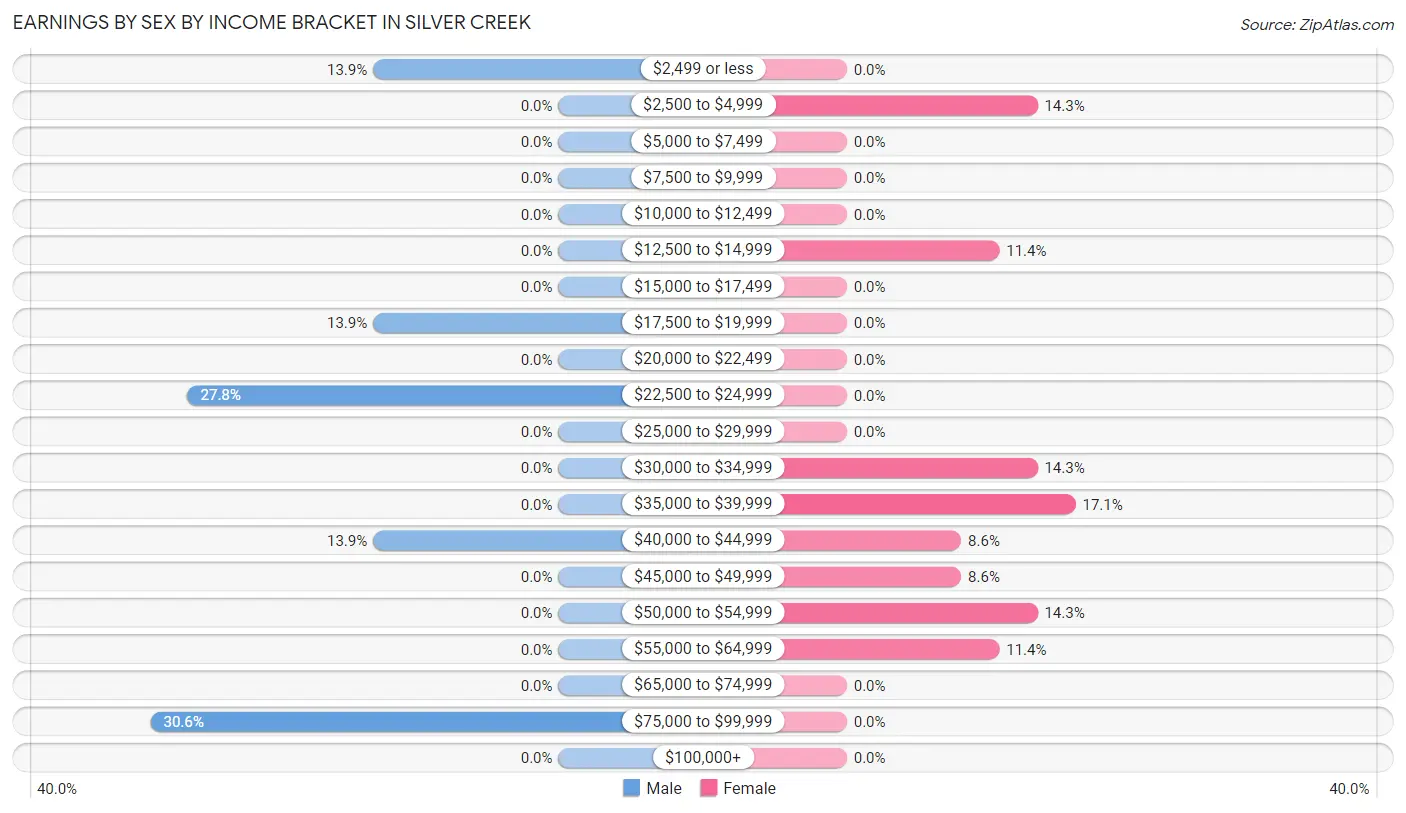
Earnings by Sex by Income Bracket in Silver Creek
The most common earnings brackets in Silver Creek are $75,000 to $99,999 for men (11 | 30.6%) and $35,000 to $39,999 for women (6 | 17.1%).
| Income | Male | Female |
| $2,499 or less | 5 (13.9%) | 0 (0.0%) |
| $2,500 to $4,999 | 0 (0.0%) | 5 (14.3%) |
| $5,000 to $7,499 | 0 (0.0%) | 0 (0.0%) |
| $7,500 to $9,999 | 0 (0.0%) | 0 (0.0%) |
| $10,000 to $12,499 | 0 (0.0%) | 0 (0.0%) |
| $12,500 to $14,999 | 0 (0.0%) | 4 (11.4%) |
| $15,000 to $17,499 | 0 (0.0%) | 0 (0.0%) |
| $17,500 to $19,999 | 5 (13.9%) | 0 (0.0%) |
| $20,000 to $22,499 | 0 (0.0%) | 0 (0.0%) |
| $22,500 to $24,999 | 10 (27.8%) | 0 (0.0%) |
| $25,000 to $29,999 | 0 (0.0%) | 0 (0.0%) |
| $30,000 to $34,999 | 0 (0.0%) | 5 (14.3%) |
| $35,000 to $39,999 | 0 (0.0%) | 6 (17.1%) |
| $40,000 to $44,999 | 5 (13.9%) | 3 (8.6%) |
| $45,000 to $49,999 | 0 (0.0%) | 3 (8.6%) |
| $50,000 to $54,999 | 0 (0.0%) | 5 (14.3%) |
| $55,000 to $64,999 | 0 (0.0%) | 4 (11.4%) |
| $65,000 to $74,999 | 0 (0.0%) | 0 (0.0%) |
| $75,000 to $99,999 | 11 (30.6%) | 0 (0.0%) |
| $100,000+ | 0 (0.0%) | 0 (0.0%) |
| Total | 36 (100.0%) | 35 (100.0%) |
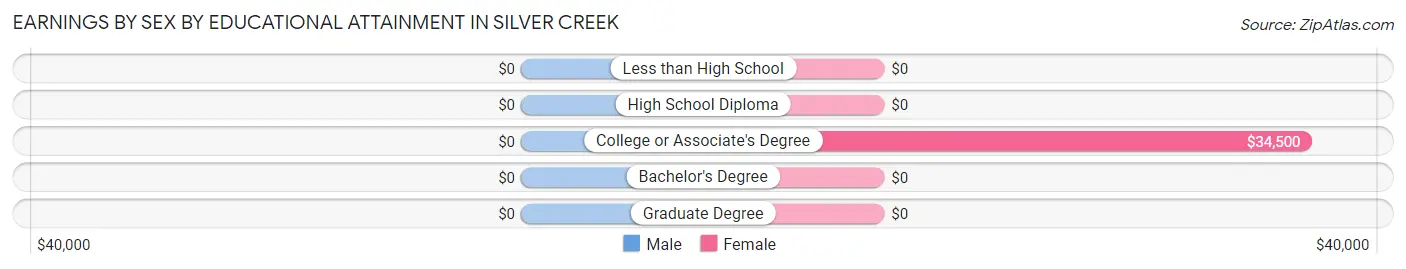
Earnings by Sex by Educational Attainment in Silver Creek
| Educational Attainment | Male Income | Female Income |
| Less than High School | - | - |
| High School Diploma | - | - |
| College or Associate's Degree | - | - |
| Bachelor's Degree | - | - |
| Graduate Degree | - | - |
| Total | - | - |
Family Income in Silver Creek
Family Income Brackets in Silver Creek
According to the Silver Creek family income data, there are 22 families falling into the $50,000 to $74,999 income range, which is the most common income bracket and makes up 43.1% of all families.
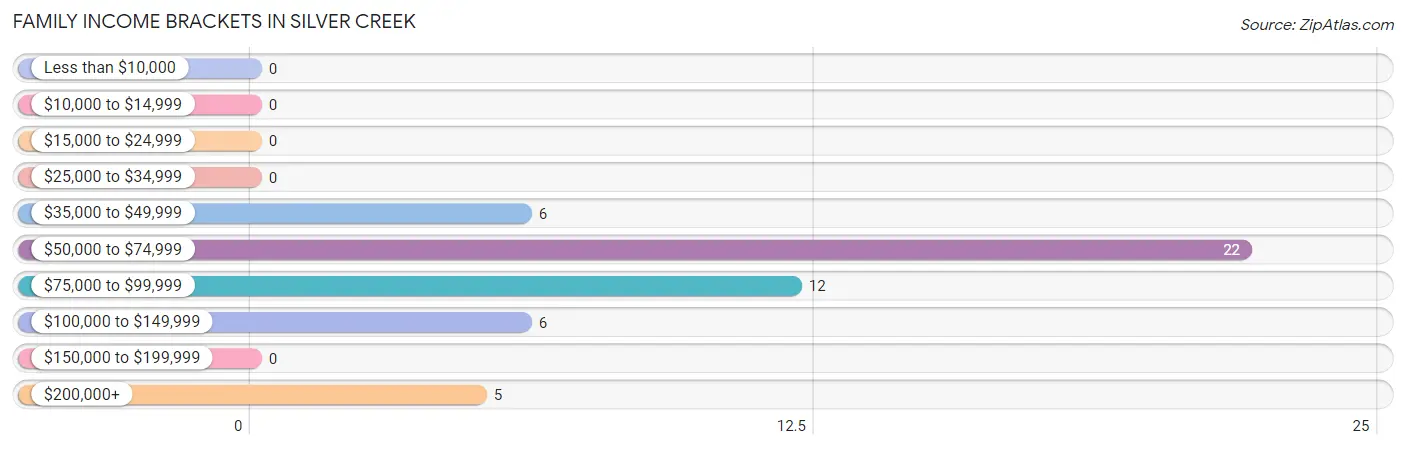
| Income Bracket | # Families | % Families |
| Less than $10,000 | 0 | 0.0% |
| $10,000 to $14,999 | 0 | 0.0% |
| $15,000 to $24,999 | 0 | 0.0% |
| $25,000 to $34,999 | 0 | 0.0% |
| $35,000 to $49,999 | 6 | 11.8% |
| $50,000 to $74,999 | 22 | 43.1% |
| $75,000 to $99,999 | 12 | 23.5% |
| $100,000 to $149,999 | 6 | 11.8% |
| $150,000 to $199,999 | 0 | 0.0% |
| $200,000+ | 5 | 9.8% |
Family Income by Famaliy Size in Silver Creek
2-person families (35 | 68.6%) account for the highest median family income in Silver Creek with $71,458 per family, while 2-person families (35 | 68.6%) have the highest median income of $35,729 per family member.
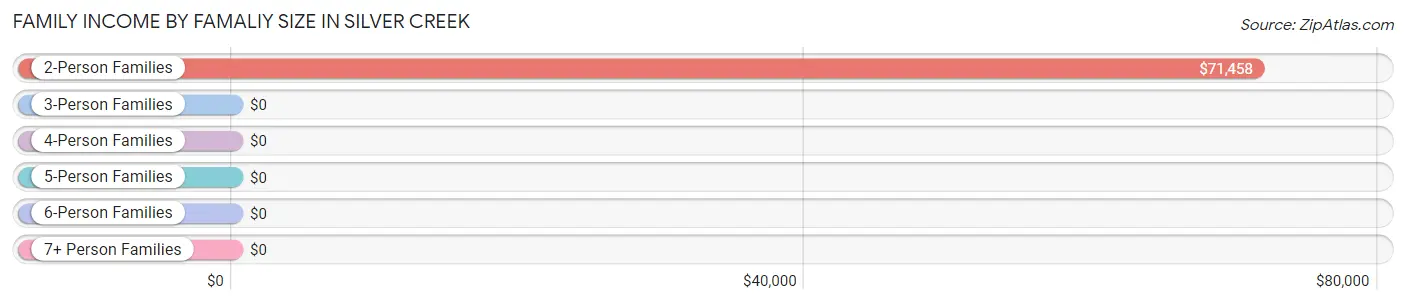
| Income Bracket | # Families | Median Income |
| 2-Person Families | 35 (68.6%) | $71,458 |
| 3-Person Families | 13 (25.5%) | $0 |
| 4-Person Families | 3 (5.9%) | $0 |
| 5-Person Families | 0 (0.0%) | $0 |
| 6-Person Families | 0 (0.0%) | $0 |
| 7+ Person Families | 0 (0.0%) | $0 |
| Total | 51 (100.0%) | $71,458 |
Family Income by Number of Earners in Silver Creek
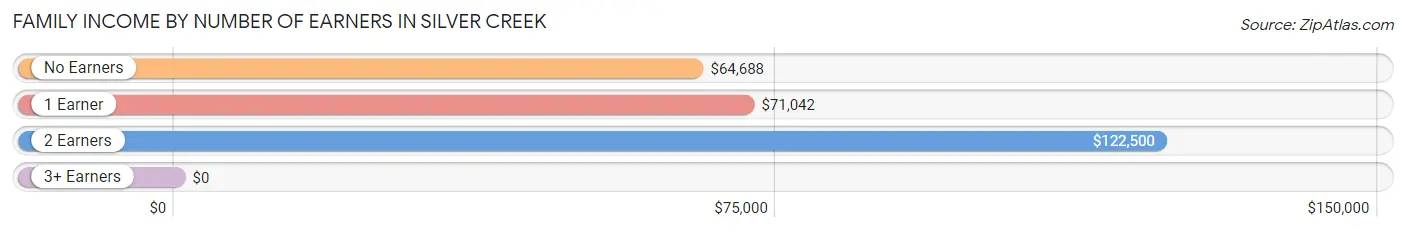
| Number of Earners | # Families | Median Income |
| No Earners | 19 (37.2%) | $64,688 |
| 1 Earner | 15 (29.4%) | $71,042 |
| 2 Earners | 12 (23.5%) | $122,500 |
| 3+ Earners | 5 (9.8%) | $0 |
| Total | 51 (100.0%) | $71,458 |
Household Income in Silver Creek
Household Income Brackets in Silver Creek
With 22 households falling in the category, the $50,000 to $74,999 income range is the most frequent in Silver Creek, accounting for 32.4% of all households.
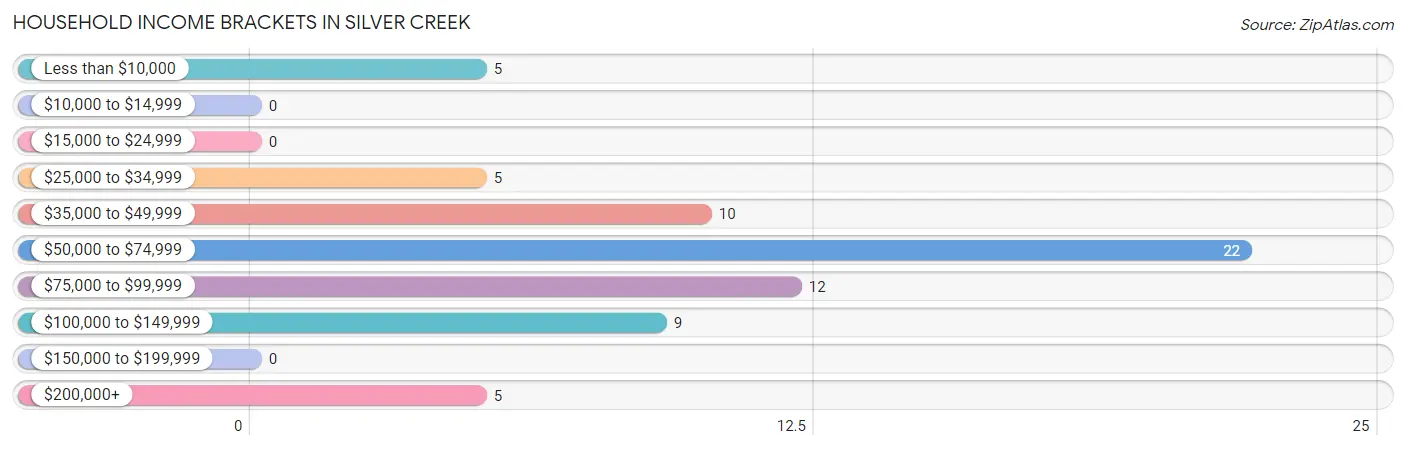
| Income Bracket | # Households | % Households |
| Less than $10,000 | 5 | 7.4% |
| $10,000 to $14,999 | 0 | 0.0% |
| $15,000 to $24,999 | 0 | 0.0% |
| $25,000 to $34,999 | 5 | 7.4% |
| $35,000 to $49,999 | 10 | 14.7% |
| $50,000 to $74,999 | 22 | 32.4% |
| $75,000 to $99,999 | 12 | 17.6% |
| $100,000 to $149,999 | 9 | 13.2% |
| $150,000 to $199,999 | 0 | 0.0% |
| $200,000+ | 5 | 7.4% |
Household Income by Householder Age in Silver Creek
The median household income in Silver Creek is $69,286, with the highest median household income of $107,083 found in the 45 to 64 years age bracket for the primary householder. A total of 23 households (33.8%) fall into this category.
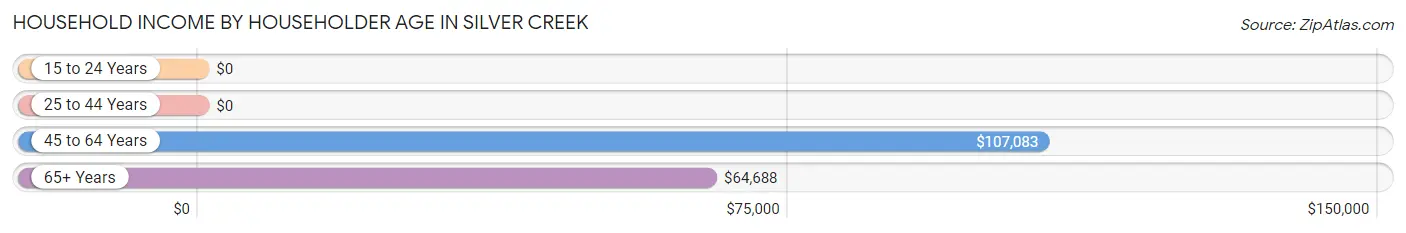
| Income Bracket | # Households | Median Income |
| 15 to 24 Years | 0 (0.0%) | $0 |
| 25 to 44 Years | 8 (11.8%) | $0 |
| 45 to 64 Years | 23 (33.8%) | $107,083 |
| 65+ Years | 37 (54.4%) | $64,688 |
| Total | 68 (100.0%) | $69,286 |
Poverty in Silver Creek
Income Below Poverty by Sex and Age in Silver Creek
With 6.9% poverty level for males and 7.3% for females among the residents of Silver Creek, 25 to 34 year old males and 25 to 34 year old females are the most vulnerable to poverty, with 5 males (45.5%) and 5 females (50.0%) in their respective age groups living below the poverty level.
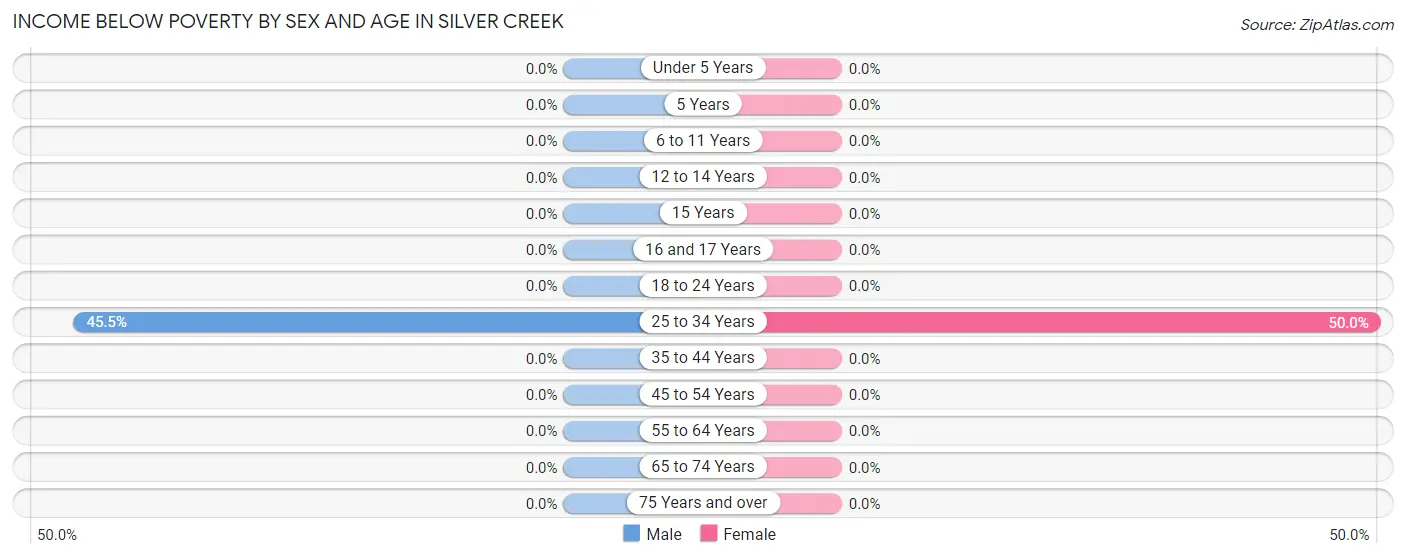
| Age Bracket | Male | Female |
| Under 5 Years | 0 (0.0%) | 0 (0.0%) |
| 5 Years | 0 (0.0%) | 0 (0.0%) |
| 6 to 11 Years | 0 (0.0%) | 0 (0.0%) |
| 12 to 14 Years | 0 (0.0%) | 0 (0.0%) |
| 15 Years | 0 (0.0%) | 0 (0.0%) |
| 16 and 17 Years | 0 (0.0%) | 0 (0.0%) |
| 18 to 24 Years | 0 (0.0%) | 0 (0.0%) |
| 25 to 34 Years | 5 (45.5%) | 5 (50.0%) |
| 35 to 44 Years | 0 (0.0%) | 0 (0.0%) |
| 45 to 54 Years | 0 (0.0%) | 0 (0.0%) |
| 55 to 64 Years | 0 (0.0%) | 0 (0.0%) |
| 65 to 74 Years | 0 (0.0%) | 0 (0.0%) |
| 75 Years and over | 0 (0.0%) | 0 (0.0%) |
| Total | 5 (6.9%) | 5 (7.3%) |
Income Above Poverty by Sex and Age in Silver Creek
According to the poverty statistics in Silver Creek, males aged 12 to 14 years and females aged 12 to 14 years are the age groups that are most secure financially, with 100.0% of males and 100.0% of females in these age groups living above the poverty line.
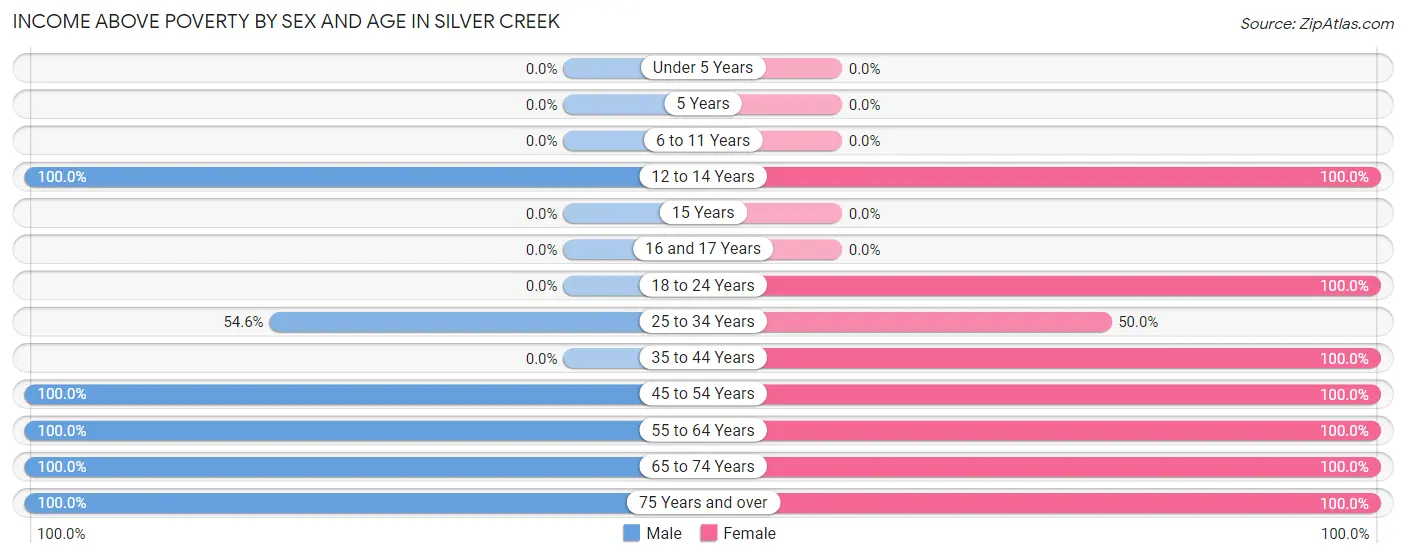
| Age Bracket | Male | Female |
| Under 5 Years | 0 (0.0%) | 0 (0.0%) |
| 5 Years | 0 (0.0%) | 0 (0.0%) |
| 6 to 11 Years | 0 (0.0%) | 0 (0.0%) |
| 12 to 14 Years | 3 (100.0%) | 3 (100.0%) |
| 15 Years | 0 (0.0%) | 0 (0.0%) |
| 16 and 17 Years | 0 (0.0%) | 0 (0.0%) |
| 18 to 24 Years | 0 (0.0%) | 4 (100.0%) |
| 25 to 34 Years | 6 (54.5%) | 5 (50.0%) |
| 35 to 44 Years | 0 (0.0%) | 3 (100.0%) |
| 45 to 54 Years | 4 (100.0%) | 4 (100.0%) |
| 55 to 64 Years | 13 (100.0%) | 25 (100.0%) |
| 65 to 74 Years | 30 (100.0%) | 4 (100.0%) |
| 75 Years and over | 12 (100.0%) | 15 (100.0%) |
| Total | 68 (93.1%) | 63 (92.6%) |
Income Below Poverty Among Married-Couple Families in Silver Creek
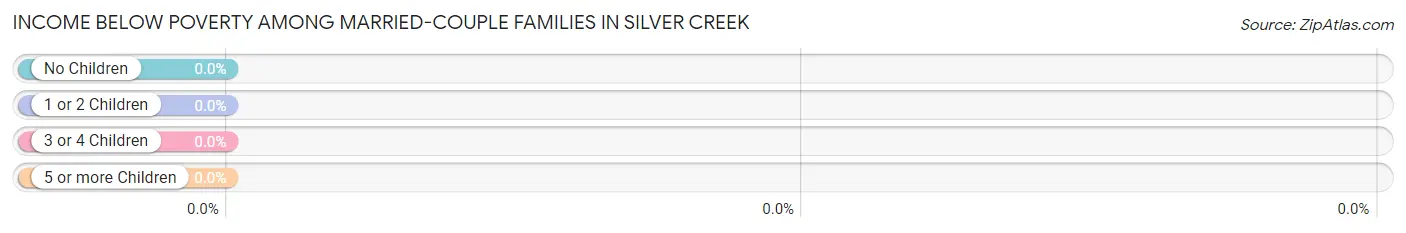
| Children | Above Poverty | Below Poverty |
| No Children | 44 (100.0%) | 0 (0.0%) |
| 1 or 2 Children | 3 (100.0%) | 0 (0.0%) |
| 3 or 4 Children | 0 (0.0%) | 0 (0.0%) |
| 5 or more Children | 0 (0.0%) | 0 (0.0%) |
| Total | 47 (100.0%) | 0 (0.0%) |
Income Below Poverty Among Single-Parent Households in Silver Creek
| Children | Single Father | Single Mother |
| No Children | 0 (0.0%) | 0 (0.0%) |
| 1 or 2 Children | 0 (0.0%) | 0 (0.0%) |
| 3 or 4 Children | 0 (0.0%) | 0 (0.0%) |
| 5 or more Children | 0 (0.0%) | 0 (0.0%) |
| Total | 0 (0.0%) | 0 (0.0%) |
Income Below Poverty Among Married-Couple vs Single-Parent Households in Silver Creek
| Children | Married-Couple Families | Single-Parent Households |
| No Children | 0 (0.0%) | 0 (0.0%) |
| 1 or 2 Children | 0 (0.0%) | 0 (0.0%) |
| 3 or 4 Children | 0 (0.0%) | 0 (0.0%) |
| 5 or more Children | 0 (0.0%) | 0 (0.0%) |
| Total | 0 (0.0%) | 0 (0.0%) |
Race in Silver Creek
The most populous races in Silver Creek are , and White / Caucasian (141 | 100.0%).
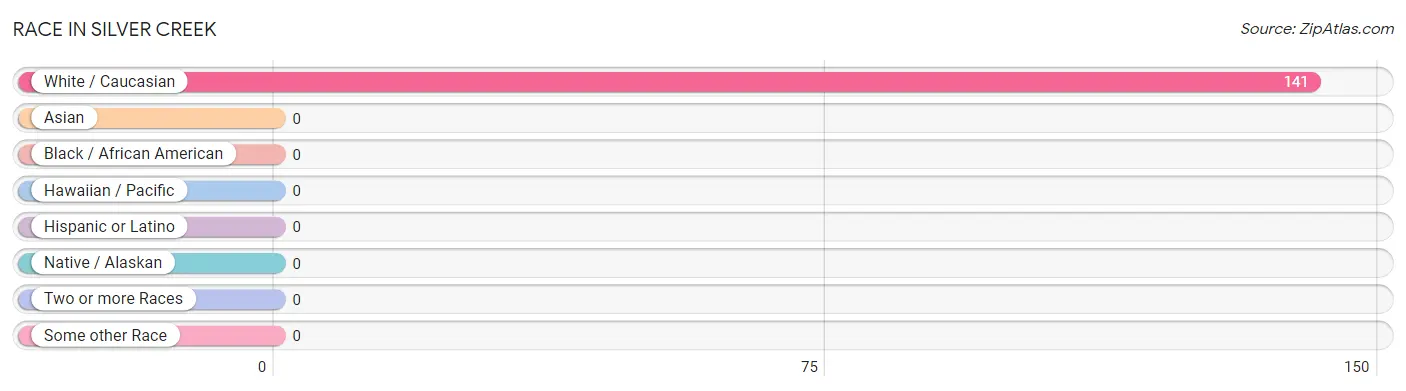
| Race | # Population | % Population |
| Asian | 0 | 0.0% |
| Black / African American | 0 | 0.0% |
| Hawaiian / Pacific | 0 | 0.0% |
| Hispanic or Latino | 0 | 0.0% |
| Native / Alaskan | 0 | 0.0% |
| White / Caucasian | 141 | 100.0% |
| Two or more Races | 0 | 0.0% |
| Some other Race | 0 | 0.0% |
| Total | 141 | 100.0% |
Ancestry in Silver Creek
The most populous ancestries reported in Silver Creek are German (50 | 35.5%), Norwegian (19 | 13.5%), Irish (16 | 11.4%), Czech (15 | 10.6%), and Belgian (13 | 9.2%), together accounting for 80.2% of all Silver Creek residents.
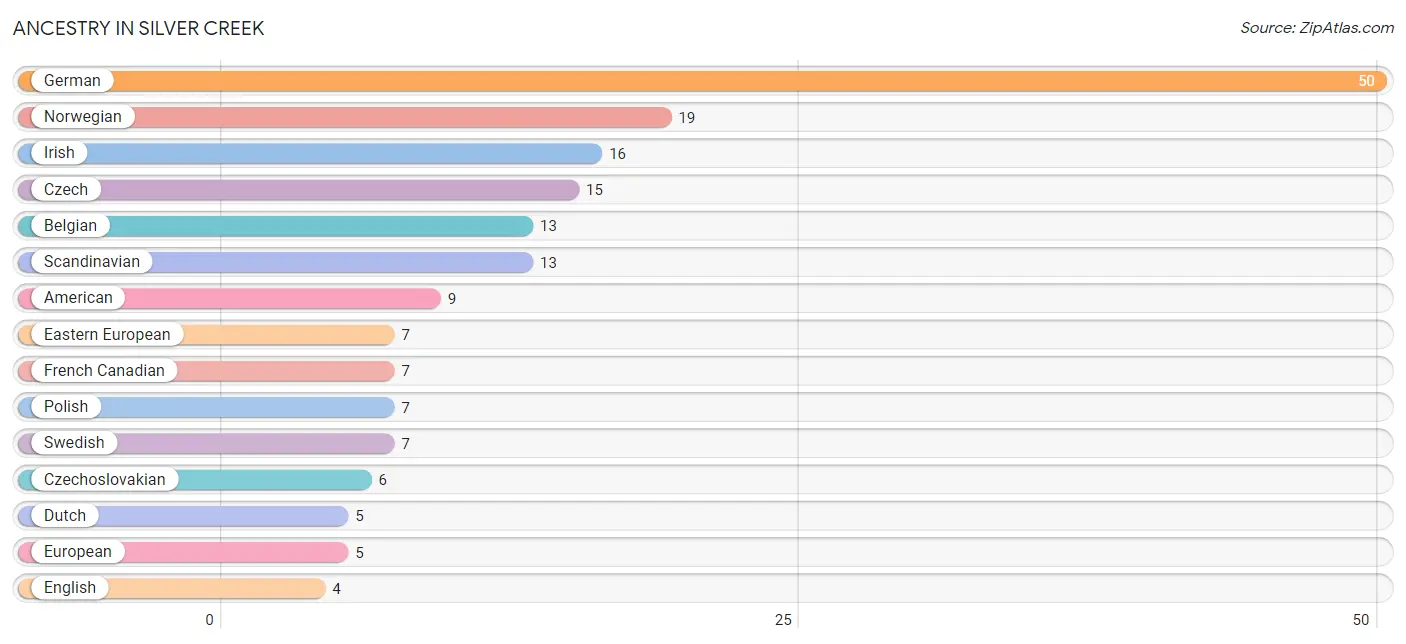
| Ancestry | # Population | % Population |
| American | 9 | 6.4% |
| Belgian | 13 | 9.2% |
| Czech | 15 | 10.6% |
| Czechoslovakian | 6 | 4.3% |
| Dutch | 5 | 3.5% |
| Eastern European | 7 | 5.0% |
| English | 4 | 2.8% |
| European | 5 | 3.5% |
| French Canadian | 7 | 5.0% |
| German | 50 | 35.5% |
| Irish | 16 | 11.4% |
| Norwegian | 19 | 13.5% |
| Polish | 7 | 5.0% |
| Scandinavian | 13 | 9.2% |
| Scotch-Irish | 4 | 2.8% |
| Swedish | 7 | 5.0% | View All 16 Rows |
Immigrants in Silver Creek

| Immigration Origin | # Population | % Population | View All 0 Rows |
Sex and Age in Silver Creek
Sex and Age in Silver Creek
The most populous age groups in Silver Creek are 65 to 69 Years (20 | 27.4%) for men and 60 to 64 Years (15 | 22.1%) for women.
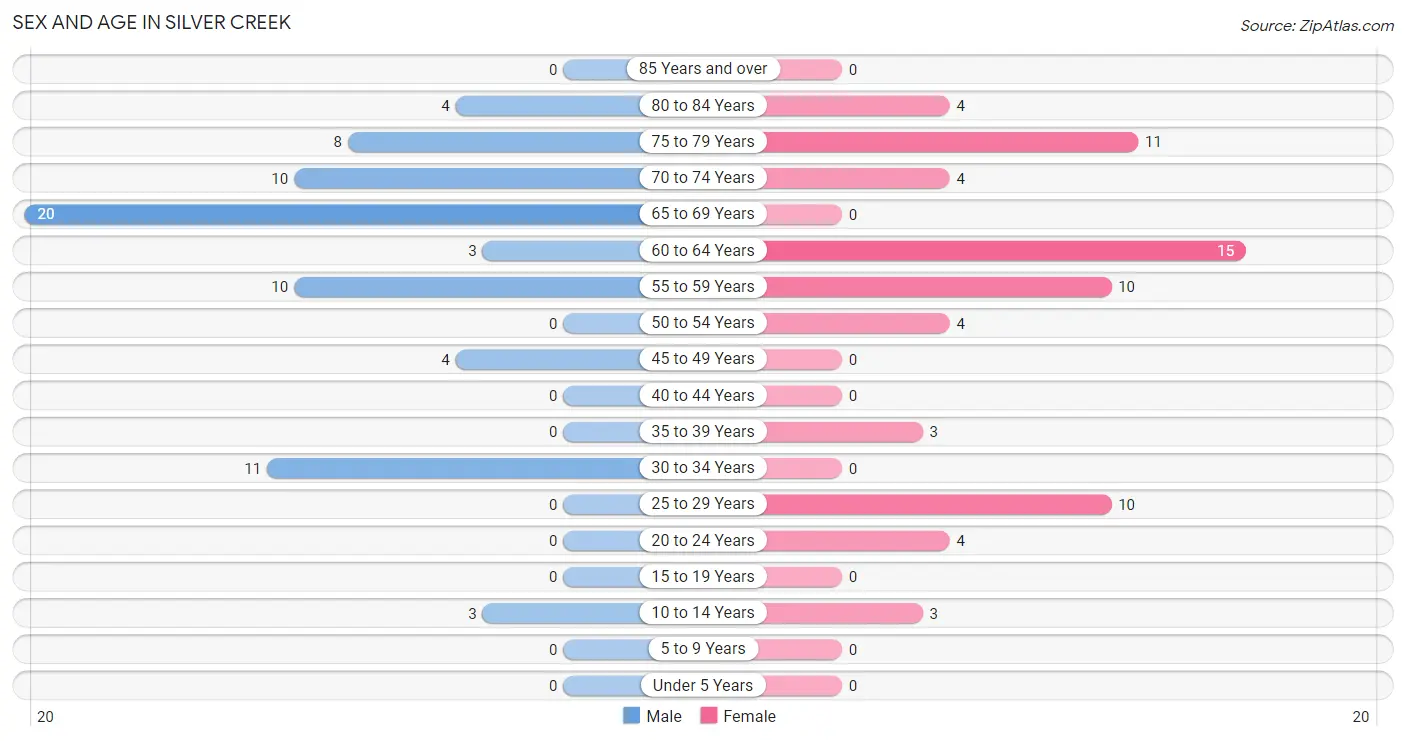
| Age Bracket | Male | Female |
| Under 5 Years | 0 (0.0%) | 0 (0.0%) |
| 5 to 9 Years | 0 (0.0%) | 0 (0.0%) |
| 10 to 14 Years | 3 (4.1%) | 3 (4.4%) |
| 15 to 19 Years | 0 (0.0%) | 0 (0.0%) |
| 20 to 24 Years | 0 (0.0%) | 4 (5.9%) |
| 25 to 29 Years | 0 (0.0%) | 10 (14.7%) |
| 30 to 34 Years | 11 (15.1%) | 0 (0.0%) |
| 35 to 39 Years | 0 (0.0%) | 3 (4.4%) |
| 40 to 44 Years | 0 (0.0%) | 0 (0.0%) |
| 45 to 49 Years | 4 (5.5%) | 0 (0.0%) |
| 50 to 54 Years | 0 (0.0%) | 4 (5.9%) |
| 55 to 59 Years | 10 (13.7%) | 10 (14.7%) |
| 60 to 64 Years | 3 (4.1%) | 15 (22.1%) |
| 65 to 69 Years | 20 (27.4%) | 0 (0.0%) |
| 70 to 74 Years | 10 (13.7%) | 4 (5.9%) |
| 75 to 79 Years | 8 (11.0%) | 11 (16.2%) |
| 80 to 84 Years | 4 (5.5%) | 4 (5.9%) |
| 85 Years and over | 0 (0.0%) | 0 (0.0%) |
| Total | 73 (100.0%) | 68 (100.0%) |
Families and Households in Silver Creek
Median Family Size in Silver Creek
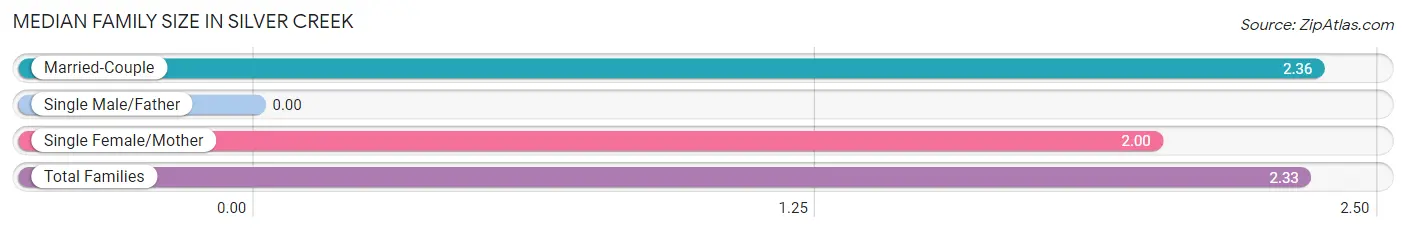
| Family Type | # Families | Family Size |
| Married-Couple | 47 (92.2%) | 2.36 |
| Single Male/Father | 0 (0.0%) | - |
| Single Female/Mother | 4 (7.8%) | 2.00 |
| Total Families | 51 (100.0%) | 2.33 |
Median Household Size in Silver Creek
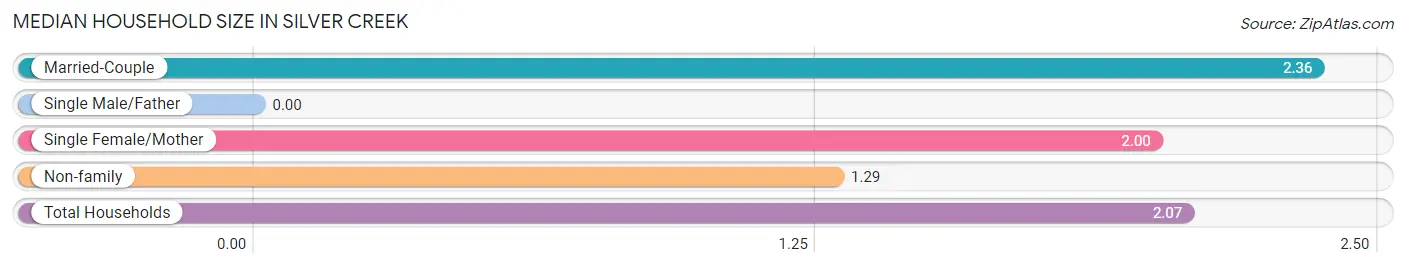
| Household Type | # Households | Household Size |
| Married-Couple | 47 (69.1%) | 2.36 |
| Single Male/Father | 0 (0.0%) | - |
| Single Female/Mother | 4 (5.9%) | 2.00 |
| Non-family | 17 (25.0%) | 1.29 |
| Total Households | 68 (100.0%) | 2.07 |
Household Size by Marriage Status in Silver Creek
Out of a total of 68 households in Silver Creek, 51 (75.0%) are family households, while 17 (25.0%) are nonfamily households. The most numerous type of family households are 2-person households, comprising 35, and the most common type of nonfamily households are 1-person households, comprising 12.
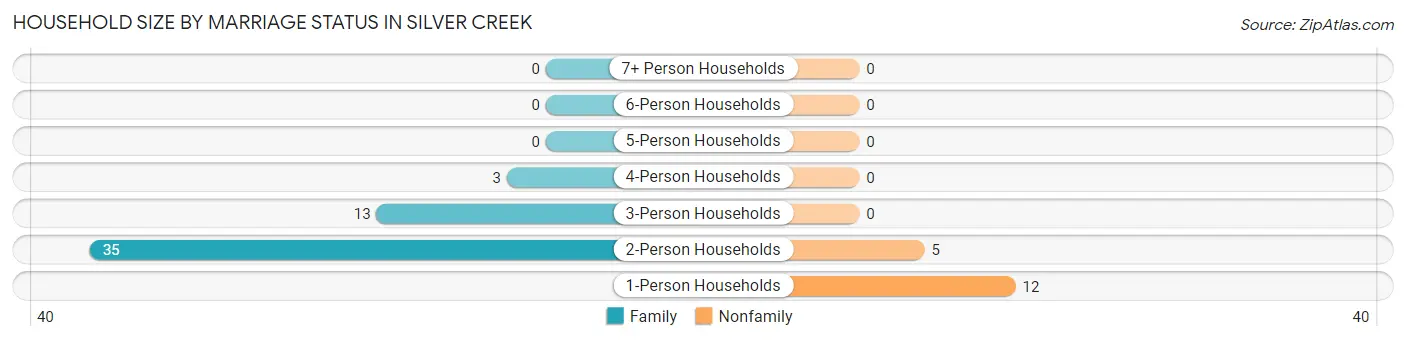
| Household Size | Family Households | Nonfamily Households |
| 1-Person Households | - | 12 (17.6%) |
| 2-Person Households | 35 (51.5%) | 5 (7.3%) |
| 3-Person Households | 13 (19.1%) | 0 (0.0%) |
| 4-Person Households | 3 (4.4%) | 0 (0.0%) |
| 5-Person Households | 0 (0.0%) | 0 (0.0%) |
| 6-Person Households | 0 (0.0%) | 0 (0.0%) |
| 7+ Person Households | 0 (0.0%) | 0 (0.0%) |
| Total | 51 (75.0%) | 17 (25.0%) |
Female Fertility in Silver Creek
Fertility by Age in Silver Creek
| Age Bracket | Women with Births | Births / 1,000 Women |
| 15 to 19 years | 0 (0.0%) | 0.0 |
| 20 to 34 years | 0 (0.0%) | 0.0 |
| 35 to 50 years | 0 (0.0%) | 0.0 |
| Total | 0 (0.0%) | 0.0 |
Fertility by Age by Marriage Status in Silver Creek
| Age Bracket | Married | Unmarried |
| 15 to 19 years | 0 (0.0%) | 0 (0.0%) |
| 20 to 34 years | 0 (0.0%) | 0 (0.0%) |
| 35 to 50 years | 0 (0.0%) | 0 (0.0%) |
| Total | 0 (0.0%) | 0 (0.0%) |
Fertility by Education in Silver Creek
| Educational Attainment | Women with Births | Births / 1,000 Women |
| Less than High School | 0 (0.0%) | 0.0 |
| High School Diploma | 0 (0.0%) | 0.0 |
| College or Associate's Degree | 0 (0.0%) | 0.0 |
| Bachelor's Degree | 0 (0.0%) | 0.0 |
| Graduate Degree | 0 (0.0%) | 0.0 |
| Total | 0 (0.0%) | 0.0 |
Fertility by Education by Marriage Status in Silver Creek
| Educational Attainment | Married | Unmarried |
| Less than High School | 0 (0.0%) | 0 (0.0%) |
| High School Diploma | 0 (0.0%) | 0 (0.0%) |
| College or Associate's Degree | 0 (0.0%) | 0 (0.0%) |
| Bachelor's Degree | 0 (0.0%) | 0 (0.0%) |
| Graduate Degree | 0 (0.0%) | 0 (0.0%) |
| Total | 0 (0.0%) | 0 (0.0%) |
Employment Characteristics in Silver Creek
Employment by Class of Employer in Silver Creek
Among the 66 employed individuals in Silver Creek, private company employees (45 | 68.2%), local government employees (12 | 18.2%), and self-employed (not incorporated) (5 | 7.6%) make up the most common classes of employment.
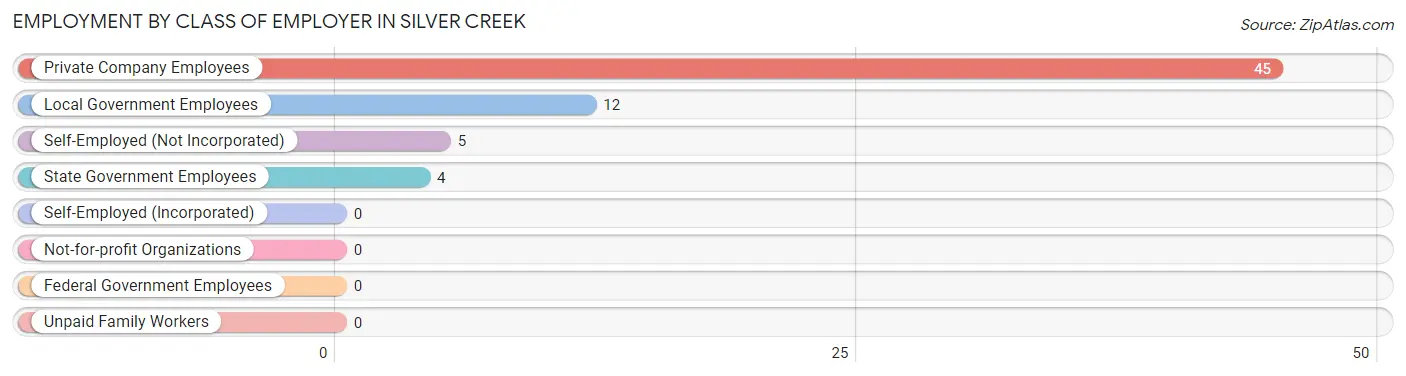
| Employer Class | # Employees | % Employees |
| Private Company Employees | 45 | 68.2% |
| Self-Employed (Incorporated) | 0 | 0.0% |
| Self-Employed (Not Incorporated) | 5 | 7.6% |
| Not-for-profit Organizations | 0 | 0.0% |
| Local Government Employees | 12 | 18.2% |
| State Government Employees | 4 | 6.1% |
| Federal Government Employees | 0 | 0.0% |
| Unpaid Family Workers | 0 | 0.0% |
| Total | 66 | 100.0% |
Employment Status by Age in Silver Creek
According to the labor force statistics for Silver Creek, out of the total population over 16 years of age (135), 52.6% or 71 individuals are in the labor force, with 7.0% or 5 of them unemployed. The age group with the highest labor force participation rate is 20 to 24 years, with 100.0% or 4 individuals in the labor force. Within the labor force, the 25 to 29 years age range has the highest percentage of unemployed individuals, with 100.0% or 5 of them being unemployed.
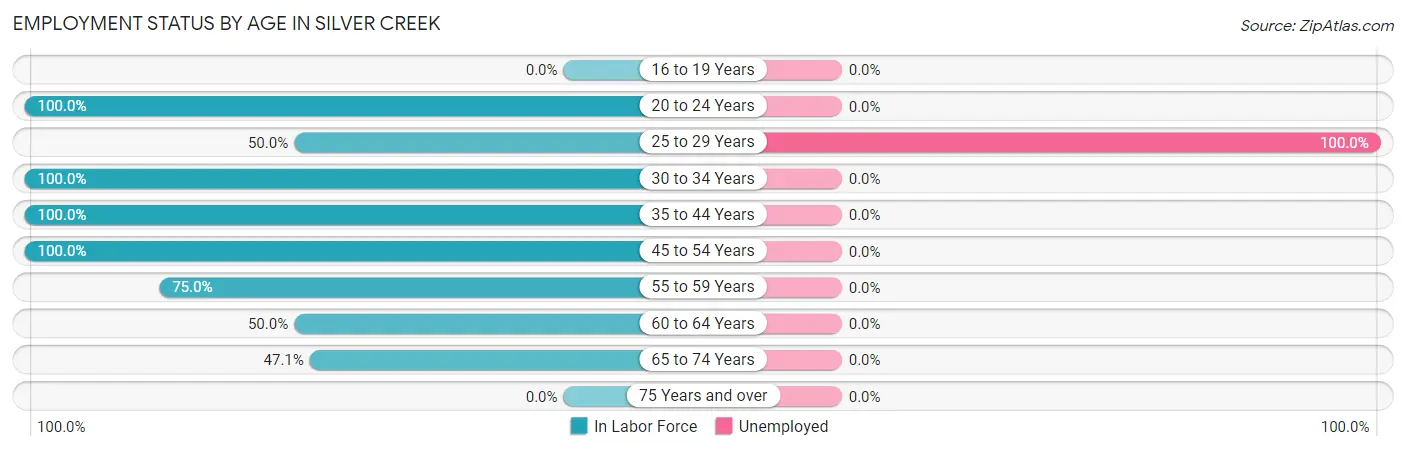
| Age Bracket | In Labor Force | Unemployed |
| 16 to 19 Years | 0 (0.0%) | 0 (0.0%) |
| 20 to 24 Years | 4 (100.0%) | 0 (0.0%) |
| 25 to 29 Years | 5 (50.0%) | 5 (100.0%) |
| 30 to 34 Years | 11 (100.0%) | 0 (0.0%) |
| 35 to 44 Years | 3 (100.0%) | 0 (0.0%) |
| 45 to 54 Years | 8 (100.0%) | 0 (0.0%) |
| 55 to 59 Years | 15 (75.0%) | 0 (0.0%) |
| 60 to 64 Years | 9 (50.0%) | 0 (0.0%) |
| 65 to 74 Years | 16 (47.1%) | 0 (0.0%) |
| 75 Years and over | 0 (0.0%) | 0 (0.0%) |
| Total | 71 (52.6%) | 5 (7.0%) |
Employment Status by Educational Attainment in Silver Creek
According to labor force statistics for Silver Creek, 72.9% of individuals (51) out of the total population between 25 and 64 years of age (70) are in the labor force, with 9.8% or 5 of them being unemployed. The group with the highest labor force participation rate are those with the educational attainment of bachelor's degree or higher, with 100.0% or 9 individuals in the labor force. Within the labor force, individuals with college / associate degree education have the highest percentage of unemployment, with 17.9% or 5 of them being unemployed.
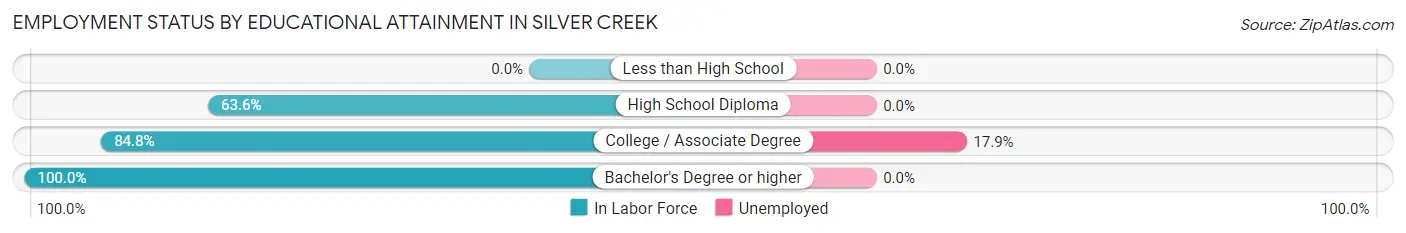
| Educational Attainment | In Labor Force | Unemployed |
| Less than High School | 0 (0.0%) | 0 (0.0%) |
| High School Diploma | 14 (63.6%) | 0 (0.0%) |
| College / Associate Degree | 28 (84.8%) | 6 (17.9%) |
| Bachelor's Degree or higher | 9 (100.0%) | 0 (0.0%) |
| Total | 51 (72.9%) | 7 (9.8%) |
Employment Occupations by Sex in Silver Creek
Management, Business, Science and Arts Occupations
The most common Management, Business, Science and Arts occupations in Silver Creek are Computers, Engineering & Science (4 | 6.1%), Architecture & Engineering (4 | 6.1%), Community & Social Service (3 | 4.5%), and Education Instruction & Library (3 | 4.5%).
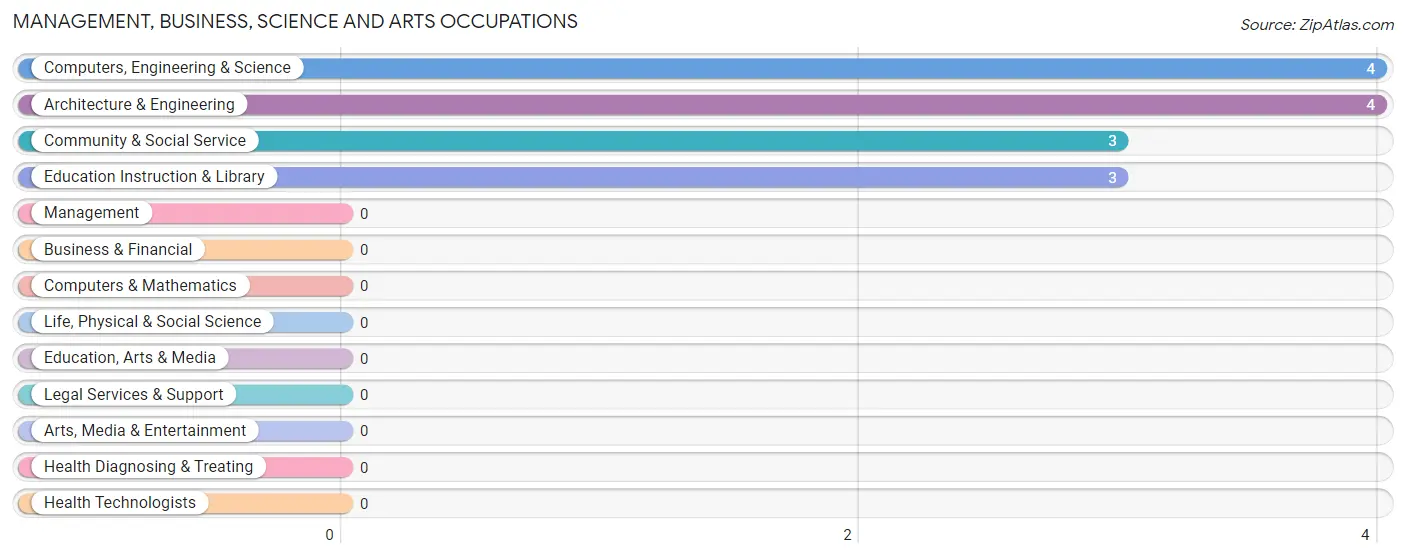
Management, Business, Science and Arts Occupations by Sex
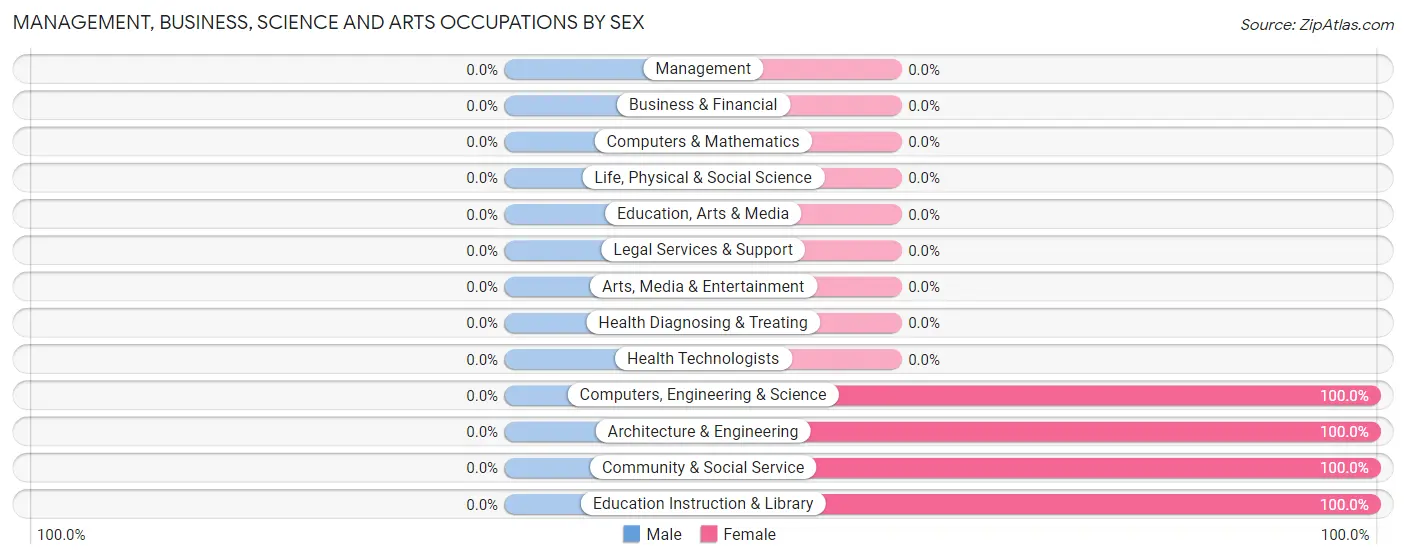
| Occupation | Male | Female |
| Management | 0 (0.0%) | 0 (0.0%) |
| Business & Financial | 0 (0.0%) | 0 (0.0%) |
| Computers, Engineering & Science | 0 (0.0%) | 4 (100.0%) |
| Computers & Mathematics | 0 (0.0%) | 0 (0.0%) |
| Architecture & Engineering | 0 (0.0%) | 4 (100.0%) |
| Life, Physical & Social Science | 0 (0.0%) | 0 (0.0%) |
| Community & Social Service | 0 (0.0%) | 3 (100.0%) |
| Education, Arts & Media | 0 (0.0%) | 0 (0.0%) |
| Legal Services & Support | 0 (0.0%) | 0 (0.0%) |
| Education Instruction & Library | 0 (0.0%) | 3 (100.0%) |
| Arts, Media & Entertainment | 0 (0.0%) | 0 (0.0%) |
| Health Diagnosing & Treating | 0 (0.0%) | 0 (0.0%) |
| Health Technologists | 0 (0.0%) | 0 (0.0%) |
| Total (Category) | 0 (0.0%) | 7 (100.0%) |
| Total (Overall) | 36 (54.5%) | 30 (45.5%) |
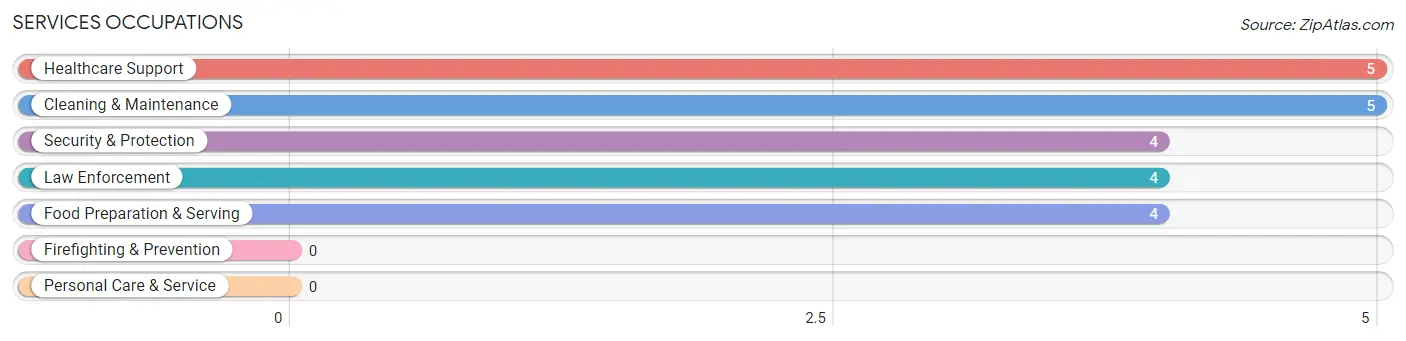
Services Occupations
The most common Services occupations in Silver Creek are Healthcare Support (5 | 7.6%), Cleaning & Maintenance (5 | 7.6%), Security & Protection (4 | 6.1%), Law Enforcement (4 | 6.1%), and Food Preparation & Serving (4 | 6.1%).
Services Occupations by Sex
Within the Services occupations in Silver Creek, the most male-oriented occupations are Food Preparation & Serving (100.0%), and Cleaning & Maintenance (100.0%), while the most female-oriented occupations are Healthcare Support (100.0%), Security & Protection (100.0%), and Law Enforcement (100.0%).
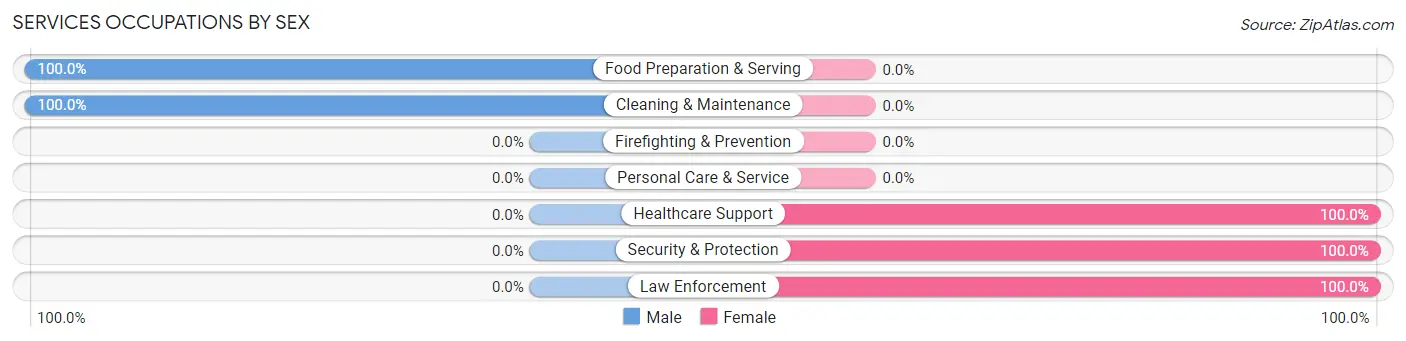
| Occupation | Male | Female |
| Healthcare Support | 0 (0.0%) | 5 (100.0%) |
| Security & Protection | 0 (0.0%) | 4 (100.0%) |
| Firefighting & Prevention | 0 (0.0%) | 0 (0.0%) |
| Law Enforcement | 0 (0.0%) | 4 (100.0%) |
| Food Preparation & Serving | 4 (100.0%) | 0 (0.0%) |
| Cleaning & Maintenance | 5 (100.0%) | 0 (0.0%) |
| Personal Care & Service | 0 (0.0%) | 0 (0.0%) |
| Total (Category) | 9 (50.0%) | 9 (50.0%) |
| Total (Overall) | 36 (54.5%) | 30 (45.5%) |
Sales and Office Occupations
The most common Sales and Office occupations in Silver Creek are , and Office & Administration (19 | 28.8%).
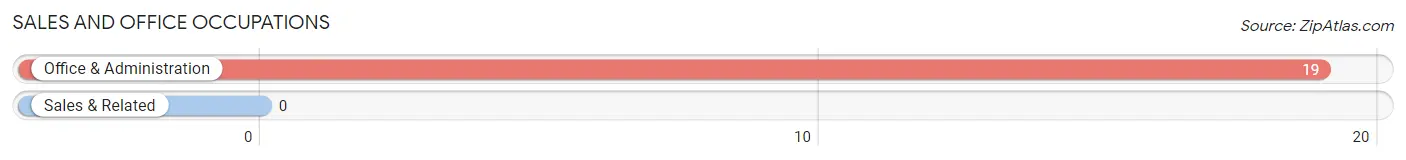
Sales and Office Occupations by Sex
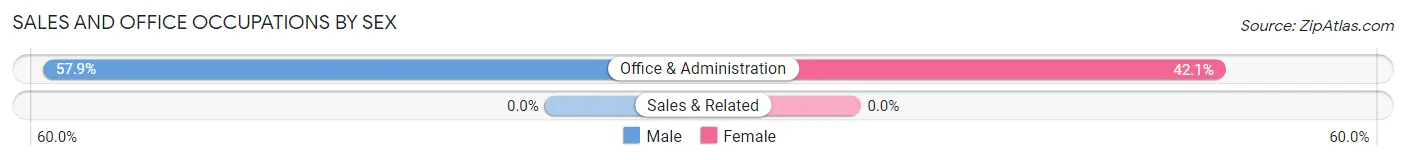
| Occupation | Male | Female |
| Sales & Related | 0 (0.0%) | 0 (0.0%) |
| Office & Administration | 11 (57.9%) | 8 (42.1%) |
| Total (Category) | 11 (57.9%) | 8 (42.1%) |
| Total (Overall) | 36 (54.5%) | 30 (45.5%) |
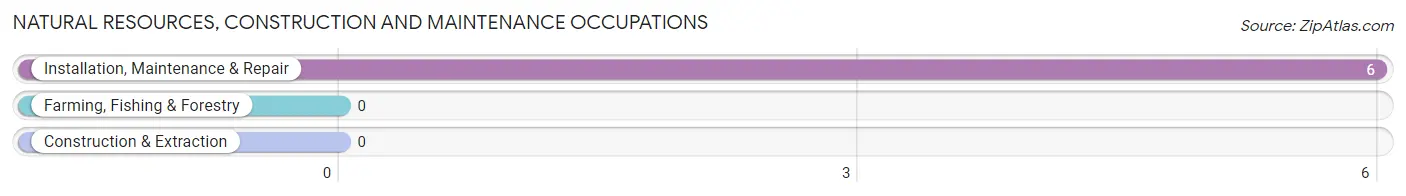
Natural Resources, Construction and Maintenance Occupations
The most common Natural Resources, Construction and Maintenance occupations in Silver Creek are , and Installation, Maintenance & Repair (6 | 9.1%).
Natural Resources, Construction and Maintenance Occupations by Sex
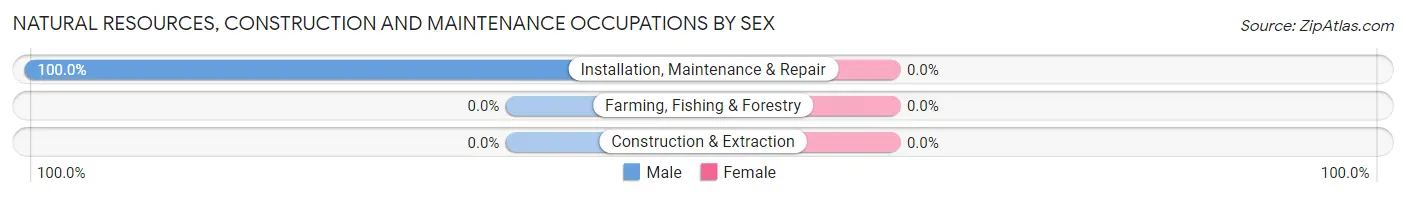
| Occupation | Male | Female |
| Farming, Fishing & Forestry | 0 (0.0%) | 0 (0.0%) |
| Construction & Extraction | 0 (0.0%) | 0 (0.0%) |
| Installation, Maintenance & Repair | 6 (100.0%) | 0 (0.0%) |
| Total (Category) | 6 (100.0%) | 0 (0.0%) |
| Total (Overall) | 36 (54.5%) | 30 (45.5%) |
Production, Transportation and Moving Occupations
The most common Production, Transportation and Moving occupations in Silver Creek are Production (11 | 16.7%), and Material Moving (5 | 7.6%).
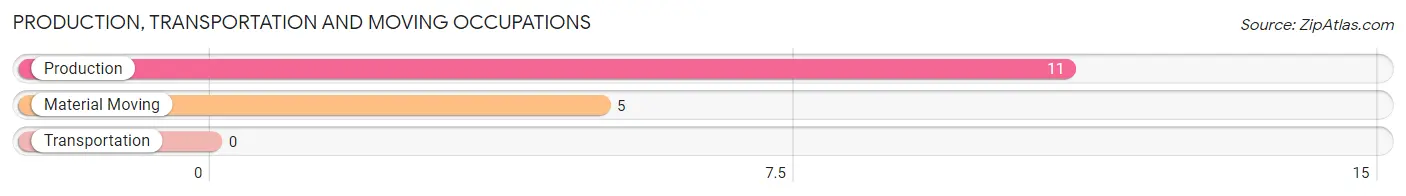
Production, Transportation and Moving Occupations by Sex
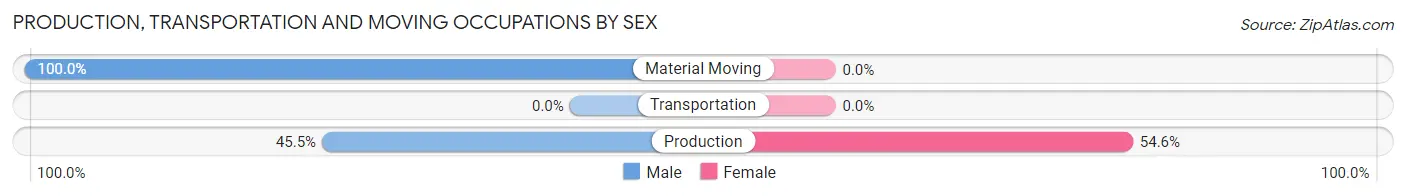
| Occupation | Male | Female |
| Production | 5 (45.5%) | 6 (54.5%) |
| Transportation | 0 (0.0%) | 0 (0.0%) |
| Material Moving | 5 (100.0%) | 0 (0.0%) |
| Total (Category) | 10 (62.5%) | 6 (37.5%) |
| Total (Overall) | 36 (54.5%) | 30 (45.5%) |
Employment Industries by Sex in Silver Creek
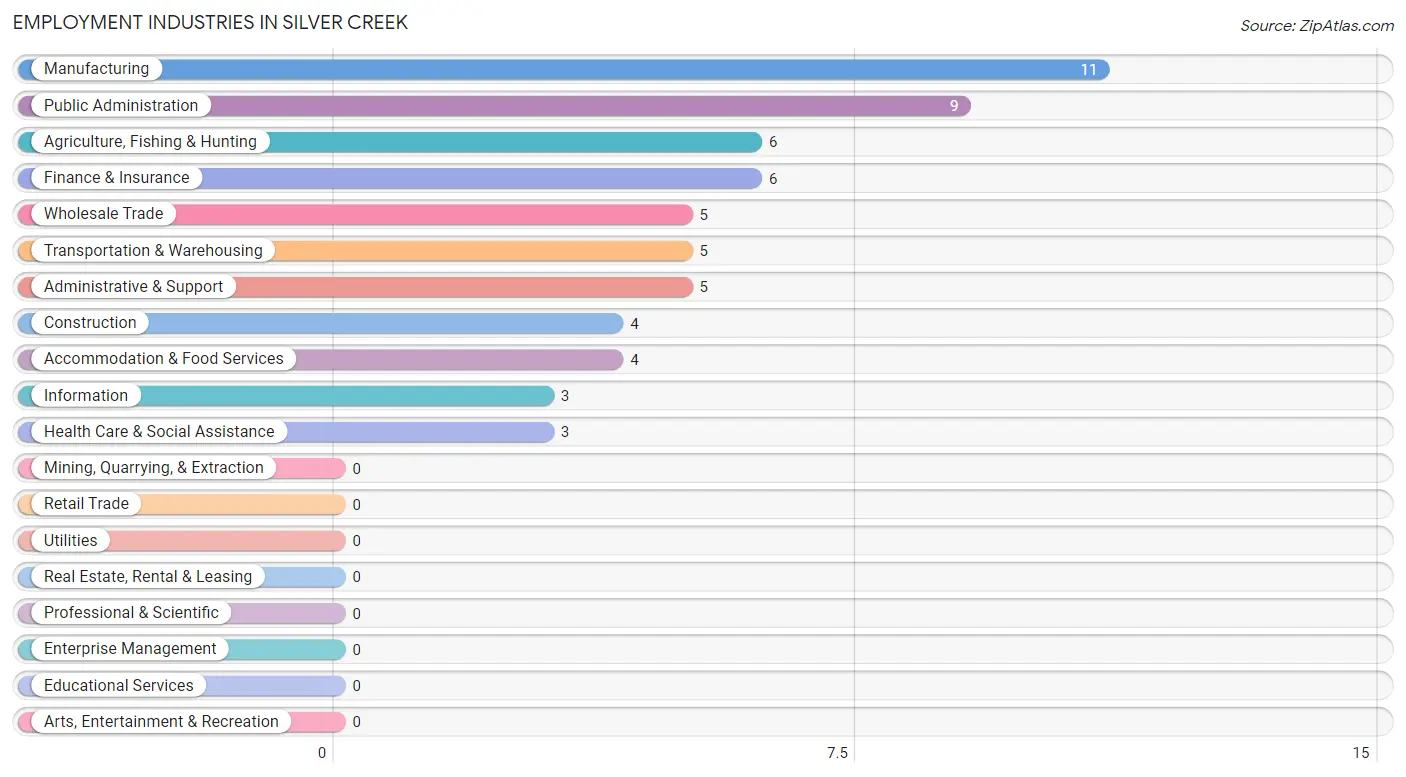
Employment Industries in Silver Creek
The major employment industries in Silver Creek include Manufacturing (11 | 16.7%), Public Administration (9 | 13.6%), Agriculture, Fishing & Hunting (6 | 9.1%), Finance & Insurance (6 | 9.1%), and Wholesale Trade (5 | 7.6%).
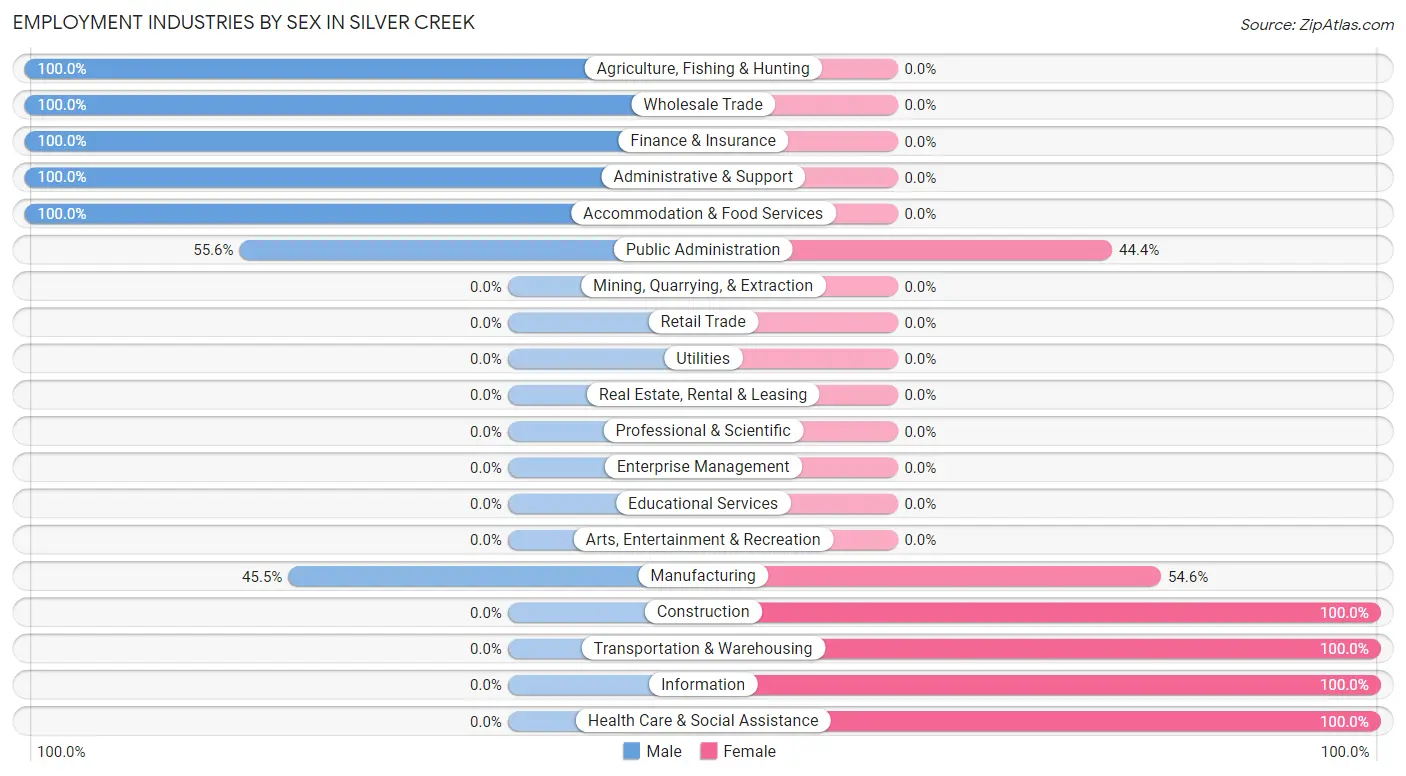
Employment Industries by Sex in Silver Creek
The Silver Creek industries that see more men than women are Agriculture, Fishing & Hunting (100.0%), Wholesale Trade (100.0%), and Finance & Insurance (100.0%), whereas the industries that tend to have a higher number of women are Construction (100.0%), Transportation & Warehousing (100.0%), and Information (100.0%).
| Industry | Male | Female |
| Agriculture, Fishing & Hunting | 6 (100.0%) | 0 (0.0%) |
| Mining, Quarrying, & Extraction | 0 (0.0%) | 0 (0.0%) |
| Construction | 0 (0.0%) | 4 (100.0%) |
| Manufacturing | 5 (45.5%) | 6 (54.5%) |
| Wholesale Trade | 5 (100.0%) | 0 (0.0%) |
| Retail Trade | 0 (0.0%) | 0 (0.0%) |
| Transportation & Warehousing | 0 (0.0%) | 5 (100.0%) |
| Utilities | 0 (0.0%) | 0 (0.0%) |
| Information | 0 (0.0%) | 3 (100.0%) |
| Finance & Insurance | 6 (100.0%) | 0 (0.0%) |
| Real Estate, Rental & Leasing | 0 (0.0%) | 0 (0.0%) |
| Professional & Scientific | 0 (0.0%) | 0 (0.0%) |
| Enterprise Management | 0 (0.0%) | 0 (0.0%) |
| Administrative & Support | 5 (100.0%) | 0 (0.0%) |
| Educational Services | 0 (0.0%) | 0 (0.0%) |
| Health Care & Social Assistance | 0 (0.0%) | 3 (100.0%) |
| Arts, Entertainment & Recreation | 0 (0.0%) | 0 (0.0%) |
| Accommodation & Food Services | 4 (100.0%) | 0 (0.0%) |
| Public Administration | 5 (55.6%) | 4 (44.4%) |
| Total | 36 (54.5%) | 30 (45.5%) |
Education in Silver Creek
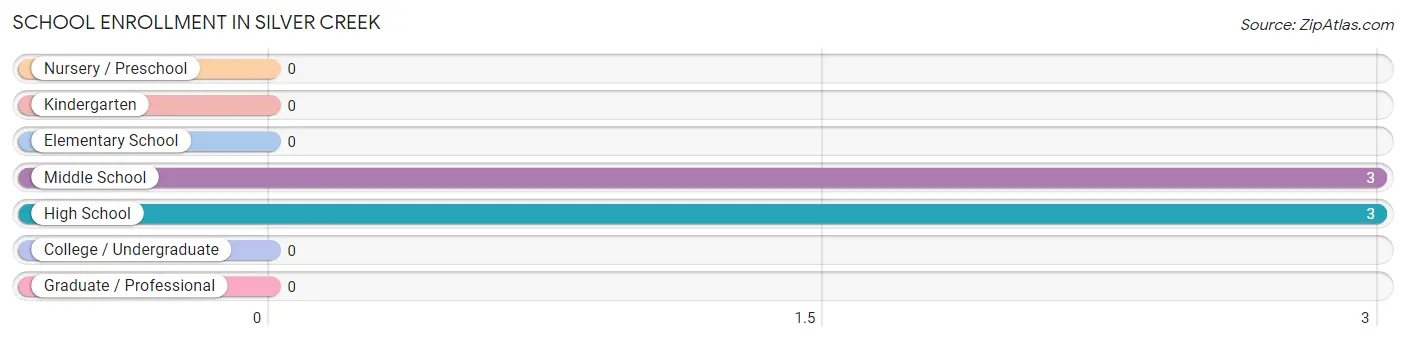
School Enrollment in Silver Creek
The most common levels of schooling among the 6 students in Silver Creek are middle school (3 | 50.0%), and high school (3 | 50.0%).
| School Level | # Students | % Students |
| Nursery / Preschool | 0 | 0.0% |
| Kindergarten | 0 | 0.0% |
| Elementary School | 0 | 0.0% |
| Middle School | 3 | 50.0% |
| High School | 3 | 50.0% |
| College / Undergraduate | 0 | 0.0% |
| Graduate / Professional | 0 | 0.0% |
| Total | 6 | 100.0% |
School Enrollment by Age by Funding Source in Silver Creek
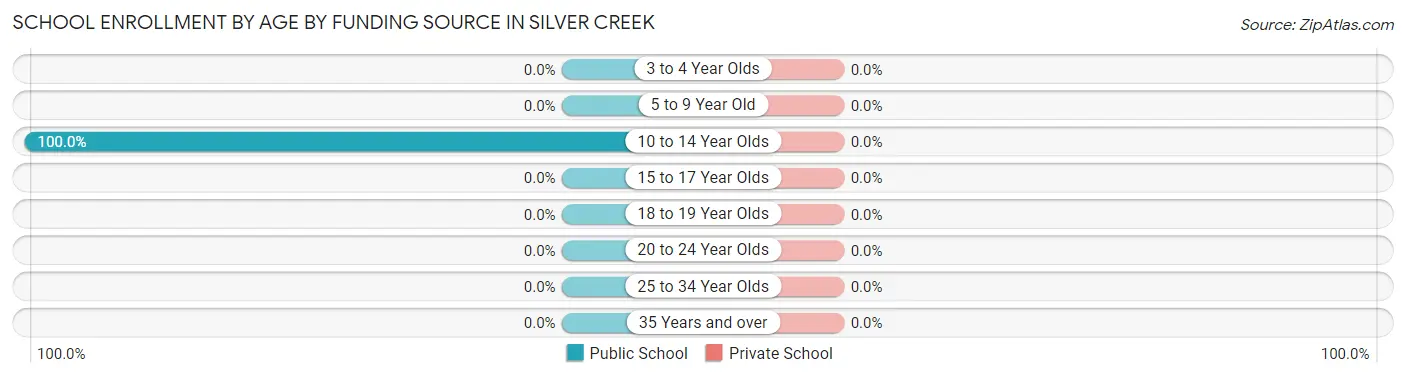
| Age Bracket | Public School | Private School |
| 3 to 4 Year Olds | 0 (0.0%) | 0 (0.0%) |
| 5 to 9 Year Old | 0 (0.0%) | 0 (0.0%) |
| 10 to 14 Year Olds | 6 (100.0%) | 0 (0.0%) |
| 15 to 17 Year Olds | 0 (0.0%) | 0 (0.0%) |
| 18 to 19 Year Olds | 0 (0.0%) | 0 (0.0%) |
| 20 to 24 Year Olds | 0 (0.0%) | 0 (0.0%) |
| 25 to 34 Year Olds | 0 (0.0%) | 0 (0.0%) |
| 35 Years and over | 0 (0.0%) | 0 (0.0%) |
| Total | 6 (100.0%) | 0 (0.0%) |
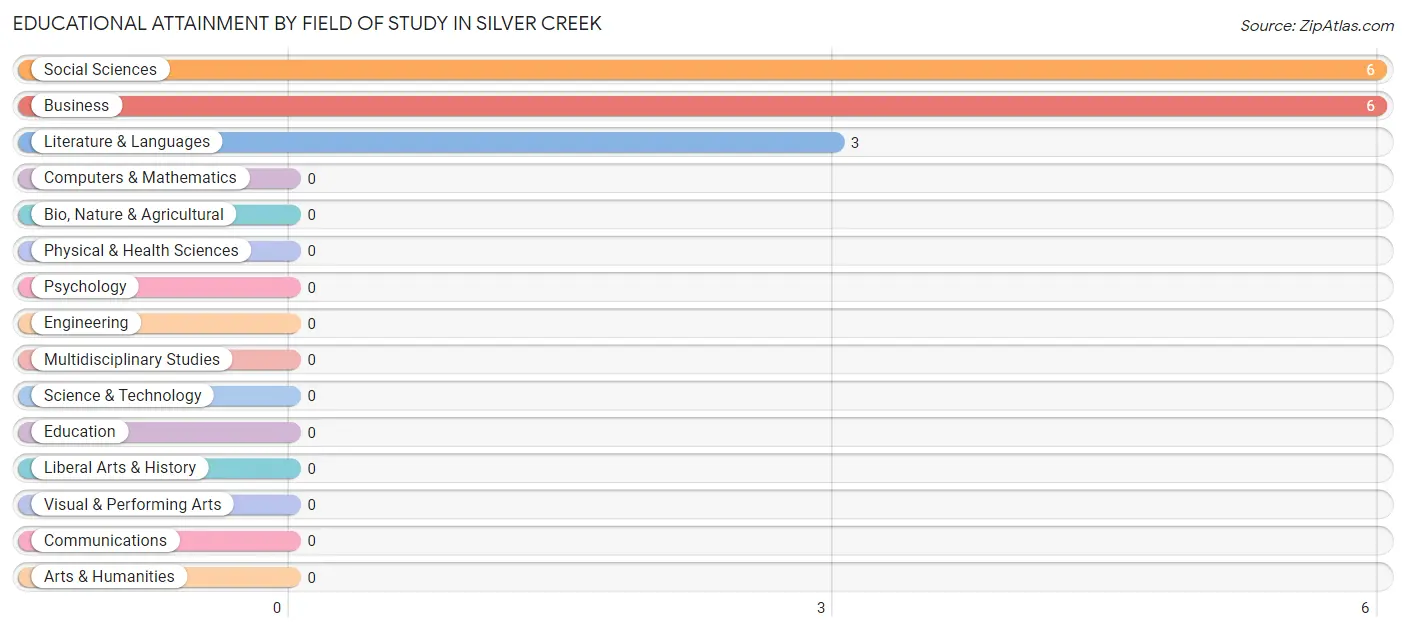
Educational Attainment by Field of Study in Silver Creek
Social sciences (6 | 40.0%), business (6 | 40.0%), and literature & languages (3 | 20.0%) are the most common fields of study among 15 individuals in Silver Creek who have obtained a bachelor's degree or higher.
| Field of Study | # Graduates | % Graduates |
| Computers & Mathematics | 0 | 0.0% |
| Bio, Nature & Agricultural | 0 | 0.0% |
| Physical & Health Sciences | 0 | 0.0% |
| Psychology | 0 | 0.0% |
| Social Sciences | 6 | 40.0% |
| Engineering | 0 | 0.0% |
| Multidisciplinary Studies | 0 | 0.0% |
| Science & Technology | 0 | 0.0% |
| Business | 6 | 40.0% |
| Education | 0 | 0.0% |
| Literature & Languages | 3 | 20.0% |
| Liberal Arts & History | 0 | 0.0% |
| Visual & Performing Arts | 0 | 0.0% |
| Communications | 0 | 0.0% |
| Arts & Humanities | 0 | 0.0% |
| Total | 15 | 100.0% |
Transportation & Commute in Silver Creek
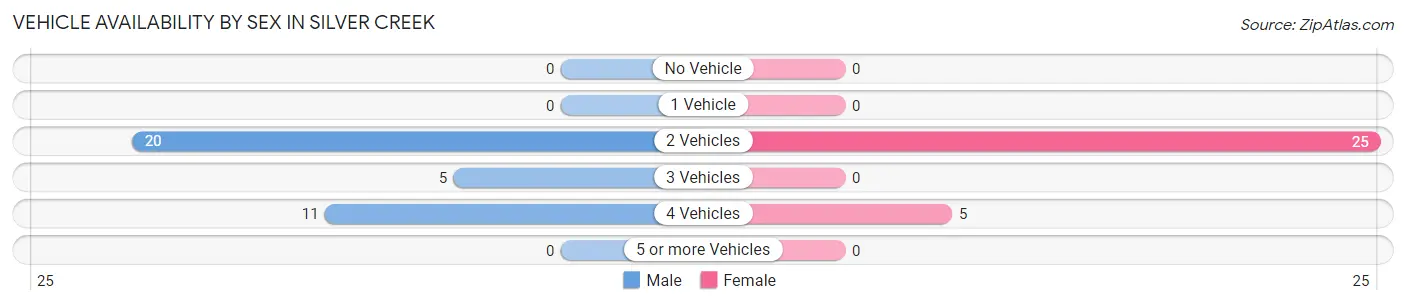
Vehicle Availability by Sex in Silver Creek
The most prevalent vehicle ownership categories in Silver Creek are males with 2 vehicles (20, accounting for 55.6%) and females with 2 vehicles (25, making up 66.7%).
| Vehicles Available | Male | Female |
| No Vehicle | 0 (0.0%) | 0 (0.0%) |
| 1 Vehicle | 0 (0.0%) | 0 (0.0%) |
| 2 Vehicles | 20 (55.6%) | 25 (83.3%) |
| 3 Vehicles | 5 (13.9%) | 0 (0.0%) |
| 4 Vehicles | 11 (30.6%) | 5 (16.7%) |
| 5 or more Vehicles | 0 (0.0%) | 0 (0.0%) |
| Total | 36 (100.0%) | 30 (100.0%) |
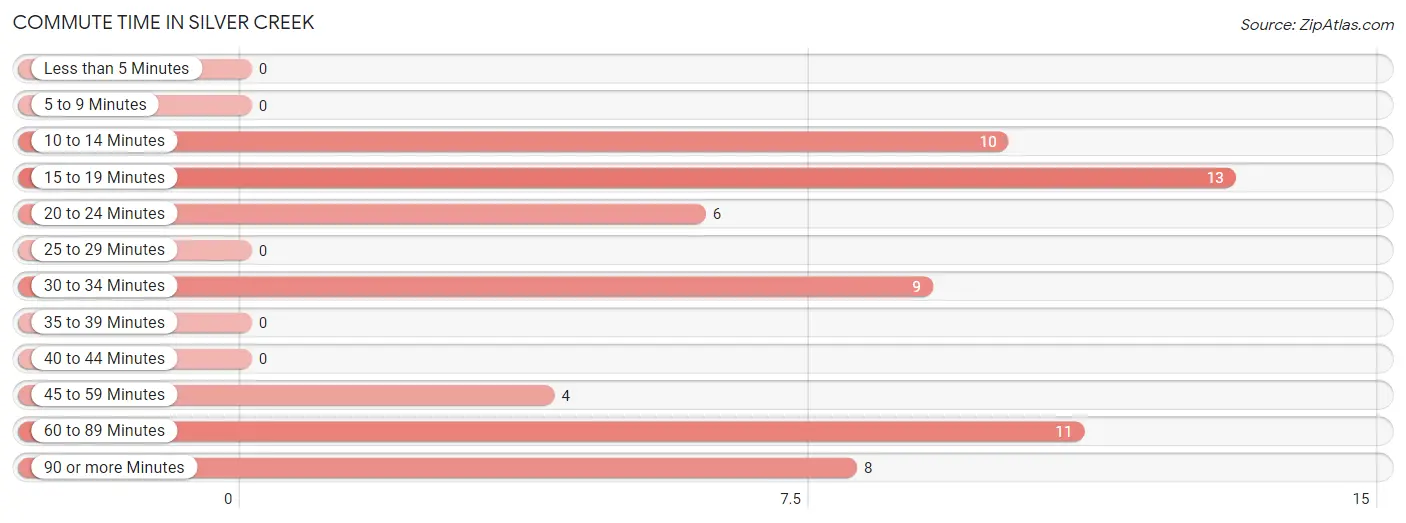
Commute Time in Silver Creek
The most frequently occuring commute durations in Silver Creek are 15 to 19 minutes (13 commuters, 21.3%), 60 to 89 minutes (11 commuters, 18.0%), and 10 to 14 minutes (10 commuters, 16.4%).
| Commute Time | # Commuters | % Commuters |
| Less than 5 Minutes | 0 | 0.0% |
| 5 to 9 Minutes | 0 | 0.0% |
| 10 to 14 Minutes | 10 | 16.4% |
| 15 to 19 Minutes | 13 | 21.3% |
| 20 to 24 Minutes | 6 | 9.8% |
| 25 to 29 Minutes | 0 | 0.0% |
| 30 to 34 Minutes | 9 | 14.7% |
| 35 to 39 Minutes | 0 | 0.0% |
| 40 to 44 Minutes | 0 | 0.0% |
| 45 to 59 Minutes | 4 | 6.6% |
| 60 to 89 Minutes | 11 | 18.0% |
| 90 or more Minutes | 8 | 13.1% |
Commute Time by Sex in Silver Creek
The most common commute times in Silver Creek are 60 to 89 minutes (11 commuters, 30.6%) for males and 90 or more minutes (8 commuters, 32.0%) for females.
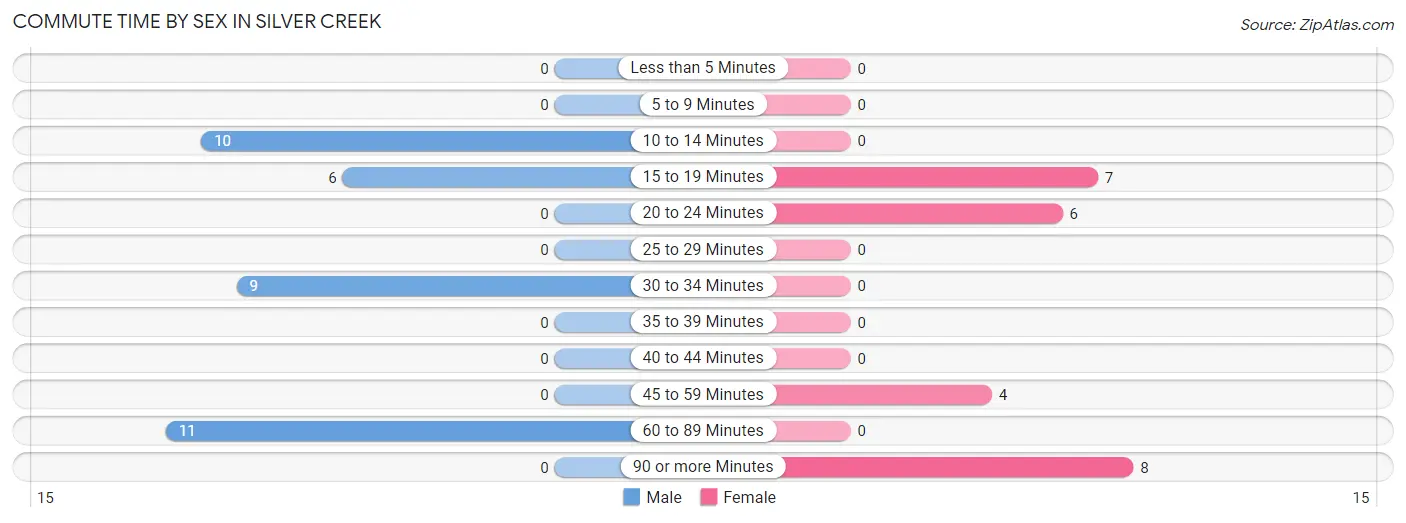
| Commute Time | Male | Female |
| Less than 5 Minutes | 0 (0.0%) | 0 (0.0%) |
| 5 to 9 Minutes | 0 (0.0%) | 0 (0.0%) |
| 10 to 14 Minutes | 10 (27.8%) | 0 (0.0%) |
| 15 to 19 Minutes | 6 (16.7%) | 7 (28.0%) |
| 20 to 24 Minutes | 0 (0.0%) | 6 (24.0%) |
| 25 to 29 Minutes | 0 (0.0%) | 0 (0.0%) |
| 30 to 34 Minutes | 9 (25.0%) | 0 (0.0%) |
| 35 to 39 Minutes | 0 (0.0%) | 0 (0.0%) |
| 40 to 44 Minutes | 0 (0.0%) | 0 (0.0%) |
| 45 to 59 Minutes | 0 (0.0%) | 4 (16.0%) |
| 60 to 89 Minutes | 11 (30.6%) | 0 (0.0%) |
| 90 or more Minutes | 0 (0.0%) | 8 (32.0%) |
Time of Departure to Work by Sex in Silver Creek
The most frequent times of departure to work in Silver Creek are 7:00 AM to 7:29 AM (11, 30.6%) for males and 5:00 AM to 5:29 AM (15, 60.0%) for females.
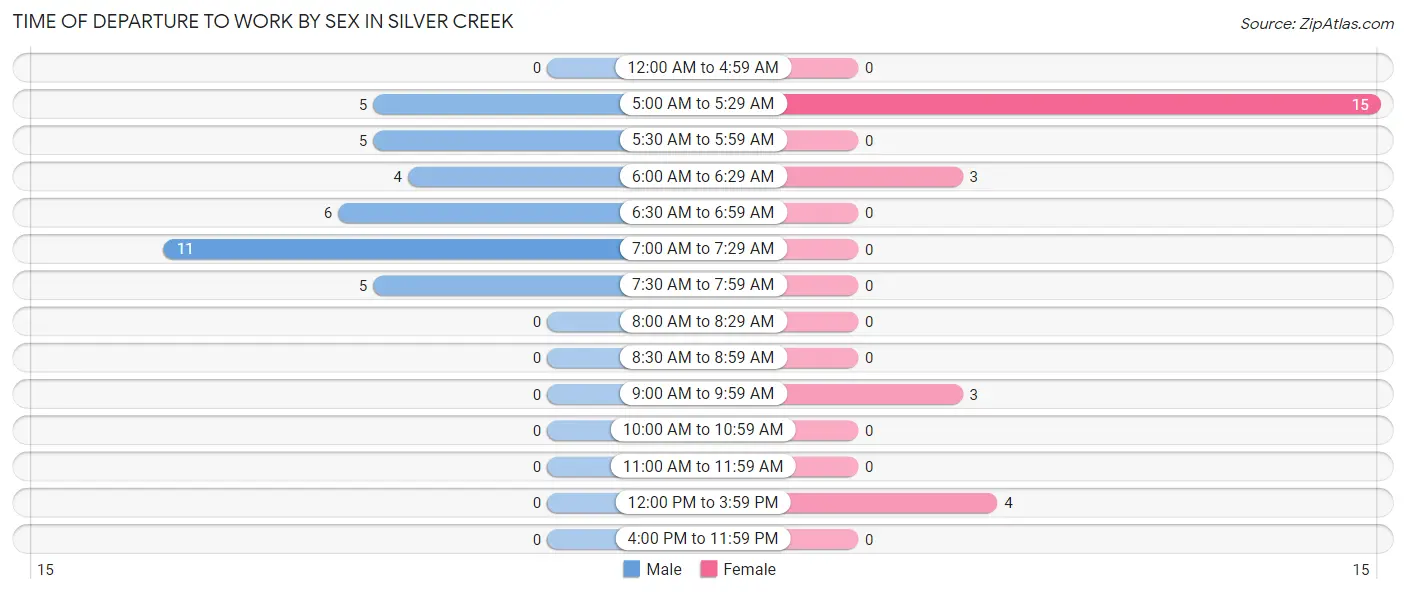
| Time of Departure | Male | Female |
| 12:00 AM to 4:59 AM | 0 (0.0%) | 0 (0.0%) |
| 5:00 AM to 5:29 AM | 5 (13.9%) | 15 (60.0%) |
| 5:30 AM to 5:59 AM | 5 (13.9%) | 0 (0.0%) |
| 6:00 AM to 6:29 AM | 4 (11.1%) | 3 (12.0%) |
| 6:30 AM to 6:59 AM | 6 (16.7%) | 0 (0.0%) |
| 7:00 AM to 7:29 AM | 11 (30.6%) | 0 (0.0%) |
| 7:30 AM to 7:59 AM | 5 (13.9%) | 0 (0.0%) |
| 8:00 AM to 8:29 AM | 0 (0.0%) | 0 (0.0%) |
| 8:30 AM to 8:59 AM | 0 (0.0%) | 0 (0.0%) |
| 9:00 AM to 9:59 AM | 0 (0.0%) | 3 (12.0%) |
| 10:00 AM to 10:59 AM | 0 (0.0%) | 0 (0.0%) |
| 11:00 AM to 11:59 AM | 0 (0.0%) | 0 (0.0%) |
| 12:00 PM to 3:59 PM | 0 (0.0%) | 4 (16.0%) |
| 4:00 PM to 11:59 PM | 0 (0.0%) | 0 (0.0%) |
| Total | 36 (100.0%) | 25 (100.0%) |
Housing Occupancy in Silver Creek
Occupancy by Ownership in Silver Creek
Of the total 68 dwellings in Silver Creek, owner-occupied units account for 60 (88.2%), while renter-occupied units make up 8 (11.8%).
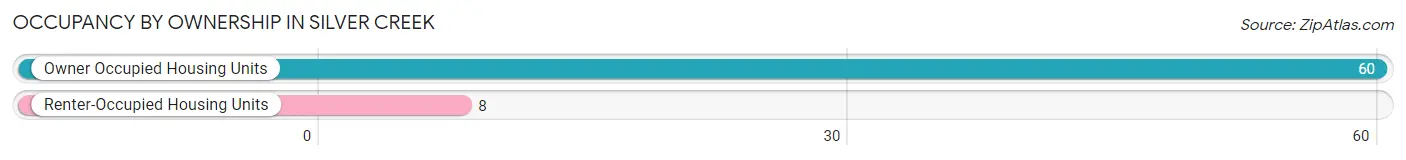
| Occupancy | # Housing Units | % Housing Units |
| Owner Occupied Housing Units | 60 | 88.2% |
| Renter-Occupied Housing Units | 8 | 11.8% |
| Total Occupied Housing Units | 68 | 100.0% |
Occupancy by Household Size in Silver Creek
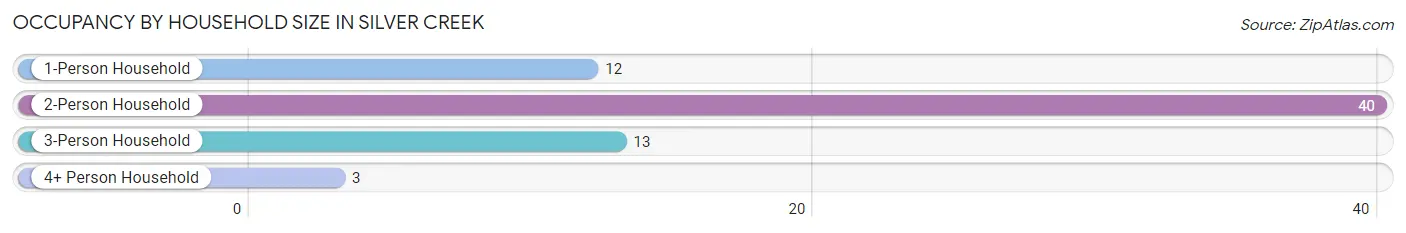
| Household Size | # Housing Units | % Housing Units |
| 1-Person Household | 12 | 17.6% |
| 2-Person Household | 40 | 58.8% |
| 3-Person Household | 13 | 19.1% |
| 4+ Person Household | 3 | 4.4% |
| Total Housing Units | 68 | 100.0% |
Occupancy by Ownership by Household Size in Silver Creek
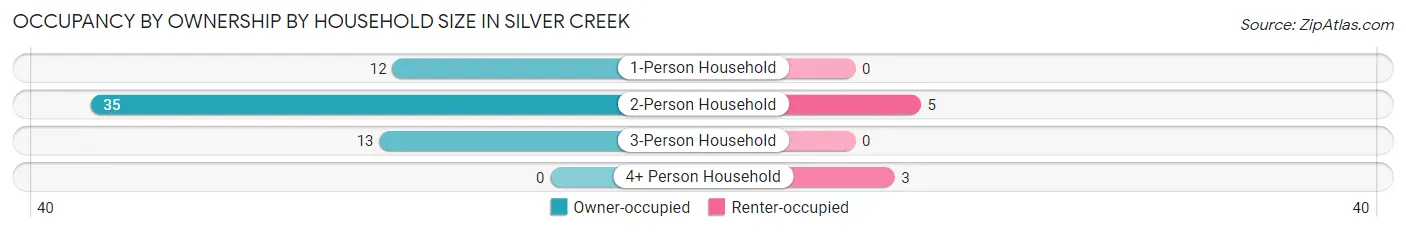
| Household Size | Owner-occupied | Renter-occupied |
| 1-Person Household | 12 (100.0%) | 0 (0.0%) |
| 2-Person Household | 35 (87.5%) | 5 (12.5%) |
| 3-Person Household | 13 (100.0%) | 0 (0.0%) |
| 4+ Person Household | 0 (0.0%) | 3 (100.0%) |
| Total Housing Units | 60 (88.2%) | 8 (11.8%) |
Occupancy by Educational Attainment in Silver Creek
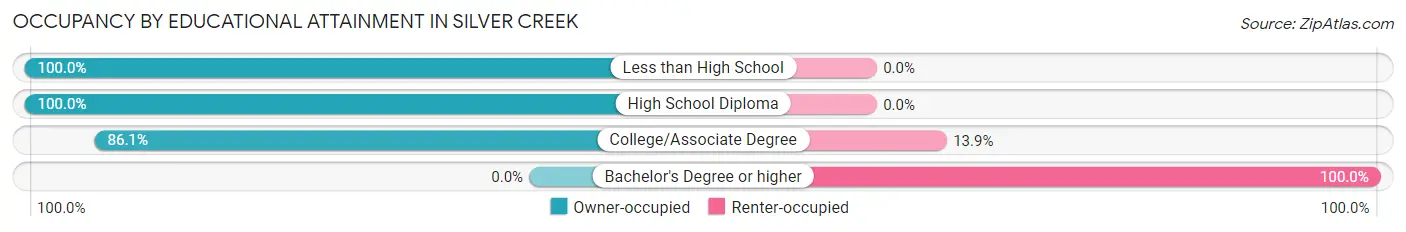
| Household Size | Owner-occupied | Renter-occupied |
| Less than High School | 6 (100.0%) | 0 (0.0%) |
| High School Diploma | 23 (100.0%) | 0 (0.0%) |
| College/Associate Degree | 31 (86.1%) | 5 (13.9%) |
| Bachelor's Degree or higher | 0 (0.0%) | 3 (100.0%) |
Occupancy by Age of Householder in Silver Creek
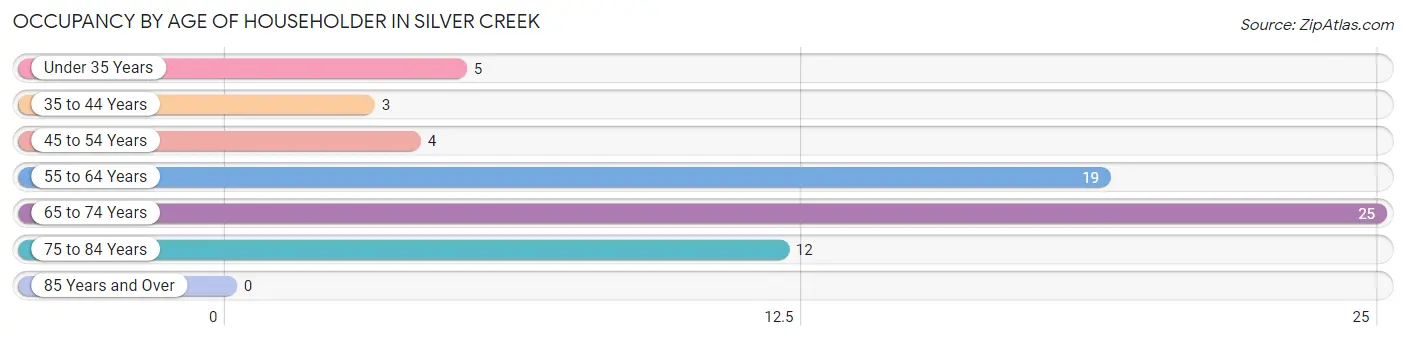
| Age Bracket | # Households | % Households |
| Under 35 Years | 5 | 7.3% |
| 35 to 44 Years | 3 | 4.4% |
| 45 to 54 Years | 4 | 5.9% |
| 55 to 64 Years | 19 | 27.9% |
| 65 to 74 Years | 25 | 36.8% |
| 75 to 84 Years | 12 | 17.6% |
| 85 Years and Over | 0 | 0.0% |
| Total | 68 | 100.0% |
Housing Finances in Silver Creek
Median Income by Occupancy in Silver Creek
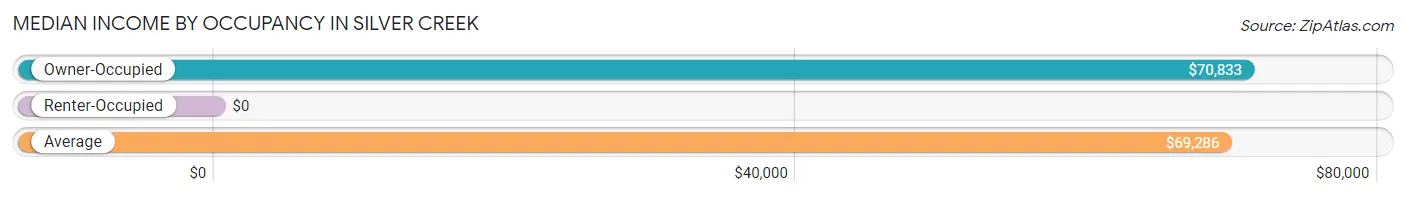
| Occupancy Type | # Households | Median Income |
| Owner-Occupied | 60 (88.2%) | $70,833 |
| Renter-Occupied | 8 (11.8%) | $0 |
| Average | 68 (100.0%) | $69,286 |
Occupancy by Householder Income Bracket in Silver Creek
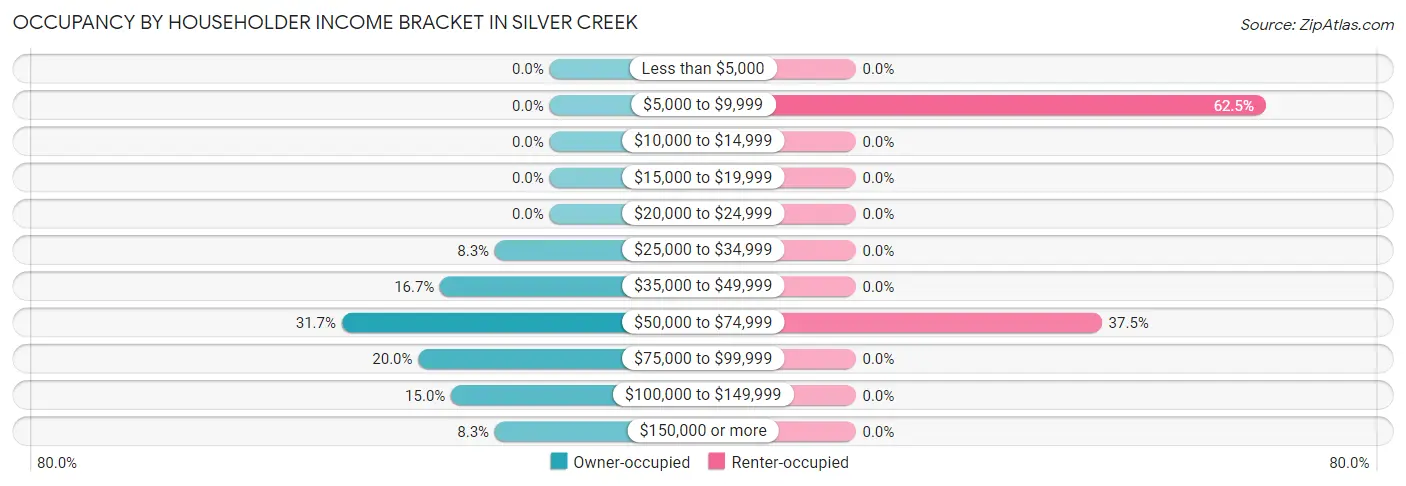
| Income Bracket | Owner-occupied | Renter-occupied |
| Less than $5,000 | 0 (0.0%) | 0 (0.0%) |
| $5,000 to $9,999 | 0 (0.0%) | 5 (62.5%) |
| $10,000 to $14,999 | 0 (0.0%) | 0 (0.0%) |
| $15,000 to $19,999 | 0 (0.0%) | 0 (0.0%) |
| $20,000 to $24,999 | 0 (0.0%) | 0 (0.0%) |
| $25,000 to $34,999 | 5 (8.3%) | 0 (0.0%) |
| $35,000 to $49,999 | 10 (16.7%) | 0 (0.0%) |
| $50,000 to $74,999 | 19 (31.7%) | 3 (37.5%) |
| $75,000 to $99,999 | 12 (20.0%) | 0 (0.0%) |
| $100,000 to $149,999 | 9 (15.0%) | 0 (0.0%) |
| $150,000 or more | 5 (8.3%) | 0 (0.0%) |
| Total | 60 (100.0%) | 8 (100.0%) |
Monthly Housing Cost Tiers in Silver Creek
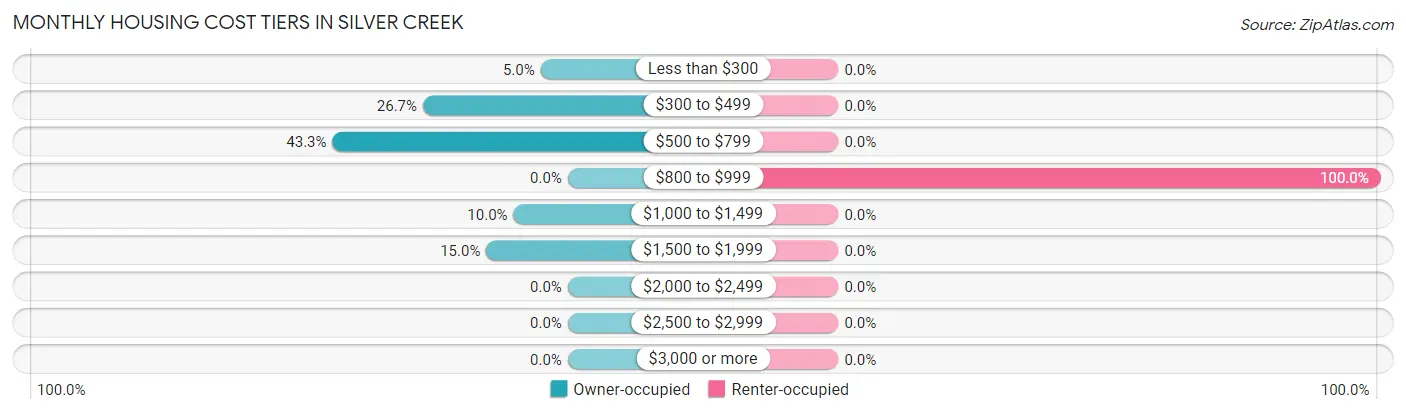
| Monthly Cost | Owner-occupied | Renter-occupied |
| Less than $300 | 3 (5.0%) | 0 (0.0%) |
| $300 to $499 | 16 (26.7%) | 0 (0.0%) |
| $500 to $799 | 26 (43.3%) | 0 (0.0%) |
| $800 to $999 | 0 (0.0%) | 8 (100.0%) |
| $1,000 to $1,499 | 6 (10.0%) | 0 (0.0%) |
| $1,500 to $1,999 | 9 (15.0%) | 0 (0.0%) |
| $2,000 to $2,499 | 0 (0.0%) | 0 (0.0%) |
| $2,500 to $2,999 | 0 (0.0%) | 0 (0.0%) |
| $3,000 or more | 0 (0.0%) | 0 (0.0%) |
| Total | 60 (100.0%) | 8 (100.0%) |
Physical Housing Characteristics in Silver Creek
Housing Structures in Silver Creek
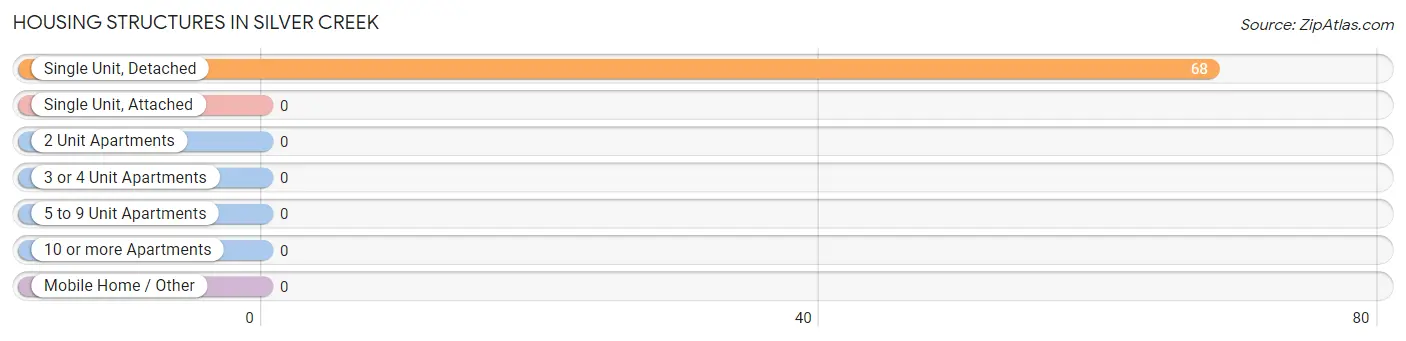
| Structure Type | # Housing Units | % Housing Units |
| Single Unit, Detached | 68 | 100.0% |
| Single Unit, Attached | 0 | 0.0% |
| 2 Unit Apartments | 0 | 0.0% |
| 3 or 4 Unit Apartments | 0 | 0.0% |
| 5 to 9 Unit Apartments | 0 | 0.0% |
| 10 or more Apartments | 0 | 0.0% |
| Mobile Home / Other | 0 | 0.0% |
| Total | 68 | 100.0% |
Housing Structures by Occupancy in Silver Creek
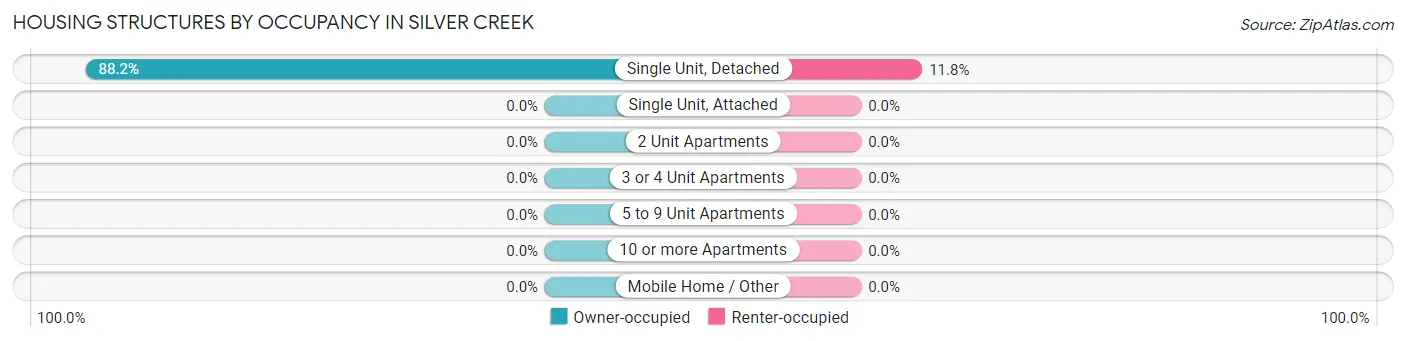
| Structure Type | Owner-occupied | Renter-occupied |
| Single Unit, Detached | 60 (88.2%) | 8 (11.8%) |
| Single Unit, Attached | 0 (0.0%) | 0 (0.0%) |
| 2 Unit Apartments | 0 (0.0%) | 0 (0.0%) |
| 3 or 4 Unit Apartments | 0 (0.0%) | 0 (0.0%) |
| 5 to 9 Unit Apartments | 0 (0.0%) | 0 (0.0%) |
| 10 or more Apartments | 0 (0.0%) | 0 (0.0%) |
| Mobile Home / Other | 0 (0.0%) | 0 (0.0%) |
| Total | 60 (88.2%) | 8 (11.8%) |
Housing Structures by Number of Rooms in Silver Creek
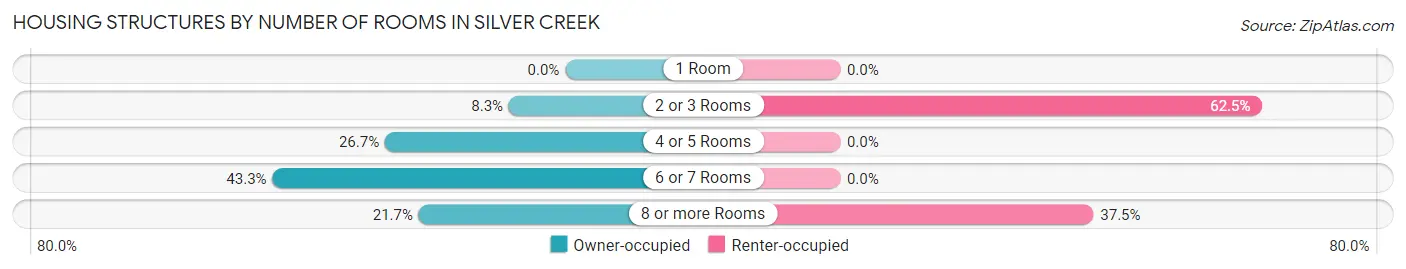
| Number of Rooms | Owner-occupied | Renter-occupied |
| 1 Room | 0 (0.0%) | 0 (0.0%) |
| 2 or 3 Rooms | 5 (8.3%) | 5 (62.5%) |
| 4 or 5 Rooms | 16 (26.7%) | 0 (0.0%) |
| 6 or 7 Rooms | 26 (43.3%) | 0 (0.0%) |
| 8 or more Rooms | 13 (21.7%) | 3 (37.5%) |
| Total | 60 (100.0%) | 8 (100.0%) |
Housing Structure by Heating Type in Silver Creek
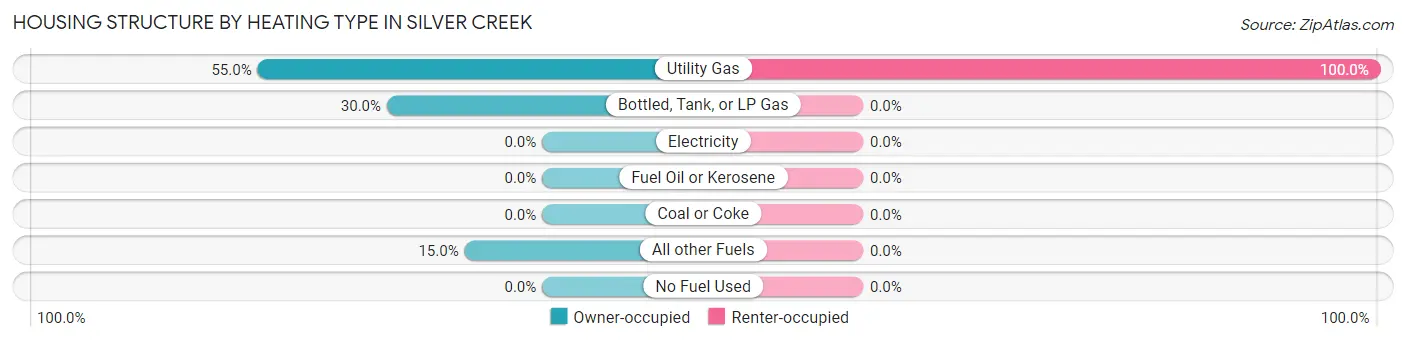
| Heating Type | Owner-occupied | Renter-occupied |
| Utility Gas | 33 (55.0%) | 8 (100.0%) |
| Bottled, Tank, or LP Gas | 18 (30.0%) | 0 (0.0%) |
| Electricity | 0 (0.0%) | 0 (0.0%) |
| Fuel Oil or Kerosene | 0 (0.0%) | 0 (0.0%) |
| Coal or Coke | 0 (0.0%) | 0 (0.0%) |
| All other Fuels | 9 (15.0%) | 0 (0.0%) |
| No Fuel Used | 0 (0.0%) | 0 (0.0%) |
| Total | 60 (100.0%) | 8 (100.0%) |
Household Vehicle Usage in Silver Creek
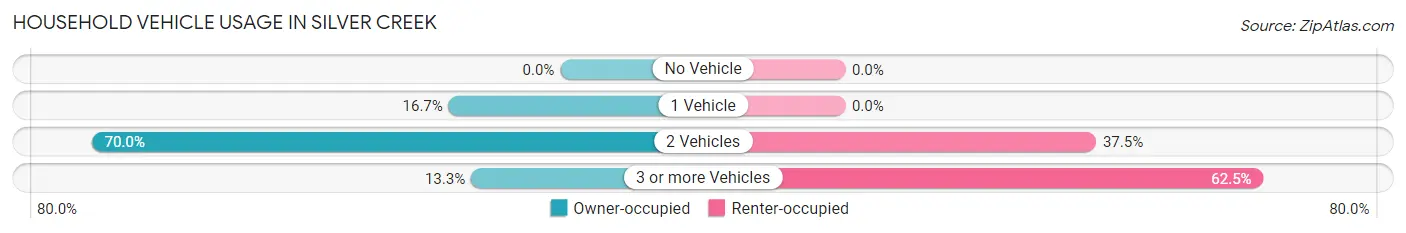
| Vehicles per Household | Owner-occupied | Renter-occupied |
| No Vehicle | 0 (0.0%) | 0 (0.0%) |
| 1 Vehicle | 10 (16.7%) | 0 (0.0%) |
| 2 Vehicles | 42 (70.0%) | 3 (37.5%) |
| 3 or more Vehicles | 8 (13.3%) | 5 (62.5%) |
| Total | 60 (100.0%) | 8 (100.0%) |
Real Estate & Mortgages in Silver Creek
Real Estate and Mortgage Overview in Silver Creek
| Characteristic | Without Mortgage | With Mortgage |
| Housing Units | 40 | 20 |
| Median Property Value | $225,000 | $275,000 |
| Median Household Income | $96,000 | $0 |
| Monthly Housing Costs | $527 | $0 |
| Real Estate Taxes | $1,844 | $0 |
Property Value by Mortgage Status in Silver Creek
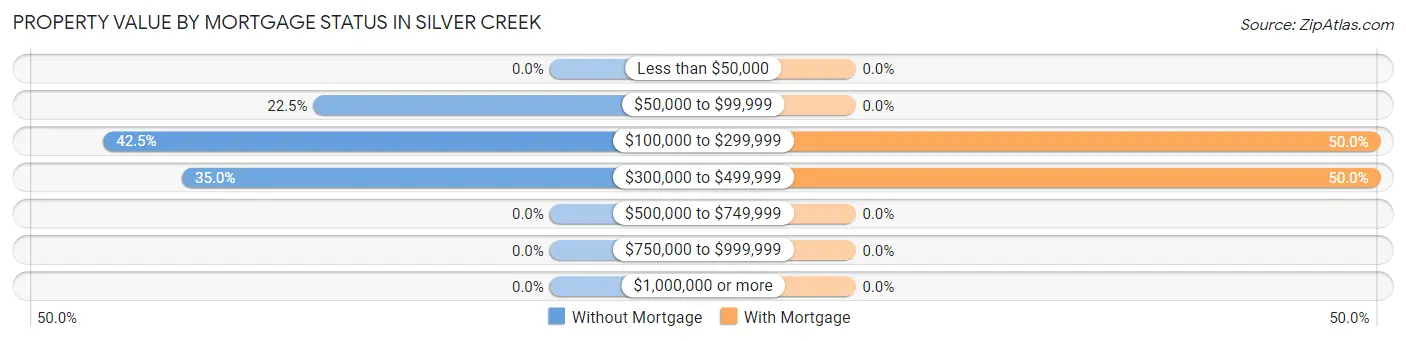
| Property Value | Without Mortgage | With Mortgage |
| Less than $50,000 | 0 (0.0%) | 0 (0.0%) |
| $50,000 to $99,999 | 9 (22.5%) | 0 (0.0%) |
| $100,000 to $299,999 | 17 (42.5%) | 10 (50.0%) |
| $300,000 to $499,999 | 14 (35.0%) | 10 (50.0%) |
| $500,000 to $749,999 | 0 (0.0%) | 0 (0.0%) |
| $750,000 to $999,999 | 0 (0.0%) | 0 (0.0%) |
| $1,000,000 or more | 0 (0.0%) | 0 (0.0%) |
| Total | 40 (100.0%) | 20 (100.0%) |
Household Income by Mortgage Status in Silver Creek
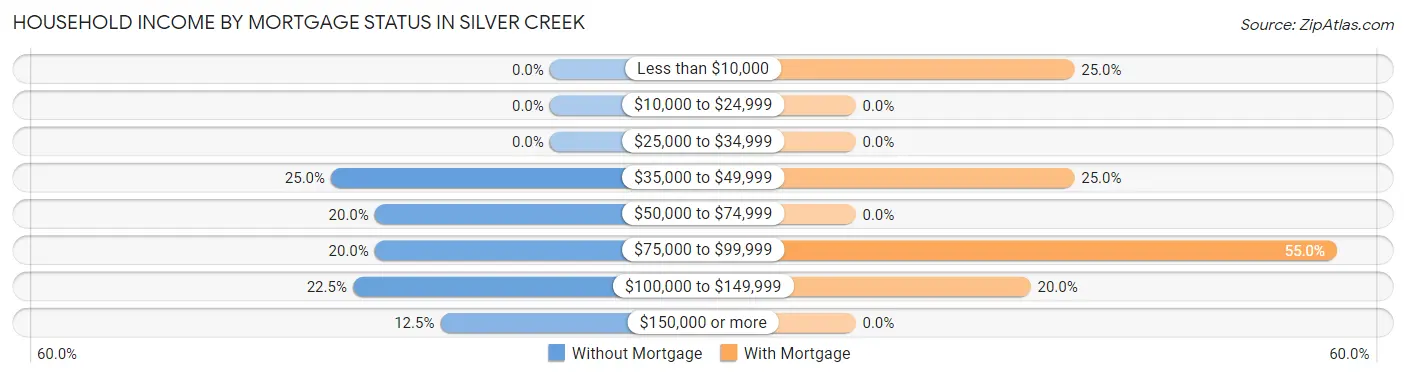
| Household Income | Without Mortgage | With Mortgage |
| Less than $10,000 | 0 (0.0%) | 5 (25.0%) |
| $10,000 to $24,999 | 0 (0.0%) | 0 (0.0%) |
| $25,000 to $34,999 | 0 (0.0%) | 0 (0.0%) |
| $35,000 to $49,999 | 10 (25.0%) | 5 (25.0%) |
| $50,000 to $74,999 | 8 (20.0%) | 0 (0.0%) |
| $75,000 to $99,999 | 8 (20.0%) | 11 (55.0%) |
| $100,000 to $149,999 | 9 (22.5%) | 4 (20.0%) |
| $150,000 or more | 5 (12.5%) | 0 (0.0%) |
| Total | 40 (100.0%) | 20 (100.0%) |
Property Value to Household Income Ratio in Silver Creek
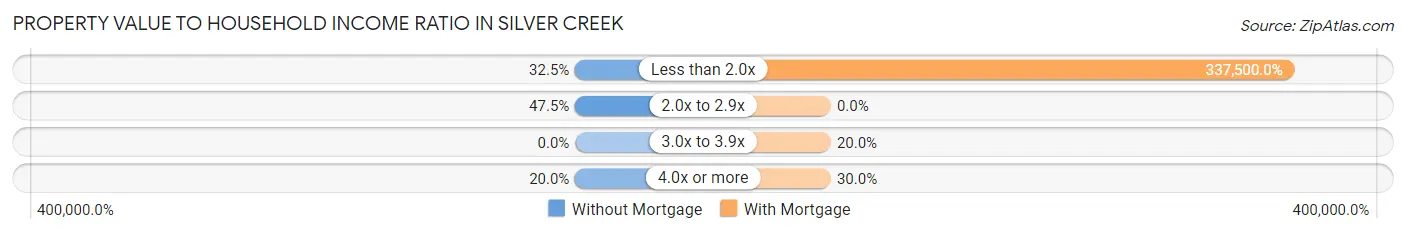
| Value-to-Income Ratio | Without Mortgage | With Mortgage |
| Less than 2.0x | 13 (32.5%) | 67,500 (337,500.0%) |
| 2.0x to 2.9x | 19 (47.5%) | 0 (0.0%) |
| 3.0x to 3.9x | 0 (0.0%) | 4 (20.0%) |
| 4.0x or more | 8 (20.0%) | 6 (30.0%) |
| Total | 40 (100.0%) | 20 (100.0%) |
Real Estate Taxes by Mortgage Status in Silver Creek
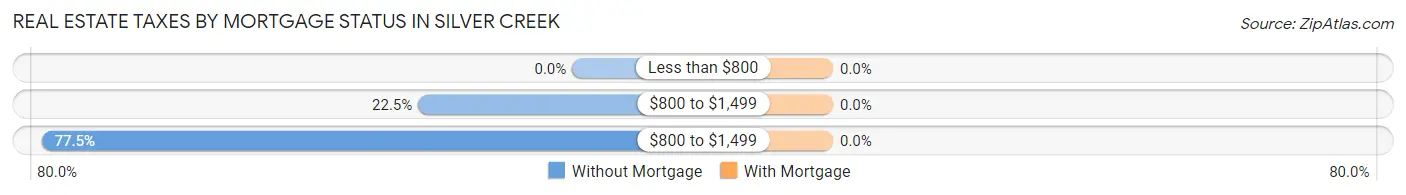
| Property Taxes | Without Mortgage | With Mortgage |
| Less than $800 | 0 (0.0%) | 0 (0.0%) |
| $800 to $1,499 | 9 (22.5%) | 0 (0.0%) |
| $800 to $1,499 | 31 (77.5%) | 0 (0.0%) |
| Total | 40 (100.0%) | 20 (100.0%) |
Health & Disability in Silver Creek
Health Insurance Coverage by Age in Silver Creek
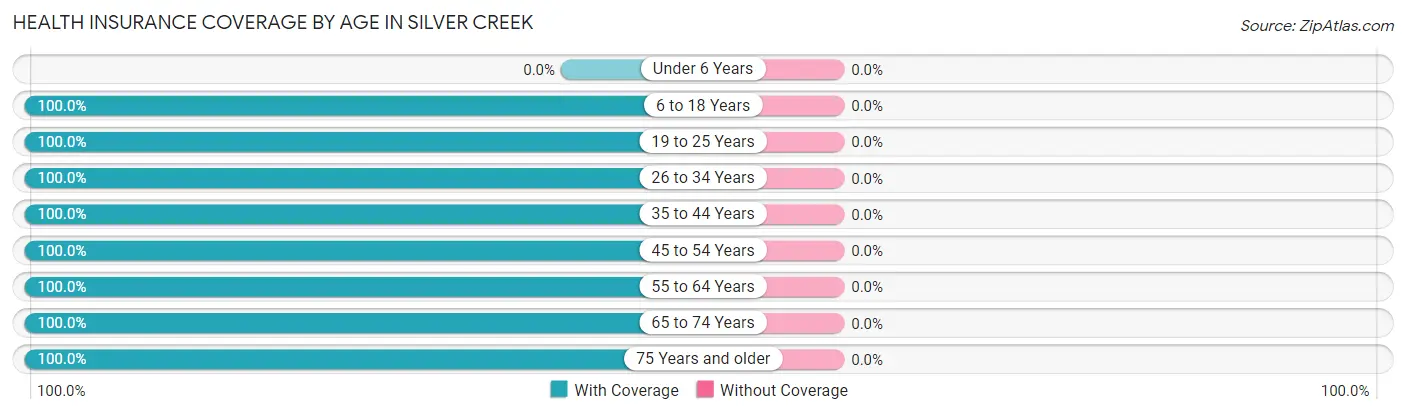
| Age Bracket | With Coverage | Without Coverage |
| Under 6 Years | 0 (0.0%) | 0 (0.0%) |
| 6 to 18 Years | 6 (100.0%) | 0 (0.0%) |
| 19 to 25 Years | 9 (100.0%) | 0 (0.0%) |
| 26 to 34 Years | 16 (100.0%) | 0 (0.0%) |
| 35 to 44 Years | 3 (100.0%) | 0 (0.0%) |
| 45 to 54 Years | 8 (100.0%) | 0 (0.0%) |
| 55 to 64 Years | 38 (100.0%) | 0 (0.0%) |
| 65 to 74 Years | 34 (100.0%) | 0 (0.0%) |
| 75 Years and older | 27 (100.0%) | 0 (0.0%) |
| Total | 141 (100.0%) | 0 (0.0%) |
Health Insurance Coverage by Citizenship Status in Silver Creek
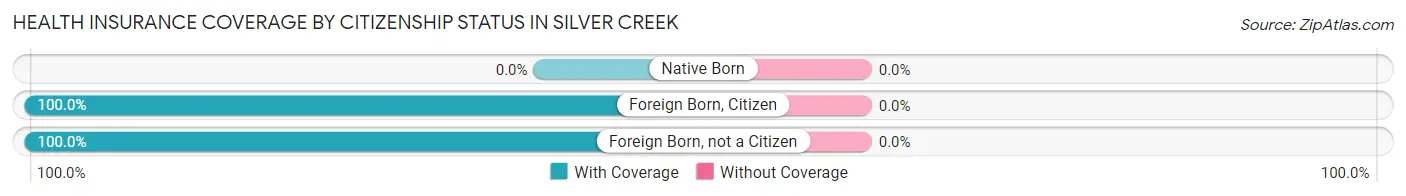
| Citizenship Status | With Coverage | Without Coverage |
| Native Born | 0 (0.0%) | 0 (0.0%) |
| Foreign Born, Citizen | 6 (100.0%) | 0 (0.0%) |
| Foreign Born, not a Citizen | 9 (100.0%) | 0 (0.0%) |
Health Insurance Coverage by Household Income in Silver Creek
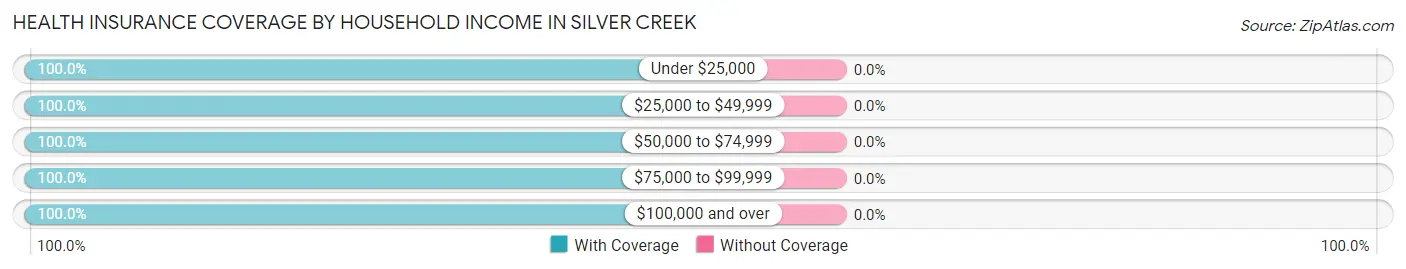
| Household Income | With Coverage | Without Coverage |
| Under $25,000 | 10 (100.0%) | 0 (0.0%) |
| $25,000 to $49,999 | 20 (100.0%) | 0 (0.0%) |
| $50,000 to $74,999 | 54 (100.0%) | 0 (0.0%) |
| $75,000 to $99,999 | 27 (100.0%) | 0 (0.0%) |
| $100,000 and over | 30 (100.0%) | 0 (0.0%) |
Public vs Private Health Insurance Coverage by Age in Silver Creek
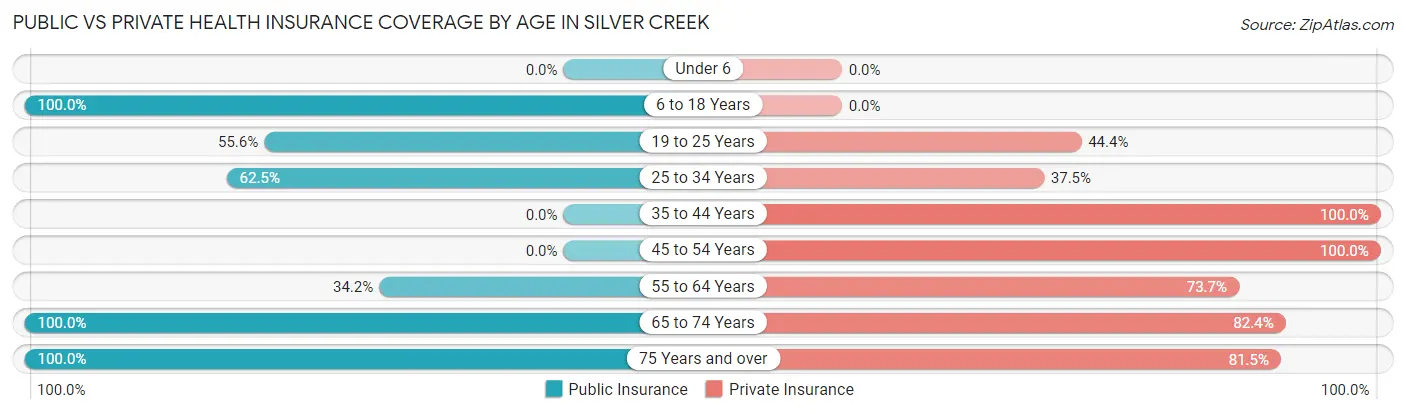
| Age Bracket | Public Insurance | Private Insurance |
| Under 6 | 0 (0.0%) | 0 (0.0%) |
| 6 to 18 Years | 6 (100.0%) | 0 (0.0%) |
| 19 to 25 Years | 5 (55.6%) | 4 (44.4%) |
| 25 to 34 Years | 10 (62.5%) | 6 (37.5%) |
| 35 to 44 Years | 0 (0.0%) | 3 (100.0%) |
| 45 to 54 Years | 0 (0.0%) | 8 (100.0%) |
| 55 to 64 Years | 13 (34.2%) | 28 (73.7%) |
| 65 to 74 Years | 34 (100.0%) | 28 (82.4%) |
| 75 Years and over | 27 (100.0%) | 22 (81.5%) |
| Total | 95 (67.4%) | 99 (70.2%) |
Disability Status by Sex by Age in Silver Creek
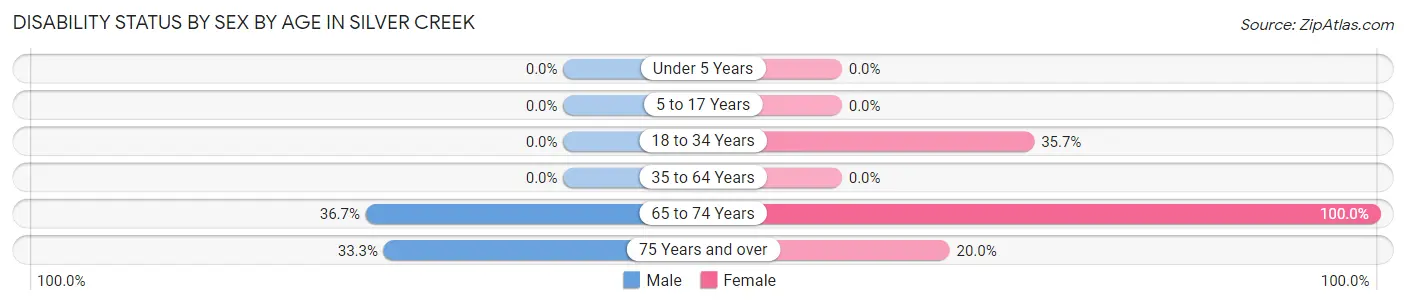
| Age Bracket | Male | Female |
| Under 5 Years | 0 (0.0%) | 0 (0.0%) |
| 5 to 17 Years | 0 (0.0%) | 0 (0.0%) |
| 18 to 34 Years | 0 (0.0%) | 5 (35.7%) |
| 35 to 64 Years | 0 (0.0%) | 0 (0.0%) |
| 65 to 74 Years | 11 (36.7%) | 4 (100.0%) |
| 75 Years and over | 4 (33.3%) | 3 (20.0%) |
Disability Class by Sex by Age in Silver Creek
Disability Class: Hearing Difficulty
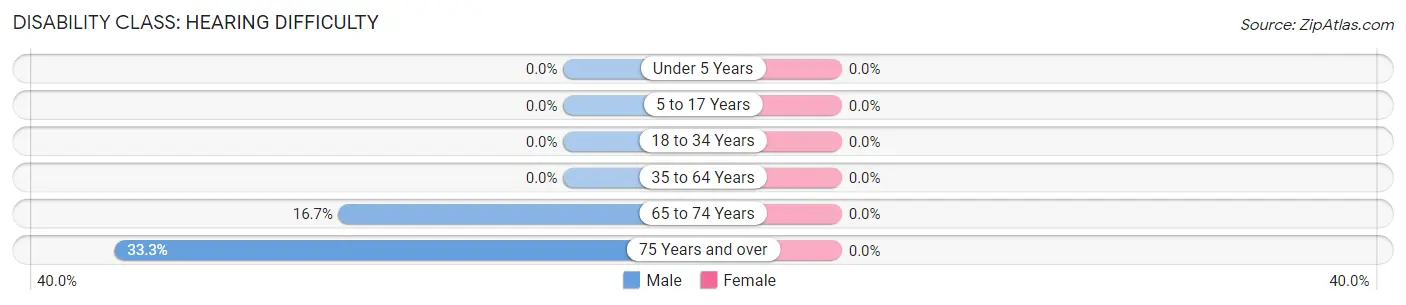
| Age Bracket | Male | Female |
| Under 5 Years | 0 (0.0%) | 0 (0.0%) |
| 5 to 17 Years | 0 (0.0%) | 0 (0.0%) |
| 18 to 34 Years | 0 (0.0%) | 0 (0.0%) |
| 35 to 64 Years | 0 (0.0%) | 0 (0.0%) |
| 65 to 74 Years | 5 (16.7%) | 0 (0.0%) |
| 75 Years and over | 4 (33.3%) | 0 (0.0%) |
Disability Class: Vision Difficulty
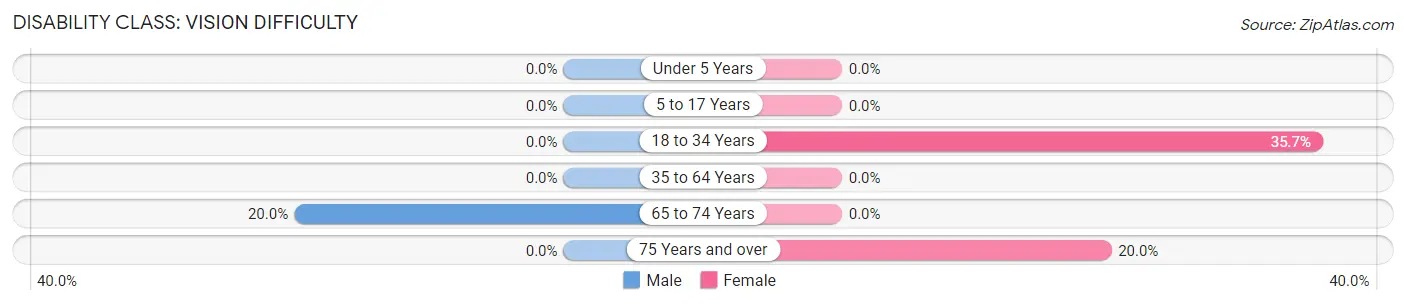
| Age Bracket | Male | Female |
| Under 5 Years | 0 (0.0%) | 0 (0.0%) |
| 5 to 17 Years | 0 (0.0%) | 0 (0.0%) |
| 18 to 34 Years | 0 (0.0%) | 5 (35.7%) |
| 35 to 64 Years | 0 (0.0%) | 0 (0.0%) |
| 65 to 74 Years | 6 (20.0%) | 0 (0.0%) |
| 75 Years and over | 0 (0.0%) | 3 (20.0%) |
Disability Class: Cognitive Difficulty
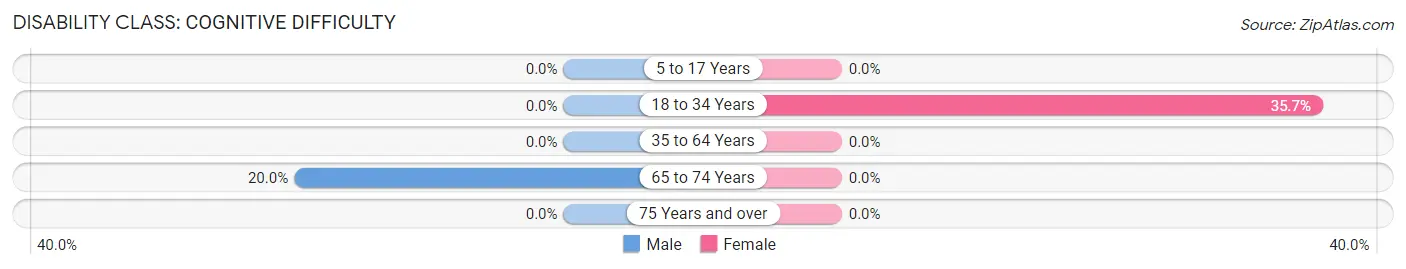
| Age Bracket | Male | Female |
| 5 to 17 Years | 0 (0.0%) | 0 (0.0%) |
| 18 to 34 Years | 0 (0.0%) | 5 (35.7%) |
| 35 to 64 Years | 0 (0.0%) | 0 (0.0%) |
| 65 to 74 Years | 6 (20.0%) | 0 (0.0%) |
| 75 Years and over | 0 (0.0%) | 0 (0.0%) |
Disability Class: Ambulatory Difficulty
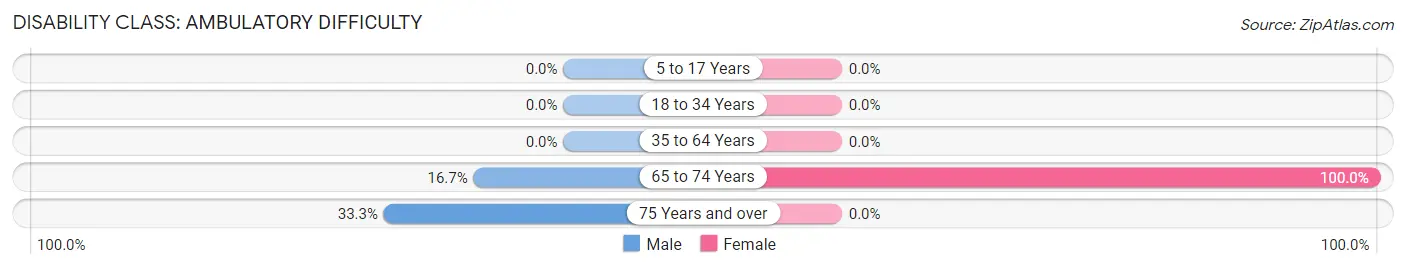
| Age Bracket | Male | Female |
| 5 to 17 Years | 0 (0.0%) | 0 (0.0%) |
| 18 to 34 Years | 0 (0.0%) | 0 (0.0%) |
| 35 to 64 Years | 0 (0.0%) | 0 (0.0%) |
| 65 to 74 Years | 5 (16.7%) | 4 (100.0%) |
| 75 Years and over | 4 (33.3%) | 0 (0.0%) |
Disability Class: Self-Care Difficulty
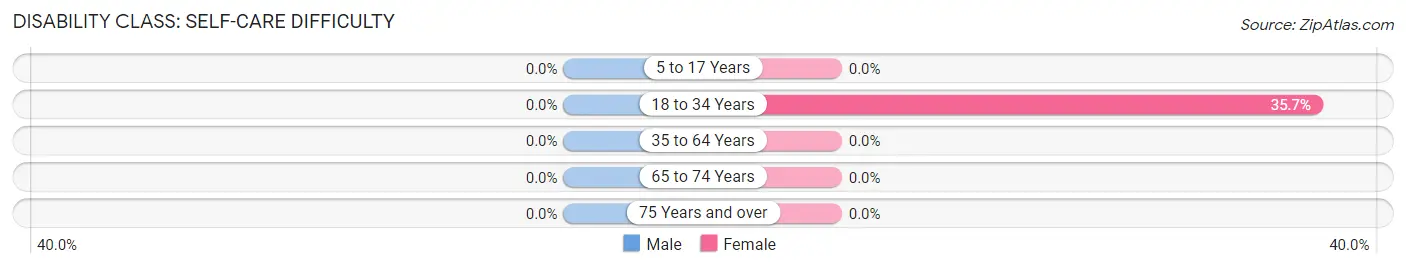
| Age Bracket | Male | Female |
| 5 to 17 Years | 0 (0.0%) | 0 (0.0%) |
| 18 to 34 Years | 0 (0.0%) | 5 (35.7%) |
| 35 to 64 Years | 0 (0.0%) | 0 (0.0%) |
| 65 to 74 Years | 0 (0.0%) | 0 (0.0%) |
| 75 Years and over | 0 (0.0%) | 0 (0.0%) |
Technology Access in Silver Creek
Computing Device Access in Silver Creek
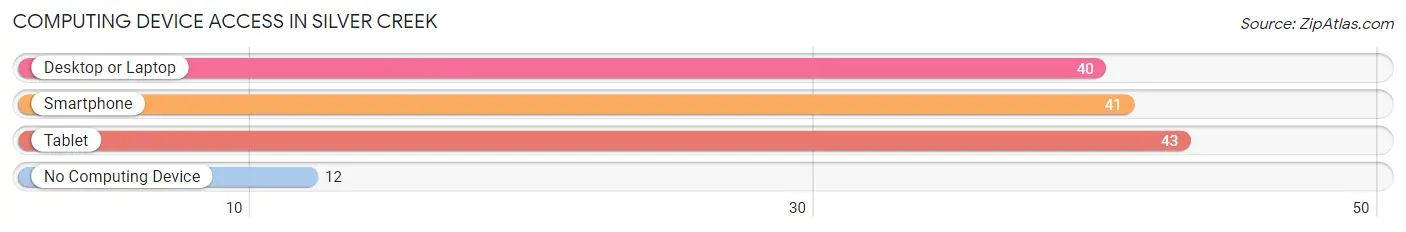
| Device Type | # Households | % Households |
| Desktop or Laptop | 40 | 58.8% |
| Smartphone | 41 | 60.3% |
| Tablet | 43 | 63.2% |
| No Computing Device | 12 | 17.6% |
| Total | 68 | 100.0% |
Internet Access in Silver Creek
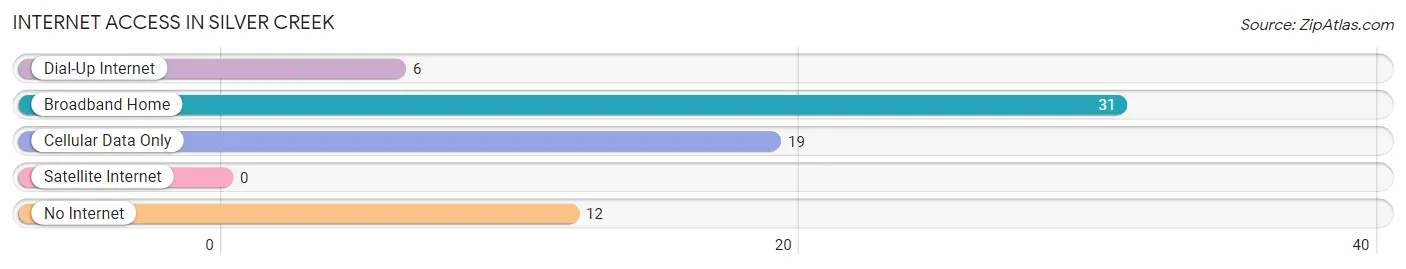
| Internet Type | # Households | % Households |
| Dial-Up Internet | 6 | 8.8% |
| Broadband Home | 31 | 45.6% |
| Cellular Data Only | 19 | 27.9% |
| Satellite Internet | 0 | 0.0% |
| No Internet | 12 | 17.6% |
| Total | 68 | 100.0% |
Silver Creek Summary
History
The area now known as Silver Creek, Minnesota was first settled in the late 1800s by a group of German immigrants. The town was originally called “Silver Creek” after the nearby creek that ran through the area. The town was officially incorporated in 1887 and quickly grew to become a thriving community.
The town was home to a variety of businesses, including a sawmill, a flour mill, a blacksmith shop, a general store, and a hotel. The town also had a post office, a school, and a church.
In the early 1900s, the town began to decline as the railroad bypassed it and the population began to move away. By the 1950s, the town had become a virtual ghost town.
In the late 1970s, the town was revitalized when a group of investors purchased the land and began to develop it into a resort community. The town was renamed “Silver Creek Resort” and the area was developed into a golf course, a ski resort, and a variety of other recreational activities.
Today, Silver Creek is a popular destination for tourists and locals alike. The town is home to a variety of restaurants, shops, and other businesses. The town also hosts a variety of events throughout the year, including the Silver Creek Music Festival and the Silver Creek Arts Festival.
Geography
Silver Creek is located in the north-central part of Minnesota, in the county of St. Louis. The town is situated on the banks of the Silver Creek, which is a tributary of the Mississippi River. The town is surrounded by a variety of lakes, including Lake Superior, Lake Vermilion, and Lake of the Woods.
The town is located in a region of Minnesota known as the Iron Range, which is known for its rich deposits of iron ore. The area is also known for its beautiful forests and lakes, making it a popular destination for outdoor recreation.
Economy
The economy of Silver Creek is largely based on tourism. The town is home to a variety of restaurants, shops, and other businesses that cater to tourists. The town also hosts a variety of events throughout the year, including the Silver Creek Music Festival and the Silver Creek Arts Festival.
The town is also home to a variety of industries, including mining, logging, and manufacturing. The town is home to a number of small businesses, including a sawmill, a flour mill, a blacksmith shop, and a general store.
Demographics
As of the 2010 census, the population of Silver Creek was 1,845. The town has a median age of 44.7 years, with a gender ratio of 50.3% male and 49.7% female. The town is predominantly white, with a population that is 97.2% white and 2.8% other races.
The town has a median household income of $45,945, with a poverty rate of 11.3%. The town has a high school graduation rate of 87.3%, and a college graduation rate of 28.2%. The town has a population that is largely employed in the service industry, with a workforce that is made up of 32.2% in the service industry, 25.2% in retail, and 22.3% in manufacturing.
Common Questions
What is Per Capita Income in Silver Creek?
Per Capita income in Silver Creek is $39,440.
What is the Median Family Income in Silver Creek?
Median Family Income in Silver Creek is $71,458.
What is the Median Household income in Silver Creek?
Median Household Income in Silver Creek is $69,286.
What is Inequality or Gini Index in Silver Creek?
Inequality or Gini Index in Silver Creek is 0.34.
What is the Total Population of Silver Creek?
Total Population of Silver Creek is 141.
What is the Total Male Population of Silver Creek?
Total Male Population of Silver Creek is 73.
What is the Total Female Population of Silver Creek?
Total Female Population of Silver Creek is 68.
What is the Ratio of Males per 100 Females in Silver Creek?
There are 107.35 Males per 100 Females in Silver Creek.
What is the Ratio of Females per 100 Males in Silver Creek?
There are 93.15 Females per 100 Males in Silver Creek.
What is the Median Population Age in Silver Creek?
Median Population Age in Silver Creek is 63.9 Years.
What is the Average Family Size in Silver Creek
Average Family Size in Silver Creek is 2.3 People.
What is the Average Household Size in Silver Creek
Average Household Size in Silver Creek is 2.1 People.
How Large is the Labor Force in Silver Creek?
There are 71 People in the Labor Forcein in Silver Creek.
What is the Percentage of People in the Labor Force in Silver Creek?
52.6% of People are in the Labor Force in Silver Creek.
What is the Unemployment Rate in Silver Creek?
Unemployment Rate in Silver Creek is 7.0%.