Shafer, MN Map & Demographics
Shafer Map
Shafer Overview
$36,627
PER CAPITA INCOME
$102,813
AVG FAMILY INCOME
$92,321
AVG HOUSEHOLD INCOME
42.4%
WAGE / INCOME GAP [ % ]
57.6¢/ $1
WAGE / INCOME GAP [ $ ]
$7,793
FAMILY INCOME DEFICIT
0.34
INEQUALITY / GINI INDEX
1,111
TOTAL POPULATION
579
MALE POPULATION
532
FEMALE POPULATION
108.83
MALES / 100 FEMALES
91.88
FEMALES / 100 MALES
30.7
MEDIAN AGE
3.1
AVG FAMILY SIZE
2.9
AVG HOUSEHOLD SIZE
661
LABOR FORCE [ PEOPLE ]
80.7%
PERCENT IN LABOR FORCE
3.2%
UNEMPLOYMENT RATE
Shafer Zip Codes
Income in Shafer
Income Overview in Shafer
Per Capita Income in Shafer is $36,627, while median incomes of families and households are $102,813 and $92,321 respectively.
| Characteristic | Number | Measure |
| Per Capita Income | 1,111 | $36,627 |
| Median Family Income | 292 | $102,813 |
| Mean Family Income | 292 | $112,846 |
| Median Household Income | 390 | $92,321 |
| Mean Household Income | 390 | $104,203 |
| Income Deficit | 292 | $7,793 |
| Wage / Income Gap (%) | 1,111 | 42.44% |
| Wage / Income Gap ($) | 1,111 | 57.56¢ per $1 |
| Gini / Inequality Index | 1,111 | 0.34 |
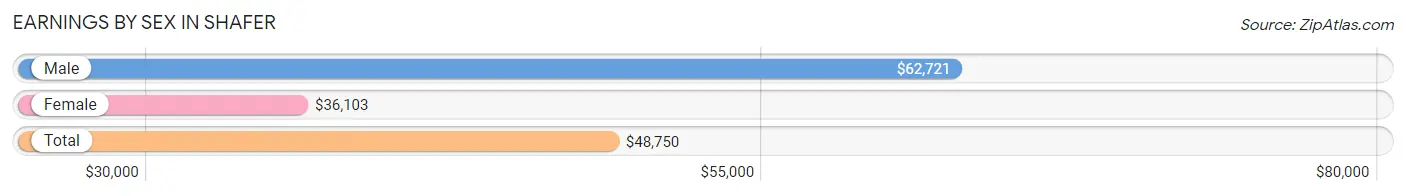
Earnings by Sex in Shafer
Average Earnings in Shafer are $48,750, $62,721 for men and $36,103 for women, a difference of 42.4%.
| Sex | Number | Average Earnings |
| Male | 345 (51.3%) | $62,721 |
| Female | 327 (48.7%) | $36,103 |
| Total | 672 (100.0%) | $48,750 |
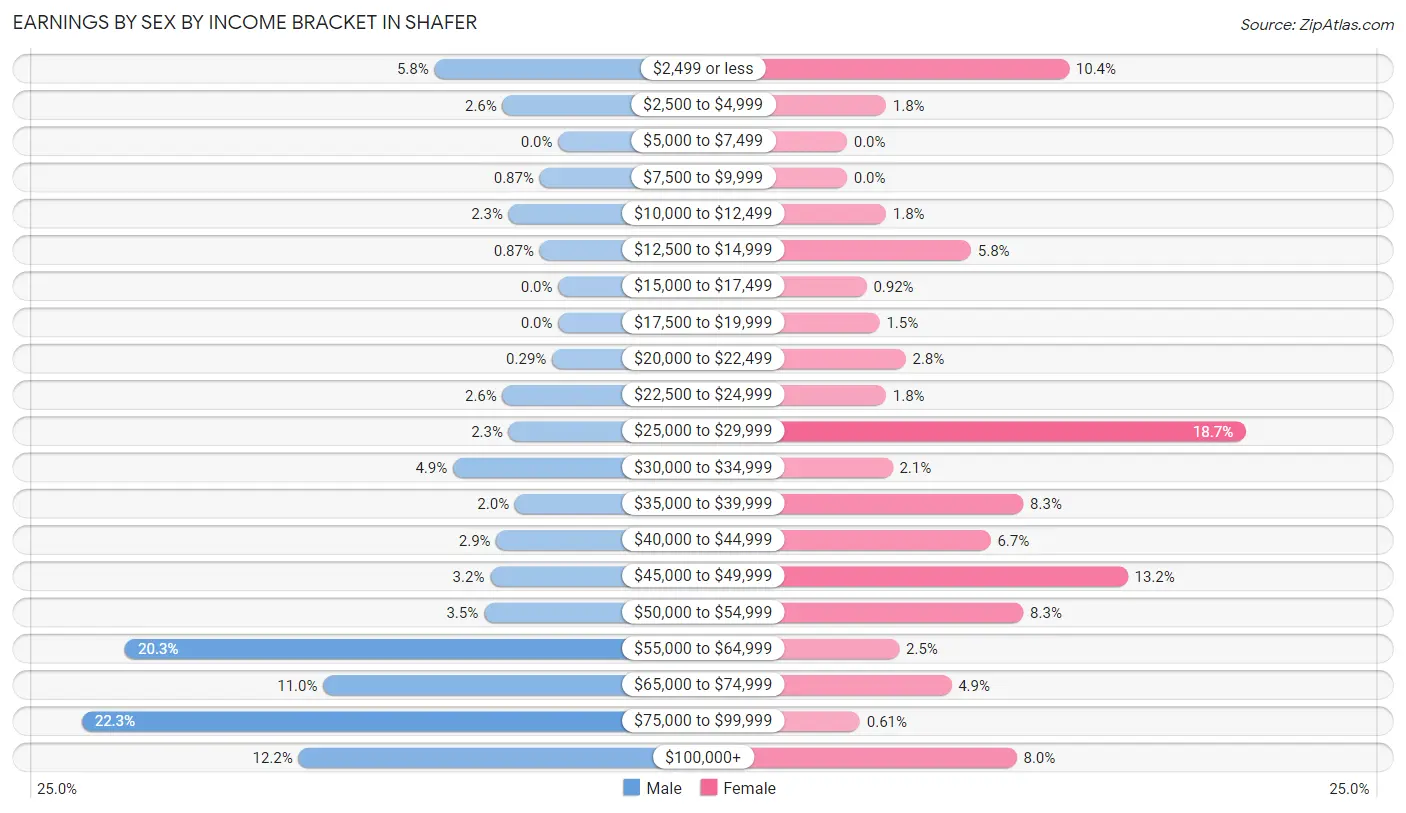
Earnings by Sex by Income Bracket in Shafer
The most common earnings brackets in Shafer are $75,000 to $99,999 for men (77 | 22.3%) and $25,000 to $29,999 for women (61 | 18.6%).
| Income | Male | Female |
| $2,499 or less | 20 (5.8%) | 34 (10.4%) |
| $2,500 to $4,999 | 9 (2.6%) | 6 (1.8%) |
| $5,000 to $7,499 | 0 (0.0%) | 0 (0.0%) |
| $7,500 to $9,999 | 3 (0.9%) | 0 (0.0%) |
| $10,000 to $12,499 | 8 (2.3%) | 6 (1.8%) |
| $12,500 to $14,999 | 3 (0.9%) | 19 (5.8%) |
| $15,000 to $17,499 | 0 (0.0%) | 3 (0.9%) |
| $17,500 to $19,999 | 0 (0.0%) | 5 (1.5%) |
| $20,000 to $22,499 | 1 (0.3%) | 9 (2.8%) |
| $22,500 to $24,999 | 9 (2.6%) | 6 (1.8%) |
| $25,000 to $29,999 | 8 (2.3%) | 61 (18.6%) |
| $30,000 to $34,999 | 17 (4.9%) | 7 (2.1%) |
| $35,000 to $39,999 | 7 (2.0%) | 27 (8.3%) |
| $40,000 to $44,999 | 10 (2.9%) | 22 (6.7%) |
| $45,000 to $49,999 | 11 (3.2%) | 43 (13.2%) |
| $50,000 to $54,999 | 12 (3.5%) | 27 (8.3%) |
| $55,000 to $64,999 | 70 (20.3%) | 8 (2.5%) |
| $65,000 to $74,999 | 38 (11.0%) | 16 (4.9%) |
| $75,000 to $99,999 | 77 (22.3%) | 2 (0.6%) |
| $100,000+ | 42 (12.2%) | 26 (8.0%) |
| Total | 345 (100.0%) | 327 (100.0%) |
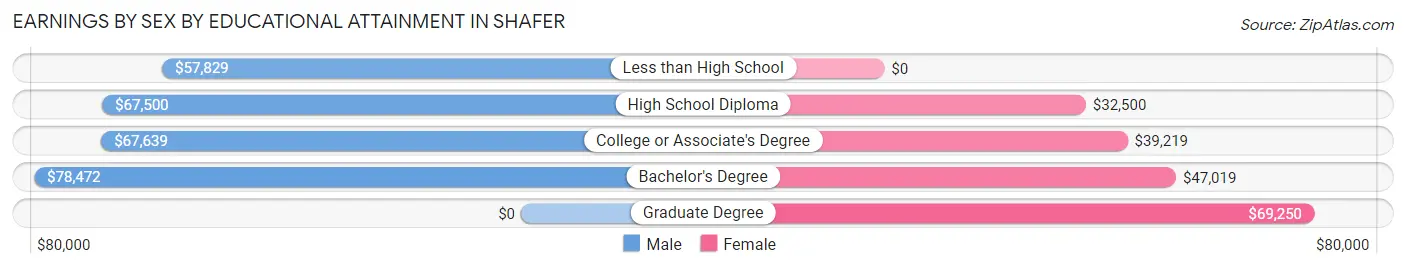
Earnings by Sex by Educational Attainment in Shafer
Average earnings in Shafer are $64,779 for men and $39,875 for women, a difference of 38.4%. Men with an educational attainment of bachelor's degree enjoy the highest average annual earnings of $78,472, while those with less than high school education earn the least with $57,829. Women with an educational attainment of graduate degree earn the most with the average annual earnings of $69,250, while those with high school diploma education have the smallest earnings of $32,500.
| Educational Attainment | Male Income | Female Income |
| Less than High School | $57,829 | $0 |
| High School Diploma | $67,500 | $32,500 |
| College or Associate's Degree | $67,639 | $39,219 |
| Bachelor's Degree | $78,472 | $47,019 |
| Graduate Degree | - | - |
| Total | $64,779 | $39,875 |
Family Income in Shafer
Family Income Brackets in Shafer
According to the Shafer family income data, there are 99 families falling into the $100,000 to $149,999 income range, which is the most common income bracket and makes up 33.9% of all families.
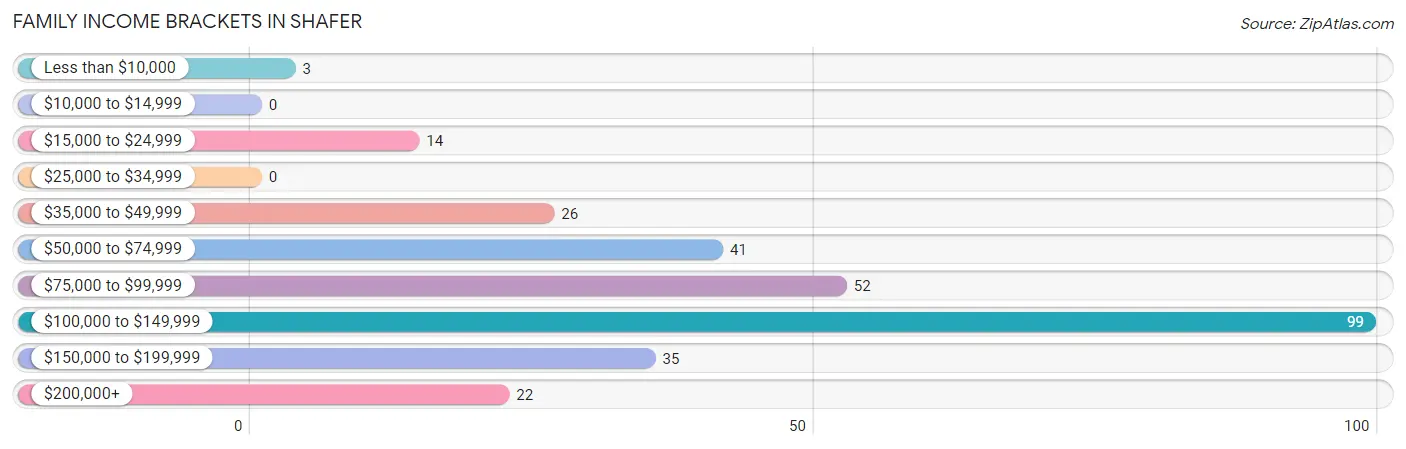
| Income Bracket | # Families | % Families |
| Less than $10,000 | 3 | 1.0% |
| $10,000 to $14,999 | 0 | 0.0% |
| $15,000 to $24,999 | 14 | 4.8% |
| $25,000 to $34,999 | 0 | 0.0% |
| $35,000 to $49,999 | 26 | 8.9% |
| $50,000 to $74,999 | 41 | 14.0% |
| $75,000 to $99,999 | 52 | 17.8% |
| $100,000 to $149,999 | 99 | 33.9% |
| $150,000 to $199,999 | 35 | 12.0% |
| $200,000+ | 22 | 7.5% |
Family Income by Famaliy Size in Shafer
6-person families (9 | 3.1%) account for the highest median family income in Shafer with $144,375 per family, while 2-person families (106 | 36.3%) have the highest median income of $51,562 per family member.
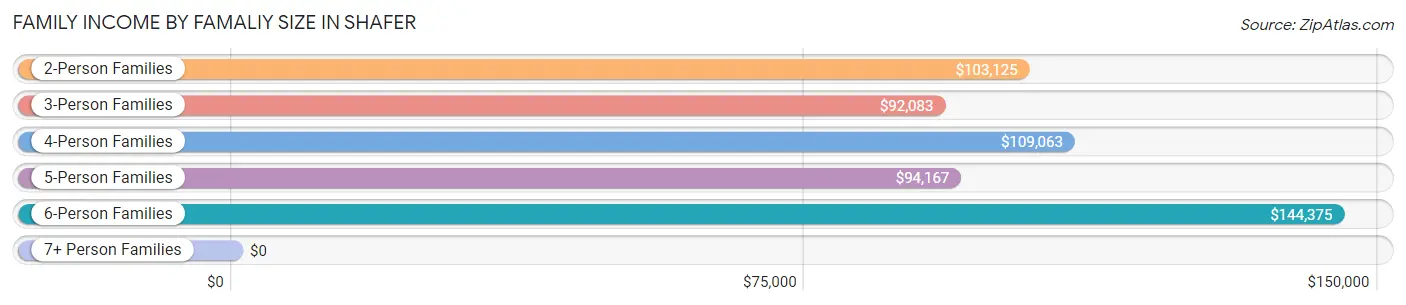
| Income Bracket | # Families | Median Income |
| 2-Person Families | 106 (36.3%) | $103,125 |
| 3-Person Families | 86 (29.4%) | $92,083 |
| 4-Person Families | 77 (26.4%) | $109,063 |
| 5-Person Families | 10 (3.4%) | $94,167 |
| 6-Person Families | 9 (3.1%) | $144,375 |
| 7+ Person Families | 4 (1.4%) | $0 |
| Total | 292 (100.0%) | $102,813 |
Family Income by Number of Earners in Shafer
The median family income in Shafer is $102,813, with families comprising 3+ earners (34) having the highest median family income of $191,579, while families with 1 earner (105) have the lowest median family income of $74,479, accounting for 11.6% and 36.0% of families, respectively.
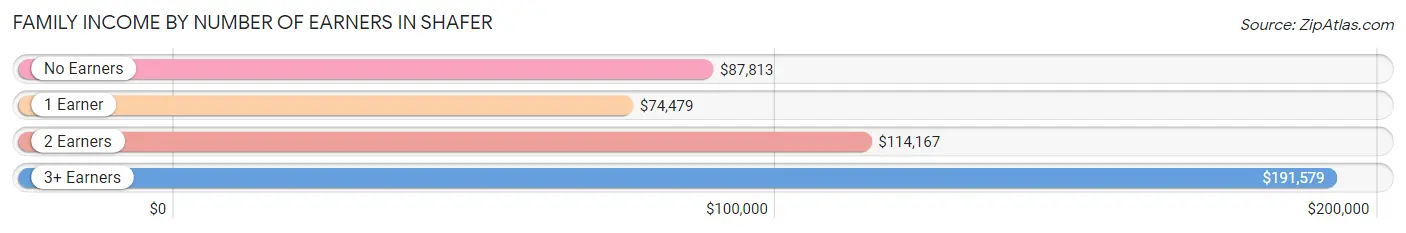
| Number of Earners | # Families | Median Income |
| No Earners | 13 (4.4%) | $87,813 |
| 1 Earner | 105 (36.0%) | $74,479 |
| 2 Earners | 140 (47.9%) | $114,167 |
| 3+ Earners | 34 (11.6%) | $191,579 |
| Total | 292 (100.0%) | $102,813 |
Household Income in Shafer
Household Income Brackets in Shafer
With 119 households falling in the category, the $100,000 to $149,999 income range is the most frequent in Shafer, accounting for 30.5% of all households. In contrast, only 5 households (1.3%) fall into the $10,000 to $14,999 income bracket, making it the least populous group.
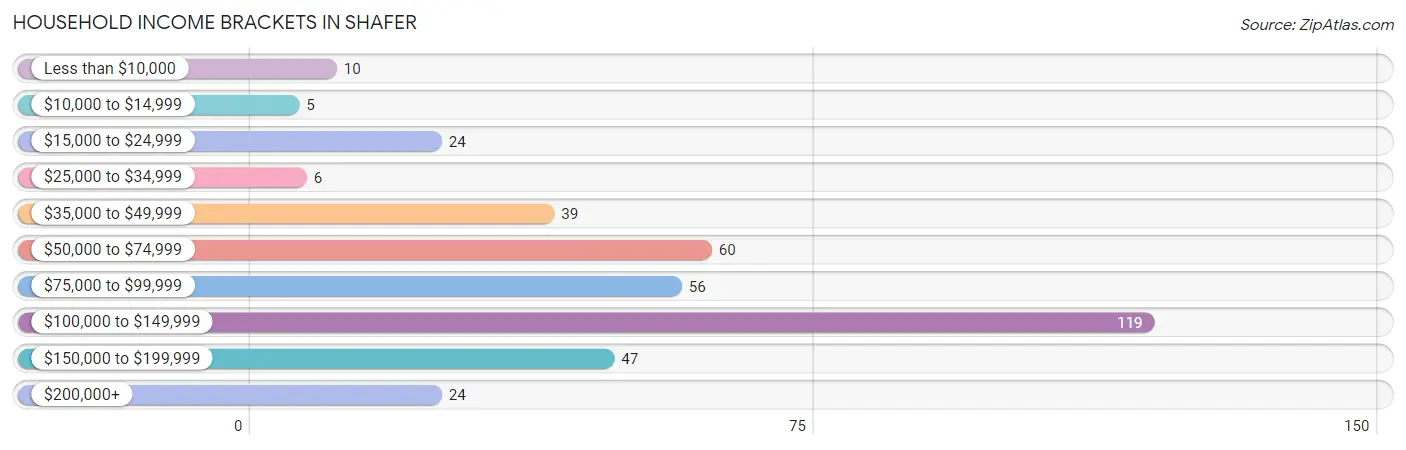
| Income Bracket | # Households | % Households |
| Less than $10,000 | 10 | 2.6% |
| $10,000 to $14,999 | 5 | 1.3% |
| $15,000 to $24,999 | 24 | 6.2% |
| $25,000 to $34,999 | 6 | 1.5% |
| $35,000 to $49,999 | 39 | 10.0% |
| $50,000 to $74,999 | 60 | 15.4% |
| $75,000 to $99,999 | 56 | 14.4% |
| $100,000 to $149,999 | 119 | 30.5% |
| $150,000 to $199,999 | 47 | 12.1% |
| $200,000+ | 24 | 6.2% |
Household Income by Householder Age in Shafer
The median household income in Shafer is $92,321, with the highest median household income of $118,333 found in the 45 to 64 years age bracket for the primary householder. A total of 138 households (35.4%) fall into this category. Meanwhile, the 65+ years age bracket for the primary householder has the lowest median household income of $48,125, with 29 households (7.4%) in this group.
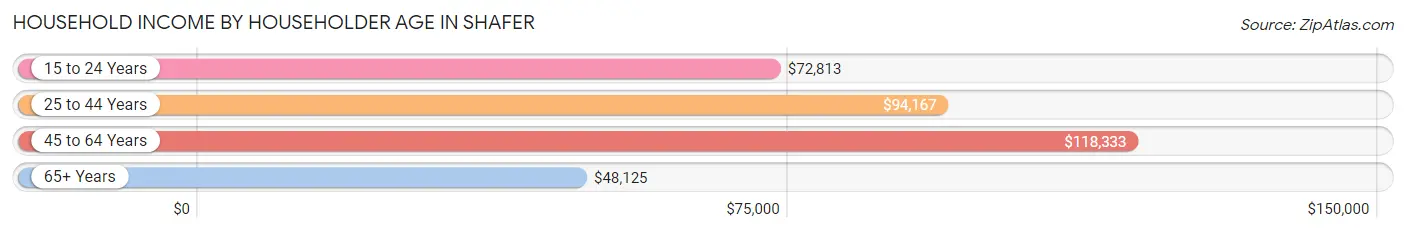
| Income Bracket | # Households | Median Income |
| 15 to 24 Years | 21 (5.4%) | $72,813 |
| 25 to 44 Years | 202 (51.8%) | $94,167 |
| 45 to 64 Years | 138 (35.4%) | $118,333 |
| 65+ Years | 29 (7.4%) | $48,125 |
| Total | 390 (100.0%) | $92,321 |
Poverty in Shafer
Income Below Poverty by Sex and Age in Shafer
With 6.6% poverty level for males and 11.0% for females among the residents of Shafer, 18 to 24 year old males and 5 year old females are the most vulnerable to poverty, with 12 males (29.3%) and 6 females (66.7%) in their respective age groups living below the poverty level.
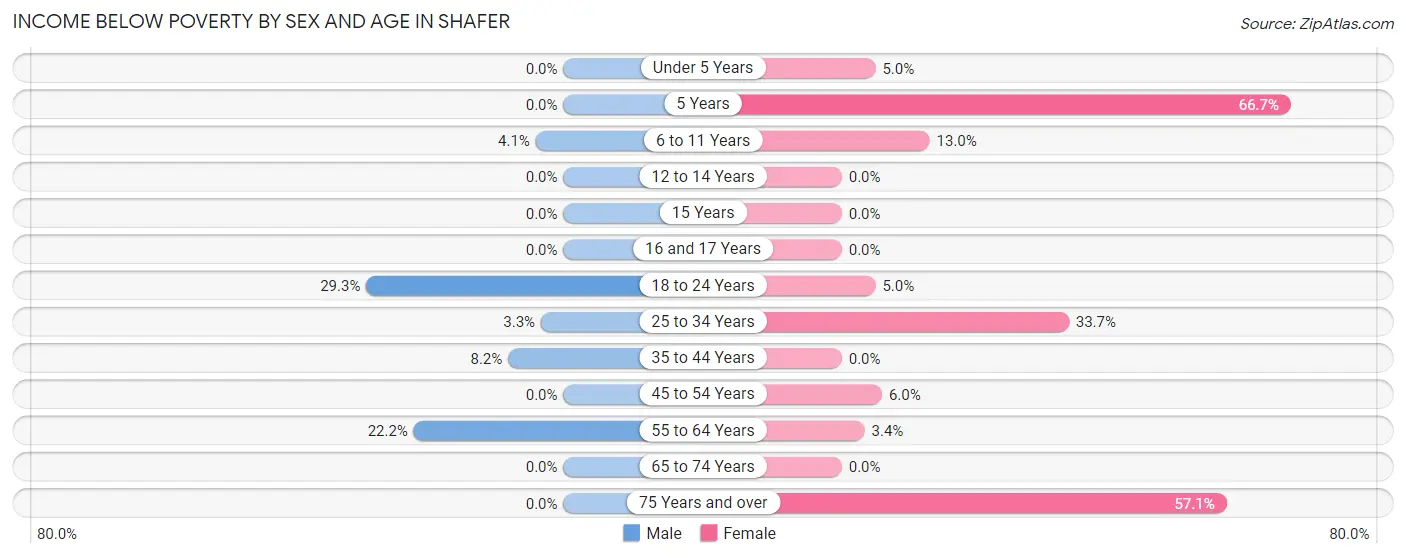
| Age Bracket | Male | Female |
| Under 5 Years | 0 (0.0%) | 2 (5.0%) |
| 5 Years | 0 (0.0%) | 6 (66.7%) |
| 6 to 11 Years | 3 (4.1%) | 6 (13.0%) |
| 12 to 14 Years | 0 (0.0%) | 0 (0.0%) |
| 15 Years | 0 (0.0%) | 0 (0.0%) |
| 16 and 17 Years | 0 (0.0%) | 0 (0.0%) |
| 18 to 24 Years | 12 (29.3%) | 3 (5.0%) |
| 25 to 34 Years | 3 (3.3%) | 30 (33.7%) |
| 35 to 44 Years | 10 (8.2%) | 0 (0.0%) |
| 45 to 54 Years | 0 (0.0%) | 4 (6.0%) |
| 55 to 64 Years | 10 (22.2%) | 2 (3.4%) |
| 65 to 74 Years | 0 (0.0%) | 0 (0.0%) |
| 75 Years and over | 0 (0.0%) | 4 (57.1%) |
| Total | 38 (6.6%) | 57 (11.0%) |
Income Above Poverty by Sex and Age in Shafer
According to the poverty statistics in Shafer, males aged under 5 years and females aged 12 to 14 years are the age groups that are most secure financially, with 100.0% of males and 100.0% of females in these age groups living above the poverty line.
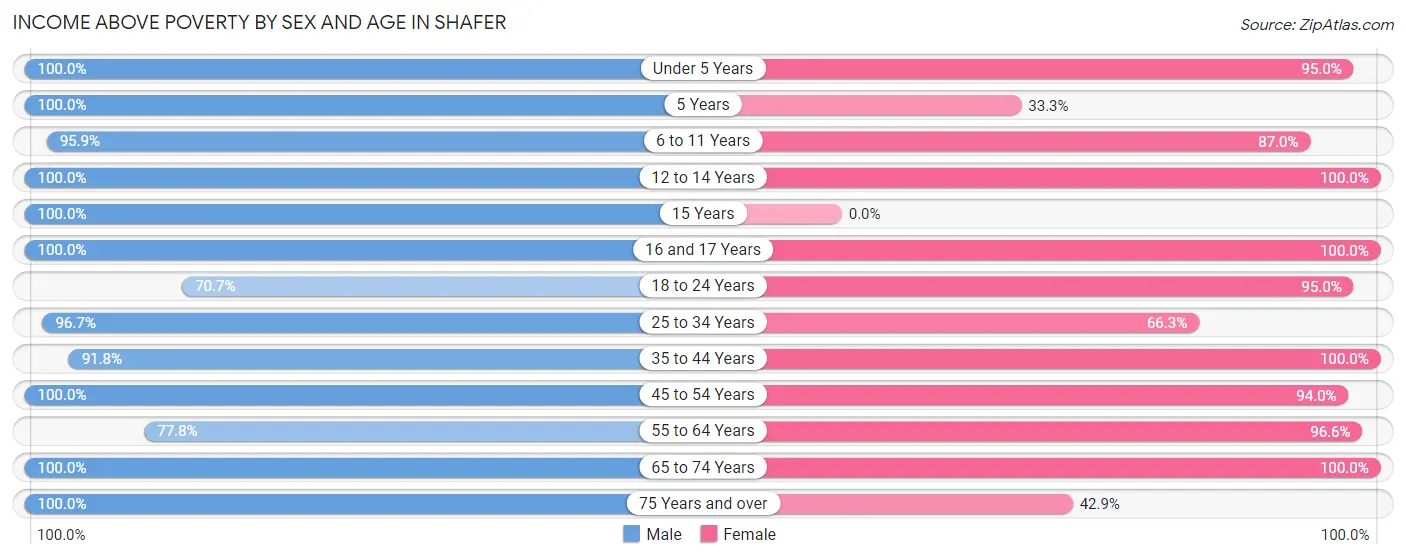
| Age Bracket | Male | Female |
| Under 5 Years | 44 (100.0%) | 38 (95.0%) |
| 5 Years | 2 (100.0%) | 3 (33.3%) |
| 6 to 11 Years | 70 (95.9%) | 40 (87.0%) |
| 12 to 14 Years | 21 (100.0%) | 30 (100.0%) |
| 15 Years | 11 (100.0%) | 0 (0.0%) |
| 16 and 17 Years | 29 (100.0%) | 4 (100.0%) |
| 18 to 24 Years | 29 (70.7%) | 57 (95.0%) |
| 25 to 34 Years | 87 (96.7%) | 59 (66.3%) |
| 35 to 44 Years | 112 (91.8%) | 87 (100.0%) |
| 45 to 54 Years | 58 (100.0%) | 63 (94.0%) |
| 55 to 64 Years | 35 (77.8%) | 57 (96.6%) |
| 65 to 74 Years | 31 (100.0%) | 21 (100.0%) |
| 75 Years and over | 9 (100.0%) | 3 (42.9%) |
| Total | 538 (93.4%) | 462 (89.0%) |
Income Below Poverty Among Married-Couple Families in Shafer
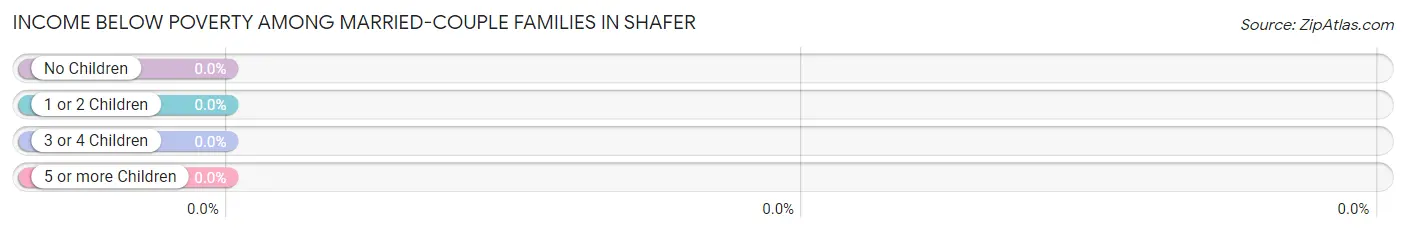
| Children | Above Poverty | Below Poverty |
| No Children | 56 (100.0%) | 0 (0.0%) |
| 1 or 2 Children | 93 (100.0%) | 0 (0.0%) |
| 3 or 4 Children | 23 (100.0%) | 0 (0.0%) |
| 5 or more Children | 0 (0.0%) | 0 (0.0%) |
| Total | 172 (100.0%) | 0 (0.0%) |
Income Below Poverty Among Single-Parent Households in Shafer
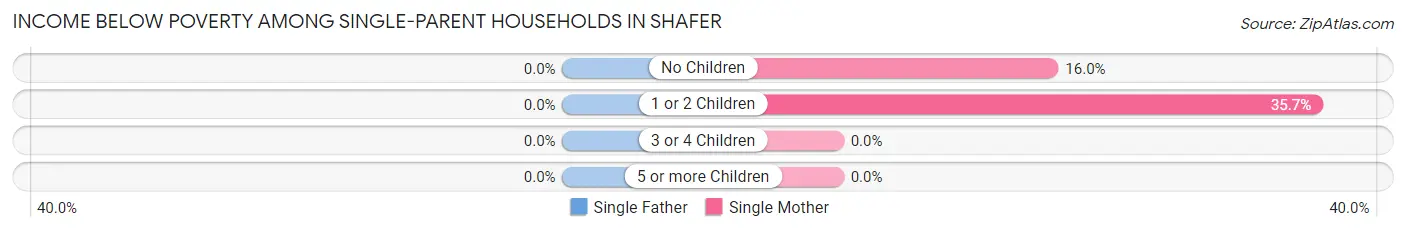
| Children | Single Father | Single Mother |
| No Children | 0 (0.0%) | 4 (16.0%) |
| 1 or 2 Children | 0 (0.0%) | 10 (35.7%) |
| 3 or 4 Children | 0 (0.0%) | 0 (0.0%) |
| 5 or more Children | 0 (0.0%) | 0 (0.0%) |
| Total | 0 (0.0%) | 14 (25.5%) |
Income Below Poverty Among Married-Couple vs Single-Parent Households in Shafer
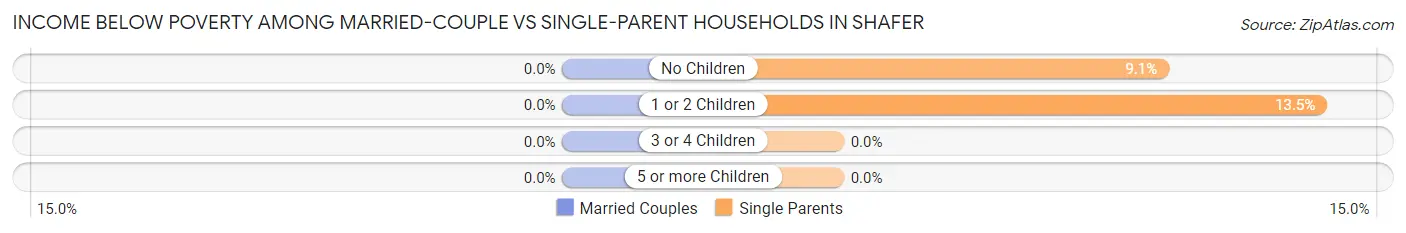
| Children | Married-Couple Families | Single-Parent Households |
| No Children | 0 (0.0%) | 4 (9.1%) |
| 1 or 2 Children | 0 (0.0%) | 10 (13.5%) |
| 3 or 4 Children | 0 (0.0%) | 0 (0.0%) |
| 5 or more Children | 0 (0.0%) | 0 (0.0%) |
| Total | 0 (0.0%) | 14 (11.7%) |
Race in Shafer
The most populous races in Shafer are White / Caucasian (992 | 89.3%), Hispanic or Latino (95 | 8.6%), and Two or more Races (86 | 7.7%).
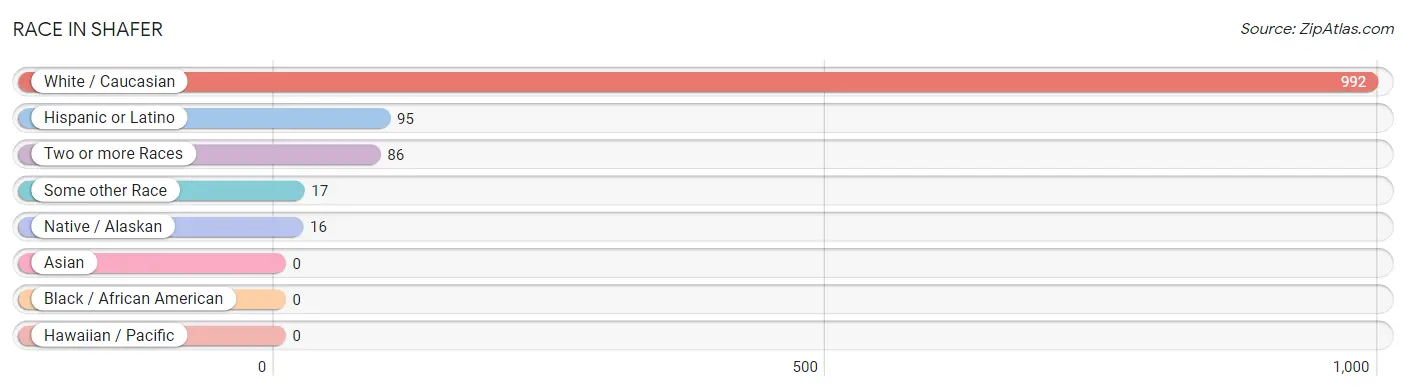
| Race | # Population | % Population |
| Asian | 0 | 0.0% |
| Black / African American | 0 | 0.0% |
| Hawaiian / Pacific | 0 | 0.0% |
| Hispanic or Latino | 95 | 8.6% |
| Native / Alaskan | 16 | 1.4% |
| White / Caucasian | 992 | 89.3% |
| Two or more Races | 86 | 7.7% |
| Some other Race | 17 | 1.5% |
| Total | 1,111 | 100.0% |
Ancestry in Shafer
The most populous ancestries reported in Shafer are German (363 | 32.7%), Norwegian (202 | 18.2%), English (135 | 12.1%), Irish (133 | 12.0%), and Swedish (94 | 8.5%), together accounting for 83.4% of all Shafer residents.
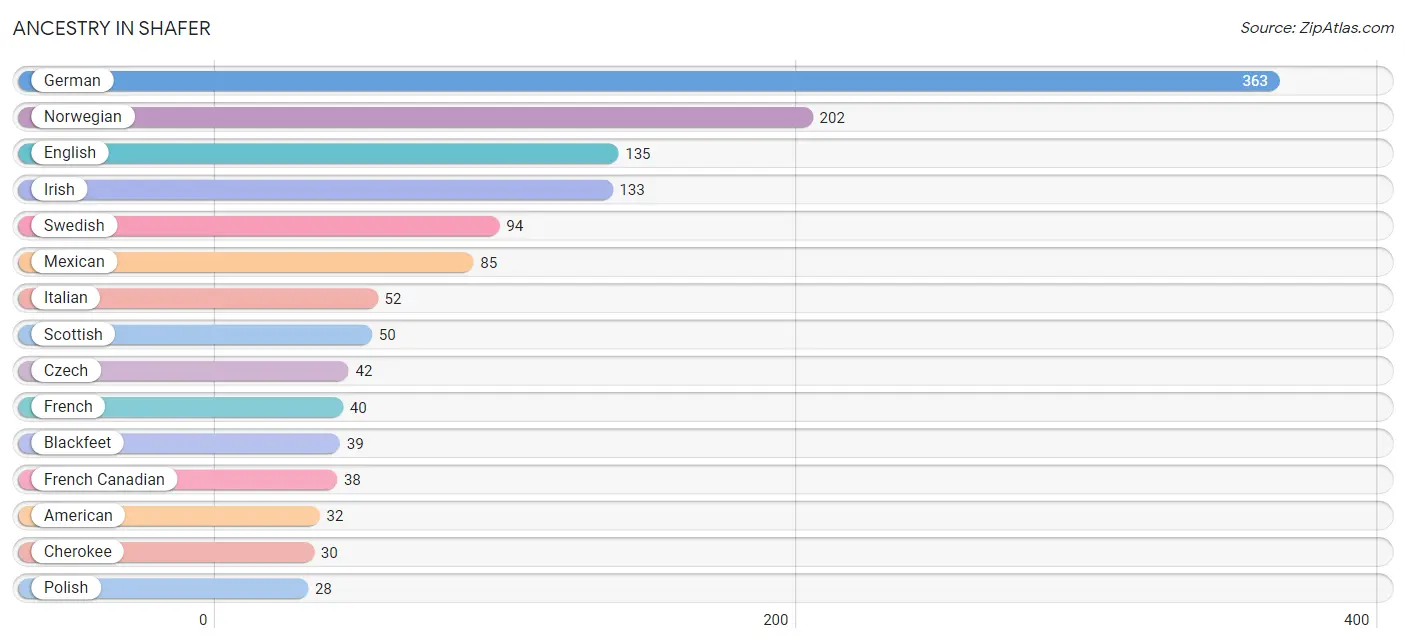
| Ancestry | # Population | % Population |
| American | 32 | 2.9% |
| Arab | 2 | 0.2% |
| Austrian | 2 | 0.2% |
| Belgian | 20 | 1.8% |
| Bhutanese | 10 | 0.9% |
| Blackfeet | 39 | 3.5% |
| Cherokee | 30 | 2.7% |
| Chippewa | 12 | 1.1% |
| Cree | 16 | 1.4% |
| Cuban | 10 | 0.9% |
| Czech | 42 | 3.8% |
| Danish | 10 | 0.9% |
| Dutch | 13 | 1.2% |
| English | 135 | 12.1% |
| European | 2 | 0.2% |
| Finnish | 3 | 0.3% |
| French | 40 | 3.6% |
| French American Indian | 16 | 1.4% |
| French Canadian | 38 | 3.4% |
| German | 363 | 32.7% |
| Irish | 133 | 12.0% |
| Italian | 52 | 4.7% |
| Lebanese | 2 | 0.2% |
| Lithuanian | 8 | 0.7% |
| Mexican | 85 | 7.6% |
| Norwegian | 202 | 18.2% |
| Polish | 28 | 2.5% |
| Russian | 3 | 0.3% |
| Samoan | 10 | 0.9% |
| Scandinavian | 4 | 0.4% |
| Scotch-Irish | 24 | 2.2% |
| Scottish | 50 | 4.5% |
| Sioux | 3 | 0.3% |
| Swedish | 94 | 8.5% |
| Thai | 10 | 0.9% | View All 35 Rows |
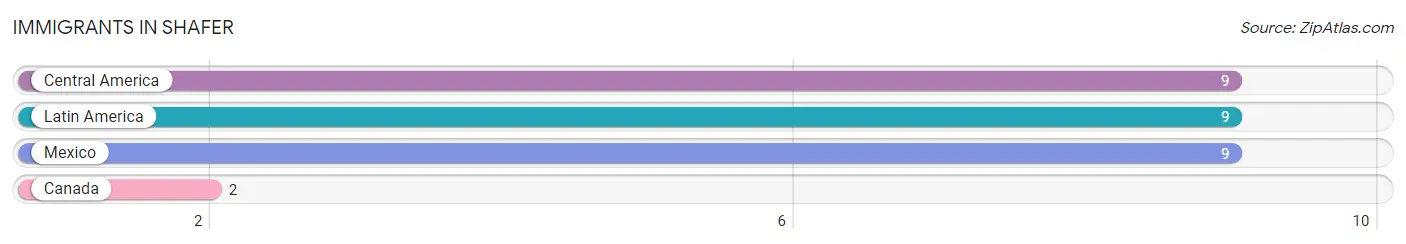
Immigrants in Shafer
The most numerous immigrant groups reported in Shafer came from Central America (9 | 0.8%), Latin America (9 | 0.8%), Mexico (9 | 0.8%), and Canada (2 | 0.2%), together accounting for 2.6% of all Shafer residents.
| Immigration Origin | # Population | % Population |
| Canada | 2 | 0.2% |
| Central America | 9 | 0.8% |
| Latin America | 9 | 0.8% |
| Mexico | 9 | 0.8% | View All 4 Rows |
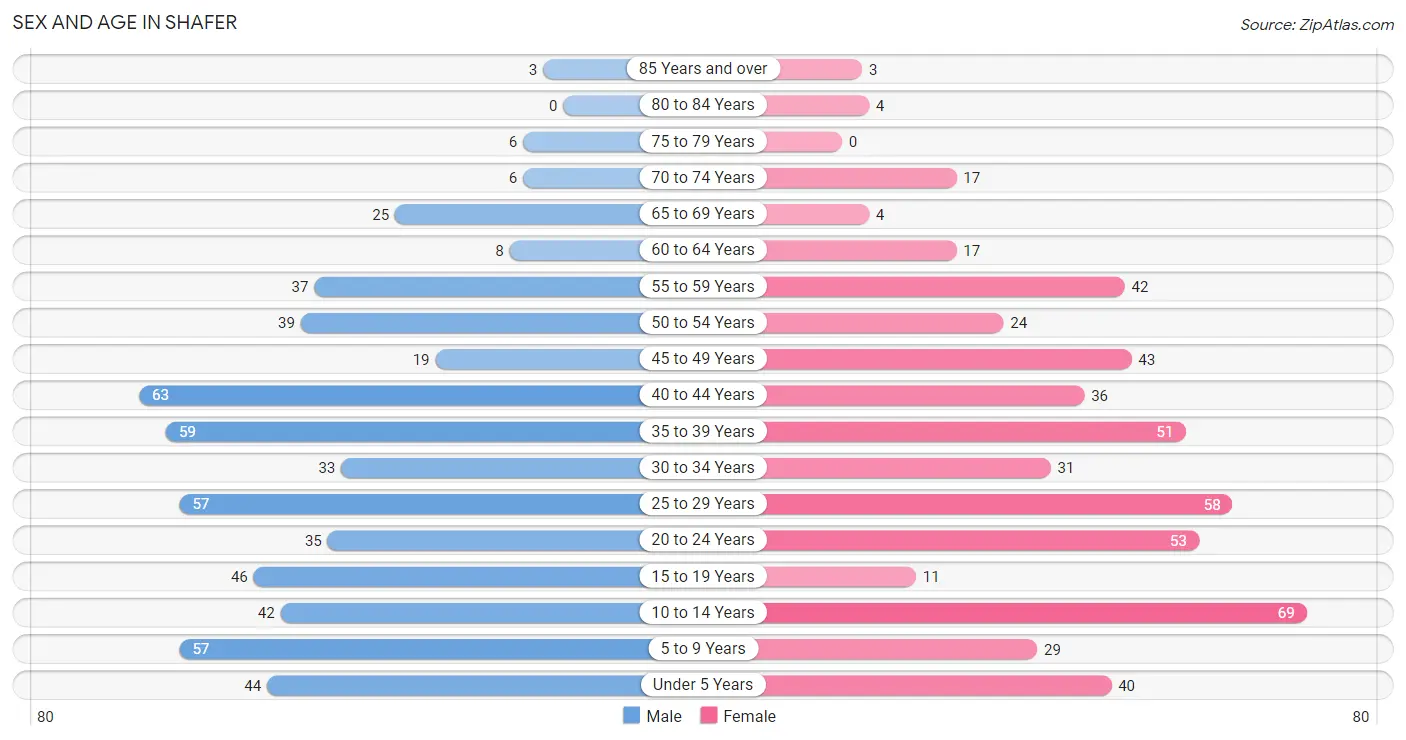
Sex and Age in Shafer
Sex and Age in Shafer
The most populous age groups in Shafer are 40 to 44 Years (63 | 10.9%) for men and 10 to 14 Years (69 | 13.0%) for women.
| Age Bracket | Male | Female |
| Under 5 Years | 44 (7.6%) | 40 (7.5%) |
| 5 to 9 Years | 57 (9.8%) | 29 (5.4%) |
| 10 to 14 Years | 42 (7.2%) | 69 (13.0%) |
| 15 to 19 Years | 46 (7.9%) | 11 (2.1%) |
| 20 to 24 Years | 35 (6.0%) | 53 (10.0%) |
| 25 to 29 Years | 57 (9.8%) | 58 (10.9%) |
| 30 to 34 Years | 33 (5.7%) | 31 (5.8%) |
| 35 to 39 Years | 59 (10.2%) | 51 (9.6%) |
| 40 to 44 Years | 63 (10.9%) | 36 (6.8%) |
| 45 to 49 Years | 19 (3.3%) | 43 (8.1%) |
| 50 to 54 Years | 39 (6.7%) | 24 (4.5%) |
| 55 to 59 Years | 37 (6.4%) | 42 (7.9%) |
| 60 to 64 Years | 8 (1.4%) | 17 (3.2%) |
| 65 to 69 Years | 25 (4.3%) | 4 (0.7%) |
| 70 to 74 Years | 6 (1.0%) | 17 (3.2%) |
| 75 to 79 Years | 6 (1.0%) | 0 (0.0%) |
| 80 to 84 Years | 0 (0.0%) | 4 (0.7%) |
| 85 Years and over | 3 (0.5%) | 3 (0.6%) |
| Total | 579 (100.0%) | 532 (100.0%) |
Families and Households in Shafer
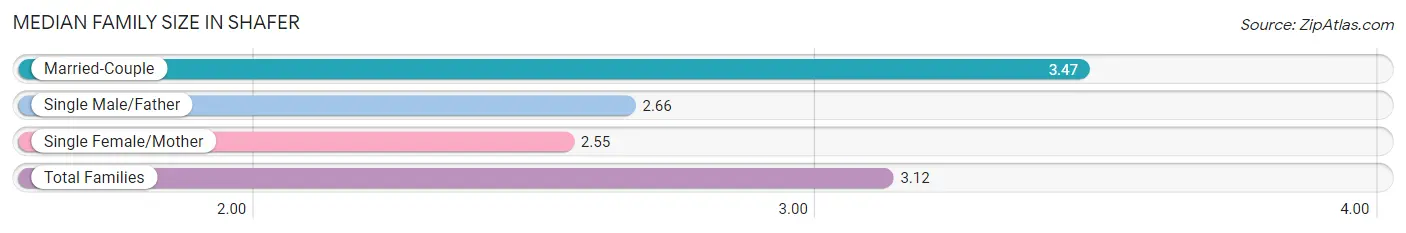
Median Family Size in Shafer
The median family size in Shafer is 3.12 persons per family, with married-couple families (172 | 58.9%) accounting for the largest median family size of 3.47 persons per family. On the other hand, single female/mother families (55 | 18.8%) represent the smallest median family size with 2.55 persons per family.
| Family Type | # Families | Family Size |
| Married-Couple | 172 (58.9%) | 3.47 |
| Single Male/Father | 65 (22.3%) | 2.66 |
| Single Female/Mother | 55 (18.8%) | 2.55 |
| Total Families | 292 (100.0%) | 3.12 |
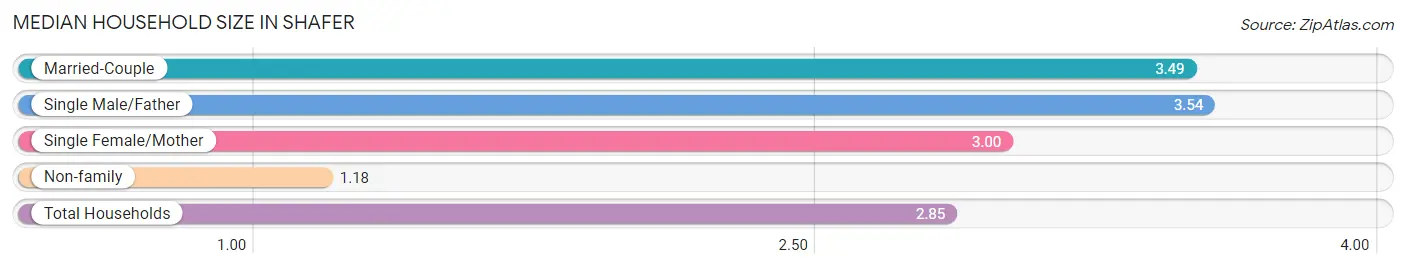
Median Household Size in Shafer
The median household size in Shafer is 2.85 persons per household, with single male/father households (65 | 16.7%) accounting for the largest median household size of 3.54 persons per household. non-family households (98 | 25.1%) represent the smallest median household size with 1.18 persons per household.
| Household Type | # Households | Household Size |
| Married-Couple | 172 (44.1%) | 3.49 |
| Single Male/Father | 65 (16.7%) | 3.54 |
| Single Female/Mother | 55 (14.1%) | 3.00 |
| Non-family | 98 (25.1%) | 1.18 |
| Total Households | 390 (100.0%) | 2.85 |
Household Size by Marriage Status in Shafer
Out of a total of 390 households in Shafer, 292 (74.9%) are family households, while 98 (25.1%) are nonfamily households. The most numerous type of family households are 3-person households, comprising 87, and the most common type of nonfamily households are 1-person households, comprising 80.
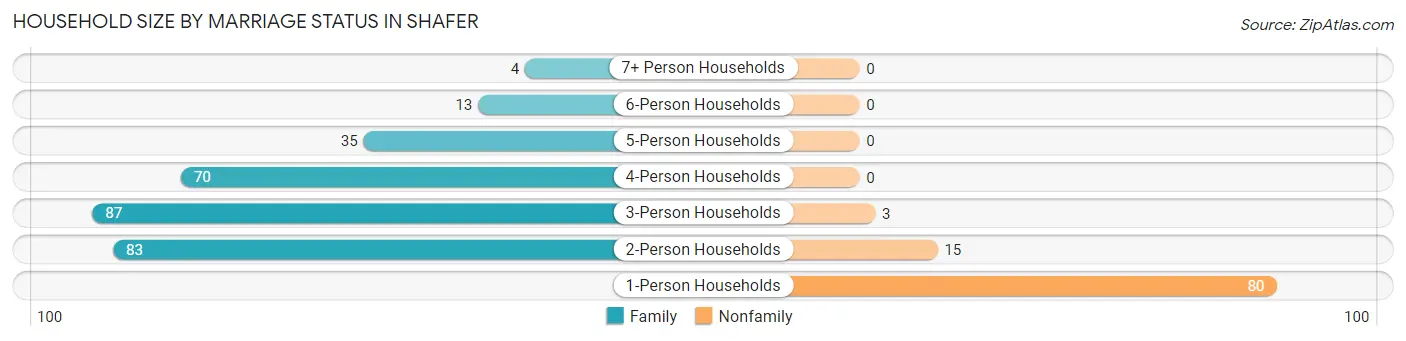
| Household Size | Family Households | Nonfamily Households |
| 1-Person Households | - | 80 (20.5%) |
| 2-Person Households | 83 (21.3%) | 15 (3.8%) |
| 3-Person Households | 87 (22.3%) | 3 (0.8%) |
| 4-Person Households | 70 (17.9%) | 0 (0.0%) |
| 5-Person Households | 35 (9.0%) | 0 (0.0%) |
| 6-Person Households | 13 (3.3%) | 0 (0.0%) |
| 7+ Person Households | 4 (1.0%) | 0 (0.0%) |
| Total | 292 (74.9%) | 98 (25.1%) |
Female Fertility in Shafer
Fertility by Age in Shafer
Average fertility rate in Shafer is 95.0 births per 1,000 women. Women in the age bracket of 20 to 34 years have the highest fertility rate with 190.0 births per 1,000 women. Women in the age bracket of 20 to 34 years acount for 100.0% of all women with births.
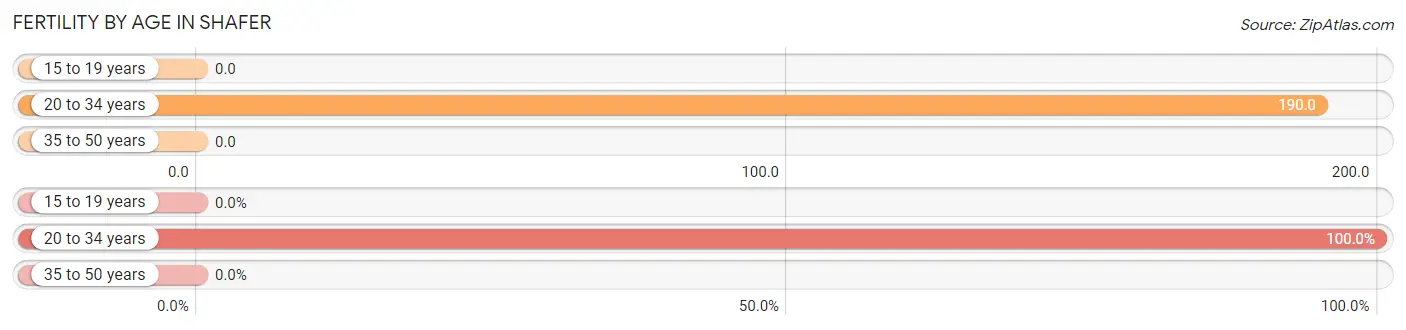
| Age Bracket | Women with Births | Births / 1,000 Women |
| 15 to 19 years | 0 (0.0%) | 0.0 |
| 20 to 34 years | 27 (100.0%) | 190.0 |
| 35 to 50 years | 0 (0.0%) | 0.0 |
| Total | 27 (100.0%) | 95.0 |
Fertility by Age by Marriage Status in Shafer
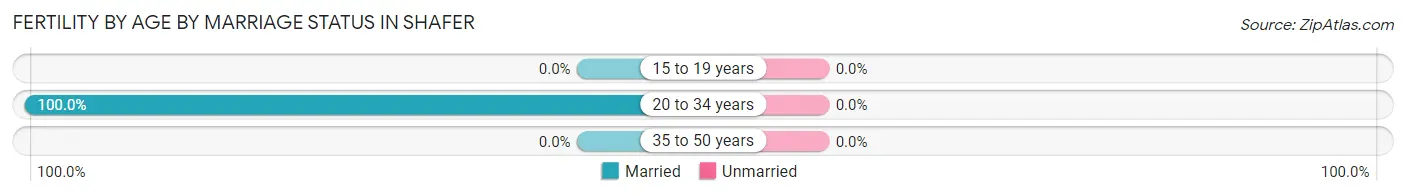
| Age Bracket | Married | Unmarried |
| 15 to 19 years | 0 (0.0%) | 0 (0.0%) |
| 20 to 34 years | 27 (100.0%) | 0 (0.0%) |
| 35 to 50 years | 0 (0.0%) | 0 (0.0%) |
| Total | 27 (100.0%) | 0 (0.0%) |
Fertility by Education in Shafer
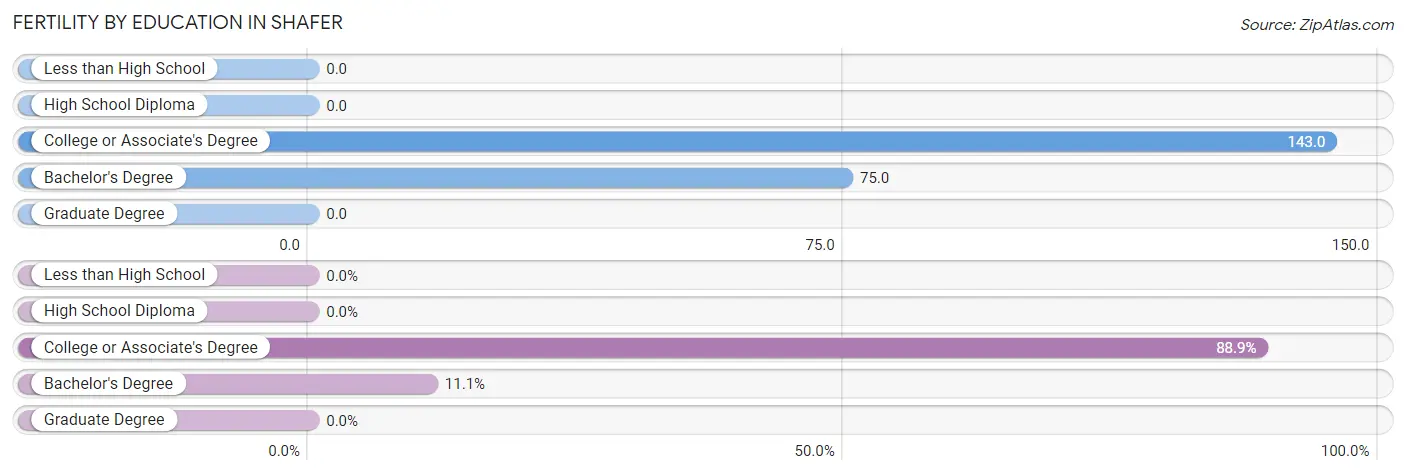
| Educational Attainment | Women with Births | Births / 1,000 Women |
| Less than High School | 0 (0.0%) | 0.0 |
| High School Diploma | 0 (0.0%) | 0.0 |
| College or Associate's Degree | 24 (88.9%) | 143.0 |
| Bachelor's Degree | 3 (11.1%) | 75.0 |
| Graduate Degree | 0 (0.0%) | 0.0 |
| Total | 27 (100.0%) | 95.0 |
Fertility by Education by Marriage Status in Shafer
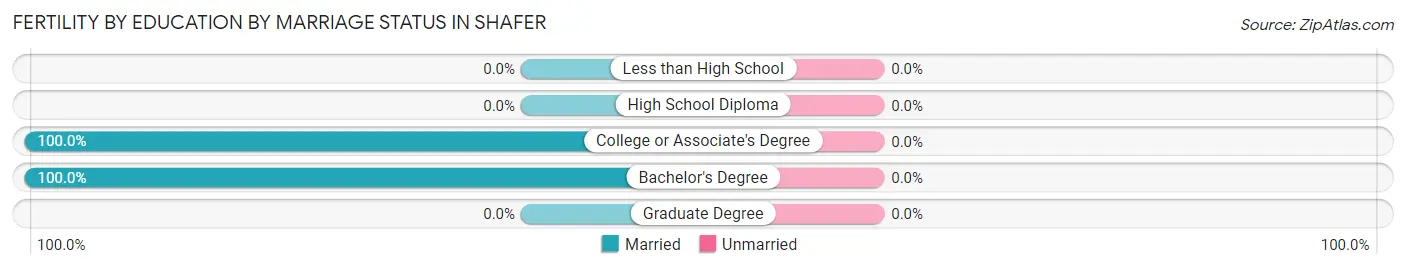
| Educational Attainment | Married | Unmarried |
| Less than High School | 0 (0.0%) | 0 (0.0%) |
| High School Diploma | 0 (0.0%) | 0 (0.0%) |
| College or Associate's Degree | 24 (100.0%) | 0 (0.0%) |
| Bachelor's Degree | 3 (100.0%) | 0 (0.0%) |
| Graduate Degree | 0 (0.0%) | 0 (0.0%) |
| Total | 27 (100.0%) | 0 (0.0%) |
Employment Characteristics in Shafer
Employment by Class of Employer in Shafer
Among the 601 employed individuals in Shafer, private company employees (416 | 69.2%), local government employees (87 | 14.5%), and not-for-profit organizations (52 | 8.6%) make up the most common classes of employment.
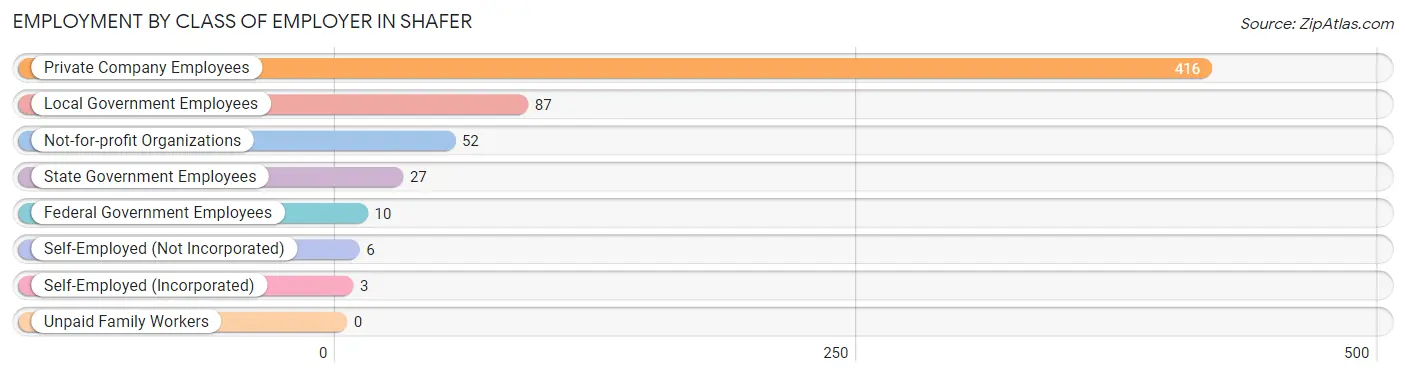
| Employer Class | # Employees | % Employees |
| Private Company Employees | 416 | 69.2% |
| Self-Employed (Incorporated) | 3 | 0.5% |
| Self-Employed (Not Incorporated) | 6 | 1.0% |
| Not-for-profit Organizations | 52 | 8.6% |
| Local Government Employees | 87 | 14.5% |
| State Government Employees | 27 | 4.5% |
| Federal Government Employees | 10 | 1.7% |
| Unpaid Family Workers | 0 | 0.0% |
| Total | 601 | 100.0% |
Employment Status by Age in Shafer
According to the labor force statistics for Shafer, out of the total population over 16 years of age (819), 80.7% or 661 individuals are in the labor force, with 3.2% or 21 of them unemployed. The age group with the highest labor force participation rate is 20 to 24 years, with 100.0% or 88 individuals in the labor force. Within the labor force, the 20 to 24 years age range has the highest percentage of unemployed individuals, with 15.9% or 14 of them being unemployed.
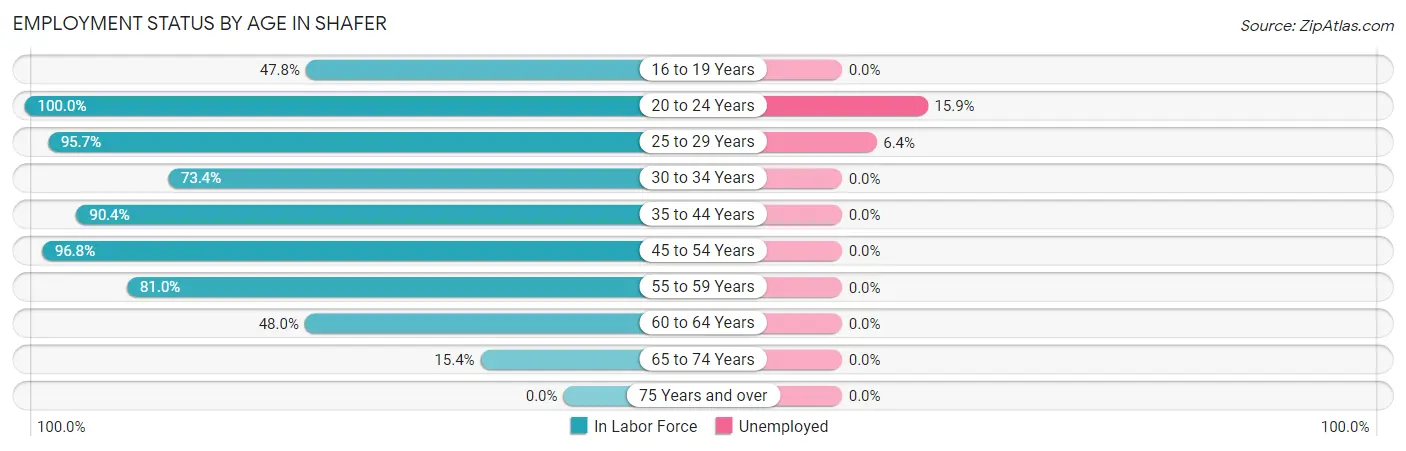
| Age Bracket | In Labor Force | Unemployed |
| 16 to 19 Years | 22 (47.8%) | 0 (0.0%) |
| 20 to 24 Years | 88 (100.0%) | 14 (15.9%) |
| 25 to 29 Years | 110 (95.7%) | 7 (6.4%) |
| 30 to 34 Years | 47 (73.4%) | 0 (0.0%) |
| 35 to 44 Years | 189 (90.4%) | 0 (0.0%) |
| 45 to 54 Years | 121 (96.8%) | 0 (0.0%) |
| 55 to 59 Years | 64 (81.0%) | 0 (0.0%) |
| 60 to 64 Years | 12 (48.0%) | 0 (0.0%) |
| 65 to 74 Years | 8 (15.4%) | 0 (0.0%) |
| 75 Years and over | 0 (0.0%) | 0 (0.0%) |
| Total | 661 (80.7%) | 21 (3.2%) |
Employment Status by Educational Attainment in Shafer
According to labor force statistics for Shafer, 88.0% of individuals (543) out of the total population between 25 and 64 years of age (617) are in the labor force, with 1.3% or 7 of them being unemployed. The group with the highest labor force participation rate are those with the educational attainment of less than high school, with 94.3% or 33 individuals in the labor force. Within the labor force, individuals with bachelor's degree or higher education have the highest percentage of unemployment, with 3.1% or 3 of them being unemployed.
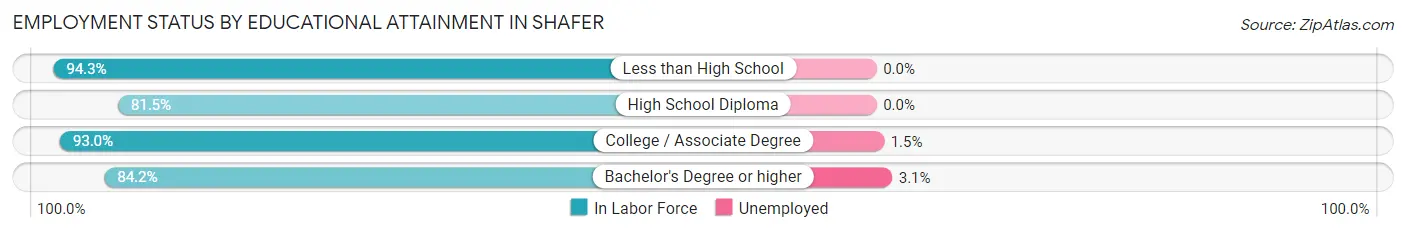
| Educational Attainment | In Labor Force | Unemployed |
| Less than High School | 33 (94.3%) | 0 (0.0%) |
| High School Diploma | 150 (81.5%) | 0 (0.0%) |
| College / Associate Degree | 264 (93.0%) | 4 (1.5%) |
| Bachelor's Degree or higher | 96 (84.2%) | 4 (3.1%) |
| Total | 543 (88.0%) | 8 (1.3%) |
Employment Occupations by Sex in Shafer
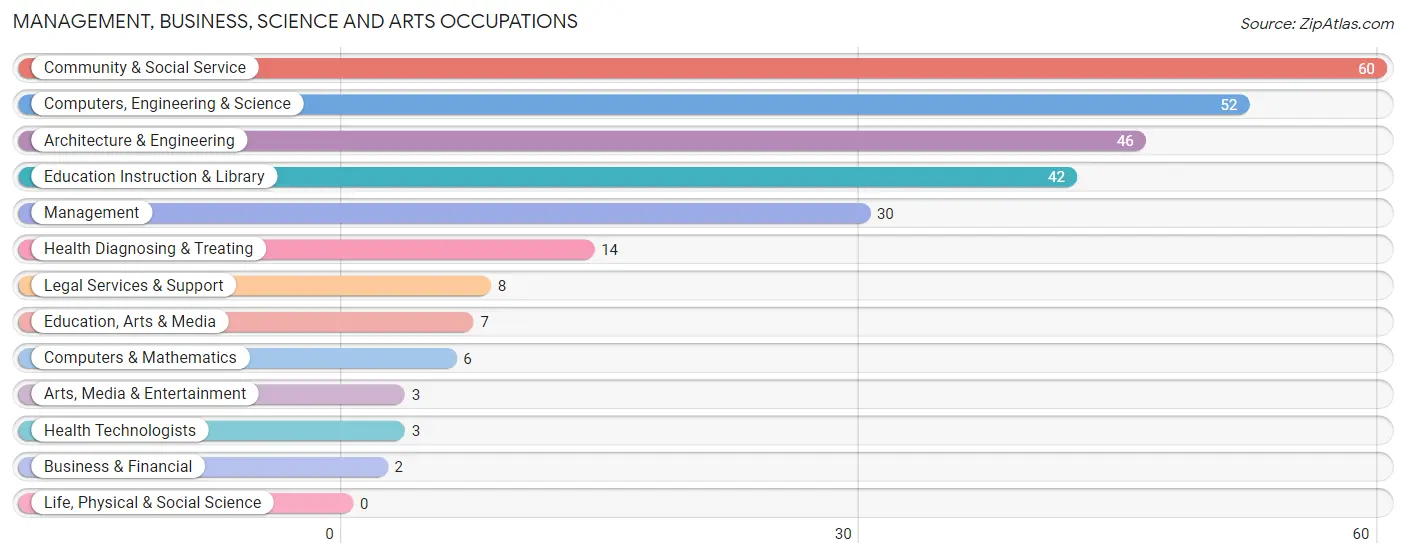
Management, Business, Science and Arts Occupations
The most common Management, Business, Science and Arts occupations in Shafer are Community & Social Service (60 | 9.4%), Computers, Engineering & Science (52 | 8.1%), Architecture & Engineering (46 | 7.2%), Education Instruction & Library (42 | 6.6%), and Management (30 | 4.7%).
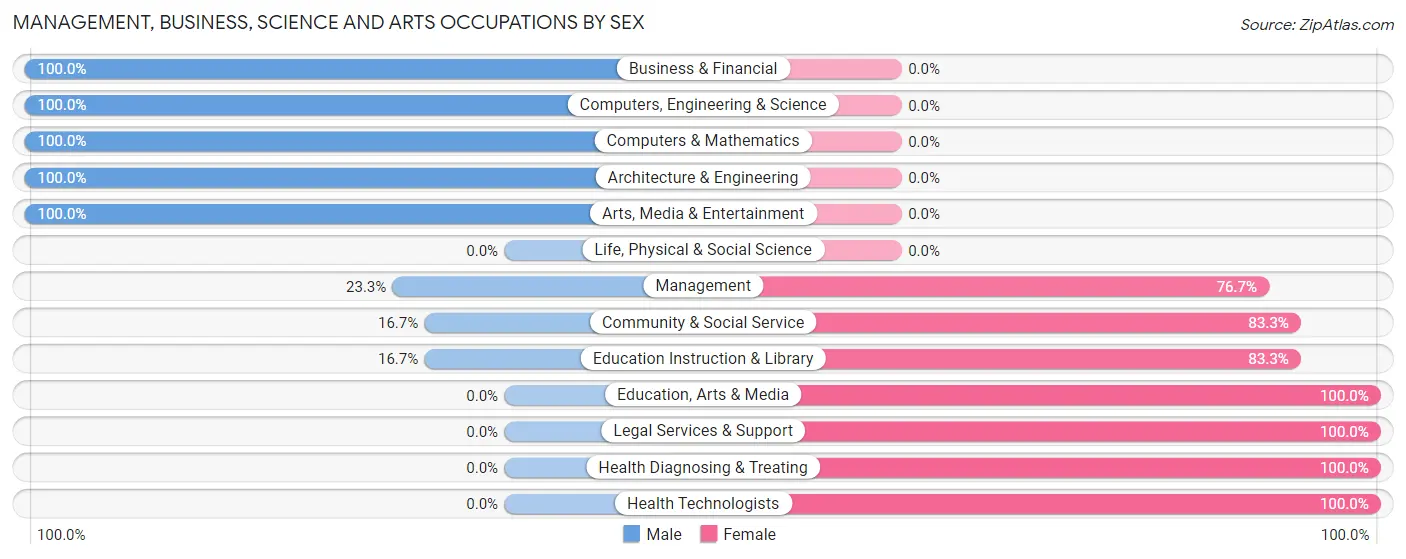
Management, Business, Science and Arts Occupations by Sex
Within the Management, Business, Science and Arts occupations in Shafer, the most male-oriented occupations are Business & Financial (100.0%), Computers, Engineering & Science (100.0%), and Computers & Mathematics (100.0%), while the most female-oriented occupations are Education, Arts & Media (100.0%), Legal Services & Support (100.0%), and Health Diagnosing & Treating (100.0%).
| Occupation | Male | Female |
| Management | 7 (23.3%) | 23 (76.7%) |
| Business & Financial | 2 (100.0%) | 0 (0.0%) |
| Computers, Engineering & Science | 52 (100.0%) | 0 (0.0%) |
| Computers & Mathematics | 6 (100.0%) | 0 (0.0%) |
| Architecture & Engineering | 46 (100.0%) | 0 (0.0%) |
| Life, Physical & Social Science | 0 (0.0%) | 0 (0.0%) |
| Community & Social Service | 10 (16.7%) | 50 (83.3%) |
| Education, Arts & Media | 0 (0.0%) | 7 (100.0%) |
| Legal Services & Support | 0 (0.0%) | 8 (100.0%) |
| Education Instruction & Library | 7 (16.7%) | 35 (83.3%) |
| Arts, Media & Entertainment | 3 (100.0%) | 0 (0.0%) |
| Health Diagnosing & Treating | 0 (0.0%) | 14 (100.0%) |
| Health Technologists | 0 (0.0%) | 3 (100.0%) |
| Total (Category) | 71 (44.9%) | 87 (55.1%) |
| Total (Overall) | 335 (52.3%) | 305 (47.7%) |
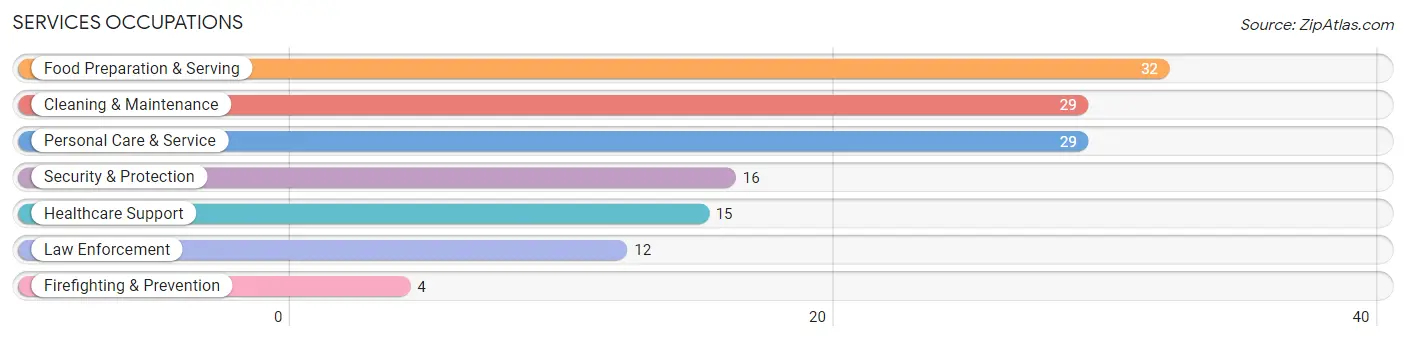
Services Occupations
The most common Services occupations in Shafer are Food Preparation & Serving (32 | 5.0%), Cleaning & Maintenance (29 | 4.5%), Personal Care & Service (29 | 4.5%), Security & Protection (16 | 2.5%), and Healthcare Support (15 | 2.3%).
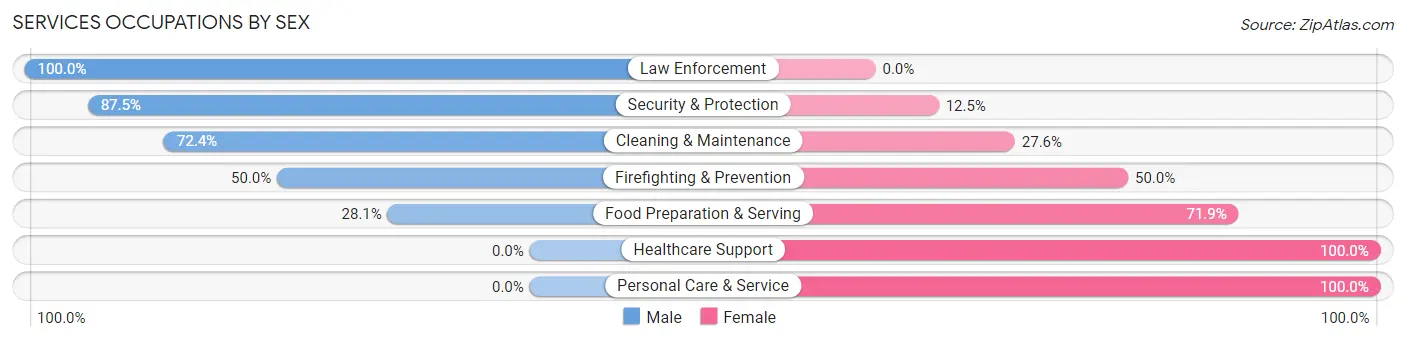
Services Occupations by Sex
Within the Services occupations in Shafer, the most male-oriented occupations are Law Enforcement (100.0%), Security & Protection (87.5%), and Cleaning & Maintenance (72.4%), while the most female-oriented occupations are Healthcare Support (100.0%), Personal Care & Service (100.0%), and Food Preparation & Serving (71.9%).
| Occupation | Male | Female |
| Healthcare Support | 0 (0.0%) | 15 (100.0%) |
| Security & Protection | 14 (87.5%) | 2 (12.5%) |
| Firefighting & Prevention | 2 (50.0%) | 2 (50.0%) |
| Law Enforcement | 12 (100.0%) | 0 (0.0%) |
| Food Preparation & Serving | 9 (28.1%) | 23 (71.9%) |
| Cleaning & Maintenance | 21 (72.4%) | 8 (27.6%) |
| Personal Care & Service | 0 (0.0%) | 29 (100.0%) |
| Total (Category) | 44 (36.4%) | 77 (63.6%) |
| Total (Overall) | 335 (52.3%) | 305 (47.7%) |
Sales and Office Occupations
The most common Sales and Office occupations in Shafer are Office & Administration (96 | 15.0%), and Sales & Related (58 | 9.1%).
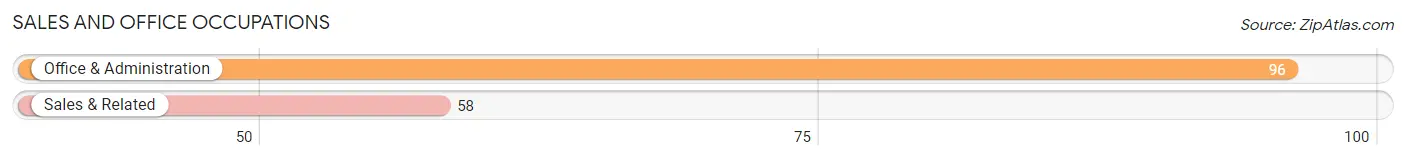
Sales and Office Occupations by Sex
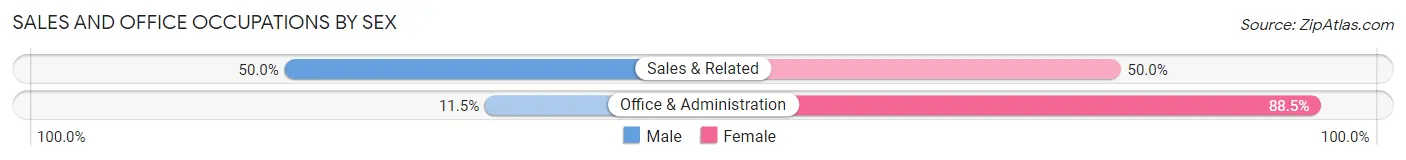
| Occupation | Male | Female |
| Sales & Related | 29 (50.0%) | 29 (50.0%) |
| Office & Administration | 11 (11.5%) | 85 (88.5%) |
| Total (Category) | 40 (26.0%) | 114 (74.0%) |
| Total (Overall) | 335 (52.3%) | 305 (47.7%) |
Natural Resources, Construction and Maintenance Occupations
The most common Natural Resources, Construction and Maintenance occupations in Shafer are Construction & Extraction (70 | 10.9%), Installation, Maintenance & Repair (26 | 4.1%), and Farming, Fishing & Forestry (3 | 0.5%).
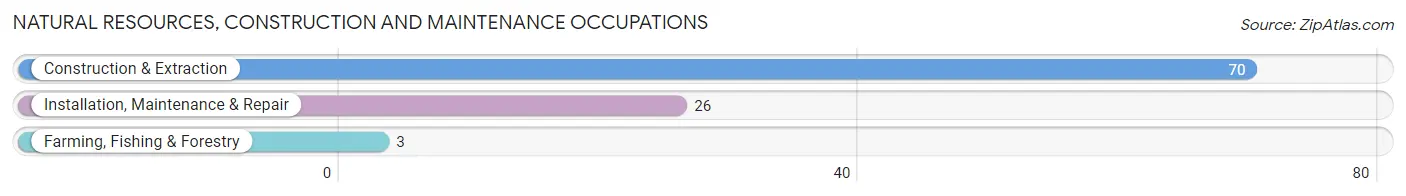
Natural Resources, Construction and Maintenance Occupations by Sex
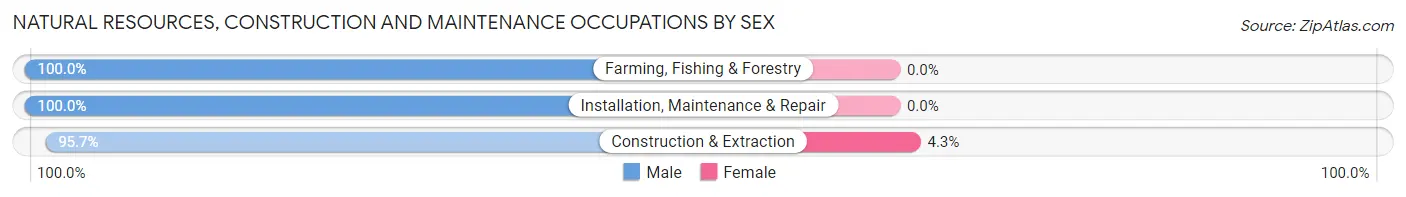
| Occupation | Male | Female |
| Farming, Fishing & Forestry | 3 (100.0%) | 0 (0.0%) |
| Construction & Extraction | 67 (95.7%) | 3 (4.3%) |
| Installation, Maintenance & Repair | 26 (100.0%) | 0 (0.0%) |
| Total (Category) | 96 (97.0%) | 3 (3.0%) |
| Total (Overall) | 335 (52.3%) | 305 (47.7%) |
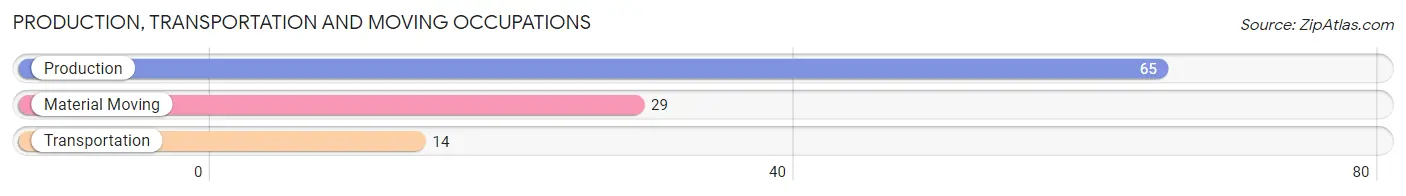
Production, Transportation and Moving Occupations
The most common Production, Transportation and Moving occupations in Shafer are Production (65 | 10.2%), Material Moving (29 | 4.5%), and Transportation (14 | 2.2%).
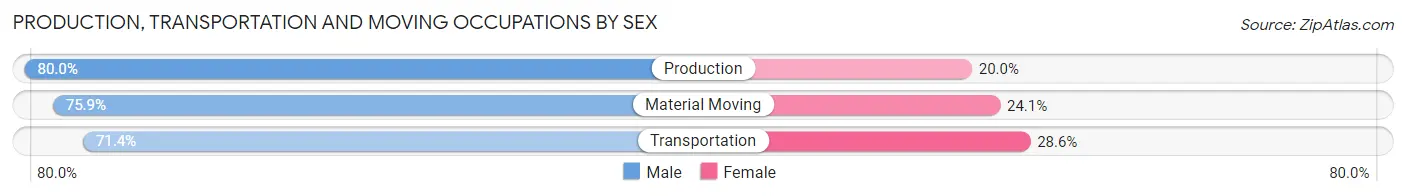
Production, Transportation and Moving Occupations by Sex
| Occupation | Male | Female |
| Production | 52 (80.0%) | 13 (20.0%) |
| Transportation | 10 (71.4%) | 4 (28.6%) |
| Material Moving | 22 (75.9%) | 7 (24.1%) |
| Total (Category) | 84 (77.8%) | 24 (22.2%) |
| Total (Overall) | 335 (52.3%) | 305 (47.7%) |
Employment Industries by Sex in Shafer
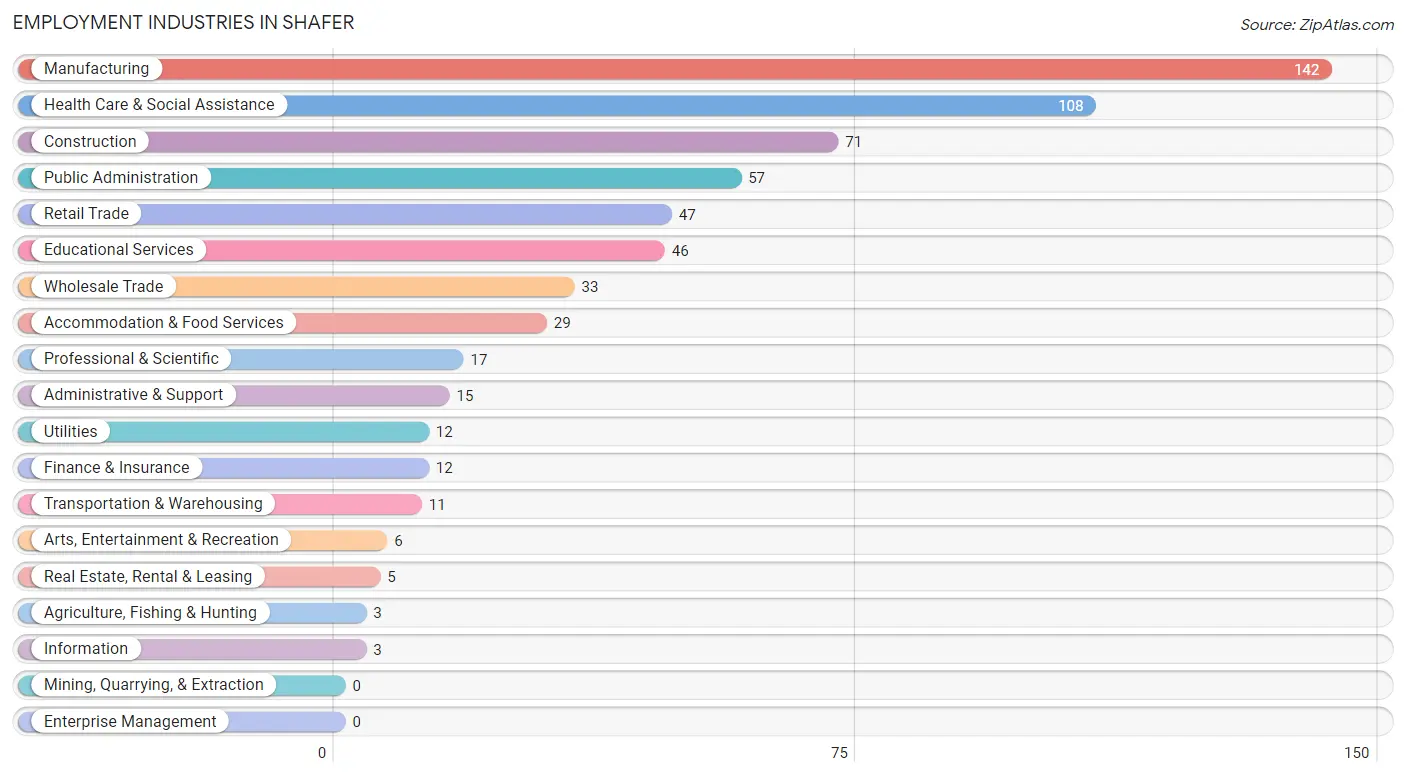
Employment Industries in Shafer
The major employment industries in Shafer include Manufacturing (142 | 22.2%), Health Care & Social Assistance (108 | 16.9%), Construction (71 | 11.1%), Public Administration (57 | 8.9%), and Retail Trade (47 | 7.3%).
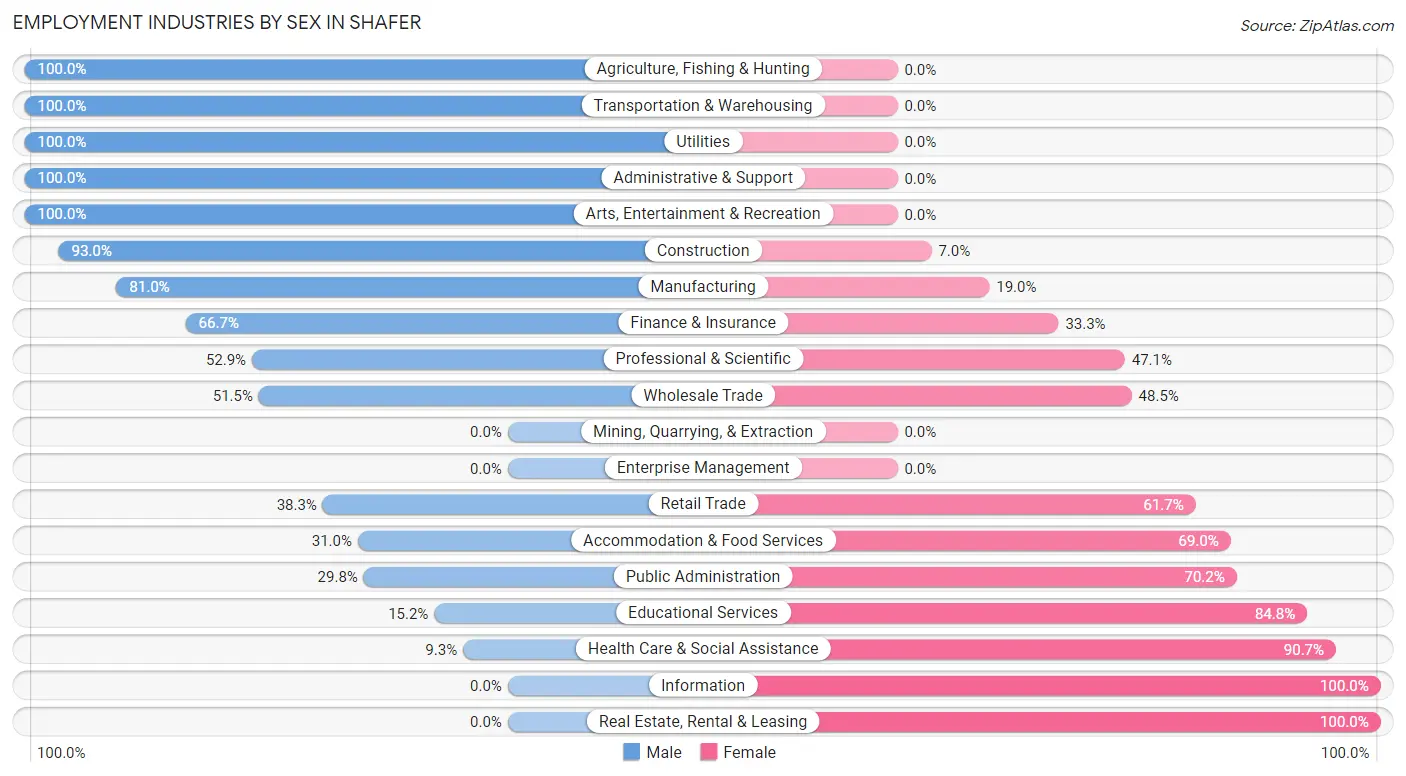
Employment Industries by Sex in Shafer
The Shafer industries that see more men than women are Agriculture, Fishing & Hunting (100.0%), Transportation & Warehousing (100.0%), and Utilities (100.0%), whereas the industries that tend to have a higher number of women are Information (100.0%), Real Estate, Rental & Leasing (100.0%), and Health Care & Social Assistance (90.7%).
| Industry | Male | Female |
| Agriculture, Fishing & Hunting | 3 (100.0%) | 0 (0.0%) |
| Mining, Quarrying, & Extraction | 0 (0.0%) | 0 (0.0%) |
| Construction | 66 (93.0%) | 5 (7.0%) |
| Manufacturing | 115 (81.0%) | 27 (19.0%) |
| Wholesale Trade | 17 (51.5%) | 16 (48.5%) |
| Retail Trade | 18 (38.3%) | 29 (61.7%) |
| Transportation & Warehousing | 11 (100.0%) | 0 (0.0%) |
| Utilities | 12 (100.0%) | 0 (0.0%) |
| Information | 0 (0.0%) | 3 (100.0%) |
| Finance & Insurance | 8 (66.7%) | 4 (33.3%) |
| Real Estate, Rental & Leasing | 0 (0.0%) | 5 (100.0%) |
| Professional & Scientific | 9 (52.9%) | 8 (47.1%) |
| Enterprise Management | 0 (0.0%) | 0 (0.0%) |
| Administrative & Support | 15 (100.0%) | 0 (0.0%) |
| Educational Services | 7 (15.2%) | 39 (84.8%) |
| Health Care & Social Assistance | 10 (9.3%) | 98 (90.7%) |
| Arts, Entertainment & Recreation | 6 (100.0%) | 0 (0.0%) |
| Accommodation & Food Services | 9 (31.0%) | 20 (69.0%) |
| Public Administration | 17 (29.8%) | 40 (70.2%) |
| Total | 335 (52.3%) | 305 (47.7%) |
Education in Shafer
School Enrollment in Shafer
The most common levels of schooling among the 312 students in Shafer are elementary school (95 | 30.4%), middle school (77 | 24.7%), and high school (60 | 19.2%).
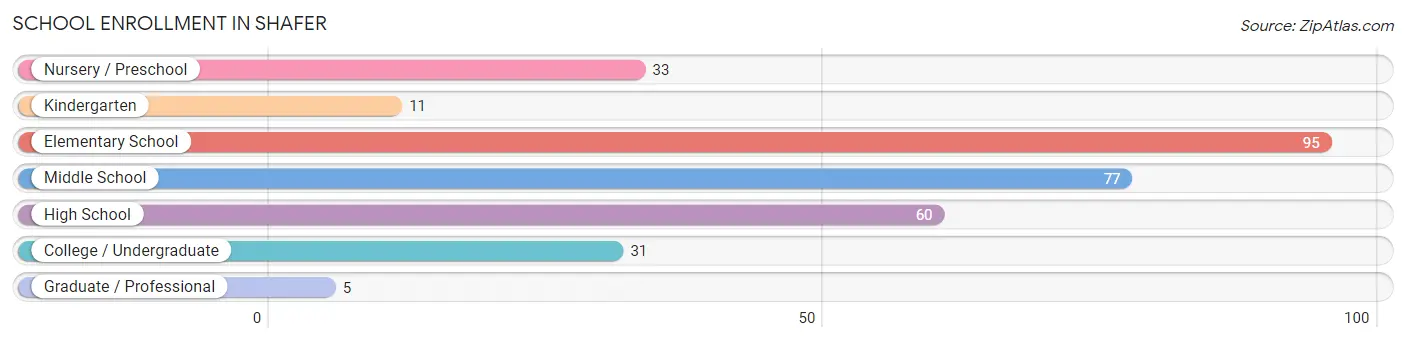
| School Level | # Students | % Students |
| Nursery / Preschool | 33 | 10.6% |
| Kindergarten | 11 | 3.5% |
| Elementary School | 95 | 30.4% |
| Middle School | 77 | 24.7% |
| High School | 60 | 19.2% |
| College / Undergraduate | 31 | 9.9% |
| Graduate / Professional | 5 | 1.6% |
| Total | 312 | 100.0% |
School Enrollment by Age by Funding Source in Shafer
Out of a total of 312 students who are enrolled in schools in Shafer, 38 (12.2%) attend a private institution, while the remaining 274 (87.8%) are enrolled in public schools. The age group of 3 to 4 year olds has the highest likelihood of being enrolled in private schools, with 16 (57.1% in the age bracket) enrolled. Conversely, the age group of 10 to 14 year olds has the lowest likelihood of being enrolled in a private school, with 111 (100.0% in the age bracket) attending a public institution.
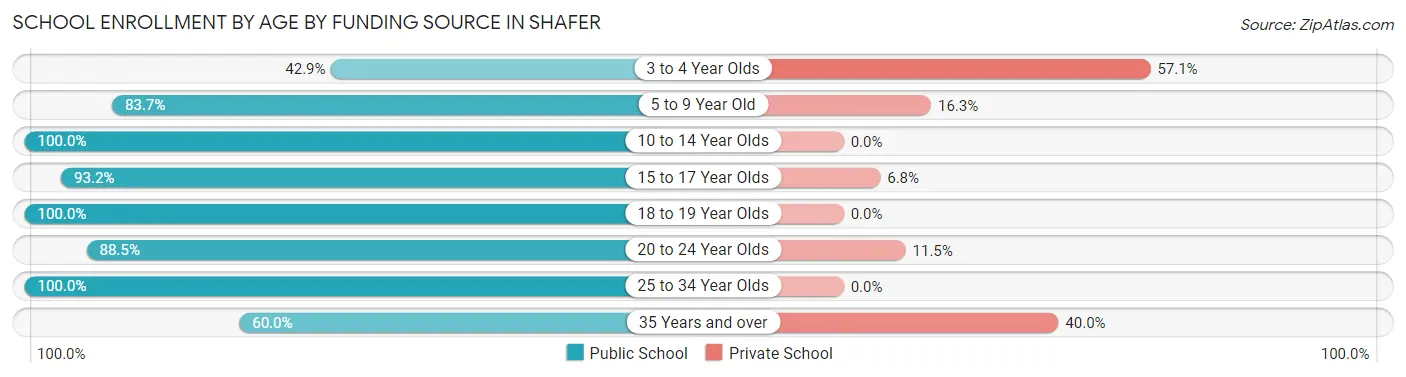
| Age Bracket | Public School | Private School |
| 3 to 4 Year Olds | 12 (42.9%) | 16 (57.1%) |
| 5 to 9 Year Old | 72 (83.7%) | 14 (16.3%) |
| 10 to 14 Year Olds | 111 (100.0%) | 0 (0.0%) |
| 15 to 17 Year Olds | 41 (93.2%) | 3 (6.8%) |
| 18 to 19 Year Olds | 7 (100.0%) | 0 (0.0%) |
| 20 to 24 Year Olds | 23 (88.5%) | 3 (11.5%) |
| 25 to 34 Year Olds | 5 (100.0%) | 0 (0.0%) |
| 35 Years and over | 3 (60.0%) | 2 (40.0%) |
| Total | 274 (87.8%) | 38 (12.2%) |
Educational Attainment by Field of Study in Shafer
Social sciences (20 | 13.6%), engineering (20 | 13.6%), psychology (18 | 12.2%), business (17 | 11.6%), and education (12 | 8.2%) are the most common fields of study among 147 individuals in Shafer who have obtained a bachelor's degree or higher.
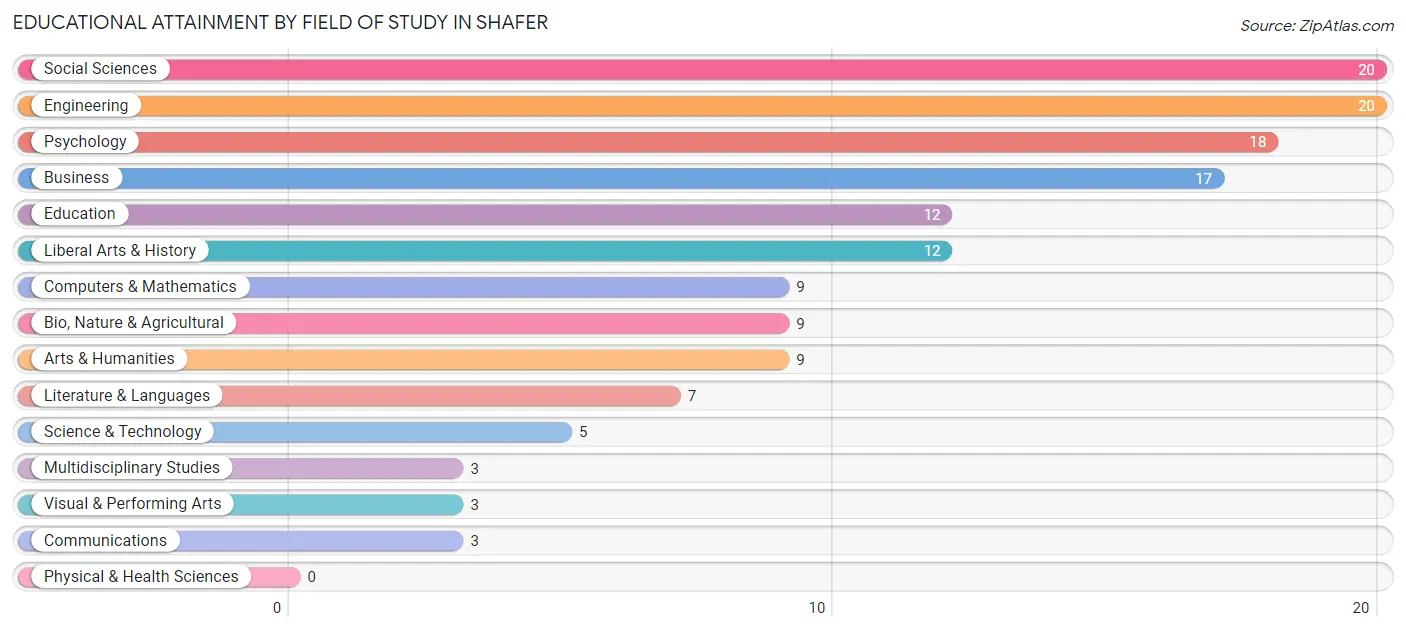
| Field of Study | # Graduates | % Graduates |
| Computers & Mathematics | 9 | 6.1% |
| Bio, Nature & Agricultural | 9 | 6.1% |
| Physical & Health Sciences | 0 | 0.0% |
| Psychology | 18 | 12.2% |
| Social Sciences | 20 | 13.6% |
| Engineering | 20 | 13.6% |
| Multidisciplinary Studies | 3 | 2.0% |
| Science & Technology | 5 | 3.4% |
| Business | 17 | 11.6% |
| Education | 12 | 8.2% |
| Literature & Languages | 7 | 4.8% |
| Liberal Arts & History | 12 | 8.2% |
| Visual & Performing Arts | 3 | 2.0% |
| Communications | 3 | 2.0% |
| Arts & Humanities | 9 | 6.1% |
| Total | 147 | 100.0% |
Transportation & Commute in Shafer
Vehicle Availability by Sex in Shafer
The most prevalent vehicle ownership categories in Shafer are males with 2 vehicles (157, accounting for 46.9%) and females with 2 vehicles (126, making up 59.0%).
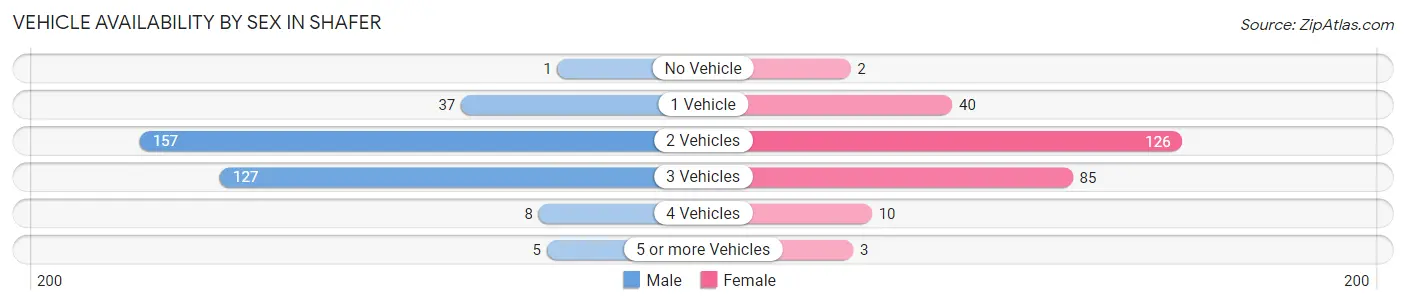
| Vehicles Available | Male | Female |
| No Vehicle | 1 (0.3%) | 2 (0.7%) |
| 1 Vehicle | 37 (11.0%) | 40 (15.0%) |
| 2 Vehicles | 157 (46.9%) | 126 (47.4%) |
| 3 Vehicles | 127 (37.9%) | 85 (32.0%) |
| 4 Vehicles | 8 (2.4%) | 10 (3.8%) |
| 5 or more Vehicles | 5 (1.5%) | 3 (1.1%) |
| Total | 335 (100.0%) | 266 (100.0%) |
Commute Time in Shafer
The most frequently occuring commute durations in Shafer are 45 to 59 minutes (108 commuters, 19.4%), 60 to 89 minutes (67 commuters, 12.0%), and 25 to 29 minutes (63 commuters, 11.3%).
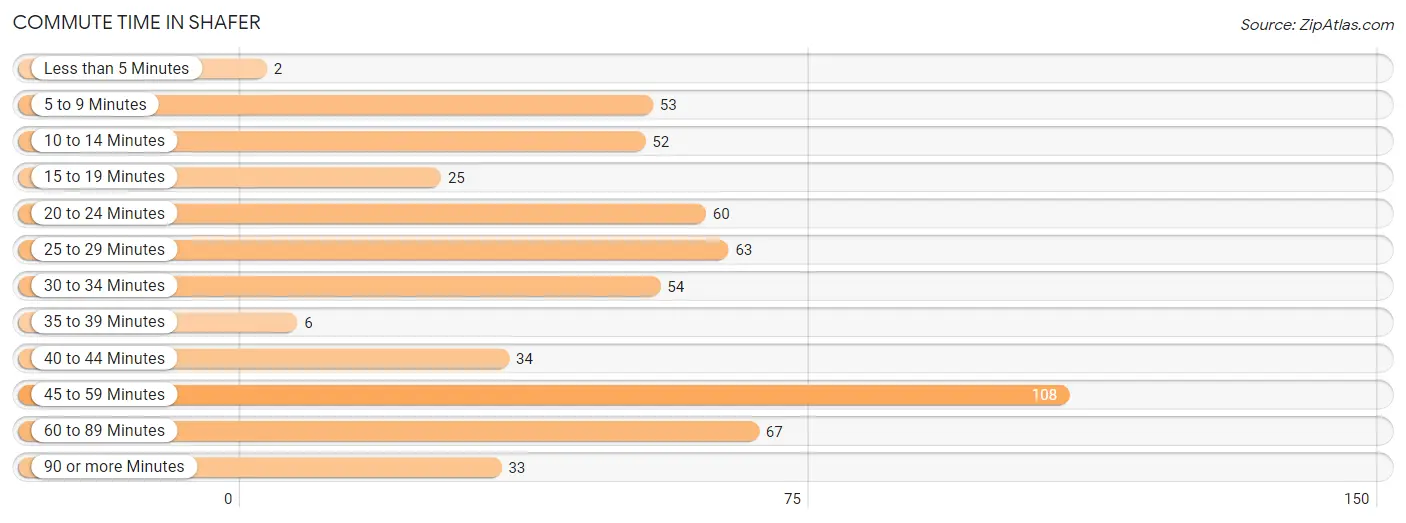
| Commute Time | # Commuters | % Commuters |
| Less than 5 Minutes | 2 | 0.4% |
| 5 to 9 Minutes | 53 | 9.5% |
| 10 to 14 Minutes | 52 | 9.3% |
| 15 to 19 Minutes | 25 | 4.5% |
| 20 to 24 Minutes | 60 | 10.8% |
| 25 to 29 Minutes | 63 | 11.3% |
| 30 to 34 Minutes | 54 | 9.7% |
| 35 to 39 Minutes | 6 | 1.1% |
| 40 to 44 Minutes | 34 | 6.1% |
| 45 to 59 Minutes | 108 | 19.4% |
| 60 to 89 Minutes | 67 | 12.0% |
| 90 or more Minutes | 33 | 5.9% |
Commute Time by Sex in Shafer
The most common commute times in Shafer are 45 to 59 minutes (69 commuters, 21.8%) for males and 5 to 9 minutes (44 commuters, 18.3%) for females.
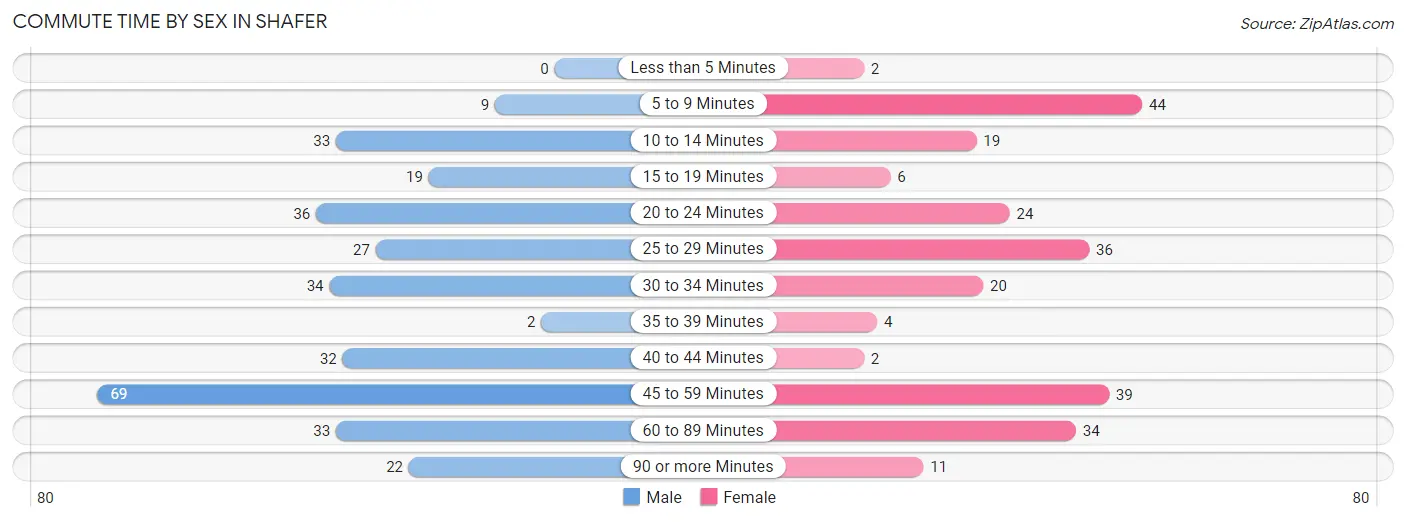
| Commute Time | Male | Female |
| Less than 5 Minutes | 0 (0.0%) | 2 (0.8%) |
| 5 to 9 Minutes | 9 (2.9%) | 44 (18.3%) |
| 10 to 14 Minutes | 33 (10.4%) | 19 (7.9%) |
| 15 to 19 Minutes | 19 (6.0%) | 6 (2.5%) |
| 20 to 24 Minutes | 36 (11.4%) | 24 (10.0%) |
| 25 to 29 Minutes | 27 (8.5%) | 36 (14.9%) |
| 30 to 34 Minutes | 34 (10.8%) | 20 (8.3%) |
| 35 to 39 Minutes | 2 (0.6%) | 4 (1.7%) |
| 40 to 44 Minutes | 32 (10.1%) | 2 (0.8%) |
| 45 to 59 Minutes | 69 (21.8%) | 39 (16.2%) |
| 60 to 89 Minutes | 33 (10.4%) | 34 (14.1%) |
| 90 or more Minutes | 22 (7.0%) | 11 (4.6%) |
Time of Departure to Work by Sex in Shafer
The most frequent times of departure to work in Shafer are 12:00 AM to 4:59 AM (63, 19.9%) for males and 6:00 AM to 6:29 AM (55, 22.8%) for females.
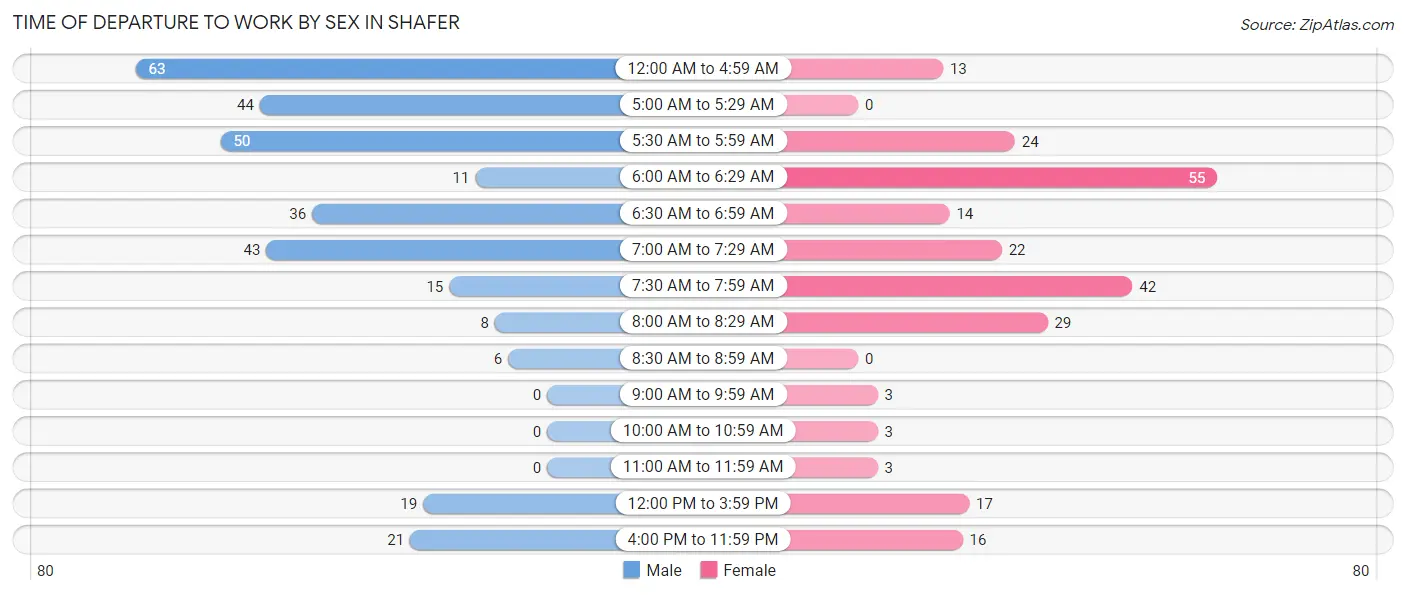
| Time of Departure | Male | Female |
| 12:00 AM to 4:59 AM | 63 (19.9%) | 13 (5.4%) |
| 5:00 AM to 5:29 AM | 44 (13.9%) | 0 (0.0%) |
| 5:30 AM to 5:59 AM | 50 (15.8%) | 24 (10.0%) |
| 6:00 AM to 6:29 AM | 11 (3.5%) | 55 (22.8%) |
| 6:30 AM to 6:59 AM | 36 (11.4%) | 14 (5.8%) |
| 7:00 AM to 7:29 AM | 43 (13.6%) | 22 (9.1%) |
| 7:30 AM to 7:59 AM | 15 (4.8%) | 42 (17.4%) |
| 8:00 AM to 8:29 AM | 8 (2.5%) | 29 (12.0%) |
| 8:30 AM to 8:59 AM | 6 (1.9%) | 0 (0.0%) |
| 9:00 AM to 9:59 AM | 0 (0.0%) | 3 (1.2%) |
| 10:00 AM to 10:59 AM | 0 (0.0%) | 3 (1.2%) |
| 11:00 AM to 11:59 AM | 0 (0.0%) | 3 (1.2%) |
| 12:00 PM to 3:59 PM | 19 (6.0%) | 17 (7.0%) |
| 4:00 PM to 11:59 PM | 21 (6.7%) | 16 (6.6%) |
| Total | 316 (100.0%) | 241 (100.0%) |
Housing Occupancy in Shafer
Occupancy by Ownership in Shafer
Of the total 390 dwellings in Shafer, owner-occupied units account for 332 (85.1%), while renter-occupied units make up 58 (14.9%).
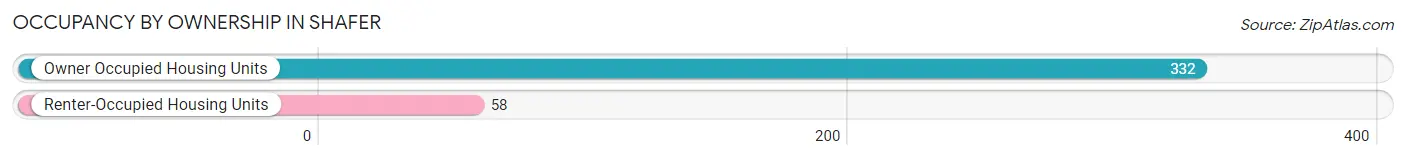
| Occupancy | # Housing Units | % Housing Units |
| Owner Occupied Housing Units | 332 | 85.1% |
| Renter-Occupied Housing Units | 58 | 14.9% |
| Total Occupied Housing Units | 390 | 100.0% |
Occupancy by Household Size in Shafer
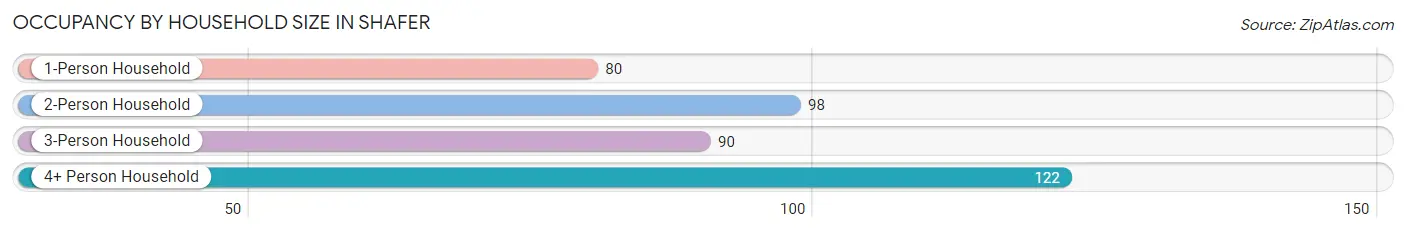
| Household Size | # Housing Units | % Housing Units |
| 1-Person Household | 80 | 20.5% |
| 2-Person Household | 98 | 25.1% |
| 3-Person Household | 90 | 23.1% |
| 4+ Person Household | 122 | 31.3% |
| Total Housing Units | 390 | 100.0% |
Occupancy by Ownership by Household Size in Shafer
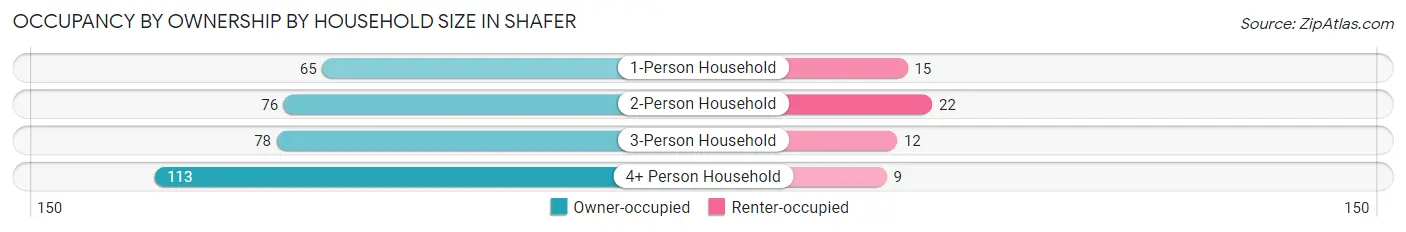
| Household Size | Owner-occupied | Renter-occupied |
| 1-Person Household | 65 (81.2%) | 15 (18.8%) |
| 2-Person Household | 76 (77.5%) | 22 (22.5%) |
| 3-Person Household | 78 (86.7%) | 12 (13.3%) |
| 4+ Person Household | 113 (92.6%) | 9 (7.4%) |
| Total Housing Units | 332 (85.1%) | 58 (14.9%) |
Occupancy by Educational Attainment in Shafer
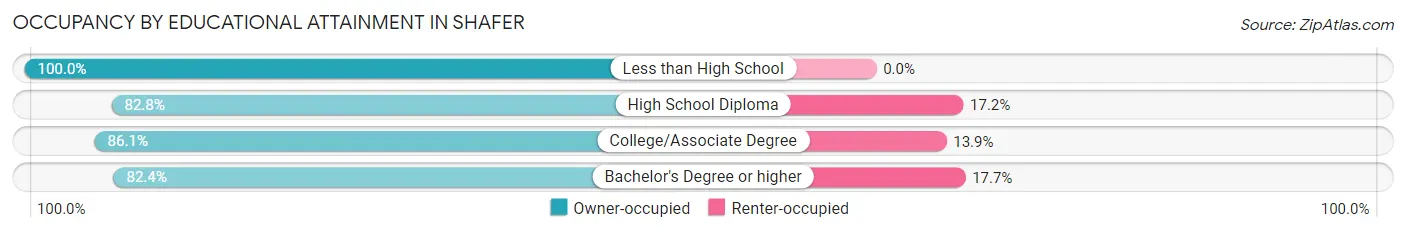
| Household Size | Owner-occupied | Renter-occupied |
| Less than High School | 19 (100.0%) | 0 (0.0%) |
| High School Diploma | 96 (82.8%) | 20 (17.2%) |
| College/Associate Degree | 161 (86.1%) | 26 (13.9%) |
| Bachelor's Degree or higher | 56 (82.4%) | 12 (17.6%) |
Occupancy by Age of Householder in Shafer
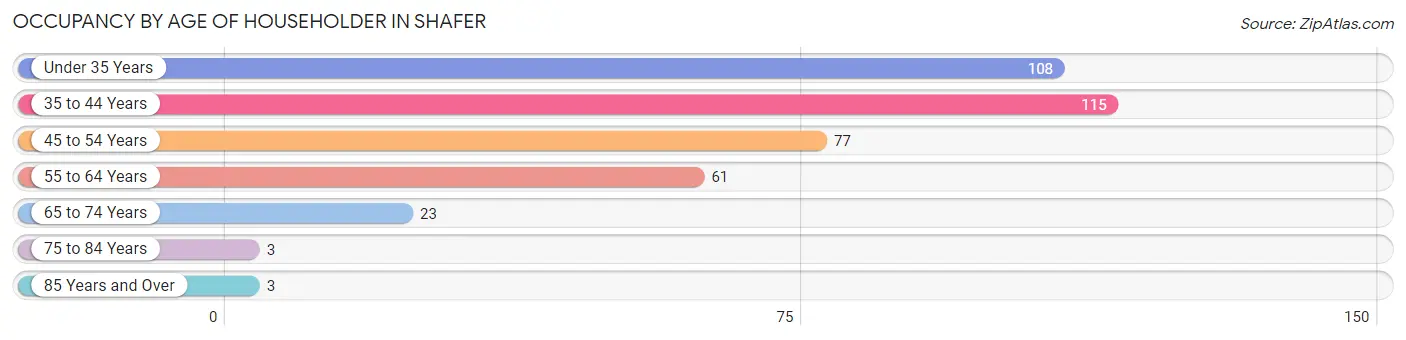
| Age Bracket | # Households | % Households |
| Under 35 Years | 108 | 27.7% |
| 35 to 44 Years | 115 | 29.5% |
| 45 to 54 Years | 77 | 19.7% |
| 55 to 64 Years | 61 | 15.6% |
| 65 to 74 Years | 23 | 5.9% |
| 75 to 84 Years | 3 | 0.8% |
| 85 Years and Over | 3 | 0.8% |
| Total | 390 | 100.0% |
Housing Finances in Shafer
Median Income by Occupancy in Shafer
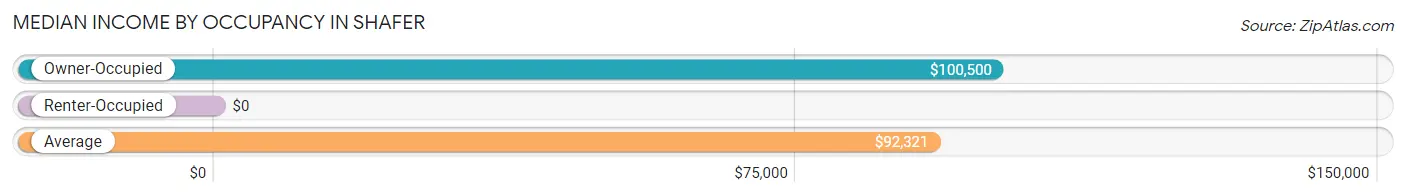
| Occupancy Type | # Households | Median Income |
| Owner-Occupied | 332 (85.1%) | $100,500 |
| Renter-Occupied | 58 (14.9%) | $0 |
| Average | 390 (100.0%) | $92,321 |
Occupancy by Householder Income Bracket in Shafer
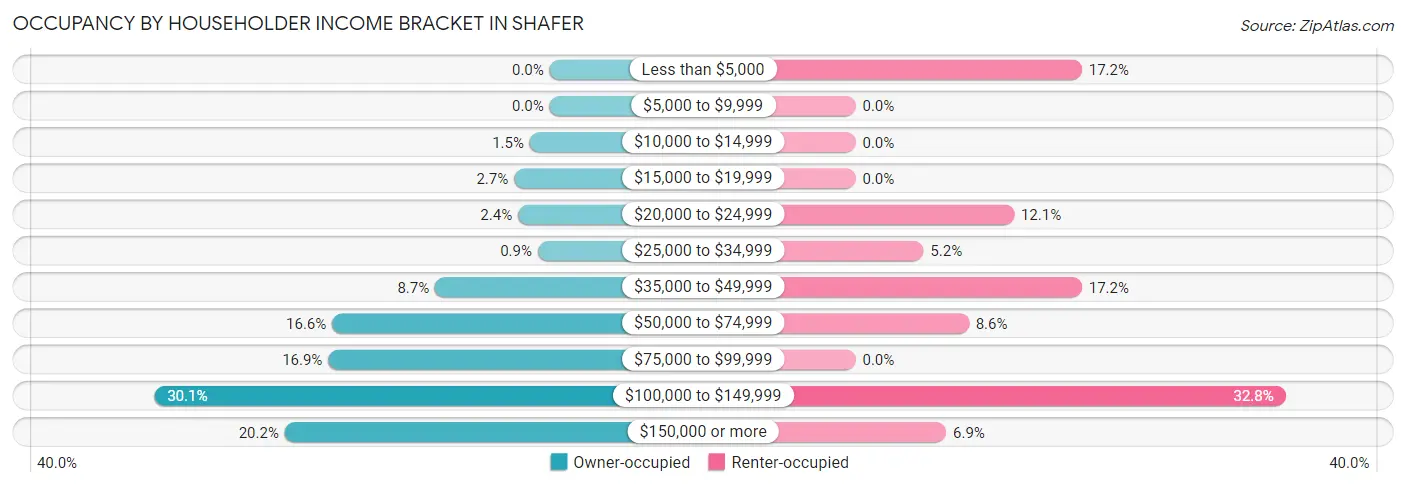
| Income Bracket | Owner-occupied | Renter-occupied |
| Less than $5,000 | 0 (0.0%) | 10 (17.2%) |
| $5,000 to $9,999 | 0 (0.0%) | 0 (0.0%) |
| $10,000 to $14,999 | 5 (1.5%) | 0 (0.0%) |
| $15,000 to $19,999 | 9 (2.7%) | 0 (0.0%) |
| $20,000 to $24,999 | 8 (2.4%) | 7 (12.1%) |
| $25,000 to $34,999 | 3 (0.9%) | 3 (5.2%) |
| $35,000 to $49,999 | 29 (8.7%) | 10 (17.2%) |
| $50,000 to $74,999 | 55 (16.6%) | 5 (8.6%) |
| $75,000 to $99,999 | 56 (16.9%) | 0 (0.0%) |
| $100,000 to $149,999 | 100 (30.1%) | 19 (32.8%) |
| $150,000 or more | 67 (20.2%) | 4 (6.9%) |
| Total | 332 (100.0%) | 58 (100.0%) |
Monthly Housing Cost Tiers in Shafer
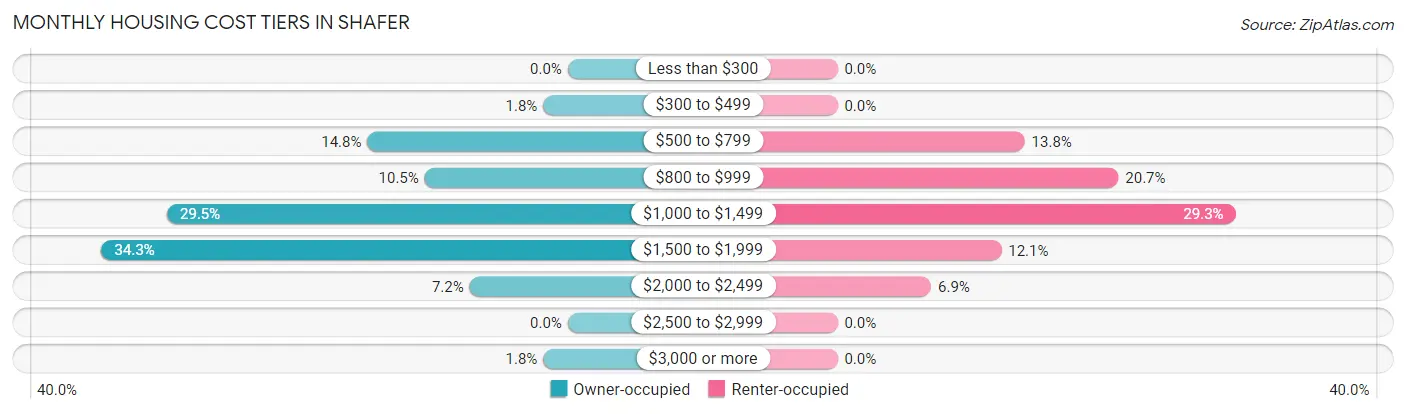
| Monthly Cost | Owner-occupied | Renter-occupied |
| Less than $300 | 0 (0.0%) | 0 (0.0%) |
| $300 to $499 | 6 (1.8%) | 0 (0.0%) |
| $500 to $799 | 49 (14.8%) | 8 (13.8%) |
| $800 to $999 | 35 (10.5%) | 12 (20.7%) |
| $1,000 to $1,499 | 98 (29.5%) | 17 (29.3%) |
| $1,500 to $1,999 | 114 (34.3%) | 7 (12.1%) |
| $2,000 to $2,499 | 24 (7.2%) | 4 (6.9%) |
| $2,500 to $2,999 | 0 (0.0%) | 0 (0.0%) |
| $3,000 or more | 6 (1.8%) | 0 (0.0%) |
| Total | 332 (100.0%) | 58 (100.0%) |
Physical Housing Characteristics in Shafer
Housing Structures in Shafer
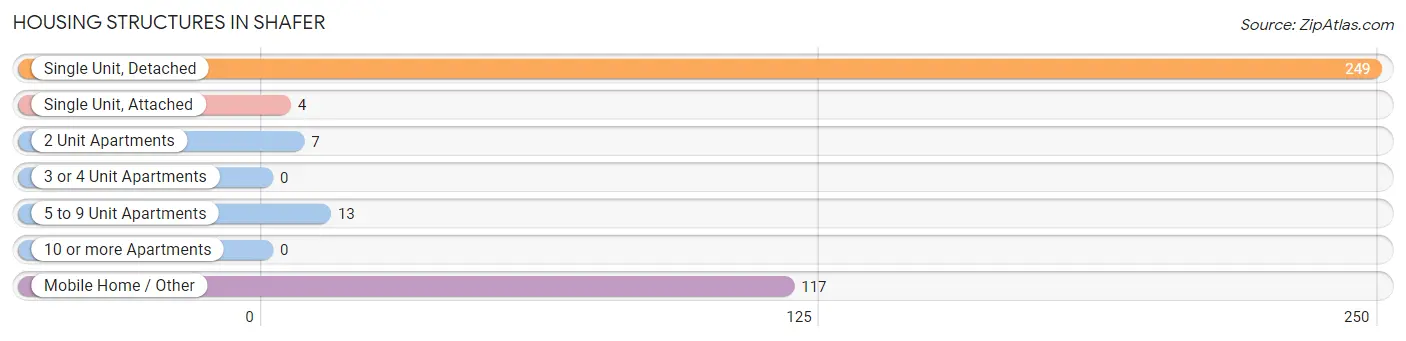
| Structure Type | # Housing Units | % Housing Units |
| Single Unit, Detached | 249 | 63.8% |
| Single Unit, Attached | 4 | 1.0% |
| 2 Unit Apartments | 7 | 1.8% |
| 3 or 4 Unit Apartments | 0 | 0.0% |
| 5 to 9 Unit Apartments | 13 | 3.3% |
| 10 or more Apartments | 0 | 0.0% |
| Mobile Home / Other | 117 | 30.0% |
| Total | 390 | 100.0% |
Housing Structures by Occupancy in Shafer
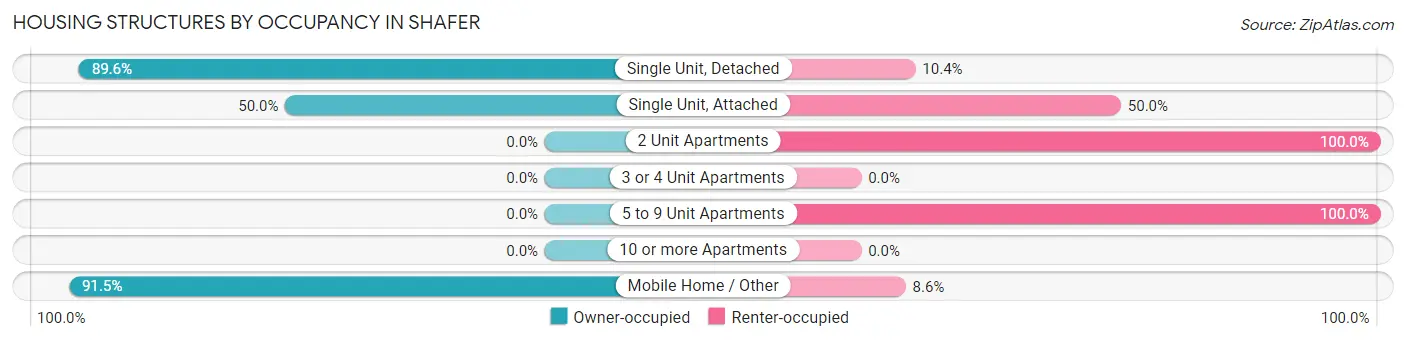
| Structure Type | Owner-occupied | Renter-occupied |
| Single Unit, Detached | 223 (89.6%) | 26 (10.4%) |
| Single Unit, Attached | 2 (50.0%) | 2 (50.0%) |
| 2 Unit Apartments | 0 (0.0%) | 7 (100.0%) |
| 3 or 4 Unit Apartments | 0 (0.0%) | 0 (0.0%) |
| 5 to 9 Unit Apartments | 0 (0.0%) | 13 (100.0%) |
| 10 or more Apartments | 0 (0.0%) | 0 (0.0%) |
| Mobile Home / Other | 107 (91.4%) | 10 (8.6%) |
| Total | 332 (85.1%) | 58 (14.9%) |
Housing Structures by Number of Rooms in Shafer
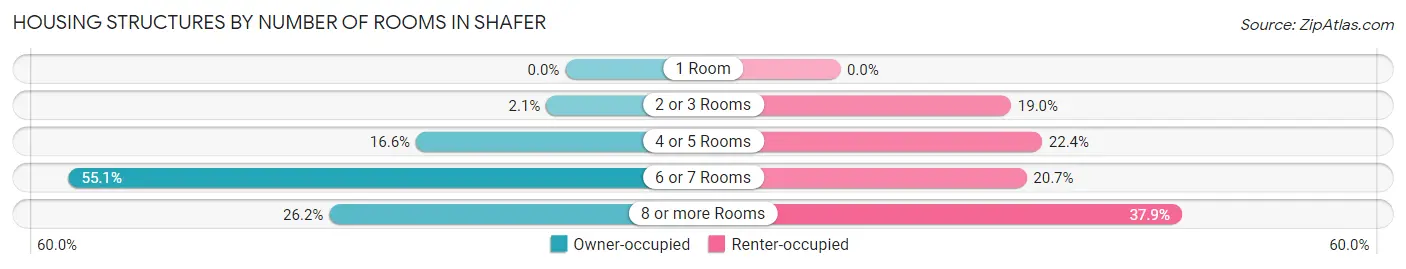
| Number of Rooms | Owner-occupied | Renter-occupied |
| 1 Room | 0 (0.0%) | 0 (0.0%) |
| 2 or 3 Rooms | 7 (2.1%) | 11 (19.0%) |
| 4 or 5 Rooms | 55 (16.6%) | 13 (22.4%) |
| 6 or 7 Rooms | 183 (55.1%) | 12 (20.7%) |
| 8 or more Rooms | 87 (26.2%) | 22 (37.9%) |
| Total | 332 (100.0%) | 58 (100.0%) |
Housing Structure by Heating Type in Shafer
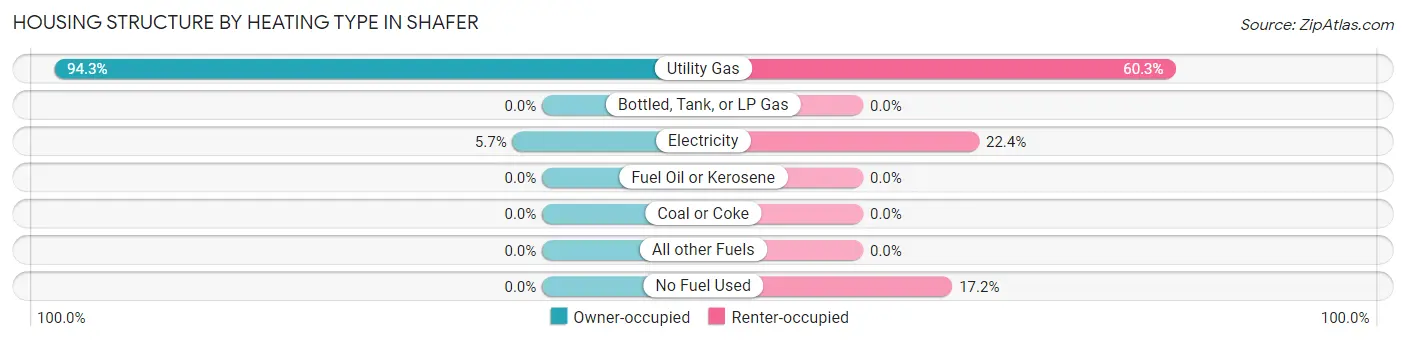
| Heating Type | Owner-occupied | Renter-occupied |
| Utility Gas | 313 (94.3%) | 35 (60.3%) |
| Bottled, Tank, or LP Gas | 0 (0.0%) | 0 (0.0%) |
| Electricity | 19 (5.7%) | 13 (22.4%) |
| Fuel Oil or Kerosene | 0 (0.0%) | 0 (0.0%) |
| Coal or Coke | 0 (0.0%) | 0 (0.0%) |
| All other Fuels | 0 (0.0%) | 0 (0.0%) |
| No Fuel Used | 0 (0.0%) | 10 (17.2%) |
| Total | 332 (100.0%) | 58 (100.0%) |
Household Vehicle Usage in Shafer
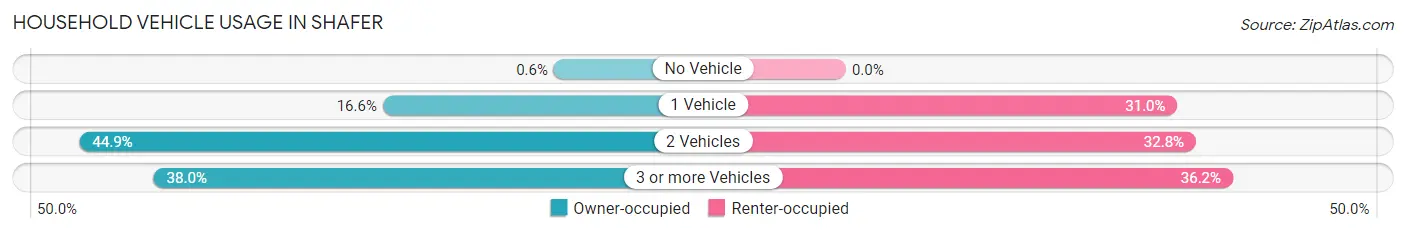
| Vehicles per Household | Owner-occupied | Renter-occupied |
| No Vehicle | 2 (0.6%) | 0 (0.0%) |
| 1 Vehicle | 55 (16.6%) | 18 (31.0%) |
| 2 Vehicles | 149 (44.9%) | 19 (32.8%) |
| 3 or more Vehicles | 126 (38.0%) | 21 (36.2%) |
| Total | 332 (100.0%) | 58 (100.0%) |
Real Estate & Mortgages in Shafer
Real Estate and Mortgage Overview in Shafer
| Characteristic | Without Mortgage | With Mortgage |
| Housing Units | 84 | 248 |
| Median Property Value | - | - |
| Median Household Income | $79,444 | $40 |
| Monthly Housing Costs | $723 | $6 |
| Real Estate Taxes | $611 | $0 |
Property Value by Mortgage Status in Shafer
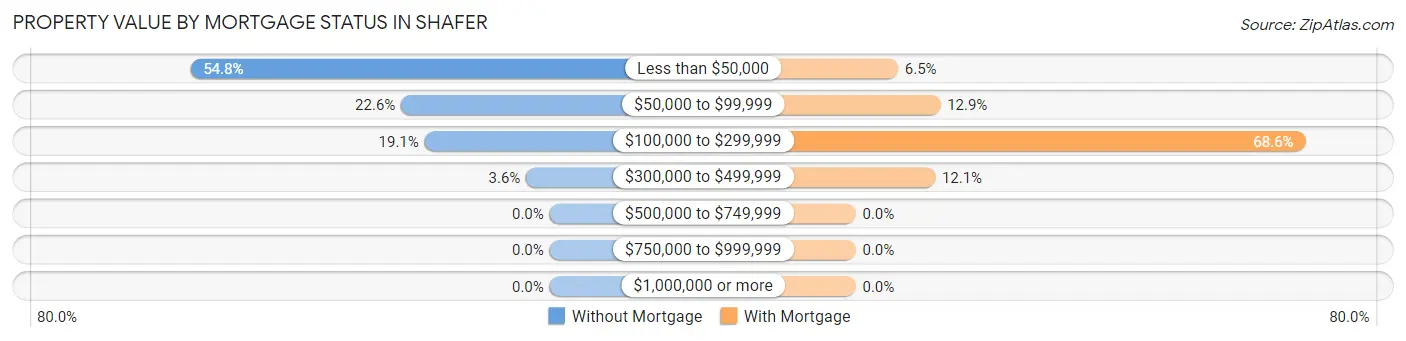
| Property Value | Without Mortgage | With Mortgage |
| Less than $50,000 | 46 (54.8%) | 16 (6.5%) |
| $50,000 to $99,999 | 19 (22.6%) | 32 (12.9%) |
| $100,000 to $299,999 | 16 (19.1%) | 170 (68.5%) |
| $300,000 to $499,999 | 3 (3.6%) | 30 (12.1%) |
| $500,000 to $749,999 | 0 (0.0%) | 0 (0.0%) |
| $750,000 to $999,999 | 0 (0.0%) | 0 (0.0%) |
| $1,000,000 or more | 0 (0.0%) | 0 (0.0%) |
| Total | 84 (100.0%) | 248 (100.0%) |
Household Income by Mortgage Status in Shafer
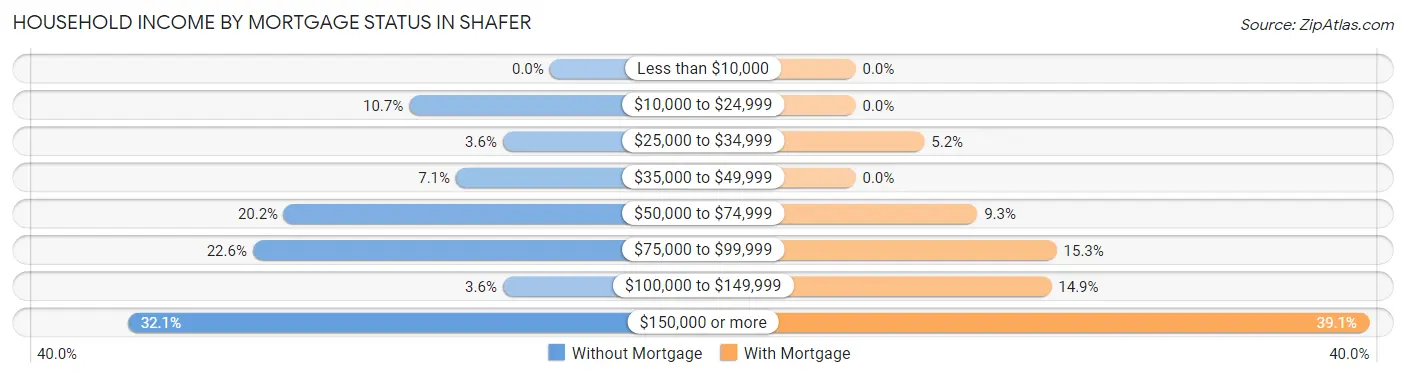
| Household Income | Without Mortgage | With Mortgage |
| Less than $10,000 | 0 (0.0%) | 0 (0.0%) |
| $10,000 to $24,999 | 9 (10.7%) | 0 (0.0%) |
| $25,000 to $34,999 | 3 (3.6%) | 13 (5.2%) |
| $35,000 to $49,999 | 6 (7.1%) | 0 (0.0%) |
| $50,000 to $74,999 | 17 (20.2%) | 23 (9.3%) |
| $75,000 to $99,999 | 19 (22.6%) | 38 (15.3%) |
| $100,000 to $149,999 | 3 (3.6%) | 37 (14.9%) |
| $150,000 or more | 27 (32.1%) | 97 (39.1%) |
| Total | 84 (100.0%) | 248 (100.0%) |
Property Value to Household Income Ratio in Shafer
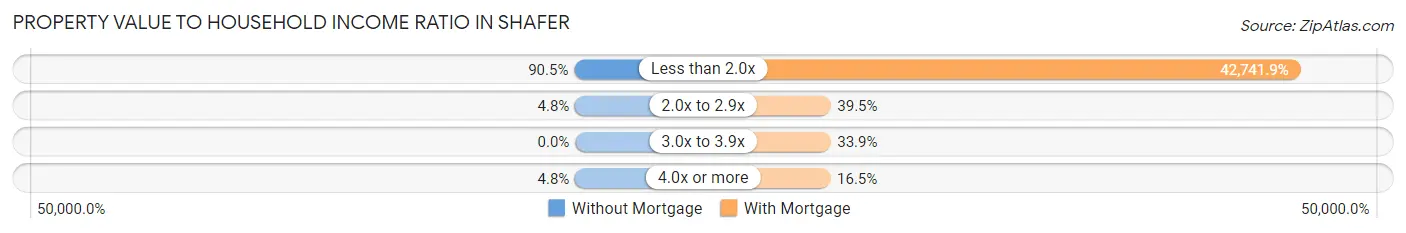
| Value-to-Income Ratio | Without Mortgage | With Mortgage |
| Less than 2.0x | 76 (90.5%) | 106,000 (42,741.9%) |
| 2.0x to 2.9x | 4 (4.8%) | 98 (39.5%) |
| 3.0x to 3.9x | 0 (0.0%) | 84 (33.9%) |
| 4.0x or more | 4 (4.8%) | 41 (16.5%) |
| Total | 84 (100.0%) | 248 (100.0%) |
Real Estate Taxes by Mortgage Status in Shafer
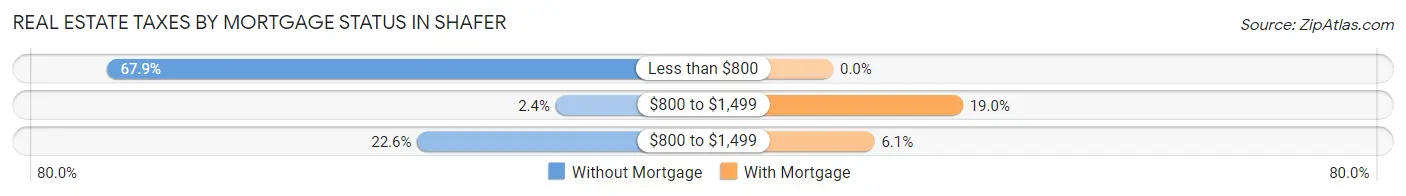
| Property Taxes | Without Mortgage | With Mortgage |
| Less than $800 | 57 (67.9%) | 0 (0.0%) |
| $800 to $1,499 | 2 (2.4%) | 47 (19.0%) |
| $800 to $1,499 | 19 (22.6%) | 15 (6.0%) |
| Total | 84 (100.0%) | 248 (100.0%) |
Health & Disability in Shafer
Health Insurance Coverage by Age in Shafer
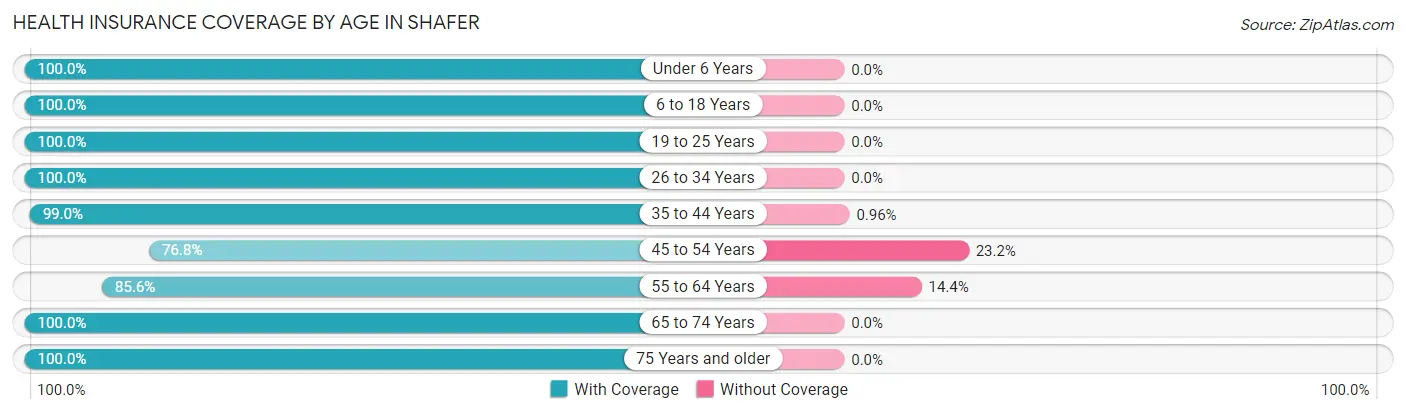
| Age Bracket | With Coverage | Without Coverage |
| Under 6 Years | 95 (100.0%) | 0 (0.0%) |
| 6 to 18 Years | 237 (100.0%) | 0 (0.0%) |
| 19 to 25 Years | 107 (100.0%) | 0 (0.0%) |
| 26 to 34 Years | 166 (100.0%) | 0 (0.0%) |
| 35 to 44 Years | 207 (99.0%) | 2 (1.0%) |
| 45 to 54 Years | 96 (76.8%) | 29 (23.2%) |
| 55 to 64 Years | 89 (85.6%) | 15 (14.4%) |
| 65 to 74 Years | 52 (100.0%) | 0 (0.0%) |
| 75 Years and older | 16 (100.0%) | 0 (0.0%) |
| Total | 1,065 (95.9%) | 46 (4.1%) |
Health Insurance Coverage by Citizenship Status in Shafer
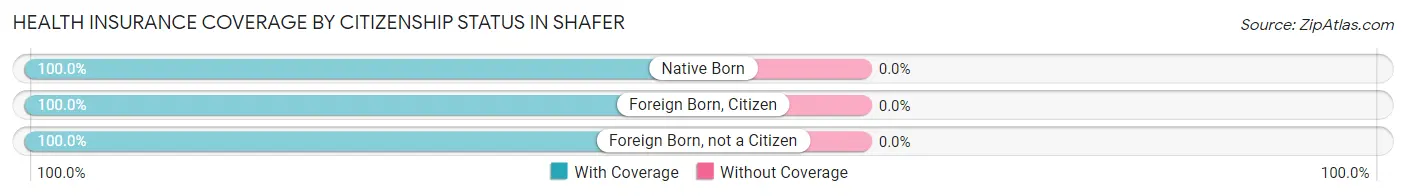
| Citizenship Status | With Coverage | Without Coverage |
| Native Born | 95 (100.0%) | 0 (0.0%) |
| Foreign Born, Citizen | 237 (100.0%) | 0 (0.0%) |
| Foreign Born, not a Citizen | 107 (100.0%) | 0 (0.0%) |
Health Insurance Coverage by Household Income in Shafer
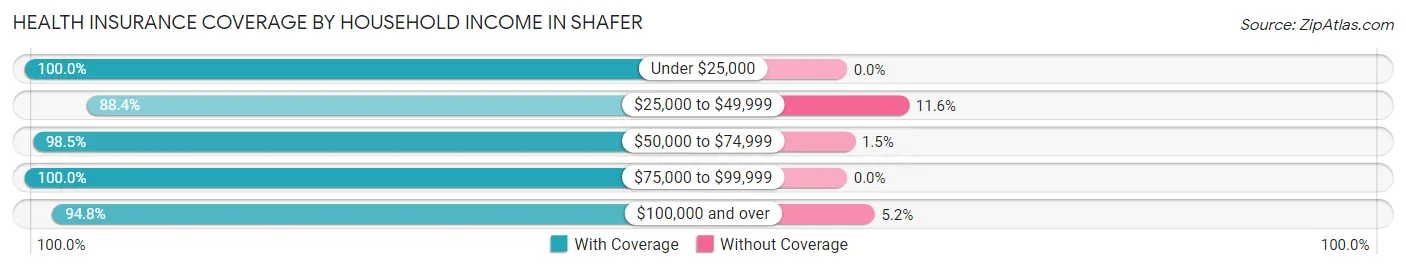
| Household Income | With Coverage | Without Coverage |
| Under $25,000 | 76 (100.0%) | 0 (0.0%) |
| $25,000 to $49,999 | 76 (88.4%) | 10 (11.6%) |
| $50,000 to $74,999 | 129 (98.5%) | 2 (1.5%) |
| $75,000 to $99,999 | 163 (100.0%) | 0 (0.0%) |
| $100,000 and over | 621 (94.8%) | 34 (5.2%) |
Public vs Private Health Insurance Coverage by Age in Shafer
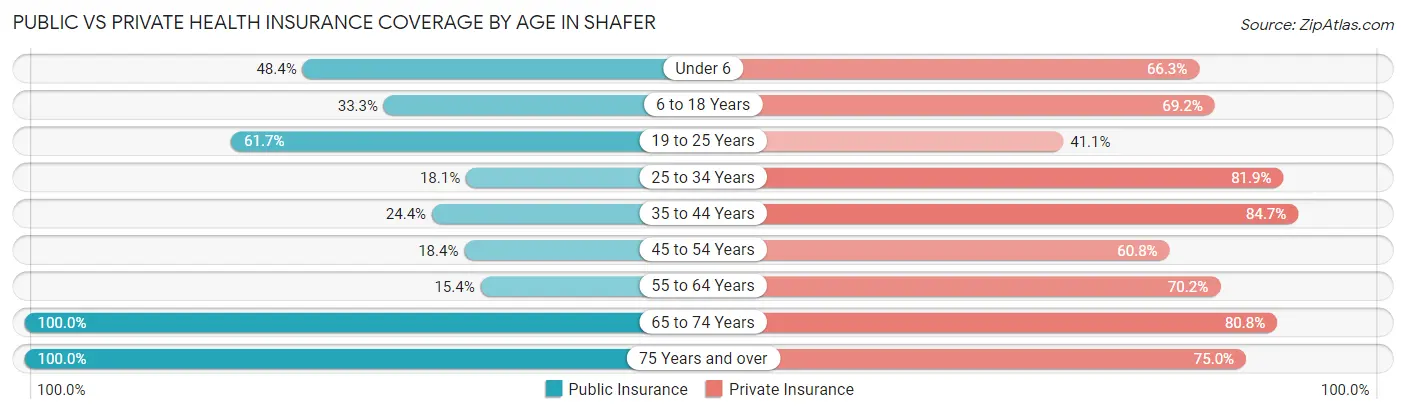
| Age Bracket | Public Insurance | Private Insurance |
| Under 6 | 46 (48.4%) | 63 (66.3%) |
| 6 to 18 Years | 79 (33.3%) | 164 (69.2%) |
| 19 to 25 Years | 66 (61.7%) | 44 (41.1%) |
| 25 to 34 Years | 30 (18.1%) | 136 (81.9%) |
| 35 to 44 Years | 51 (24.4%) | 177 (84.7%) |
| 45 to 54 Years | 23 (18.4%) | 76 (60.8%) |
| 55 to 64 Years | 16 (15.4%) | 73 (70.2%) |
| 65 to 74 Years | 52 (100.0%) | 42 (80.8%) |
| 75 Years and over | 16 (100.0%) | 12 (75.0%) |
| Total | 379 (34.1%) | 787 (70.8%) |
Disability Status by Sex by Age in Shafer
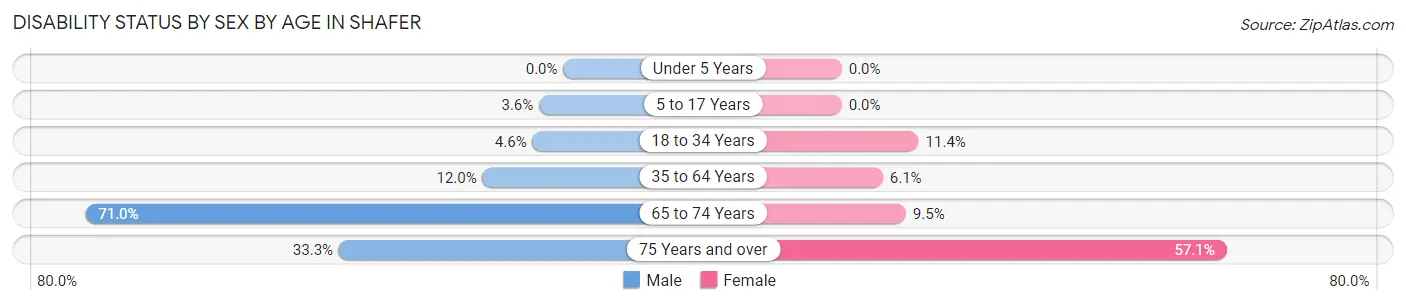
| Age Bracket | Male | Female |
| Under 5 Years | 0 (0.0%) | 0 (0.0%) |
| 5 to 17 Years | 5 (3.6%) | 0 (0.0%) |
| 18 to 34 Years | 6 (4.6%) | 17 (11.4%) |
| 35 to 64 Years | 27 (12.0%) | 13 (6.1%) |
| 65 to 74 Years | 22 (71.0%) | 2 (9.5%) |
| 75 Years and over | 3 (33.3%) | 4 (57.1%) |
Disability Class by Sex by Age in Shafer
Disability Class: Hearing Difficulty
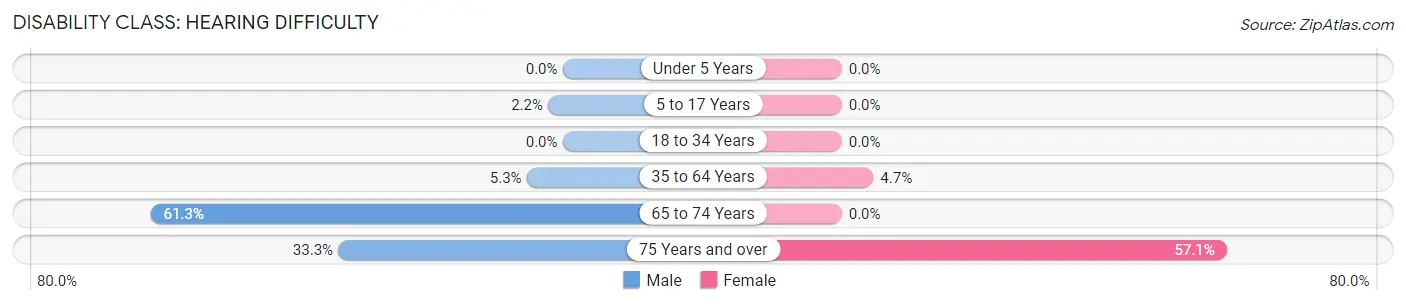
| Age Bracket | Male | Female |
| Under 5 Years | 0 (0.0%) | 0 (0.0%) |
| 5 to 17 Years | 3 (2.2%) | 0 (0.0%) |
| 18 to 34 Years | 0 (0.0%) | 0 (0.0%) |
| 35 to 64 Years | 12 (5.3%) | 10 (4.7%) |
| 65 to 74 Years | 19 (61.3%) | 0 (0.0%) |
| 75 Years and over | 3 (33.3%) | 4 (57.1%) |
Disability Class: Vision Difficulty
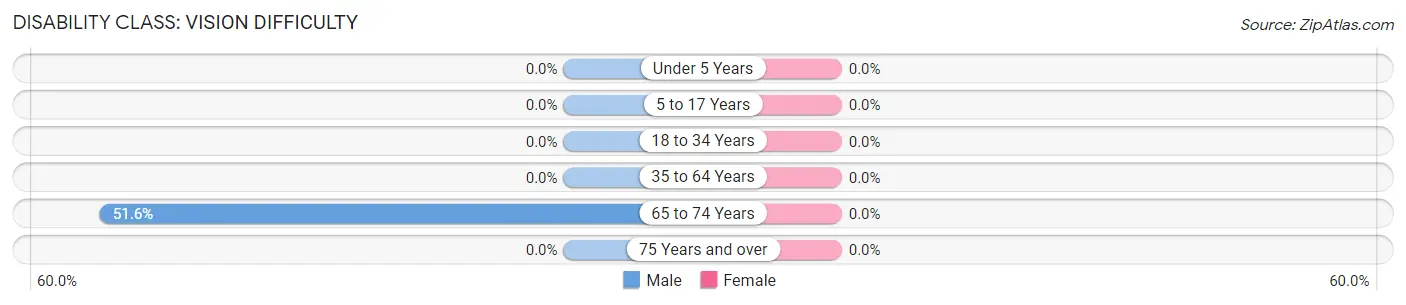
| Age Bracket | Male | Female |
| Under 5 Years | 0 (0.0%) | 0 (0.0%) |
| 5 to 17 Years | 0 (0.0%) | 0 (0.0%) |
| 18 to 34 Years | 0 (0.0%) | 0 (0.0%) |
| 35 to 64 Years | 0 (0.0%) | 0 (0.0%) |
| 65 to 74 Years | 16 (51.6%) | 0 (0.0%) |
| 75 Years and over | 0 (0.0%) | 0 (0.0%) |
Disability Class: Cognitive Difficulty
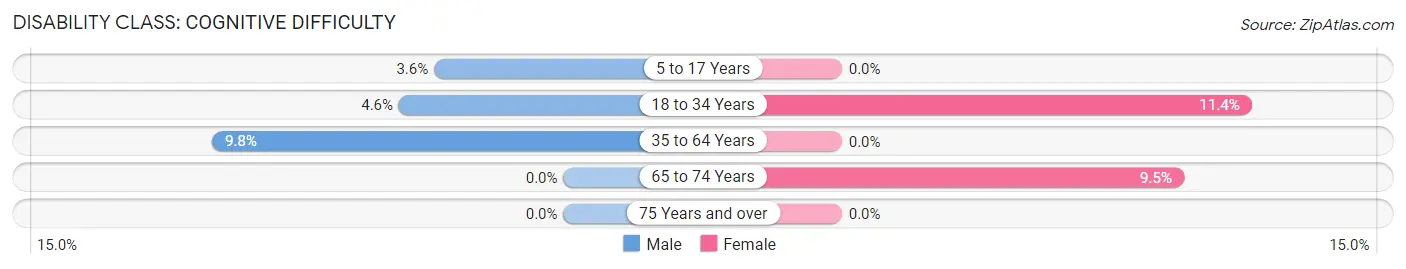
| Age Bracket | Male | Female |
| 5 to 17 Years | 5 (3.6%) | 0 (0.0%) |
| 18 to 34 Years | 6 (4.6%) | 17 (11.4%) |
| 35 to 64 Years | 22 (9.8%) | 0 (0.0%) |
| 65 to 74 Years | 0 (0.0%) | 2 (9.5%) |
| 75 Years and over | 0 (0.0%) | 0 (0.0%) |
Disability Class: Ambulatory Difficulty
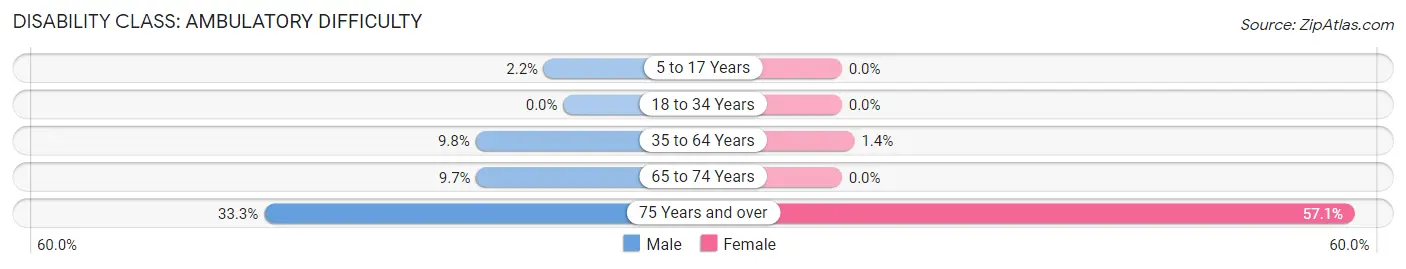
| Age Bracket | Male | Female |
| 5 to 17 Years | 3 (2.2%) | 0 (0.0%) |
| 18 to 34 Years | 0 (0.0%) | 0 (0.0%) |
| 35 to 64 Years | 22 (9.8%) | 3 (1.4%) |
| 65 to 74 Years | 3 (9.7%) | 0 (0.0%) |
| 75 Years and over | 3 (33.3%) | 4 (57.1%) |
Disability Class: Self-Care Difficulty
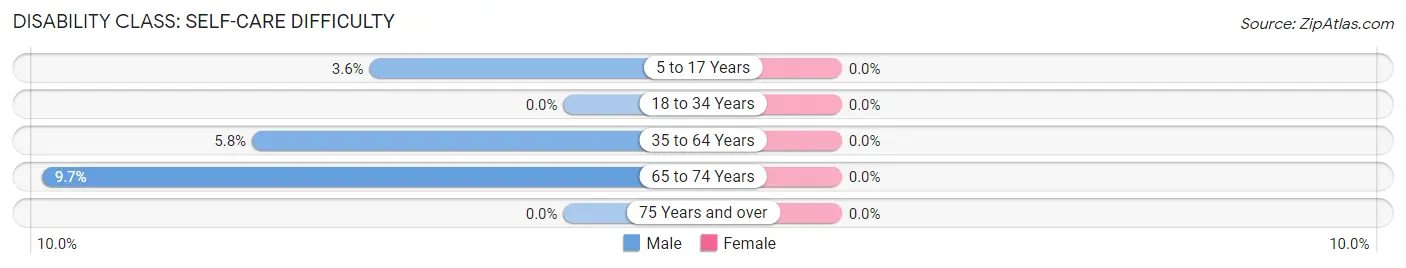
| Age Bracket | Male | Female |
| 5 to 17 Years | 5 (3.6%) | 0 (0.0%) |
| 18 to 34 Years | 0 (0.0%) | 0 (0.0%) |
| 35 to 64 Years | 13 (5.8%) | 0 (0.0%) |
| 65 to 74 Years | 3 (9.7%) | 0 (0.0%) |
| 75 Years and over | 0 (0.0%) | 0 (0.0%) |
Technology Access in Shafer
Computing Device Access in Shafer
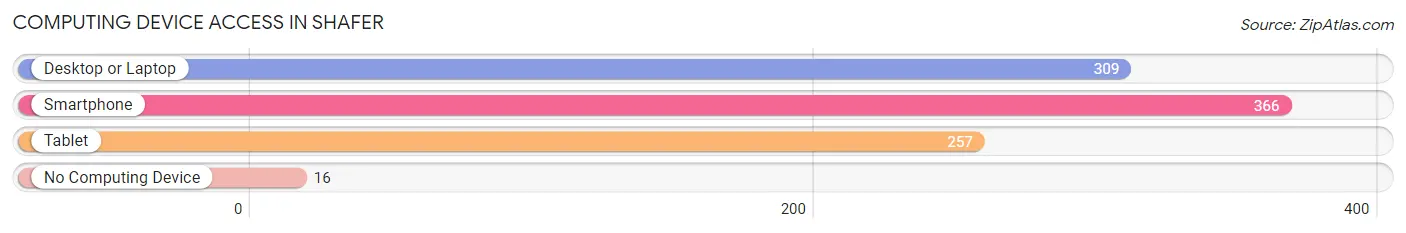
| Device Type | # Households | % Households |
| Desktop or Laptop | 309 | 79.2% |
| Smartphone | 366 | 93.9% |
| Tablet | 257 | 65.9% |
| No Computing Device | 16 | 4.1% |
| Total | 390 | 100.0% |
Internet Access in Shafer
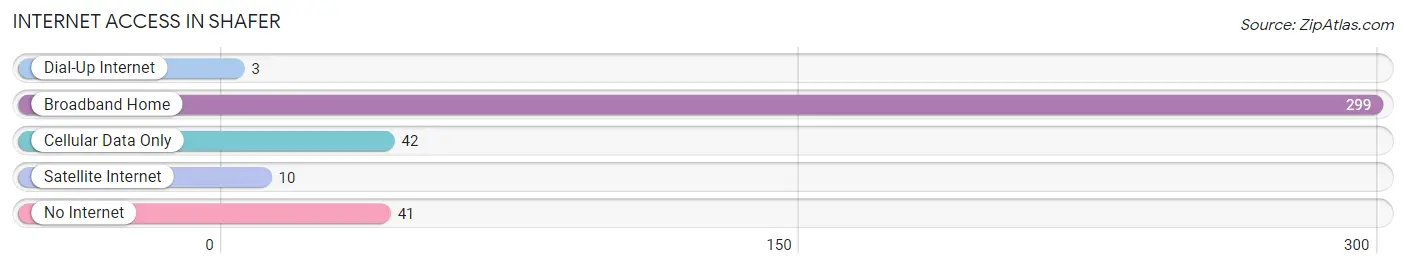
| Internet Type | # Households | % Households |
| Dial-Up Internet | 3 | 0.8% |
| Broadband Home | 299 | 76.7% |
| Cellular Data Only | 42 | 10.8% |
| Satellite Internet | 10 | 2.6% |
| No Internet | 41 | 10.5% |
| Total | 390 | 100.0% |
Shafer Summary
Shafer, Minnesota is a small city located in Chisago County, Minnesota. It is situated on the north shore of the Sunrise River, about 25 miles northeast of the Twin Cities. The city has a population of about 1,000 people and is part of the Minneapolis-St. Paul metropolitan area.
History
Shafer was founded in 1856 by a group of Swedish immigrants. The city was named after the Swedish word for “shoal”, which is a shallow area of water. The first settlers were attracted to the area due to its abundance of natural resources, including timber, fish, and wild game.
The city was incorporated in 1887 and quickly grew to become a thriving community. The first post office was established in 1891 and the first school was built in 1895. The city was also home to a number of businesses, including a sawmill, a grist mill, a creamery, and a general store.
In the early 1900s, the city experienced a period of growth and prosperity. The population increased from about 500 in 1900 to over 1,000 by 1910. The city was also home to a number of churches, including the Swedish Lutheran Church, the Methodist Episcopal Church, and the Catholic Church.
Geography
Shafer is located in Chisago County, Minnesota. It is situated on the north shore of the Sunrise River, about 25 miles northeast of the Twin Cities. The city has a total area of 1.2 square miles, all of which is land.
The city is located in a rural area and is surrounded by forests and lakes. The Sunrise River runs through the city and is a popular spot for fishing and canoeing. The city is also home to a number of parks, including the Shafer Park and the Sunrise River Park.
Economy
The economy of Shafer is largely based on agriculture and tourism. The city is home to a number of farms, which produce a variety of crops, including corn, soybeans, and hay. The city is also home to a number of small businesses, including restaurants, retail stores, and service providers.
Tourism is also an important part of the economy. The city is home to a number of attractions, including the Sunrise River Park, the Shafer Park, and the Chisago County Historical Museum. The city is also home to a number of events, including the annual Shafer Days Festival.
Demographics
As of the 2010 census, the population of Shafer was 1,000 people. The racial makeup of the city was 97.2% White, 0.7% African American, 0.2% Native American, 0.2% Asian, 0.2% from other races, and 1.7% from two or more races. Hispanic or Latino of any race were 1.2% of the population.
The median income for a household in the city was $50,000, and the median income for a family was $54,000. The per capita income for the city was $21,000. About 8.2% of families and 10.2% of the population were below the poverty line, including 14.3% of those under age 18 and 6.7% of those age 65 or over.
Overall, Shafer is a small city with a rich history and a strong economy. The city is home to a number of businesses, farms, and attractions, and is a popular destination for tourists. The city has a diverse population and a strong sense of community.
Common Questions
What is Per Capita Income in Shafer?
Per Capita income in Shafer is $36,627.
What is the Median Family Income in Shafer?
Median Family Income in Shafer is $102,813.
What is the Median Household income in Shafer?
Median Household Income in Shafer is $92,321.
What is Income or Wage Gap in Shafer?
Income or Wage Gap in Shafer is 42.4%.
Women in Shafer earn 57.6 cents for every dollar earned by a man.
What is Family Income Deficit in Shafer?
Family Income Deficit in Shafer is $7,793.
Families that are below poverty line in Shafer earn $7,793 less on average than the poverty threshold level.
What is Inequality or Gini Index in Shafer?
Inequality or Gini Index in Shafer is 0.34.
What is the Total Population of Shafer?
Total Population of Shafer is 1,111.
What is the Total Male Population of Shafer?
Total Male Population of Shafer is 579.
What is the Total Female Population of Shafer?
Total Female Population of Shafer is 532.
What is the Ratio of Males per 100 Females in Shafer?
There are 108.83 Males per 100 Females in Shafer.
What is the Ratio of Females per 100 Males in Shafer?
There are 91.88 Females per 100 Males in Shafer.
What is the Median Population Age in Shafer?
Median Population Age in Shafer is 30.7 Years.
What is the Average Family Size in Shafer
Average Family Size in Shafer is 3.1 People.
What is the Average Household Size in Shafer
Average Household Size in Shafer is 2.9 People.
How Large is the Labor Force in Shafer?
There are 661 People in the Labor Forcein in Shafer.
What is the Percentage of People in the Labor Force in Shafer?
80.7% of People are in the Labor Force in Shafer.
What is the Unemployment Rate in Shafer?
Unemployment Rate in Shafer is 3.2%.