Kandiyohi, MN Map & Demographics
Kandiyohi Map
Kandiyohi Overview
$37,025
PER CAPITA INCOME
$81,875
AVG FAMILY INCOME
$70,417
AVG HOUSEHOLD INCOME
33.1%
WAGE / INCOME GAP [ % ]
66.9¢/ $1
WAGE / INCOME GAP [ $ ]
0.38
INEQUALITY / GINI INDEX
471
TOTAL POPULATION
251
MALE POPULATION
220
FEMALE POPULATION
114.09
MALES / 100 FEMALES
87.65
FEMALES / 100 MALES
38.5
MEDIAN AGE
2.8
AVG FAMILY SIZE
2.3
AVG HOUSEHOLD SIZE
297
LABOR FORCE [ PEOPLE ]
79.6%
PERCENT IN LABOR FORCE
6.7%
UNEMPLOYMENT RATE
Kandiyohi Zip Codes
Kandiyohi Area Codes
Income in Kandiyohi
Income Overview in Kandiyohi
Per Capita Income in Kandiyohi is $37,025, while median incomes of families and households are $81,875 and $70,417 respectively.
| Characteristic | Number | Measure |
| Per Capita Income | 471 | $37,025 |
| Median Family Income | 138 | $81,875 |
| Mean Family Income | 138 | $95,346 |
| Median Household Income | 208 | $70,417 |
| Mean Household Income | 208 | $84,222 |
| Income Deficit | 138 | $0 |
| Wage / Income Gap (%) | 471 | 33.12% |
| Wage / Income Gap ($) | 471 | 66.88¢ per $1 |
| Gini / Inequality Index | 471 | 0.38 |
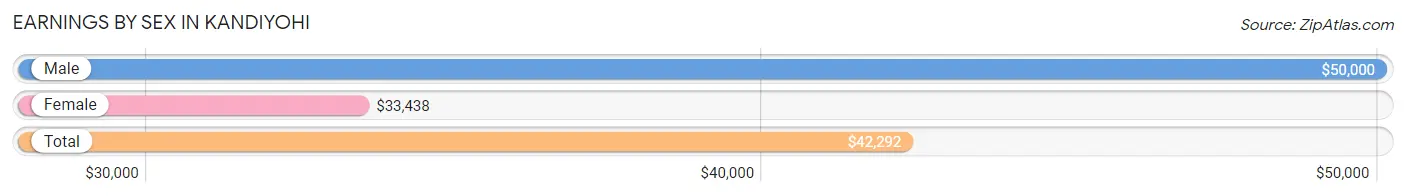
Earnings by Sex in Kandiyohi
Average Earnings in Kandiyohi are $42,292, $50,000 for men and $33,438 for women, a difference of 33.1%.
| Sex | Number | Average Earnings |
| Male | 170 (54.5%) | $50,000 |
| Female | 142 (45.5%) | $33,438 |
| Total | 312 (100.0%) | $42,292 |
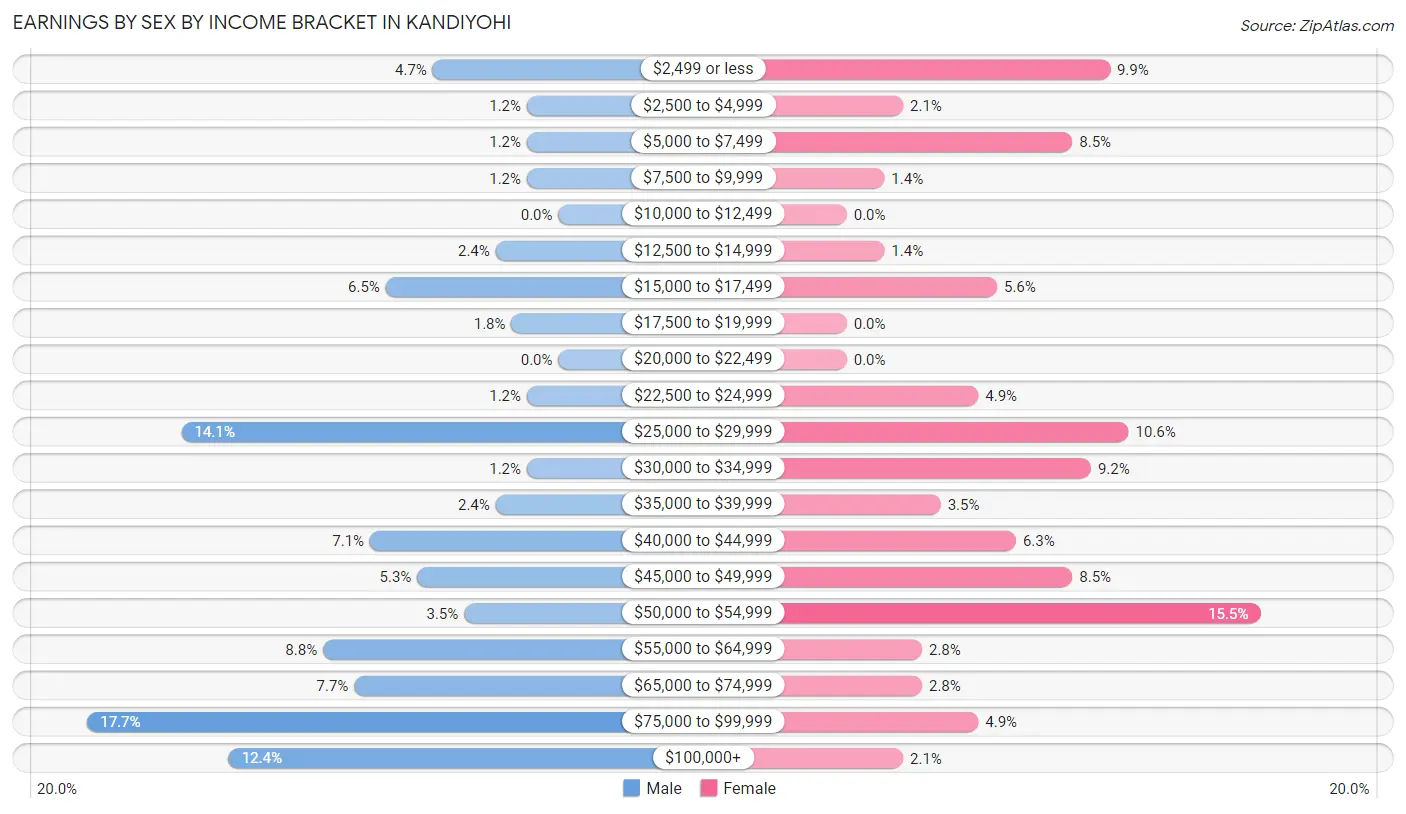
Earnings by Sex by Income Bracket in Kandiyohi
The most common earnings brackets in Kandiyohi are $75,000 to $99,999 for men (30 | 17.6%) and $50,000 to $54,999 for women (22 | 15.5%).
| Income | Male | Female |
| $2,499 or less | 8 (4.7%) | 14 (9.9%) |
| $2,500 to $4,999 | 2 (1.2%) | 3 (2.1%) |
| $5,000 to $7,499 | 2 (1.2%) | 12 (8.5%) |
| $7,500 to $9,999 | 2 (1.2%) | 2 (1.4%) |
| $10,000 to $12,499 | 0 (0.0%) | 0 (0.0%) |
| $12,500 to $14,999 | 4 (2.4%) | 2 (1.4%) |
| $15,000 to $17,499 | 11 (6.5%) | 8 (5.6%) |
| $17,500 to $19,999 | 3 (1.8%) | 0 (0.0%) |
| $20,000 to $22,499 | 0 (0.0%) | 0 (0.0%) |
| $22,500 to $24,999 | 2 (1.2%) | 7 (4.9%) |
| $25,000 to $29,999 | 24 (14.1%) | 15 (10.6%) |
| $30,000 to $34,999 | 2 (1.2%) | 13 (9.1%) |
| $35,000 to $39,999 | 4 (2.4%) | 5 (3.5%) |
| $40,000 to $44,999 | 12 (7.1%) | 9 (6.3%) |
| $45,000 to $49,999 | 9 (5.3%) | 12 (8.5%) |
| $50,000 to $54,999 | 6 (3.5%) | 22 (15.5%) |
| $55,000 to $64,999 | 15 (8.8%) | 4 (2.8%) |
| $65,000 to $74,999 | 13 (7.6%) | 4 (2.8%) |
| $75,000 to $99,999 | 30 (17.6%) | 7 (4.9%) |
| $100,000+ | 21 (12.3%) | 3 (2.1%) |
| Total | 170 (100.0%) | 142 (100.0%) |
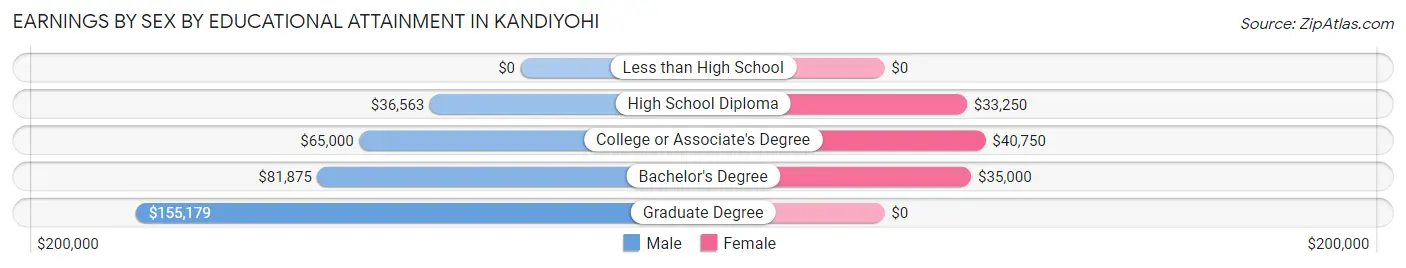
Earnings by Sex by Educational Attainment in Kandiyohi
Average earnings in Kandiyohi are $58,571 for men and $34,844 for women, a difference of 40.5%. Men with an educational attainment of graduate degree enjoy the highest average annual earnings of $155,179, while those with high school diploma education earn the least with $36,563. Women with an educational attainment of college or associate's degree earn the most with the average annual earnings of $40,750, while those with high school diploma education have the smallest earnings of $33,250.
| Educational Attainment | Male Income | Female Income |
| Less than High School | - | - |
| High School Diploma | $36,563 | $33,250 |
| College or Associate's Degree | $65,000 | $40,750 |
| Bachelor's Degree | $81,875 | $35,000 |
| Graduate Degree | $155,179 | $0 |
| Total | $58,571 | $34,844 |
Family Income in Kandiyohi
Family Income Brackets in Kandiyohi
According to the Kandiyohi family income data, there are 31 families falling into the $100,000 to $149,999 income range, which is the most common income bracket and makes up 22.5% of all families.
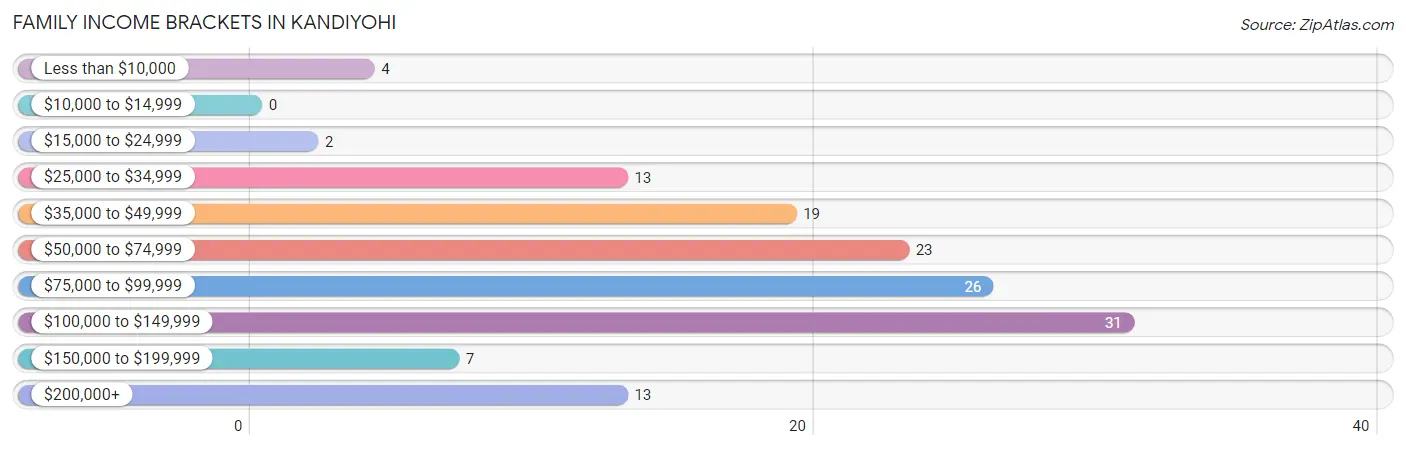
| Income Bracket | # Families | % Families |
| Less than $10,000 | 4 | 2.9% |
| $10,000 to $14,999 | 0 | 0.0% |
| $15,000 to $24,999 | 2 | 1.4% |
| $25,000 to $34,999 | 13 | 9.4% |
| $35,000 to $49,999 | 19 | 13.8% |
| $50,000 to $74,999 | 23 | 16.7% |
| $75,000 to $99,999 | 26 | 18.8% |
| $100,000 to $149,999 | 31 | 22.5% |
| $150,000 to $199,999 | 7 | 5.1% |
| $200,000+ | 13 | 9.4% |
Family Income by Famaliy Size in Kandiyohi
4-person families (27 | 19.6%) account for the highest median family income in Kandiyohi with $91,750 per family, while 2-person families (65 | 47.1%) have the highest median income of $40,782 per family member.
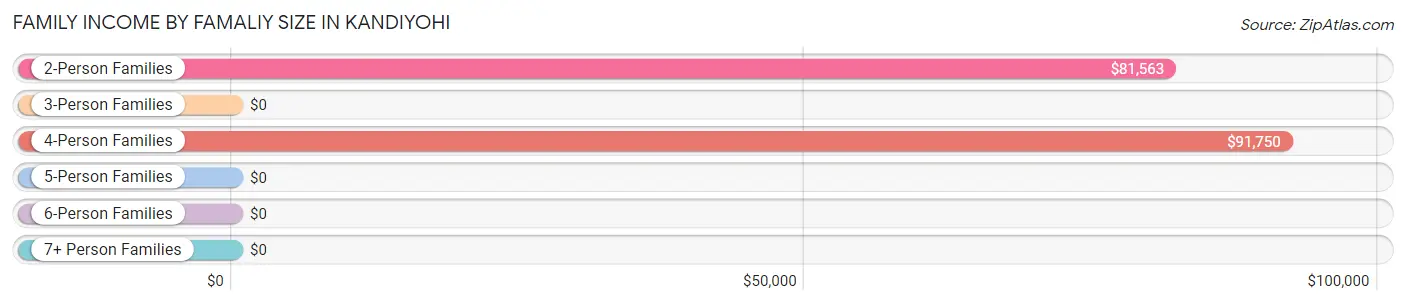
| Income Bracket | # Families | Median Income |
| 2-Person Families | 65 (47.1%) | $81,563 |
| 3-Person Families | 36 (26.1%) | $0 |
| 4-Person Families | 27 (19.6%) | $91,750 |
| 5-Person Families | 4 (2.9%) | $0 |
| 6-Person Families | 3 (2.2%) | $0 |
| 7+ Person Families | 3 (2.2%) | $0 |
| Total | 138 (100.0%) | $81,875 |
Family Income by Number of Earners in Kandiyohi
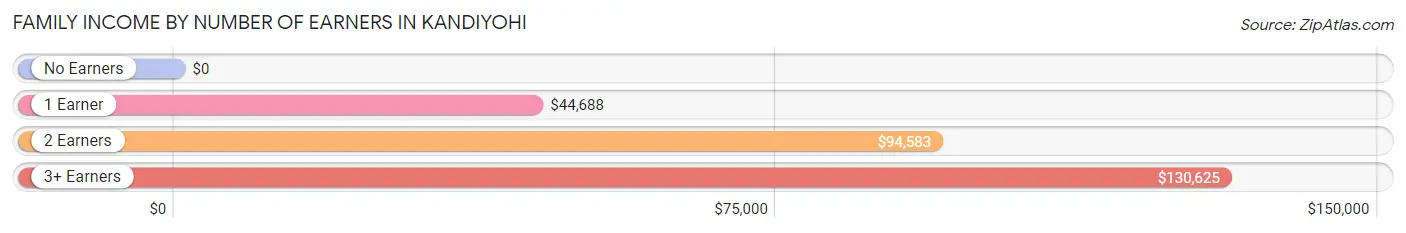
| Number of Earners | # Families | Median Income |
| No Earners | 7 (5.1%) | $0 |
| 1 Earner | 34 (24.6%) | $44,688 |
| 2 Earners | 82 (59.4%) | $94,583 |
| 3+ Earners | 15 (10.9%) | $130,625 |
| Total | 138 (100.0%) | $81,875 |
Household Income in Kandiyohi
Household Income Brackets in Kandiyohi
With 48 households falling in the category, the $50,000 to $74,999 income range is the most frequent in Kandiyohi, accounting for 23.1% of all households. In contrast, only 5 households (2.4%) fall into the $10,000 to $14,999 income bracket, making it the least populous group.
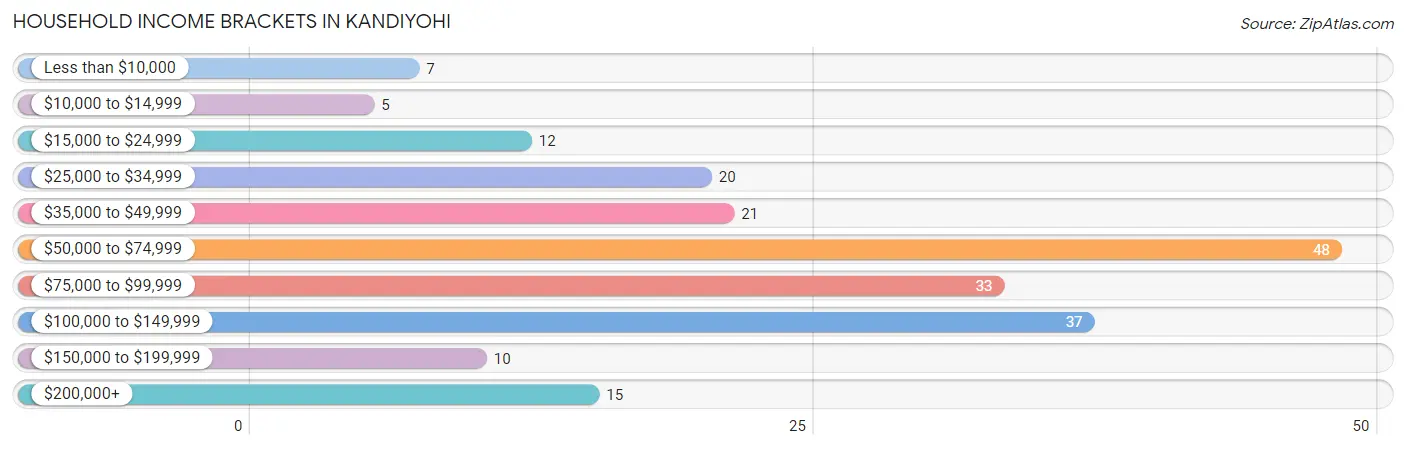
| Income Bracket | # Households | % Households |
| Less than $10,000 | 7 | 3.4% |
| $10,000 to $14,999 | 5 | 2.4% |
| $15,000 to $24,999 | 12 | 5.8% |
| $25,000 to $34,999 | 20 | 9.6% |
| $35,000 to $49,999 | 21 | 10.1% |
| $50,000 to $74,999 | 48 | 23.1% |
| $75,000 to $99,999 | 33 | 15.9% |
| $100,000 to $149,999 | 37 | 17.8% |
| $150,000 to $199,999 | 10 | 4.8% |
| $200,000+ | 15 | 7.2% |
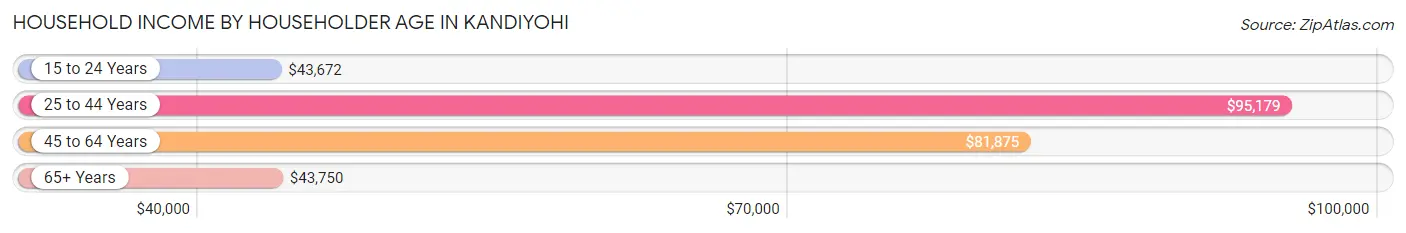
Household Income by Householder Age in Kandiyohi
The median household income in Kandiyohi is $70,417, with the highest median household income of $95,179 found in the 25 to 44 years age bracket for the primary householder. A total of 77 households (37.0%) fall into this category. Meanwhile, the 15 to 24 years age bracket for the primary householder has the lowest median household income of $43,672, with 31 households (14.9%) in this group.
| Income Bracket | # Households | Median Income |
| 15 to 24 Years | 31 (14.9%) | $43,672 |
| 25 to 44 Years | 77 (37.0%) | $95,179 |
| 45 to 64 Years | 58 (27.9%) | $81,875 |
| 65+ Years | 42 (20.2%) | $43,750 |
| Total | 208 (100.0%) | $70,417 |
Poverty in Kandiyohi
Income Below Poverty by Sex and Age in Kandiyohi
With 8.8% poverty level for males and 10.4% for females among the residents of Kandiyohi, 15 year old males and 16 and 17 year old females are the most vulnerable to poverty, with 3 males (100.0%) and 5 females (62.5%) in their respective age groups living below the poverty level.
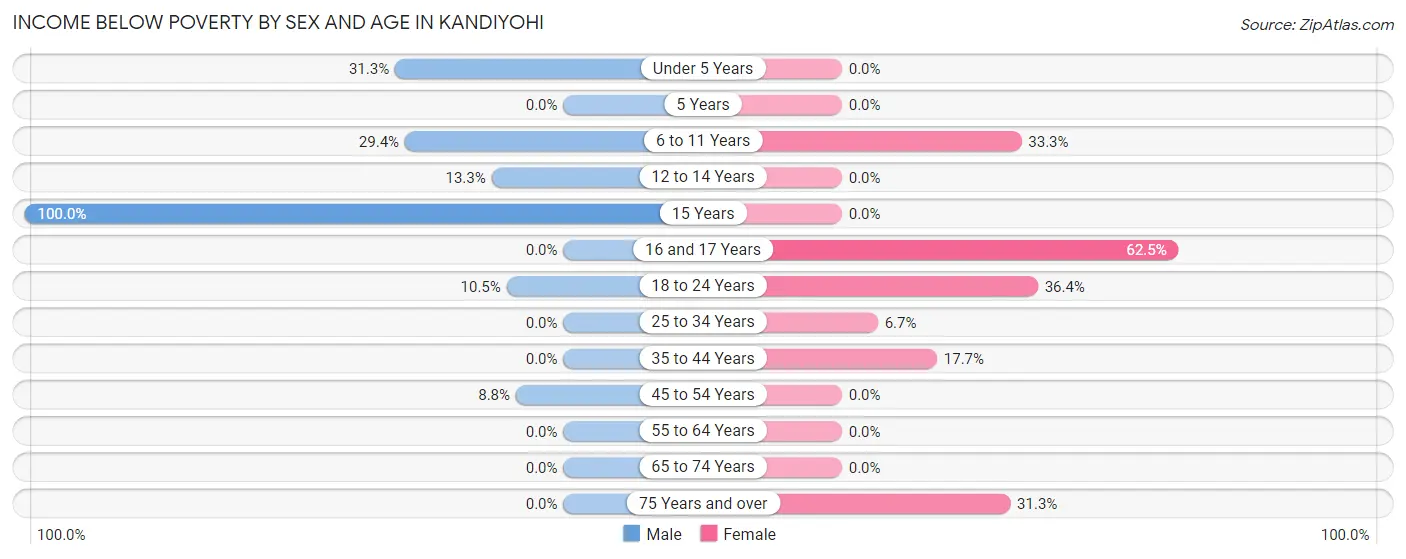
| Age Bracket | Male | Female |
| Under 5 Years | 5 (31.2%) | 0 (0.0%) |
| 5 Years | 0 (0.0%) | 0 (0.0%) |
| 6 to 11 Years | 5 (29.4%) | 3 (33.3%) |
| 12 to 14 Years | 2 (13.3%) | 0 (0.0%) |
| 15 Years | 3 (100.0%) | 0 (0.0%) |
| 16 and 17 Years | 0 (0.0%) | 5 (62.5%) |
| 18 to 24 Years | 4 (10.5%) | 4 (36.4%) |
| 25 to 34 Years | 0 (0.0%) | 3 (6.7%) |
| 35 to 44 Years | 0 (0.0%) | 3 (17.6%) |
| 45 to 54 Years | 3 (8.8%) | 0 (0.0%) |
| 55 to 64 Years | 0 (0.0%) | 0 (0.0%) |
| 65 to 74 Years | 0 (0.0%) | 0 (0.0%) |
| 75 Years and over | 0 (0.0%) | 5 (31.2%) |
| Total | 22 (8.8%) | 23 (10.4%) |
Income Above Poverty by Sex and Age in Kandiyohi
According to the poverty statistics in Kandiyohi, males aged 16 and 17 years and females aged under 5 years are the age groups that are most secure financially, with 100.0% of males and 100.0% of females in these age groups living above the poverty line.
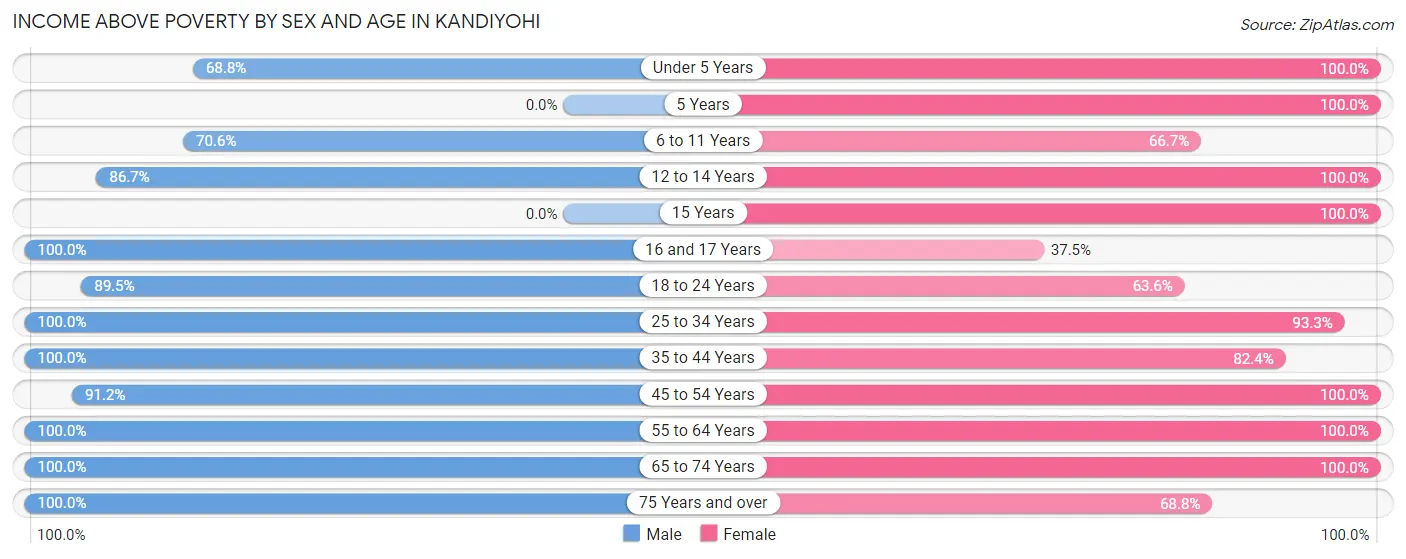
| Age Bracket | Male | Female |
| Under 5 Years | 11 (68.8%) | 22 (100.0%) |
| 5 Years | 0 (0.0%) | 2 (100.0%) |
| 6 to 11 Years | 12 (70.6%) | 6 (66.7%) |
| 12 to 14 Years | 13 (86.7%) | 11 (100.0%) |
| 15 Years | 0 (0.0%) | 3 (100.0%) |
| 16 and 17 Years | 4 (100.0%) | 3 (37.5%) |
| 18 to 24 Years | 34 (89.5%) | 7 (63.6%) |
| 25 to 34 Years | 26 (100.0%) | 42 (93.3%) |
| 35 to 44 Years | 36 (100.0%) | 14 (82.4%) |
| 45 to 54 Years | 31 (91.2%) | 23 (100.0%) |
| 55 to 64 Years | 40 (100.0%) | 30 (100.0%) |
| 65 to 74 Years | 16 (100.0%) | 23 (100.0%) |
| 75 Years and over | 6 (100.0%) | 11 (68.8%) |
| Total | 229 (91.2%) | 197 (89.5%) |
Income Below Poverty Among Married-Couple Families in Kandiyohi
The poverty statistics for married-couple families in Kandiyohi show that 2.8% or 3 of the total 107 families live below the poverty line. Families with 5 or more children have the highest poverty rate of 100.0%, comprising of 3 families. On the other hand, families with no children have the lowest poverty rate of 0.0%, which includes 0 families.
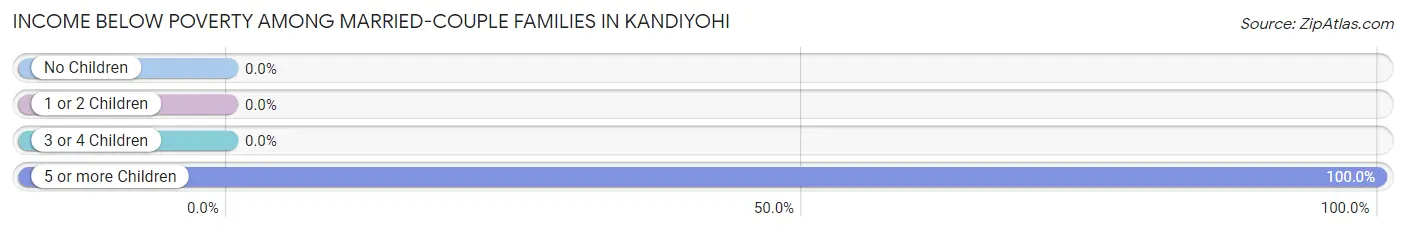
| Children | Above Poverty | Below Poverty |
| No Children | 54 (100.0%) | 0 (0.0%) |
| 1 or 2 Children | 45 (100.0%) | 0 (0.0%) |
| 3 or 4 Children | 5 (100.0%) | 0 (0.0%) |
| 5 or more Children | 0 (0.0%) | 3 (100.0%) |
| Total | 104 (97.2%) | 3 (2.8%) |
Income Below Poverty Among Single-Parent Households in Kandiyohi
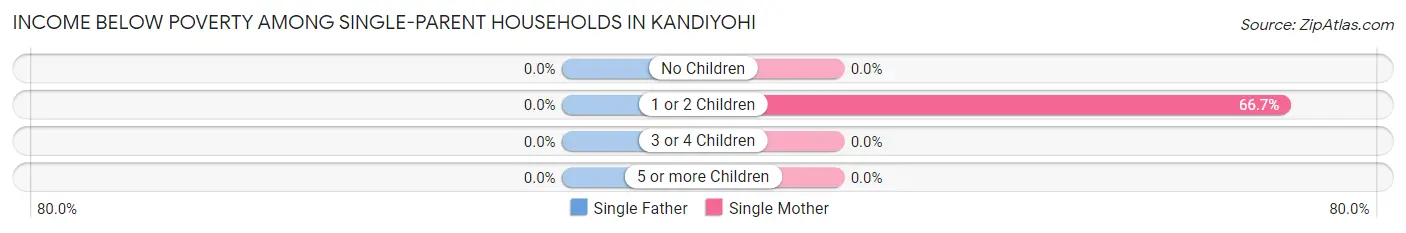
| Children | Single Father | Single Mother |
| No Children | 0 (0.0%) | 0 (0.0%) |
| 1 or 2 Children | 0 (0.0%) | 4 (66.7%) |
| 3 or 4 Children | 0 (0.0%) | 0 (0.0%) |
| 5 or more Children | 0 (0.0%) | 0 (0.0%) |
| Total | 0 (0.0%) | 4 (66.7%) |
Income Below Poverty Among Married-Couple vs Single-Parent Households in Kandiyohi
The poverty data for Kandiyohi shows that 3 of the married-couple family households (2.8%) and 4 of the single-parent households (12.9%) are living below the poverty level. Within the married-couple family households, those with 5 or more children have the highest poverty rate, with 3 households (100.0%) falling below the poverty line. Among the single-parent households, those with 1 or 2 children have the highest poverty rate, with 4 household (16.7%) living below poverty.
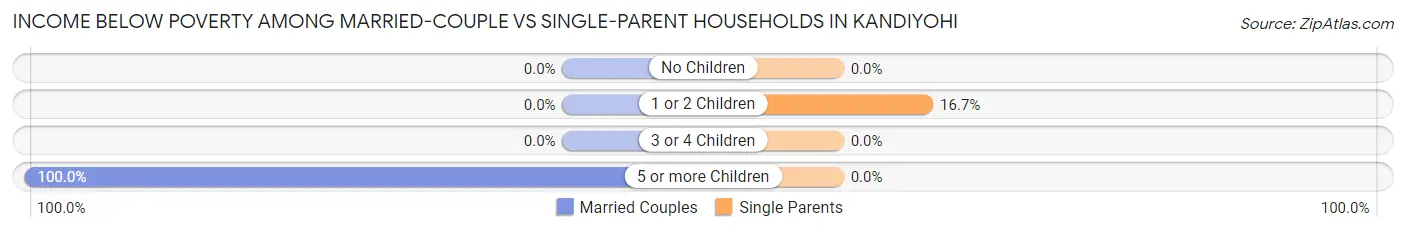
| Children | Married-Couple Families | Single-Parent Households |
| No Children | 0 (0.0%) | 0 (0.0%) |
| 1 or 2 Children | 0 (0.0%) | 4 (16.7%) |
| 3 or 4 Children | 0 (0.0%) | 0 (0.0%) |
| 5 or more Children | 3 (100.0%) | 0 (0.0%) |
| Total | 3 (2.8%) | 4 (12.9%) |
Race in Kandiyohi
The most populous races in Kandiyohi are White / Caucasian (424 | 90.0%), Hispanic or Latino (44 | 9.3%), and Two or more Races (41 | 8.7%).
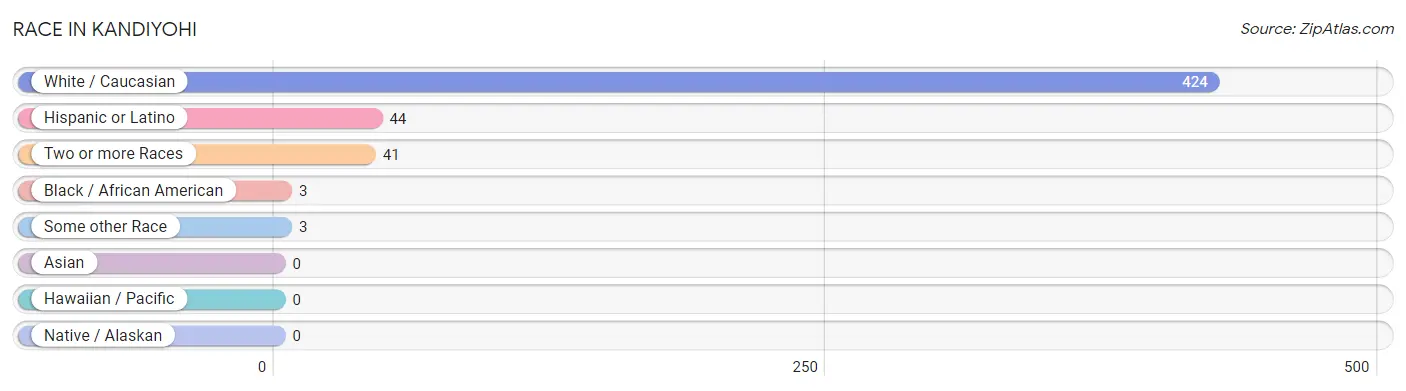
| Race | # Population | % Population |
| Asian | 0 | 0.0% |
| Black / African American | 3 | 0.6% |
| Hawaiian / Pacific | 0 | 0.0% |
| Hispanic or Latino | 44 | 9.3% |
| Native / Alaskan | 0 | 0.0% |
| White / Caucasian | 424 | 90.0% |
| Two or more Races | 41 | 8.7% |
| Some other Race | 3 | 0.6% |
| Total | 471 | 100.0% |
Ancestry in Kandiyohi
The most populous ancestries reported in Kandiyohi are German (147 | 31.2%), Norwegian (126 | 26.8%), Swedish (75 | 15.9%), Irish (45 | 9.6%), and Mexican (44 | 9.3%), together accounting for 92.8% of all Kandiyohi residents.
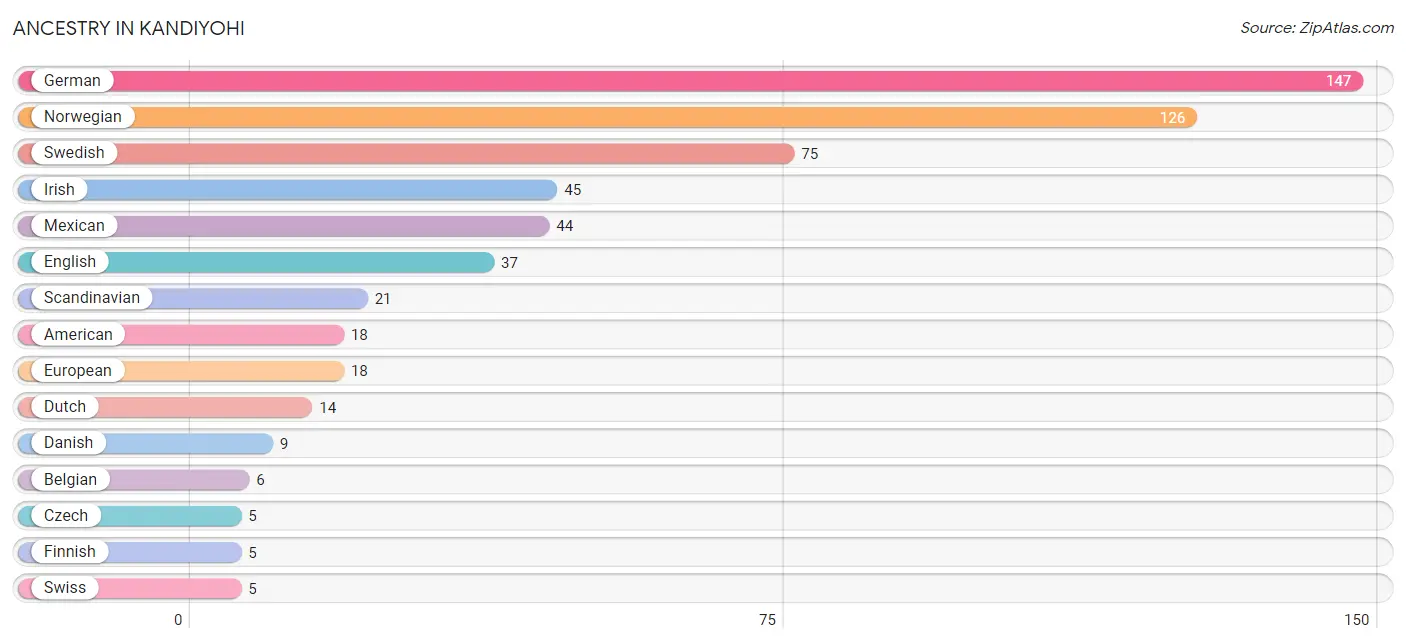
| Ancestry | # Population | % Population |
| American | 18 | 3.8% |
| Austrian | 1 | 0.2% |
| Belgian | 6 | 1.3% |
| Czech | 5 | 1.1% |
| Danish | 9 | 1.9% |
| Dutch | 14 | 3.0% |
| English | 37 | 7.9% |
| European | 18 | 3.8% |
| Finnish | 5 | 1.1% |
| French | 3 | 0.6% |
| German | 147 | 31.2% |
| Irish | 45 | 9.6% |
| Liberian | 3 | 0.6% |
| Mexican | 44 | 9.3% |
| Norwegian | 126 | 26.8% |
| Polish | 1 | 0.2% |
| Russian | 1 | 0.2% |
| Scandinavian | 21 | 4.5% |
| Slavic | 3 | 0.6% |
| Subsaharan African | 3 | 0.6% |
| Swedish | 75 | 15.9% |
| Swiss | 5 | 1.1% | View All 22 Rows |
Immigrants in Kandiyohi
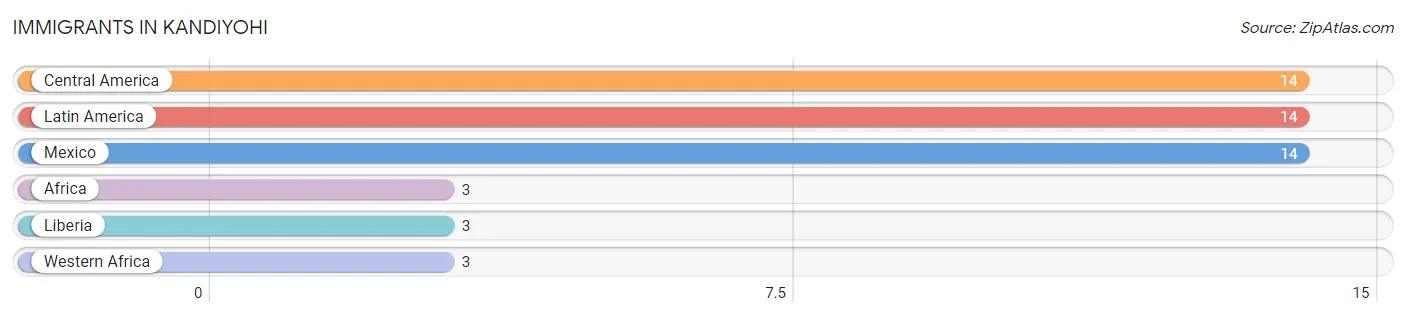
The most numerous immigrant groups reported in Kandiyohi came from Central America (14 | 3.0%), Latin America (14 | 3.0%), Mexico (14 | 3.0%), Africa (3 | 0.6%), and Liberia (3 | 0.6%), together accounting for 10.2% of all Kandiyohi residents.
| Immigration Origin | # Population | % Population |
| Africa | 3 | 0.6% |
| Central America | 14 | 3.0% |
| Latin America | 14 | 3.0% |
| Liberia | 3 | 0.6% |
| Mexico | 14 | 3.0% |
| Western Africa | 3 | 0.6% | View All 6 Rows |
Sex and Age in Kandiyohi
Sex and Age in Kandiyohi
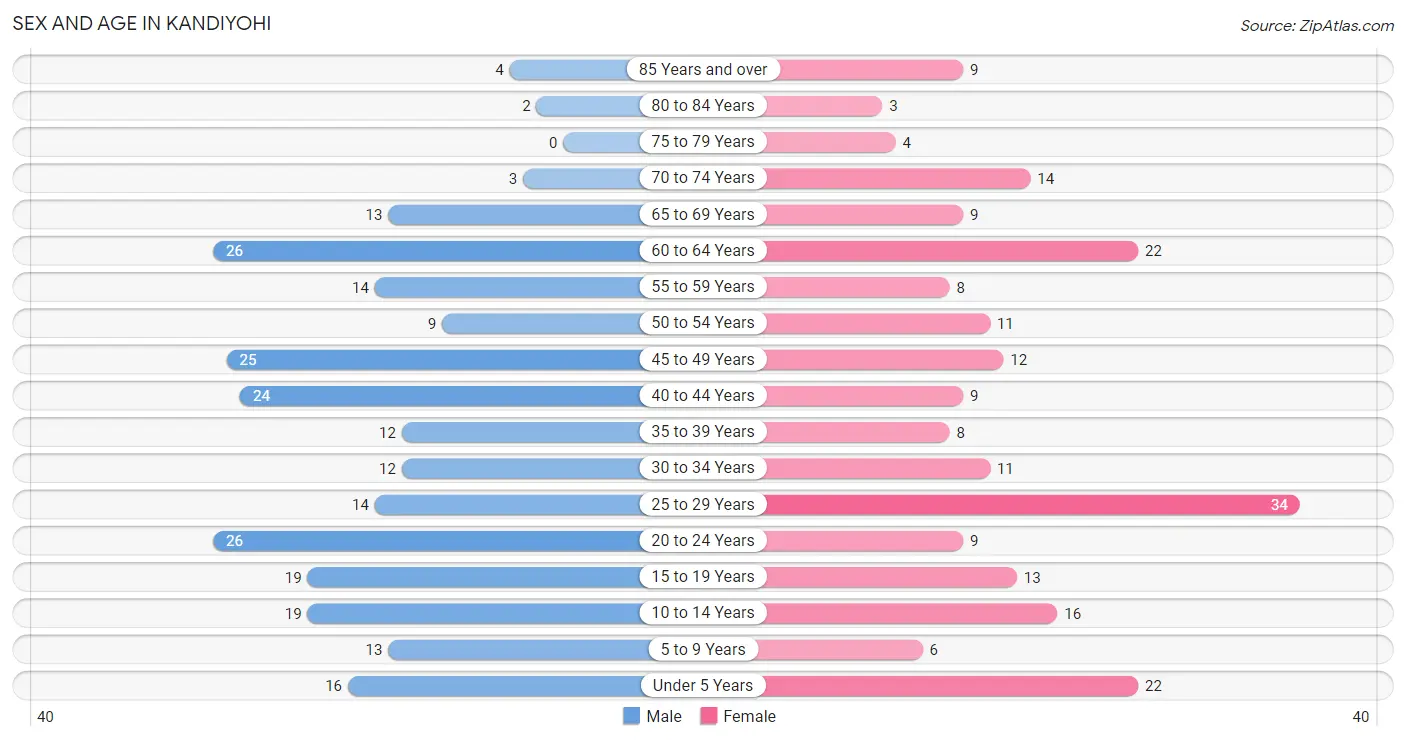
The most populous age groups in Kandiyohi are 20 to 24 Years (26 | 10.4%) for men and 25 to 29 Years (34 | 15.4%) for women.
| Age Bracket | Male | Female |
| Under 5 Years | 16 (6.4%) | 22 (10.0%) |
| 5 to 9 Years | 13 (5.2%) | 6 (2.7%) |
| 10 to 14 Years | 19 (7.6%) | 16 (7.3%) |
| 15 to 19 Years | 19 (7.6%) | 13 (5.9%) |
| 20 to 24 Years | 26 (10.4%) | 9 (4.1%) |
| 25 to 29 Years | 14 (5.6%) | 34 (15.4%) |
| 30 to 34 Years | 12 (4.8%) | 11 (5.0%) |
| 35 to 39 Years | 12 (4.8%) | 8 (3.6%) |
| 40 to 44 Years | 24 (9.6%) | 9 (4.1%) |
| 45 to 49 Years | 25 (10.0%) | 12 (5.4%) |
| 50 to 54 Years | 9 (3.6%) | 11 (5.0%) |
| 55 to 59 Years | 14 (5.6%) | 8 (3.6%) |
| 60 to 64 Years | 26 (10.4%) | 22 (10.0%) |
| 65 to 69 Years | 13 (5.2%) | 9 (4.1%) |
| 70 to 74 Years | 3 (1.2%) | 14 (6.4%) |
| 75 to 79 Years | 0 (0.0%) | 4 (1.8%) |
| 80 to 84 Years | 2 (0.8%) | 3 (1.4%) |
| 85 Years and over | 4 (1.6%) | 9 (4.1%) |
| Total | 251 (100.0%) | 220 (100.0%) |
Families and Households in Kandiyohi
Median Family Size in Kandiyohi
The median family size in Kandiyohi is 2.81 persons per family, with married-couple families (107 | 77.5%) accounting for the largest median family size of 2.97 persons per family. On the other hand, single female/mother families (6 | 4.3%) represent the smallest median family size with 1.83 persons per family.
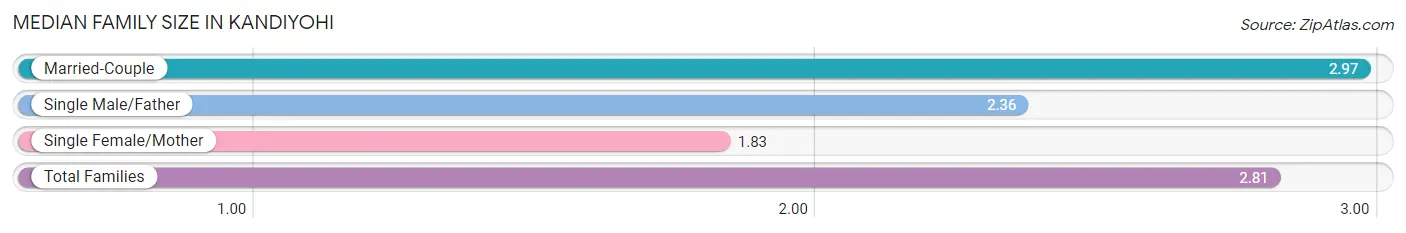
| Family Type | # Families | Family Size |
| Married-Couple | 107 (77.5%) | 2.97 |
| Single Male/Father | 25 (18.1%) | 2.36 |
| Single Female/Mother | 6 (4.3%) | 1.83 |
| Total Families | 138 (100.0%) | 2.81 |
Median Household Size in Kandiyohi
The median household size in Kandiyohi is 2.26 persons per household, with married-couple households (107 | 51.4%) accounting for the largest median household size of 2.99 persons per household. non-family households (70 | 33.7%) represent the smallest median household size with 1.13 persons per household.
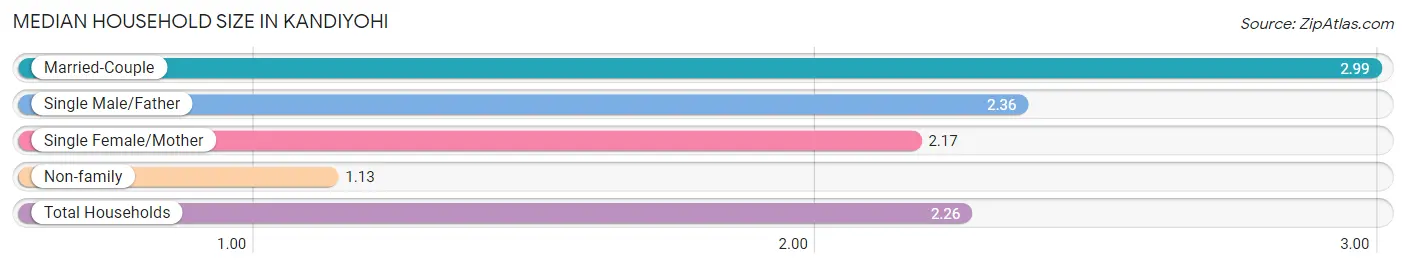
| Household Type | # Households | Household Size |
| Married-Couple | 107 (51.4%) | 2.99 |
| Single Male/Father | 25 (12.0%) | 2.36 |
| Single Female/Mother | 6 (2.9%) | 2.17 |
| Non-family | 70 (33.7%) | 1.13 |
| Total Households | 208 (100.0%) | 2.26 |
Household Size by Marriage Status in Kandiyohi
Out of a total of 208 households in Kandiyohi, 138 (66.3%) are family households, while 70 (33.7%) are nonfamily households. The most numerous type of family households are 2-person households, comprising 63, and the most common type of nonfamily households are 1-person households, comprising 64.
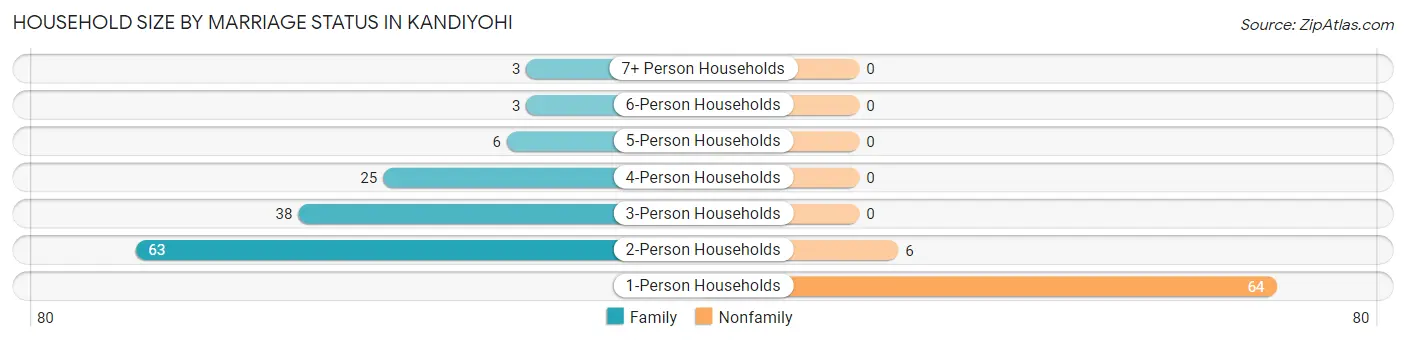
| Household Size | Family Households | Nonfamily Households |
| 1-Person Households | - | 64 (30.8%) |
| 2-Person Households | 63 (30.3%) | 6 (2.9%) |
| 3-Person Households | 38 (18.3%) | 0 (0.0%) |
| 4-Person Households | 25 (12.0%) | 0 (0.0%) |
| 5-Person Households | 6 (2.9%) | 0 (0.0%) |
| 6-Person Households | 3 (1.4%) | 0 (0.0%) |
| 7+ Person Households | 3 (1.4%) | 0 (0.0%) |
| Total | 138 (66.3%) | 70 (33.7%) |
Female Fertility in Kandiyohi
Fertility by Age in Kandiyohi
Average fertility rate in Kandiyohi is 61.0 births per 1,000 women. Women in the age bracket of 20 to 34 years have the highest fertility rate with 111.0 births per 1,000 women. Women in the age bracket of 20 to 34 years acount for 100.0% of all women with births.
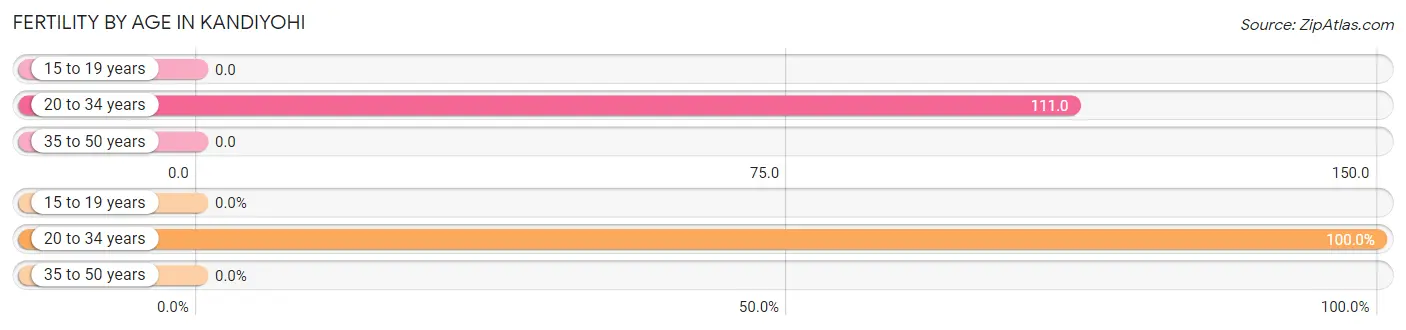
| Age Bracket | Women with Births | Births / 1,000 Women |
| 15 to 19 years | 0 (0.0%) | 0.0 |
| 20 to 34 years | 6 (100.0%) | 111.0 |
| 35 to 50 years | 0 (0.0%) | 0.0 |
| Total | 6 (100.0%) | 61.0 |
Fertility by Age by Marriage Status in Kandiyohi
66.7% of women with births (6) in Kandiyohi are married. The highest percentage of unmarried women with births falls into 20 to 34 years age bracket with 33.3% of them unmarried at the time of birth, while the lowest percentage of unmarried women with births belong to 20 to 34 years age bracket with 33.3% of them unmarried.
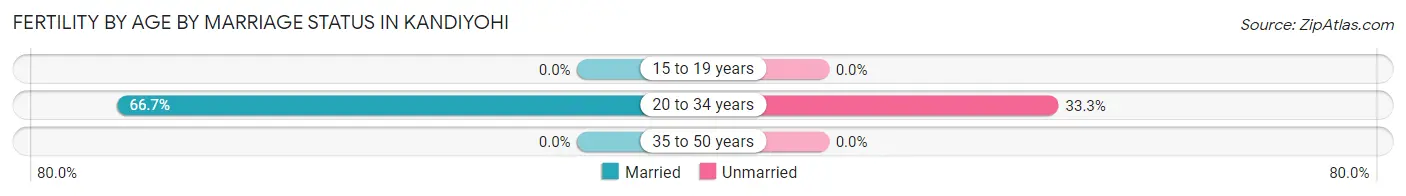
| Age Bracket | Married | Unmarried |
| 15 to 19 years | 0 (0.0%) | 0 (0.0%) |
| 20 to 34 years | 4 (66.7%) | 2 (33.3%) |
| 35 to 50 years | 0 (0.0%) | 0 (0.0%) |
| Total | 4 (66.7%) | 2 (33.3%) |
Fertility by Education in Kandiyohi
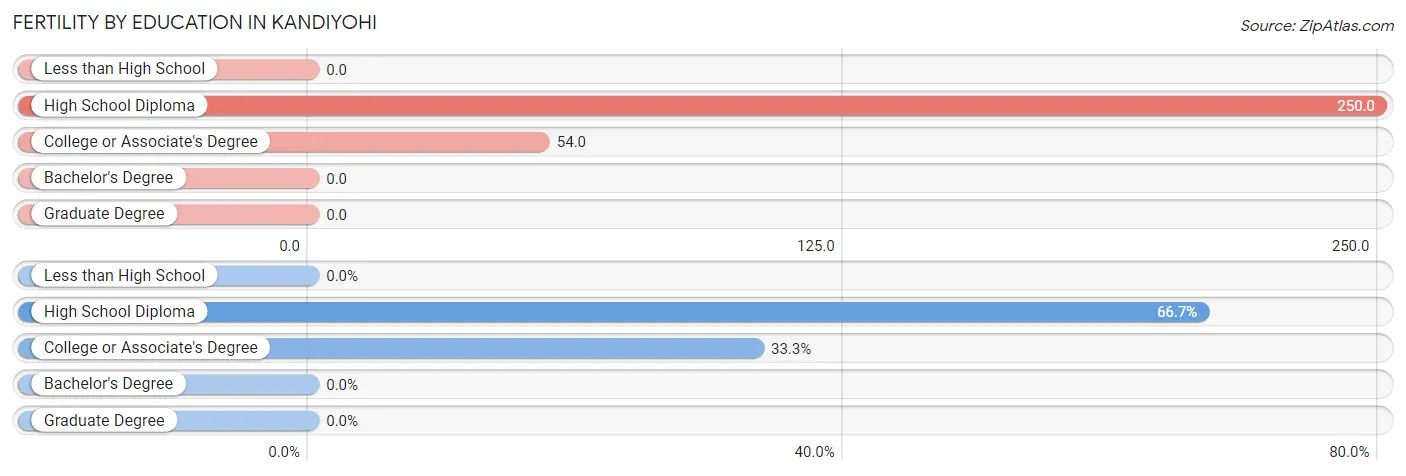
| Educational Attainment | Women with Births | Births / 1,000 Women |
| Less than High School | 0 (0.0%) | 0.0 |
| High School Diploma | 4 (66.7%) | 250.0 |
| College or Associate's Degree | 2 (33.3%) | 54.0 |
| Bachelor's Degree | 0 (0.0%) | 0.0 |
| Graduate Degree | 0 (0.0%) | 0.0 |
| Total | 6 (100.0%) | 61.0 |
Fertility by Education by Marriage Status in Kandiyohi
33.3% of women with births in Kandiyohi are unmarried. Women with the educational attainment of college or associate's degree are most likely to be married with 100.0% of them married at childbirth, while women with the educational attainment of high school diploma are least likely to be married with 50.0% of them unmarried at childbirth.
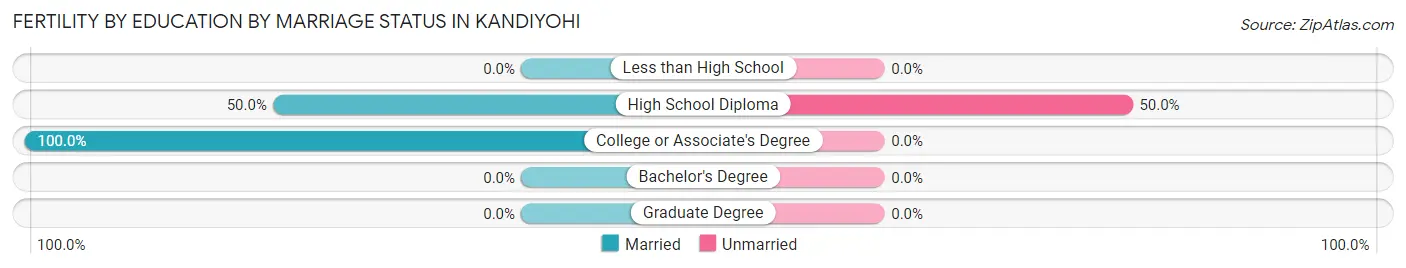
| Educational Attainment | Married | Unmarried |
| Less than High School | 0 (0.0%) | 0 (0.0%) |
| High School Diploma | 2 (50.0%) | 2 (50.0%) |
| College or Associate's Degree | 2 (100.0%) | 0 (0.0%) |
| Bachelor's Degree | 0 (0.0%) | 0 (0.0%) |
| Graduate Degree | 0 (0.0%) | 0 (0.0%) |
| Total | 4 (66.7%) | 2 (33.3%) |
Employment Characteristics in Kandiyohi
Employment by Class of Employer in Kandiyohi
Among the 271 employed individuals in Kandiyohi, private company employees (158 | 58.3%), state government employees (26 | 9.6%), and self-employed (not incorporated) (23 | 8.5%) make up the most common classes of employment.
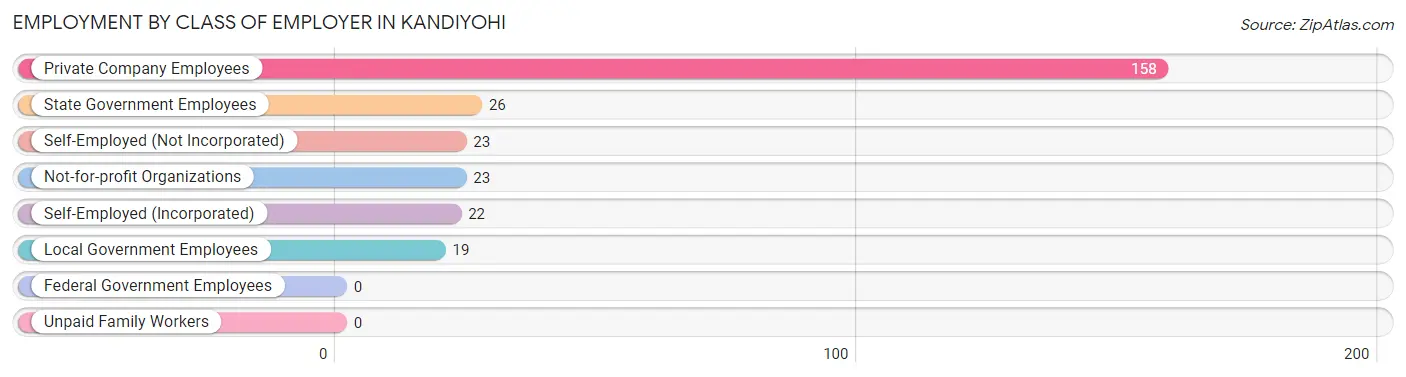
| Employer Class | # Employees | % Employees |
| Private Company Employees | 158 | 58.3% |
| Self-Employed (Incorporated) | 22 | 8.1% |
| Self-Employed (Not Incorporated) | 23 | 8.5% |
| Not-for-profit Organizations | 23 | 8.5% |
| Local Government Employees | 19 | 7.0% |
| State Government Employees | 26 | 9.6% |
| Federal Government Employees | 0 | 0.0% |
| Unpaid Family Workers | 0 | 0.0% |
| Total | 271 | 100.0% |
Employment Status by Age in Kandiyohi
According to the labor force statistics for Kandiyohi, out of the total population over 16 years of age (373), 79.6% or 297 individuals are in the labor force, with 6.7% or 20 of them unemployed. The age group with the highest labor force participation rate is 20 to 24 years, with 100.0% or 35 individuals in the labor force. Within the labor force, the 20 to 24 years age range has the highest percentage of unemployed individuals, with 51.4% or 18 of them being unemployed.
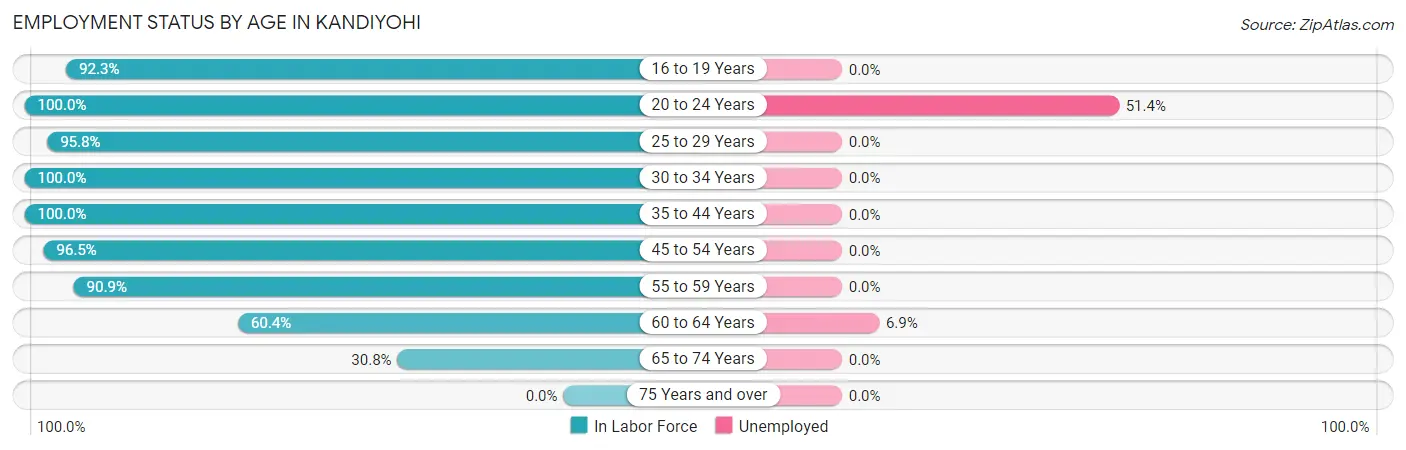
| Age Bracket | In Labor Force | Unemployed |
| 16 to 19 Years | 24 (92.3%) | 0 (0.0%) |
| 20 to 24 Years | 35 (100.0%) | 18 (51.4%) |
| 25 to 29 Years | 46 (95.8%) | 0 (0.0%) |
| 30 to 34 Years | 23 (100.0%) | 0 (0.0%) |
| 35 to 44 Years | 53 (100.0%) | 0 (0.0%) |
| 45 to 54 Years | 55 (96.5%) | 0 (0.0%) |
| 55 to 59 Years | 20 (90.9%) | 0 (0.0%) |
| 60 to 64 Years | 29 (60.4%) | 2 (6.9%) |
| 65 to 74 Years | 12 (30.8%) | 0 (0.0%) |
| 75 Years and over | 0 (0.0%) | 0 (0.0%) |
| Total | 297 (79.6%) | 20 (6.7%) |
Employment Status by Educational Attainment in Kandiyohi
According to labor force statistics for Kandiyohi, 90.0% of individuals (226) out of the total population between 25 and 64 years of age (251) are in the labor force, with 0.9% or 2 of them being unemployed. The group with the highest labor force participation rate are those with the educational attainment of college / associate degree, with 98.3% or 116 individuals in the labor force. Within the labor force, individuals with high school diploma education have the highest percentage of unemployment, with 4.0% or 2 of them being unemployed.
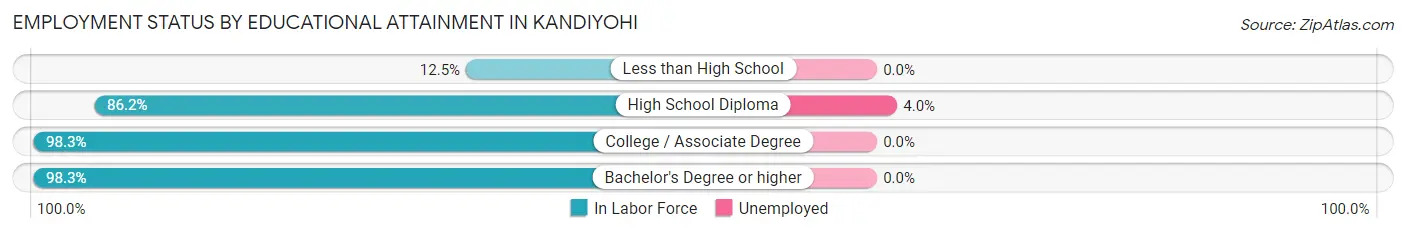
| Educational Attainment | In Labor Force | Unemployed |
| Less than High School | 2 (12.5%) | 0 (0.0%) |
| High School Diploma | 50 (86.2%) | 2 (4.0%) |
| College / Associate Degree | 116 (98.3%) | 0 (0.0%) |
| Bachelor's Degree or higher | 58 (98.3%) | 0 (0.0%) |
| Total | 226 (90.0%) | 2 (0.9%) |
Employment Occupations by Sex in Kandiyohi
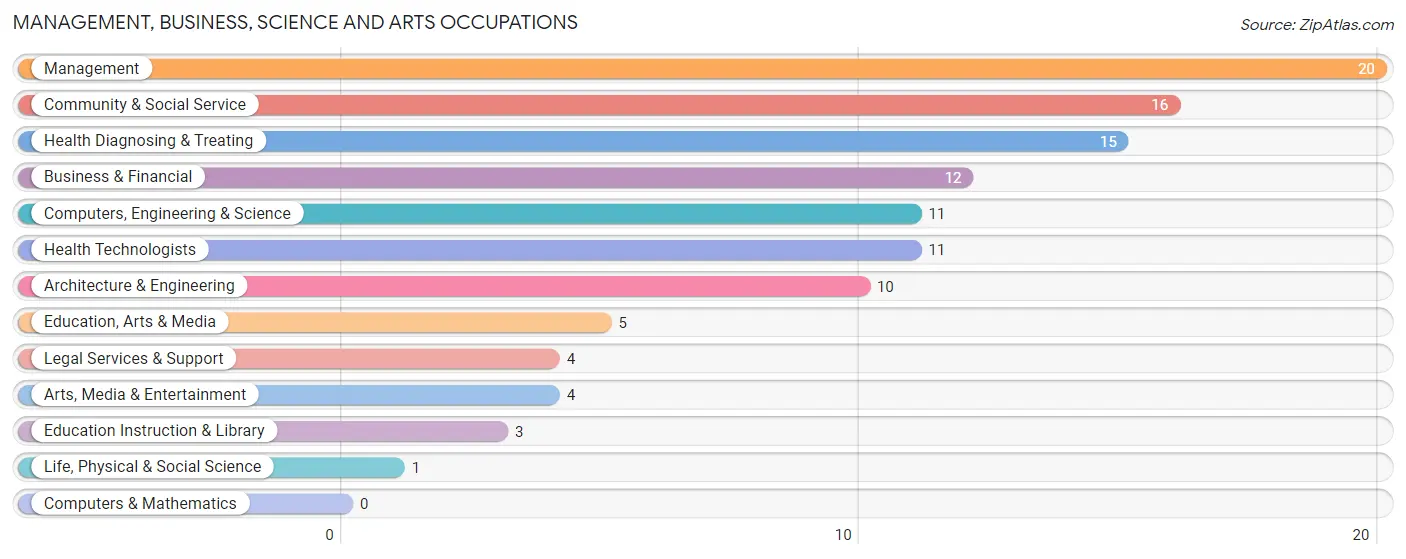
Management, Business, Science and Arts Occupations
The most common Management, Business, Science and Arts occupations in Kandiyohi are Management (20 | 7.2%), Community & Social Service (16 | 5.8%), Health Diagnosing & Treating (15 | 5.4%), Business & Financial (12 | 4.3%), and Computers, Engineering & Science (11 | 4.0%).
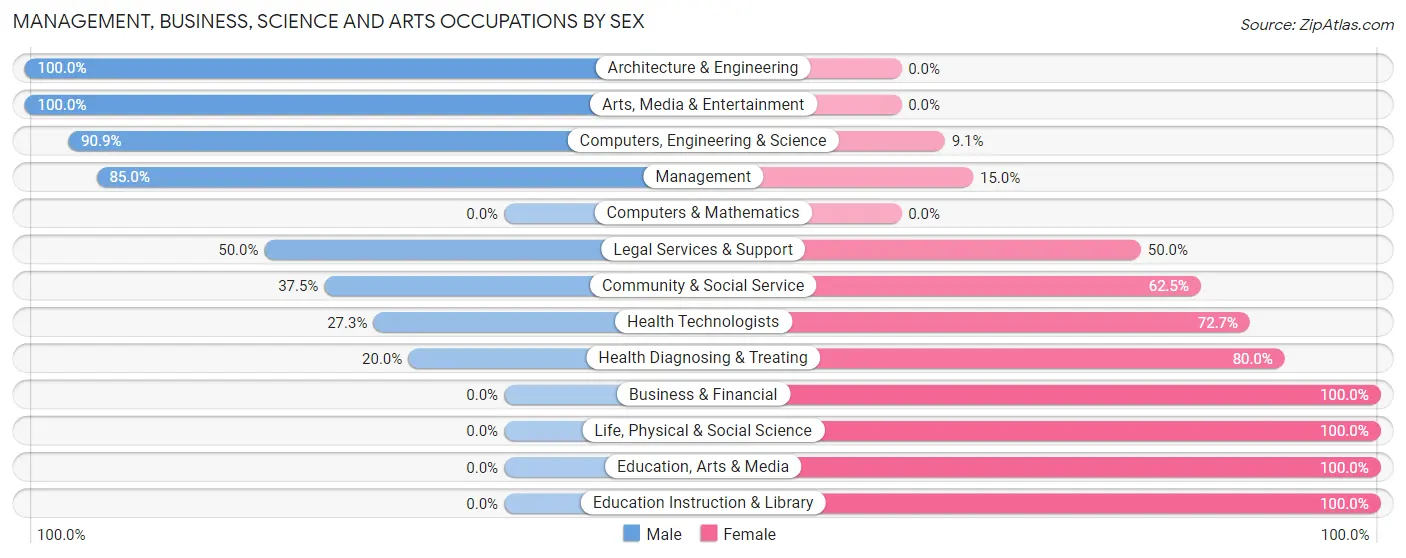
Management, Business, Science and Arts Occupations by Sex
Within the Management, Business, Science and Arts occupations in Kandiyohi, the most male-oriented occupations are Architecture & Engineering (100.0%), Arts, Media & Entertainment (100.0%), and Computers, Engineering & Science (90.9%), while the most female-oriented occupations are Business & Financial (100.0%), Life, Physical & Social Science (100.0%), and Education, Arts & Media (100.0%).
| Occupation | Male | Female |
| Management | 17 (85.0%) | 3 (15.0%) |
| Business & Financial | 0 (0.0%) | 12 (100.0%) |
| Computers, Engineering & Science | 10 (90.9%) | 1 (9.1%) |
| Computers & Mathematics | 0 (0.0%) | 0 (0.0%) |
| Architecture & Engineering | 10 (100.0%) | 0 (0.0%) |
| Life, Physical & Social Science | 0 (0.0%) | 1 (100.0%) |
| Community & Social Service | 6 (37.5%) | 10 (62.5%) |
| Education, Arts & Media | 0 (0.0%) | 5 (100.0%) |
| Legal Services & Support | 2 (50.0%) | 2 (50.0%) |
| Education Instruction & Library | 0 (0.0%) | 3 (100.0%) |
| Arts, Media & Entertainment | 4 (100.0%) | 0 (0.0%) |
| Health Diagnosing & Treating | 3 (20.0%) | 12 (80.0%) |
| Health Technologists | 3 (27.3%) | 8 (72.7%) |
| Total (Category) | 36 (48.6%) | 38 (51.3%) |
| Total (Overall) | 146 (52.7%) | 131 (47.3%) |
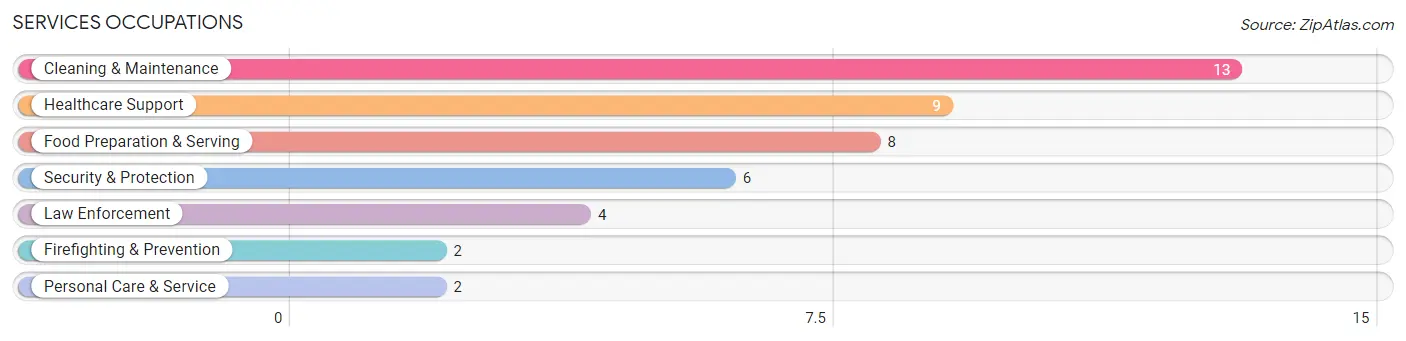
Services Occupations
The most common Services occupations in Kandiyohi are Cleaning & Maintenance (13 | 4.7%), Healthcare Support (9 | 3.3%), Food Preparation & Serving (8 | 2.9%), Security & Protection (6 | 2.2%), and Law Enforcement (4 | 1.4%).
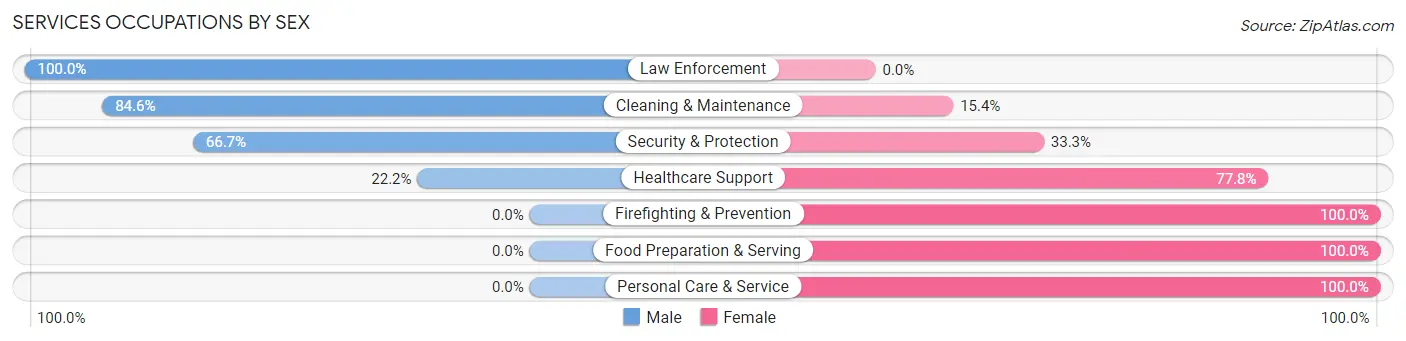
Services Occupations by Sex
Within the Services occupations in Kandiyohi, the most male-oriented occupations are Law Enforcement (100.0%), Cleaning & Maintenance (84.6%), and Security & Protection (66.7%), while the most female-oriented occupations are Firefighting & Prevention (100.0%), Food Preparation & Serving (100.0%), and Personal Care & Service (100.0%).
| Occupation | Male | Female |
| Healthcare Support | 2 (22.2%) | 7 (77.8%) |
| Security & Protection | 4 (66.7%) | 2 (33.3%) |
| Firefighting & Prevention | 0 (0.0%) | 2 (100.0%) |
| Law Enforcement | 4 (100.0%) | 0 (0.0%) |
| Food Preparation & Serving | 0 (0.0%) | 8 (100.0%) |
| Cleaning & Maintenance | 11 (84.6%) | 2 (15.4%) |
| Personal Care & Service | 0 (0.0%) | 2 (100.0%) |
| Total (Category) | 17 (44.7%) | 21 (55.3%) |
| Total (Overall) | 146 (52.7%) | 131 (47.3%) |
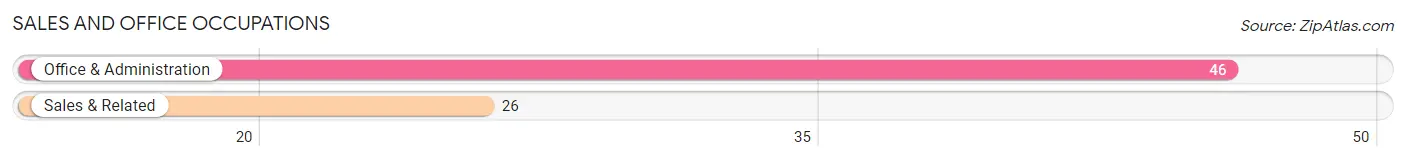
Sales and Office Occupations
The most common Sales and Office occupations in Kandiyohi are Office & Administration (46 | 16.6%), and Sales & Related (26 | 9.4%).
Sales and Office Occupations by Sex
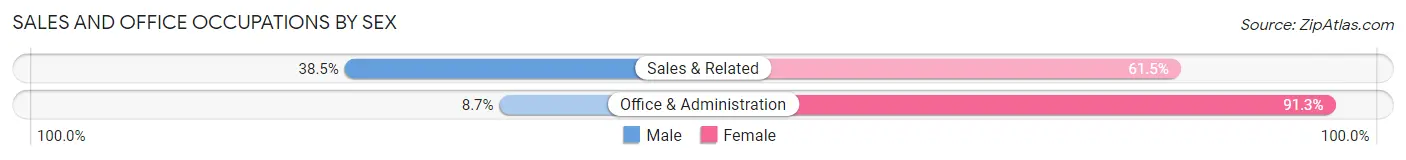
| Occupation | Male | Female |
| Sales & Related | 10 (38.5%) | 16 (61.5%) |
| Office & Administration | 4 (8.7%) | 42 (91.3%) |
| Total (Category) | 14 (19.4%) | 58 (80.6%) |
| Total (Overall) | 146 (52.7%) | 131 (47.3%) |
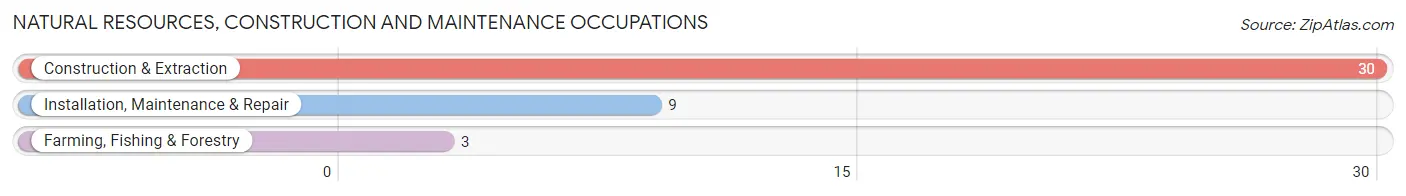
Natural Resources, Construction and Maintenance Occupations
The most common Natural Resources, Construction and Maintenance occupations in Kandiyohi are Construction & Extraction (30 | 10.8%), Installation, Maintenance & Repair (9 | 3.3%), and Farming, Fishing & Forestry (3 | 1.1%).
Natural Resources, Construction and Maintenance Occupations by Sex
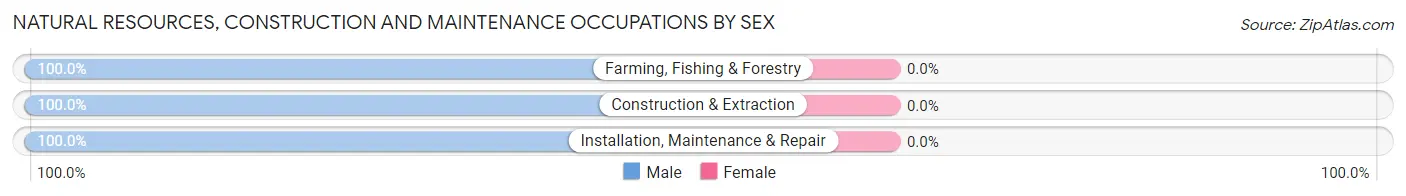
| Occupation | Male | Female |
| Farming, Fishing & Forestry | 3 (100.0%) | 0 (0.0%) |
| Construction & Extraction | 30 (100.0%) | 0 (0.0%) |
| Installation, Maintenance & Repair | 9 (100.0%) | 0 (0.0%) |
| Total (Category) | 42 (100.0%) | 0 (0.0%) |
| Total (Overall) | 146 (52.7%) | 131 (47.3%) |
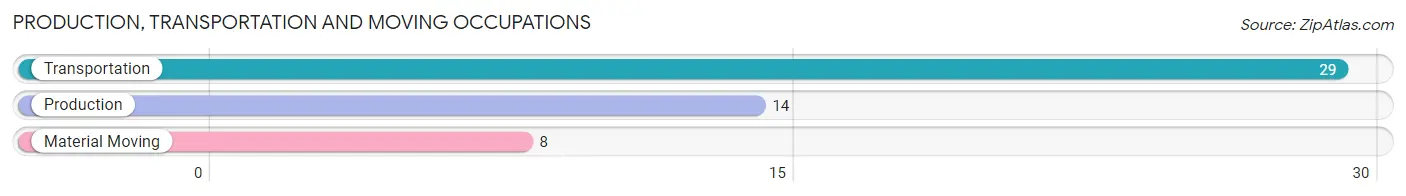
Production, Transportation and Moving Occupations
The most common Production, Transportation and Moving occupations in Kandiyohi are Transportation (29 | 10.5%), Production (14 | 5.1%), and Material Moving (8 | 2.9%).
Production, Transportation and Moving Occupations by Sex
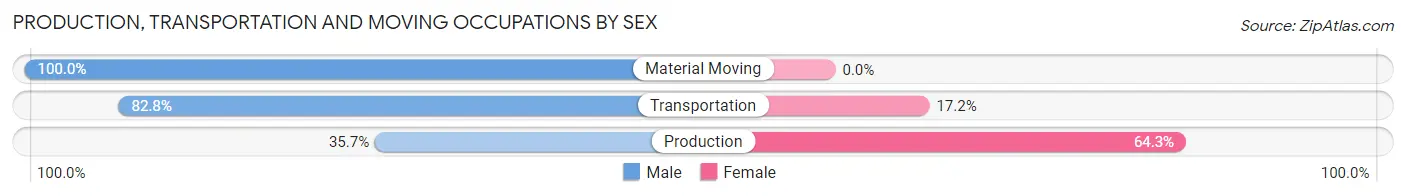
| Occupation | Male | Female |
| Production | 5 (35.7%) | 9 (64.3%) |
| Transportation | 24 (82.8%) | 5 (17.2%) |
| Material Moving | 8 (100.0%) | 0 (0.0%) |
| Total (Category) | 37 (72.6%) | 14 (27.5%) |
| Total (Overall) | 146 (52.7%) | 131 (47.3%) |
Employment Industries by Sex in Kandiyohi
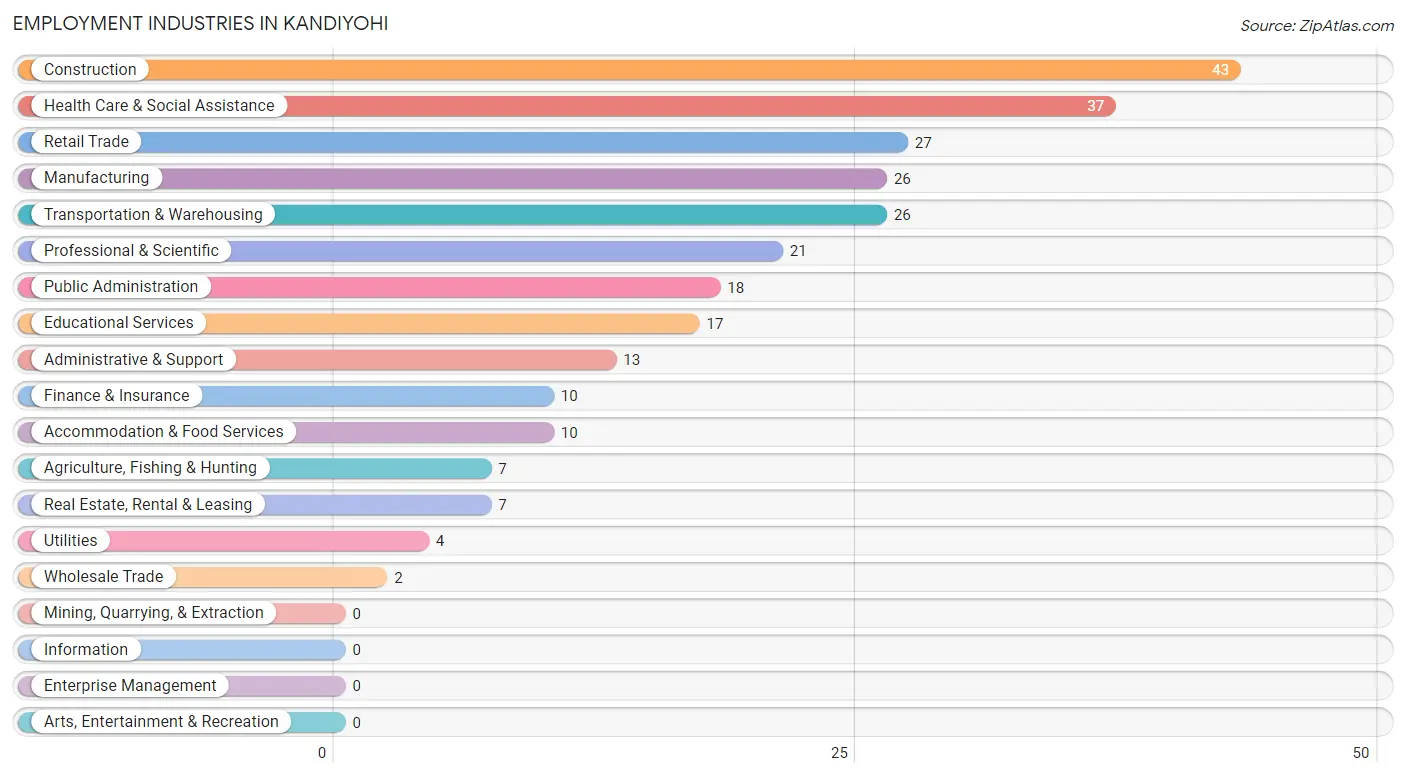
Employment Industries in Kandiyohi
The major employment industries in Kandiyohi include Construction (43 | 15.5%), Health Care & Social Assistance (37 | 13.4%), Retail Trade (27 | 9.8%), Manufacturing (26 | 9.4%), and Transportation & Warehousing (26 | 9.4%).
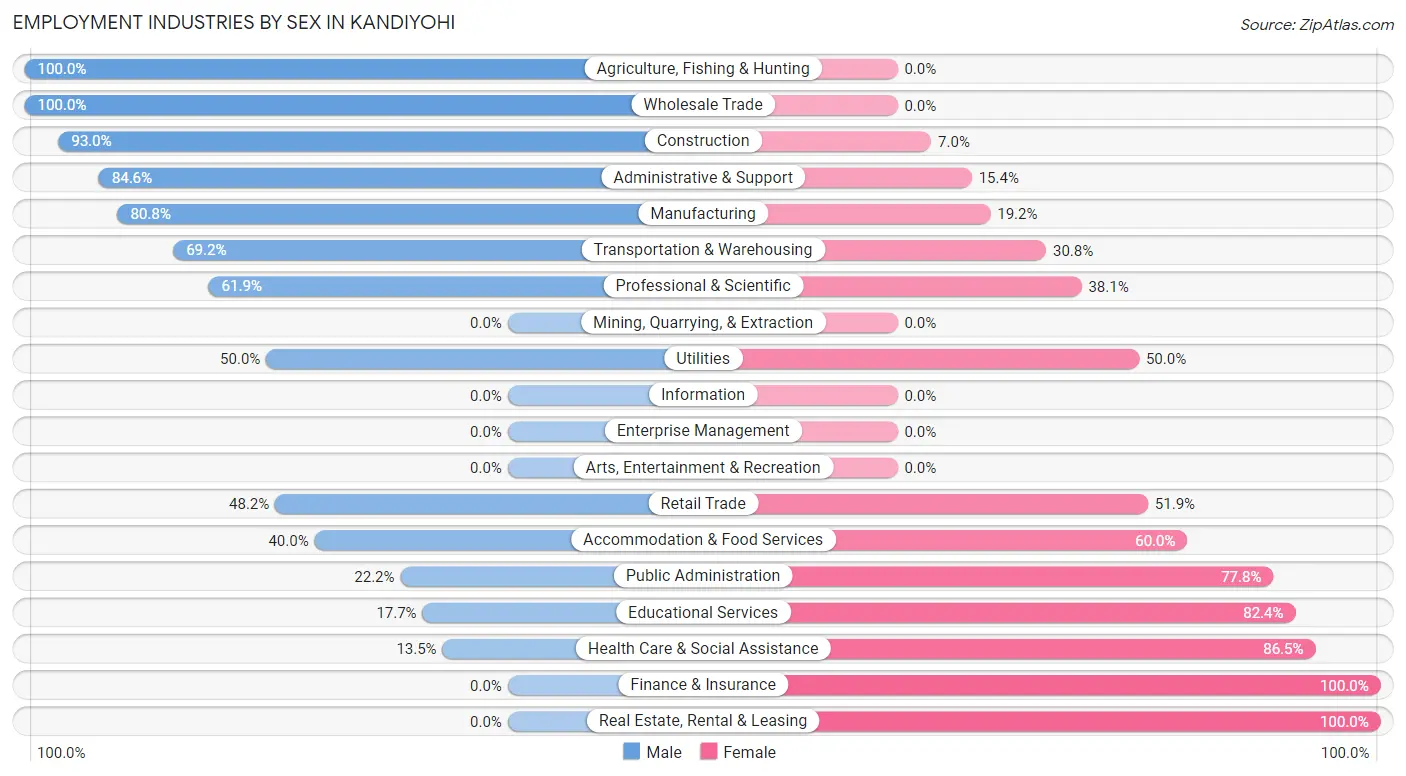
Employment Industries by Sex in Kandiyohi
The Kandiyohi industries that see more men than women are Agriculture, Fishing & Hunting (100.0%), Wholesale Trade (100.0%), and Construction (93.0%), whereas the industries that tend to have a higher number of women are Finance & Insurance (100.0%), Real Estate, Rental & Leasing (100.0%), and Health Care & Social Assistance (86.5%).
| Industry | Male | Female |
| Agriculture, Fishing & Hunting | 7 (100.0%) | 0 (0.0%) |
| Mining, Quarrying, & Extraction | 0 (0.0%) | 0 (0.0%) |
| Construction | 40 (93.0%) | 3 (7.0%) |
| Manufacturing | 21 (80.8%) | 5 (19.2%) |
| Wholesale Trade | 2 (100.0%) | 0 (0.0%) |
| Retail Trade | 13 (48.1%) | 14 (51.8%) |
| Transportation & Warehousing | 18 (69.2%) | 8 (30.8%) |
| Utilities | 2 (50.0%) | 2 (50.0%) |
| Information | 0 (0.0%) | 0 (0.0%) |
| Finance & Insurance | 0 (0.0%) | 10 (100.0%) |
| Real Estate, Rental & Leasing | 0 (0.0%) | 7 (100.0%) |
| Professional & Scientific | 13 (61.9%) | 8 (38.1%) |
| Enterprise Management | 0 (0.0%) | 0 (0.0%) |
| Administrative & Support | 11 (84.6%) | 2 (15.4%) |
| Educational Services | 3 (17.6%) | 14 (82.4%) |
| Health Care & Social Assistance | 5 (13.5%) | 32 (86.5%) |
| Arts, Entertainment & Recreation | 0 (0.0%) | 0 (0.0%) |
| Accommodation & Food Services | 4 (40.0%) | 6 (60.0%) |
| Public Administration | 4 (22.2%) | 14 (77.8%) |
| Total | 146 (52.7%) | 131 (47.3%) |
Education in Kandiyohi
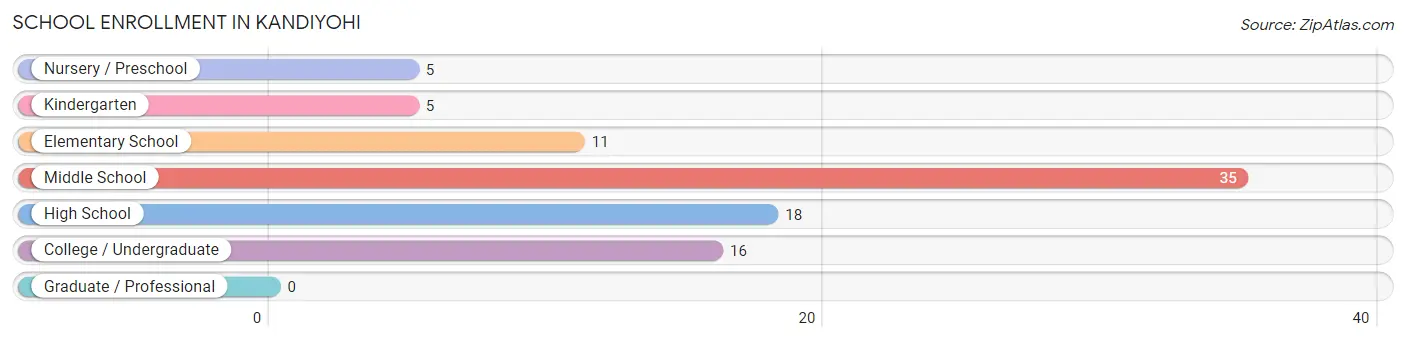
School Enrollment in Kandiyohi
The most common levels of schooling among the 90 students in Kandiyohi are middle school (35 | 38.9%), high school (18 | 20.0%), and college / undergraduate (16 | 17.8%).
| School Level | # Students | % Students |
| Nursery / Preschool | 5 | 5.6% |
| Kindergarten | 5 | 5.6% |
| Elementary School | 11 | 12.2% |
| Middle School | 35 | 38.9% |
| High School | 18 | 20.0% |
| College / Undergraduate | 16 | 17.8% |
| Graduate / Professional | 0 | 0.0% |
| Total | 90 | 100.0% |
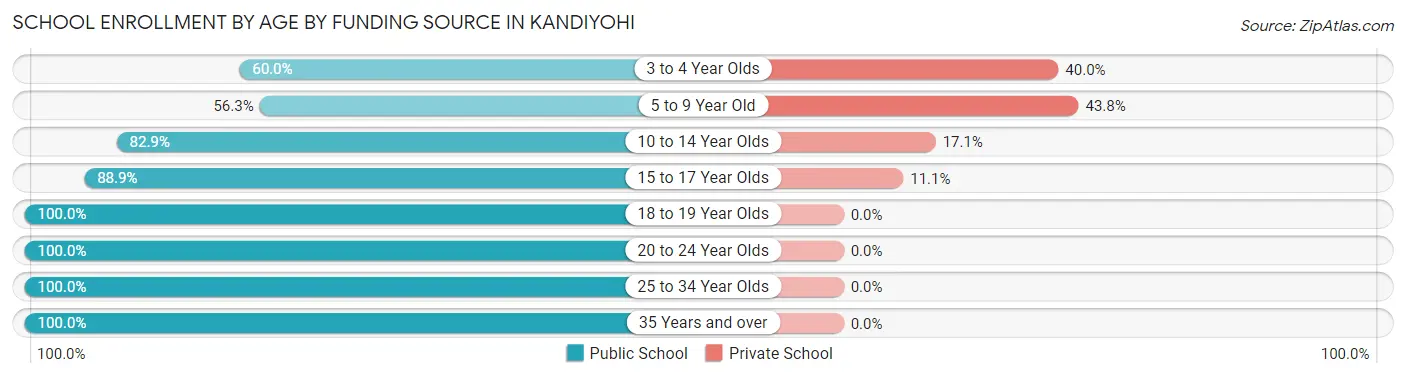
School Enrollment by Age by Funding Source in Kandiyohi
Out of a total of 90 students who are enrolled in schools in Kandiyohi, 17 (18.9%) attend a private institution, while the remaining 73 (81.1%) are enrolled in public schools. The age group of 5 to 9 year old has the highest likelihood of being enrolled in private schools, with 7 (43.8% in the age bracket) enrolled. Conversely, the age group of 18 to 19 year olds has the lowest likelihood of being enrolled in a private school, with 7 (100.0% in the age bracket) attending a public institution.
| Age Bracket | Public School | Private School |
| 3 to 4 Year Olds | 3 (60.0%) | 2 (40.0%) |
| 5 to 9 Year Old | 9 (56.2%) | 7 (43.8%) |
| 10 to 14 Year Olds | 29 (82.9%) | 6 (17.1%) |
| 15 to 17 Year Olds | 16 (88.9%) | 2 (11.1%) |
| 18 to 19 Year Olds | 7 (100.0%) | 0 (0.0%) |
| 20 to 24 Year Olds | 4 (100.0%) | 0 (0.0%) |
| 25 to 34 Year Olds | 3 (100.0%) | 0 (0.0%) |
| 35 Years and over | 2 (100.0%) | 0 (0.0%) |
| Total | 73 (81.1%) | 17 (18.9%) |
Educational Attainment by Field of Study in Kandiyohi
Business (23 | 28.4%), education (17 | 21.0%), science & technology (14 | 17.3%), bio, nature & agricultural (9 | 11.1%), and communications (5 | 6.2%) are the most common fields of study among 81 individuals in Kandiyohi who have obtained a bachelor's degree or higher.
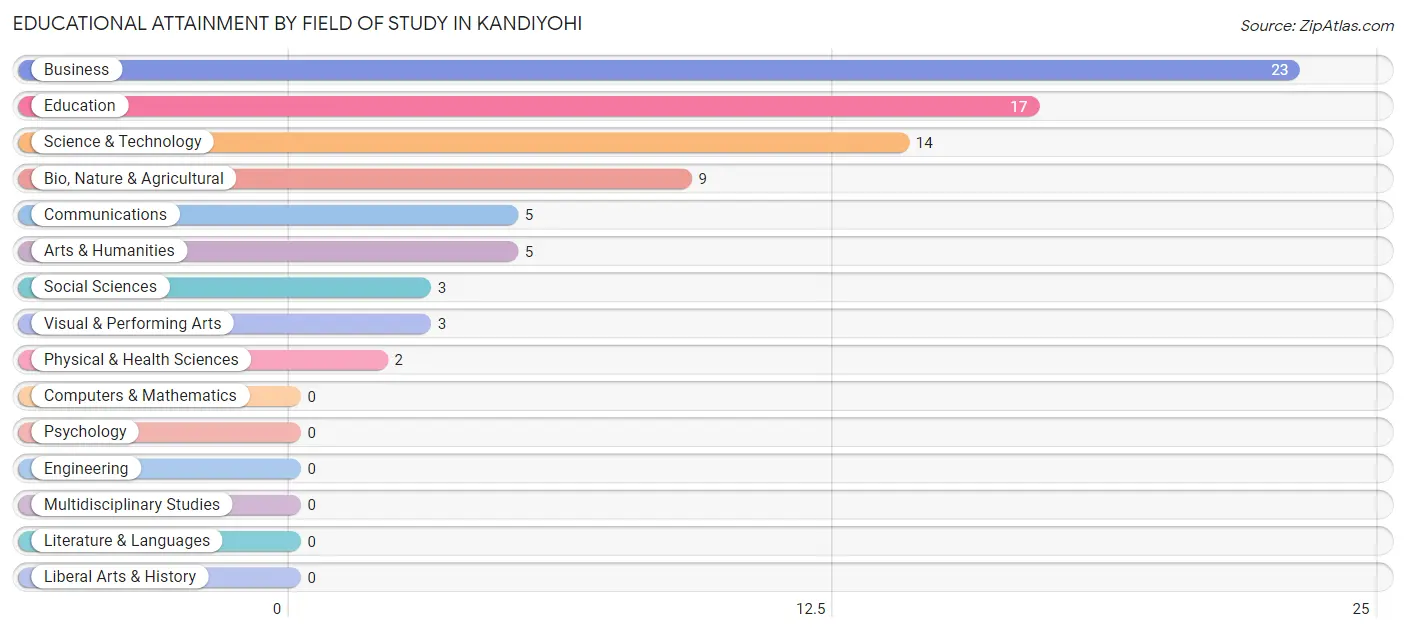
| Field of Study | # Graduates | % Graduates |
| Computers & Mathematics | 0 | 0.0% |
| Bio, Nature & Agricultural | 9 | 11.1% |
| Physical & Health Sciences | 2 | 2.5% |
| Psychology | 0 | 0.0% |
| Social Sciences | 3 | 3.7% |
| Engineering | 0 | 0.0% |
| Multidisciplinary Studies | 0 | 0.0% |
| Science & Technology | 14 | 17.3% |
| Business | 23 | 28.4% |
| Education | 17 | 21.0% |
| Literature & Languages | 0 | 0.0% |
| Liberal Arts & History | 0 | 0.0% |
| Visual & Performing Arts | 3 | 3.7% |
| Communications | 5 | 6.2% |
| Arts & Humanities | 5 | 6.2% |
| Total | 81 | 100.0% |
Transportation & Commute in Kandiyohi
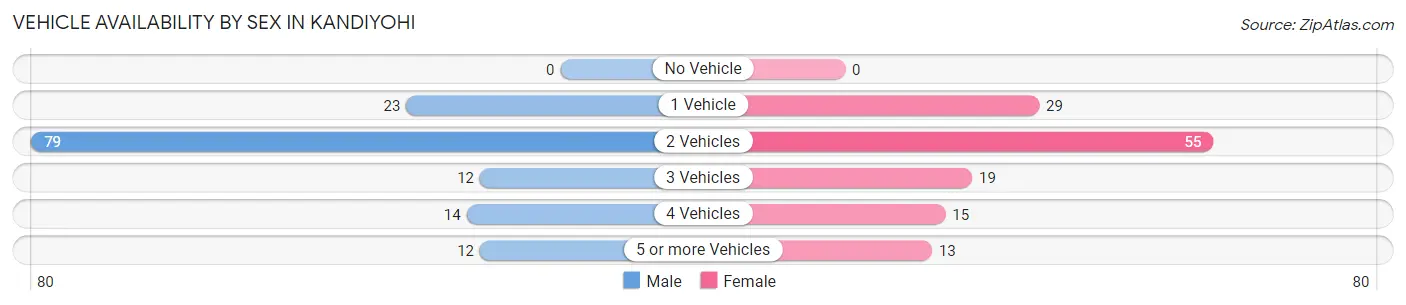
Vehicle Availability by Sex in Kandiyohi
The most prevalent vehicle ownership categories in Kandiyohi are males with 2 vehicles (79, accounting for 56.4%) and females with 2 vehicles (55, making up 60.3%).
| Vehicles Available | Male | Female |
| No Vehicle | 0 (0.0%) | 0 (0.0%) |
| 1 Vehicle | 23 (16.4%) | 29 (22.1%) |
| 2 Vehicles | 79 (56.4%) | 55 (42.0%) |
| 3 Vehicles | 12 (8.6%) | 19 (14.5%) |
| 4 Vehicles | 14 (10.0%) | 15 (11.5%) |
| 5 or more Vehicles | 12 (8.6%) | 13 (9.9%) |
| Total | 140 (100.0%) | 131 (100.0%) |
Commute Time in Kandiyohi
The most frequently occuring commute durations in Kandiyohi are 10 to 14 minutes (99 commuters, 40.9%), 15 to 19 minutes (47 commuters, 19.4%), and 20 to 24 minutes (25 commuters, 10.3%).
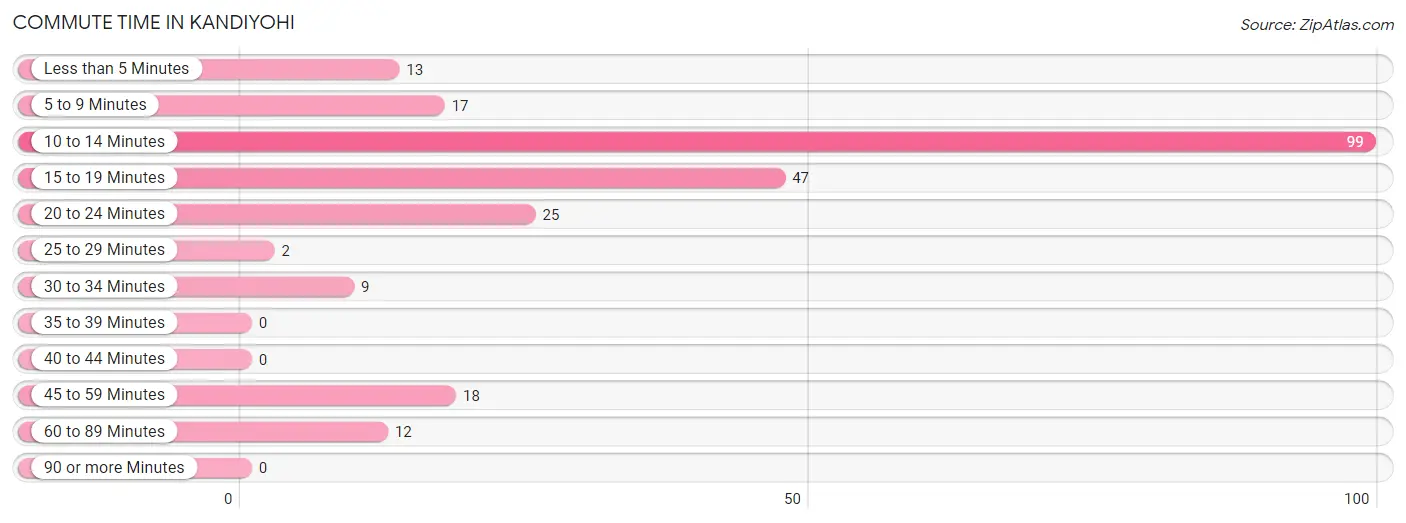
| Commute Time | # Commuters | % Commuters |
| Less than 5 Minutes | 13 | 5.4% |
| 5 to 9 Minutes | 17 | 7.0% |
| 10 to 14 Minutes | 99 | 40.9% |
| 15 to 19 Minutes | 47 | 19.4% |
| 20 to 24 Minutes | 25 | 10.3% |
| 25 to 29 Minutes | 2 | 0.8% |
| 30 to 34 Minutes | 9 | 3.7% |
| 35 to 39 Minutes | 0 | 0.0% |
| 40 to 44 Minutes | 0 | 0.0% |
| 45 to 59 Minutes | 18 | 7.4% |
| 60 to 89 Minutes | 12 | 5.0% |
| 90 or more Minutes | 0 | 0.0% |
Commute Time by Sex in Kandiyohi
The most common commute times in Kandiyohi are 10 to 14 minutes (54 commuters, 41.9%) for males and 10 to 14 minutes (45 commuters, 39.8%) for females.
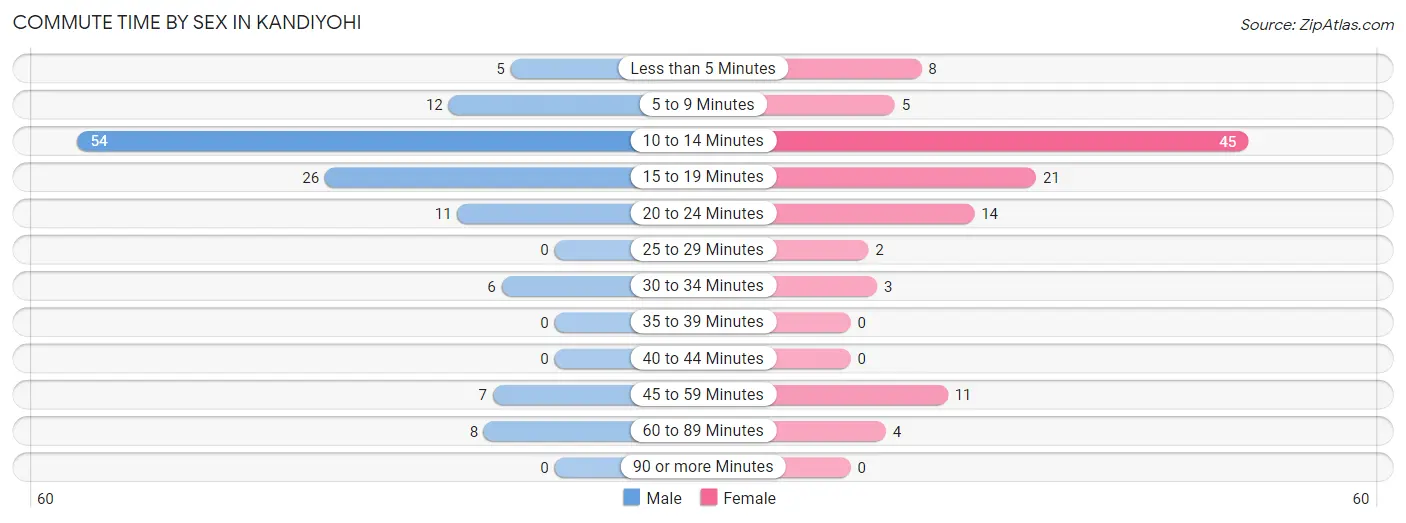
| Commute Time | Male | Female |
| Less than 5 Minutes | 5 (3.9%) | 8 (7.1%) |
| 5 to 9 Minutes | 12 (9.3%) | 5 (4.4%) |
| 10 to 14 Minutes | 54 (41.9%) | 45 (39.8%) |
| 15 to 19 Minutes | 26 (20.2%) | 21 (18.6%) |
| 20 to 24 Minutes | 11 (8.5%) | 14 (12.4%) |
| 25 to 29 Minutes | 0 (0.0%) | 2 (1.8%) |
| 30 to 34 Minutes | 6 (4.6%) | 3 (2.6%) |
| 35 to 39 Minutes | 0 (0.0%) | 0 (0.0%) |
| 40 to 44 Minutes | 0 (0.0%) | 0 (0.0%) |
| 45 to 59 Minutes | 7 (5.4%) | 11 (9.7%) |
| 60 to 89 Minutes | 8 (6.2%) | 4 (3.5%) |
| 90 or more Minutes | 0 (0.0%) | 0 (0.0%) |
Time of Departure to Work by Sex in Kandiyohi
The most frequent times of departure to work in Kandiyohi are 6:00 AM to 6:29 AM (26, 20.2%) for males and 7:30 AM to 7:59 AM (35, 31.0%) for females.
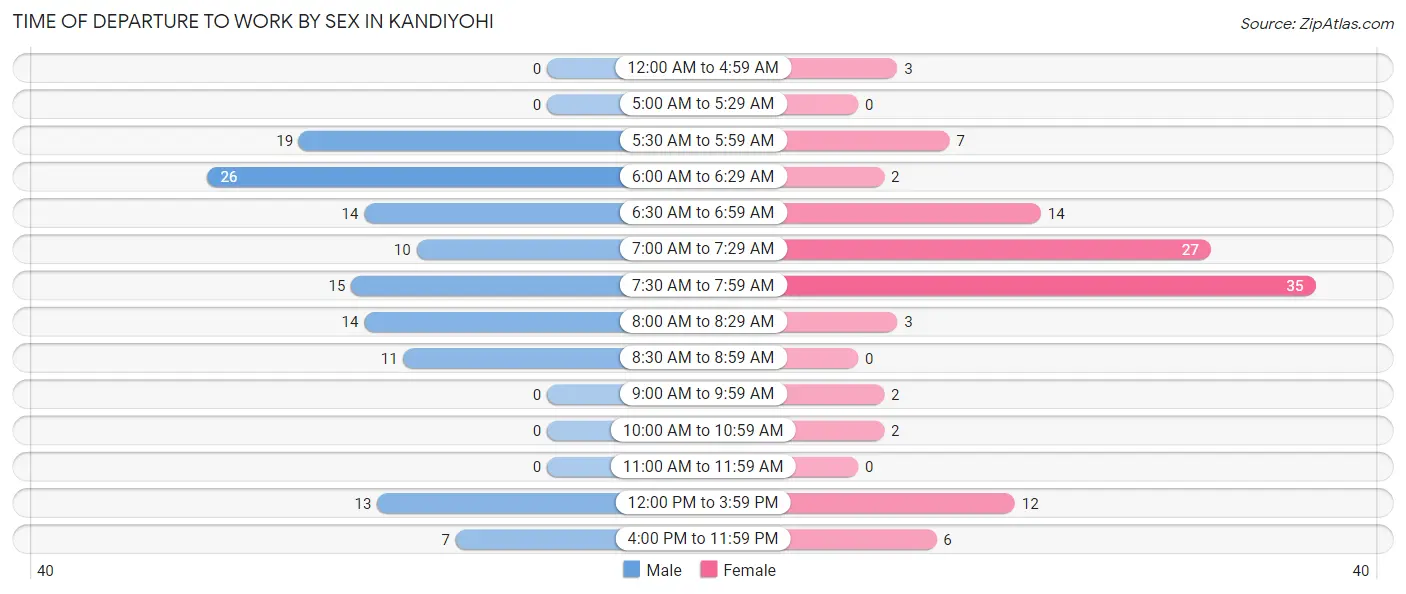
| Time of Departure | Male | Female |
| 12:00 AM to 4:59 AM | 0 (0.0%) | 3 (2.6%) |
| 5:00 AM to 5:29 AM | 0 (0.0%) | 0 (0.0%) |
| 5:30 AM to 5:59 AM | 19 (14.7%) | 7 (6.2%) |
| 6:00 AM to 6:29 AM | 26 (20.2%) | 2 (1.8%) |
| 6:30 AM to 6:59 AM | 14 (10.8%) | 14 (12.4%) |
| 7:00 AM to 7:29 AM | 10 (7.7%) | 27 (23.9%) |
| 7:30 AM to 7:59 AM | 15 (11.6%) | 35 (31.0%) |
| 8:00 AM to 8:29 AM | 14 (10.8%) | 3 (2.6%) |
| 8:30 AM to 8:59 AM | 11 (8.5%) | 0 (0.0%) |
| 9:00 AM to 9:59 AM | 0 (0.0%) | 2 (1.8%) |
| 10:00 AM to 10:59 AM | 0 (0.0%) | 2 (1.8%) |
| 11:00 AM to 11:59 AM | 0 (0.0%) | 0 (0.0%) |
| 12:00 PM to 3:59 PM | 13 (10.1%) | 12 (10.6%) |
| 4:00 PM to 11:59 PM | 7 (5.4%) | 6 (5.3%) |
| Total | 129 (100.0%) | 113 (100.0%) |
Housing Occupancy in Kandiyohi
Occupancy by Ownership in Kandiyohi
Of the total 208 dwellings in Kandiyohi, owner-occupied units account for 153 (73.6%), while renter-occupied units make up 55 (26.4%).
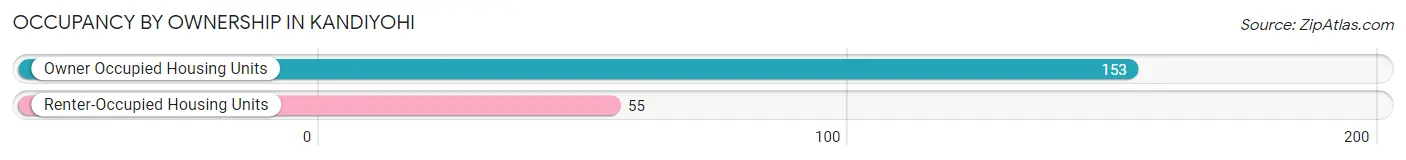
| Occupancy | # Housing Units | % Housing Units |
| Owner Occupied Housing Units | 153 | 73.6% |
| Renter-Occupied Housing Units | 55 | 26.4% |
| Total Occupied Housing Units | 208 | 100.0% |
Occupancy by Household Size in Kandiyohi
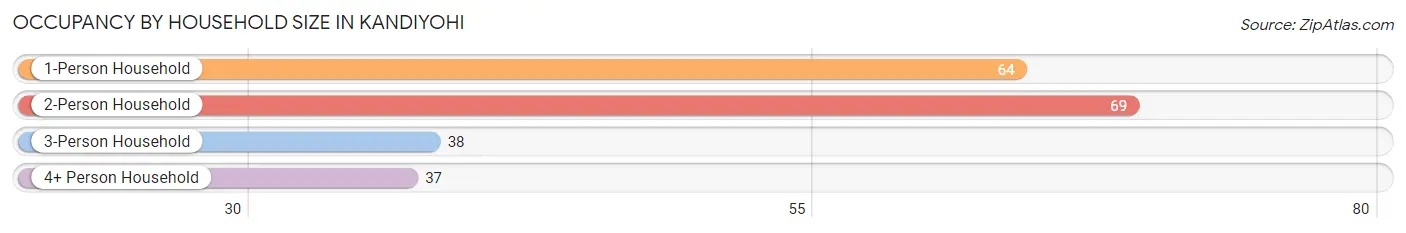
| Household Size | # Housing Units | % Housing Units |
| 1-Person Household | 64 | 30.8% |
| 2-Person Household | 69 | 33.2% |
| 3-Person Household | 38 | 18.3% |
| 4+ Person Household | 37 | 17.8% |
| Total Housing Units | 208 | 100.0% |
Occupancy by Ownership by Household Size in Kandiyohi
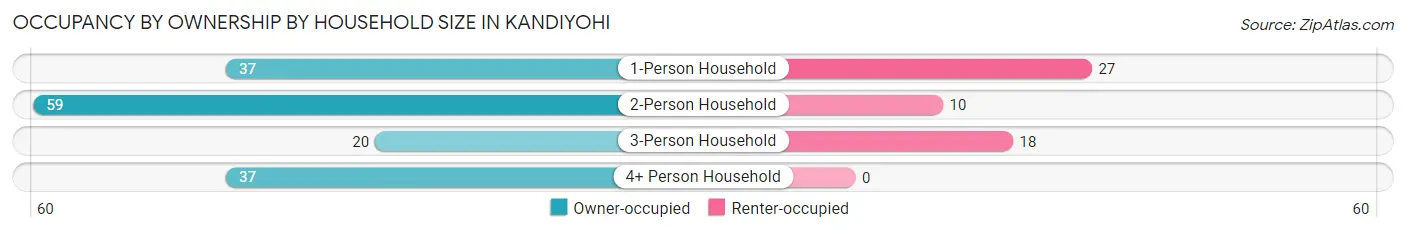
| Household Size | Owner-occupied | Renter-occupied |
| 1-Person Household | 37 (57.8%) | 27 (42.2%) |
| 2-Person Household | 59 (85.5%) | 10 (14.5%) |
| 3-Person Household | 20 (52.6%) | 18 (47.4%) |
| 4+ Person Household | 37 (100.0%) | 0 (0.0%) |
| Total Housing Units | 153 (73.6%) | 55 (26.4%) |
Occupancy by Educational Attainment in Kandiyohi
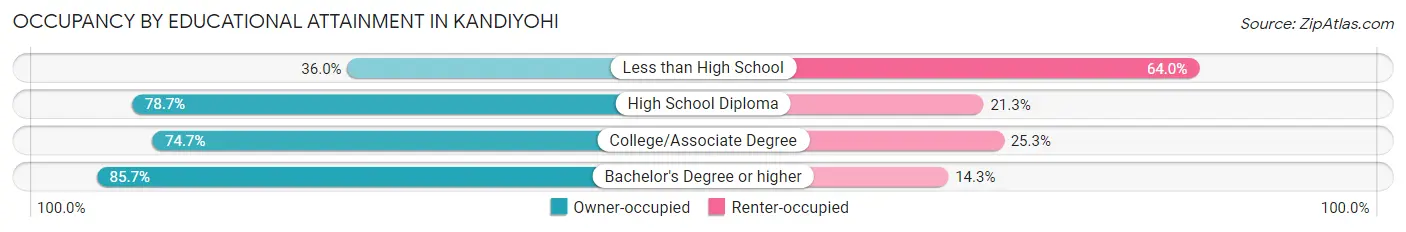
| Household Size | Owner-occupied | Renter-occupied |
| Less than High School | 9 (36.0%) | 16 (64.0%) |
| High School Diploma | 37 (78.7%) | 10 (21.3%) |
| College/Associate Degree | 65 (74.7%) | 22 (25.3%) |
| Bachelor's Degree or higher | 42 (85.7%) | 7 (14.3%) |
Occupancy by Age of Householder in Kandiyohi
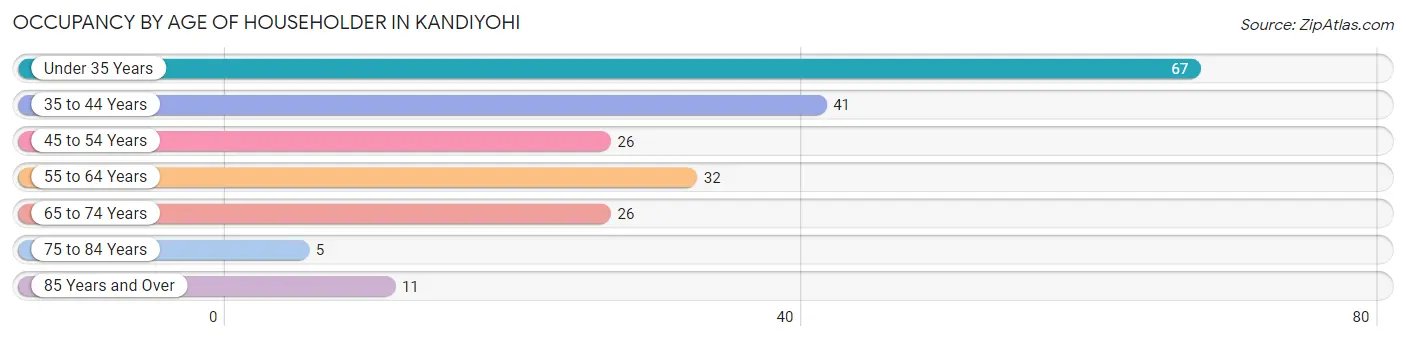
| Age Bracket | # Households | % Households |
| Under 35 Years | 67 | 32.2% |
| 35 to 44 Years | 41 | 19.7% |
| 45 to 54 Years | 26 | 12.5% |
| 55 to 64 Years | 32 | 15.4% |
| 65 to 74 Years | 26 | 12.5% |
| 75 to 84 Years | 5 | 2.4% |
| 85 Years and Over | 11 | 5.3% |
| Total | 208 | 100.0% |
Housing Finances in Kandiyohi
Median Income by Occupancy in Kandiyohi
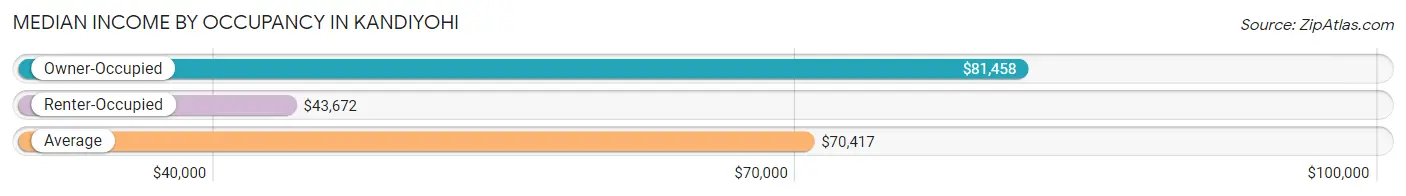
| Occupancy Type | # Households | Median Income |
| Owner-Occupied | 153 (73.6%) | $81,458 |
| Renter-Occupied | 55 (26.4%) | $43,672 |
| Average | 208 (100.0%) | $70,417 |
Occupancy by Householder Income Bracket in Kandiyohi
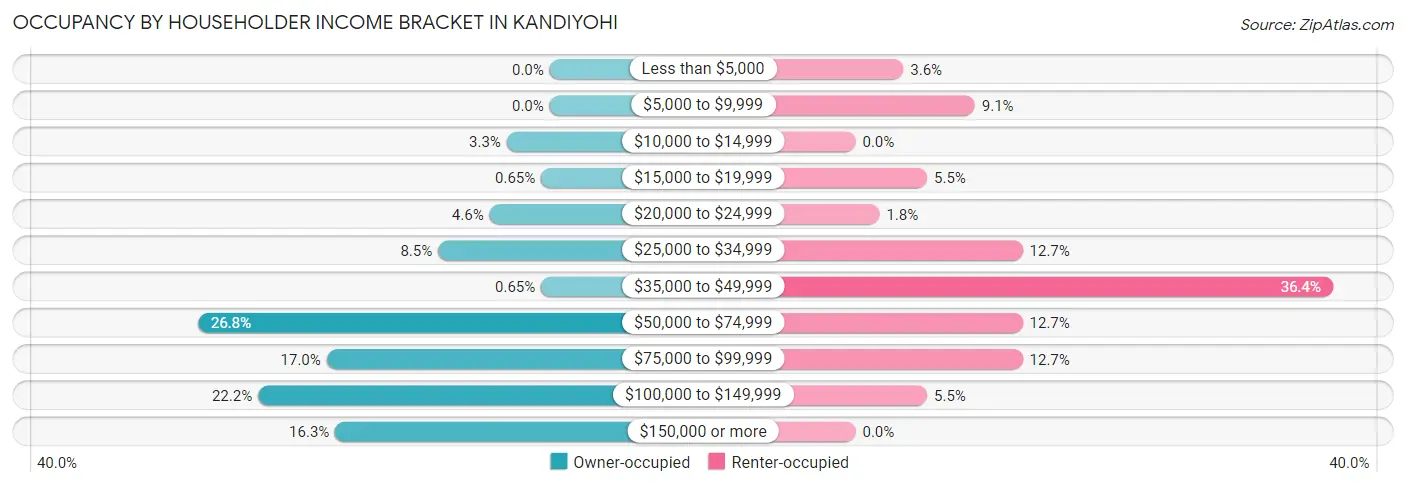
| Income Bracket | Owner-occupied | Renter-occupied |
| Less than $5,000 | 0 (0.0%) | 2 (3.6%) |
| $5,000 to $9,999 | 0 (0.0%) | 5 (9.1%) |
| $10,000 to $14,999 | 5 (3.3%) | 0 (0.0%) |
| $15,000 to $19,999 | 1 (0.6%) | 3 (5.4%) |
| $20,000 to $24,999 | 7 (4.6%) | 1 (1.8%) |
| $25,000 to $34,999 | 13 (8.5%) | 7 (12.7%) |
| $35,000 to $49,999 | 1 (0.6%) | 20 (36.4%) |
| $50,000 to $74,999 | 41 (26.8%) | 7 (12.7%) |
| $75,000 to $99,999 | 26 (17.0%) | 7 (12.7%) |
| $100,000 to $149,999 | 34 (22.2%) | 3 (5.4%) |
| $150,000 or more | 25 (16.3%) | 0 (0.0%) |
| Total | 153 (100.0%) | 55 (100.0%) |
Monthly Housing Cost Tiers in Kandiyohi
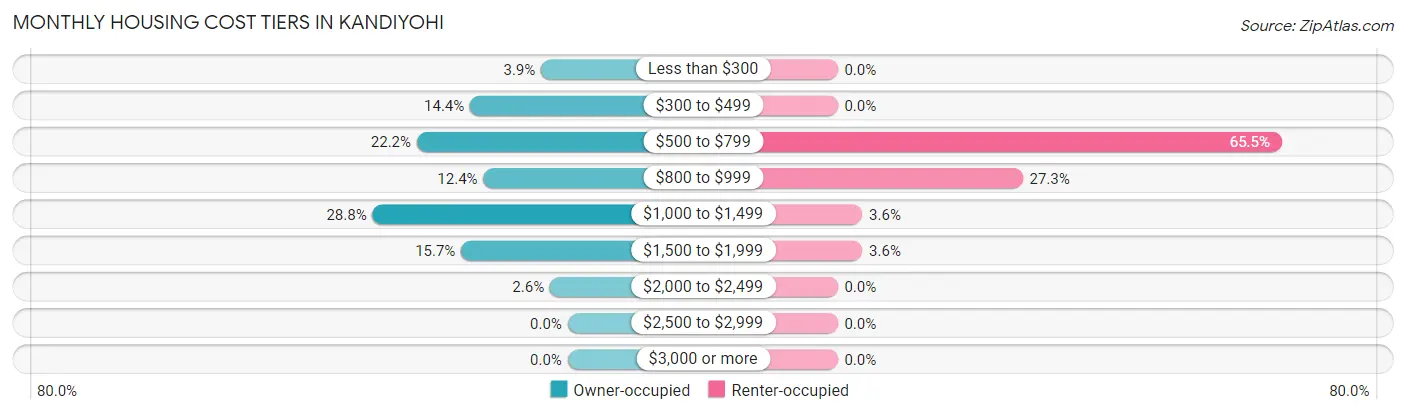
| Monthly Cost | Owner-occupied | Renter-occupied |
| Less than $300 | 6 (3.9%) | 0 (0.0%) |
| $300 to $499 | 22 (14.4%) | 0 (0.0%) |
| $500 to $799 | 34 (22.2%) | 36 (65.4%) |
| $800 to $999 | 19 (12.4%) | 15 (27.3%) |
| $1,000 to $1,499 | 44 (28.8%) | 2 (3.6%) |
| $1,500 to $1,999 | 24 (15.7%) | 2 (3.6%) |
| $2,000 to $2,499 | 4 (2.6%) | 0 (0.0%) |
| $2,500 to $2,999 | 0 (0.0%) | 0 (0.0%) |
| $3,000 or more | 0 (0.0%) | 0 (0.0%) |
| Total | 153 (100.0%) | 55 (100.0%) |
Physical Housing Characteristics in Kandiyohi
Housing Structures in Kandiyohi
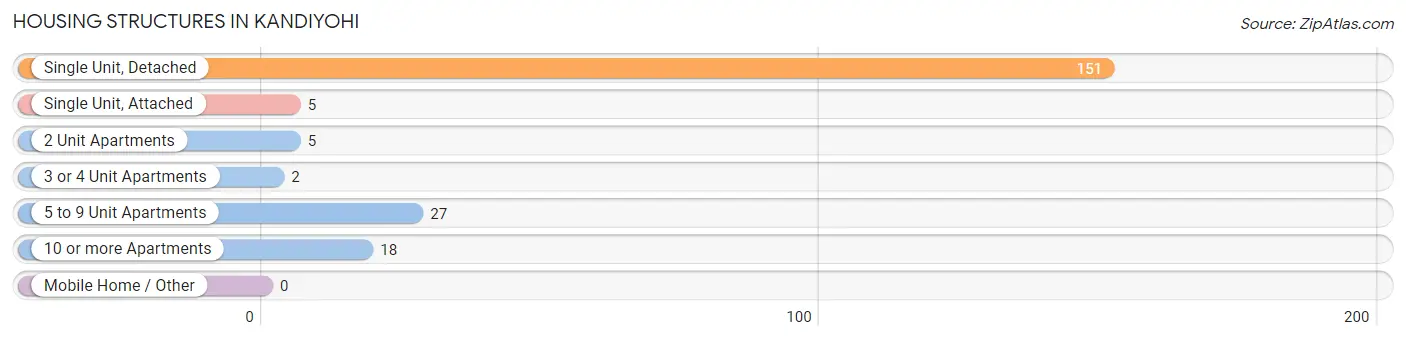
| Structure Type | # Housing Units | % Housing Units |
| Single Unit, Detached | 151 | 72.6% |
| Single Unit, Attached | 5 | 2.4% |
| 2 Unit Apartments | 5 | 2.4% |
| 3 or 4 Unit Apartments | 2 | 1.0% |
| 5 to 9 Unit Apartments | 27 | 13.0% |
| 10 or more Apartments | 18 | 8.6% |
| Mobile Home / Other | 0 | 0.0% |
| Total | 208 | 100.0% |
Housing Structures by Occupancy in Kandiyohi
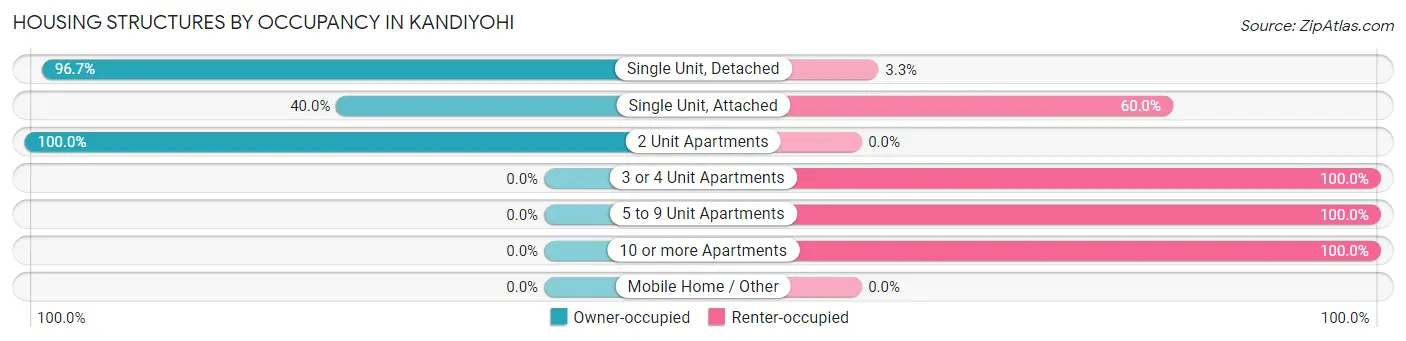
| Structure Type | Owner-occupied | Renter-occupied |
| Single Unit, Detached | 146 (96.7%) | 5 (3.3%) |
| Single Unit, Attached | 2 (40.0%) | 3 (60.0%) |
| 2 Unit Apartments | 5 (100.0%) | 0 (0.0%) |
| 3 or 4 Unit Apartments | 0 (0.0%) | 2 (100.0%) |
| 5 to 9 Unit Apartments | 0 (0.0%) | 27 (100.0%) |
| 10 or more Apartments | 0 (0.0%) | 18 (100.0%) |
| Mobile Home / Other | 0 (0.0%) | 0 (0.0%) |
| Total | 153 (73.6%) | 55 (26.4%) |
Housing Structures by Number of Rooms in Kandiyohi
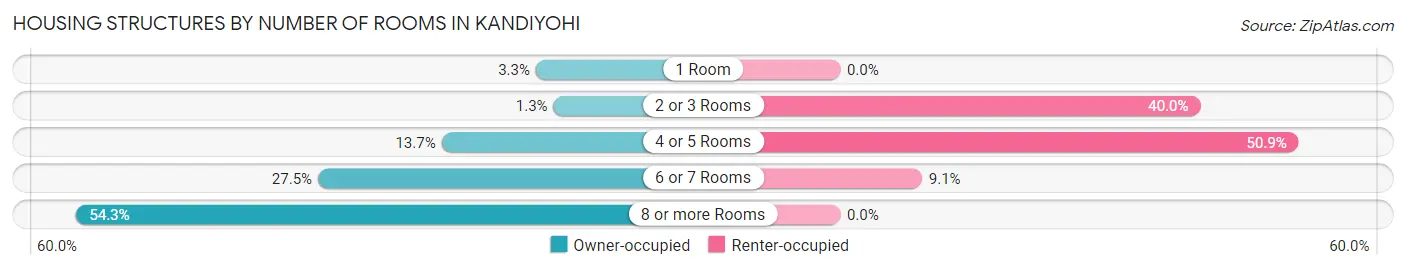
| Number of Rooms | Owner-occupied | Renter-occupied |
| 1 Room | 5 (3.3%) | 0 (0.0%) |
| 2 or 3 Rooms | 2 (1.3%) | 22 (40.0%) |
| 4 or 5 Rooms | 21 (13.7%) | 28 (50.9%) |
| 6 or 7 Rooms | 42 (27.5%) | 5 (9.1%) |
| 8 or more Rooms | 83 (54.2%) | 0 (0.0%) |
| Total | 153 (100.0%) | 55 (100.0%) |
Housing Structure by Heating Type in Kandiyohi
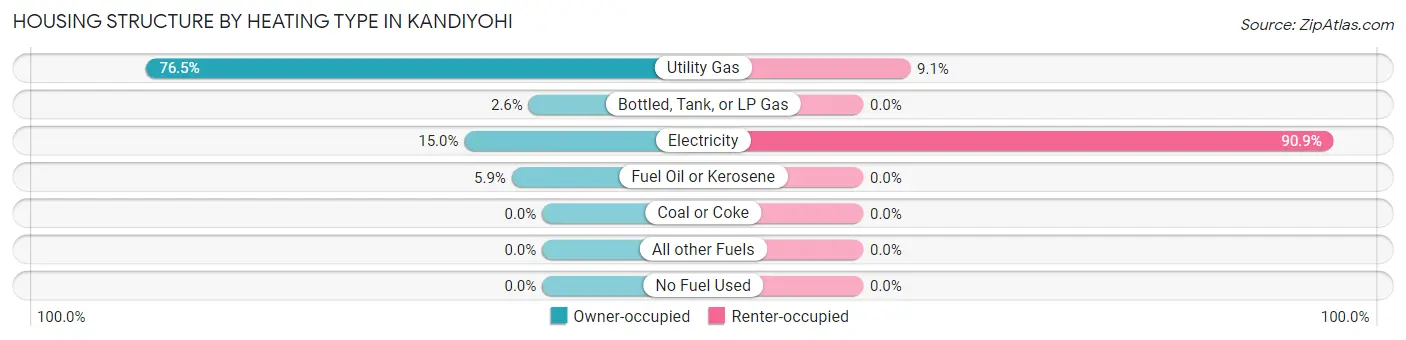
| Heating Type | Owner-occupied | Renter-occupied |
| Utility Gas | 117 (76.5%) | 5 (9.1%) |
| Bottled, Tank, or LP Gas | 4 (2.6%) | 0 (0.0%) |
| Electricity | 23 (15.0%) | 50 (90.9%) |
| Fuel Oil or Kerosene | 9 (5.9%) | 0 (0.0%) |
| Coal or Coke | 0 (0.0%) | 0 (0.0%) |
| All other Fuels | 0 (0.0%) | 0 (0.0%) |
| No Fuel Used | 0 (0.0%) | 0 (0.0%) |
| Total | 153 (100.0%) | 55 (100.0%) |
Household Vehicle Usage in Kandiyohi
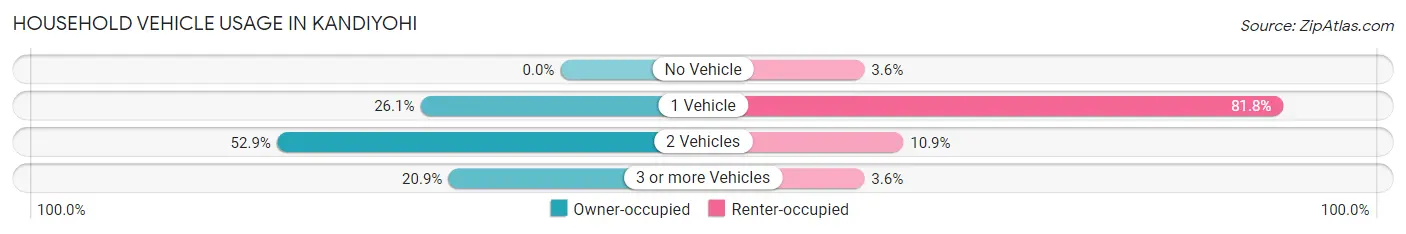
| Vehicles per Household | Owner-occupied | Renter-occupied |
| No Vehicle | 0 (0.0%) | 2 (3.6%) |
| 1 Vehicle | 40 (26.1%) | 45 (81.8%) |
| 2 Vehicles | 81 (52.9%) | 6 (10.9%) |
| 3 or more Vehicles | 32 (20.9%) | 2 (3.6%) |
| Total | 153 (100.0%) | 55 (100.0%) |
Real Estate & Mortgages in Kandiyohi
Real Estate and Mortgage Overview in Kandiyohi
| Characteristic | Without Mortgage | With Mortgage |
| Housing Units | 58 | 95 |
| Median Property Value | $121,400 | $161,600 |
| Median Household Income | $52,143 | $22 |
| Monthly Housing Costs | $521 | $0 |
| Real Estate Taxes | $1,636 | $2 |
Property Value by Mortgage Status in Kandiyohi
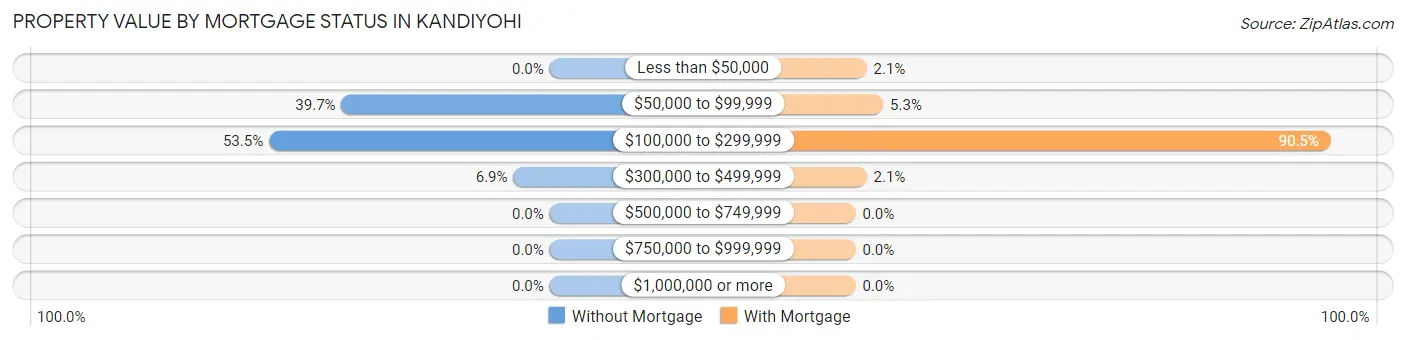
| Property Value | Without Mortgage | With Mortgage |
| Less than $50,000 | 0 (0.0%) | 2 (2.1%) |
| $50,000 to $99,999 | 23 (39.7%) | 5 (5.3%) |
| $100,000 to $299,999 | 31 (53.4%) | 86 (90.5%) |
| $300,000 to $499,999 | 4 (6.9%) | 2 (2.1%) |
| $500,000 to $749,999 | 0 (0.0%) | 0 (0.0%) |
| $750,000 to $999,999 | 0 (0.0%) | 0 (0.0%) |
| $1,000,000 or more | 0 (0.0%) | 0 (0.0%) |
| Total | 58 (100.0%) | 95 (100.0%) |
Household Income by Mortgage Status in Kandiyohi
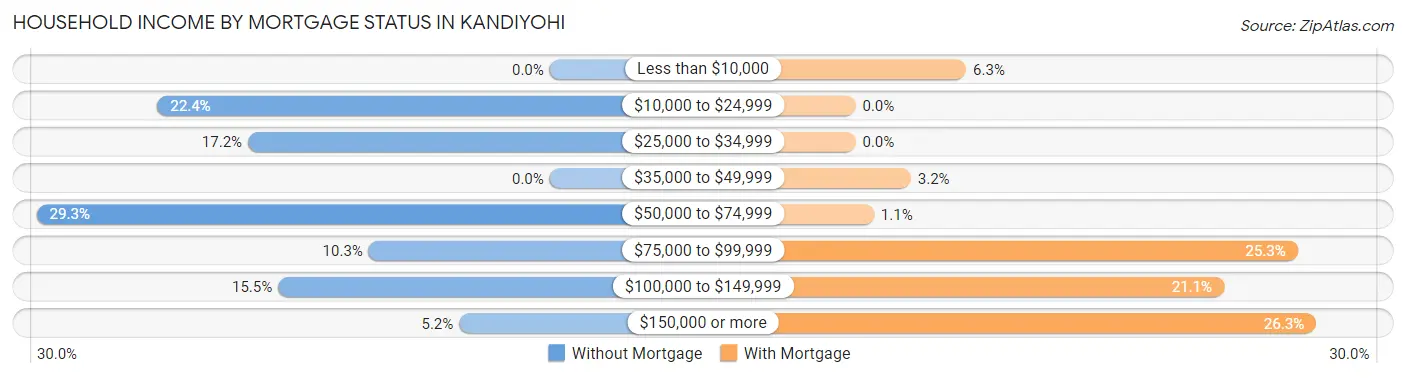
| Household Income | Without Mortgage | With Mortgage |
| Less than $10,000 | 0 (0.0%) | 6 (6.3%) |
| $10,000 to $24,999 | 13 (22.4%) | 0 (0.0%) |
| $25,000 to $34,999 | 10 (17.2%) | 0 (0.0%) |
| $35,000 to $49,999 | 0 (0.0%) | 3 (3.2%) |
| $50,000 to $74,999 | 17 (29.3%) | 1 (1.1%) |
| $75,000 to $99,999 | 6 (10.3%) | 24 (25.3%) |
| $100,000 to $149,999 | 9 (15.5%) | 20 (21.0%) |
| $150,000 or more | 3 (5.2%) | 25 (26.3%) |
| Total | 58 (100.0%) | 95 (100.0%) |
Property Value to Household Income Ratio in Kandiyohi
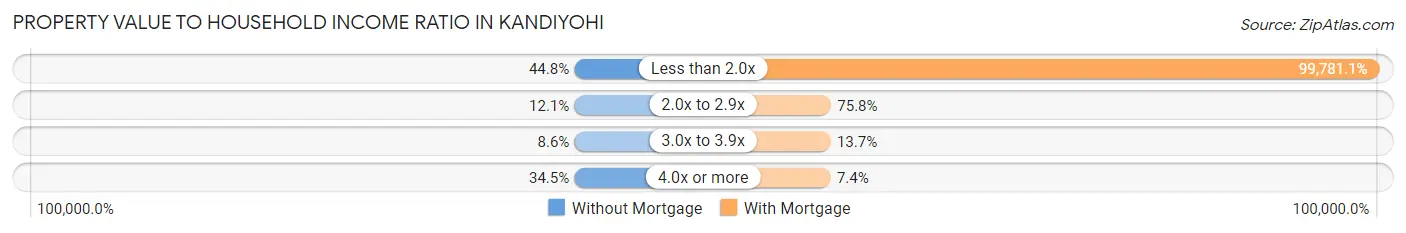
| Value-to-Income Ratio | Without Mortgage | With Mortgage |
| Less than 2.0x | 26 (44.8%) | 94,792 (99,781.1%) |
| 2.0x to 2.9x | 7 (12.1%) | 72 (75.8%) |
| 3.0x to 3.9x | 5 (8.6%) | 13 (13.7%) |
| 4.0x or more | 20 (34.5%) | 7 (7.4%) |
| Total | 58 (100.0%) | 95 (100.0%) |
Real Estate Taxes by Mortgage Status in Kandiyohi
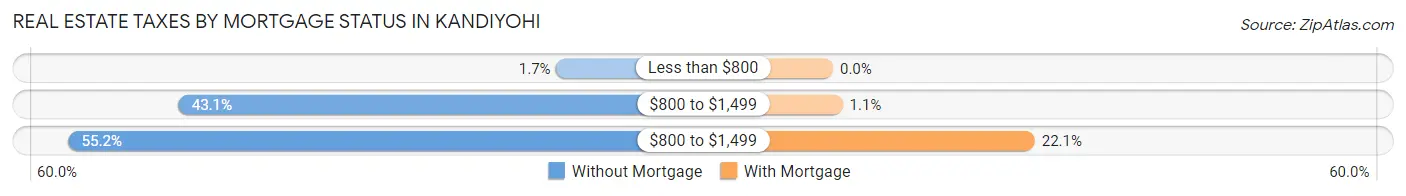
| Property Taxes | Without Mortgage | With Mortgage |
| Less than $800 | 1 (1.7%) | 0 (0.0%) |
| $800 to $1,499 | 25 (43.1%) | 1 (1.1%) |
| $800 to $1,499 | 32 (55.2%) | 21 (22.1%) |
| Total | 58 (100.0%) | 95 (100.0%) |
Health & Disability in Kandiyohi
Health Insurance Coverage by Age in Kandiyohi
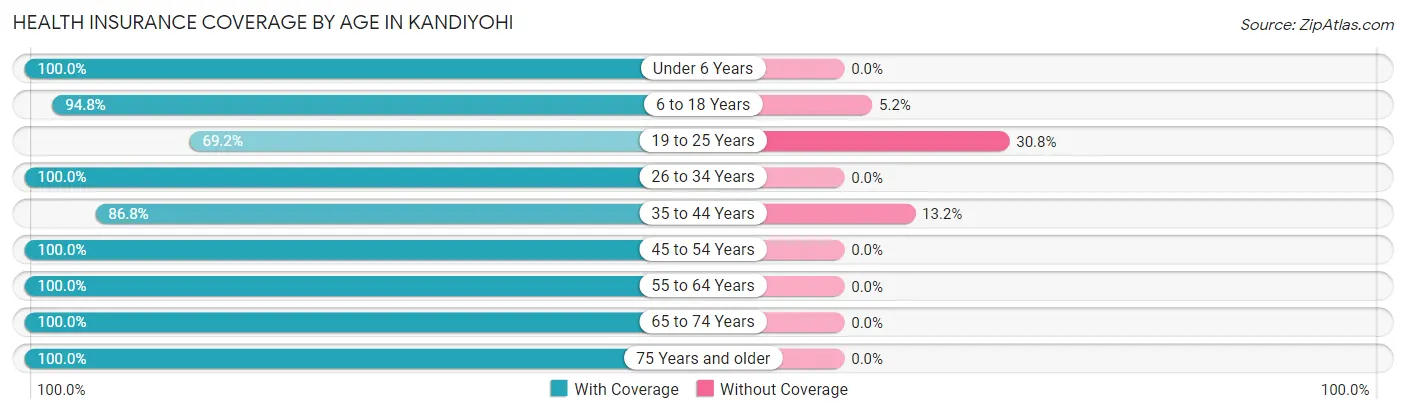
| Age Bracket | With Coverage | Without Coverage |
| Under 6 Years | 40 (100.0%) | 0 (0.0%) |
| 6 to 18 Years | 73 (94.8%) | 4 (5.2%) |
| 19 to 25 Years | 36 (69.2%) | 16 (30.8%) |
| 26 to 34 Years | 61 (100.0%) | 0 (0.0%) |
| 35 to 44 Years | 46 (86.8%) | 7 (13.2%) |
| 45 to 54 Years | 57 (100.0%) | 0 (0.0%) |
| 55 to 64 Years | 70 (100.0%) | 0 (0.0%) |
| 65 to 74 Years | 39 (100.0%) | 0 (0.0%) |
| 75 Years and older | 22 (100.0%) | 0 (0.0%) |
| Total | 444 (94.3%) | 27 (5.7%) |
Health Insurance Coverage by Citizenship Status in Kandiyohi
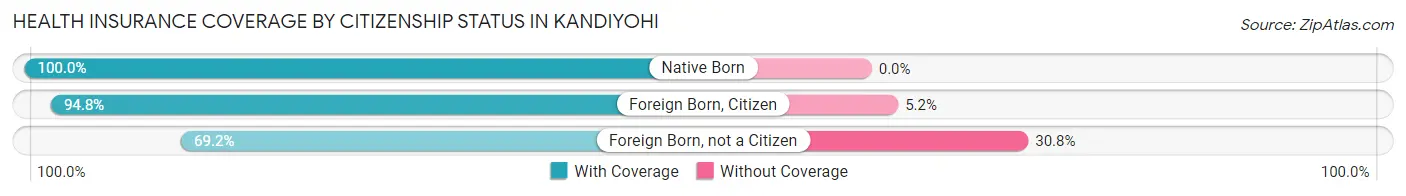
| Citizenship Status | With Coverage | Without Coverage |
| Native Born | 40 (100.0%) | 0 (0.0%) |
| Foreign Born, Citizen | 73 (94.8%) | 4 (5.2%) |
| Foreign Born, not a Citizen | 36 (69.2%) | 16 (30.8%) |
Health Insurance Coverage by Household Income in Kandiyohi
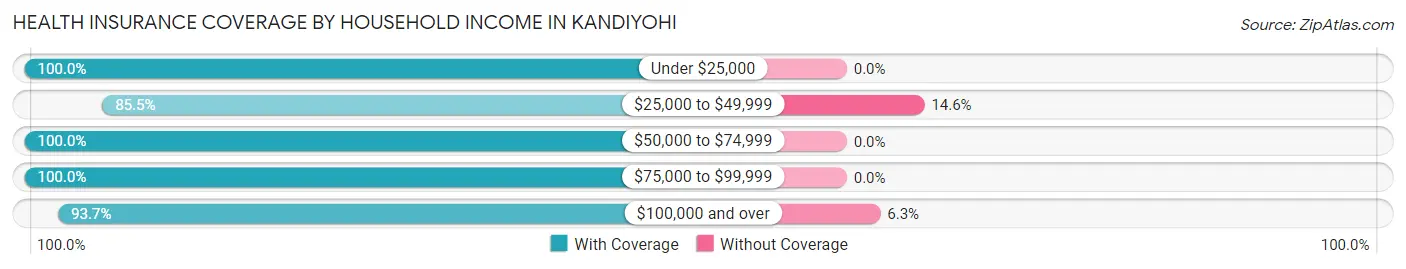
| Household Income | With Coverage | Without Coverage |
| Under $25,000 | 29 (100.0%) | 0 (0.0%) |
| $25,000 to $49,999 | 94 (85.5%) | 16 (14.5%) |
| $50,000 to $74,999 | 90 (100.0%) | 0 (0.0%) |
| $75,000 to $99,999 | 67 (100.0%) | 0 (0.0%) |
| $100,000 and over | 164 (93.7%) | 11 (6.3%) |
Public vs Private Health Insurance Coverage by Age in Kandiyohi
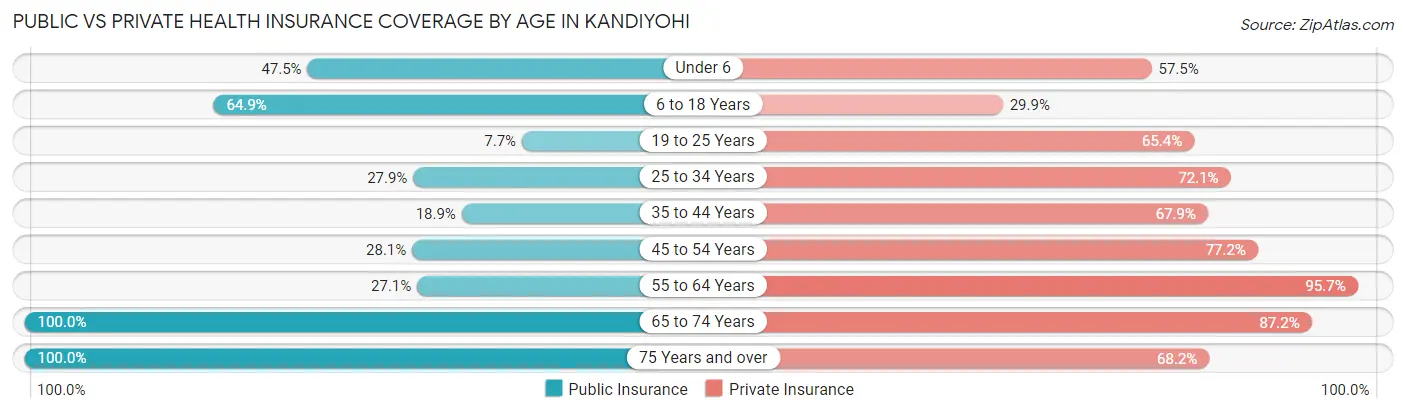
| Age Bracket | Public Insurance | Private Insurance |
| Under 6 | 19 (47.5%) | 23 (57.5%) |
| 6 to 18 Years | 50 (64.9%) | 23 (29.9%) |
| 19 to 25 Years | 4 (7.7%) | 34 (65.4%) |
| 25 to 34 Years | 17 (27.9%) | 44 (72.1%) |
| 35 to 44 Years | 10 (18.9%) | 36 (67.9%) |
| 45 to 54 Years | 16 (28.1%) | 44 (77.2%) |
| 55 to 64 Years | 19 (27.1%) | 67 (95.7%) |
| 65 to 74 Years | 39 (100.0%) | 34 (87.2%) |
| 75 Years and over | 22 (100.0%) | 15 (68.2%) |
| Total | 196 (41.6%) | 320 (67.9%) |
Disability Status by Sex by Age in Kandiyohi
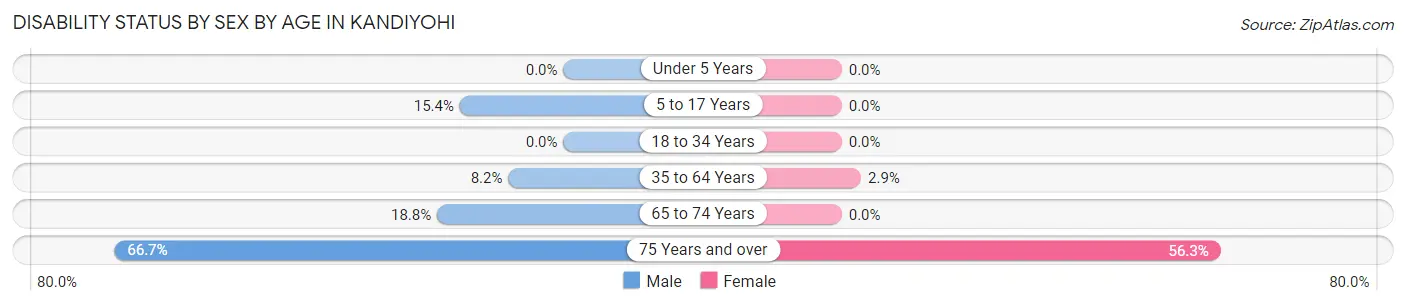
| Age Bracket | Male | Female |
| Under 5 Years | 0 (0.0%) | 0 (0.0%) |
| 5 to 17 Years | 6 (15.4%) | 0 (0.0%) |
| 18 to 34 Years | 0 (0.0%) | 0 (0.0%) |
| 35 to 64 Years | 9 (8.2%) | 2 (2.9%) |
| 65 to 74 Years | 3 (18.8%) | 0 (0.0%) |
| 75 Years and over | 4 (66.7%) | 9 (56.2%) |
Disability Class by Sex by Age in Kandiyohi
Disability Class: Hearing Difficulty
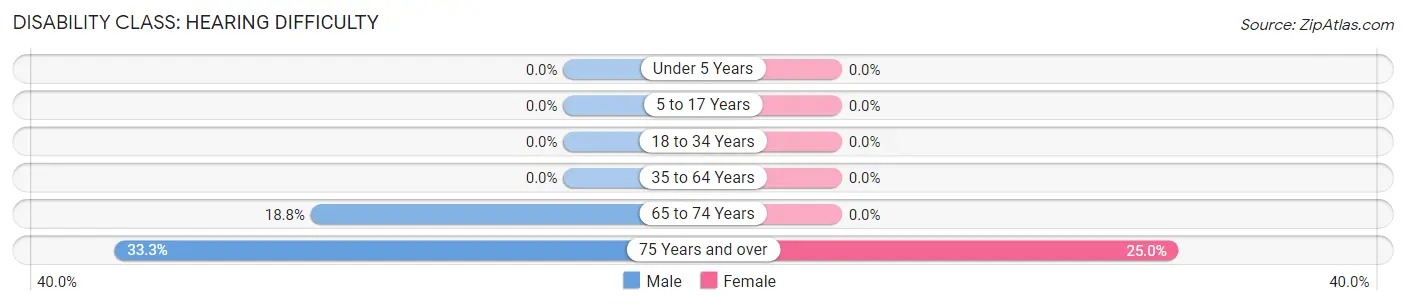
| Age Bracket | Male | Female |
| Under 5 Years | 0 (0.0%) | 0 (0.0%) |
| 5 to 17 Years | 0 (0.0%) | 0 (0.0%) |
| 18 to 34 Years | 0 (0.0%) | 0 (0.0%) |
| 35 to 64 Years | 0 (0.0%) | 0 (0.0%) |
| 65 to 74 Years | 3 (18.8%) | 0 (0.0%) |
| 75 Years and over | 2 (33.3%) | 4 (25.0%) |
Disability Class: Vision Difficulty
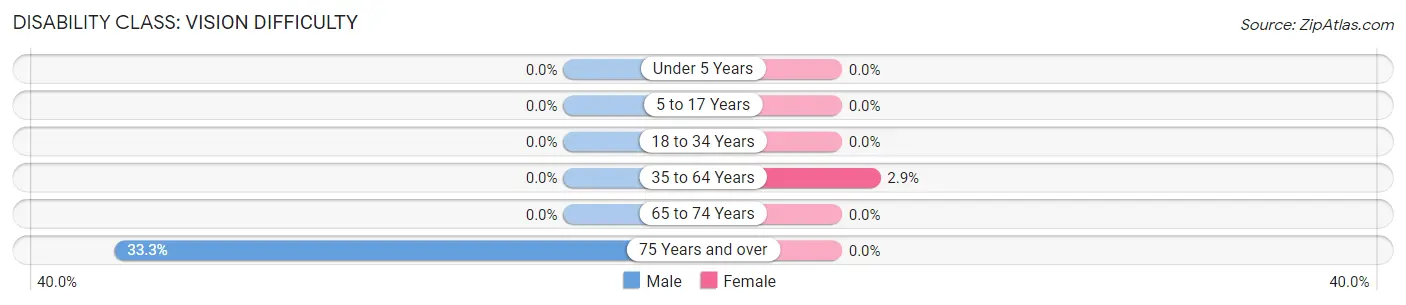
| Age Bracket | Male | Female |
| Under 5 Years | 0 (0.0%) | 0 (0.0%) |
| 5 to 17 Years | 0 (0.0%) | 0 (0.0%) |
| 18 to 34 Years | 0 (0.0%) | 0 (0.0%) |
| 35 to 64 Years | 0 (0.0%) | 2 (2.9%) |
| 65 to 74 Years | 0 (0.0%) | 0 (0.0%) |
| 75 Years and over | 2 (33.3%) | 0 (0.0%) |
Disability Class: Cognitive Difficulty
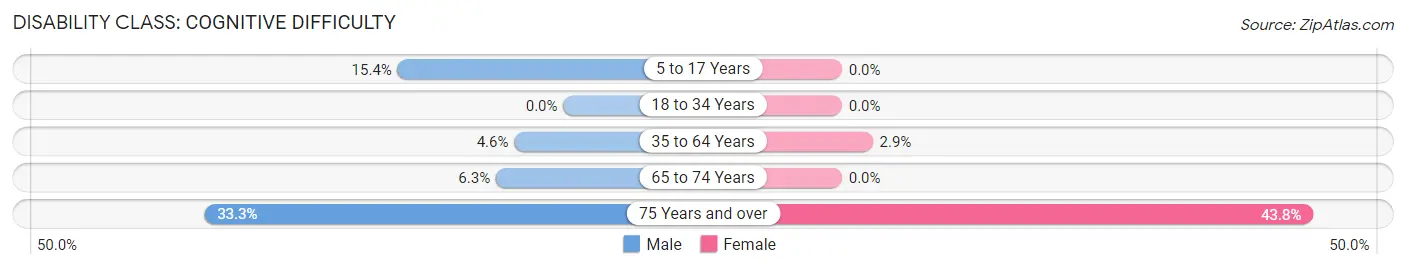
| Age Bracket | Male | Female |
| 5 to 17 Years | 6 (15.4%) | 0 (0.0%) |
| 18 to 34 Years | 0 (0.0%) | 0 (0.0%) |
| 35 to 64 Years | 5 (4.5%) | 2 (2.9%) |
| 65 to 74 Years | 1 (6.2%) | 0 (0.0%) |
| 75 Years and over | 2 (33.3%) | 7 (43.8%) |
Disability Class: Ambulatory Difficulty
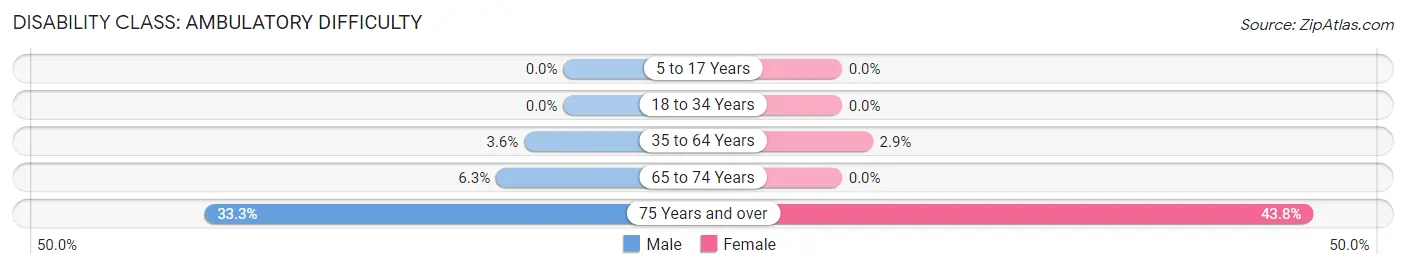
| Age Bracket | Male | Female |
| 5 to 17 Years | 0 (0.0%) | 0 (0.0%) |
| 18 to 34 Years | 0 (0.0%) | 0 (0.0%) |
| 35 to 64 Years | 4 (3.6%) | 2 (2.9%) |
| 65 to 74 Years | 1 (6.2%) | 0 (0.0%) |
| 75 Years and over | 2 (33.3%) | 7 (43.8%) |
Disability Class: Self-Care Difficulty
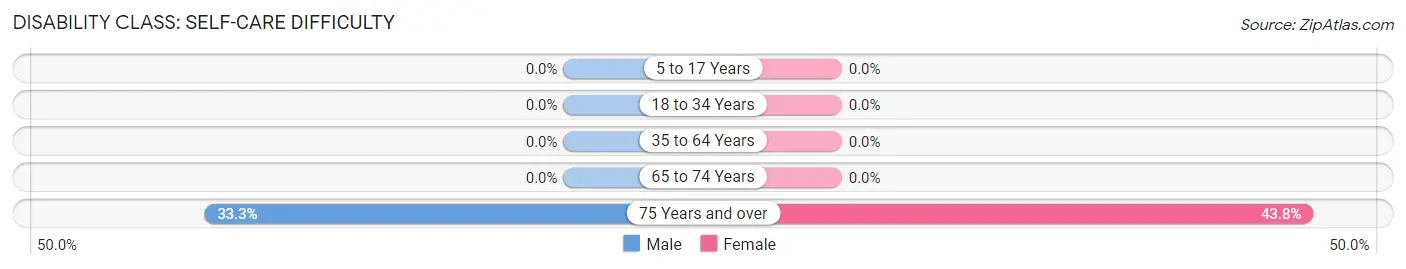
| Age Bracket | Male | Female |
| 5 to 17 Years | 0 (0.0%) | 0 (0.0%) |
| 18 to 34 Years | 0 (0.0%) | 0 (0.0%) |
| 35 to 64 Years | 0 (0.0%) | 0 (0.0%) |
| 65 to 74 Years | 0 (0.0%) | 0 (0.0%) |
| 75 Years and over | 2 (33.3%) | 7 (43.8%) |
Technology Access in Kandiyohi
Computing Device Access in Kandiyohi
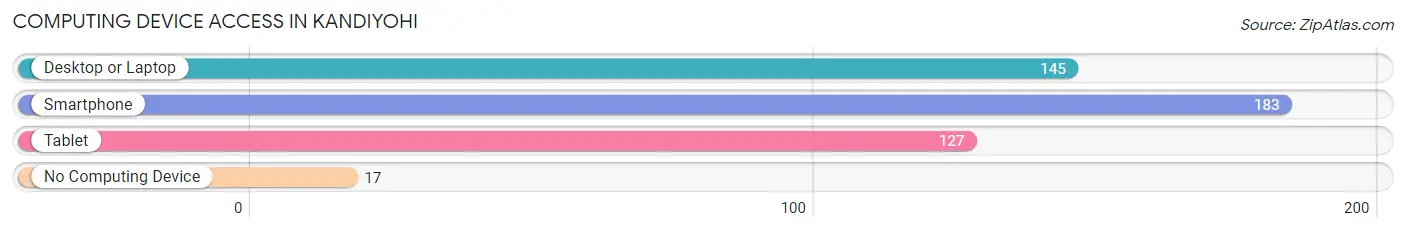
| Device Type | # Households | % Households |
| Desktop or Laptop | 145 | 69.7% |
| Smartphone | 183 | 88.0% |
| Tablet | 127 | 61.1% |
| No Computing Device | 17 | 8.2% |
| Total | 208 | 100.0% |
Internet Access in Kandiyohi
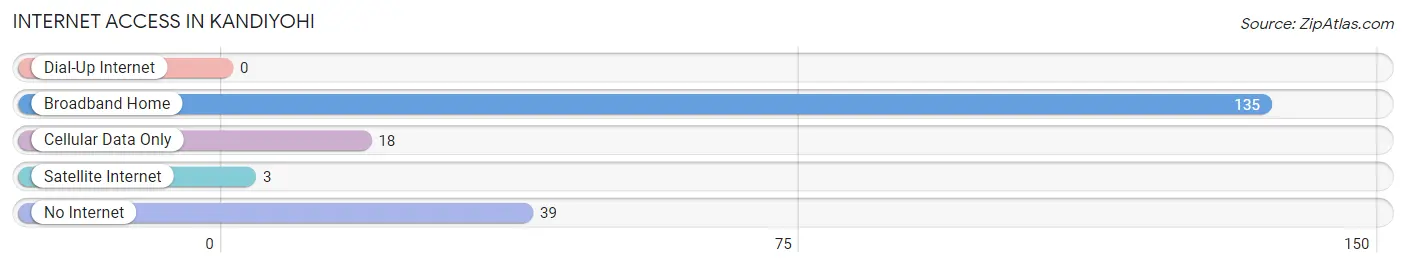
| Internet Type | # Households | % Households |
| Dial-Up Internet | 0 | 0.0% |
| Broadband Home | 135 | 64.9% |
| Cellular Data Only | 18 | 8.6% |
| Satellite Internet | 3 | 1.4% |
| No Internet | 39 | 18.8% |
| Total | 208 | 100.0% |
Kandiyohi Summary
Kandiyohi is a county located in the state of Minnesota, United States. It is part of the Willmar, MN Metropolitan Statistical Area. The county seat is Willmar. As of the 2010 census, the population was 42,239.
Geography
Kandiyohi County is located in the west-central part of Minnesota. It is bordered by Chippewa County to the north, Meeker County to the east, Stearns County to the south, and Swift County to the west. The county has a total area of 576 square miles, of which 571 square miles is land and 5.2 square miles (0.9%) is water.
The county is located in the Central Lakes region of Minnesota. The terrain is generally flat, with some rolling hills in the northern part of the county. The highest point in the county is located in the northwest corner, at an elevation of 1,092 feet. The county is drained by the Chippewa River, which flows through the center of the county.
History
Kandiyohi County was established in 1858. It was named after the Dakota word for “where the buffalo fish come.” The county was originally part of the Dakota Territory, and was later included in the Minnesota Territory.
The first settlers in the county were mostly of German and Scandinavian descent. The first permanent settlement was established in 1866. The county was organized in 1868, and the first county seat was located in Willmar.
Economy
Kandiyohi County’s economy is largely based on agriculture. The county is home to a number of large farms, and is one of the top producers of corn, soybeans, and sugar beets in the state. Other important crops include wheat, oats, barley, and hay.
The county is also home to a number of manufacturing and technology companies, including 3M, Cargill, and Jennie-O Turkey Store. The county is also home to a number of small businesses, including restaurants, retail stores, and service providers.
Demographics
As of the 2010 census, there were 42,239 people, 16,845 households, and 11,717 families residing in the county. The population density was 73.9 people per square mile. There were 17,945 housing units at an average density of 31.3 per square mile.
The racial makeup of the county was 92.2% White, 0.7% Black or African American, 0.4% Native American, 0.7% Asian, 0.1% Pacific Islander, 4.3% from other races, and 1.6% from two or more races. Hispanic or Latino of any race were 8.2% of the population.
The median income for a household in the county was $45,945, and the median income for a family was $54,945. The per capita income for the county was $22,845. About 6.2% of families and 8.7% of the population were below the poverty line, including 10.3% of those under age 18 and 8.2% of those age 65 or over.
Common Questions
What is Per Capita Income in Kandiyohi?
Per Capita income in Kandiyohi is $37,025.
What is the Median Family Income in Kandiyohi?
Median Family Income in Kandiyohi is $81,875.
What is the Median Household income in Kandiyohi?
Median Household Income in Kandiyohi is $70,417.
What is Income or Wage Gap in Kandiyohi?
Income or Wage Gap in Kandiyohi is 33.1%.
Women in Kandiyohi earn 66.9 cents for every dollar earned by a man.
What is Inequality or Gini Index in Kandiyohi?
Inequality or Gini Index in Kandiyohi is 0.38.
What is the Total Population of Kandiyohi?
Total Population of Kandiyohi is 471.
What is the Total Male Population of Kandiyohi?
Total Male Population of Kandiyohi is 251.
What is the Total Female Population of Kandiyohi?
Total Female Population of Kandiyohi is 220.
What is the Ratio of Males per 100 Females in Kandiyohi?
There are 114.09 Males per 100 Females in Kandiyohi.
What is the Ratio of Females per 100 Males in Kandiyohi?
There are 87.65 Females per 100 Males in Kandiyohi.
What is the Median Population Age in Kandiyohi?
Median Population Age in Kandiyohi is 38.5 Years.
What is the Average Family Size in Kandiyohi
Average Family Size in Kandiyohi is 2.8 People.
What is the Average Household Size in Kandiyohi
Average Household Size in Kandiyohi is 2.3 People.
How Large is the Labor Force in Kandiyohi?
There are 297 People in the Labor Forcein in Kandiyohi.
What is the Percentage of People in the Labor Force in Kandiyohi?
79.6% of People are in the Labor Force in Kandiyohi.
What is the Unemployment Rate in Kandiyohi?
Unemployment Rate in Kandiyohi is 6.7%.