Finland, MN Map & Demographics
Finland Map
Finland Overview
$33,476
PER CAPITA INCOME
$85,938
AVG FAMILY INCOME
$49,688
AVG HOUSEHOLD INCOME
0.45
INEQUALITY / GINI INDEX
177
TOTAL POPULATION
104
MALE POPULATION
73
FEMALE POPULATION
142.47
MALES / 100 FEMALES
70.19
FEMALES / 100 MALES
56.3
MEDIAN AGE
2.2
AVG FAMILY SIZE
1.5
AVG HOUSEHOLD SIZE
69
LABOR FORCE [ PEOPLE ]
40.6%
PERCENT IN LABOR FORCE
4.3%
UNEMPLOYMENT RATE
Finland Zip Codes
Finland Area Codes
Income in Finland
Income Overview in Finland
Per Capita Income in Finland is $33,476, while median incomes of families and households are $85,938 and $49,688 respectively.
| Characteristic | Number | Measure |
| Per Capita Income | 177 | $33,476 |
| Median Family Income | 39 | $85,938 |
| Mean Family Income | 39 | $88,103 |
| Median Household Income | 121 | $49,688 |
| Mean Household Income | 121 | $50,388 |
| Income Deficit | 39 | $0 |
| Wage / Income Gap (%) | 177 | 0.00% |
| Wage / Income Gap ($) | 177 | 100.00¢ per $1 |
| Gini / Inequality Index | 177 | 0.45 |
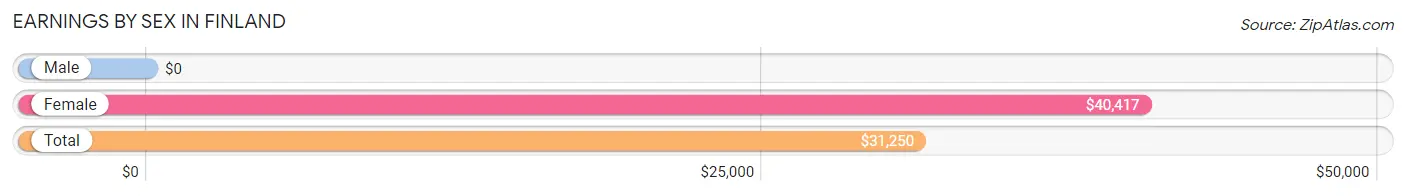
Earnings by Sex in Finland
| Sex | Number | Average Earnings |
| Male | 60 (60.0%) | $0 |
| Female | 40 (40.0%) | $40,417 |
| Total | 100 (100.0%) | $31,250 |
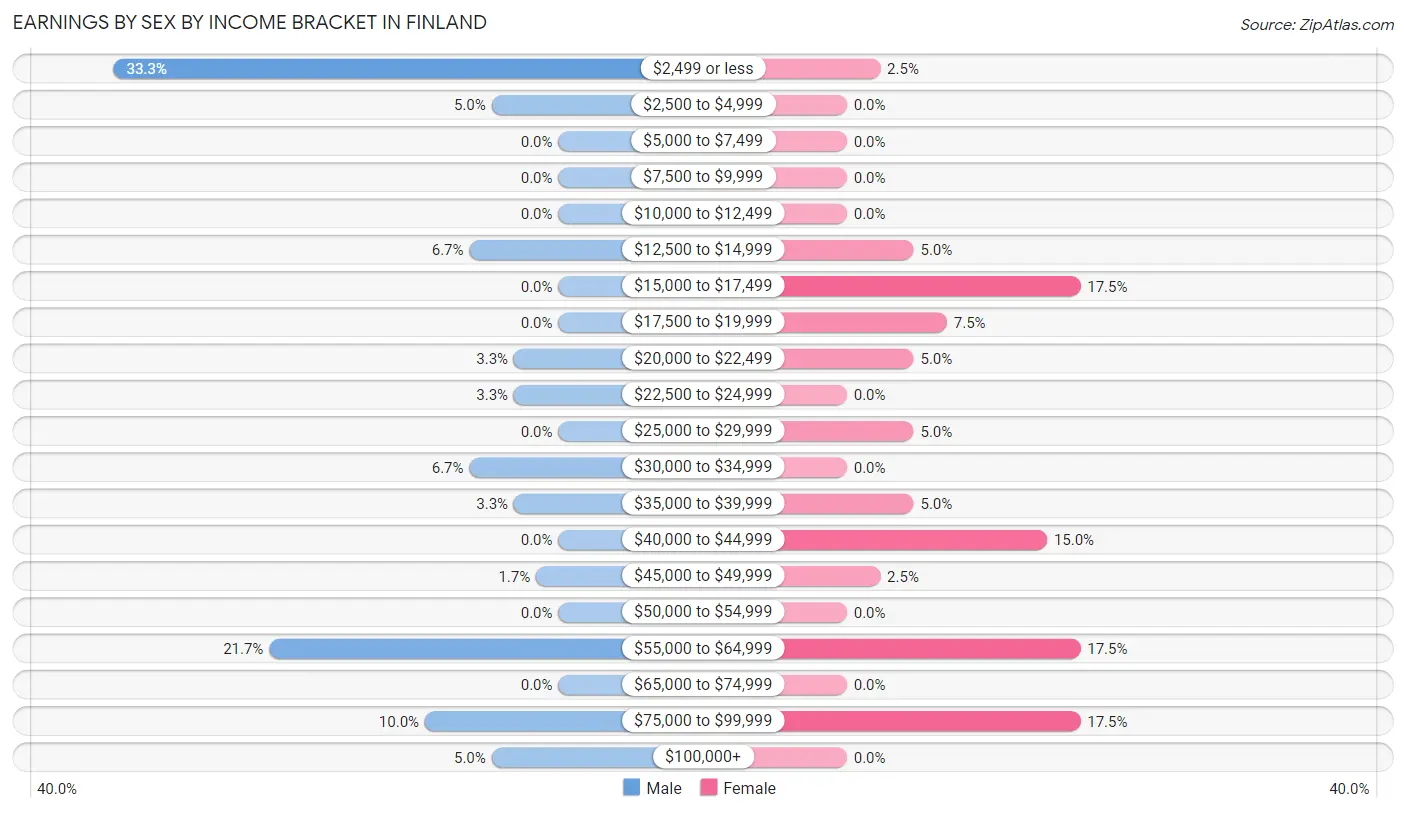
Earnings by Sex by Income Bracket in Finland
The most common earnings brackets in Finland are $2,499 or less for men (20 | 33.3%) and $15,000 to $17,499 for women (7 | 17.5%).
| Income | Male | Female |
| $2,499 or less | 20 (33.3%) | 1 (2.5%) |
| $2,500 to $4,999 | 3 (5.0%) | 0 (0.0%) |
| $5,000 to $7,499 | 0 (0.0%) | 0 (0.0%) |
| $7,500 to $9,999 | 0 (0.0%) | 0 (0.0%) |
| $10,000 to $12,499 | 0 (0.0%) | 0 (0.0%) |
| $12,500 to $14,999 | 4 (6.7%) | 2 (5.0%) |
| $15,000 to $17,499 | 0 (0.0%) | 7 (17.5%) |
| $17,500 to $19,999 | 0 (0.0%) | 3 (7.5%) |
| $20,000 to $22,499 | 2 (3.3%) | 2 (5.0%) |
| $22,500 to $24,999 | 2 (3.3%) | 0 (0.0%) |
| $25,000 to $29,999 | 0 (0.0%) | 2 (5.0%) |
| $30,000 to $34,999 | 4 (6.7%) | 0 (0.0%) |
| $35,000 to $39,999 | 2 (3.3%) | 2 (5.0%) |
| $40,000 to $44,999 | 0 (0.0%) | 6 (15.0%) |
| $45,000 to $49,999 | 1 (1.7%) | 1 (2.5%) |
| $50,000 to $54,999 | 0 (0.0%) | 0 (0.0%) |
| $55,000 to $64,999 | 13 (21.7%) | 7 (17.5%) |
| $65,000 to $74,999 | 0 (0.0%) | 0 (0.0%) |
| $75,000 to $99,999 | 6 (10.0%) | 7 (17.5%) |
| $100,000+ | 3 (5.0%) | 0 (0.0%) |
| Total | 60 (100.0%) | 40 (100.0%) |
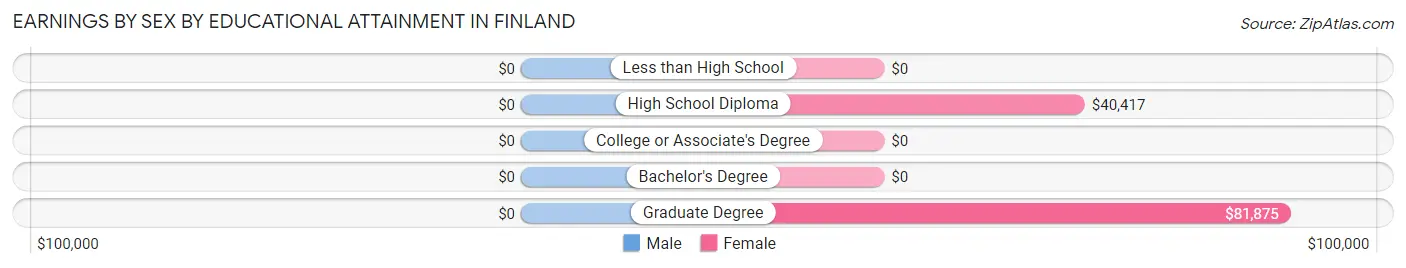
Earnings by Sex by Educational Attainment in Finland
| Educational Attainment | Male Income | Female Income |
| Less than High School | - | - |
| High School Diploma | - | - |
| College or Associate's Degree | - | - |
| Bachelor's Degree | - | - |
| Graduate Degree | - | - |
| Total | - | - |
Family Income in Finland
Family Income Brackets in Finland
According to the Finland family income data, there are 14 families falling into the $100,000 to $149,999 income range, which is the most common income bracket and makes up 35.9% of all families.
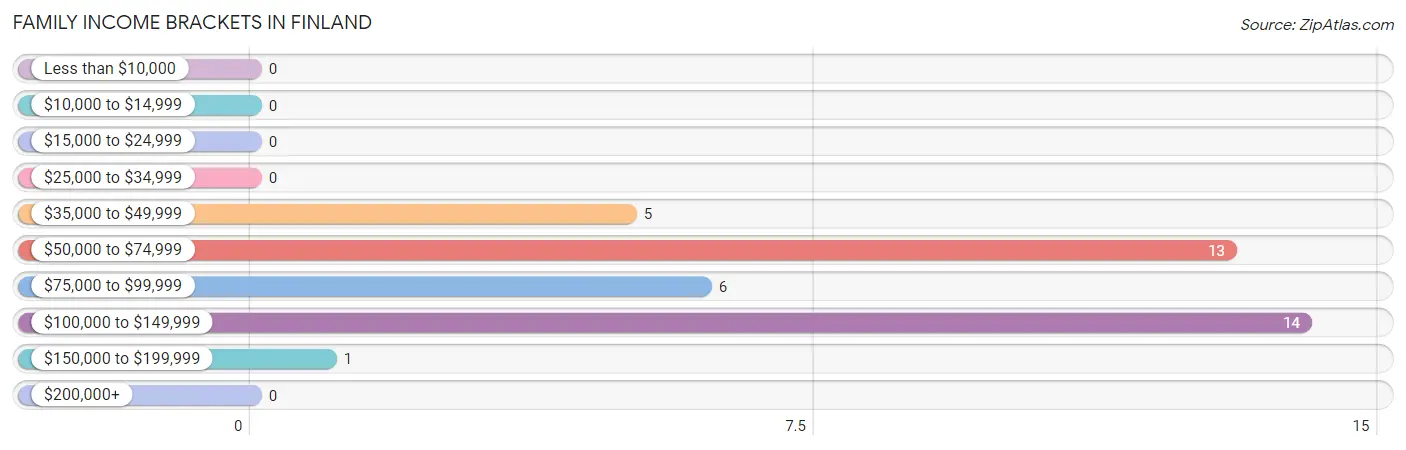
| Income Bracket | # Families | % Families |
| Less than $10,000 | 0 | 0.0% |
| $10,000 to $14,999 | 0 | 0.0% |
| $15,000 to $24,999 | 0 | 0.0% |
| $25,000 to $34,999 | 0 | 0.0% |
| $35,000 to $49,999 | 5 | 12.8% |
| $50,000 to $74,999 | 13 | 33.3% |
| $75,000 to $99,999 | 6 | 15.4% |
| $100,000 to $149,999 | 14 | 35.9% |
| $150,000 to $199,999 | 1 | 2.6% |
| $200,000+ | 0 | 0.0% |
Family Income by Famaliy Size in Finland
2-person families (31 | 79.5%) account for the highest median family income in Finland with $69,531 per family, while 2-person families (31 | 79.5%) have the highest median income of $34,766 per family member.
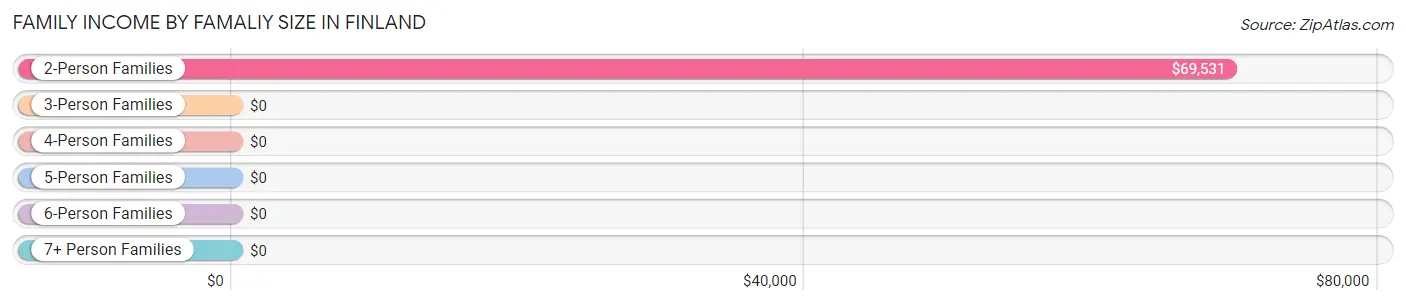
| Income Bracket | # Families | Median Income |
| 2-Person Families | 31 (79.5%) | $69,531 |
| 3-Person Families | 4 (10.3%) | $0 |
| 4-Person Families | 3 (7.7%) | $0 |
| 5-Person Families | 1 (2.6%) | $0 |
| 6-Person Families | 0 (0.0%) | $0 |
| 7+ Person Families | 0 (0.0%) | $0 |
| Total | 39 (100.0%) | $85,938 |
Family Income by Number of Earners in Finland
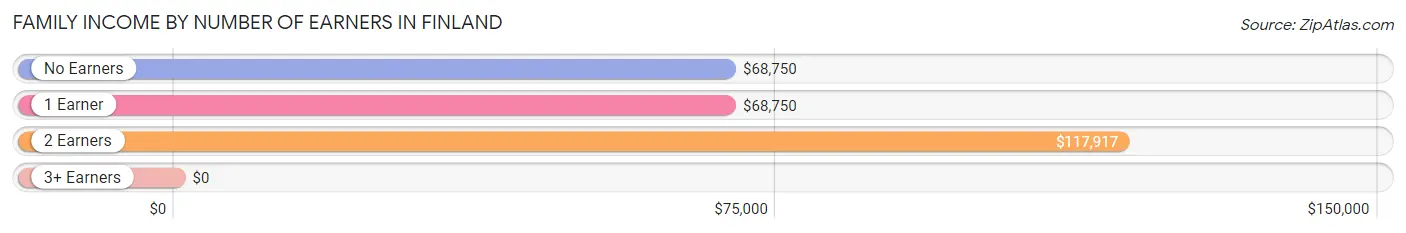
| Number of Earners | # Families | Median Income |
| No Earners | 10 (25.6%) | $68,750 |
| 1 Earner | 14 (35.9%) | $68,750 |
| 2 Earners | 15 (38.5%) | $117,917 |
| 3+ Earners | 0 (0.0%) | $0 |
| Total | 39 (100.0%) | $85,938 |
Household Income in Finland
Household Income Brackets in Finland
With 34 households falling in the category, the $50,000 to $74,999 income range is the most frequent in Finland, accounting for 28.1% of all households.
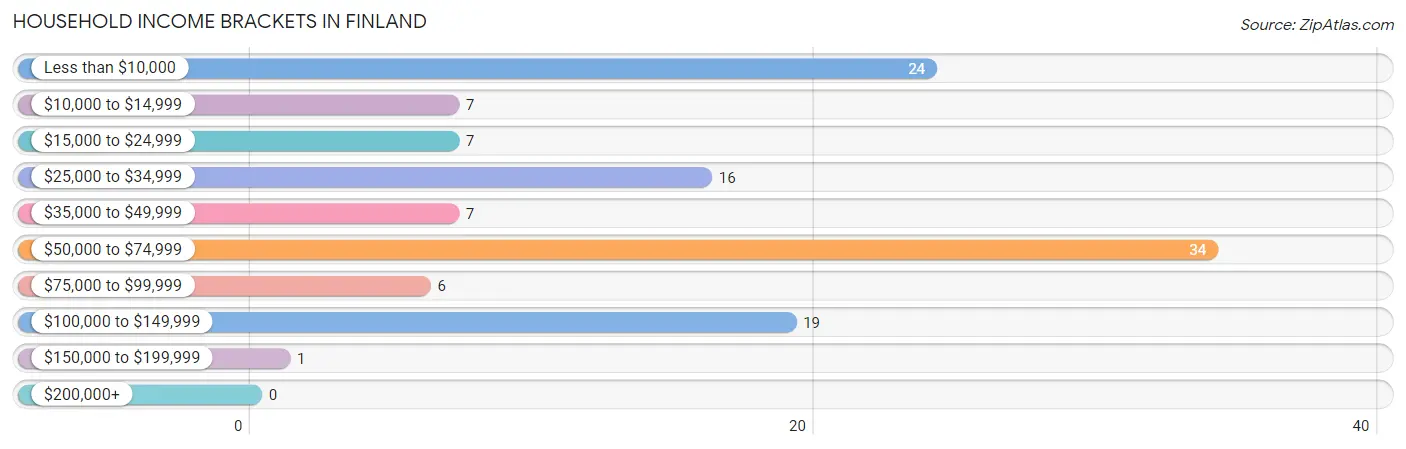
| Income Bracket | # Households | % Households |
| Less than $10,000 | 24 | 19.8% |
| $10,000 to $14,999 | 7 | 5.8% |
| $15,000 to $24,999 | 7 | 5.8% |
| $25,000 to $34,999 | 16 | 13.2% |
| $35,000 to $49,999 | 7 | 5.8% |
| $50,000 to $74,999 | 34 | 28.1% |
| $75,000 to $99,999 | 6 | 5.0% |
| $100,000 to $149,999 | 19 | 15.7% |
| $150,000 to $199,999 | 1 | 0.8% |
| $200,000+ | 0 | 0.0% |
Household Income by Householder Age in Finland
The median household income in Finland is $49,688, with the highest median household income of $62,727 found in the 25 to 44 years age bracket for the primary householder. A total of 32 households (26.5%) fall into this category.
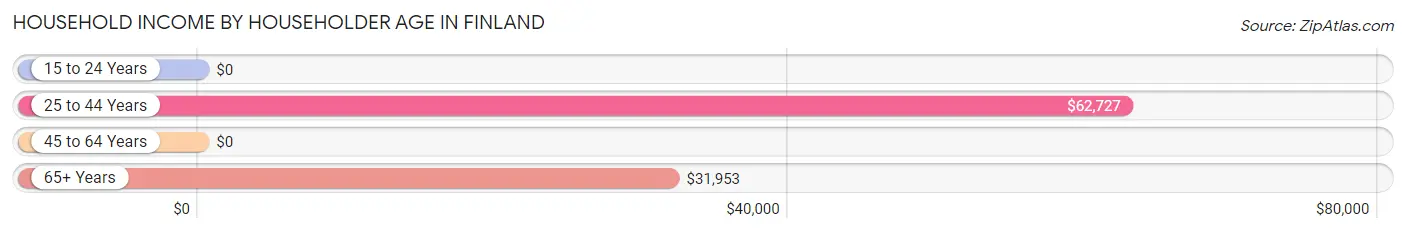
| Income Bracket | # Households | Median Income |
| 15 to 24 Years | 0 (0.0%) | $0 |
| 25 to 44 Years | 32 (26.5%) | $62,727 |
| 45 to 64 Years | 58 (47.9%) | $0 |
| 65+ Years | 31 (25.6%) | $31,953 |
| Total | 121 (100.0%) | $49,688 |
Poverty in Finland
Income Below Poverty by Sex and Age in Finland
With 36.5% poverty level for males and 4.1% for females among the residents of Finland, 35 to 44 year old males and 75 year old and over females are the most vulnerable to poverty, with 13 males (92.9%) and 3 females (60.0%) in their respective age groups living below the poverty level.
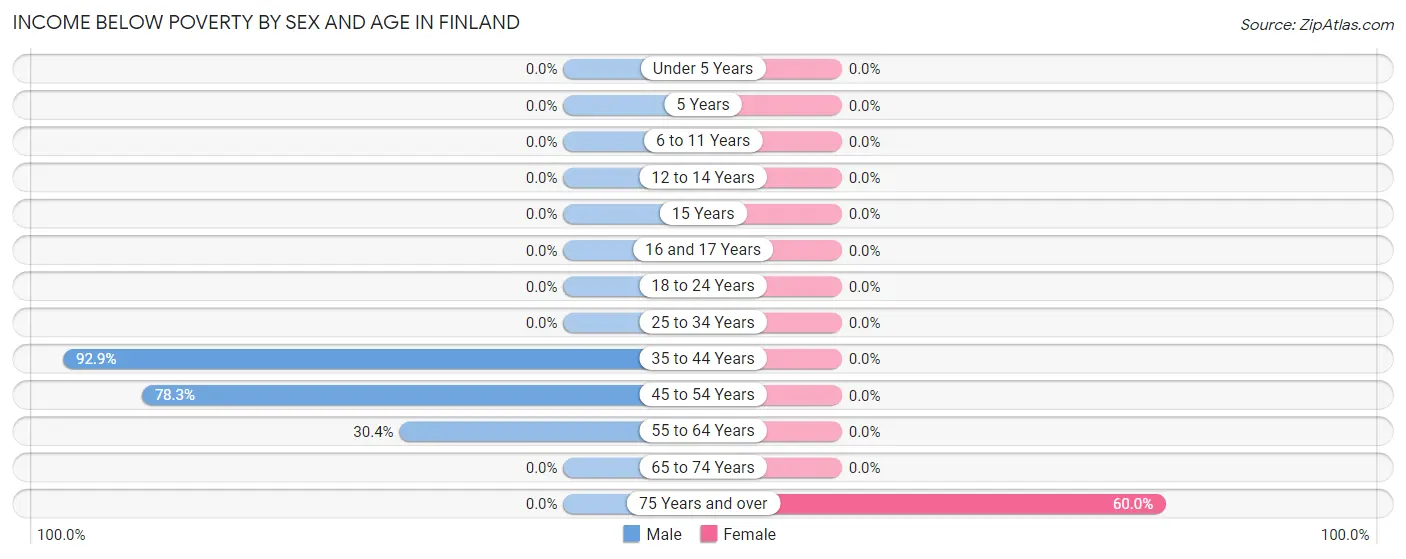
| Age Bracket | Male | Female |
| Under 5 Years | 0 (0.0%) | 0 (0.0%) |
| 5 Years | 0 (0.0%) | 0 (0.0%) |
| 6 to 11 Years | 0 (0.0%) | 0 (0.0%) |
| 12 to 14 Years | 0 (0.0%) | 0 (0.0%) |
| 15 Years | 0 (0.0%) | 0 (0.0%) |
| 16 and 17 Years | 0 (0.0%) | 0 (0.0%) |
| 18 to 24 Years | 0 (0.0%) | 0 (0.0%) |
| 25 to 34 Years | 0 (0.0%) | 0 (0.0%) |
| 35 to 44 Years | 13 (92.9%) | 0 (0.0%) |
| 45 to 54 Years | 18 (78.3%) | 0 (0.0%) |
| 55 to 64 Years | 7 (30.4%) | 0 (0.0%) |
| 65 to 74 Years | 0 (0.0%) | 0 (0.0%) |
| 75 Years and over | 0 (0.0%) | 3 (60.0%) |
| Total | 38 (36.5%) | 3 (4.1%) |
Income Above Poverty by Sex and Age in Finland
According to the poverty statistics in Finland, males aged 6 to 11 years and females aged 6 to 11 years are the age groups that are most secure financially, with 100.0% of males and 100.0% of females in these age groups living above the poverty line.
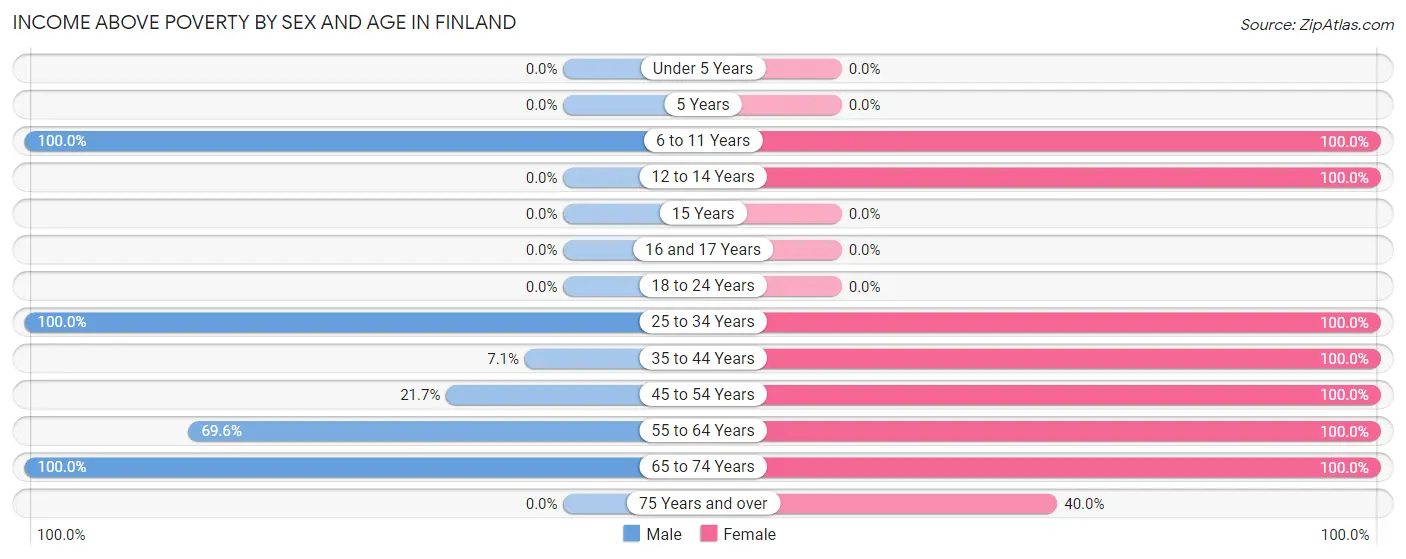
| Age Bracket | Male | Female |
| Under 5 Years | 0 (0.0%) | 0 (0.0%) |
| 5 Years | 0 (0.0%) | 0 (0.0%) |
| 6 to 11 Years | 2 (100.0%) | 2 (100.0%) |
| 12 to 14 Years | 0 (0.0%) | 3 (100.0%) |
| 15 Years | 0 (0.0%) | 0 (0.0%) |
| 16 and 17 Years | 0 (0.0%) | 0 (0.0%) |
| 18 to 24 Years | 0 (0.0%) | 0 (0.0%) |
| 25 to 34 Years | 13 (100.0%) | 12 (100.0%) |
| 35 to 44 Years | 1 (7.1%) | 10 (100.0%) |
| 45 to 54 Years | 5 (21.7%) | 2 (100.0%) |
| 55 to 64 Years | 16 (69.6%) | 33 (100.0%) |
| 65 to 74 Years | 29 (100.0%) | 6 (100.0%) |
| 75 Years and over | 0 (0.0%) | 2 (40.0%) |
| Total | 66 (63.5%) | 70 (95.9%) |
Income Below Poverty Among Married-Couple Families in Finland
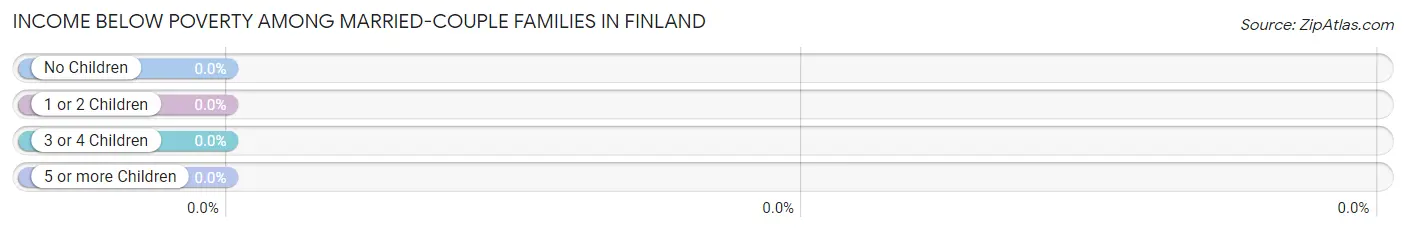
| Children | Above Poverty | Below Poverty |
| No Children | 35 (100.0%) | 0 (0.0%) |
| 1 or 2 Children | 3 (100.0%) | 0 (0.0%) |
| 3 or 4 Children | 1 (100.0%) | 0 (0.0%) |
| 5 or more Children | 0 (0.0%) | 0 (0.0%) |
| Total | 39 (100.0%) | 0 (0.0%) |
Income Below Poverty Among Single-Parent Households in Finland
| Children | Single Father | Single Mother |
| No Children | 0 (0.0%) | 0 (0.0%) |
| 1 or 2 Children | 0 (0.0%) | 0 (0.0%) |
| 3 or 4 Children | 0 (0.0%) | 0 (0.0%) |
| 5 or more Children | 0 (0.0%) | 0 (0.0%) |
| Total | 0 (0.0%) | 0 (0.0%) |
Income Below Poverty Among Married-Couple vs Single-Parent Households in Finland
| Children | Married-Couple Families | Single-Parent Households |
| No Children | 0 (0.0%) | 0 (0.0%) |
| 1 or 2 Children | 0 (0.0%) | 0 (0.0%) |
| 3 or 4 Children | 0 (0.0%) | 0 (0.0%) |
| 5 or more Children | 0 (0.0%) | 0 (0.0%) |
| Total | 0 (0.0%) | 0 (0.0%) |
Race in Finland
The most populous races in Finland are White / Caucasian (166 | 93.8%), and Two or more Races (11 | 6.2%).
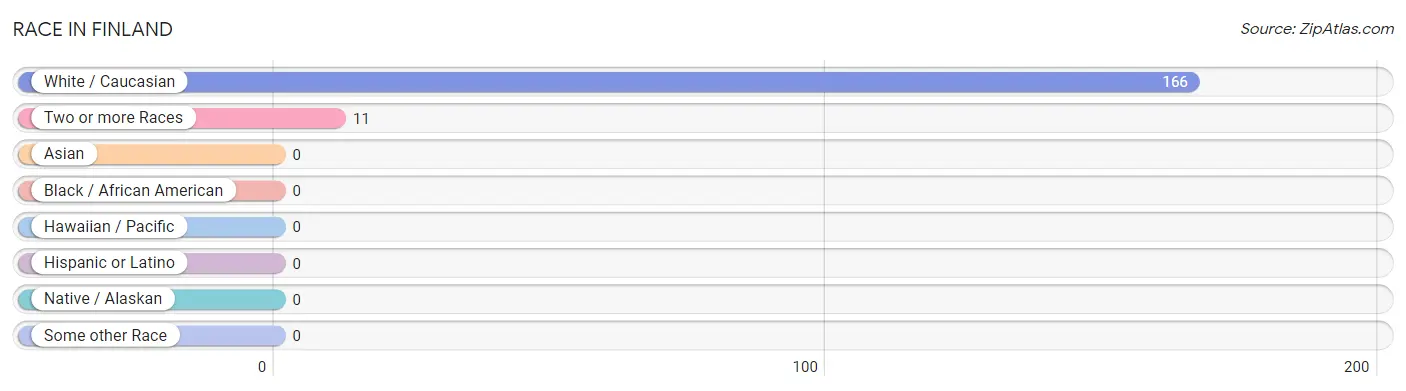
| Race | # Population | % Population |
| Asian | 0 | 0.0% |
| Black / African American | 0 | 0.0% |
| Hawaiian / Pacific | 0 | 0.0% |
| Hispanic or Latino | 0 | 0.0% |
| Native / Alaskan | 0 | 0.0% |
| White / Caucasian | 166 | 93.8% |
| Two or more Races | 11 | 6.2% |
| Some other Race | 0 | 0.0% |
| Total | 177 | 100.0% |
Ancestry in Finland
The most populous ancestries reported in Finland are Finnish (33 | 18.6%), German (28 | 15.8%), Swedish (25 | 14.1%), Norwegian (20 | 11.3%), and English (14 | 7.9%), together accounting for 67.8% of all Finland residents.
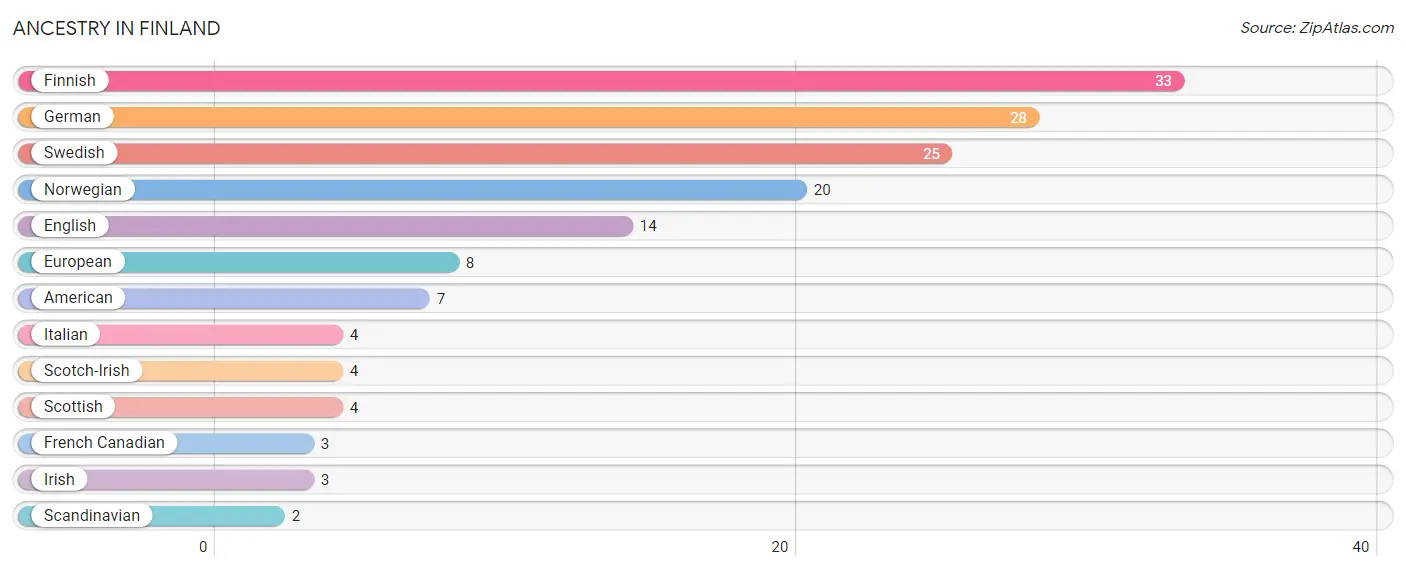
| Ancestry | # Population | % Population |
| American | 7 | 4.0% |
| English | 14 | 7.9% |
| European | 8 | 4.5% |
| Finnish | 33 | 18.6% |
| French Canadian | 3 | 1.7% |
| German | 28 | 15.8% |
| Irish | 3 | 1.7% |
| Italian | 4 | 2.3% |
| Norwegian | 20 | 11.3% |
| Scandinavian | 2 | 1.1% |
| Scotch-Irish | 4 | 2.3% |
| Scottish | 4 | 2.3% |
| Swedish | 25 | 14.1% | View All 13 Rows |
Immigrants in Finland
The most numerous immigrant groups reported in Finland came from , and Canada (1 | 0.6%), together accounting for 0.6% of all Finland residents.

| Immigration Origin | # Population | % Population |
| Canada | 1 | 0.6% | View All 1 Rows |
Sex and Age in Finland
Sex and Age in Finland
The most populous age groups in Finland are 65 to 69 Years (23 | 22.1%) for men and 55 to 59 Years (20 | 27.4%) for women.
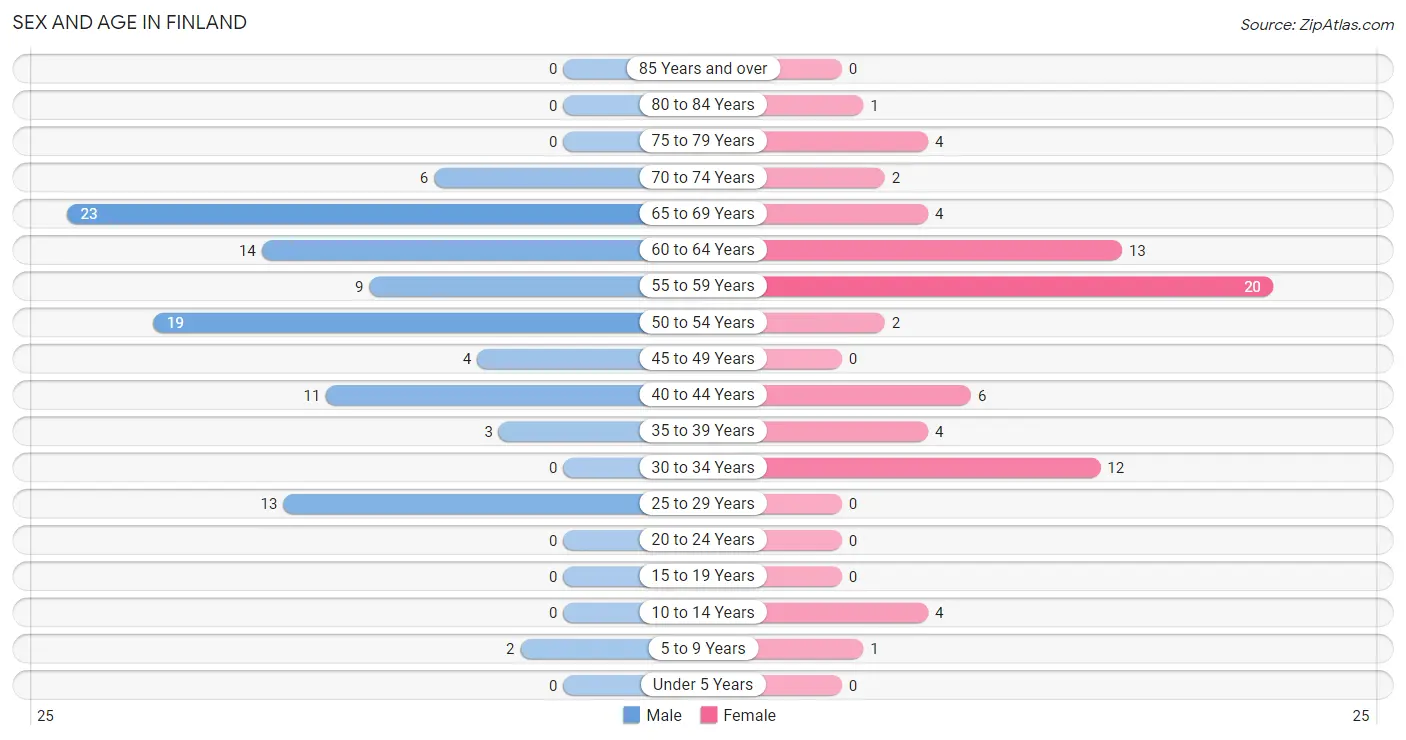
| Age Bracket | Male | Female |
| Under 5 Years | 0 (0.0%) | 0 (0.0%) |
| 5 to 9 Years | 2 (1.9%) | 1 (1.4%) |
| 10 to 14 Years | 0 (0.0%) | 4 (5.5%) |
| 15 to 19 Years | 0 (0.0%) | 0 (0.0%) |
| 20 to 24 Years | 0 (0.0%) | 0 (0.0%) |
| 25 to 29 Years | 13 (12.5%) | 0 (0.0%) |
| 30 to 34 Years | 0 (0.0%) | 12 (16.4%) |
| 35 to 39 Years | 3 (2.9%) | 4 (5.5%) |
| 40 to 44 Years | 11 (10.6%) | 6 (8.2%) |
| 45 to 49 Years | 4 (3.8%) | 0 (0.0%) |
| 50 to 54 Years | 19 (18.3%) | 2 (2.7%) |
| 55 to 59 Years | 9 (8.6%) | 20 (27.4%) |
| 60 to 64 Years | 14 (13.5%) | 13 (17.8%) |
| 65 to 69 Years | 23 (22.1%) | 4 (5.5%) |
| 70 to 74 Years | 6 (5.8%) | 2 (2.7%) |
| 75 to 79 Years | 0 (0.0%) | 4 (5.5%) |
| 80 to 84 Years | 0 (0.0%) | 1 (1.4%) |
| 85 Years and over | 0 (0.0%) | 0 (0.0%) |
| Total | 104 (100.0%) | 73 (100.0%) |
Families and Households in Finland
Median Family Size in Finland
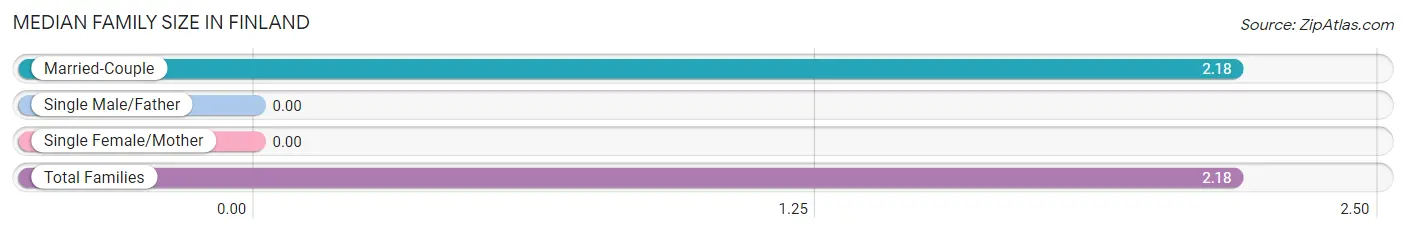
| Family Type | # Families | Family Size |
| Married-Couple | 39 (100.0%) | 2.18 |
| Single Male/Father | 0 (0.0%) | - |
| Single Female/Mother | 0 (0.0%) | - |
| Total Families | 39 (100.0%) | 2.18 |
Median Household Size in Finland
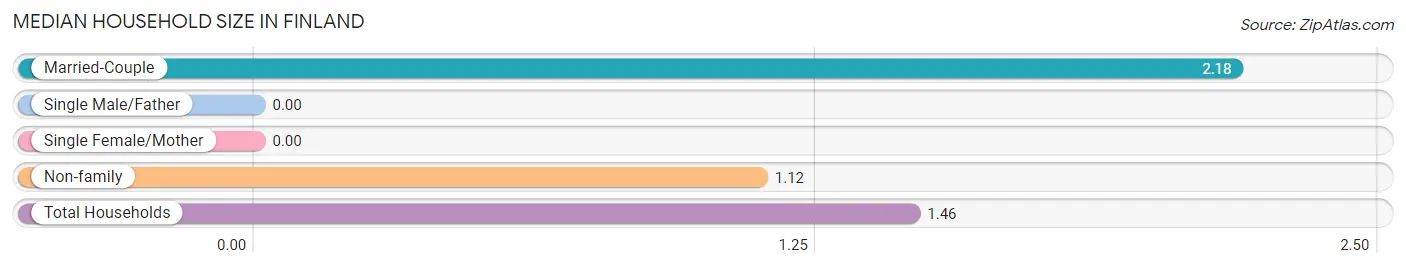
| Household Type | # Households | Household Size |
| Married-Couple | 39 (32.2%) | 2.18 |
| Single Male/Father | 0 (0.0%) | - |
| Single Female/Mother | 0 (0.0%) | - |
| Non-family | 82 (67.8%) | 1.12 |
| Total Households | 121 (100.0%) | 1.46 |
Household Size by Marriage Status in Finland
Out of a total of 121 households in Finland, 39 (32.2%) are family households, while 82 (67.8%) are nonfamily households. The most numerous type of family households are 2-person households, comprising 31, and the most common type of nonfamily households are 1-person households, comprising 69.
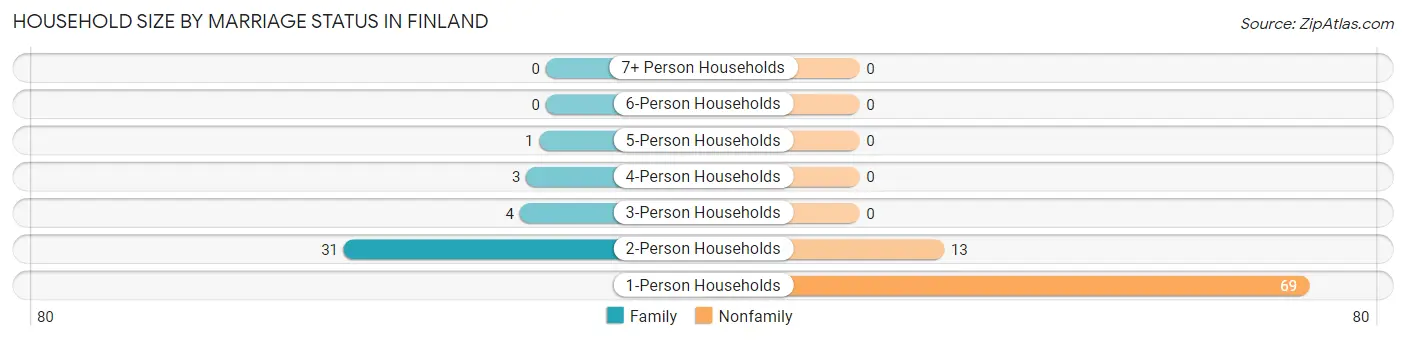
| Household Size | Family Households | Nonfamily Households |
| 1-Person Households | - | 69 (57.0%) |
| 2-Person Households | 31 (25.6%) | 13 (10.7%) |
| 3-Person Households | 4 (3.3%) | 0 (0.0%) |
| 4-Person Households | 3 (2.5%) | 0 (0.0%) |
| 5-Person Households | 1 (0.8%) | 0 (0.0%) |
| 6-Person Households | 0 (0.0%) | 0 (0.0%) |
| 7+ Person Households | 0 (0.0%) | 0 (0.0%) |
| Total | 39 (32.2%) | 82 (67.8%) |
Female Fertility in Finland
Fertility by Age in Finland
| Age Bracket | Women with Births | Births / 1,000 Women |
| 15 to 19 years | 0 (0.0%) | 0.0 |
| 20 to 34 years | 0 (0.0%) | 0.0 |
| 35 to 50 years | 0 (0.0%) | 0.0 |
| Total | 0 (0.0%) | 0.0 |
Fertility by Age by Marriage Status in Finland
| Age Bracket | Married | Unmarried |
| 15 to 19 years | 0 (0.0%) | 0 (0.0%) |
| 20 to 34 years | 0 (0.0%) | 0 (0.0%) |
| 35 to 50 years | 0 (0.0%) | 0 (0.0%) |
| Total | 0 (0.0%) | 0 (0.0%) |
Fertility by Education in Finland
| Educational Attainment | Women with Births | Births / 1,000 Women |
| Less than High School | 0 (0.0%) | 0.0 |
| High School Diploma | 0 (0.0%) | 0.0 |
| College or Associate's Degree | 0 (0.0%) | 0.0 |
| Bachelor's Degree | 0 (0.0%) | 0.0 |
| Graduate Degree | 0 (0.0%) | 0.0 |
| Total | 0 (0.0%) | 0.0 |
Fertility by Education by Marriage Status in Finland
| Educational Attainment | Married | Unmarried |
| Less than High School | 0 (0.0%) | 0 (0.0%) |
| High School Diploma | 0 (0.0%) | 0 (0.0%) |
| College or Associate's Degree | 0 (0.0%) | 0 (0.0%) |
| Bachelor's Degree | 0 (0.0%) | 0 (0.0%) |
| Graduate Degree | 0 (0.0%) | 0 (0.0%) |
| Total | 0 (0.0%) | 0 (0.0%) |
Employment Characteristics in Finland
Employment by Class of Employer in Finland
Among the 64 employed individuals in Finland, private company employees (39 | 60.9%), state government employees (11 | 17.2%), and local government employees (6 | 9.4%) make up the most common classes of employment.
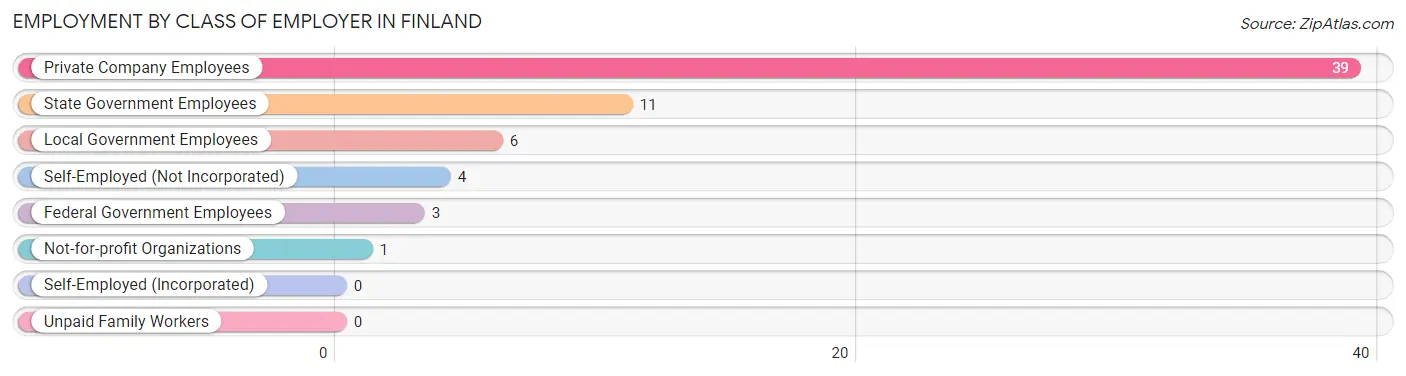
| Employer Class | # Employees | % Employees |
| Private Company Employees | 39 | 60.9% |
| Self-Employed (Incorporated) | 0 | 0.0% |
| Self-Employed (Not Incorporated) | 4 | 6.2% |
| Not-for-profit Organizations | 1 | 1.6% |
| Local Government Employees | 6 | 9.4% |
| State Government Employees | 11 | 17.2% |
| Federal Government Employees | 3 | 4.7% |
| Unpaid Family Workers | 0 | 0.0% |
| Total | 64 | 100.0% |
Employment Status by Age in Finland
According to the labor force statistics for Finland, out of the total population over 16 years of age (170), 40.6% or 69 individuals are in the labor force, with 4.3% or 3 of them unemployed. The age group with the highest labor force participation rate is 25 to 29 years, with 100.0% or 13 individuals in the labor force. Within the labor force, the 65 to 74 years age range has the highest percentage of unemployed individuals, with 33.3% or 3 of them being unemployed.
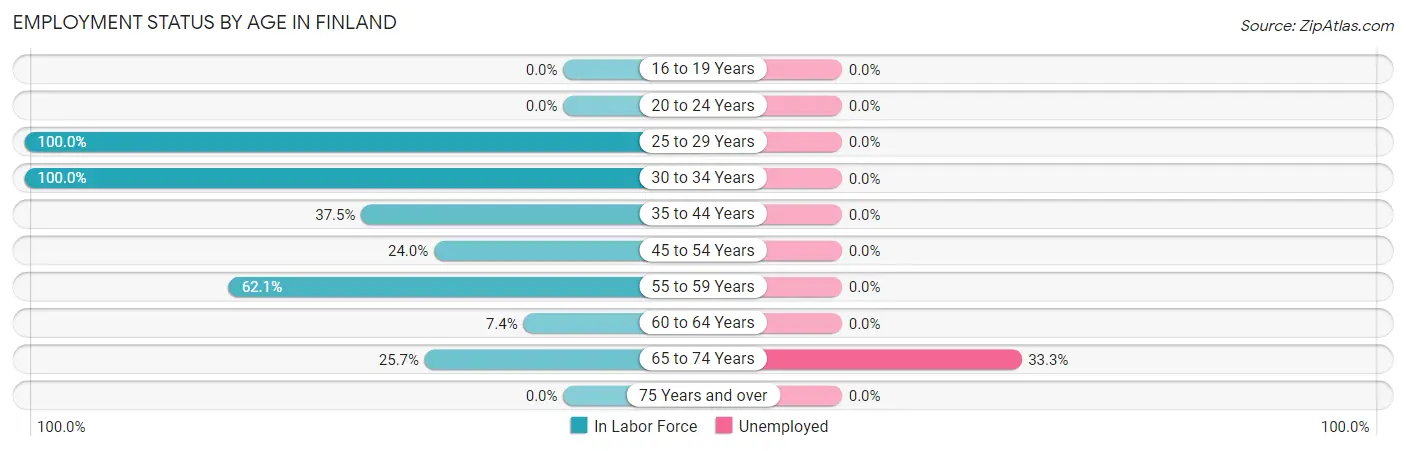
| Age Bracket | In Labor Force | Unemployed |
| 16 to 19 Years | 0 (0.0%) | 0 (0.0%) |
| 20 to 24 Years | 0 (0.0%) | 0 (0.0%) |
| 25 to 29 Years | 13 (100.0%) | 0 (0.0%) |
| 30 to 34 Years | 12 (100.0%) | 0 (0.0%) |
| 35 to 44 Years | 9 (37.5%) | 0 (0.0%) |
| 45 to 54 Years | 6 (24.0%) | 0 (0.0%) |
| 55 to 59 Years | 18 (62.1%) | 0 (0.0%) |
| 60 to 64 Years | 2 (7.4%) | 0 (0.0%) |
| 65 to 74 Years | 9 (25.7%) | 3 (33.3%) |
| 75 Years and over | 0 (0.0%) | 0 (0.0%) |
| Total | 69 (40.6%) | 3 (4.3%) |
Employment Status by Educational Attainment in Finland
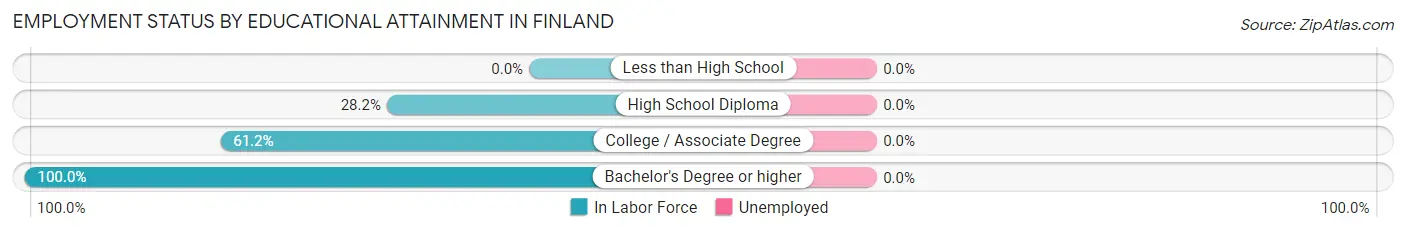
| Educational Attainment | In Labor Force | Unemployed |
| Less than High School | 0 (0.0%) | 0 (0.0%) |
| High School Diploma | 20 (28.2%) | 0 (0.0%) |
| College / Associate Degree | 30 (61.2%) | 0 (0.0%) |
| Bachelor's Degree or higher | 10 (100.0%) | 0 (0.0%) |
| Total | 60 (46.2%) | 0 (0.0%) |
Employment Occupations by Sex in Finland
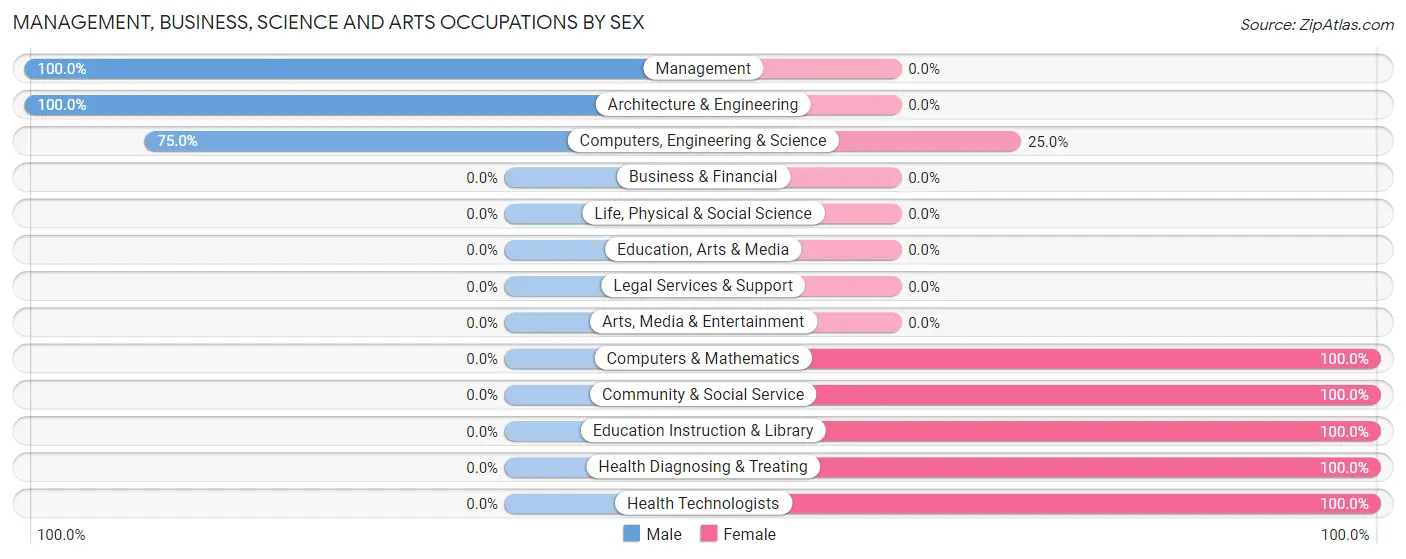
Management, Business, Science and Arts Occupations
The most common Management, Business, Science and Arts occupations in Finland are Health Diagnosing & Treating (5 | 7.6%), Health Technologists (5 | 7.6%), Computers, Engineering & Science (4 | 6.1%), Community & Social Service (4 | 6.1%), and Education Instruction & Library (4 | 6.1%).
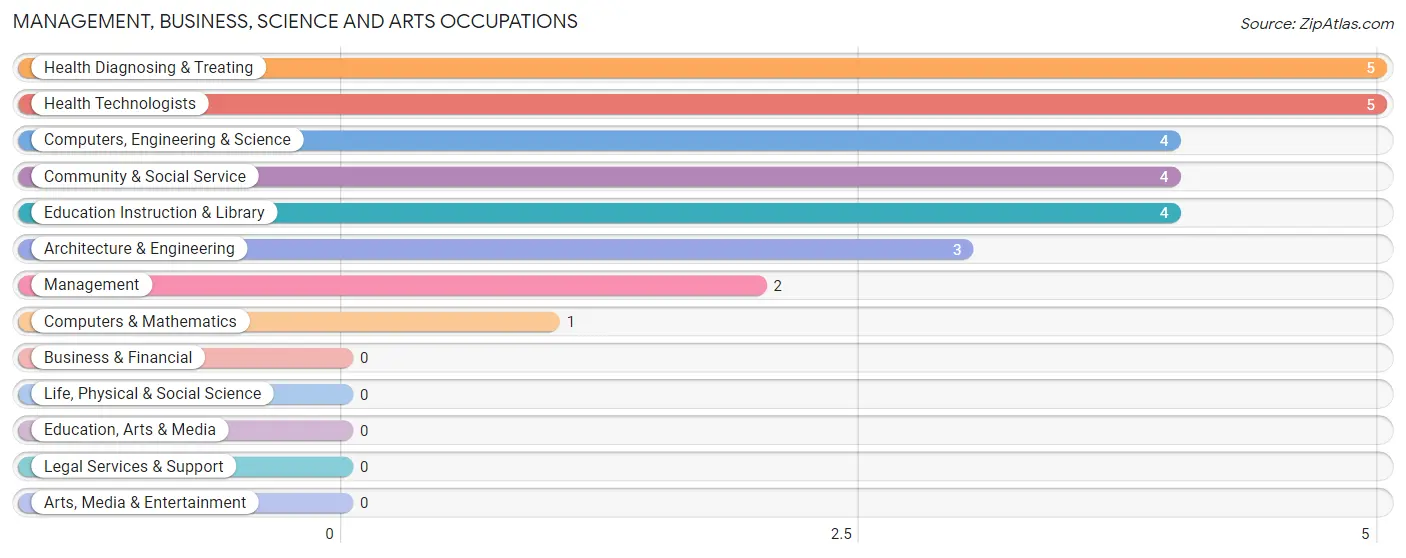
Management, Business, Science and Arts Occupations by Sex
Within the Management, Business, Science and Arts occupations in Finland, the most male-oriented occupations are Management (100.0%), Architecture & Engineering (100.0%), and Computers, Engineering & Science (75.0%), while the most female-oriented occupations are Computers & Mathematics (100.0%), Community & Social Service (100.0%), and Education Instruction & Library (100.0%).
| Occupation | Male | Female |
| Management | 2 (100.0%) | 0 (0.0%) |
| Business & Financial | 0 (0.0%) | 0 (0.0%) |
| Computers, Engineering & Science | 3 (75.0%) | 1 (25.0%) |
| Computers & Mathematics | 0 (0.0%) | 1 (100.0%) |
| Architecture & Engineering | 3 (100.0%) | 0 (0.0%) |
| Life, Physical & Social Science | 0 (0.0%) | 0 (0.0%) |
| Community & Social Service | 0 (0.0%) | 4 (100.0%) |
| Education, Arts & Media | 0 (0.0%) | 0 (0.0%) |
| Legal Services & Support | 0 (0.0%) | 0 (0.0%) |
| Education Instruction & Library | 0 (0.0%) | 4 (100.0%) |
| Arts, Media & Entertainment | 0 (0.0%) | 0 (0.0%) |
| Health Diagnosing & Treating | 0 (0.0%) | 5 (100.0%) |
| Health Technologists | 0 (0.0%) | 5 (100.0%) |
| Total (Category) | 5 (33.3%) | 10 (66.7%) |
| Total (Overall) | 29 (43.9%) | 37 (56.1%) |
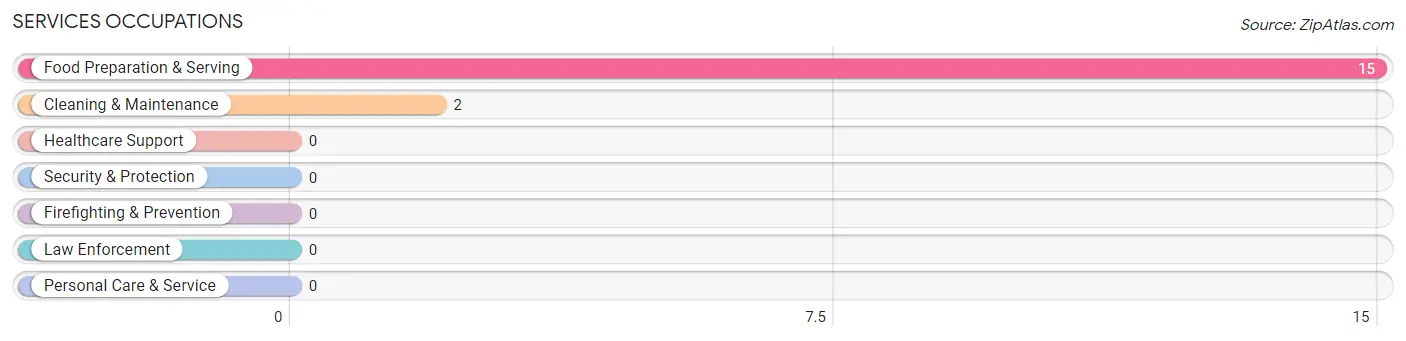
Services Occupations
The most common Services occupations in Finland are Food Preparation & Serving (15 | 22.7%), and Cleaning & Maintenance (2 | 3.0%).
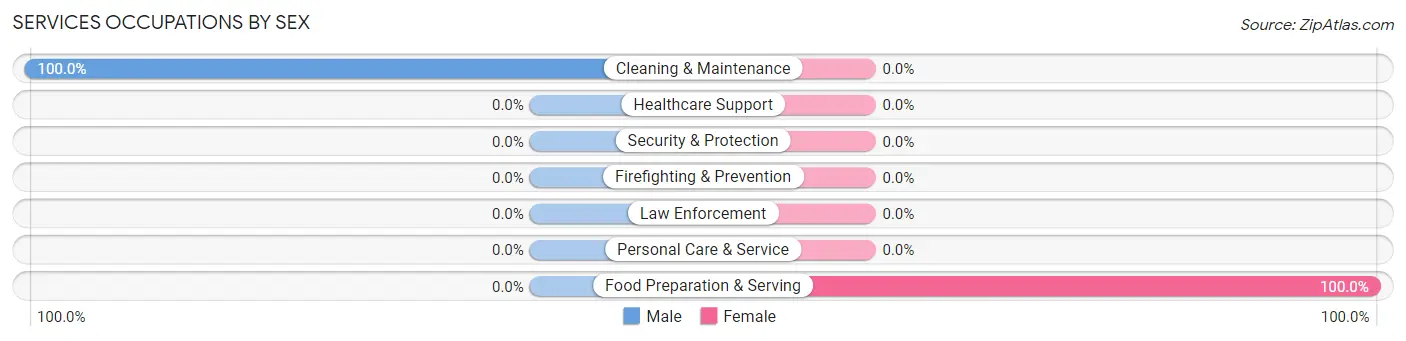
Services Occupations by Sex
| Occupation | Male | Female |
| Healthcare Support | 0 (0.0%) | 0 (0.0%) |
| Security & Protection | 0 (0.0%) | 0 (0.0%) |
| Firefighting & Prevention | 0 (0.0%) | 0 (0.0%) |
| Law Enforcement | 0 (0.0%) | 0 (0.0%) |
| Food Preparation & Serving | 0 (0.0%) | 15 (100.0%) |
| Cleaning & Maintenance | 2 (100.0%) | 0 (0.0%) |
| Personal Care & Service | 0 (0.0%) | 0 (0.0%) |
| Total (Category) | 2 (11.8%) | 15 (88.2%) |
| Total (Overall) | 29 (43.9%) | 37 (56.1%) |
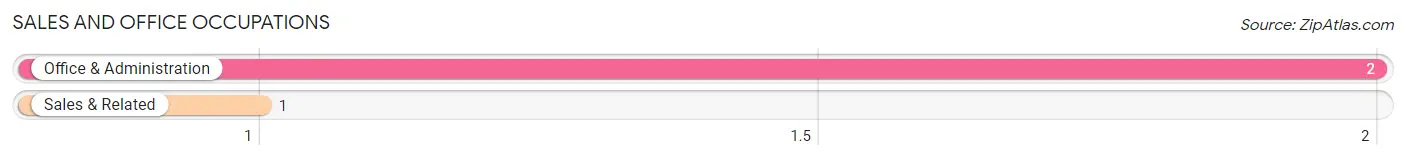
Sales and Office Occupations
The most common Sales and Office occupations in Finland are Office & Administration (2 | 3.0%), and Sales & Related (1 | 1.5%).
Sales and Office Occupations by Sex
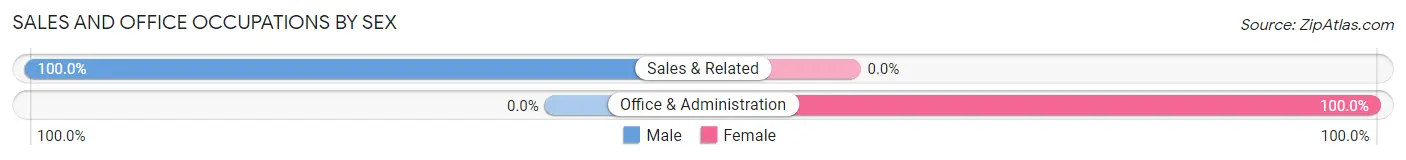
| Occupation | Male | Female |
| Sales & Related | 1 (100.0%) | 0 (0.0%) |
| Office & Administration | 0 (0.0%) | 2 (100.0%) |
| Total (Category) | 1 (33.3%) | 2 (66.7%) |
| Total (Overall) | 29 (43.9%) | 37 (56.1%) |
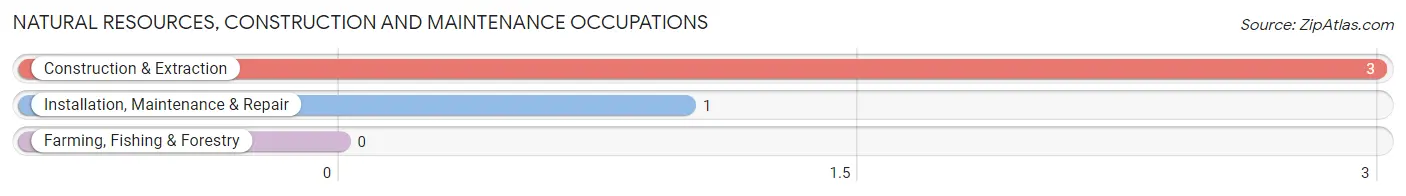
Natural Resources, Construction and Maintenance Occupations
The most common Natural Resources, Construction and Maintenance occupations in Finland are Construction & Extraction (3 | 4.5%), and Installation, Maintenance & Repair (1 | 1.5%).
Natural Resources, Construction and Maintenance Occupations by Sex
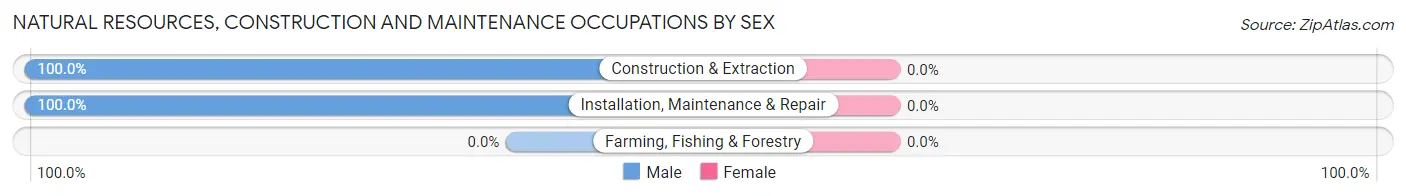
| Occupation | Male | Female |
| Farming, Fishing & Forestry | 0 (0.0%) | 0 (0.0%) |
| Construction & Extraction | 3 (100.0%) | 0 (0.0%) |
| Installation, Maintenance & Repair | 1 (100.0%) | 0 (0.0%) |
| Total (Category) | 4 (100.0%) | 0 (0.0%) |
| Total (Overall) | 29 (43.9%) | 37 (56.1%) |
Production, Transportation and Moving Occupations
The most common Production, Transportation and Moving occupations in Finland are Production (14 | 21.2%), and Transportation (13 | 19.7%).
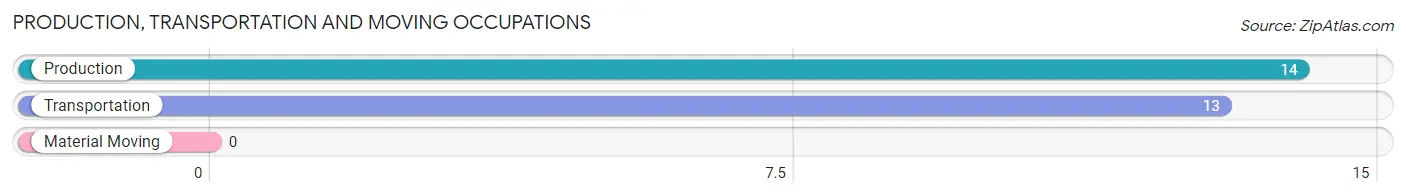
Production, Transportation and Moving Occupations by Sex
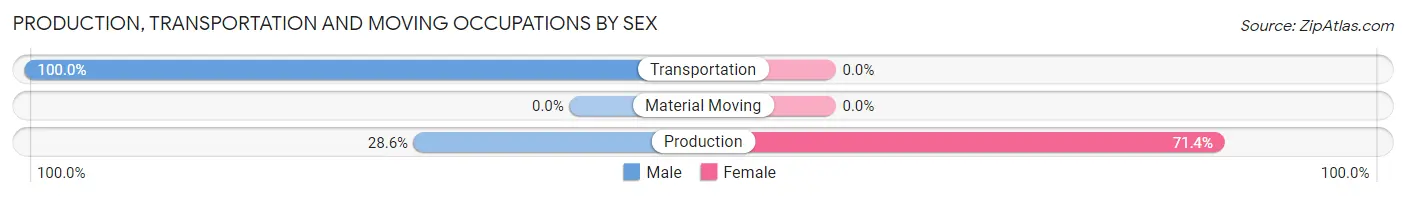
| Occupation | Male | Female |
| Production | 4 (28.6%) | 10 (71.4%) |
| Transportation | 13 (100.0%) | 0 (0.0%) |
| Material Moving | 0 (0.0%) | 0 (0.0%) |
| Total (Category) | 17 (63.0%) | 10 (37.0%) |
| Total (Overall) | 29 (43.9%) | 37 (56.1%) |
Employment Industries by Sex in Finland
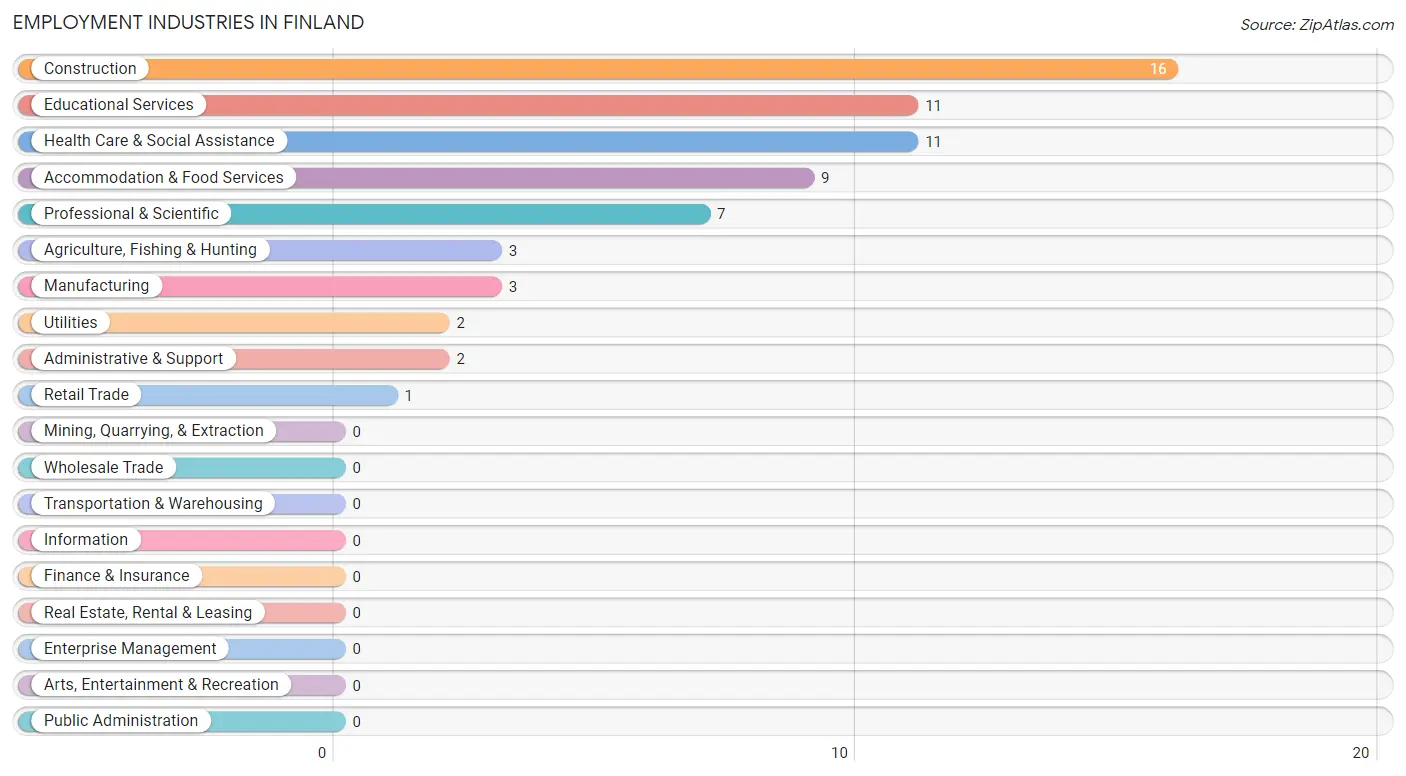
Employment Industries in Finland
The major employment industries in Finland include Construction (16 | 24.2%), Educational Services (11 | 16.7%), Health Care & Social Assistance (11 | 16.7%), Accommodation & Food Services (9 | 13.6%), and Professional & Scientific (7 | 10.6%).
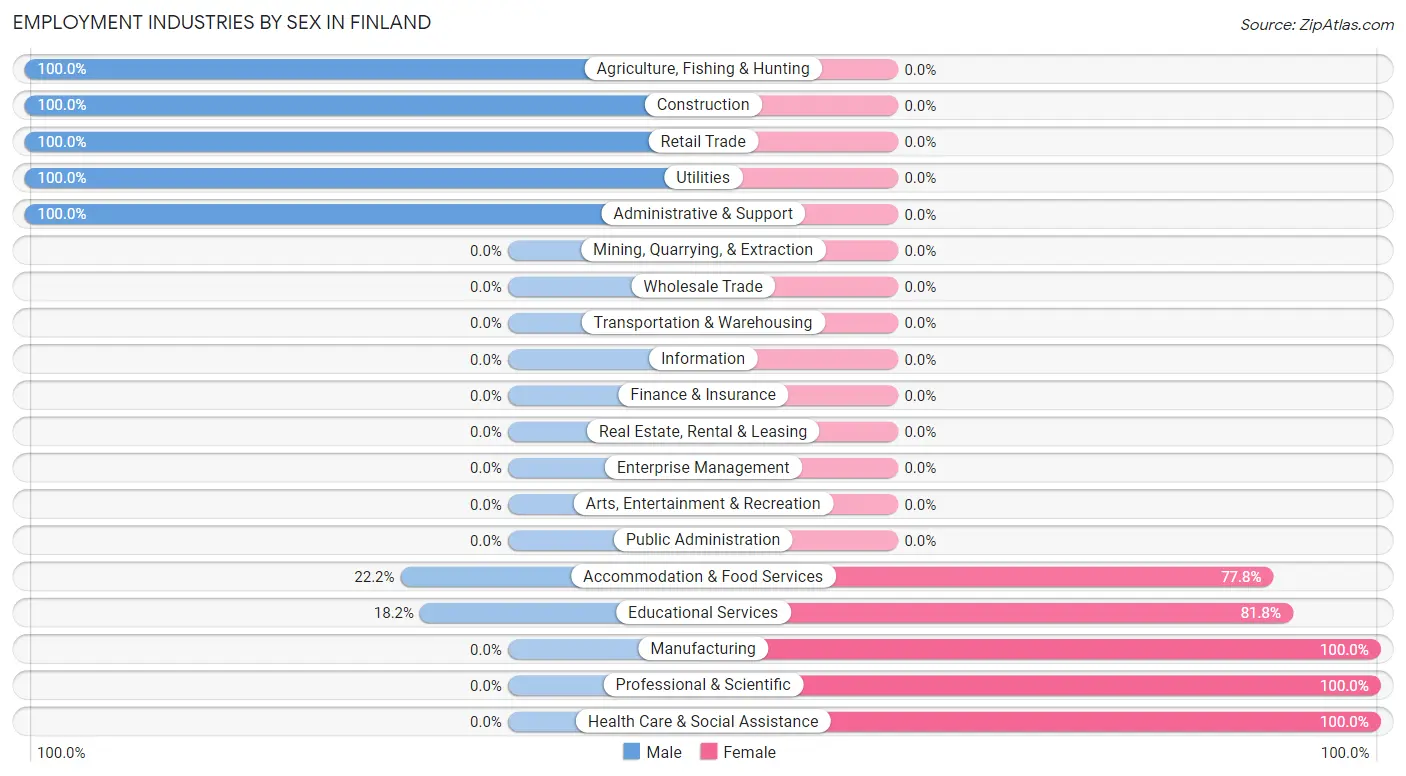
Employment Industries by Sex in Finland
The Finland industries that see more men than women are Agriculture, Fishing & Hunting (100.0%), Construction (100.0%), and Retail Trade (100.0%), whereas the industries that tend to have a higher number of women are Manufacturing (100.0%), Professional & Scientific (100.0%), and Health Care & Social Assistance (100.0%).
| Industry | Male | Female |
| Agriculture, Fishing & Hunting | 3 (100.0%) | 0 (0.0%) |
| Mining, Quarrying, & Extraction | 0 (0.0%) | 0 (0.0%) |
| Construction | 16 (100.0%) | 0 (0.0%) |
| Manufacturing | 0 (0.0%) | 3 (100.0%) |
| Wholesale Trade | 0 (0.0%) | 0 (0.0%) |
| Retail Trade | 1 (100.0%) | 0 (0.0%) |
| Transportation & Warehousing | 0 (0.0%) | 0 (0.0%) |
| Utilities | 2 (100.0%) | 0 (0.0%) |
| Information | 0 (0.0%) | 0 (0.0%) |
| Finance & Insurance | 0 (0.0%) | 0 (0.0%) |
| Real Estate, Rental & Leasing | 0 (0.0%) | 0 (0.0%) |
| Professional & Scientific | 0 (0.0%) | 7 (100.0%) |
| Enterprise Management | 0 (0.0%) | 0 (0.0%) |
| Administrative & Support | 2 (100.0%) | 0 (0.0%) |
| Educational Services | 2 (18.2%) | 9 (81.8%) |
| Health Care & Social Assistance | 0 (0.0%) | 11 (100.0%) |
| Arts, Entertainment & Recreation | 0 (0.0%) | 0 (0.0%) |
| Accommodation & Food Services | 2 (22.2%) | 7 (77.8%) |
| Public Administration | 0 (0.0%) | 0 (0.0%) |
| Total | 29 (43.9%) | 37 (56.1%) |
Education in Finland
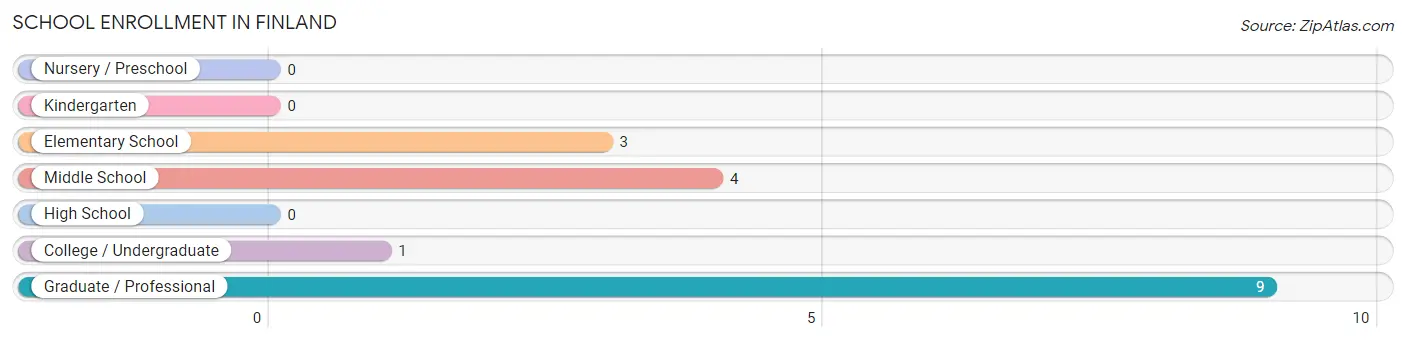
School Enrollment in Finland
The most common levels of schooling among the 17 students in Finland are graduate / professional (9 | 52.9%), middle school (4 | 23.5%), and elementary school (3 | 17.6%).
| School Level | # Students | % Students |
| Nursery / Preschool | 0 | 0.0% |
| Kindergarten | 0 | 0.0% |
| Elementary School | 3 | 17.6% |
| Middle School | 4 | 23.5% |
| High School | 0 | 0.0% |
| College / Undergraduate | 1 | 5.9% |
| Graduate / Professional | 9 | 52.9% |
| Total | 17 | 100.0% |
School Enrollment by Age by Funding Source in Finland
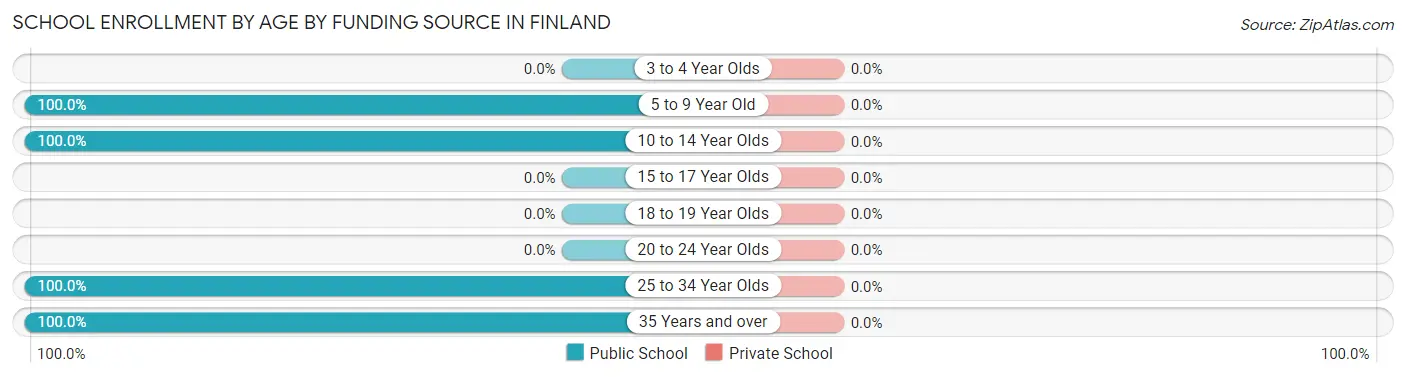
| Age Bracket | Public School | Private School |
| 3 to 4 Year Olds | 0 (0.0%) | 0 (0.0%) |
| 5 to 9 Year Old | 3 (100.0%) | 0 (0.0%) |
| 10 to 14 Year Olds | 4 (100.0%) | 0 (0.0%) |
| 15 to 17 Year Olds | 0 (0.0%) | 0 (0.0%) |
| 18 to 19 Year Olds | 0 (0.0%) | 0 (0.0%) |
| 20 to 24 Year Olds | 0 (0.0%) | 0 (0.0%) |
| 25 to 34 Year Olds | 7 (100.0%) | 0 (0.0%) |
| 35 Years and over | 3 (100.0%) | 0 (0.0%) |
| Total | 17 (100.0%) | 0 (0.0%) |
Educational Attainment by Field of Study in Finland
Psychology (3 | 20.0%), engineering (3 | 20.0%), liberal arts & history (3 | 20.0%), bio, nature & agricultural (2 | 13.3%), and education (2 | 13.3%) are the most common fields of study among 15 individuals in Finland who have obtained a bachelor's degree or higher.
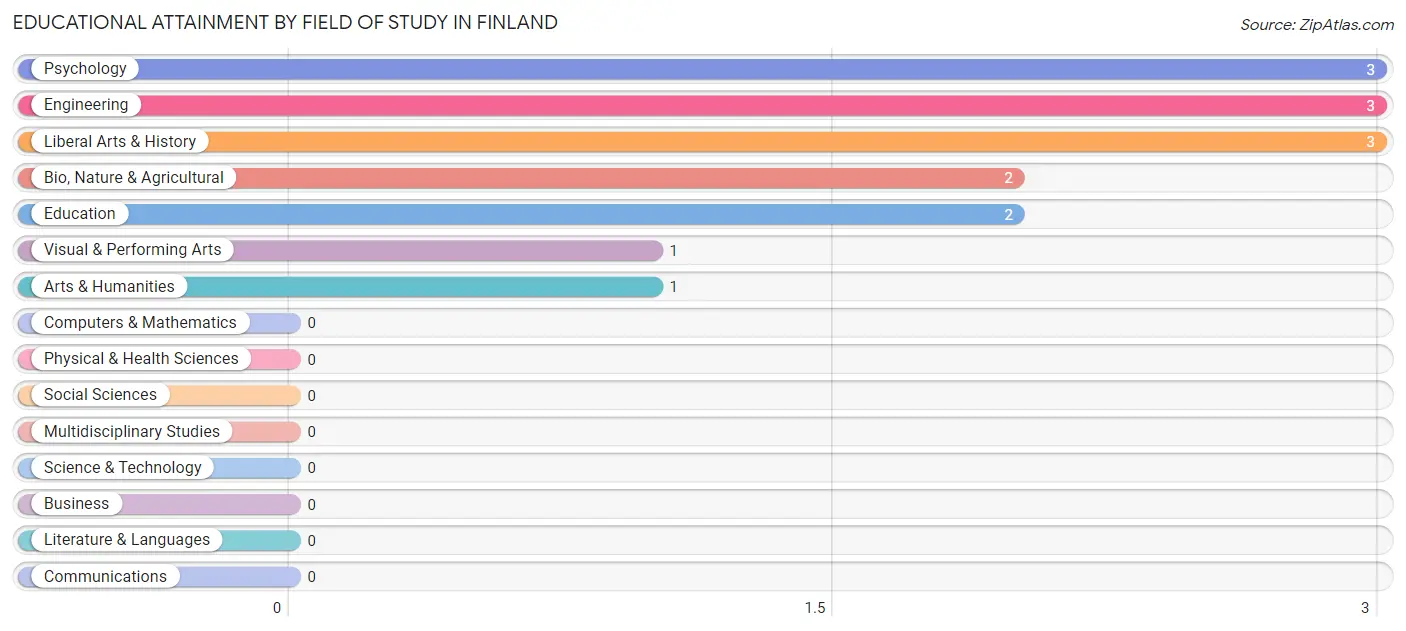
| Field of Study | # Graduates | % Graduates |
| Computers & Mathematics | 0 | 0.0% |
| Bio, Nature & Agricultural | 2 | 13.3% |
| Physical & Health Sciences | 0 | 0.0% |
| Psychology | 3 | 20.0% |
| Social Sciences | 0 | 0.0% |
| Engineering | 3 | 20.0% |
| Multidisciplinary Studies | 0 | 0.0% |
| Science & Technology | 0 | 0.0% |
| Business | 0 | 0.0% |
| Education | 2 | 13.3% |
| Literature & Languages | 0 | 0.0% |
| Liberal Arts & History | 3 | 20.0% |
| Visual & Performing Arts | 1 | 6.7% |
| Communications | 0 | 0.0% |
| Arts & Humanities | 1 | 6.7% |
| Total | 15 | 100.0% |
Transportation & Commute in Finland
Vehicle Availability by Sex in Finland
The most prevalent vehicle ownership categories in Finland are males with 1 vehicle (14, accounting for 48.3%) and females with 1 vehicle (7, making up 40.0%).
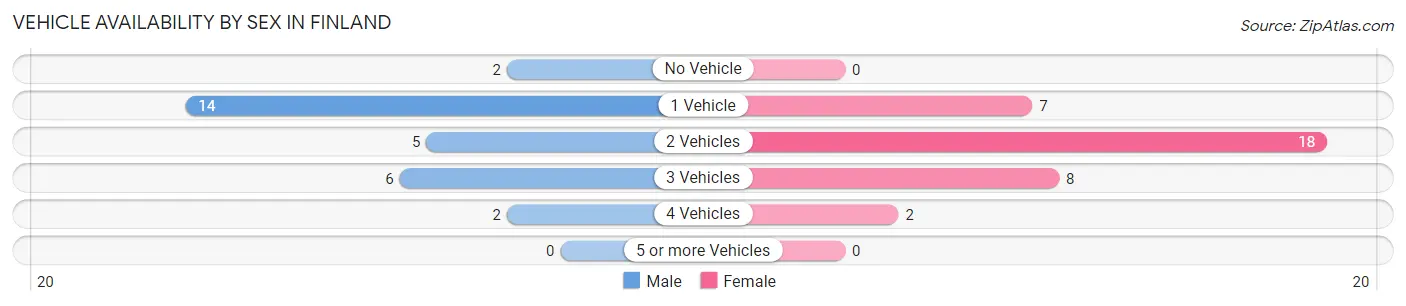
| Vehicles Available | Male | Female |
| No Vehicle | 2 (6.9%) | 0 (0.0%) |
| 1 Vehicle | 14 (48.3%) | 7 (20.0%) |
| 2 Vehicles | 5 (17.2%) | 18 (51.4%) |
| 3 Vehicles | 6 (20.7%) | 8 (22.9%) |
| 4 Vehicles | 2 (6.9%) | 2 (5.7%) |
| 5 or more Vehicles | 0 (0.0%) | 0 (0.0%) |
| Total | 29 (100.0%) | 35 (100.0%) |
Commute Time in Finland
The most frequently occuring commute durations in Finland are 20 to 24 minutes (22 commuters, 34.4%), 15 to 19 minutes (9 commuters, 14.1%), and 30 to 34 minutes (9 commuters, 14.1%).
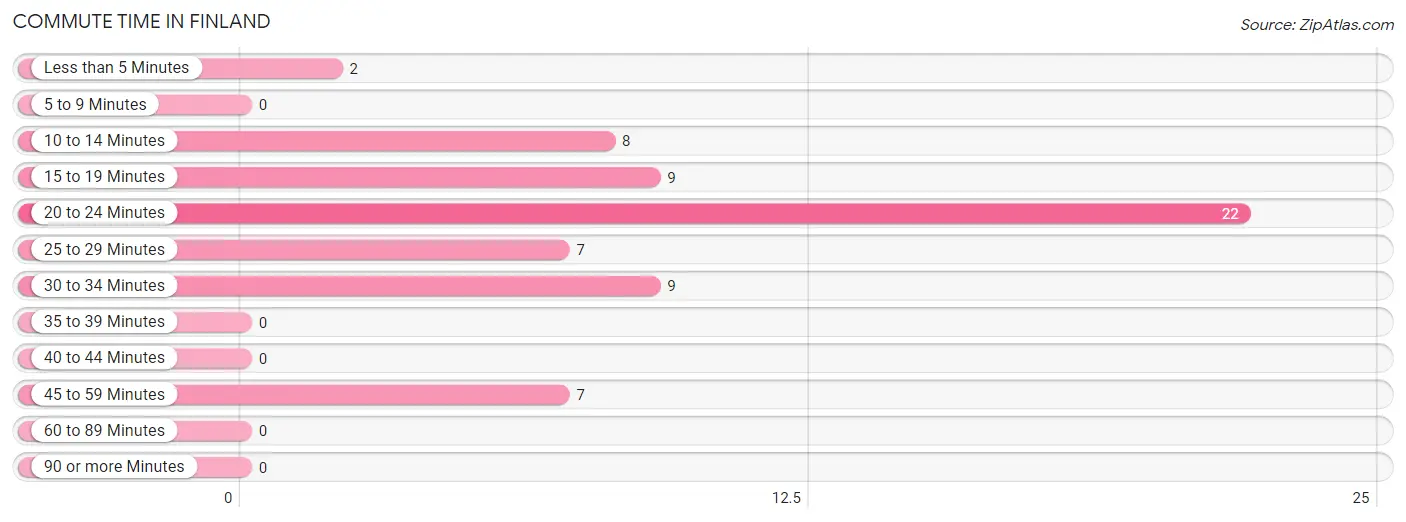
| Commute Time | # Commuters | % Commuters |
| Less than 5 Minutes | 2 | 3.1% |
| 5 to 9 Minutes | 0 | 0.0% |
| 10 to 14 Minutes | 8 | 12.5% |
| 15 to 19 Minutes | 9 | 14.1% |
| 20 to 24 Minutes | 22 | 34.4% |
| 25 to 29 Minutes | 7 | 10.9% |
| 30 to 34 Minutes | 9 | 14.1% |
| 35 to 39 Minutes | 0 | 0.0% |
| 40 to 44 Minutes | 0 | 0.0% |
| 45 to 59 Minutes | 7 | 10.9% |
| 60 to 89 Minutes | 0 | 0.0% |
| 90 or more Minutes | 0 | 0.0% |
Commute Time by Sex in Finland
The most common commute times in Finland are 20 to 24 minutes (14 commuters, 48.3%) for males and 20 to 24 minutes (8 commuters, 22.9%) for females.
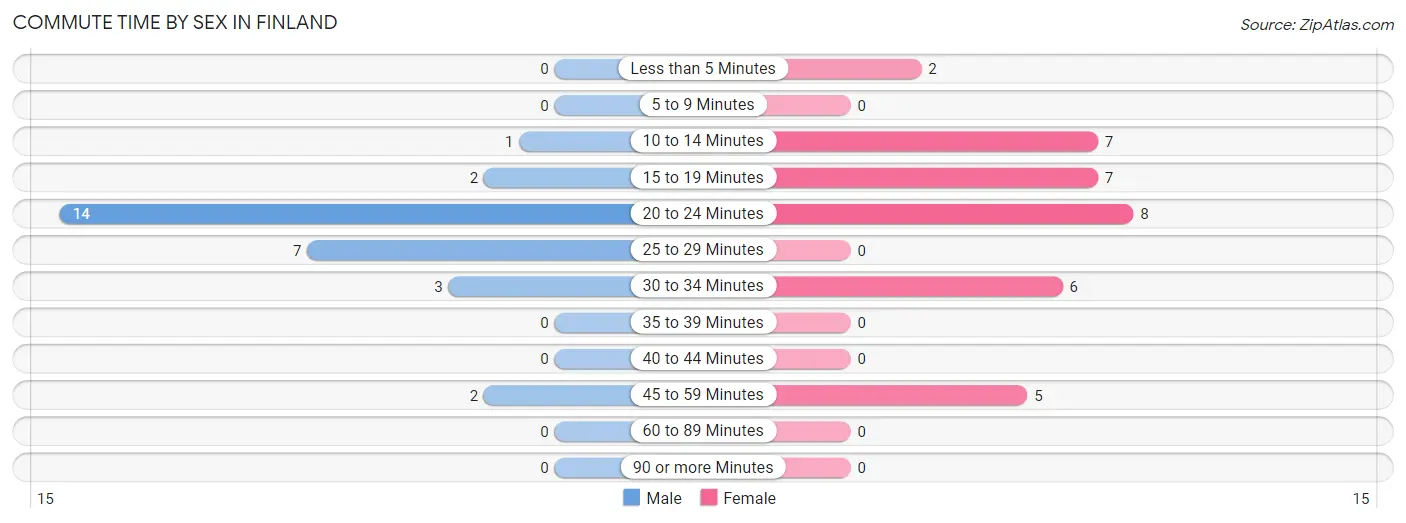
| Commute Time | Male | Female |
| Less than 5 Minutes | 0 (0.0%) | 2 (5.7%) |
| 5 to 9 Minutes | 0 (0.0%) | 0 (0.0%) |
| 10 to 14 Minutes | 1 (3.5%) | 7 (20.0%) |
| 15 to 19 Minutes | 2 (6.9%) | 7 (20.0%) |
| 20 to 24 Minutes | 14 (48.3%) | 8 (22.9%) |
| 25 to 29 Minutes | 7 (24.1%) | 0 (0.0%) |
| 30 to 34 Minutes | 3 (10.3%) | 6 (17.1%) |
| 35 to 39 Minutes | 0 (0.0%) | 0 (0.0%) |
| 40 to 44 Minutes | 0 (0.0%) | 0 (0.0%) |
| 45 to 59 Minutes | 2 (6.9%) | 5 (14.3%) |
| 60 to 89 Minutes | 0 (0.0%) | 0 (0.0%) |
| 90 or more Minutes | 0 (0.0%) | 0 (0.0%) |
Time of Departure to Work by Sex in Finland
The most frequent times of departure to work in Finland are 7:30 AM to 7:59 AM (11, 37.9%) for males and 6:00 AM to 6:29 AM (15, 42.9%) for females.
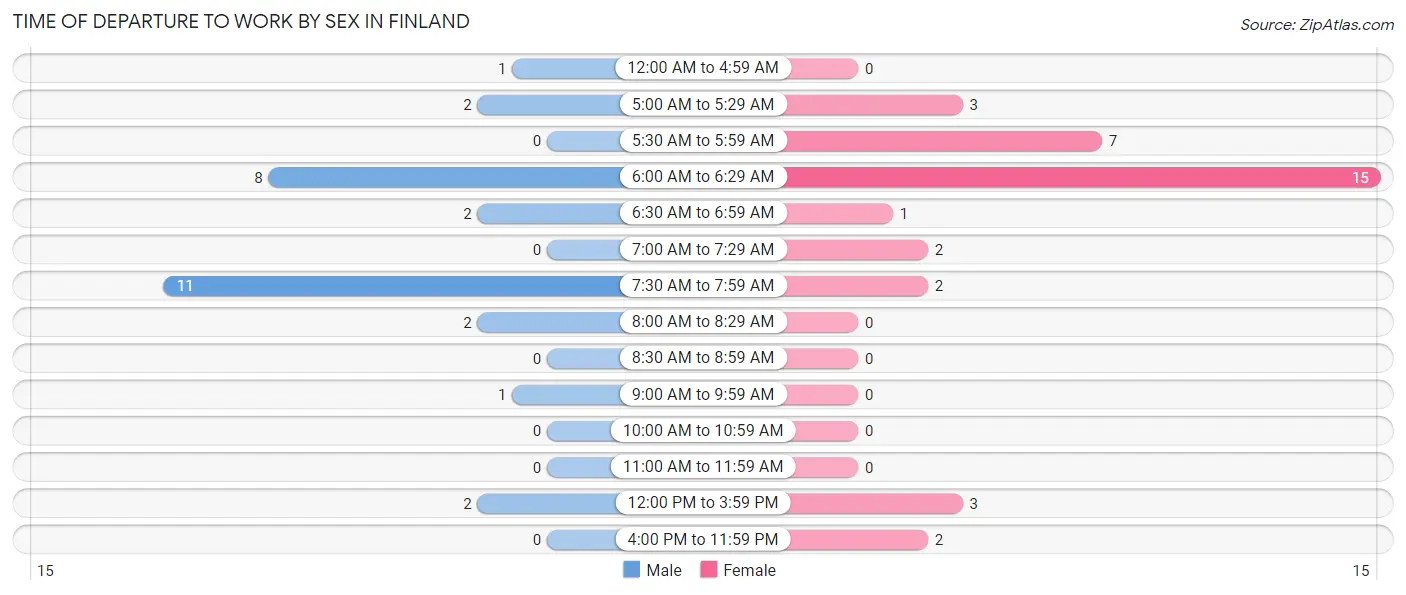
| Time of Departure | Male | Female |
| 12:00 AM to 4:59 AM | 1 (3.5%) | 0 (0.0%) |
| 5:00 AM to 5:29 AM | 2 (6.9%) | 3 (8.6%) |
| 5:30 AM to 5:59 AM | 0 (0.0%) | 7 (20.0%) |
| 6:00 AM to 6:29 AM | 8 (27.6%) | 15 (42.9%) |
| 6:30 AM to 6:59 AM | 2 (6.9%) | 1 (2.9%) |
| 7:00 AM to 7:29 AM | 0 (0.0%) | 2 (5.7%) |
| 7:30 AM to 7:59 AM | 11 (37.9%) | 2 (5.7%) |
| 8:00 AM to 8:29 AM | 2 (6.9%) | 0 (0.0%) |
| 8:30 AM to 8:59 AM | 0 (0.0%) | 0 (0.0%) |
| 9:00 AM to 9:59 AM | 1 (3.5%) | 0 (0.0%) |
| 10:00 AM to 10:59 AM | 0 (0.0%) | 0 (0.0%) |
| 11:00 AM to 11:59 AM | 0 (0.0%) | 0 (0.0%) |
| 12:00 PM to 3:59 PM | 2 (6.9%) | 3 (8.6%) |
| 4:00 PM to 11:59 PM | 0 (0.0%) | 2 (5.7%) |
| Total | 29 (100.0%) | 35 (100.0%) |
Housing Occupancy in Finland
Occupancy by Ownership in Finland
Of the total 121 dwellings in Finland, owner-occupied units account for 85 (70.3%), while renter-occupied units make up 36 (29.7%).
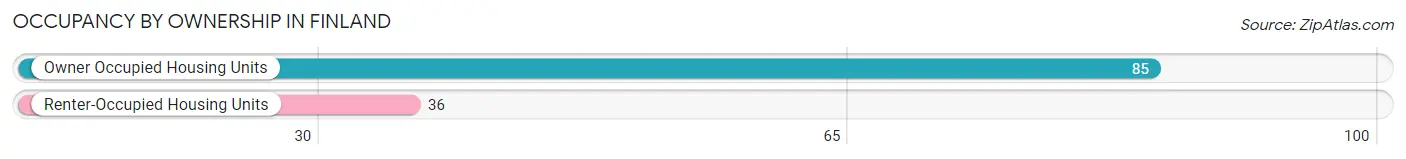
| Occupancy | # Housing Units | % Housing Units |
| Owner Occupied Housing Units | 85 | 70.3% |
| Renter-Occupied Housing Units | 36 | 29.7% |
| Total Occupied Housing Units | 121 | 100.0% |
Occupancy by Household Size in Finland
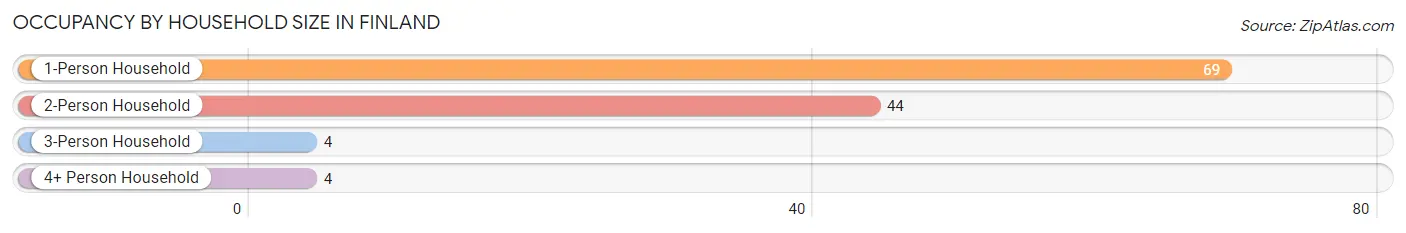
| Household Size | # Housing Units | % Housing Units |
| 1-Person Household | 69 | 57.0% |
| 2-Person Household | 44 | 36.4% |
| 3-Person Household | 4 | 3.3% |
| 4+ Person Household | 4 | 3.3% |
| Total Housing Units | 121 | 100.0% |
Occupancy by Ownership by Household Size in Finland
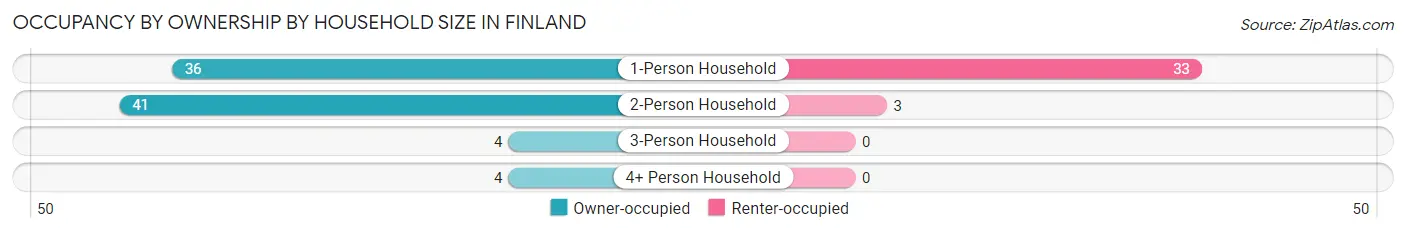
| Household Size | Owner-occupied | Renter-occupied |
| 1-Person Household | 36 (52.2%) | 33 (47.8%) |
| 2-Person Household | 41 (93.2%) | 3 (6.8%) |
| 3-Person Household | 4 (100.0%) | 0 (0.0%) |
| 4+ Person Household | 4 (100.0%) | 0 (0.0%) |
| Total Housing Units | 85 (70.3%) | 36 (29.7%) |
Occupancy by Educational Attainment in Finland
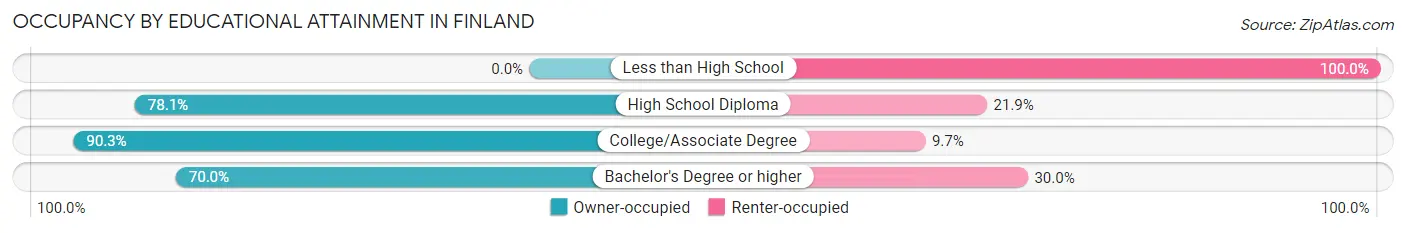
| Household Size | Owner-occupied | Renter-occupied |
| Less than High School | 0 (0.0%) | 16 (100.0%) |
| High School Diploma | 50 (78.1%) | 14 (21.9%) |
| College/Associate Degree | 28 (90.3%) | 3 (9.7%) |
| Bachelor's Degree or higher | 7 (70.0%) | 3 (30.0%) |
Occupancy by Age of Householder in Finland
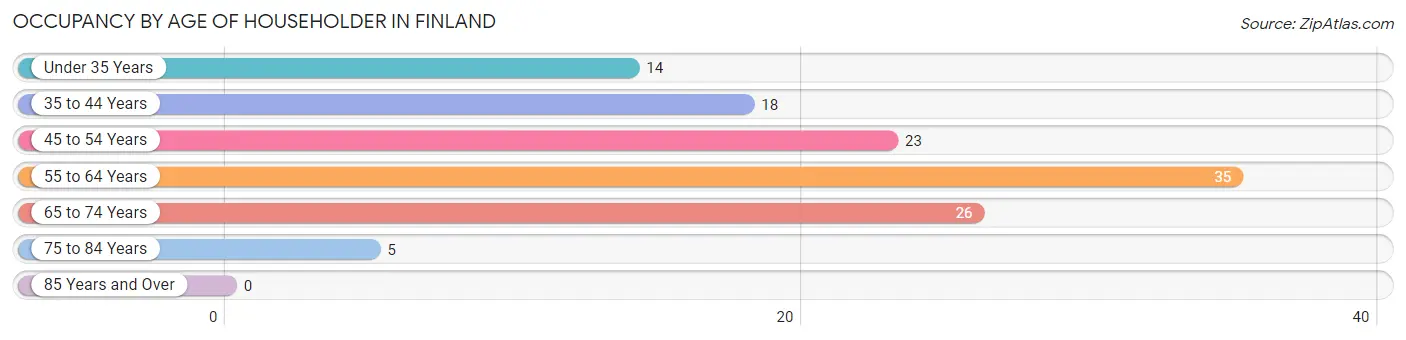
| Age Bracket | # Households | % Households |
| Under 35 Years | 14 | 11.6% |
| 35 to 44 Years | 18 | 14.9% |
| 45 to 54 Years | 23 | 19.0% |
| 55 to 64 Years | 35 | 28.9% |
| 65 to 74 Years | 26 | 21.5% |
| 75 to 84 Years | 5 | 4.1% |
| 85 Years and Over | 0 | 0.0% |
| Total | 121 | 100.0% |
Housing Finances in Finland
Median Income by Occupancy in Finland
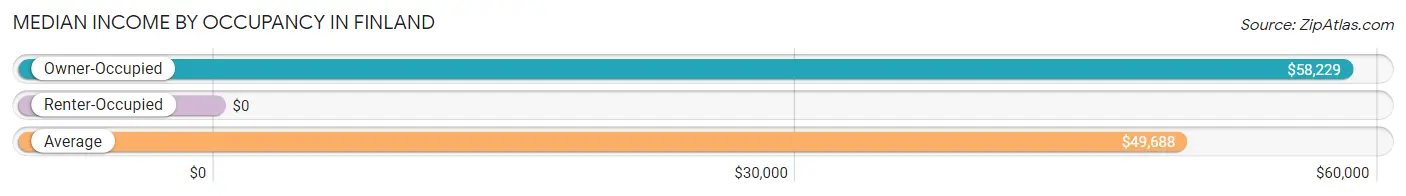
| Occupancy Type | # Households | Median Income |
| Owner-Occupied | 85 (70.3%) | $58,229 |
| Renter-Occupied | 36 (29.7%) | $0 |
| Average | 121 (100.0%) | $49,688 |
Occupancy by Householder Income Bracket in Finland
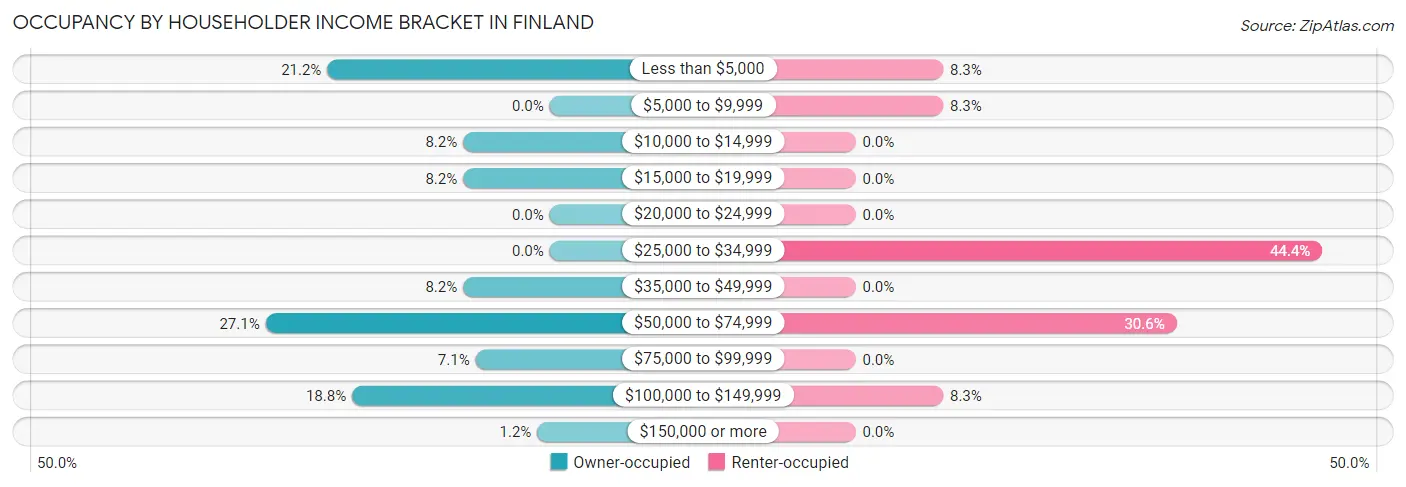
| Income Bracket | Owner-occupied | Renter-occupied |
| Less than $5,000 | 18 (21.2%) | 3 (8.3%) |
| $5,000 to $9,999 | 0 (0.0%) | 3 (8.3%) |
| $10,000 to $14,999 | 7 (8.2%) | 0 (0.0%) |
| $15,000 to $19,999 | 7 (8.2%) | 0 (0.0%) |
| $20,000 to $24,999 | 0 (0.0%) | 0 (0.0%) |
| $25,000 to $34,999 | 0 (0.0%) | 16 (44.4%) |
| $35,000 to $49,999 | 7 (8.2%) | 0 (0.0%) |
| $50,000 to $74,999 | 23 (27.1%) | 11 (30.6%) |
| $75,000 to $99,999 | 6 (7.1%) | 0 (0.0%) |
| $100,000 to $149,999 | 16 (18.8%) | 3 (8.3%) |
| $150,000 or more | 1 (1.2%) | 0 (0.0%) |
| Total | 85 (100.0%) | 36 (100.0%) |
Monthly Housing Cost Tiers in Finland
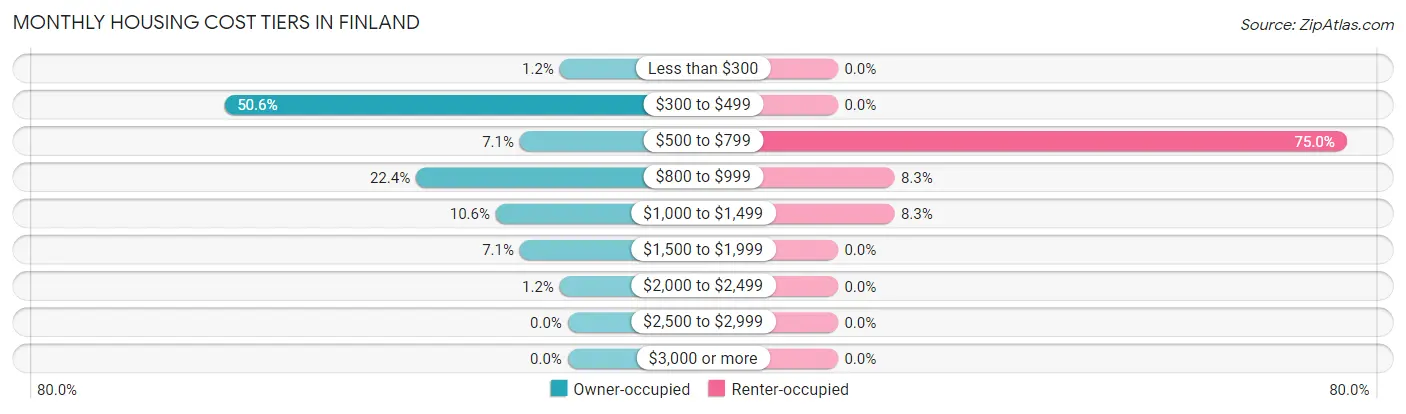
| Monthly Cost | Owner-occupied | Renter-occupied |
| Less than $300 | 1 (1.2%) | 0 (0.0%) |
| $300 to $499 | 43 (50.6%) | 0 (0.0%) |
| $500 to $799 | 6 (7.1%) | 27 (75.0%) |
| $800 to $999 | 19 (22.4%) | 3 (8.3%) |
| $1,000 to $1,499 | 9 (10.6%) | 3 (8.3%) |
| $1,500 to $1,999 | 6 (7.1%) | 0 (0.0%) |
| $2,000 to $2,499 | 1 (1.2%) | 0 (0.0%) |
| $2,500 to $2,999 | 0 (0.0%) | 0 (0.0%) |
| $3,000 or more | 0 (0.0%) | 0 (0.0%) |
| Total | 85 (100.0%) | 36 (100.0%) |
Physical Housing Characteristics in Finland
Housing Structures in Finland
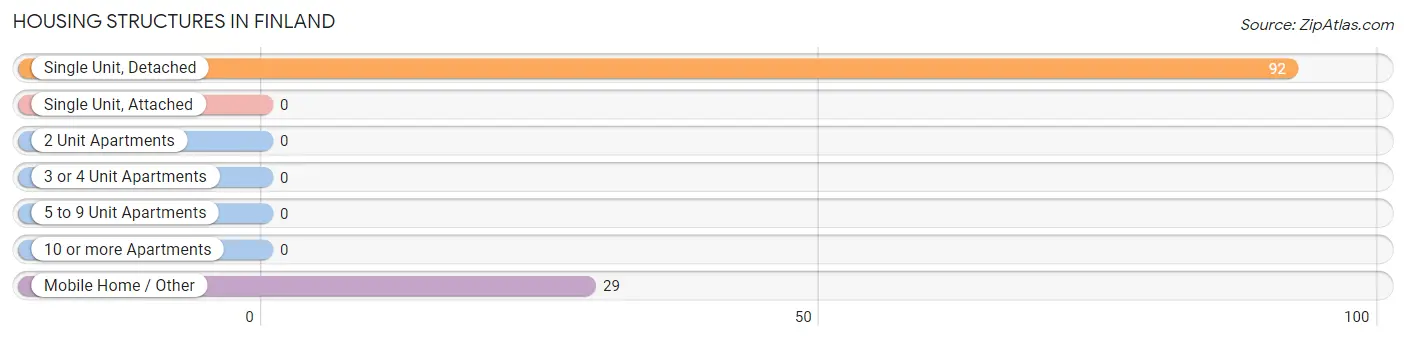
| Structure Type | # Housing Units | % Housing Units |
| Single Unit, Detached | 92 | 76.0% |
| Single Unit, Attached | 0 | 0.0% |
| 2 Unit Apartments | 0 | 0.0% |
| 3 or 4 Unit Apartments | 0 | 0.0% |
| 5 to 9 Unit Apartments | 0 | 0.0% |
| 10 or more Apartments | 0 | 0.0% |
| Mobile Home / Other | 29 | 24.0% |
| Total | 121 | 100.0% |
Housing Structures by Occupancy in Finland
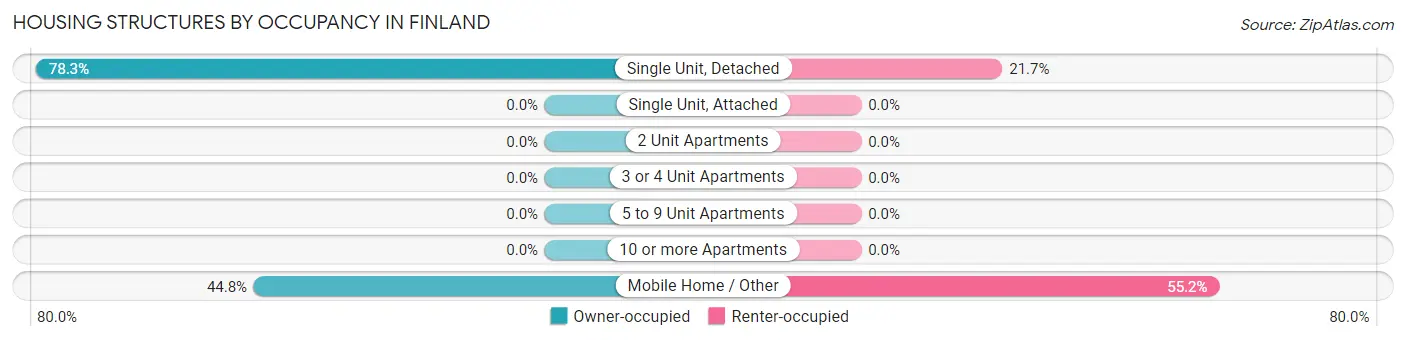
| Structure Type | Owner-occupied | Renter-occupied |
| Single Unit, Detached | 72 (78.3%) | 20 (21.7%) |
| Single Unit, Attached | 0 (0.0%) | 0 (0.0%) |
| 2 Unit Apartments | 0 (0.0%) | 0 (0.0%) |
| 3 or 4 Unit Apartments | 0 (0.0%) | 0 (0.0%) |
| 5 to 9 Unit Apartments | 0 (0.0%) | 0 (0.0%) |
| 10 or more Apartments | 0 (0.0%) | 0 (0.0%) |
| Mobile Home / Other | 13 (44.8%) | 16 (55.2%) |
| Total | 85 (70.3%) | 36 (29.7%) |
Housing Structures by Number of Rooms in Finland
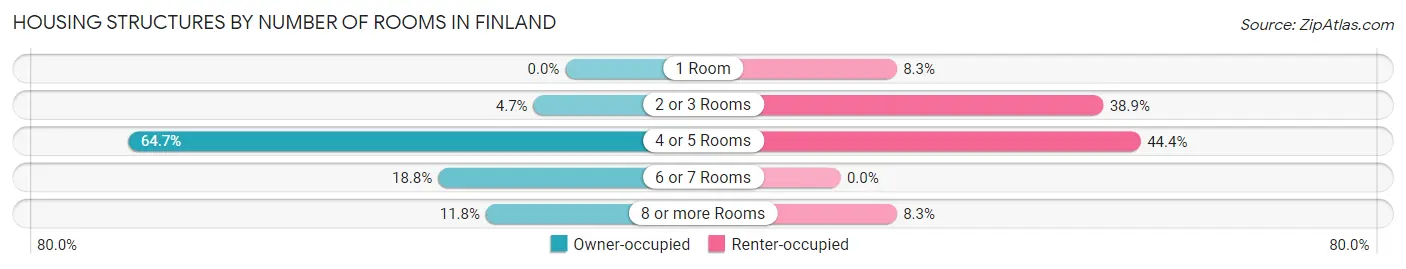
| Number of Rooms | Owner-occupied | Renter-occupied |
| 1 Room | 0 (0.0%) | 3 (8.3%) |
| 2 or 3 Rooms | 4 (4.7%) | 14 (38.9%) |
| 4 or 5 Rooms | 55 (64.7%) | 16 (44.4%) |
| 6 or 7 Rooms | 16 (18.8%) | 0 (0.0%) |
| 8 or more Rooms | 10 (11.8%) | 3 (8.3%) |
| Total | 85 (100.0%) | 36 (100.0%) |
Housing Structure by Heating Type in Finland
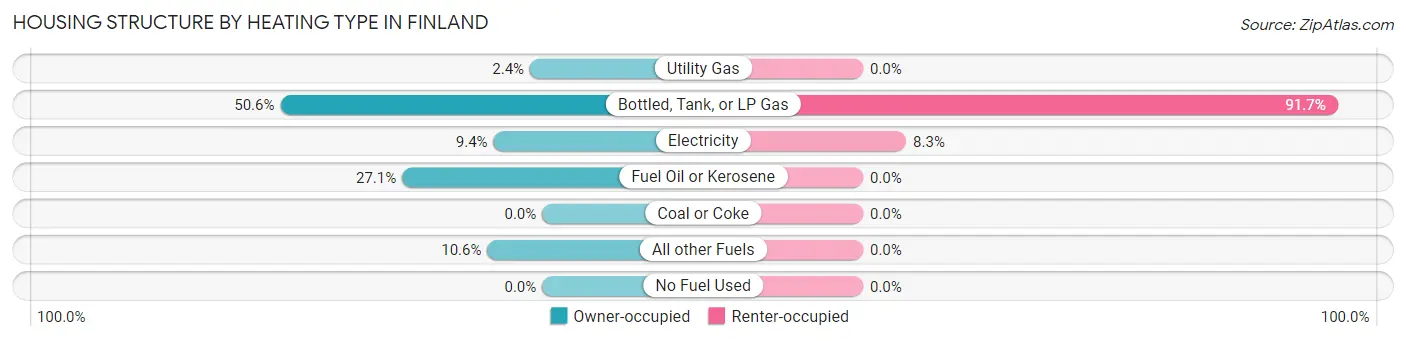
| Heating Type | Owner-occupied | Renter-occupied |
| Utility Gas | 2 (2.4%) | 0 (0.0%) |
| Bottled, Tank, or LP Gas | 43 (50.6%) | 33 (91.7%) |
| Electricity | 8 (9.4%) | 3 (8.3%) |
| Fuel Oil or Kerosene | 23 (27.1%) | 0 (0.0%) |
| Coal or Coke | 0 (0.0%) | 0 (0.0%) |
| All other Fuels | 9 (10.6%) | 0 (0.0%) |
| No Fuel Used | 0 (0.0%) | 0 (0.0%) |
| Total | 85 (100.0%) | 36 (100.0%) |
Household Vehicle Usage in Finland
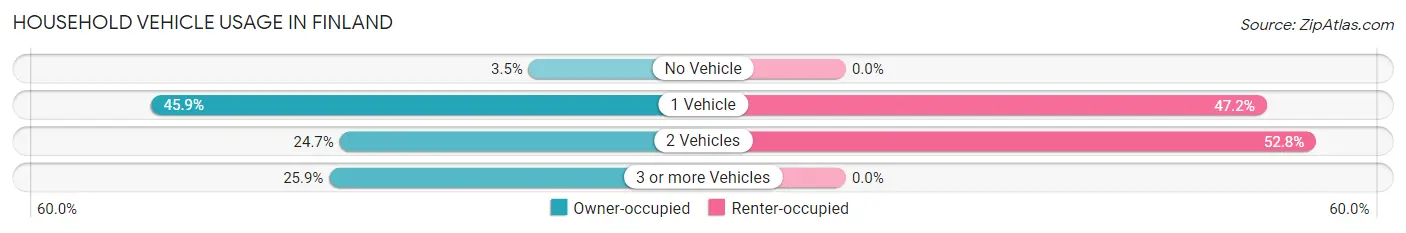
| Vehicles per Household | Owner-occupied | Renter-occupied |
| No Vehicle | 3 (3.5%) | 0 (0.0%) |
| 1 Vehicle | 39 (45.9%) | 17 (47.2%) |
| 2 Vehicles | 21 (24.7%) | 19 (52.8%) |
| 3 or more Vehicles | 22 (25.9%) | 0 (0.0%) |
| Total | 85 (100.0%) | 36 (100.0%) |
Real Estate & Mortgages in Finland
Real Estate and Mortgage Overview in Finland
| Characteristic | Without Mortgage | With Mortgage |
| Housing Units | 51 | 34 |
| Median Property Value | $121,100 | $137,500 |
| Median Household Income | - | - |
| Monthly Housing Costs | $438 | $0 |
| Real Estate Taxes | $1,456 | $0 |
Property Value by Mortgage Status in Finland
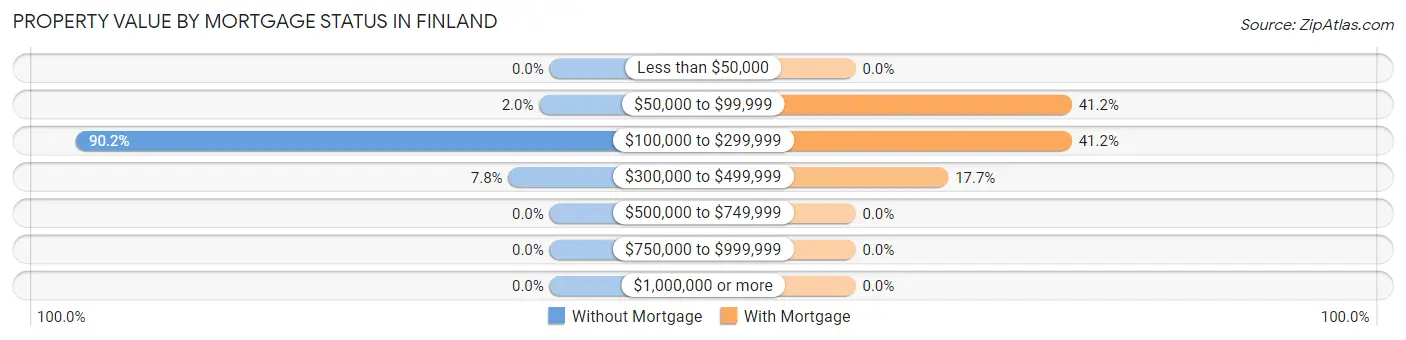
| Property Value | Without Mortgage | With Mortgage |
| Less than $50,000 | 0 (0.0%) | 0 (0.0%) |
| $50,000 to $99,999 | 1 (2.0%) | 14 (41.2%) |
| $100,000 to $299,999 | 46 (90.2%) | 14 (41.2%) |
| $300,000 to $499,999 | 4 (7.8%) | 6 (17.6%) |
| $500,000 to $749,999 | 0 (0.0%) | 0 (0.0%) |
| $750,000 to $999,999 | 0 (0.0%) | 0 (0.0%) |
| $1,000,000 or more | 0 (0.0%) | 0 (0.0%) |
| Total | 51 (100.0%) | 34 (100.0%) |
Household Income by Mortgage Status in Finland
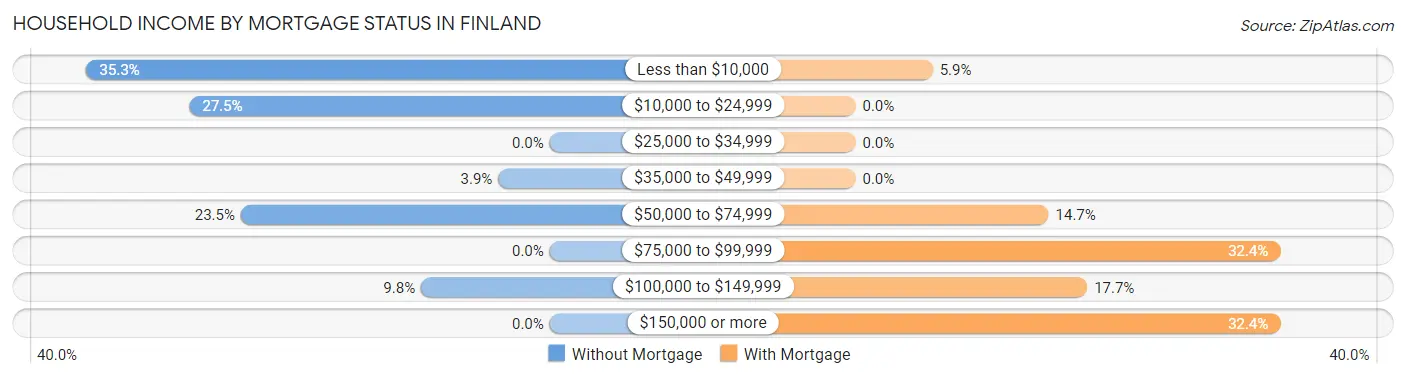
| Household Income | Without Mortgage | With Mortgage |
| Less than $10,000 | 18 (35.3%) | 2 (5.9%) |
| $10,000 to $24,999 | 14 (27.5%) | 0 (0.0%) |
| $25,000 to $34,999 | 0 (0.0%) | 0 (0.0%) |
| $35,000 to $49,999 | 2 (3.9%) | 0 (0.0%) |
| $50,000 to $74,999 | 12 (23.5%) | 5 (14.7%) |
| $75,000 to $99,999 | 0 (0.0%) | 11 (32.4%) |
| $100,000 to $149,999 | 5 (9.8%) | 6 (17.6%) |
| $150,000 or more | 0 (0.0%) | 11 (32.4%) |
| Total | 51 (100.0%) | 34 (100.0%) |
Property Value to Household Income Ratio in Finland
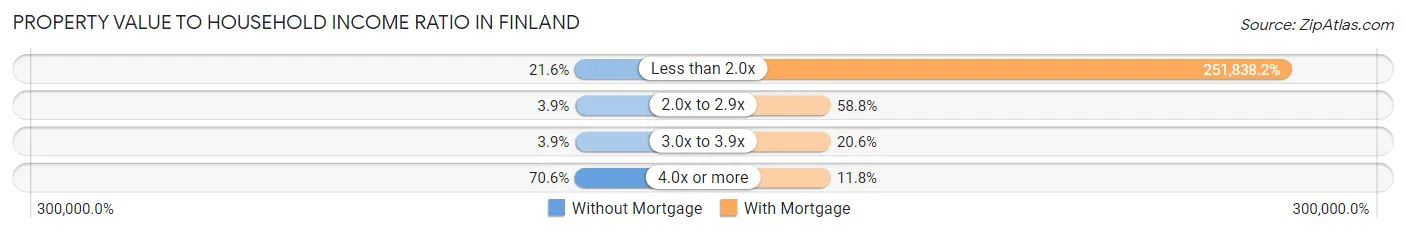
| Value-to-Income Ratio | Without Mortgage | With Mortgage |
| Less than 2.0x | 11 (21.6%) | 85,625 (251,838.2%) |
| 2.0x to 2.9x | 2 (3.9%) | 20 (58.8%) |
| 3.0x to 3.9x | 2 (3.9%) | 7 (20.6%) |
| 4.0x or more | 36 (70.6%) | 4 (11.8%) |
| Total | 51 (100.0%) | 34 (100.0%) |
Real Estate Taxes by Mortgage Status in Finland
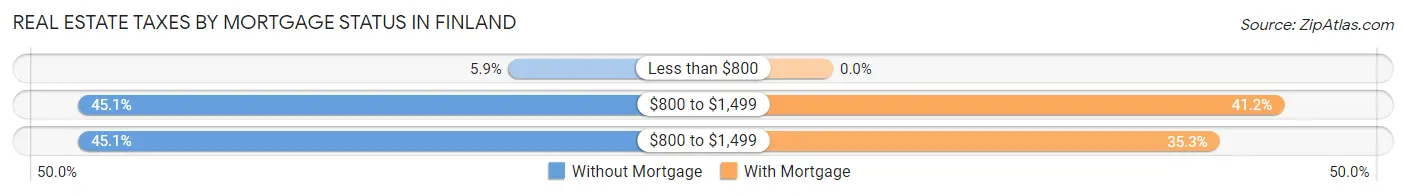
| Property Taxes | Without Mortgage | With Mortgage |
| Less than $800 | 3 (5.9%) | 0 (0.0%) |
| $800 to $1,499 | 23 (45.1%) | 14 (41.2%) |
| $800 to $1,499 | 23 (45.1%) | 12 (35.3%) |
| Total | 51 (100.0%) | 34 (100.0%) |
Health & Disability in Finland
Health Insurance Coverage by Age in Finland
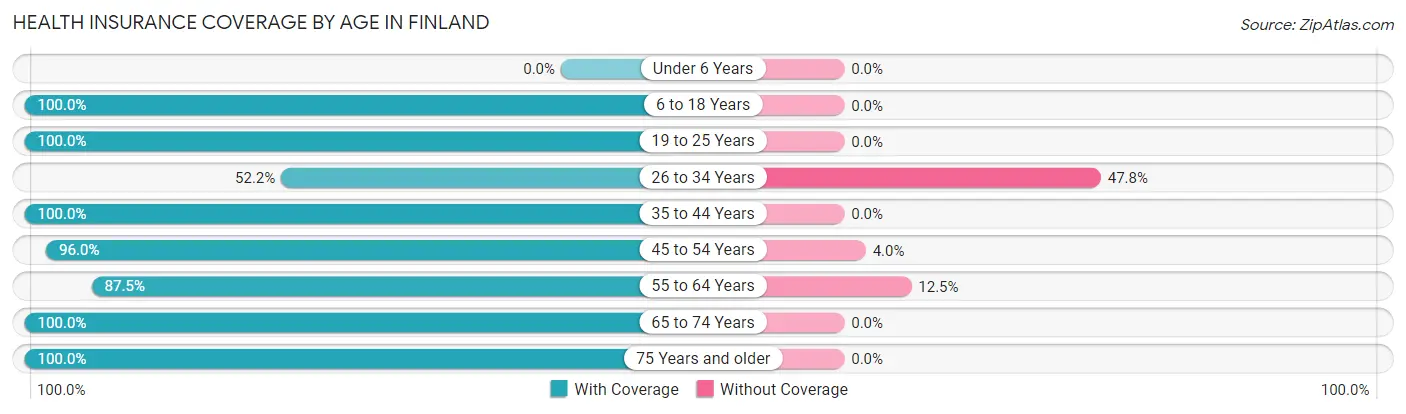
| Age Bracket | With Coverage | Without Coverage |
| Under 6 Years | 0 (0.0%) | 0 (0.0%) |
| 6 to 18 Years | 7 (100.0%) | 0 (0.0%) |
| 19 to 25 Years | 2 (100.0%) | 0 (0.0%) |
| 26 to 34 Years | 12 (52.2%) | 11 (47.8%) |
| 35 to 44 Years | 24 (100.0%) | 0 (0.0%) |
| 45 to 54 Years | 24 (96.0%) | 1 (4.0%) |
| 55 to 64 Years | 49 (87.5%) | 7 (12.5%) |
| 65 to 74 Years | 35 (100.0%) | 0 (0.0%) |
| 75 Years and older | 5 (100.0%) | 0 (0.0%) |
| Total | 158 (89.3%) | 19 (10.7%) |
Health Insurance Coverage by Citizenship Status in Finland
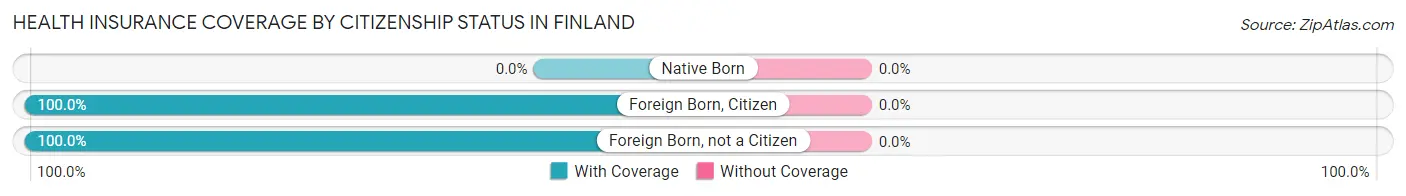
| Citizenship Status | With Coverage | Without Coverage |
| Native Born | 0 (0.0%) | 0 (0.0%) |
| Foreign Born, Citizen | 7 (100.0%) | 0 (0.0%) |
| Foreign Born, not a Citizen | 2 (100.0%) | 0 (0.0%) |
Health Insurance Coverage by Household Income in Finland
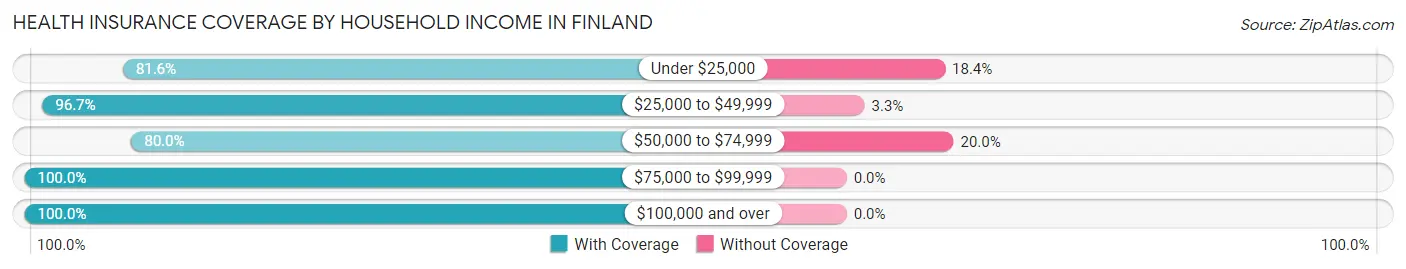
| Household Income | With Coverage | Without Coverage |
| Under $25,000 | 31 (81.6%) | 7 (18.4%) |
| $25,000 to $49,999 | 29 (96.7%) | 1 (3.3%) |
| $50,000 to $74,999 | 44 (80.0%) | 11 (20.0%) |
| $75,000 to $99,999 | 9 (100.0%) | 0 (0.0%) |
| $100,000 and over | 45 (100.0%) | 0 (0.0%) |
Public vs Private Health Insurance Coverage by Age in Finland
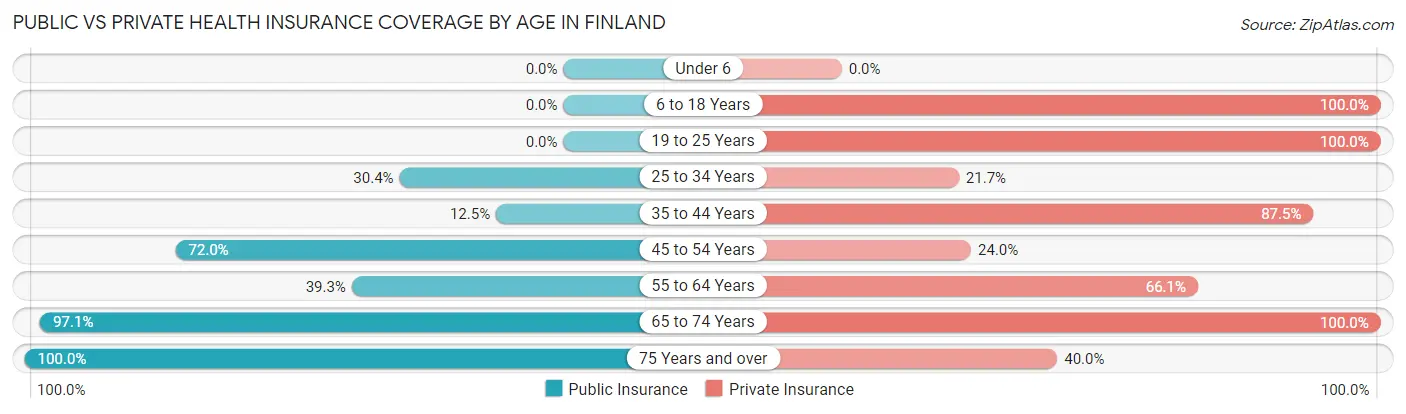
| Age Bracket | Public Insurance | Private Insurance |
| Under 6 | 0 (0.0%) | 0 (0.0%) |
| 6 to 18 Years | 0 (0.0%) | 7 (100.0%) |
| 19 to 25 Years | 0 (0.0%) | 2 (100.0%) |
| 25 to 34 Years | 7 (30.4%) | 5 (21.7%) |
| 35 to 44 Years | 3 (12.5%) | 21 (87.5%) |
| 45 to 54 Years | 18 (72.0%) | 6 (24.0%) |
| 55 to 64 Years | 22 (39.3%) | 37 (66.1%) |
| 65 to 74 Years | 34 (97.1%) | 35 (100.0%) |
| 75 Years and over | 5 (100.0%) | 2 (40.0%) |
| Total | 89 (50.3%) | 115 (65.0%) |
Disability Status by Sex by Age in Finland
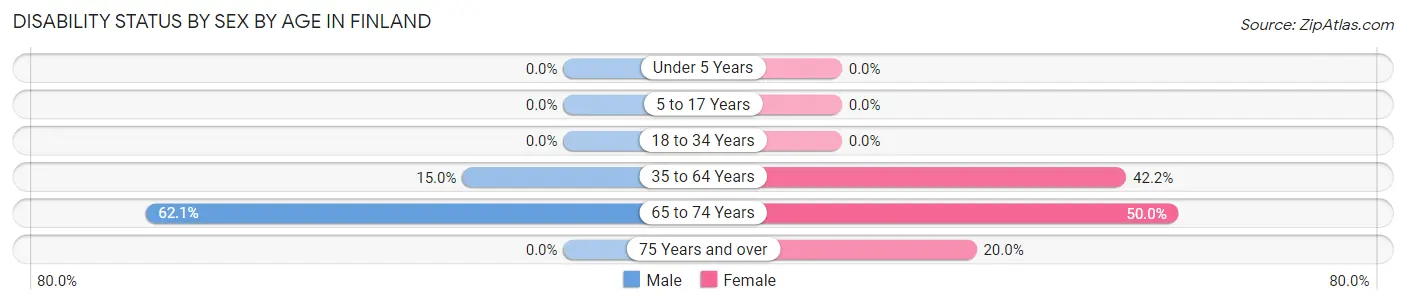
| Age Bracket | Male | Female |
| Under 5 Years | 0 (0.0%) | 0 (0.0%) |
| 5 to 17 Years | 0 (0.0%) | 0 (0.0%) |
| 18 to 34 Years | 0 (0.0%) | 0 (0.0%) |
| 35 to 64 Years | 9 (15.0%) | 19 (42.2%) |
| 65 to 74 Years | 18 (62.1%) | 3 (50.0%) |
| 75 Years and over | 0 (0.0%) | 1 (20.0%) |
Disability Class by Sex by Age in Finland
Disability Class: Hearing Difficulty
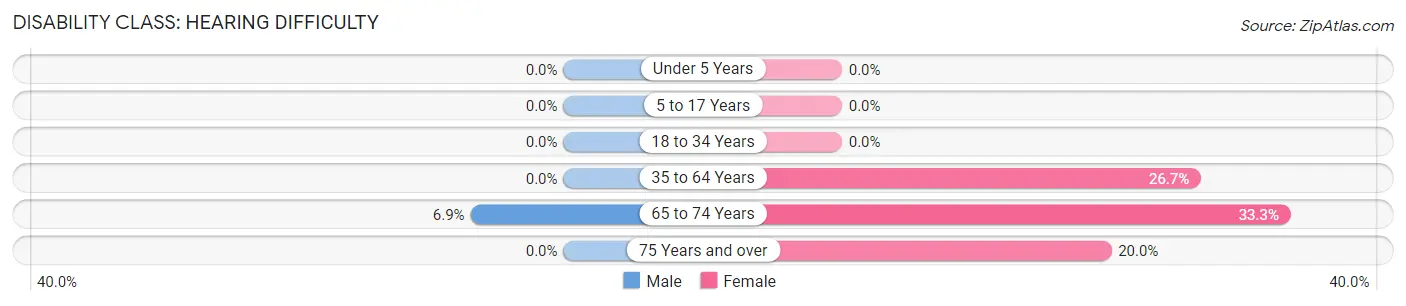
| Age Bracket | Male | Female |
| Under 5 Years | 0 (0.0%) | 0 (0.0%) |
| 5 to 17 Years | 0 (0.0%) | 0 (0.0%) |
| 18 to 34 Years | 0 (0.0%) | 0 (0.0%) |
| 35 to 64 Years | 0 (0.0%) | 12 (26.7%) |
| 65 to 74 Years | 2 (6.9%) | 2 (33.3%) |
| 75 Years and over | 0 (0.0%) | 1 (20.0%) |
Disability Class: Vision Difficulty
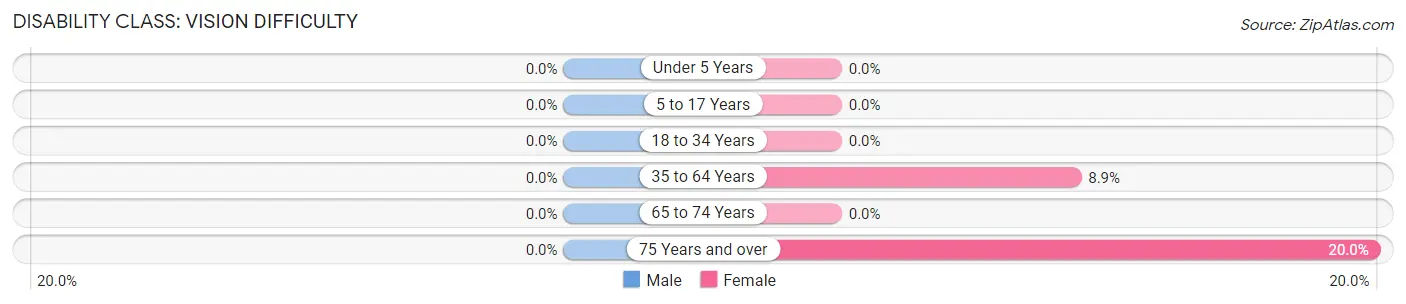
| Age Bracket | Male | Female |
| Under 5 Years | 0 (0.0%) | 0 (0.0%) |
| 5 to 17 Years | 0 (0.0%) | 0 (0.0%) |
| 18 to 34 Years | 0 (0.0%) | 0 (0.0%) |
| 35 to 64 Years | 0 (0.0%) | 4 (8.9%) |
| 65 to 74 Years | 0 (0.0%) | 0 (0.0%) |
| 75 Years and over | 0 (0.0%) | 1 (20.0%) |
Disability Class: Cognitive Difficulty
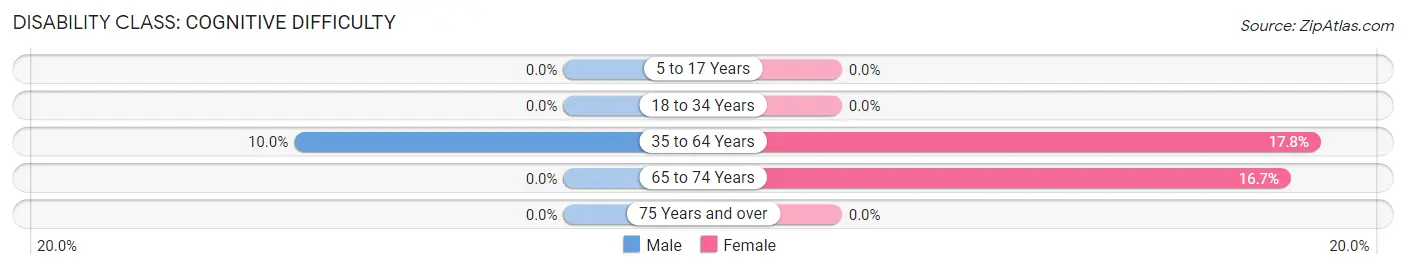
| Age Bracket | Male | Female |
| 5 to 17 Years | 0 (0.0%) | 0 (0.0%) |
| 18 to 34 Years | 0 (0.0%) | 0 (0.0%) |
| 35 to 64 Years | 6 (10.0%) | 8 (17.8%) |
| 65 to 74 Years | 0 (0.0%) | 1 (16.7%) |
| 75 Years and over | 0 (0.0%) | 0 (0.0%) |
Disability Class: Ambulatory Difficulty
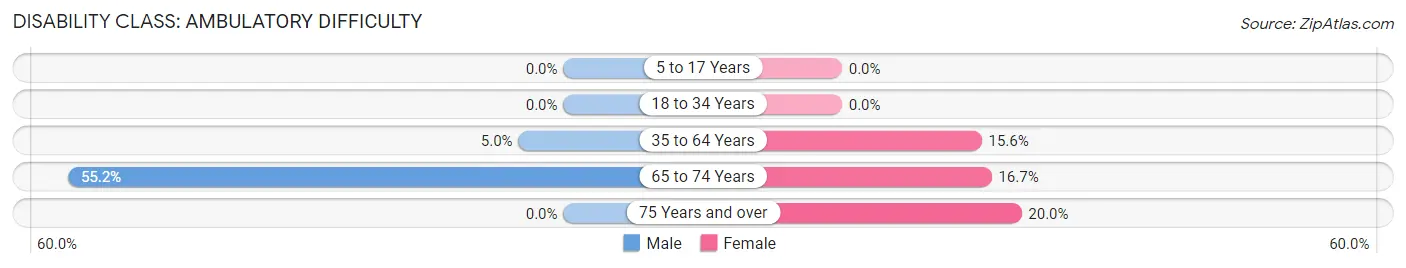
| Age Bracket | Male | Female |
| 5 to 17 Years | 0 (0.0%) | 0 (0.0%) |
| 18 to 34 Years | 0 (0.0%) | 0 (0.0%) |
| 35 to 64 Years | 3 (5.0%) | 7 (15.6%) |
| 65 to 74 Years | 16 (55.2%) | 1 (16.7%) |
| 75 Years and over | 0 (0.0%) | 1 (20.0%) |
Disability Class: Self-Care Difficulty
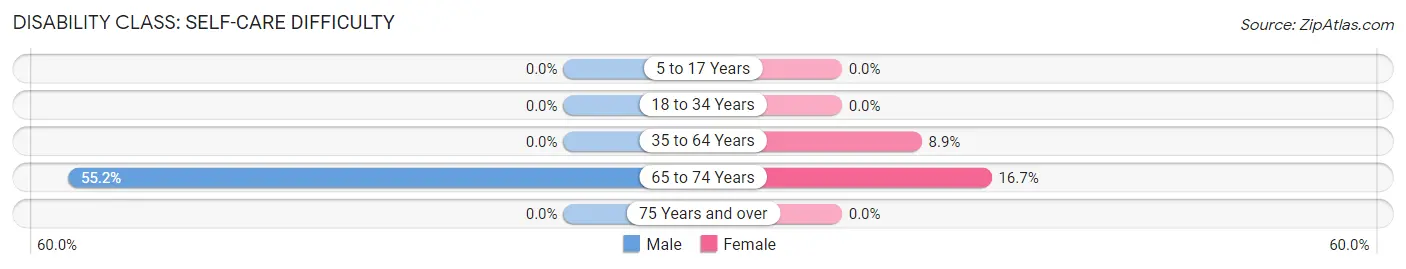
| Age Bracket | Male | Female |
| 5 to 17 Years | 0 (0.0%) | 0 (0.0%) |
| 18 to 34 Years | 0 (0.0%) | 0 (0.0%) |
| 35 to 64 Years | 0 (0.0%) | 4 (8.9%) |
| 65 to 74 Years | 16 (55.2%) | 1 (16.7%) |
| 75 Years and over | 0 (0.0%) | 0 (0.0%) |
Technology Access in Finland
Computing Device Access in Finland
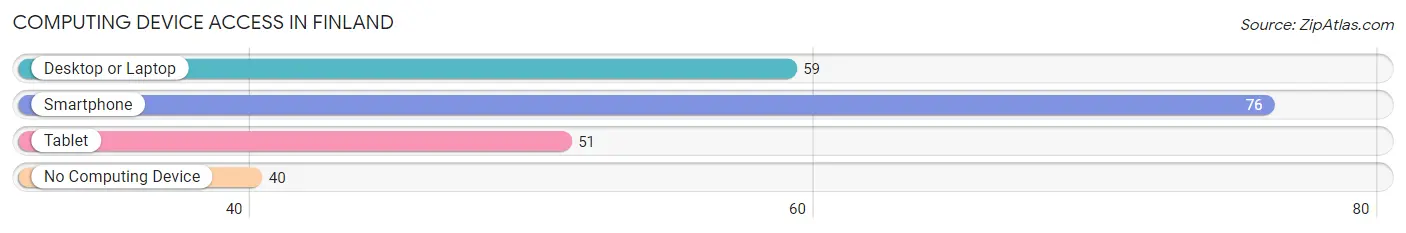
| Device Type | # Households | % Households |
| Desktop or Laptop | 59 | 48.8% |
| Smartphone | 76 | 62.8% |
| Tablet | 51 | 42.1% |
| No Computing Device | 40 | 33.1% |
| Total | 121 | 100.0% |
Internet Access in Finland
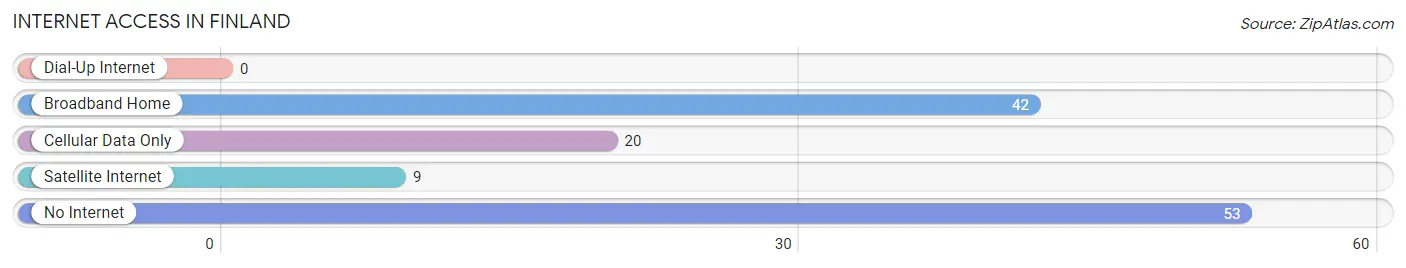
| Internet Type | # Households | % Households |
| Dial-Up Internet | 0 | 0.0% |
| Broadband Home | 42 | 34.7% |
| Cellular Data Only | 20 | 16.5% |
| Satellite Internet | 9 | 7.4% |
| No Internet | 53 | 43.8% |
| Total | 121 | 100.0% |
Finland Summary
Finland, Minnesota is a small town located in the northeastern corner of the state, just south of the Canadian border. It is part of the Arrowhead region of Minnesota, and is known for its natural beauty and outdoor recreation opportunities. The town has a population of just over 1,000 people, and is home to a variety of businesses, including a ski resort, a golf course, and a number of restaurants and shops.
Geography
Finland is located in the Arrowhead region of Minnesota, which is known for its rugged terrain and abundant natural resources. The town is situated on the shore of Lake Superior, and is surrounded by the Superior National Forest. The town is located in the heart of the Boundary Waters Canoe Area Wilderness, which is a popular destination for outdoor recreation. The town is also located near the Boundary Waters Canoe Area Wilderness, which is a popular destination for canoeing and fishing.
The town is located in St. Louis County, and is part of the Duluth Metropolitan Statistical Area. The town is located approximately 25 miles north of Duluth, and is accessible by car via Highway 61. The town is also served by the Duluth International Airport, which is located approximately 30 miles away.
History
The area that is now Finland was first settled in the late 1800s by Finnish immigrants. The town was officially incorporated in 1906, and was named after the country of Finland. The town was originally a logging and mining town, and was home to a number of sawmills and mines. The town was also home to a number of Finnish-American businesses, including a bakery, a grocery store, and a hotel.
In the early 1900s, the town began to attract tourists, and a number of resorts were built in the area. The town was also home to a number of summer camps, and was a popular destination for outdoor recreation. The town was also home to a number of Finnish-American cultural organizations, including the Finnish-American Historical Society and the Finnish-American Cultural Center.
Economy
The economy of Finland is largely based on tourism and outdoor recreation. The town is home to a number of resorts, including the Finland Ski Resort, which is a popular destination for skiing and snowboarding. The town is also home to a number of restaurants and shops, as well as a golf course. The town is also home to a number of businesses that provide services to the local community, including a bank, a post office, and a library.
Demographics
As of the 2010 census, the population of Finland was 1,072. The town has a median age of 44.7 years, and a median household income of $45,000. The town is predominantly white, with 95.3% of the population identifying as white. The town is also home to a number of Finnish-American residents, with 8.3% of the population identifying as Finnish-American. The town is also home to a number of Native American residents, with 1.2% of the population identifying as Native American.
Common Questions
What is Per Capita Income in Finland?
Per Capita income in Finland is $33,476.
What is the Median Family Income in Finland?
Median Family Income in Finland is $85,938.
What is the Median Household income in Finland?
Median Household Income in Finland is $49,688.
What is Inequality or Gini Index in Finland?
Inequality or Gini Index in Finland is 0.45.
What is the Total Population of Finland?
Total Population of Finland is 177.
What is the Total Male Population of Finland?
Total Male Population of Finland is 104.
What is the Total Female Population of Finland?
Total Female Population of Finland is 73.
What is the Ratio of Males per 100 Females in Finland?
There are 142.47 Males per 100 Females in Finland.
What is the Ratio of Females per 100 Males in Finland?
There are 70.19 Females per 100 Males in Finland.
What is the Median Population Age in Finland?
Median Population Age in Finland is 56.3 Years.
What is the Average Family Size in Finland
Average Family Size in Finland is 2.2 People.
What is the Average Household Size in Finland
Average Household Size in Finland is 1.5 People.
How Large is the Labor Force in Finland?
There are 69 People in the Labor Forcein in Finland.
What is the Percentage of People in the Labor Force in Finland?
40.6% of People are in the Labor Force in Finland.
What is the Unemployment Rate in Finland?
Unemployment Rate in Finland is 4.3%.