Zip Codes with the Highest Percentage of Population Employed in Architecture & Engineering in Minnesota
RELATED REPORTS & OPTIONS
Architecture & Engineering
Minnesota
Compare Zip Codes
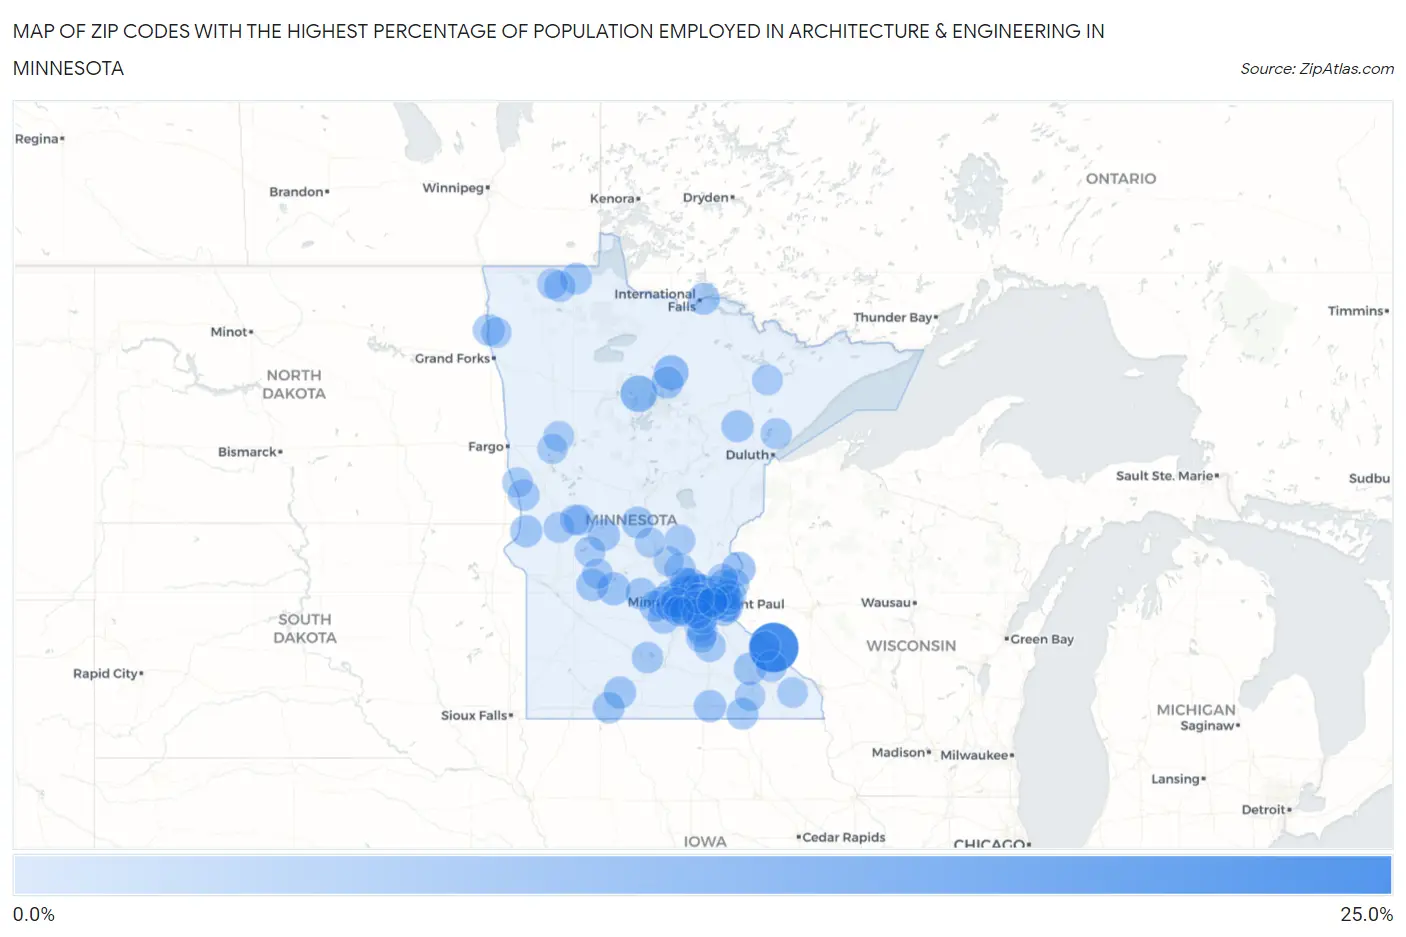
Map of Zip Codes with the Highest Percentage of Population Employed in Architecture & Engineering in Minnesota
0.0%
25.0%
Zip Codes with the Highest Percentage of Population Employed in Architecture & Engineering in Minnesota
| Zip Code | % Employed | vs State | vs National | |
| 1. | 55968 | 22.0% | 2.4%(+19.6)#1 | 2.1%(+19.9)#86 |
| 2. | 56663 | 9.1% | 2.4%(+6.72)#2 | 2.1%(+6.94)#407 |
| 3. | 56688 | 7.1% | 2.4%(+4.77)#3 | 2.1%(+4.99)#717 |
| 4. | 55340 | 6.7% | 2.4%(+4.32)#4 | 2.1%(+4.54)#830 |
| 5. | 55374 | 6.7% | 2.4%(+4.31)#5 | 2.1%(+4.53)#831 |
| 6. | 55074 | 6.5% | 2.4%(+4.13)#6 | 2.1%(+4.35)#889 |
| 7. | 55363 | 5.8% | 2.4%(+3.38)#7 | 2.1%(+3.60)#1,197 |
| 8. | 56251 | 5.7% | 2.4%(+3.37)#8 | 2.1%(+3.59)#1,201 |
| 9. | 55395 | 5.3% | 2.4%(+2.97)#9 | 2.1%(+3.19)#1,428 |
| 10. | 55126 | 5.3% | 2.4%(+2.89)#10 | 2.1%(+3.11)#1,480 |
| 11. | 55960 | 5.2% | 2.4%(+2.88)#11 | 2.1%(+3.10)#1,492 |
| 12. | 55370 | 5.2% | 2.4%(+2.80)#12 | 2.1%(+3.02)#1,546 |
| 13. | 55446 | 5.1% | 2.4%(+2.77)#13 | 2.1%(+2.99)#1,579 |
| 14. | 56252 | 5.1% | 2.4%(+2.73)#14 | 2.1%(+2.94)#1,599 |
| 15. | 55401 | 5.1% | 2.4%(+2.72)#15 | 2.1%(+2.94)#1,603 |
| 16. | 56043 | 5.1% | 2.4%(+2.68)#16 | 2.1%(+2.90)#1,632 |
| 17. | 55346 | 5.0% | 2.4%(+2.67)#17 | 2.1%(+2.89)#1,637 |
| 18. | 56680 | 5.0% | 2.4%(+2.63)#18 | 2.1%(+2.85)#1,661 |
| 19. | 56160 | 4.9% | 2.4%(+2.53)#19 | 2.1%(+2.75)#1,737 |
| 20. | 55765 | 4.9% | 2.4%(+2.53)#20 | 2.1%(+2.75)#1,739 |
| 21. | 56296 | 4.9% | 2.4%(+2.52)#21 | 2.1%(+2.74)#1,756 |
| 22. | 56389 | 4.9% | 2.4%(+2.51)#22 | 2.1%(+2.73)#1,765 |
| 23. | 55055 | 4.9% | 2.4%(+2.50)#23 | 2.1%(+2.72)#1,772 |
| 24. | 56668 | 4.9% | 2.4%(+2.49)#24 | 2.1%(+2.71)#1,781 |
| 25. | 55357 | 4.8% | 2.4%(+2.43)#25 | 2.1%(+2.65)#1,830 |
| 26. | 55311 | 4.8% | 2.4%(+2.38)#26 | 2.1%(+2.60)#1,877 |
| 27. | 56143 | 4.6% | 2.4%(+2.26)#27 | 2.1%(+2.48)#1,992 |
| 28. | 55977 | 4.6% | 2.4%(+2.23)#28 | 2.1%(+2.45)#2,022 |
| 29. | 55369 | 4.6% | 2.4%(+2.23)#29 | 2.1%(+2.45)#2,025 |
| 30. | 55324 | 4.6% | 2.4%(+2.19)#30 | 2.1%(+2.41)#2,059 |
| 31. | 55442 | 4.5% | 2.4%(+2.17)#31 | 2.1%(+2.39)#2,082 |
| 32. | 56328 | 4.5% | 2.4%(+2.13)#32 | 2.1%(+2.35)#2,131 |
| 33. | 55414 | 4.5% | 2.4%(+2.12)#33 | 2.1%(+2.33)#2,148 |
| 34. | 56744 | 4.5% | 2.4%(+2.10)#34 | 2.1%(+2.32)#2,166 |
| 35. | 56756 | 4.5% | 2.4%(+2.10)#35 | 2.1%(+2.32)#2,170 |
| 36. | 55445 | 4.4% | 2.4%(+2.06)#36 | 2.1%(+2.28)#2,215 |
| 37. | 55381 | 4.4% | 2.4%(+2.03)#37 | 2.1%(+2.25)#2,253 |
| 38. | 55019 | 4.4% | 2.4%(+2.03)#38 | 2.1%(+2.25)#2,259 |
| 39. | 56520 | 4.4% | 2.4%(+2.00)#39 | 2.1%(+2.22)#2,299 |
| 40. | 56751 | 4.3% | 2.4%(+1.97)#40 | 2.1%(+2.19)#2,331 |
| 41. | 55410 | 4.3% | 2.4%(+1.92)#41 | 2.1%(+2.14)#2,382 |
| 42. | 55101 | 4.2% | 2.4%(+1.88)#42 | 2.1%(+2.10)#2,437 |
| 43. | 56021 | 4.2% | 2.4%(+1.87)#43 | 2.1%(+2.09)#2,451 |
| 44. | 55328 | 4.1% | 2.4%(+1.77)#44 | 2.1%(+1.99)#2,565 |
| 45. | 55427 | 4.0% | 2.4%(+1.63)#45 | 2.1%(+1.85)#2,765 |
| 46. | 55364 | 4.0% | 2.4%(+1.62)#46 | 2.1%(+1.84)#2,785 |
| 47. | 55803 | 4.0% | 2.4%(+1.61)#47 | 2.1%(+1.83)#2,800 |
| 48. | 55964 | 4.0% | 2.4%(+1.60)#48 | 2.1%(+1.82)#2,824 |
| 49. | 55413 | 3.9% | 2.4%(+1.58)#49 | 2.1%(+1.80)#2,854 |
| 50. | 55309 | 3.9% | 2.4%(+1.58)#50 | 2.1%(+1.79)#2,861 |
| 51. | 55447 | 3.9% | 2.4%(+1.57)#51 | 2.1%(+1.79)#2,875 |
| 52. | 55426 | 3.9% | 2.4%(+1.53)#52 | 2.1%(+1.75)#2,938 |
| 53. | 55372 | 3.9% | 2.4%(+1.50)#53 | 2.1%(+1.72)#2,978 |
| 54. | 55038 | 3.8% | 2.4%(+1.44)#54 | 2.1%(+1.66)#3,070 |
| 55. | 55418 | 3.8% | 2.4%(+1.44)#55 | 2.1%(+1.66)#3,071 |
| 56. | 55047 | 3.8% | 2.4%(+1.44)#56 | 2.1%(+1.66)#3,079 |
| 57. | 55305 | 3.7% | 2.4%(+1.38)#57 | 2.1%(+1.60)#3,205 |
| 58. | 55129 | 3.7% | 2.4%(+1.37)#58 | 2.1%(+1.59)#3,224 |
| 59. | 56334 | 3.7% | 2.4%(+1.32)#59 | 2.1%(+1.54)#3,320 |
| 60. | 56330 | 3.7% | 2.4%(+1.32)#60 | 2.1%(+1.53)#3,332 |
| 61. | 55360 | 3.7% | 2.4%(+1.30)#61 | 2.1%(+1.52)#3,367 |
| 62. | 55435 | 3.7% | 2.4%(+1.28)#62 | 2.1%(+1.50)#3,397 |
| 63. | 56332 | 3.6% | 2.4%(+1.27)#63 | 2.1%(+1.49)#3,430 |
| 64. | 55732 | 3.6% | 2.4%(+1.25)#64 | 2.1%(+1.47)#3,471 |
| 65. | 56714 | 3.6% | 2.4%(+1.25)#65 | 2.1%(+1.47)#3,478 |
| 66. | 55416 | 3.6% | 2.4%(+1.22)#66 | 2.1%(+1.43)#3,541 |
| 67. | 55125 | 3.6% | 2.4%(+1.21)#67 | 2.1%(+1.43)#3,558 |
| 68. | 55105 | 3.6% | 2.4%(+1.20)#68 | 2.1%(+1.42)#3,563 |
| 69. | 55375 | 3.6% | 2.4%(+1.20)#69 | 2.1%(+1.42)#3,578 |
| 70. | 55102 | 3.6% | 2.4%(+1.20)#70 | 2.1%(+1.41)#3,581 |
| 71. | 56311 | 3.5% | 2.4%(+1.18)#71 | 2.1%(+1.40)#3,617 |
| 72. | 56289 | 3.5% | 2.4%(+1.15)#72 | 2.1%(+1.37)#3,684 |
| 73. | 56710 | 3.5% | 2.4%(+1.15)#73 | 2.1%(+1.37)#3,693 |
| 74. | 55020 | 3.5% | 2.4%(+1.14)#74 | 2.1%(+1.36)#3,714 |
| 75. | 55971 | 3.5% | 2.4%(+1.12)#75 | 2.1%(+1.34)#3,761 |
| 76. | 55376 | 3.5% | 2.4%(+1.11)#76 | 2.1%(+1.33)#3,798 |
| 77. | 55408 | 3.5% | 2.4%(+1.11)#77 | 2.1%(+1.33)#3,802 |
| 78. | 56315 | 3.5% | 2.4%(+1.09)#78 | 2.1%(+1.31)#3,828 |
| 79. | 55088 | 3.5% | 2.4%(+1.08)#79 | 2.1%(+1.30)#3,848 |
| 80. | 55388 | 3.4% | 2.4%(+1.08)#80 | 2.1%(+1.30)#3,865 |
| 81. | 55345 | 3.4% | 2.4%(+1.07)#81 | 2.1%(+1.29)#3,874 |
| 82. | 56553 | 3.4% | 2.4%(+1.04)#82 | 2.1%(+1.26)#3,947 |
| 83. | 56521 | 3.4% | 2.4%(+1.03)#83 | 2.1%(+1.25)#3,958 |
| 84. | 55041 | 3.4% | 2.4%(+1.01)#84 | 2.1%(+1.23)#4,006 |
| 85. | 55108 | 3.4% | 2.4%(+0.986)#85 | 2.1%(+1.20)#4,059 |
| 86. | 56511 | 3.3% | 2.4%(+0.975)#86 | 2.1%(+1.19)#4,083 |
| 87. | 55082 | 3.3% | 2.4%(+0.936)#87 | 2.1%(+1.16)#4,184 |
| 88. | 55115 | 3.3% | 2.4%(+0.933)#88 | 2.1%(+1.15)#4,192 |
| 89. | 55113 | 3.3% | 2.4%(+0.931)#89 | 2.1%(+1.15)#4,196 |
| 90. | 55386 | 3.3% | 2.4%(+0.922)#90 | 2.1%(+1.14)#4,228 |
| 91. | 55378 | 3.3% | 2.4%(+0.919)#91 | 2.1%(+1.14)#4,238 |
| 92. | 55025 | 3.3% | 2.4%(+0.901)#92 | 2.1%(+1.12)#4,274 |
| 93. | 55347 | 3.2% | 2.4%(+0.881)#93 | 2.1%(+1.10)#4,330 |
| 94. | 55042 | 3.2% | 2.4%(+0.872)#94 | 2.1%(+1.09)#4,353 |
| 95. | 55319 | 3.2% | 2.4%(+0.871)#95 | 2.1%(+1.09)#4,356 |
| 96. | 55441 | 3.2% | 2.4%(+0.858)#96 | 2.1%(+1.08)#4,396 |
| 97. | 55387 | 3.2% | 2.4%(+0.847)#97 | 2.1%(+1.07)#4,424 |
| 98. | 55114 | 3.2% | 2.4%(+0.837)#98 | 2.1%(+1.06)#4,449 |
| 99. | 56375 | 3.2% | 2.4%(+0.796)#99 | 2.1%(+1.02)#4,562 |
| 100. | 55967 | 3.2% | 2.4%(+0.786)#100 | 2.1%(+1.00)#4,593 |
Common Questions
What are the Top 10 Zip Codes with the Highest Percentage of Population Employed in Architecture & Engineering in Minnesota?
Top 10 Zip Codes with the Highest Percentage of Population Employed in Architecture & Engineering in Minnesota are:
What zip code has the Highest Percentage of Population Employed in Architecture & Engineering in Minnesota?
55968 has the Highest Percentage of Population Employed in Architecture & Engineering in Minnesota with 22.0%.
What is the Percentage of Population Employed in Architecture & Engineering in the State of Minnesota?
Percentage of Population Employed in Architecture & Engineering in Minnesota is 2.4%.
What is the Percentage of Population Employed in Architecture & Engineering in the United States?
Percentage of Population Employed in Architecture & Engineering in the United States is 2.1%.