St Michael, MN Map & Demographics
St Michael Map
St Michael Overview
$48,167
PER CAPITA INCOME
$132,048
AVG FAMILY INCOME
$123,318
AVG HOUSEHOLD INCOME
27.8%
WAGE / INCOME GAP [ % ]
72.2¢/ $1
WAGE / INCOME GAP [ $ ]
0.32
INEQUALITY / GINI INDEX
18,648
TOTAL POPULATION
10,031
MALE POPULATION
8,617
FEMALE POPULATION
116.41
MALES / 100 FEMALES
85.90
FEMALES / 100 MALES
35.7
MEDIAN AGE
3.2
AVG FAMILY SIZE
2.8
AVG HOUSEHOLD SIZE
10,910
LABOR FORCE [ PEOPLE ]
78.4%
PERCENT IN LABOR FORCE
2.6%
UNEMPLOYMENT RATE
Income in St Michael
Income Overview in St Michael
Per Capita Income in St Michael is $48,167, while median incomes of families and households are $132,048 and $123,318 respectively.
| Characteristic | Number | Measure |
| Per Capita Income | 18,648 | $48,167 |
| Median Family Income | 5,241 | $132,048 |
| Mean Family Income | 5,241 | $152,072 |
| Median Household Income | 6,579 | $123,318 |
| Mean Household Income | 6,579 | $139,580 |
| Income Deficit | 5,241 | $0 |
| Wage / Income Gap (%) | 18,648 | 27.85% |
| Wage / Income Gap ($) | 18,648 | 72.15¢ per $1 |
| Gini / Inequality Index | 18,648 | 0.32 |
Earnings by Sex in St Michael
Average Earnings in St Michael are $58,927, $68,068 for men and $49,114 for women, a difference of 27.9%.
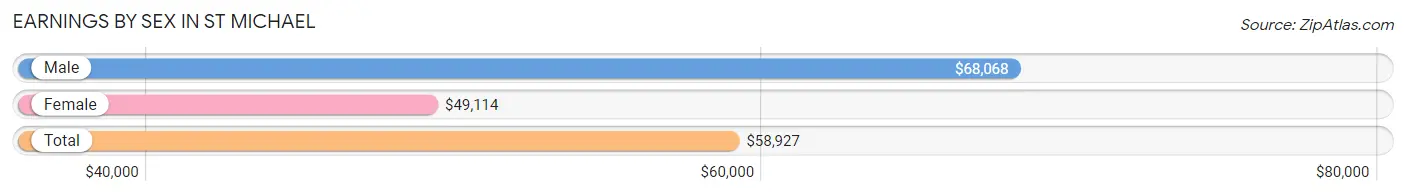
| Sex | Number | Average Earnings |
| Male | 6,295 (55.2%) | $68,068 |
| Female | 5,108 (44.8%) | $49,114 |
| Total | 11,403 (100.0%) | $58,927 |
Earnings by Sex by Income Bracket in St Michael
The most common earnings brackets in St Michael are $100,000+ for men (1,878 | 29.8%) and $100,000+ for women (667 | 13.1%).
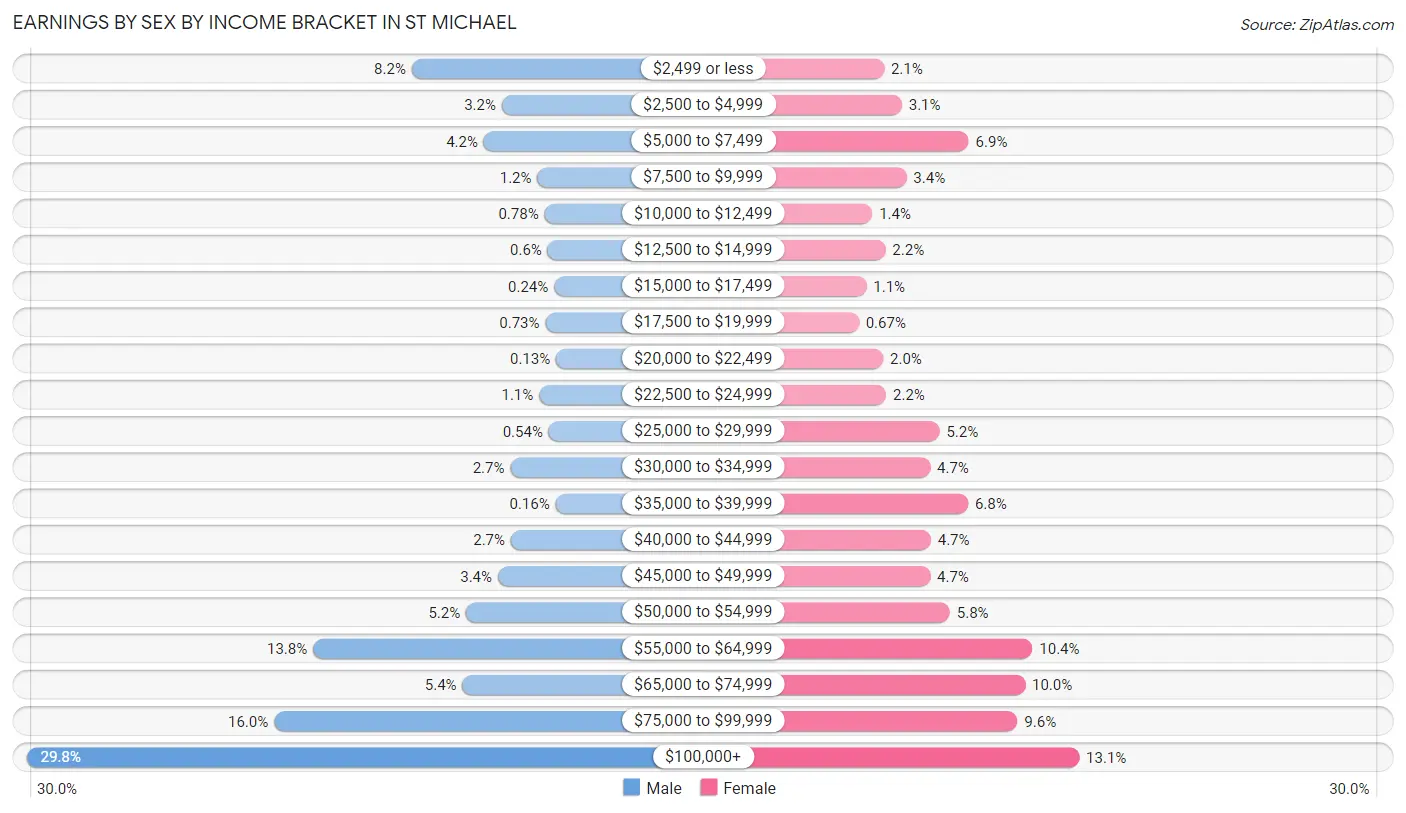
| Income | Male | Female |
| $2,499 or less | 519 (8.2%) | 107 (2.1%) |
| $2,500 to $4,999 | 200 (3.2%) | 158 (3.1%) |
| $5,000 to $7,499 | 264 (4.2%) | 350 (6.9%) |
| $7,500 to $9,999 | 74 (1.2%) | 171 (3.4%) |
| $10,000 to $12,499 | 49 (0.8%) | 73 (1.4%) |
| $12,500 to $14,999 | 38 (0.6%) | 111 (2.2%) |
| $15,000 to $17,499 | 15 (0.2%) | 56 (1.1%) |
| $17,500 to $19,999 | 46 (0.7%) | 34 (0.7%) |
| $20,000 to $22,499 | 8 (0.1%) | 104 (2.0%) |
| $22,500 to $24,999 | 68 (1.1%) | 113 (2.2%) |
| $25,000 to $29,999 | 34 (0.5%) | 266 (5.2%) |
| $30,000 to $34,999 | 170 (2.7%) | 239 (4.7%) |
| $35,000 to $39,999 | 10 (0.2%) | 348 (6.8%) |
| $40,000 to $44,999 | 168 (2.7%) | 241 (4.7%) |
| $45,000 to $49,999 | 214 (3.4%) | 239 (4.7%) |
| $50,000 to $54,999 | 327 (5.2%) | 296 (5.8%) |
| $55,000 to $64,999 | 868 (13.8%) | 533 (10.4%) |
| $65,000 to $74,999 | 339 (5.4%) | 512 (10.0%) |
| $75,000 to $99,999 | 1,006 (16.0%) | 490 (9.6%) |
| $100,000+ | 1,878 (29.8%) | 667 (13.1%) |
| Total | 6,295 (100.0%) | 5,108 (100.0%) |
Earnings by Sex by Educational Attainment in St Michael
Average earnings in St Michael are $80,679 for men and $54,198 for women, a difference of 32.8%. Men with an educational attainment of graduate degree enjoy the highest average annual earnings of $115,077, while those with high school diploma education earn the least with $56,250. Women with an educational attainment of graduate degree earn the most with the average annual earnings of $69,180, while those with college or associate's degree education have the smallest earnings of $38,537.
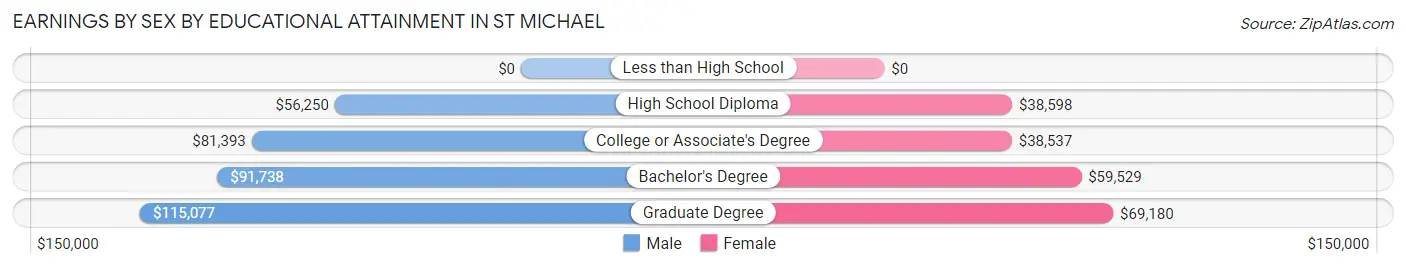
| Educational Attainment | Male Income | Female Income |
| Less than High School | - | - |
| High School Diploma | $56,250 | $38,598 |
| College or Associate's Degree | $81,393 | $38,537 |
| Bachelor's Degree | $91,738 | $59,529 |
| Graduate Degree | $115,077 | $69,180 |
| Total | $80,679 | $54,198 |
Family Income in St Michael
Family Income Brackets in St Michael
According to the St Michael family income data, there are 1,923 families falling into the $100,000 to $149,999 income range, which is the most common income bracket and makes up 36.7% of all families.
| Income Bracket | # Families | % Families |
| Less than $10,000 | 63 | 1.2% |
| $10,000 to $14,999 | 37 | 0.7% |
| $15,000 to $24,999 | 0 | 0.0% |
| $25,000 to $34,999 | 94 | 1.8% |
| $35,000 to $49,999 | 121 | 2.3% |
| $50,000 to $74,999 | 356 | 6.8% |
| $75,000 to $99,999 | 540 | 10.3% |
| $100,000 to $149,999 | 1,923 | 36.7% |
| $150,000 to $199,999 | 1,237 | 23.6% |
| $200,000+ | 870 | 16.6% |
Family Income by Famaliy Size in St Michael
3-person families (1,193 | 22.8%) account for the highest median family income in St Michael with $158,475 per family, while 2-person families (1,938 | 37.0%) have the highest median income of $54,578 per family member.
| Income Bracket | # Families | Median Income |
| 2-Person Families | 1,938 (37.0%) | $109,156 |
| 3-Person Families | 1,193 (22.8%) | $158,475 |
| 4-Person Families | 1,336 (25.5%) | $130,841 |
| 5-Person Families | 399 (7.6%) | $154,954 |
| 6-Person Families | 222 (4.2%) | $149,542 |
| 7+ Person Families | 153 (2.9%) | $154,955 |
| Total | 5,241 (100.0%) | $132,048 |
Family Income by Number of Earners in St Michael
The median family income in St Michael is $132,048, with families comprising 3+ earners (904) having the highest median family income of $170,962, while families with no earners (308) have the lowest median family income of $73,125, accounting for 17.2% and 5.9% of families, respectively.
| Number of Earners | # Families | Median Income |
| No Earners | 308 (5.9%) | $73,125 |
| 1 Earner | 946 (18.0%) | $86,296 |
| 2 Earners | 3,083 (58.8%) | $137,339 |
| 3+ Earners | 904 (17.2%) | $170,962 |
| Total | 5,241 (100.0%) | $132,048 |
Household Income in St Michael
Household Income Brackets in St Michael
With 2,250 households falling in the category, the $100,000 to $149,999 income range is the most frequent in St Michael, accounting for 34.2% of all households. In contrast, only 79 households (1.2%) fall into the $15,000 to $24,999 income bracket, making it the least populous group.
| Income Bracket | # Households | % Households |
| Less than $10,000 | 171 | 2.6% |
| $10,000 to $14,999 | 99 | 1.5% |
| $15,000 to $24,999 | 79 | 1.2% |
| $25,000 to $34,999 | 138 | 2.1% |
| $35,000 to $49,999 | 237 | 3.6% |
| $50,000 to $74,999 | 507 | 7.7% |
| $75,000 to $99,999 | 717 | 10.9% |
| $100,000 to $149,999 | 2,250 | 34.2% |
| $150,000 to $199,999 | 1,421 | 21.6% |
| $200,000+ | 961 | 14.6% |
Household Income by Householder Age in St Michael
The median household income in St Michael is $123,318, with the highest median household income of $149,205 found in the 45 to 64 years age bracket for the primary householder. A total of 2,674 households (40.6%) fall into this category. Meanwhile, the 65+ years age bracket for the primary householder has the lowest median household income of $69,801, with 1,161 households (17.6%) in this group.
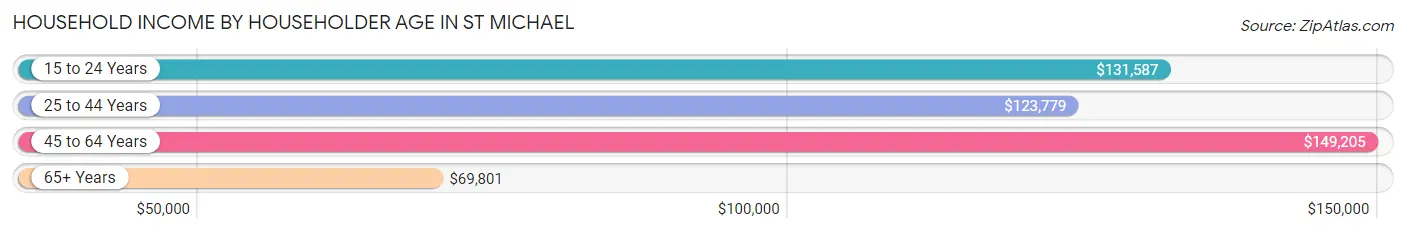
| Income Bracket | # Households | Median Income |
| 15 to 24 Years | 199 (3.0%) | $131,587 |
| 25 to 44 Years | 2,545 (38.7%) | $123,779 |
| 45 to 64 Years | 2,674 (40.6%) | $149,205 |
| 65+ Years | 1,161 (17.6%) | $69,801 |
| Total | 6,579 (100.0%) | $123,318 |
Poverty in St Michael
Income Below Poverty by Sex and Age in St Michael
With 2.5% poverty level for males and 4.8% for females among the residents of St Michael, 16 and 17 year old males and 5 year old females are the most vulnerable to poverty, with 83 males (12.6%) and 73 females (32.0%) in their respective age groups living below the poverty level.
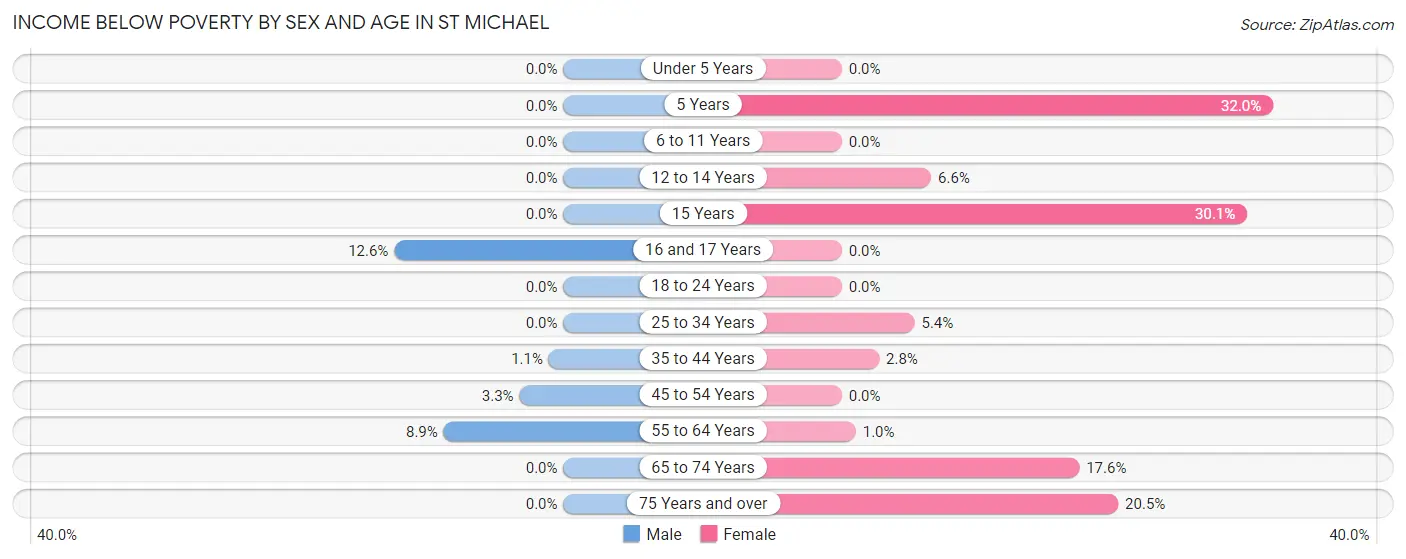
| Age Bracket | Male | Female |
| Under 5 Years | 0 (0.0%) | 0 (0.0%) |
| 5 Years | 0 (0.0%) | 73 (32.0%) |
| 6 to 11 Years | 0 (0.0%) | 0 (0.0%) |
| 12 to 14 Years | 0 (0.0%) | 34 (6.6%) |
| 15 Years | 0 (0.0%) | 34 (30.1%) |
| 16 and 17 Years | 83 (12.6%) | 0 (0.0%) |
| 18 to 24 Years | 0 (0.0%) | 0 (0.0%) |
| 25 to 34 Years | 0 (0.0%) | 63 (5.4%) |
| 35 to 44 Years | 16 (1.1%) | 35 (2.8%) |
| 45 to 54 Years | 49 (3.3%) | 0 (0.0%) |
| 55 to 64 Years | 104 (8.9%) | 10 (1.0%) |
| 65 to 74 Years | 0 (0.0%) | 95 (17.6%) |
| 75 Years and over | 0 (0.0%) | 71 (20.5%) |
| Total | 252 (2.5%) | 415 (4.8%) |
Income Above Poverty by Sex and Age in St Michael
According to the poverty statistics in St Michael, males aged under 5 years and females aged under 5 years are the age groups that are most secure financially, with 100.0% of males and 100.0% of females in these age groups living above the poverty line.
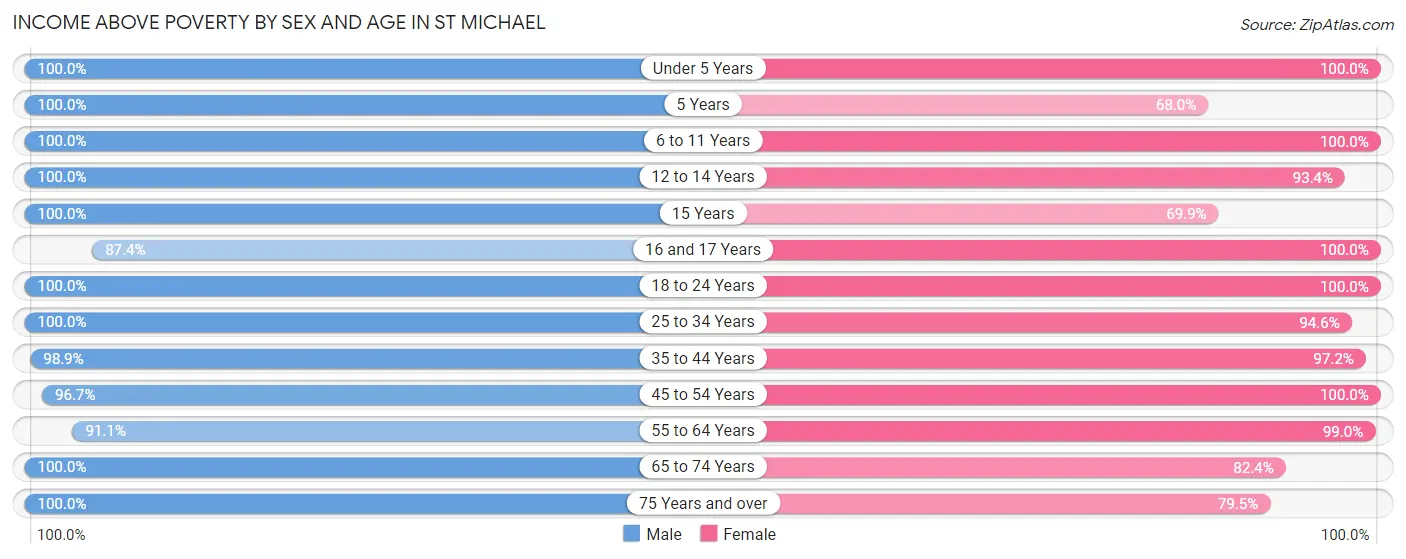
| Age Bracket | Male | Female |
| Under 5 Years | 816 (100.0%) | 441 (100.0%) |
| 5 Years | 135 (100.0%) | 155 (68.0%) |
| 6 to 11 Years | 1,057 (100.0%) | 730 (100.0%) |
| 12 to 14 Years | 440 (100.0%) | 479 (93.4%) |
| 15 Years | 213 (100.0%) | 79 (69.9%) |
| 16 and 17 Years | 578 (87.4%) | 283 (100.0%) |
| 18 to 24 Years | 646 (100.0%) | 561 (100.0%) |
| 25 to 34 Years | 1,142 (100.0%) | 1,103 (94.6%) |
| 35 to 44 Years | 1,459 (98.9%) | 1,230 (97.2%) |
| 45 to 54 Years | 1,454 (96.7%) | 1,455 (100.0%) |
| 55 to 64 Years | 1,066 (91.1%) | 947 (99.0%) |
| 65 to 74 Years | 540 (100.0%) | 444 (82.4%) |
| 75 Years and over | 206 (100.0%) | 275 (79.5%) |
| Total | 9,752 (97.5%) | 8,182 (95.2%) |
Income Below Poverty Among Married-Couple Families in St Michael
The poverty statistics for married-couple families in St Michael show that 1.4% or 63 of the total 4,508 families live below the poverty line. Families with 1 or 2 children have the highest poverty rate of 3.2%, comprising of 63 families. On the other hand, families with no children have the lowest poverty rate of 0.0%, which includes 0 families.
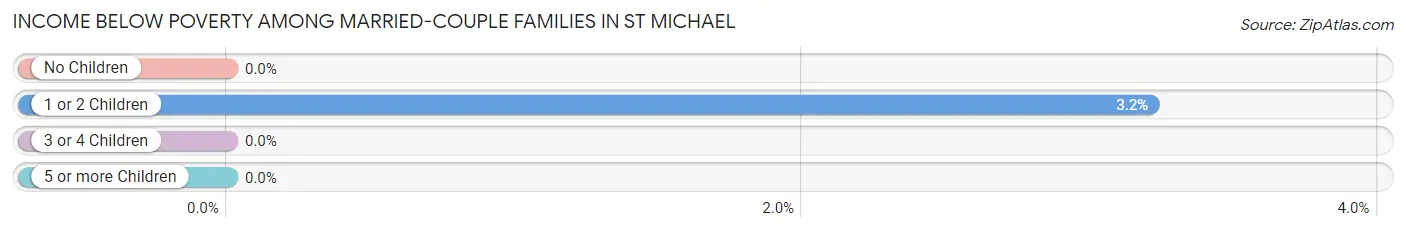
| Children | Above Poverty | Below Poverty |
| No Children | 1,884 (100.0%) | 0 (0.0%) |
| 1 or 2 Children | 1,898 (96.8%) | 63 (3.2%) |
| 3 or 4 Children | 564 (100.0%) | 0 (0.0%) |
| 5 or more Children | 99 (100.0%) | 0 (0.0%) |
| Total | 4,445 (98.6%) | 63 (1.4%) |
Income Below Poverty Among Single-Parent Households in St Michael
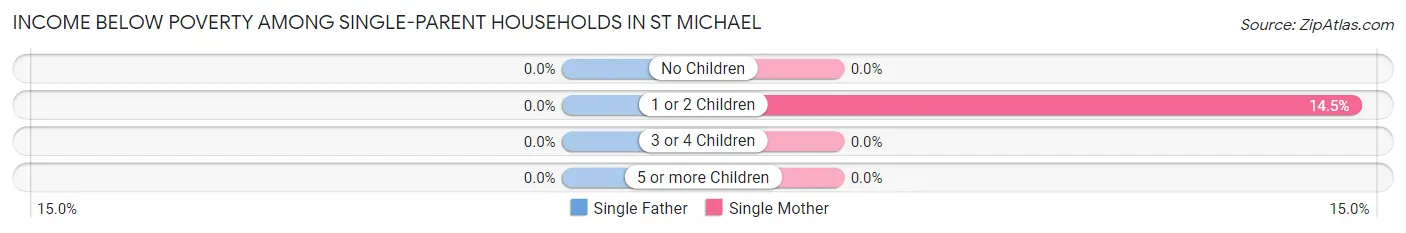
| Children | Single Father | Single Mother |
| No Children | 0 (0.0%) | 0 (0.0%) |
| 1 or 2 Children | 0 (0.0%) | 35 (14.5%) |
| 3 or 4 Children | 0 (0.0%) | 0 (0.0%) |
| 5 or more Children | 0 (0.0%) | 0 (0.0%) |
| Total | 0 (0.0%) | 35 (6.9%) |
Income Below Poverty Among Married-Couple vs Single-Parent Households in St Michael
The poverty data for St Michael shows that 63 of the married-couple family households (1.4%) and 35 of the single-parent households (4.8%) are living below the poverty level. Within the married-couple family households, those with 1 or 2 children have the highest poverty rate, with 63 households (3.2%) falling below the poverty line. Among the single-parent households, those with 1 or 2 children have the highest poverty rate, with 35 household (10.3%) living below poverty.
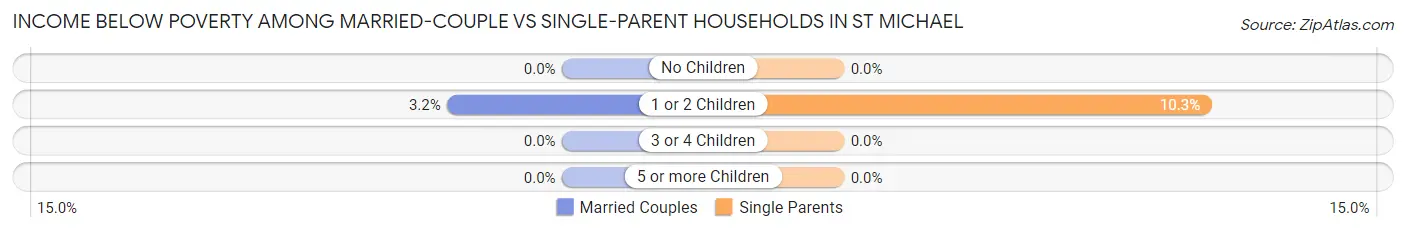
| Children | Married-Couple Families | Single-Parent Households |
| No Children | 0 (0.0%) | 0 (0.0%) |
| 1 or 2 Children | 63 (3.2%) | 35 (10.3%) |
| 3 or 4 Children | 0 (0.0%) | 0 (0.0%) |
| 5 or more Children | 0 (0.0%) | 0 (0.0%) |
| Total | 63 (1.4%) | 35 (4.8%) |
Race in St Michael
The most populous races in St Michael are White / Caucasian (16,946 | 90.9%), Two or more Races (646 | 3.5%), and Black / African American (583 | 3.1%).
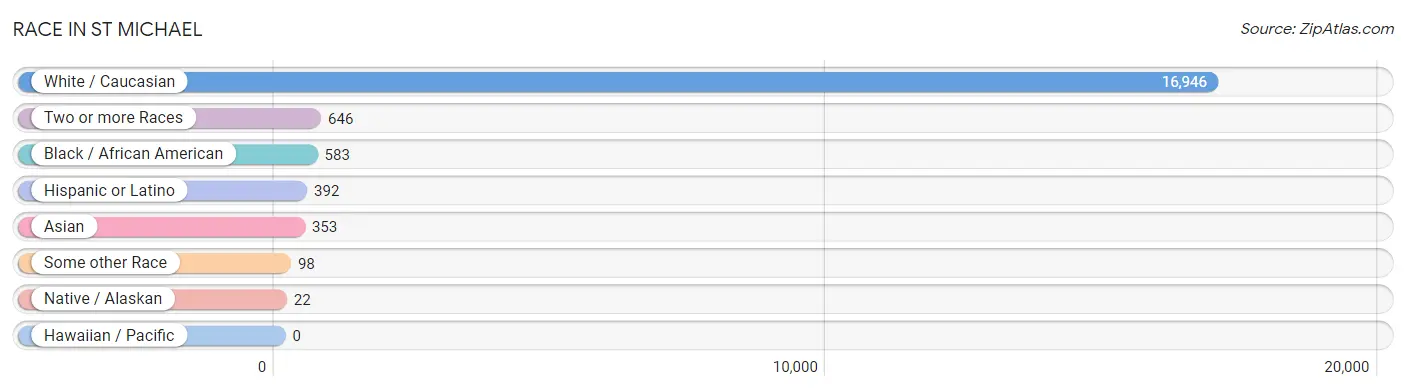
| Race | # Population | % Population |
| Asian | 353 | 1.9% |
| Black / African American | 583 | 3.1% |
| Hawaiian / Pacific | 0 | 0.0% |
| Hispanic or Latino | 392 | 2.1% |
| Native / Alaskan | 22 | 0.1% |
| White / Caucasian | 16,946 | 90.9% |
| Two or more Races | 646 | 3.5% |
| Some other Race | 98 | 0.5% |
| Total | 18,648 | 100.0% |
Ancestry in St Michael
The most populous ancestries reported in St Michael are German (6,767 | 36.3%), Norwegian (2,452 | 13.2%), Irish (2,360 | 12.7%), Polish (1,138 | 6.1%), and American (1,083 | 5.8%), together accounting for 74.0% of all St Michael residents.
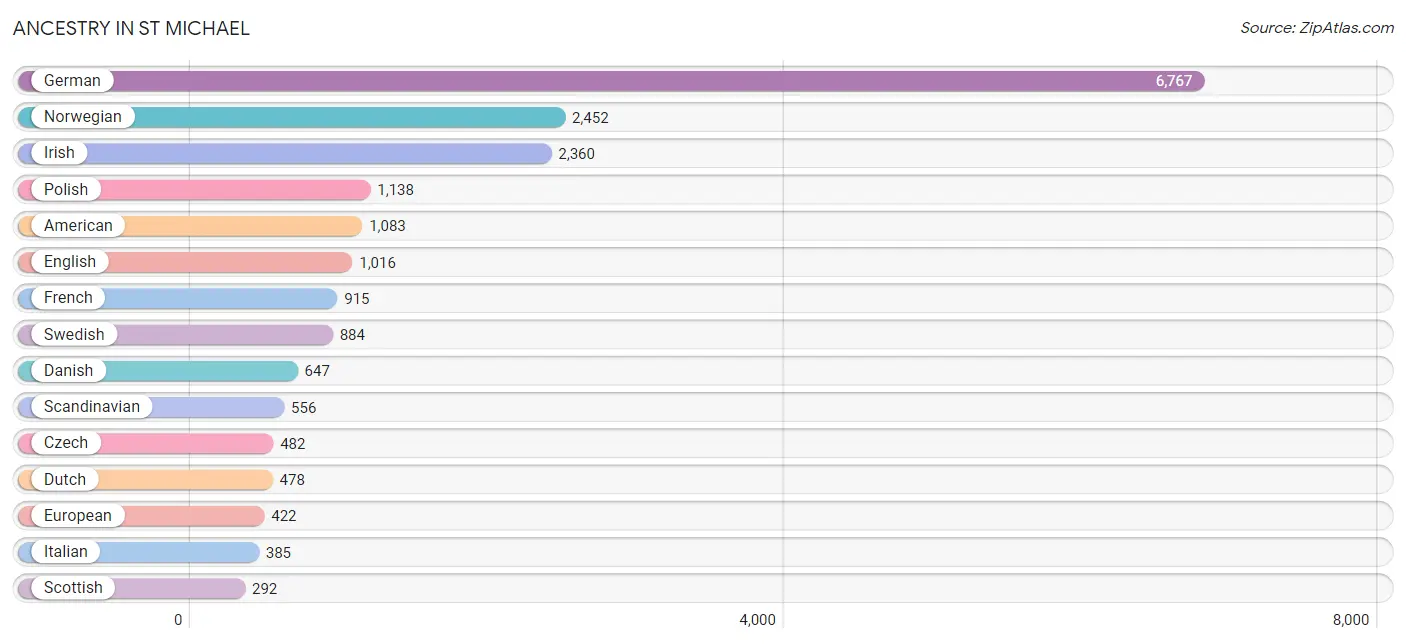
| Ancestry | # Population | % Population |
| American | 1,083 | 5.8% |
| Arab | 98 | 0.5% |
| Austrian | 72 | 0.4% |
| Bangladeshi | 146 | 0.8% |
| Belgian | 109 | 0.6% |
| Burmese | 64 | 0.3% |
| Chippewa | 31 | 0.2% |
| Colombian | 94 | 0.5% |
| Cuban | 14 | 0.1% |
| Czech | 482 | 2.6% |
| Czechoslovakian | 94 | 0.5% |
| Danish | 647 | 3.5% |
| Dutch | 478 | 2.6% |
| Eastern European | 19 | 0.1% |
| English | 1,016 | 5.4% |
| European | 422 | 2.3% |
| Finnish | 214 | 1.1% |
| French | 915 | 4.9% |
| French Canadian | 160 | 0.9% |
| German | 6,767 | 36.3% |
| Greek | 19 | 0.1% |
| Hungarian | 126 | 0.7% |
| Irish | 2,360 | 12.7% |
| Italian | 385 | 2.1% |
| Kenyan | 84 | 0.4% |
| Korean | 44 | 0.2% |
| Lebanese | 57 | 0.3% |
| Liberian | 109 | 0.6% |
| Malaysian | 99 | 0.5% |
| Mexican | 248 | 1.3% |
| Norwegian | 2,452 | 13.2% |
| Polish | 1,138 | 6.1% |
| Russian | 26 | 0.1% |
| Scandinavian | 556 | 3.0% |
| Scottish | 292 | 1.6% |
| Serbian | 2 | 0.0% |
| Sioux | 49 | 0.3% |
| Slovene | 76 | 0.4% |
| South American | 94 | 0.5% |
| Spaniard | 36 | 0.2% |
| Subsaharan African | 193 | 1.0% |
| Swedish | 884 | 4.7% |
| Swiss | 82 | 0.4% |
| Ukrainian | 5 | 0.0% | View All 44 Rows |
Immigrants in St Michael
The most numerous immigrant groups reported in St Michael came from Africa (180 | 1.0%), Asia (163 | 0.9%), Laos (130 | 0.7%), South Eastern Asia (130 | 0.7%), and Liberia (96 | 0.5%), together accounting for 3.7% of all St Michael residents.
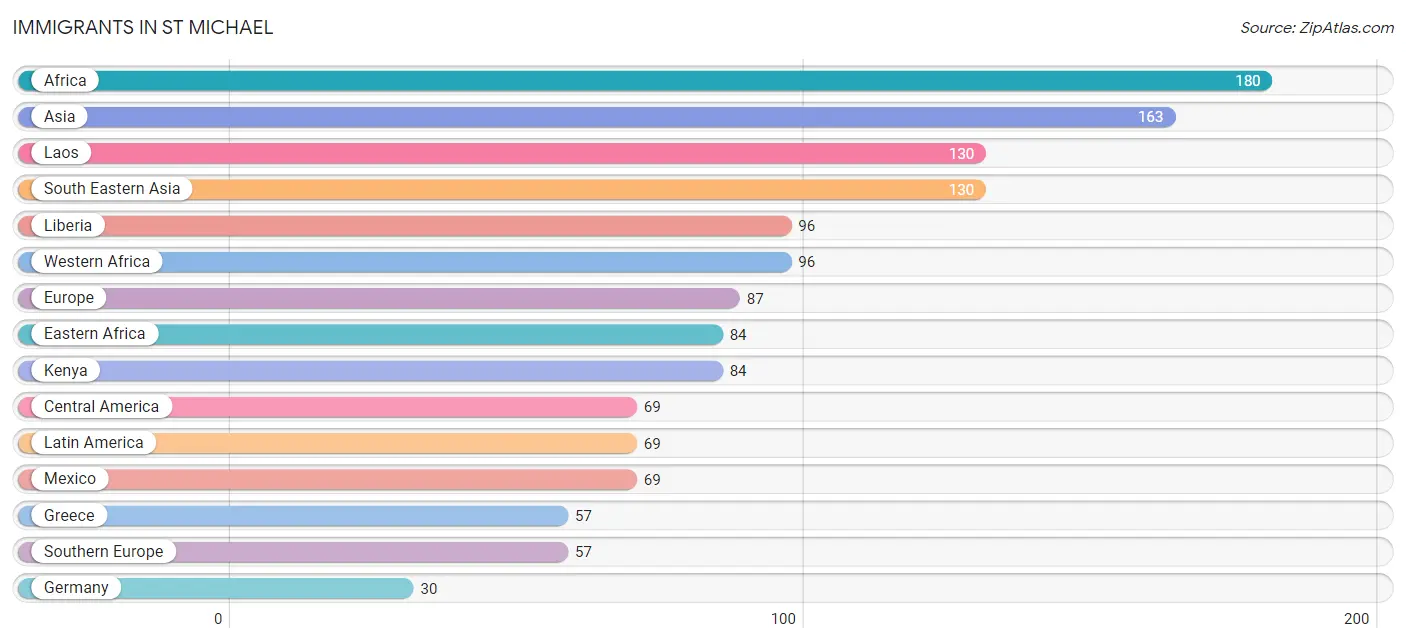
| Immigration Origin | # Population | % Population |
| Africa | 180 | 1.0% |
| Asia | 163 | 0.9% |
| Central America | 69 | 0.4% |
| Eastern Africa | 84 | 0.4% |
| Eastern Asia | 28 | 0.2% |
| Europe | 87 | 0.5% |
| Germany | 30 | 0.2% |
| Greece | 57 | 0.3% |
| Kenya | 84 | 0.4% |
| Korea | 28 | 0.2% |
| Laos | 130 | 0.7% |
| Latin America | 69 | 0.4% |
| Liberia | 96 | 0.5% |
| Mexico | 69 | 0.4% |
| South Central Asia | 5 | 0.0% |
| South Eastern Asia | 130 | 0.7% |
| Southern Europe | 57 | 0.3% |
| Uzbekistan | 5 | 0.0% |
| Western Africa | 96 | 0.5% |
| Western Europe | 30 | 0.2% | View All 20 Rows |
Sex and Age in St Michael
Sex and Age in St Michael
The most populous age groups in St Michael are 15 to 19 Years (1,055 | 10.5%) for men and 50 to 54 Years (795 | 9.2%) for women.
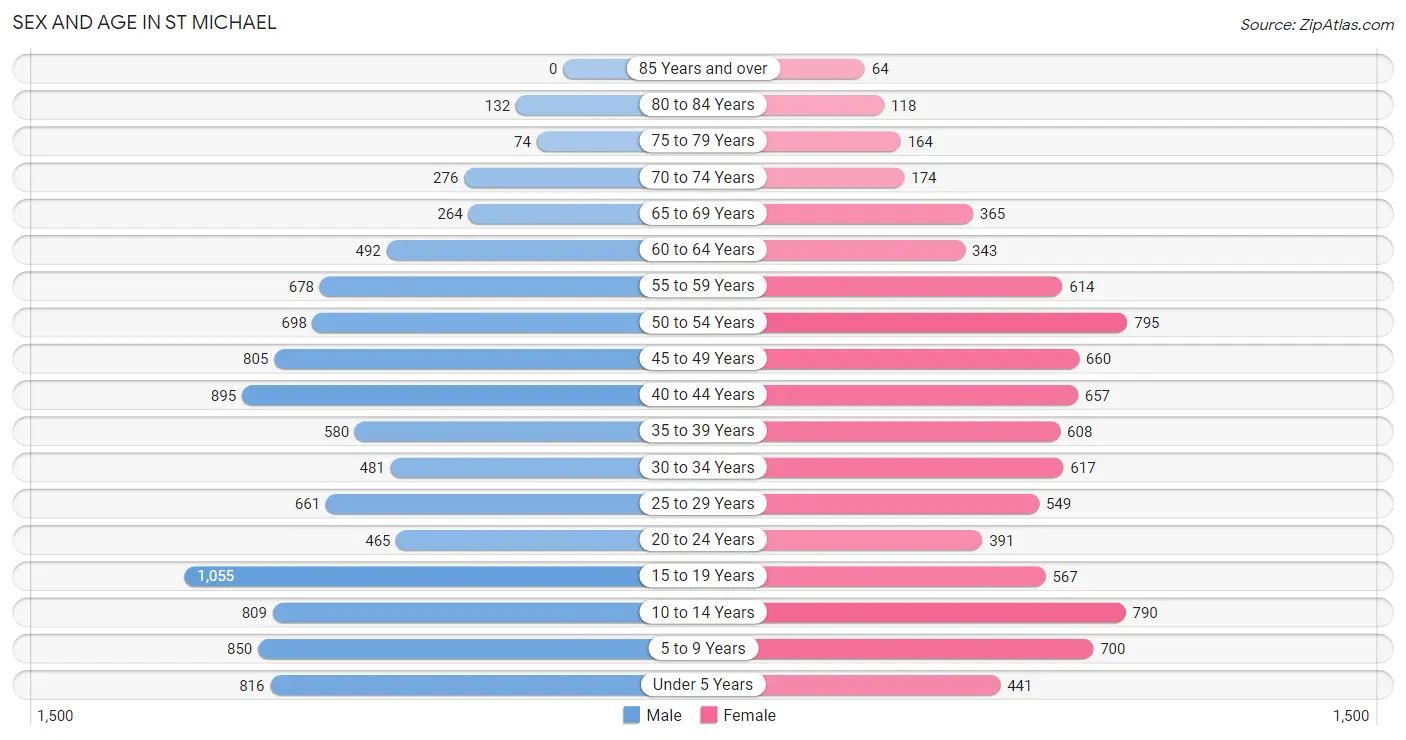
| Age Bracket | Male | Female |
| Under 5 Years | 816 (8.1%) | 441 (5.1%) |
| 5 to 9 Years | 850 (8.5%) | 700 (8.1%) |
| 10 to 14 Years | 809 (8.1%) | 790 (9.2%) |
| 15 to 19 Years | 1,055 (10.5%) | 567 (6.6%) |
| 20 to 24 Years | 465 (4.6%) | 391 (4.5%) |
| 25 to 29 Years | 661 (6.6%) | 549 (6.4%) |
| 30 to 34 Years | 481 (4.8%) | 617 (7.2%) |
| 35 to 39 Years | 580 (5.8%) | 608 (7.1%) |
| 40 to 44 Years | 895 (8.9%) | 657 (7.6%) |
| 45 to 49 Years | 805 (8.0%) | 660 (7.7%) |
| 50 to 54 Years | 698 (7.0%) | 795 (9.2%) |
| 55 to 59 Years | 678 (6.8%) | 614 (7.1%) |
| 60 to 64 Years | 492 (4.9%) | 343 (4.0%) |
| 65 to 69 Years | 264 (2.6%) | 365 (4.2%) |
| 70 to 74 Years | 276 (2.8%) | 174 (2.0%) |
| 75 to 79 Years | 74 (0.7%) | 164 (1.9%) |
| 80 to 84 Years | 132 (1.3%) | 118 (1.4%) |
| 85 Years and over | 0 (0.0%) | 64 (0.7%) |
| Total | 10,031 (100.0%) | 8,617 (100.0%) |
Families and Households in St Michael
Median Family Size in St Michael
The median family size in St Michael is 3.19 persons per family, with married-couple families (4,508 | 86.0%) accounting for the largest median family size of 3.29 persons per family. On the other hand, single female/mother families (509 | 9.7%) represent the smallest median family size with 2.53 persons per family.
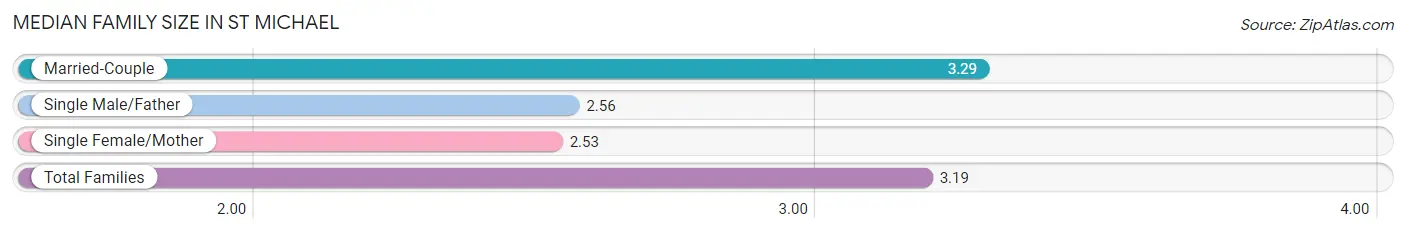
| Family Type | # Families | Family Size |
| Married-Couple | 4,508 (86.0%) | 3.29 |
| Single Male/Father | 224 (4.3%) | 2.56 |
| Single Female/Mother | 509 (9.7%) | 2.53 |
| Total Families | 5,241 (100.0%) | 3.19 |
Median Household Size in St Michael
The median household size in St Michael is 2.83 persons per household, with married-couple households (4,508 | 68.5%) accounting for the largest median household size of 3.29 persons per household. non-family households (1,338 | 20.3%) represent the smallest median household size with 1.31 persons per household.
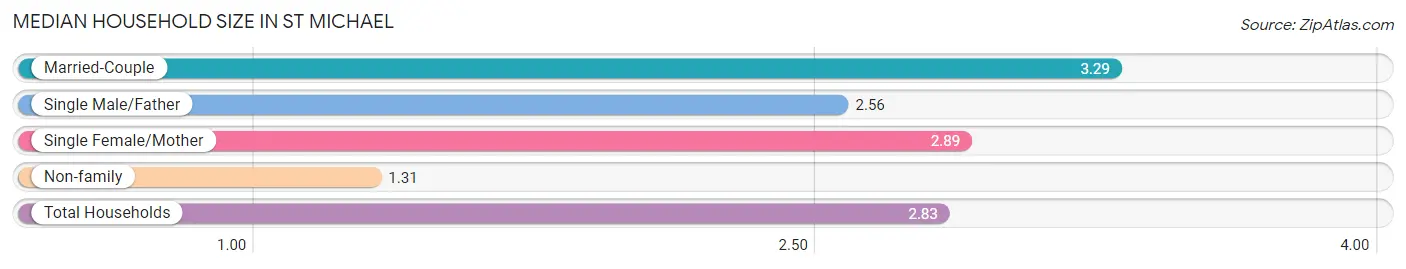
| Household Type | # Households | Household Size |
| Married-Couple | 4,508 (68.5%) | 3.29 |
| Single Male/Father | 224 (3.4%) | 2.56 |
| Single Female/Mother | 509 (7.7%) | 2.89 |
| Non-family | 1,338 (20.3%) | 1.31 |
| Total Households | 6,579 (100.0%) | 2.83 |
Household Size by Marriage Status in St Michael
Out of a total of 6,579 households in St Michael, 5,241 (79.7%) are family households, while 1,338 (20.3%) are nonfamily households. The most numerous type of family households are 2-person households, comprising 1,912, and the most common type of nonfamily households are 1-person households, comprising 1,040.
| Household Size | Family Households | Nonfamily Households |
| 1-Person Households | - | 1,040 (15.8%) |
| 2-Person Households | 1,912 (29.1%) | 203 (3.1%) |
| 3-Person Households | 1,131 (17.2%) | 71 (1.1%) |
| 4-Person Households | 1,381 (21.0%) | 24 (0.4%) |
| 5-Person Households | 413 (6.3%) | 0 (0.0%) |
| 6-Person Households | 251 (3.8%) | 0 (0.0%) |
| 7+ Person Households | 153 (2.3%) | 0 (0.0%) |
| Total | 5,241 (79.7%) | 1,338 (20.3%) |
Female Fertility in St Michael
Fertility by Age in St Michael
Average fertility rate in St Michael is 100.0 births per 1,000 women. Women in the age bracket of 20 to 34 years have the highest fertility rate with 225.0 births per 1,000 women. Women in the age bracket of 20 to 34 years acount for 83.2% of all women with births.
| Age Bracket | Women with Births | Births / 1,000 Women |
| 15 to 19 years | 0 (0.0%) | 0.0 |
| 20 to 34 years | 351 (83.2%) | 225.0 |
| 35 to 50 years | 71 (16.8%) | 34.0 |
| Total | 422 (100.0%) | 100.0 |
Fertility by Age by Marriage Status in St Michael
| Age Bracket | Married | Unmarried |
| 15 to 19 years | 0 (0.0%) | 0 (0.0%) |
| 20 to 34 years | 351 (100.0%) | 0 (0.0%) |
| 35 to 50 years | 71 (100.0%) | 0 (0.0%) |
| Total | 422 (100.0%) | 0 (0.0%) |
Fertility by Education in St Michael
| Educational Attainment | Women with Births | Births / 1,000 Women |
| Less than High School | 0 (0.0%) | 0.0 |
| High School Diploma | 0 (0.0%) | 0.0 |
| College or Associate's Degree | 169 (40.1%) | 148.0 |
| Bachelor's Degree | 44 (10.4%) | 25.0 |
| Graduate Degree | 209 (49.5%) | 319.0 |
| Total | 422 (100.0%) | 100.0 |
Fertility by Education by Marriage Status in St Michael
| Educational Attainment | Married | Unmarried |
| Less than High School | 0 (0.0%) | 0 (0.0%) |
| High School Diploma | 0 (0.0%) | 0 (0.0%) |
| College or Associate's Degree | 169 (100.0%) | 0 (0.0%) |
| Bachelor's Degree | 44 (100.0%) | 0 (0.0%) |
| Graduate Degree | 209 (100.0%) | 0 (0.0%) |
| Total | 422 (100.0%) | 0 (0.0%) |
Employment Characteristics in St Michael
Employment by Class of Employer in St Michael
Among the 10,433 employed individuals in St Michael, private company employees (7,601 | 72.9%), not-for-profit organizations (1,110 | 10.6%), and local government employees (619 | 5.9%) make up the most common classes of employment.
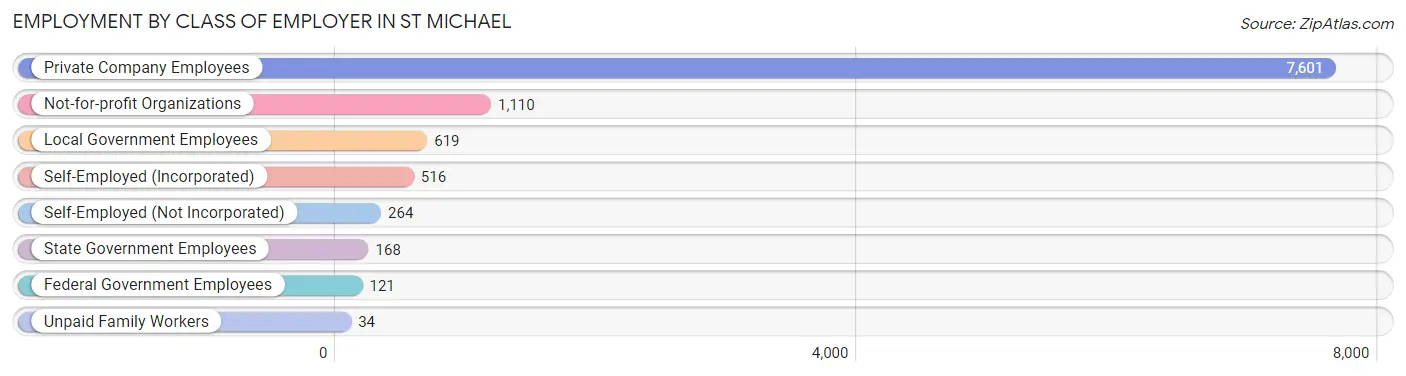
| Employer Class | # Employees | % Employees |
| Private Company Employees | 7,601 | 72.9% |
| Self-Employed (Incorporated) | 516 | 5.0% |
| Self-Employed (Not Incorporated) | 264 | 2.5% |
| Not-for-profit Organizations | 1,110 | 10.6% |
| Local Government Employees | 619 | 5.9% |
| State Government Employees | 168 | 1.6% |
| Federal Government Employees | 121 | 1.2% |
| Unpaid Family Workers | 34 | 0.3% |
| Total | 10,433 | 100.0% |
Employment Status by Age in St Michael
According to the labor force statistics for St Michael, out of the total population over 16 years of age (13,916), 78.4% or 10,910 individuals are in the labor force, with 2.6% or 284 of them unemployed. The age group with the highest labor force participation rate is 25 to 29 years, with 95.6% or 1,157 individuals in the labor force. Within the labor force, the 60 to 64 years age range has the highest percentage of unemployed individuals, with 8.3% or 50 of them being unemployed.
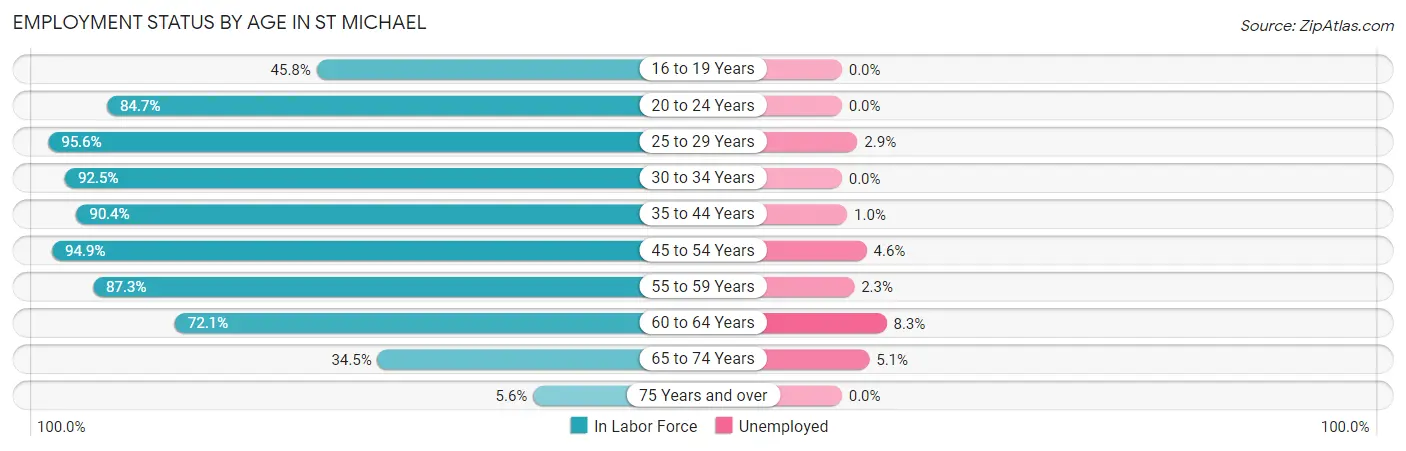
| Age Bracket | In Labor Force | Unemployed |
| 16 to 19 Years | 594 (45.8%) | 0 (0.0%) |
| 20 to 24 Years | 725 (84.7%) | 0 (0.0%) |
| 25 to 29 Years | 1,157 (95.6%) | 34 (2.9%) |
| 30 to 34 Years | 1,016 (92.5%) | 0 (0.0%) |
| 35 to 44 Years | 2,477 (90.4%) | 25 (1.0%) |
| 45 to 54 Years | 2,807 (94.9%) | 129 (4.6%) |
| 55 to 59 Years | 1,128 (87.3%) | 26 (2.3%) |
| 60 to 64 Years | 602 (72.1%) | 50 (8.3%) |
| 65 to 74 Years | 372 (34.5%) | 19 (5.1%) |
| 75 Years and over | 31 (5.6%) | 0 (0.0%) |
| Total | 10,910 (78.4%) | 284 (2.6%) |
Employment Status by Educational Attainment in St Michael
According to labor force statistics for St Michael, 90.7% of individuals (9,191) out of the total population between 25 and 64 years of age (10,133) are in the labor force, with 2.9% or 267 of them being unemployed. The group with the highest labor force participation rate are those with the educational attainment of bachelor's degree or higher, with 92.3% or 4,724 individuals in the labor force. Within the labor force, individuals with high school diploma education have the highest percentage of unemployment, with 6.2% or 110 of them being unemployed.
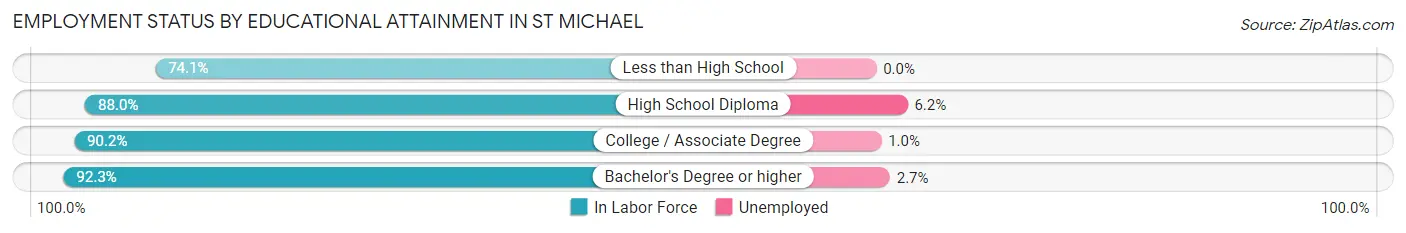
| Educational Attainment | In Labor Force | Unemployed |
| Less than High School | 80 (74.1%) | 0 (0.0%) |
| High School Diploma | 1,777 (88.0%) | 125 (6.2%) |
| College / Associate Degree | 2,605 (90.2%) | 29 (1.0%) |
| Bachelor's Degree or higher | 4,724 (92.3%) | 138 (2.7%) |
| Total | 9,191 (90.7%) | 294 (2.9%) |
Employment Occupations by Sex in St Michael
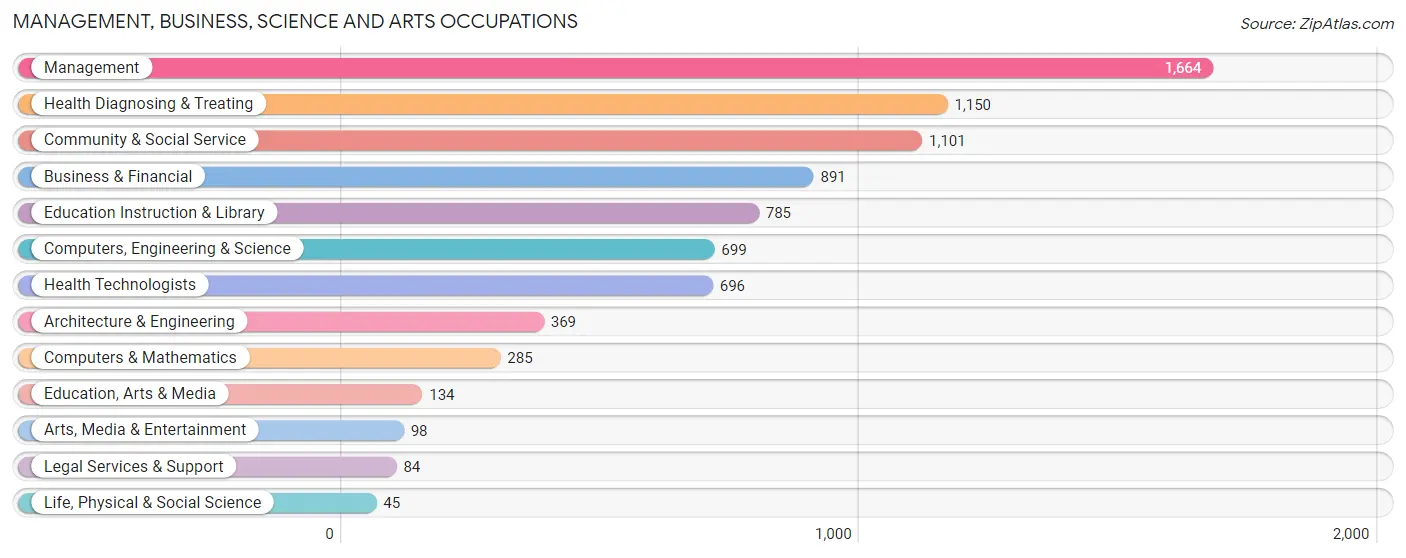
Management, Business, Science and Arts Occupations
The most common Management, Business, Science and Arts occupations in St Michael are Management (1,664 | 15.7%), Health Diagnosing & Treating (1,150 | 10.8%), Community & Social Service (1,101 | 10.4%), Business & Financial (891 | 8.4%), and Education Instruction & Library (785 | 7.4%).
Management, Business, Science and Arts Occupations by Sex
Within the Management, Business, Science and Arts occupations in St Michael, the most male-oriented occupations are Life, Physical & Social Science (100.0%), Architecture & Engineering (86.2%), and Computers, Engineering & Science (78.0%), while the most female-oriented occupations are Education, Arts & Media (85.1%), Legal Services & Support (80.9%), and Community & Social Service (73.5%).
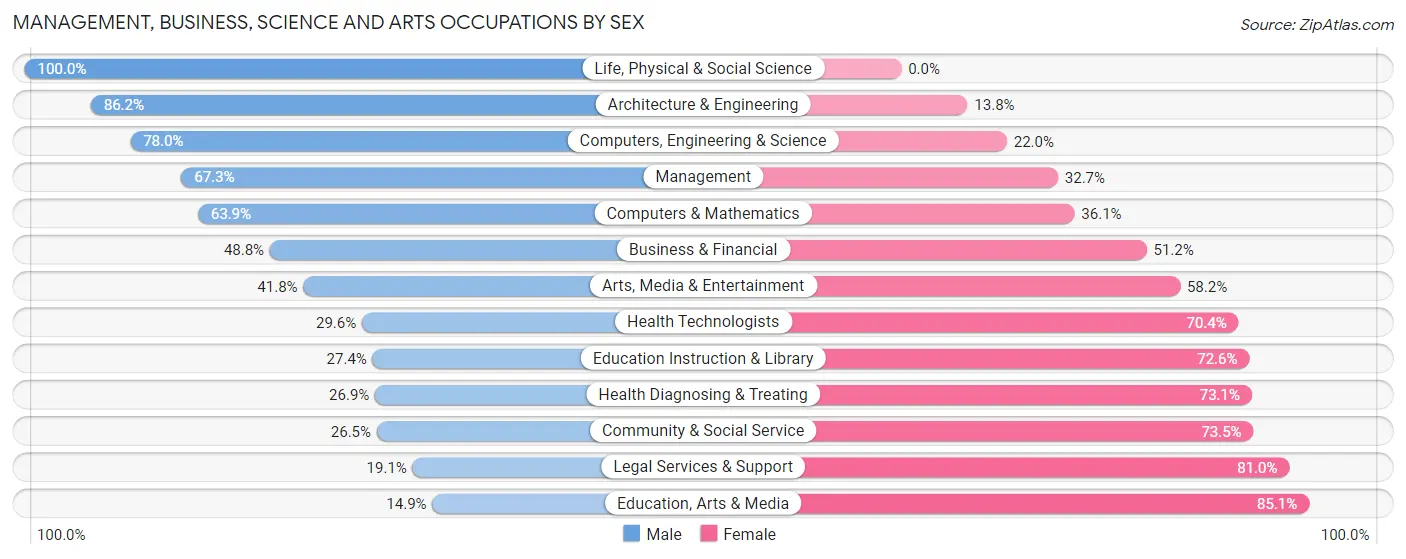
| Occupation | Male | Female |
| Management | 1,120 (67.3%) | 544 (32.7%) |
| Business & Financial | 435 (48.8%) | 456 (51.2%) |
| Computers, Engineering & Science | 545 (78.0%) | 154 (22.0%) |
| Computers & Mathematics | 182 (63.9%) | 103 (36.1%) |
| Architecture & Engineering | 318 (86.2%) | 51 (13.8%) |
| Life, Physical & Social Science | 45 (100.0%) | 0 (0.0%) |
| Community & Social Service | 292 (26.5%) | 809 (73.5%) |
| Education, Arts & Media | 20 (14.9%) | 114 (85.1%) |
| Legal Services & Support | 16 (19.1%) | 68 (80.9%) |
| Education Instruction & Library | 215 (27.4%) | 570 (72.6%) |
| Arts, Media & Entertainment | 41 (41.8%) | 57 (58.2%) |
| Health Diagnosing & Treating | 309 (26.9%) | 841 (73.1%) |
| Health Technologists | 206 (29.6%) | 490 (70.4%) |
| Total (Category) | 2,701 (49.1%) | 2,804 (50.9%) |
| Total (Overall) | 5,974 (56.2%) | 4,654 (43.8%) |
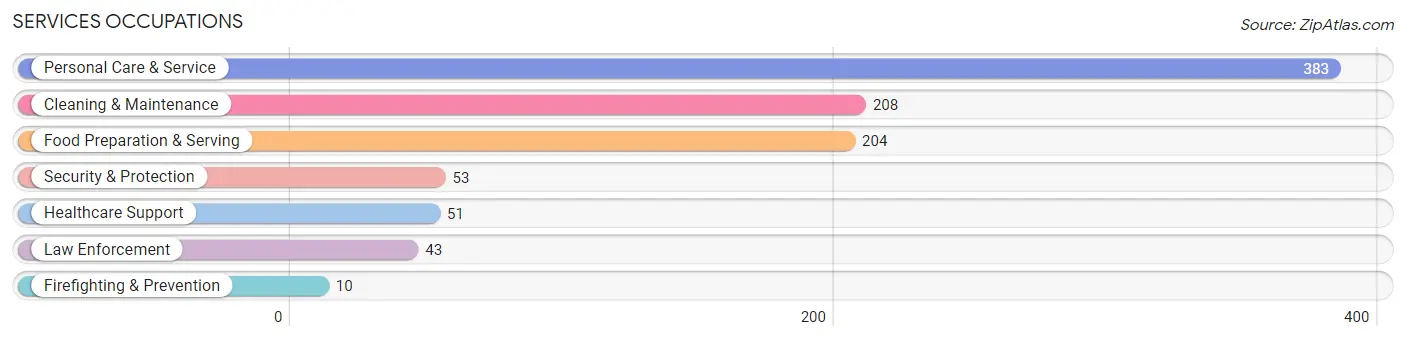
Services Occupations
The most common Services occupations in St Michael are Personal Care & Service (383 | 3.6%), Cleaning & Maintenance (208 | 2.0%), Food Preparation & Serving (204 | 1.9%), Security & Protection (53 | 0.5%), and Healthcare Support (51 | 0.5%).
Services Occupations by Sex
Within the Services occupations in St Michael, the most male-oriented occupations are Firefighting & Prevention (100.0%), Cleaning & Maintenance (73.1%), and Food Preparation & Serving (63.7%), while the most female-oriented occupations are Healthcare Support (100.0%), Law Enforcement (100.0%), and Personal Care & Service (83.8%).
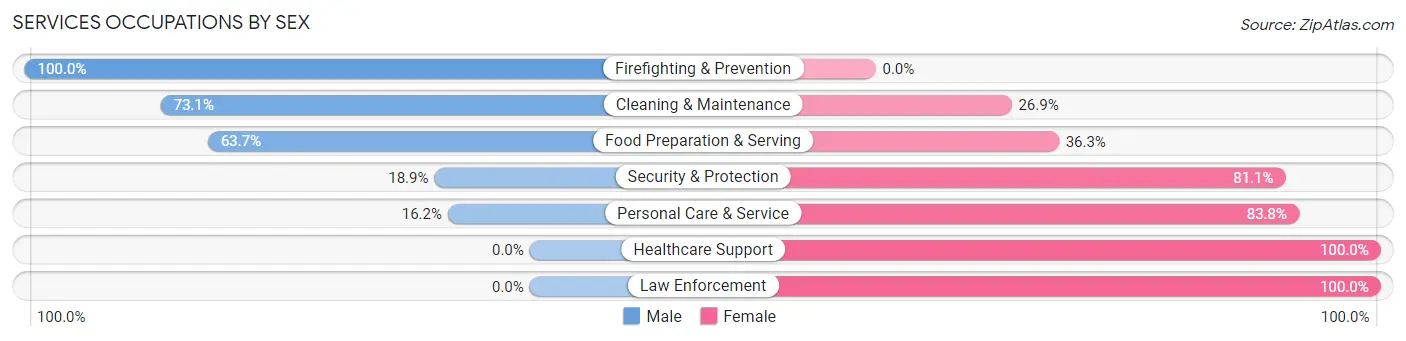
| Occupation | Male | Female |
| Healthcare Support | 0 (0.0%) | 51 (100.0%) |
| Security & Protection | 10 (18.9%) | 43 (81.1%) |
| Firefighting & Prevention | 10 (100.0%) | 0 (0.0%) |
| Law Enforcement | 0 (0.0%) | 43 (100.0%) |
| Food Preparation & Serving | 130 (63.7%) | 74 (36.3%) |
| Cleaning & Maintenance | 152 (73.1%) | 56 (26.9%) |
| Personal Care & Service | 62 (16.2%) | 321 (83.8%) |
| Total (Category) | 354 (39.4%) | 545 (60.6%) |
| Total (Overall) | 5,974 (56.2%) | 4,654 (43.8%) |
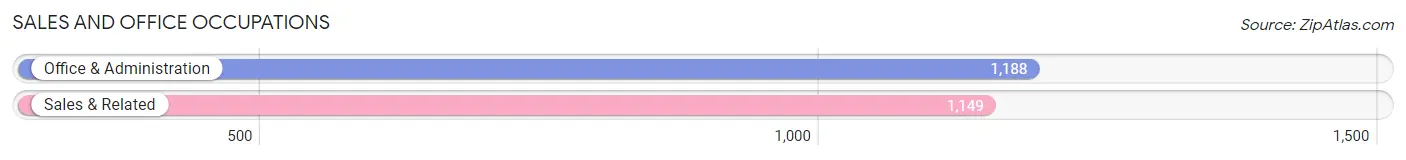
Sales and Office Occupations
The most common Sales and Office occupations in St Michael are Office & Administration (1,188 | 11.2%), and Sales & Related (1,149 | 10.8%).
Sales and Office Occupations by Sex
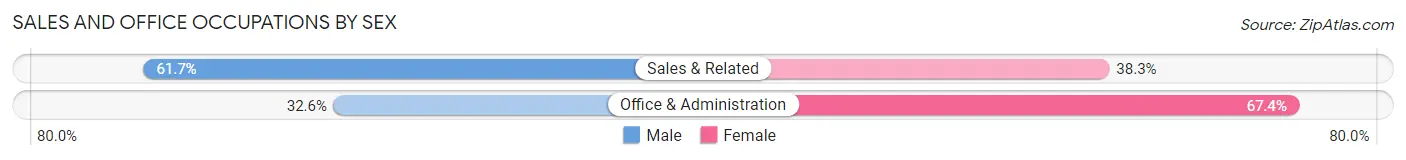
| Occupation | Male | Female |
| Sales & Related | 709 (61.7%) | 440 (38.3%) |
| Office & Administration | 387 (32.6%) | 801 (67.4%) |
| Total (Category) | 1,096 (46.9%) | 1,241 (53.1%) |
| Total (Overall) | 5,974 (56.2%) | 4,654 (43.8%) |
Natural Resources, Construction and Maintenance Occupations
The most common Natural Resources, Construction and Maintenance occupations in St Michael are Construction & Extraction (562 | 5.3%), Installation, Maintenance & Repair (375 | 3.5%), and Farming, Fishing & Forestry (41 | 0.4%).
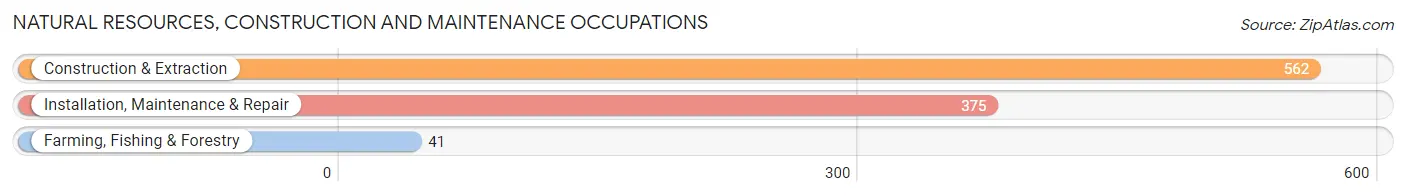
Natural Resources, Construction and Maintenance Occupations by Sex
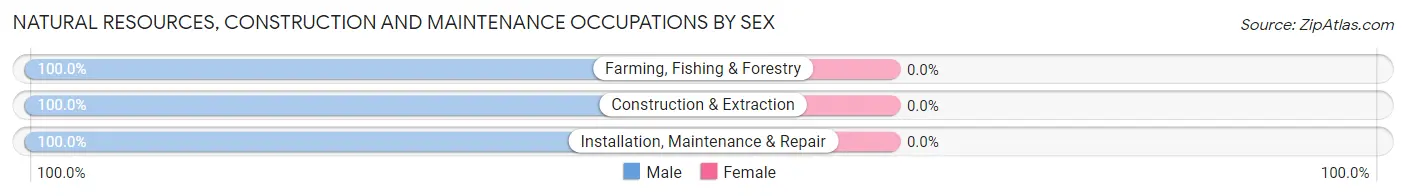
| Occupation | Male | Female |
| Farming, Fishing & Forestry | 41 (100.0%) | 0 (0.0%) |
| Construction & Extraction | 562 (100.0%) | 0 (0.0%) |
| Installation, Maintenance & Repair | 375 (100.0%) | 0 (0.0%) |
| Total (Category) | 978 (100.0%) | 0 (0.0%) |
| Total (Overall) | 5,974 (56.2%) | 4,654 (43.8%) |
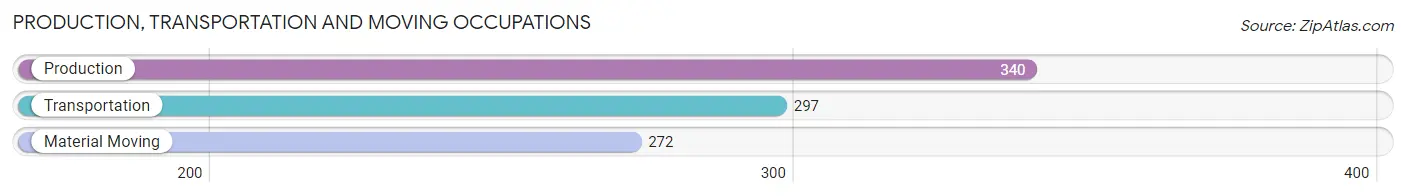
Production, Transportation and Moving Occupations
The most common Production, Transportation and Moving occupations in St Michael are Production (340 | 3.2%), Transportation (297 | 2.8%), and Material Moving (272 | 2.6%).
Production, Transportation and Moving Occupations by Sex
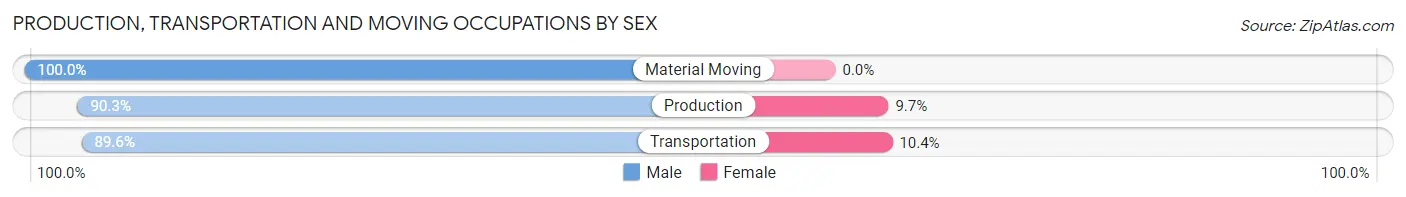
| Occupation | Male | Female |
| Production | 307 (90.3%) | 33 (9.7%) |
| Transportation | 266 (89.6%) | 31 (10.4%) |
| Material Moving | 272 (100.0%) | 0 (0.0%) |
| Total (Category) | 845 (93.0%) | 64 (7.0%) |
| Total (Overall) | 5,974 (56.2%) | 4,654 (43.8%) |
Employment Industries by Sex in St Michael
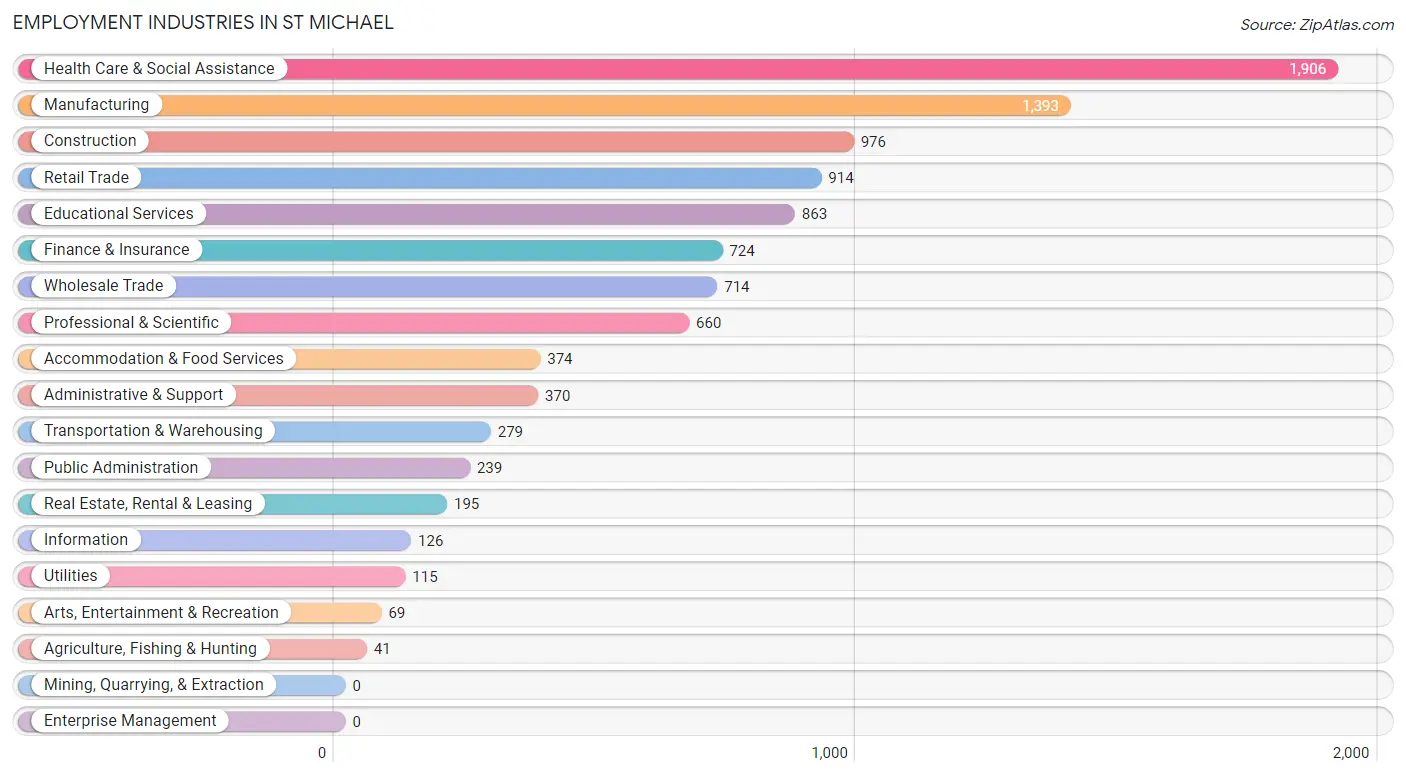
Employment Industries in St Michael
The major employment industries in St Michael include Health Care & Social Assistance (1,906 | 17.9%), Manufacturing (1,393 | 13.1%), Construction (976 | 9.2%), Retail Trade (914 | 8.6%), and Educational Services (863 | 8.1%).
Employment Industries by Sex in St Michael
The St Michael industries that see more men than women are Agriculture, Fishing & Hunting (100.0%), Construction (90.5%), and Information (82.5%), whereas the industries that tend to have a higher number of women are Real Estate, Rental & Leasing (85.6%), Health Care & Social Assistance (72.6%), and Educational Services (67.6%).
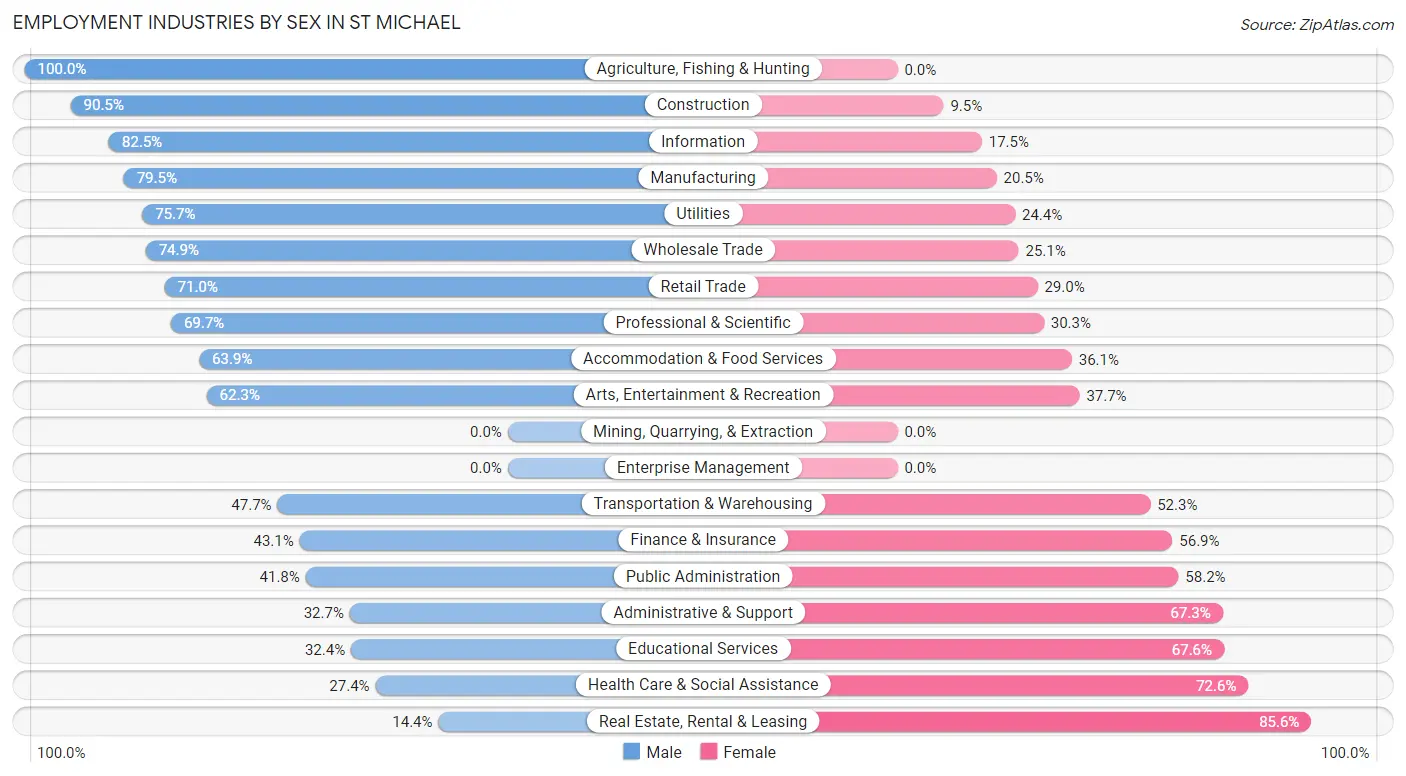
| Industry | Male | Female |
| Agriculture, Fishing & Hunting | 41 (100.0%) | 0 (0.0%) |
| Mining, Quarrying, & Extraction | 0 (0.0%) | 0 (0.0%) |
| Construction | 883 (90.5%) | 93 (9.5%) |
| Manufacturing | 1,107 (79.5%) | 286 (20.5%) |
| Wholesale Trade | 535 (74.9%) | 179 (25.1%) |
| Retail Trade | 649 (71.0%) | 265 (29.0%) |
| Transportation & Warehousing | 133 (47.7%) | 146 (52.3%) |
| Utilities | 87 (75.6%) | 28 (24.3%) |
| Information | 104 (82.5%) | 22 (17.5%) |
| Finance & Insurance | 312 (43.1%) | 412 (56.9%) |
| Real Estate, Rental & Leasing | 28 (14.4%) | 167 (85.6%) |
| Professional & Scientific | 460 (69.7%) | 200 (30.3%) |
| Enterprise Management | 0 (0.0%) | 0 (0.0%) |
| Administrative & Support | 121 (32.7%) | 249 (67.3%) |
| Educational Services | 280 (32.4%) | 583 (67.6%) |
| Health Care & Social Assistance | 522 (27.4%) | 1,384 (72.6%) |
| Arts, Entertainment & Recreation | 43 (62.3%) | 26 (37.7%) |
| Accommodation & Food Services | 239 (63.9%) | 135 (36.1%) |
| Public Administration | 100 (41.8%) | 139 (58.2%) |
| Total | 5,974 (56.2%) | 4,654 (43.8%) |
Education in St Michael
School Enrollment in St Michael
The most common levels of schooling among the 5,244 students in St Michael are high school (1,622 | 30.9%), elementary school (1,311 | 25.0%), and middle school (1,078 | 20.6%).
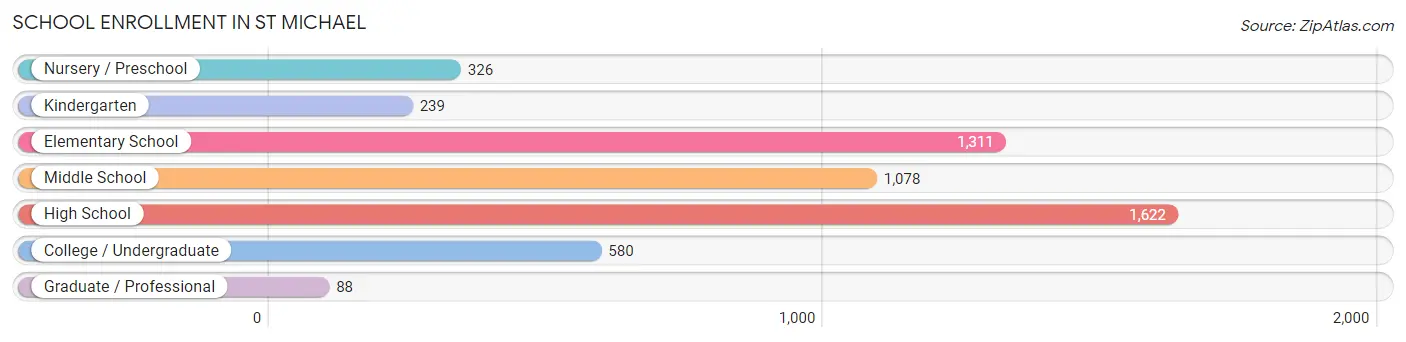
| School Level | # Students | % Students |
| Nursery / Preschool | 326 | 6.2% |
| Kindergarten | 239 | 4.6% |
| Elementary School | 1,311 | 25.0% |
| Middle School | 1,078 | 20.6% |
| High School | 1,622 | 30.9% |
| College / Undergraduate | 580 | 11.1% |
| Graduate / Professional | 88 | 1.7% |
| Total | 5,244 | 100.0% |
School Enrollment by Age by Funding Source in St Michael
Out of a total of 5,244 students who are enrolled in schools in St Michael, 530 (10.1%) attend a private institution, while the remaining 4,714 (89.9%) are enrolled in public schools. The age group of 35 years and over has the highest likelihood of being enrolled in private schools, with 57 (40.1% in the age bracket) enrolled. Conversely, the age group of 18 to 19 year olds has the lowest likelihood of being enrolled in a private school, with 216 (100.0% in the age bracket) attending a public institution.
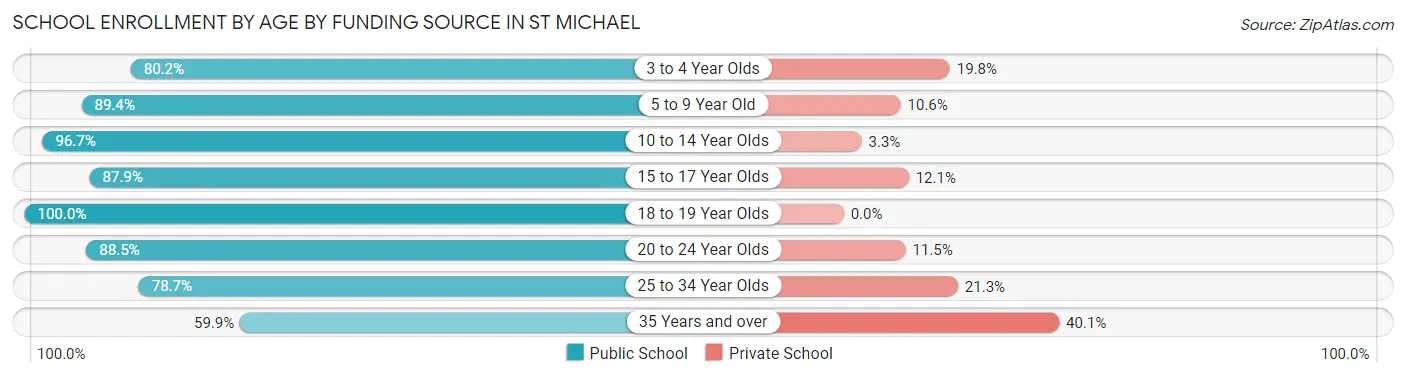
| Age Bracket | Public School | Private School |
| 3 to 4 Year Olds | 219 (80.2%) | 54 (19.8%) |
| 5 to 9 Year Old | 1,188 (89.4%) | 141 (10.6%) |
| 10 to 14 Year Olds | 1,504 (96.7%) | 52 (3.3%) |
| 15 to 17 Year Olds | 1,117 (87.9%) | 154 (12.1%) |
| 18 to 19 Year Olds | 216 (100.0%) | 0 (0.0%) |
| 20 to 24 Year Olds | 238 (88.5%) | 31 (11.5%) |
| 25 to 34 Year Olds | 148 (78.7%) | 40 (21.3%) |
| 35 Years and over | 85 (59.9%) | 57 (40.1%) |
| Total | 4,714 (89.9%) | 530 (10.1%) |
Educational Attainment by Field of Study in St Michael
Business (1,763 | 30.6%), education (859 | 14.9%), science & technology (856 | 14.9%), bio, nature & agricultural (332 | 5.8%), and engineering (330 | 5.7%) are the most common fields of study among 5,758 individuals in St Michael who have obtained a bachelor's degree or higher.
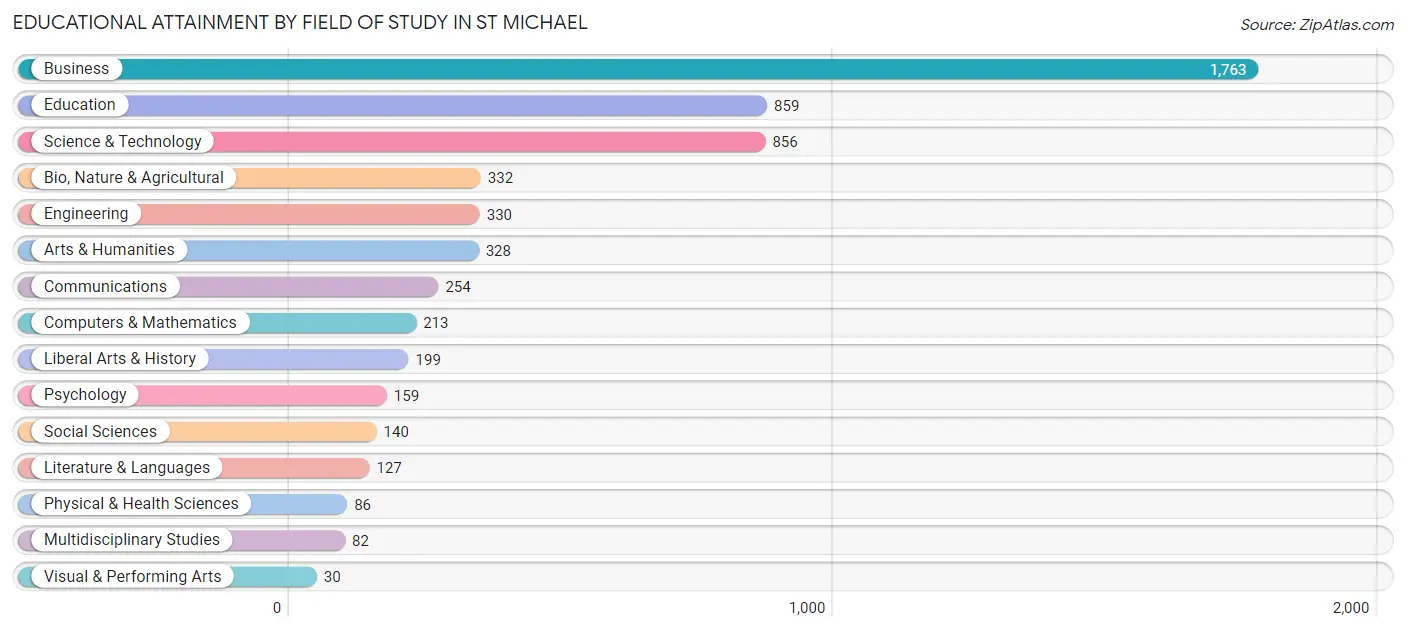
| Field of Study | # Graduates | % Graduates |
| Computers & Mathematics | 213 | 3.7% |
| Bio, Nature & Agricultural | 332 | 5.8% |
| Physical & Health Sciences | 86 | 1.5% |
| Psychology | 159 | 2.8% |
| Social Sciences | 140 | 2.4% |
| Engineering | 330 | 5.7% |
| Multidisciplinary Studies | 82 | 1.4% |
| Science & Technology | 856 | 14.9% |
| Business | 1,763 | 30.6% |
| Education | 859 | 14.9% |
| Literature & Languages | 127 | 2.2% |
| Liberal Arts & History | 199 | 3.5% |
| Visual & Performing Arts | 30 | 0.5% |
| Communications | 254 | 4.4% |
| Arts & Humanities | 328 | 5.7% |
| Total | 5,758 | 100.0% |
Transportation & Commute in St Michael
Vehicle Availability by Sex in St Michael
The most prevalent vehicle ownership categories in St Michael are males with 2 vehicles (2,871, accounting for 48.6%) and females with 2 vehicles (2,107, making up 63.5%).
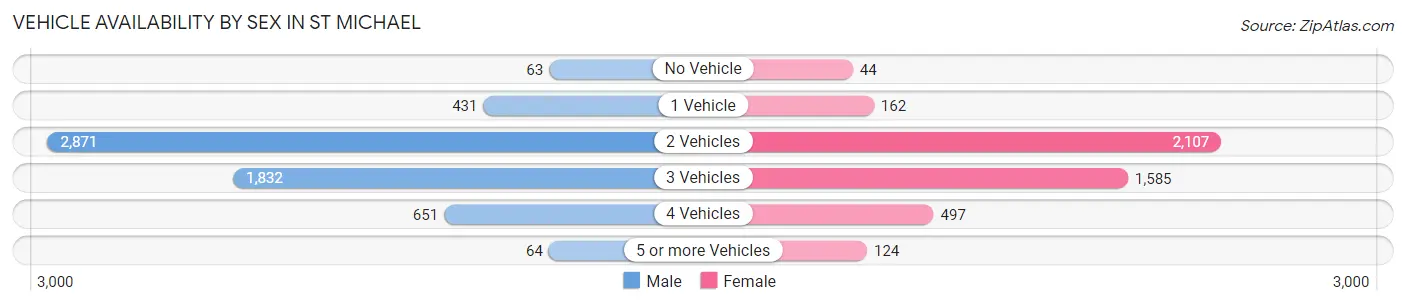
| Vehicles Available | Male | Female |
| No Vehicle | 63 (1.1%) | 44 (1.0%) |
| 1 Vehicle | 431 (7.3%) | 162 (3.6%) |
| 2 Vehicles | 2,871 (48.6%) | 2,107 (46.6%) |
| 3 Vehicles | 1,832 (31.0%) | 1,585 (35.1%) |
| 4 Vehicles | 651 (11.0%) | 497 (11.0%) |
| 5 or more Vehicles | 64 (1.1%) | 124 (2.7%) |
| Total | 5,912 (100.0%) | 4,519 (100.0%) |
Commute Time in St Michael
The most frequently occuring commute durations in St Michael are 30 to 34 minutes (1,351 commuters, 15.2%), 45 to 59 minutes (1,239 commuters, 13.9%), and 40 to 44 minutes (1,201 commuters, 13.5%).
| Commute Time | # Commuters | % Commuters |
| Less than 5 Minutes | 91 | 1.0% |
| 5 to 9 Minutes | 826 | 9.3% |
| 10 to 14 Minutes | 825 | 9.3% |
| 15 to 19 Minutes | 891 | 10.0% |
| 20 to 24 Minutes | 949 | 10.7% |
| 25 to 29 Minutes | 589 | 6.6% |
| 30 to 34 Minutes | 1,351 | 15.2% |
| 35 to 39 Minutes | 524 | 5.9% |
| 40 to 44 Minutes | 1,201 | 13.5% |
| 45 to 59 Minutes | 1,239 | 13.9% |
| 60 to 89 Minutes | 301 | 3.4% |
| 90 or more Minutes | 104 | 1.2% |
Commute Time by Sex in St Michael
The most common commute times in St Michael are 30 to 34 minutes (736 commuters, 14.7%) for males and 20 to 24 minutes (645 commuters, 16.5%) for females.
| Commute Time | Male | Female |
| Less than 5 Minutes | 26 (0.5%) | 65 (1.7%) |
| 5 to 9 Minutes | 580 (11.6%) | 246 (6.3%) |
| 10 to 14 Minutes | 461 (9.2%) | 364 (9.3%) |
| 15 to 19 Minutes | 533 (10.7%) | 358 (9.2%) |
| 20 to 24 Minutes | 304 (6.1%) | 645 (16.5%) |
| 25 to 29 Minutes | 397 (8.0%) | 192 (4.9%) |
| 30 to 34 Minutes | 736 (14.7%) | 615 (15.8%) |
| 35 to 39 Minutes | 434 (8.7%) | 90 (2.3%) |
| 40 to 44 Minutes | 624 (12.5%) | 577 (14.8%) |
| 45 to 59 Minutes | 622 (12.5%) | 617 (15.8%) |
| 60 to 89 Minutes | 202 (4.1%) | 99 (2.5%) |
| 90 or more Minutes | 73 (1.5%) | 31 (0.8%) |
Time of Departure to Work by Sex in St Michael
The most frequent times of departure to work in St Michael are 7:00 AM to 7:29 AM (774, 15.5%) for males and 7:00 AM to 7:29 AM (975, 25.0%) for females.
| Time of Departure | Male | Female |
| 12:00 AM to 4:59 AM | 721 (14.4%) | 0 (0.0%) |
| 5:00 AM to 5:29 AM | 233 (4.7%) | 115 (2.9%) |
| 5:30 AM to 5:59 AM | 516 (10.3%) | 102 (2.6%) |
| 6:00 AM to 6:29 AM | 706 (14.1%) | 458 (11.7%) |
| 6:30 AM to 6:59 AM | 271 (5.4%) | 534 (13.7%) |
| 7:00 AM to 7:29 AM | 774 (15.5%) | 975 (25.0%) |
| 7:30 AM to 7:59 AM | 217 (4.3%) | 295 (7.6%) |
| 8:00 AM to 8:29 AM | 196 (3.9%) | 276 (7.1%) |
| 8:30 AM to 8:59 AM | 46 (0.9%) | 290 (7.4%) |
| 9:00 AM to 9:59 AM | 224 (4.5%) | 129 (3.3%) |
| 10:00 AM to 10:59 AM | 45 (0.9%) | 243 (6.2%) |
| 11:00 AM to 11:59 AM | 28 (0.6%) | 48 (1.2%) |
| 12:00 PM to 3:59 PM | 576 (11.5%) | 146 (3.7%) |
| 4:00 PM to 11:59 PM | 439 (8.8%) | 288 (7.4%) |
| Total | 4,992 (100.0%) | 3,899 (100.0%) |
Housing Occupancy in St Michael
Occupancy by Ownership in St Michael
Of the total 6,579 dwellings in St Michael, owner-occupied units account for 6,024 (91.6%), while renter-occupied units make up 555 (8.4%).
| Occupancy | # Housing Units | % Housing Units |
| Owner Occupied Housing Units | 6,024 | 91.6% |
| Renter-Occupied Housing Units | 555 | 8.4% |
| Total Occupied Housing Units | 6,579 | 100.0% |
Occupancy by Household Size in St Michael

| Household Size | # Housing Units | % Housing Units |
| 1-Person Household | 1,040 | 15.8% |
| 2-Person Household | 2,115 | 32.2% |
| 3-Person Household | 1,202 | 18.3% |
| 4+ Person Household | 2,222 | 33.8% |
| Total Housing Units | 6,579 | 100.0% |
Occupancy by Ownership by Household Size in St Michael
| Household Size | Owner-occupied | Renter-occupied |
| 1-Person Household | 845 (81.2%) | 195 (18.8%) |
| 2-Person Household | 1,992 (94.2%) | 123 (5.8%) |
| 3-Person Household | 1,076 (89.5%) | 126 (10.5%) |
| 4+ Person Household | 2,111 (95.0%) | 111 (5.0%) |
| Total Housing Units | 6,024 (91.6%) | 555 (8.4%) |
Occupancy by Educational Attainment in St Michael
| Household Size | Owner-occupied | Renter-occupied |
| Less than High School | 80 (100.0%) | 0 (0.0%) |
| High School Diploma | 899 (85.5%) | 152 (14.5%) |
| College/Associate Degree | 1,682 (82.3%) | 361 (17.7%) |
| Bachelor's Degree or higher | 3,363 (98.8%) | 42 (1.2%) |
Occupancy by Age of Householder in St Michael
| Age Bracket | # Households | % Households |
| Under 35 Years | 1,338 | 20.3% |
| 35 to 44 Years | 1,406 | 21.4% |
| 45 to 54 Years | 1,395 | 21.2% |
| 55 to 64 Years | 1,279 | 19.4% |
| 65 to 74 Years | 737 | 11.2% |
| 75 to 84 Years | 374 | 5.7% |
| 85 Years and Over | 50 | 0.8% |
| Total | 6,579 | 100.0% |
Housing Finances in St Michael
Median Income by Occupancy in St Michael
| Occupancy Type | # Households | Median Income |
| Owner-Occupied | 6,024 (91.6%) | $123,813 |
| Renter-Occupied | 555 (8.4%) | $0 |
| Average | 6,579 (100.0%) | $123,318 |
Occupancy by Householder Income Bracket in St Michael
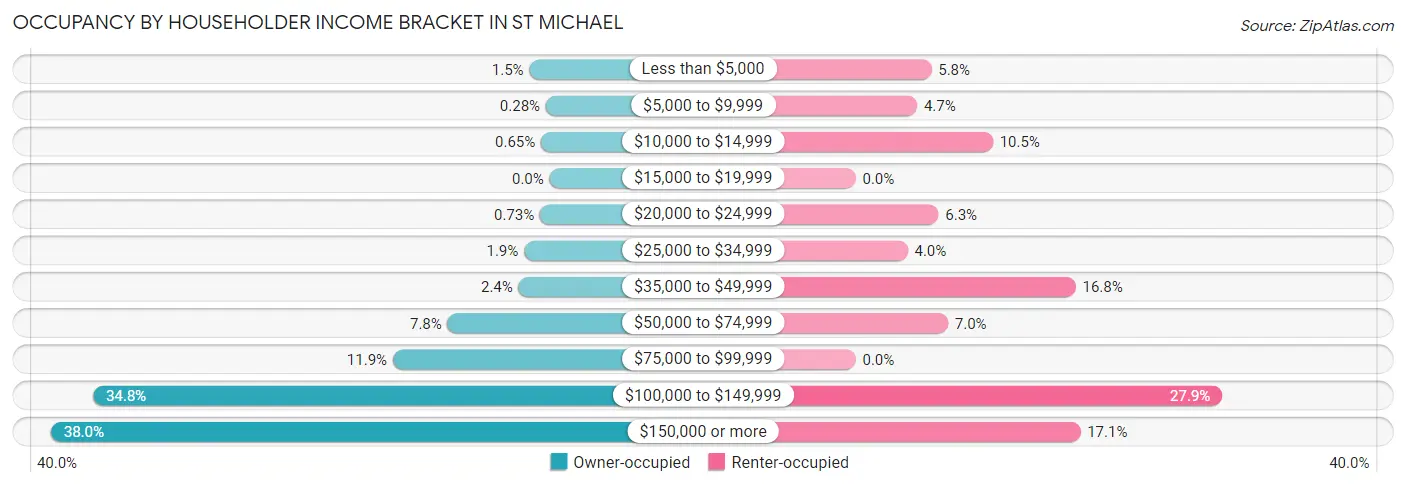
| Income Bracket | Owner-occupied | Renter-occupied |
| Less than $5,000 | 93 (1.5%) | 32 (5.8%) |
| $5,000 to $9,999 | 17 (0.3%) | 26 (4.7%) |
| $10,000 to $14,999 | 39 (0.6%) | 58 (10.4%) |
| $15,000 to $19,999 | 0 (0.0%) | 0 (0.0%) |
| $20,000 to $24,999 | 44 (0.7%) | 35 (6.3%) |
| $25,000 to $34,999 | 117 (1.9%) | 22 (4.0%) |
| $35,000 to $49,999 | 142 (2.4%) | 93 (16.8%) |
| $50,000 to $74,999 | 468 (7.8%) | 39 (7.0%) |
| $75,000 to $99,999 | 719 (11.9%) | 0 (0.0%) |
| $100,000 to $149,999 | 2,096 (34.8%) | 155 (27.9%) |
| $150,000 or more | 2,289 (38.0%) | 95 (17.1%) |
| Total | 6,024 (100.0%) | 555 (100.0%) |
Monthly Housing Cost Tiers in St Michael
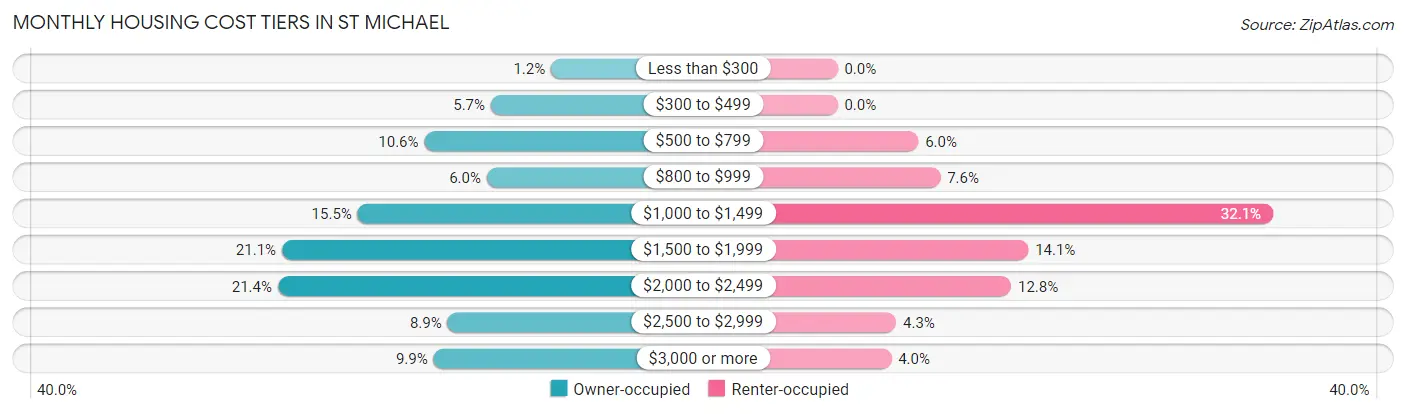
| Monthly Cost | Owner-occupied | Renter-occupied |
| Less than $300 | 74 (1.2%) | 0 (0.0%) |
| $300 to $499 | 341 (5.7%) | 0 (0.0%) |
| $500 to $799 | 636 (10.6%) | 33 (5.9%) |
| $800 to $999 | 359 (6.0%) | 42 (7.6%) |
| $1,000 to $1,499 | 932 (15.5%) | 178 (32.1%) |
| $1,500 to $1,999 | 1,268 (21.0%) | 78 (14.1%) |
| $2,000 to $2,499 | 1,286 (21.3%) | 71 (12.8%) |
| $2,500 to $2,999 | 533 (8.8%) | 24 (4.3%) |
| $3,000 or more | 595 (9.9%) | 22 (4.0%) |
| Total | 6,024 (100.0%) | 555 (100.0%) |
Physical Housing Characteristics in St Michael
Housing Structures in St Michael
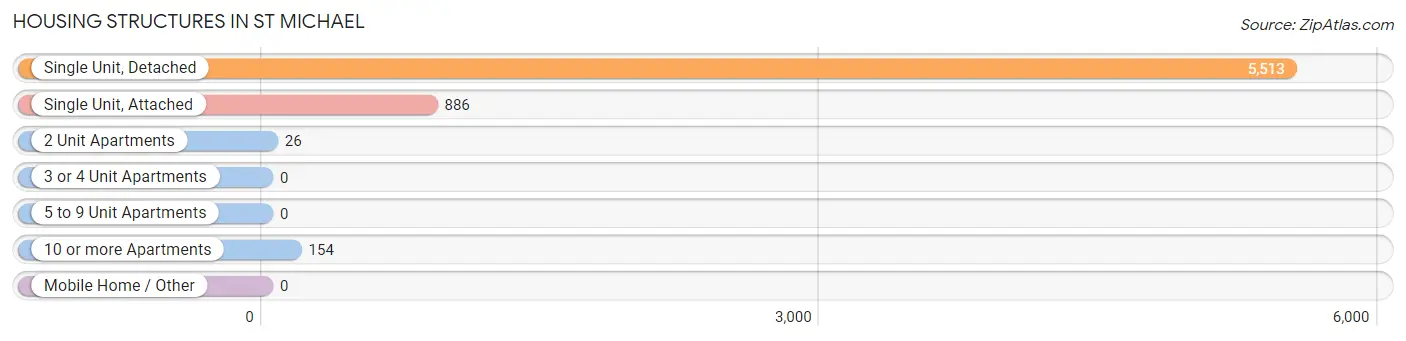
| Structure Type | # Housing Units | % Housing Units |
| Single Unit, Detached | 5,513 | 83.8% |
| Single Unit, Attached | 886 | 13.5% |
| 2 Unit Apartments | 26 | 0.4% |
| 3 or 4 Unit Apartments | 0 | 0.0% |
| 5 to 9 Unit Apartments | 0 | 0.0% |
| 10 or more Apartments | 154 | 2.3% |
| Mobile Home / Other | 0 | 0.0% |
| Total | 6,579 | 100.0% |
Housing Structures by Occupancy in St Michael
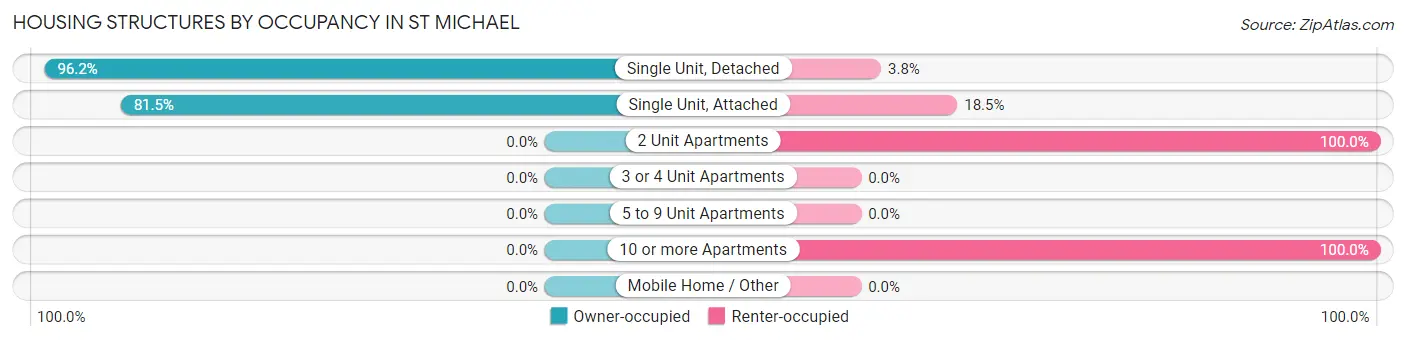
| Structure Type | Owner-occupied | Renter-occupied |
| Single Unit, Detached | 5,302 (96.2%) | 211 (3.8%) |
| Single Unit, Attached | 722 (81.5%) | 164 (18.5%) |
| 2 Unit Apartments | 0 (0.0%) | 26 (100.0%) |
| 3 or 4 Unit Apartments | 0 (0.0%) | 0 (0.0%) |
| 5 to 9 Unit Apartments | 0 (0.0%) | 0 (0.0%) |
| 10 or more Apartments | 0 (0.0%) | 154 (100.0%) |
| Mobile Home / Other | 0 (0.0%) | 0 (0.0%) |
| Total | 6,024 (91.6%) | 555 (8.4%) |
Housing Structures by Number of Rooms in St Michael
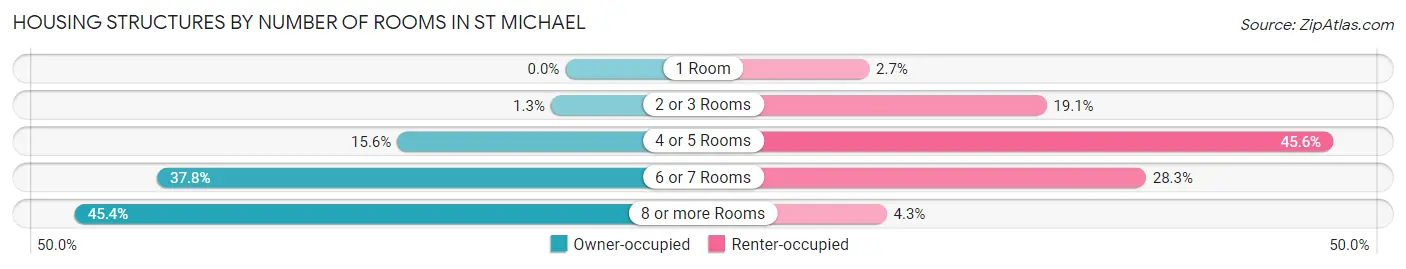
| Number of Rooms | Owner-occupied | Renter-occupied |
| 1 Room | 0 (0.0%) | 15 (2.7%) |
| 2 or 3 Rooms | 81 (1.3%) | 106 (19.1%) |
| 4 or 5 Rooms | 937 (15.5%) | 253 (45.6%) |
| 6 or 7 Rooms | 2,274 (37.8%) | 157 (28.3%) |
| 8 or more Rooms | 2,732 (45.4%) | 24 (4.3%) |
| Total | 6,024 (100.0%) | 555 (100.0%) |
Housing Structure by Heating Type in St Michael
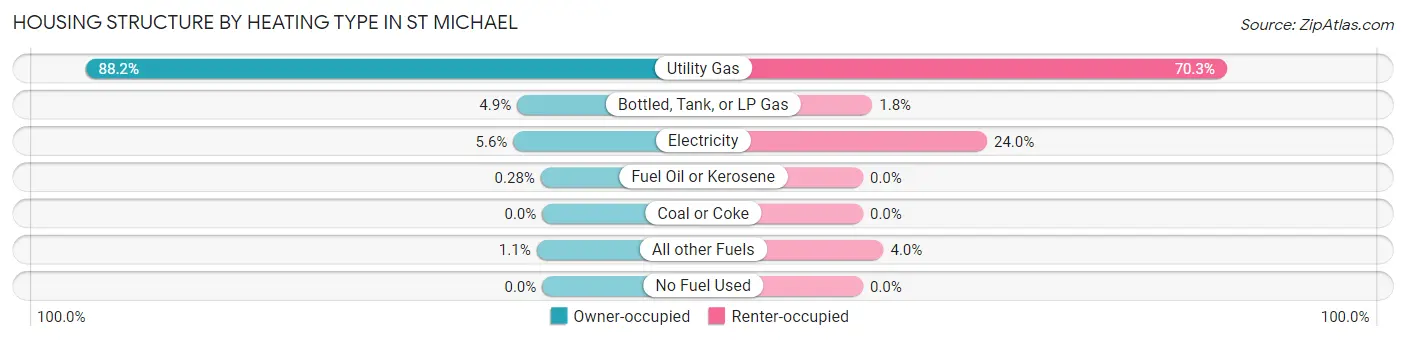
| Heating Type | Owner-occupied | Renter-occupied |
| Utility Gas | 5,313 (88.2%) | 390 (70.3%) |
| Bottled, Tank, or LP Gas | 292 (4.9%) | 10 (1.8%) |
| Electricity | 337 (5.6%) | 133 (24.0%) |
| Fuel Oil or Kerosene | 17 (0.3%) | 0 (0.0%) |
| Coal or Coke | 0 (0.0%) | 0 (0.0%) |
| All other Fuels | 65 (1.1%) | 22 (4.0%) |
| No Fuel Used | 0 (0.0%) | 0 (0.0%) |
| Total | 6,024 (100.0%) | 555 (100.0%) |
Household Vehicle Usage in St Michael
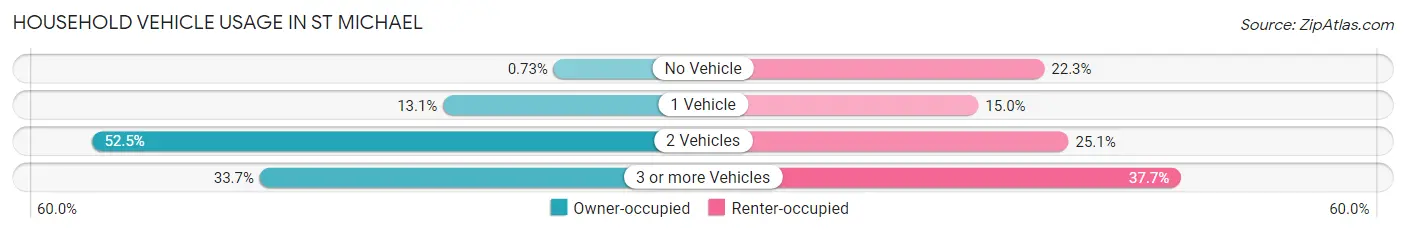
| Vehicles per Household | Owner-occupied | Renter-occupied |
| No Vehicle | 44 (0.7%) | 124 (22.3%) |
| 1 Vehicle | 790 (13.1%) | 83 (14.9%) |
| 2 Vehicles | 3,163 (52.5%) | 139 (25.1%) |
| 3 or more Vehicles | 2,027 (33.7%) | 209 (37.7%) |
| Total | 6,024 (100.0%) | 555 (100.0%) |
Real Estate & Mortgages in St Michael
Real Estate and Mortgage Overview in St Michael
| Characteristic | Without Mortgage | With Mortgage |
| Housing Units | 1,704 | 4,320 |
| Median Property Value | $333,900 | $348,800 |
| Median Household Income | $108,036 | $1,798 |
| Monthly Housing Costs | $707 | $595 |
| Real Estate Taxes | $3,848 | $52 |
Property Value by Mortgage Status in St Michael
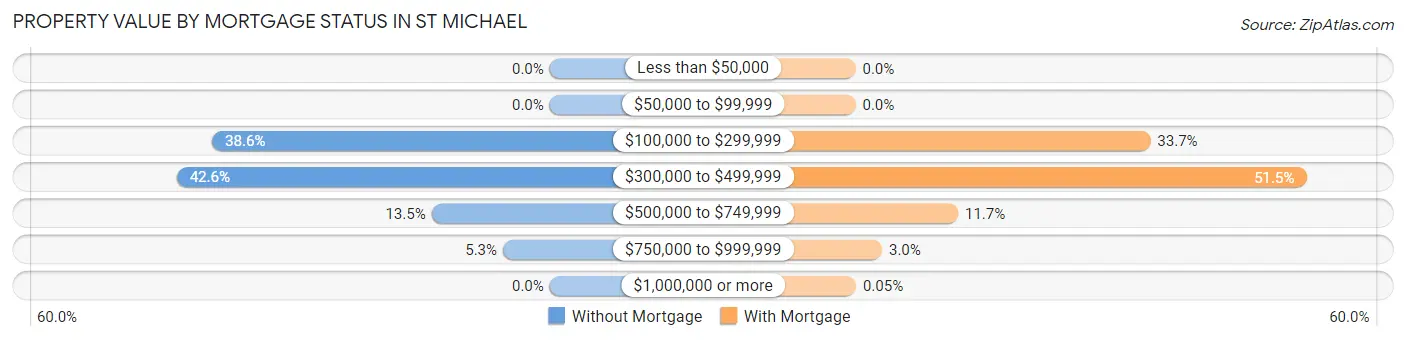
| Property Value | Without Mortgage | With Mortgage |
| Less than $50,000 | 0 (0.0%) | 0 (0.0%) |
| $50,000 to $99,999 | 0 (0.0%) | 0 (0.0%) |
| $100,000 to $299,999 | 657 (38.6%) | 1,456 (33.7%) |
| $300,000 to $499,999 | 726 (42.6%) | 2,225 (51.5%) |
| $500,000 to $749,999 | 230 (13.5%) | 506 (11.7%) |
| $750,000 to $999,999 | 91 (5.3%) | 131 (3.0%) |
| $1,000,000 or more | 0 (0.0%) | 2 (0.1%) |
| Total | 1,704 (100.0%) | 4,320 (100.0%) |
Household Income by Mortgage Status in St Michael
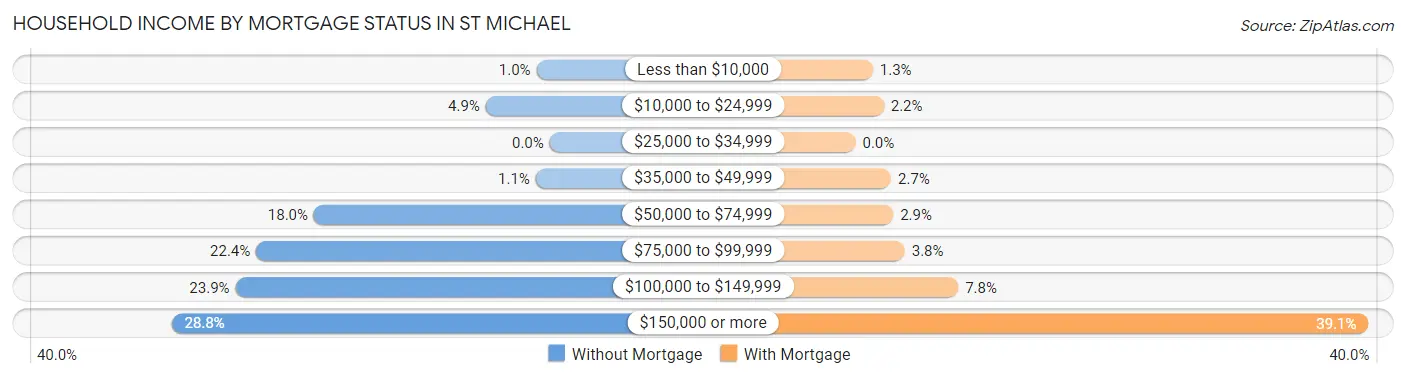
| Household Income | Without Mortgage | With Mortgage |
| Less than $10,000 | 17 (1.0%) | 57 (1.3%) |
| $10,000 to $24,999 | 83 (4.9%) | 93 (2.1%) |
| $25,000 to $34,999 | 0 (0.0%) | 0 (0.0%) |
| $35,000 to $49,999 | 18 (1.1%) | 117 (2.7%) |
| $50,000 to $74,999 | 306 (18.0%) | 124 (2.9%) |
| $75,000 to $99,999 | 381 (22.4%) | 162 (3.7%) |
| $100,000 to $149,999 | 408 (23.9%) | 338 (7.8%) |
| $150,000 or more | 491 (28.8%) | 1,688 (39.1%) |
| Total | 1,704 (100.0%) | 4,320 (100.0%) |
Property Value to Household Income Ratio in St Michael
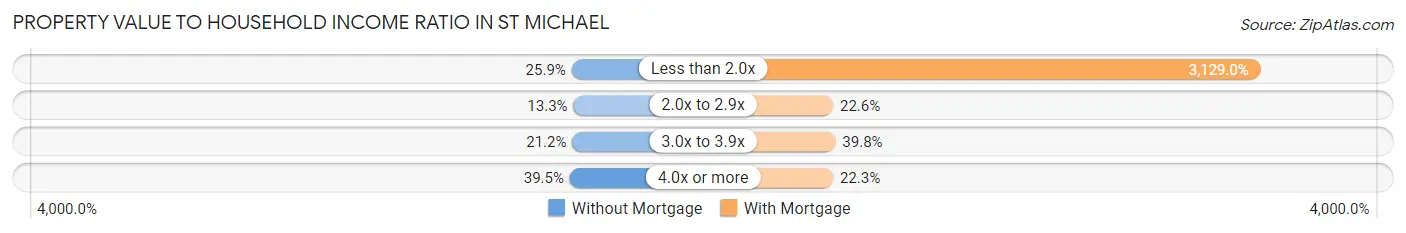
| Value-to-Income Ratio | Without Mortgage | With Mortgage |
| Less than 2.0x | 442 (25.9%) | 135,172 (3,129.0%) |
| 2.0x to 2.9x | 227 (13.3%) | 976 (22.6%) |
| 3.0x to 3.9x | 362 (21.2%) | 1,718 (39.8%) |
| 4.0x or more | 673 (39.5%) | 961 (22.3%) |
| Total | 1,704 (100.0%) | 4,320 (100.0%) |
Real Estate Taxes by Mortgage Status in St Michael
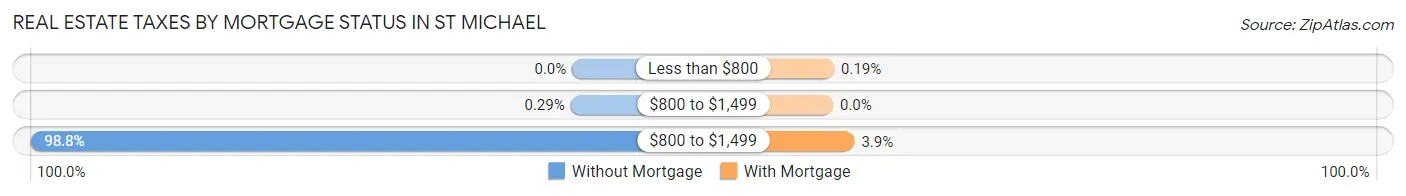
| Property Taxes | Without Mortgage | With Mortgage |
| Less than $800 | 0 (0.0%) | 8 (0.2%) |
| $800 to $1,499 | 5 (0.3%) | 0 (0.0%) |
| $800 to $1,499 | 1,683 (98.8%) | 169 (3.9%) |
| Total | 1,704 (100.0%) | 4,320 (100.0%) |
Health & Disability in St Michael
Health Insurance Coverage by Age in St Michael
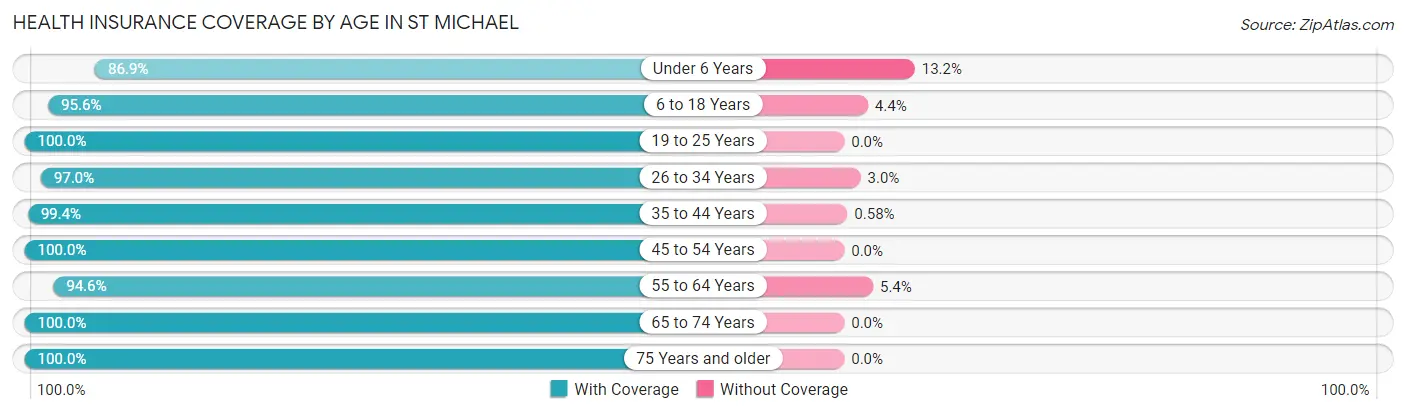
| Age Bracket | With Coverage | Without Coverage |
| Under 6 Years | 1,407 (86.9%) | 213 (13.2%) |
| 6 to 18 Years | 4,067 (95.6%) | 187 (4.4%) |
| 19 to 25 Years | 1,241 (100.0%) | 0 (0.0%) |
| 26 to 34 Years | 2,012 (97.0%) | 63 (3.0%) |
| 35 to 44 Years | 2,724 (99.4%) | 16 (0.6%) |
| 45 to 54 Years | 2,958 (100.0%) | 0 (0.0%) |
| 55 to 64 Years | 2,013 (94.6%) | 114 (5.4%) |
| 65 to 74 Years | 1,079 (100.0%) | 0 (0.0%) |
| 75 Years and older | 552 (100.0%) | 0 (0.0%) |
| Total | 18,053 (96.8%) | 593 (3.2%) |
Health Insurance Coverage by Citizenship Status in St Michael
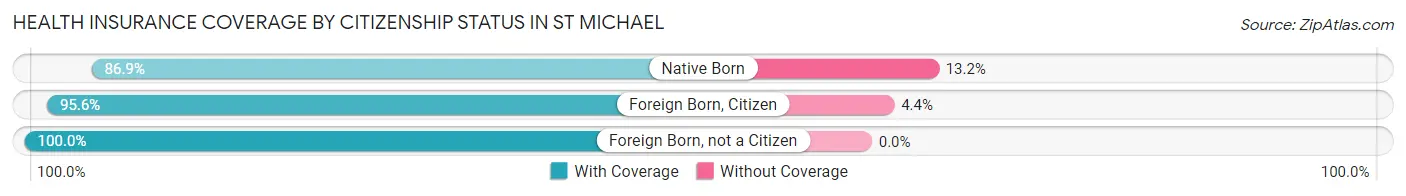
| Citizenship Status | With Coverage | Without Coverage |
| Native Born | 1,407 (86.9%) | 213 (13.2%) |
| Foreign Born, Citizen | 4,067 (95.6%) | 187 (4.4%) |
| Foreign Born, not a Citizen | 1,241 (100.0%) | 0 (0.0%) |
Health Insurance Coverage by Household Income in St Michael
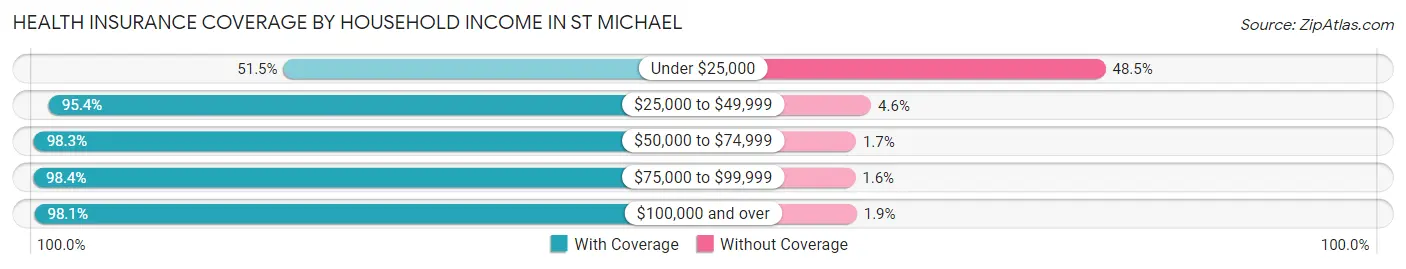
| Household Income | With Coverage | Without Coverage |
| Under $25,000 | 255 (51.5%) | 240 (48.5%) |
| $25,000 to $49,999 | 670 (95.4%) | 32 (4.6%) |
| $50,000 to $74,999 | 913 (98.3%) | 16 (1.7%) |
| $75,000 to $99,999 | 1,411 (98.4%) | 23 (1.6%) |
| $100,000 and over | 14,802 (98.1%) | 282 (1.9%) |
Public vs Private Health Insurance Coverage by Age in St Michael
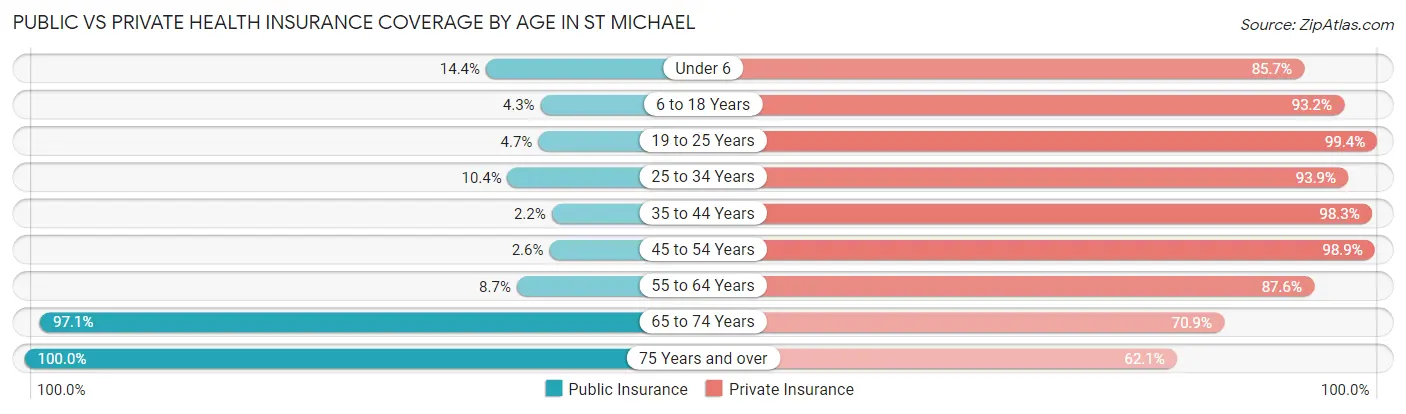
| Age Bracket | Public Insurance | Private Insurance |
| Under 6 | 233 (14.4%) | 1,389 (85.7%) |
| 6 to 18 Years | 181 (4.3%) | 3,964 (93.2%) |
| 19 to 25 Years | 58 (4.7%) | 1,233 (99.4%) |
| 25 to 34 Years | 215 (10.4%) | 1,949 (93.9%) |
| 35 to 44 Years | 60 (2.2%) | 2,694 (98.3%) |
| 45 to 54 Years | 77 (2.6%) | 2,925 (98.9%) |
| 55 to 64 Years | 184 (8.6%) | 1,863 (87.6%) |
| 65 to 74 Years | 1,048 (97.1%) | 765 (70.9%) |
| 75 Years and over | 552 (100.0%) | 343 (62.1%) |
| Total | 2,608 (14.0%) | 17,125 (91.8%) |
Disability Status by Sex by Age in St Michael
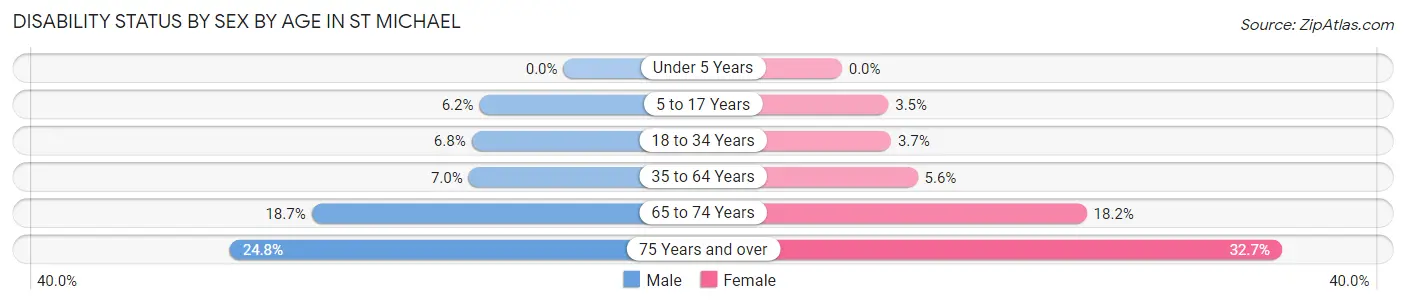
| Age Bracket | Male | Female |
| Under 5 Years | 0 (0.0%) | 0 (0.0%) |
| 5 to 17 Years | 158 (6.2%) | 65 (3.5%) |
| 18 to 34 Years | 122 (6.8%) | 63 (3.6%) |
| 35 to 64 Years | 292 (7.0%) | 207 (5.6%) |
| 65 to 74 Years | 101 (18.7%) | 98 (18.2%) |
| 75 Years and over | 51 (24.8%) | 113 (32.7%) |
Disability Class by Sex by Age in St Michael
Disability Class: Hearing Difficulty
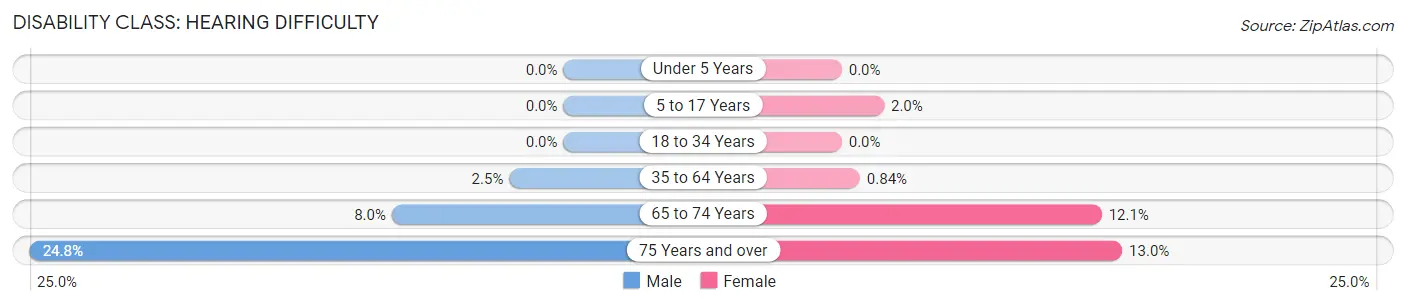
| Age Bracket | Male | Female |
| Under 5 Years | 0 (0.0%) | 0 (0.0%) |
| 5 to 17 Years | 0 (0.0%) | 37 (2.0%) |
| 18 to 34 Years | 0 (0.0%) | 0 (0.0%) |
| 35 to 64 Years | 104 (2.5%) | 31 (0.8%) |
| 65 to 74 Years | 43 (8.0%) | 65 (12.1%) |
| 75 Years and over | 51 (24.8%) | 45 (13.0%) |
Disability Class: Vision Difficulty
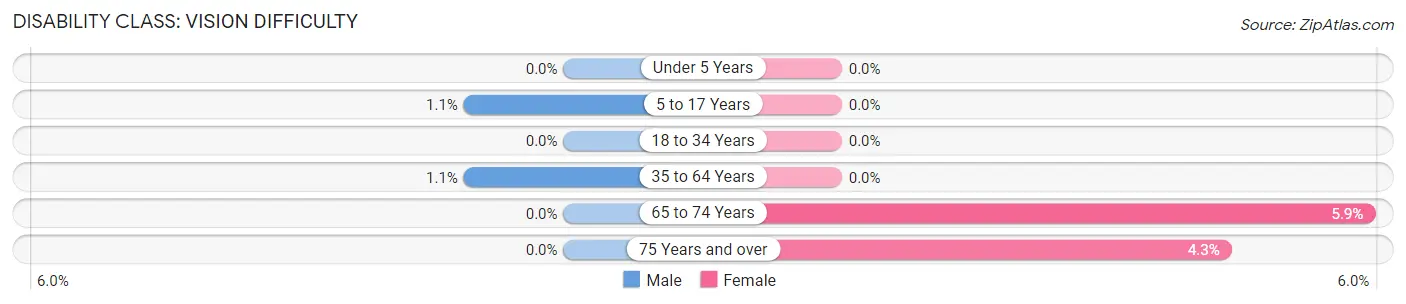
| Age Bracket | Male | Female |
| Under 5 Years | 0 (0.0%) | 0 (0.0%) |
| 5 to 17 Years | 28 (1.1%) | 0 (0.0%) |
| 18 to 34 Years | 0 (0.0%) | 0 (0.0%) |
| 35 to 64 Years | 46 (1.1%) | 0 (0.0%) |
| 65 to 74 Years | 0 (0.0%) | 32 (5.9%) |
| 75 Years and over | 0 (0.0%) | 15 (4.3%) |
Disability Class: Cognitive Difficulty
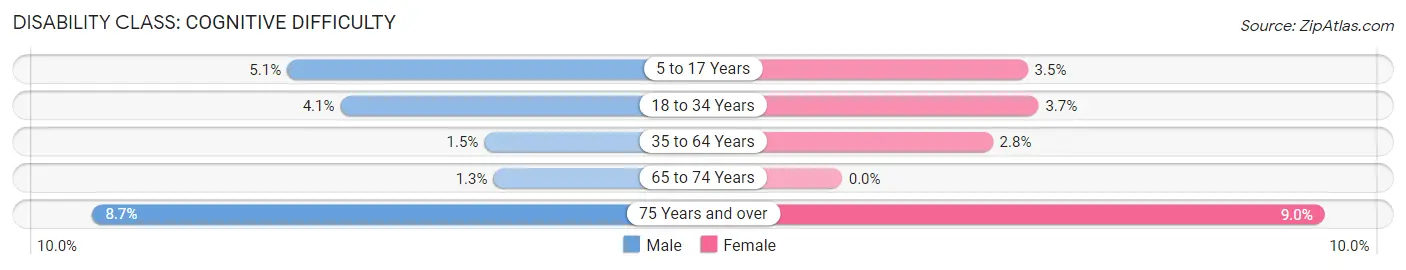
| Age Bracket | Male | Female |
| 5 to 17 Years | 130 (5.1%) | 65 (3.5%) |
| 18 to 34 Years | 74 (4.1%) | 63 (3.6%) |
| 35 to 64 Years | 61 (1.5%) | 103 (2.8%) |
| 65 to 74 Years | 7 (1.3%) | 0 (0.0%) |
| 75 Years and over | 18 (8.7%) | 31 (9.0%) |
Disability Class: Ambulatory Difficulty
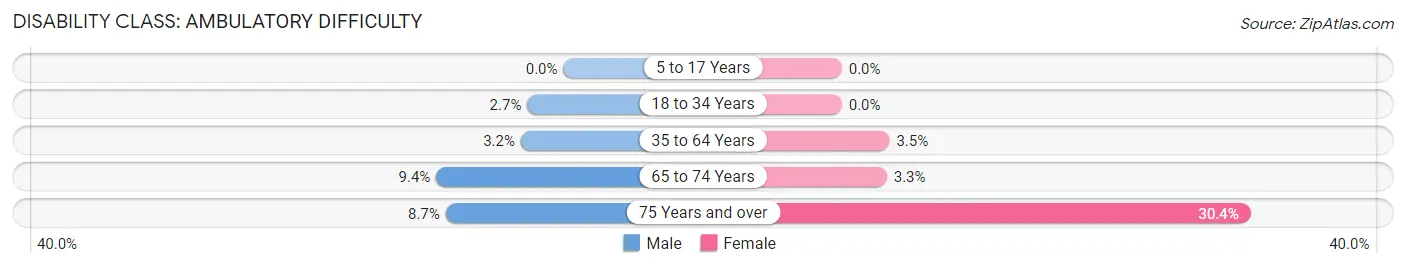
| Age Bracket | Male | Female |
| 5 to 17 Years | 0 (0.0%) | 0 (0.0%) |
| 18 to 34 Years | 48 (2.7%) | 0 (0.0%) |
| 35 to 64 Years | 131 (3.2%) | 130 (3.5%) |
| 65 to 74 Years | 51 (9.4%) | 18 (3.3%) |
| 75 Years and over | 18 (8.7%) | 105 (30.3%) |
Disability Class: Self-Care Difficulty
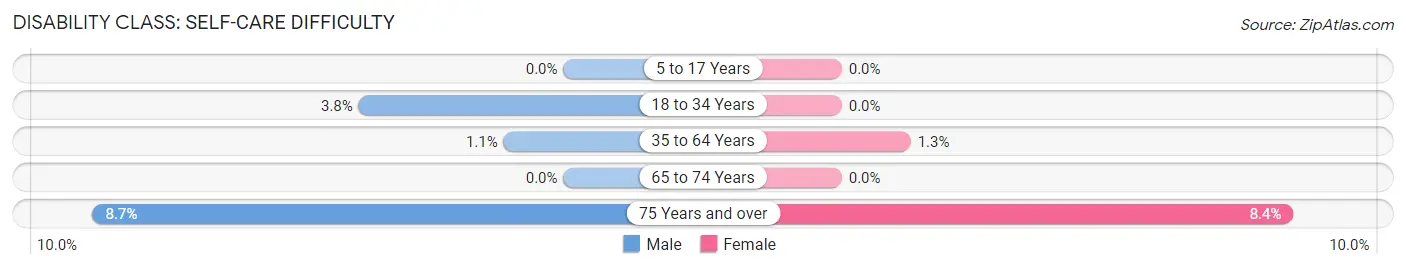
| Age Bracket | Male | Female |
| 5 to 17 Years | 0 (0.0%) | 0 (0.0%) |
| 18 to 34 Years | 68 (3.8%) | 0 (0.0%) |
| 35 to 64 Years | 46 (1.1%) | 47 (1.3%) |
| 65 to 74 Years | 0 (0.0%) | 0 (0.0%) |
| 75 Years and over | 18 (8.7%) | 29 (8.4%) |
Technology Access in St Michael
Computing Device Access in St Michael
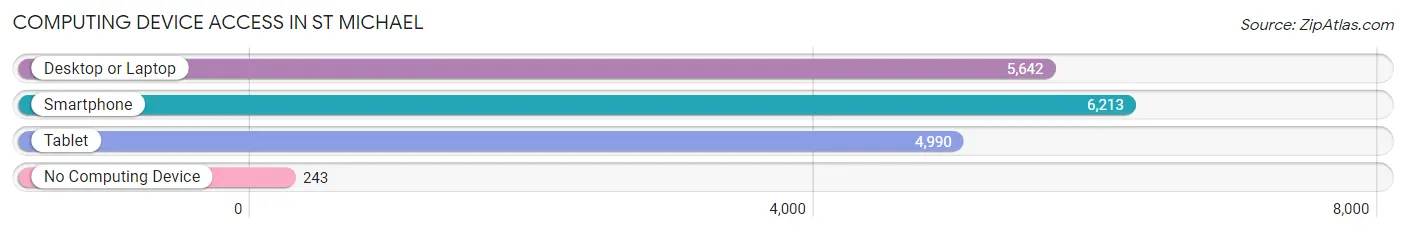
| Device Type | # Households | % Households |
| Desktop or Laptop | 5,642 | 85.8% |
| Smartphone | 6,213 | 94.4% |
| Tablet | 4,990 | 75.8% |
| No Computing Device | 243 | 3.7% |
| Total | 6,579 | 100.0% |
Internet Access in St Michael
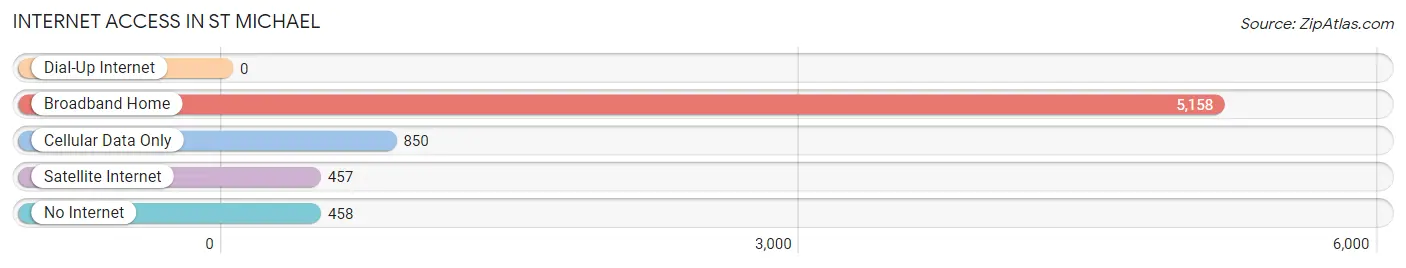
| Internet Type | # Households | % Households |
| Dial-Up Internet | 0 | 0.0% |
| Broadband Home | 5,158 | 78.4% |
| Cellular Data Only | 850 | 12.9% |
| Satellite Internet | 457 | 7.0% |
| No Internet | 458 | 7.0% |
| Total | 6,579 | 100.0% |
St Michael Summary
St. Michael is a city located in the state of Minnesota, United States. It is located in the northwestern part of the state, in Wright County. The city is situated on the banks of the Mississippi River, and is part of the Minneapolis-St. Paul metropolitan area. As of the 2010 census, the population of St. Michael was 16,399.
History
The area that is now St. Michael was first settled in 1855 by a group of German immigrants. The town was originally known as St. Michael’s Settlement, and was named after the patron saint of the German settlers. The town was incorporated in 1858, and was named after the nearby St. Michael’s Church.
In the late 19th century, St. Michael was a thriving agricultural community. The town was home to several grain mills, a creamery, and a cheese factory. The town also had a large lumber industry, and was home to several sawmills.
In the early 20th century, St. Michael began to experience a population boom. The town was home to several large manufacturing companies, including a paper mill, a canning factory, and a furniture factory. The town also had a large railroad industry, and was home to several railroads.
Geography
St. Michael is located in the northwestern part of Minnesota, in Wright County. The city is situated on the banks of the Mississippi River, and is part of the Minneapolis-St. Paul metropolitan area. The city has a total area of 8.7 square miles, of which 8.6 square miles is land and 0.1 square miles is water.
The city is located in a hilly region, and is surrounded by several lakes and rivers. The city is home to several parks, including St. Michael City Park, which features a playground, picnic areas, and a walking trail.
Economy
St. Michael’s economy is largely based on manufacturing and retail. The city is home to several large manufacturing companies, including a paper mill, a canning factory, and a furniture factory. The city also has a large retail sector, and is home to several large shopping centers.
The city is also home to several large healthcare providers, including St. Michael’s Medical Center and St. Michael’s Hospital. The city is also home to several educational institutions, including St. Michael’s College and St. Michael’s High School.
Demographics
As of the 2010 census, the population of St. Michael was 16,399. The racial makeup of the city was 94.2% White, 1.2% African American, 0.7% Native American, 1.2% Asian, 0.1% Pacific Islander, 1.2% from other races, and 1.6% from two or more races. Hispanic or Latino of any race were 3.2% of the population.
The median income for a household in the city was $60,945, and the median income for a family was $71,945. The per capita income for the city was $27,945. About 4.2% of families and 5.7% of the population were below the poverty line, including 6.7% of those under age 18 and 4.2% of those age 65 or over.
Common Questions
What is Per Capita Income in St Michael?
Per Capita income in St Michael is $48,167.
What is the Median Family Income in St Michael?
Median Family Income in St Michael is $132,048.
What is the Median Household income in St Michael?
Median Household Income in St Michael is $123,318.
What is Income or Wage Gap in St Michael?
Income or Wage Gap in St Michael is 27.8%.
Women in St Michael earn 72.2 cents for every dollar earned by a man.
What is Inequality or Gini Index in St Michael?
Inequality or Gini Index in St Michael is 0.32.
What is the Total Population of St Michael?
Total Population of St Michael is 18,648.
What is the Total Male Population of St Michael?
Total Male Population of St Michael is 10,031.
What is the Total Female Population of St Michael?
Total Female Population of St Michael is 8,617.
What is the Ratio of Males per 100 Females in St Michael?
There are 116.41 Males per 100 Females in St Michael.
What is the Ratio of Females per 100 Males in St Michael?
There are 85.90 Females per 100 Males in St Michael.
What is the Median Population Age in St Michael?
Median Population Age in St Michael is 35.7 Years.
What is the Average Family Size in St Michael
Average Family Size in St Michael is 3.2 People.
What is the Average Household Size in St Michael
Average Household Size in St Michael is 2.8 People.
How Large is the Labor Force in St Michael?
There are 10,910 People in the Labor Forcein in St Michael.
What is the Percentage of People in the Labor Force in St Michael?
78.4% of People are in the Labor Force in St Michael.
What is the Unemployment Rate in St Michael?
Unemployment Rate in St Michael is 2.6%.