Zip Codes with the Highest Percentage of Population Employed in Computer, Engineering & Science in Indiana
RELATED REPORTS & OPTIONS
Computer, Engineering & Science
Indiana
Compare Zip Codes
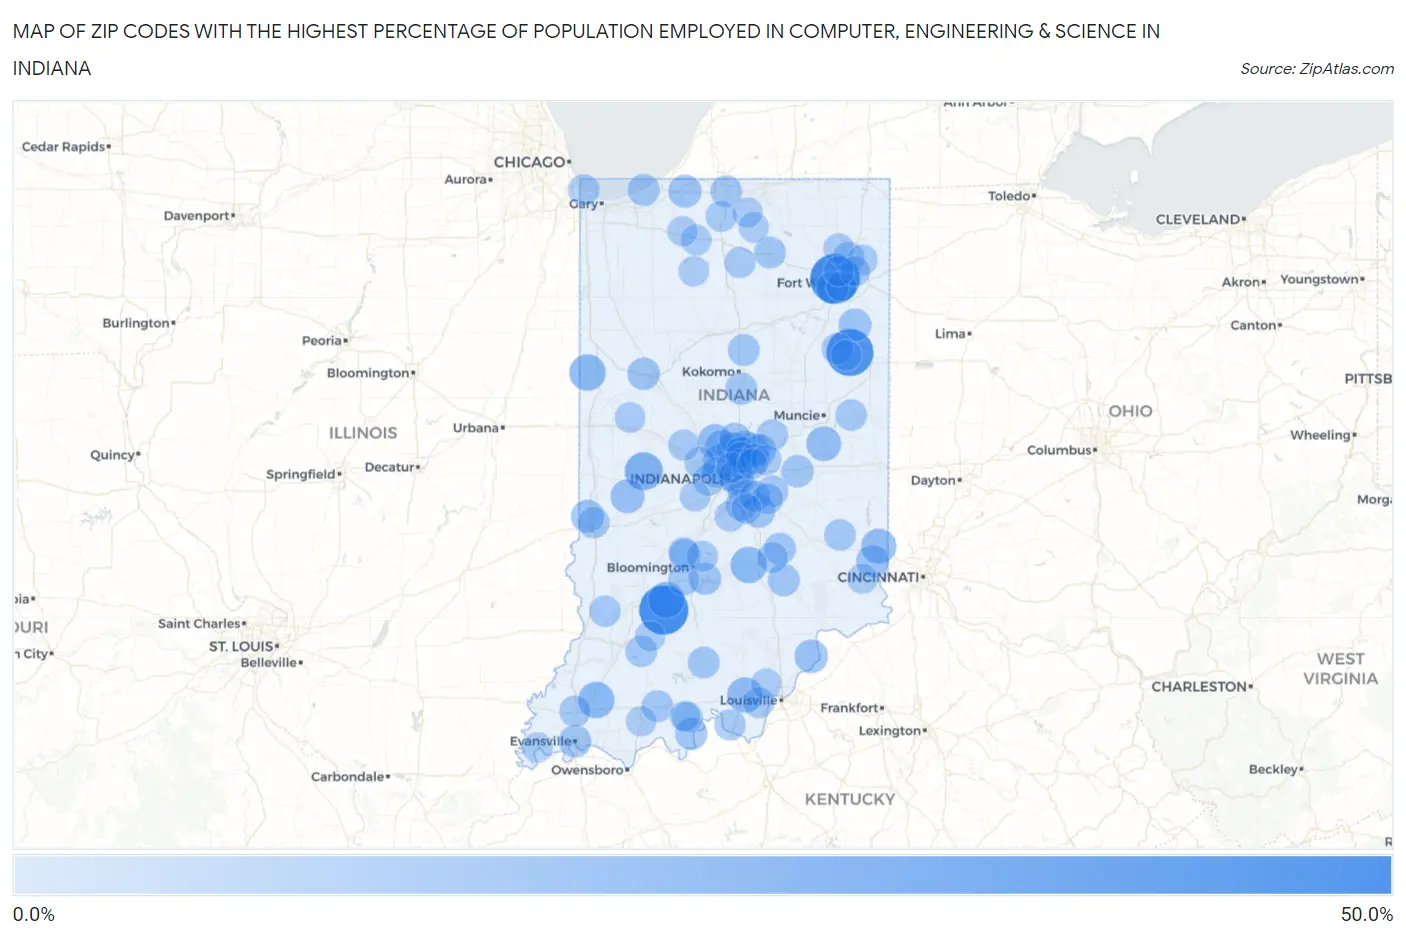
Map of Zip Codes with the Highest Percentage of Population Employed in Computer, Engineering & Science in Indiana
0.0%
50.0%
Zip Codes with the Highest Percentage of Population Employed in Computer, Engineering & Science in Indiana
| Zip Code | % Employed | vs State | vs National | |
| 1. | 46704 | 42.1% | 5.5%(+36.6)#1 | 6.8%(+35.3)#66 |
| 2. | 47522 | 41.6% | 5.5%(+36.1)#2 | 6.8%(+34.8)#70 |
| 3. | 46778 | 37.5% | 5.5%(+32.0)#3 | 6.8%(+30.7)#106 |
| 4. | 46175 | 21.3% | 5.5%(+15.8)#4 | 6.8%(+14.5)#424 |
| 5. | 47917 | 18.5% | 5.5%(+13.0)#5 | 6.8%(+11.7)#636 |
| 6. | 47201 | 18.3% | 5.5%(+12.8)#6 | 6.8%(+11.5)#648 |
| 7. | 47453 | 18.3% | 5.5%(+12.8)#7 | 6.8%(+11.5)#655 |
| 8. | 47654 | 18.2% | 5.5%(+12.7)#8 | 6.8%(+11.4)#664 |
| 9. | 47114 | 16.8% | 5.5%(+11.4)#9 | 6.8%(+10.1)#837 |
| 10. | 47035 | 16.2% | 5.5%(+10.7)#10 | 6.8%(+9.43)#927 |
| 11. | 46204 | 15.8% | 5.5%(+10.4)#11 | 6.8%(+9.07)#982 |
| 12. | 47361 | 15.5% | 5.5%(+10.0)#12 | 6.8%(+8.73)#1,029 |
| 13. | 46075 | 14.8% | 5.5%(+9.32)#13 | 6.8%(+8.02)#1,156 |
| 14. | 47837 | 14.1% | 5.5%(+8.61)#14 | 6.8%(+7.31)#1,314 |
| 15. | 46278 | 14.1% | 5.5%(+8.59)#15 | 6.8%(+7.29)#1,323 |
| 16. | 46038 | 13.5% | 5.5%(+7.99)#16 | 6.8%(+6.69)#1,492 |
| 17. | 46033 | 13.3% | 5.5%(+7.81)#17 | 6.8%(+6.52)#1,546 |
| 18. | 47162 | 13.1% | 5.5%(+7.66)#18 | 6.8%(+6.36)#1,592 |
| 19. | 46032 | 12.9% | 5.5%(+7.44)#19 | 6.8%(+6.15)#1,672 |
| 20. | 46371 | 12.5% | 5.5%(+7.01)#20 | 6.8%(+5.71)#1,839 |
| 21. | 47876 | 12.4% | 5.5%(+6.91)#21 | 6.8%(+5.62)#1,870 |
| 22. | 46814 | 12.4% | 5.5%(+6.89)#22 | 6.8%(+5.59)#1,877 |
| 23. | 46731 | 12.2% | 5.5%(+6.77)#23 | 6.8%(+5.48)#1,926 |
| 24. | 46162 | 12.1% | 5.5%(+6.67)#24 | 6.8%(+5.37)#1,969 |
| 25. | 47022 | 12.0% | 5.5%(+6.57)#25 | 6.8%(+5.27)#2,022 |
| 26. | 46077 | 11.9% | 5.5%(+6.41)#26 | 6.8%(+5.11)#2,092 |
| 27. | 47906 | 11.6% | 5.5%(+6.11)#27 | 6.8%(+4.81)#2,253 |
| 28. | 47708 | 11.5% | 5.5%(+6.01)#28 | 6.8%(+4.71)#2,313 |
| 29. | 46117 | 11.5% | 5.5%(+5.98)#29 | 6.8%(+4.69)#2,325 |
| 30. | 46202 | 11.4% | 5.5%(+5.91)#30 | 6.8%(+4.62)#2,361 |
| 31. | 47525 | 11.3% | 5.5%(+5.87)#31 | 6.8%(+4.58)#2,384 |
| 32. | 47401 | 11.3% | 5.5%(+5.79)#32 | 6.8%(+4.49)#2,433 |
| 33. | 47273 | 11.1% | 5.5%(+5.67)#33 | 6.8%(+4.38)#2,491 |
| 34. | 46237 | 10.8% | 5.5%(+5.32)#34 | 6.8%(+4.02)#2,684 |
| 35. | 47246 | 10.8% | 5.5%(+5.31)#35 | 6.8%(+4.02)#2,687 |
| 36. | 46301 | 10.7% | 5.5%(+5.25)#36 | 6.8%(+3.95)#2,722 |
| 37. | 46074 | 10.5% | 5.5%(+5.04)#37 | 6.8%(+3.74)#2,866 |
| 38. | 46068 | 10.5% | 5.5%(+5.00)#38 | 6.8%(+3.70)#2,889 |
| 39. | 46914 | 10.5% | 5.5%(+4.99)#39 | 6.8%(+3.69)#2,894 |
| 40. | 46280 | 10.4% | 5.5%(+4.89)#40 | 6.8%(+3.59)#2,963 |
| 41. | 46582 | 10.3% | 5.5%(+4.88)#41 | 6.8%(+3.58)#2,969 |
| 42. | 46037 | 10.3% | 5.5%(+4.86)#42 | 6.8%(+3.56)#2,974 |
| 43. | 47532 | 10.3% | 5.5%(+4.79)#43 | 6.8%(+3.50)#3,025 |
| 44. | 47454 | 10.2% | 5.5%(+4.78)#44 | 6.8%(+3.48)#3,038 |
| 45. | 46781 | 10.1% | 5.5%(+4.64)#45 | 6.8%(+3.34)#3,140 |
| 46. | 47036 | 10.1% | 5.5%(+4.64)#46 | 6.8%(+3.34)#3,147 |
| 47. | 47519 | 10.0% | 5.5%(+4.57)#47 | 6.8%(+3.27)#3,190 |
| 48. | 46130 | 10.0% | 5.5%(+4.55)#48 | 6.8%(+3.26)#3,198 |
| 49. | 47404 | 10.0% | 5.5%(+4.54)#49 | 6.8%(+3.24)#3,209 |
| 50. | 46748 | 10.0% | 5.5%(+4.49)#50 | 6.8%(+3.19)#3,255 |
| 51. | 46617 | 10.0% | 5.5%(+4.49)#51 | 6.8%(+3.19)#3,257 |
| 52. | 47809 | 9.9% | 5.5%(+4.44)#52 | 6.8%(+3.15)#3,292 |
| 53. | 47340 | 9.9% | 5.5%(+4.44)#53 | 6.8%(+3.14)#3,299 |
| 54. | 46143 | 9.9% | 5.5%(+4.41)#54 | 6.8%(+3.11)#3,314 |
| 55. | 46394 | 9.6% | 5.5%(+4.17)#55 | 6.8%(+2.88)#3,491 |
| 56. | 46123 | 9.6% | 5.5%(+4.17)#56 | 6.8%(+2.87)#3,496 |
| 57. | 46220 | 9.6% | 5.5%(+4.13)#57 | 6.8%(+2.83)#3,526 |
| 58. | 47639 | 9.6% | 5.5%(+4.12)#58 | 6.8%(+2.83)#3,530 |
| 59. | 47535 | 9.5% | 5.5%(+4.04)#59 | 6.8%(+2.74)#3,596 |
| 60. | 46051 | 9.5% | 5.5%(+4.02)#60 | 6.8%(+2.72)#3,612 |
| 61. | 46240 | 9.5% | 5.5%(+4.01)#61 | 6.8%(+2.72)#3,617 |
| 62. | 46167 | 9.4% | 5.5%(+3.95)#62 | 6.8%(+2.65)#3,671 |
| 63. | 46259 | 9.3% | 5.5%(+3.86)#63 | 6.8%(+2.56)#3,759 |
| 64. | 47403 | 9.3% | 5.5%(+3.83)#64 | 6.8%(+2.54)#3,778 |
| 65. | 47408 | 9.2% | 5.5%(+3.73)#65 | 6.8%(+2.44)#3,864 |
| 66. | 46102 | 9.2% | 5.5%(+3.70)#66 | 6.8%(+2.41)#3,898 |
| 67. | 46570 | 9.2% | 5.5%(+3.69)#67 | 6.8%(+2.40)#3,908 |
| 68. | 47136 | 9.1% | 5.5%(+3.64)#68 | 6.8%(+2.34)#3,956 |
| 69. | 46536 | 9.1% | 5.5%(+3.60)#69 | 6.8%(+2.30)#4,005 |
| 70. | 46126 | 9.1% | 5.5%(+3.60)#70 | 6.8%(+2.30)#4,006 |
| 71. | 47142 | 9.0% | 5.5%(+3.53)#71 | 6.8%(+2.23)#4,072 |
| 72. | 47203 | 9.0% | 5.5%(+3.50)#72 | 6.8%(+2.21)#4,096 |
| 73. | 46234 | 8.8% | 5.5%(+3.37)#73 | 6.8%(+2.07)#4,228 |
| 74. | 46106 | 8.7% | 5.5%(+3.26)#74 | 6.8%(+1.97)#4,326 |
| 75. | 46759 | 8.7% | 5.5%(+3.26)#75 | 6.8%(+1.96)#4,331 |
| 76. | 47551 | 8.6% | 5.5%(+3.14)#76 | 6.8%(+1.84)#4,479 |
| 77. | 46763 | 8.5% | 5.5%(+3.04)#77 | 6.8%(+1.74)#4,597 |
| 78. | 46765 | 8.3% | 5.5%(+2.87)#78 | 6.8%(+1.57)#4,795 |
| 79. | 47994 | 8.3% | 5.5%(+2.87)#79 | 6.8%(+1.57)#4,805 |
| 80. | 46531 | 8.3% | 5.5%(+2.80)#80 | 6.8%(+1.50)#4,917 |
| 81. | 46228 | 8.2% | 5.5%(+2.75)#81 | 6.8%(+1.46)#4,968 |
| 82. | 46256 | 8.2% | 5.5%(+2.72)#82 | 6.8%(+1.42)#5,019 |
| 83. | 46118 | 8.2% | 5.5%(+2.69)#83 | 6.8%(+1.40)#5,053 |
| 84. | 47119 | 8.1% | 5.5%(+2.63)#84 | 6.8%(+1.33)#5,138 |
| 85. | 46055 | 8.1% | 5.5%(+2.62)#85 | 6.8%(+1.32)#5,159 |
| 86. | 46960 | 8.0% | 5.5%(+2.56)#86 | 6.8%(+1.26)#5,234 |
| 87. | 47429 | 8.0% | 5.5%(+2.53)#87 | 6.8%(+1.23)#5,273 |
| 88. | 46804 | 8.0% | 5.5%(+2.50)#88 | 6.8%(+1.20)#5,313 |
| 89. | 47552 | 7.9% | 5.5%(+2.41)#89 | 6.8%(+1.12)#5,428 |
| 90. | 47032 | 7.9% | 5.5%(+2.40)#90 | 6.8%(+1.11)#5,446 |
| 91. | 46825 | 7.9% | 5.5%(+2.40)#91 | 6.8%(+1.11)#5,449 |
| 92. | 46532 | 7.9% | 5.5%(+2.39)#92 | 6.8%(+1.09)#5,469 |
| 93. | 46216 | 7.8% | 5.5%(+2.38)#93 | 6.8%(+1.08)#5,483 |
| 94. | 47514 | 7.8% | 5.5%(+2.38)#94 | 6.8%(+1.08)#5,489 |
| 95. | 46550 | 7.8% | 5.5%(+2.38)#95 | 6.8%(+1.08)#5,492 |
| 96. | 47553 | 7.8% | 5.5%(+2.37)#96 | 6.8%(+1.07)#5,494 |
| 97. | 46184 | 7.8% | 5.5%(+2.36)#97 | 6.8%(+1.06)#5,510 |
| 98. | 46818 | 7.8% | 5.5%(+2.33)#98 | 6.8%(+1.03)#5,548 |
| 99. | 46573 | 7.8% | 5.5%(+2.31)#99 | 6.8%(+1.01)#5,584 |
| 100. | 47620 | 7.8% | 5.5%(+2.31)#100 | 6.8%(+1.01)#5,586 |
Common Questions
What are the Top 10 Zip Codes with the Highest Percentage of Population Employed in Computer, Engineering & Science in Indiana?
Top 10 Zip Codes with the Highest Percentage of Population Employed in Computer, Engineering & Science in Indiana are:
What zip code has the Highest Percentage of Population Employed in Computer, Engineering & Science in Indiana?
46704 has the Highest Percentage of Population Employed in Computer, Engineering & Science in Indiana with 42.1%.
What is the Percentage of Population Employed in Computer, Engineering & Science in the State of Indiana?
Percentage of Population Employed in Computer, Engineering & Science in Indiana is 5.5%.
What is the Percentage of Population Employed in Computer, Engineering & Science in the United States?
Percentage of Population Employed in Computer, Engineering & Science in the United States is 6.8%.