Zip Codes with the Highest Percentage of Population Employed in Accommodation & Food Services in Fishers, IN
RELATED REPORTS & OPTIONS
Accommodation & Food Services
Fishers
Compare Zip Codes
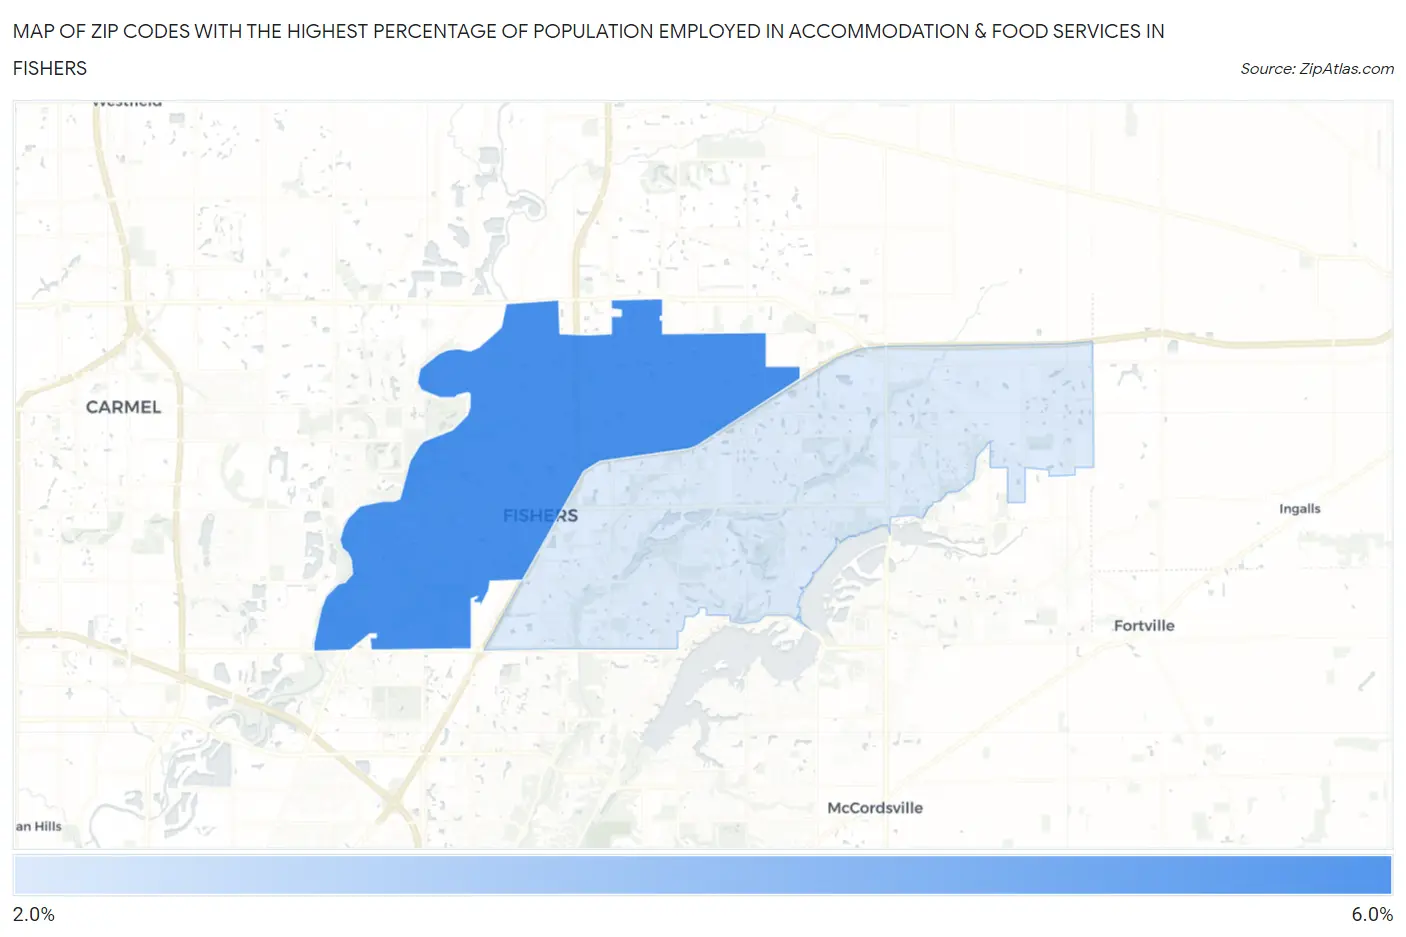
Map of Zip Codes with the Highest Percentage of Population Employed in Accommodation & Food Services in Fishers
2.4%
5.0%
Zip Codes with the Highest Percentage of Population Employed in Accommodation & Food Services in Fishers, IN
| Zip Code | % Employed | vs State | vs National | |
| 1. | 46038 | 5.0% | 6.4%(-1.42)#402 | 6.9%(-1.86)#16,756 |
| 2. | 46037 | 2.4% | 6.4%(-4.04)#622 | 6.9%(-4.48)#24,724 |
1
Common Questions
What are the Top Zip Codes with the Highest Percentage of Population Employed in Accommodation & Food Services in Fishers, IN?
Top Zip Codes with the Highest Percentage of Population Employed in Accommodation & Food Services in Fishers, IN are:
What zip code has the Highest Percentage of Population Employed in Accommodation & Food Services in Fishers, IN?
46038 has the Highest Percentage of Population Employed in Accommodation & Food Services in Fishers, IN with 5.0%.
What is the Percentage of Population Employed in Accommodation & Food Services in Fishers, IN?
Percentage of Population Employed in Accommodation & Food Services in Fishers is 3.9%.
What is the Percentage of Population Employed in Accommodation & Food Services in Indiana?
Percentage of Population Employed in Accommodation & Food Services in Indiana is 6.4%.
What is the Percentage of Population Employed in Accommodation & Food Services in the United States?
Percentage of Population Employed in Accommodation & Food Services in the United States is 6.9%.