Zip Codes with the Highest Percentage of Population Employed in Accommodation & Food Services in Indianapolis, IN

RELATED REPORTS & OPTIONS

Accommodation & Food Services
Population
Families and Households
Female Fertility
Female Fertility (Unmarried)
Race (Community Size)
Race (Percentage)
Ancestry (Community Size)
AfghanAfricanAlaskan AthabascanAlbanianAlsatianAmericanApacheArabArgentineanArmenianAustralianAustrianBahamianBangladeshiBarbadianBasqueBelgianBelizeanBhutaneseBlackfeetBolivianBrazilianBritishBritish West IndianBulgarianBurmeseCajunCanadianCelticCentral AmericanCentral American IndianCherokeeChickasawChileanChippewaChoctawColombianCosta RicanCroatianCrowCubanCzechCzechoslovakianDanishDominicanDutchEastern EuropeanEcuadorianEgyptianEnglishEstonianEthiopianEuropeanFilipinoFinnishFrenchFrench CanadianGermanGerman RussianGhanaianGreekGuamanian / ChamorroGuatemalanGuyaneseHaitianHonduranHopiHungarianIcelanderIndian (Asian)IndonesianInupiatIranianIraqiIrishIroquoisIsraeliItalianJamaicanJapaneseJordanianKenyanKoreanLaotianLatvianLebaneseLiberianLithuanianLuxembourgerMacedonianMalaysianMenomineeMexicanMexican American IndianMongolianMoroccanNative HawaiianNavajoNew ZealanderNicaraguanNigerianNorthern EuropeanNorwegianPakistaniPalestinianPanamanianPennsylvania GermanPeruvianPolishPortuguesePotawatomiPuerto RicanRomanianRussianSalvadoranSamoanScandinavianScotch-IrishScottishSeminoleSenegaleseSerbianSierra LeoneanSiouxSlavicSlovakSloveneSouth AfricanSouth AmericanSouth American IndianSpaniardSpanishSri LankanSubsaharan AfricanSudaneseSwedishSwissSyrianThaiTonganTrinidadian and TobagonianTurkishUgandanUkrainianUruguayanVenezuelanVietnameseWelshWest IndianYugoslavianZimbabwean
Ancestry (Percentage)
AfghanAfricanAlaskan AthabascanAlbanianAlsatianAmericanApacheArabArgentineanArmenianAustralianAustrianBahamianBangladeshiBarbadianBasqueBelgianBelizeanBhutaneseBlackfeetBolivianBrazilianBritishBritish West IndianBulgarianBurmeseCajunCanadianCelticCentral AmericanCentral American IndianCherokeeChickasawChileanChippewaChoctawColombianCosta RicanCroatianCrowCubanCzechCzechoslovakianDanishDominicanDutchEastern EuropeanEcuadorianEgyptianEnglishEstonianEthiopianEuropeanFilipinoFinnishFrenchFrench CanadianGermanGerman RussianGhanaianGreekGuamanian / ChamorroGuatemalanGuyaneseHaitianHonduranHopiHungarianIcelanderIndian (Asian)IndonesianInupiatIranianIraqiIrishIroquoisIsraeliItalianJamaicanJapaneseJordanianKenyanKoreanLaotianLatvianLebaneseLiberianLithuanianLuxembourgerMacedonianMalaysianMenomineeMexicanMexican American IndianMongolianMoroccanNative HawaiianNavajoNew ZealanderNicaraguanNigerianNorthern EuropeanNorwegianPakistaniPalestinianPanamanianPennsylvania GermanPeruvianPolishPortuguesePotawatomiPuerto RicanRomanianRussianSalvadoranSamoanScandinavianScotch-IrishScottishSeminoleSenegaleseSerbianSierra LeoneanSiouxSlavicSlovakSloveneSouth AfricanSouth AmericanSouth American IndianSpaniardSpanishSri LankanSubsaharan AfricanSudaneseSwedishSwissSyrianThaiTonganTrinidadian and TobagonianTurkishUgandanUkrainianUruguayanVenezuelanVietnameseWelshWest IndianYugoslavianZimbabwean
Immigrant Origin (Total)
AfghanistanAfricaArgentinaAsiaAustraliaAustriaBahamasBangladeshBarbadosBelarusBoliviaBosnia and HerzegovinaBrazilBulgariaBurma / MyanmarCambodiaCameroonCanadaCaribbeanCentral AmericaChileChinaColombiaCongoCosta RicaCubaDenmarkDominican RepublicEastern AfricaEastern AsiaEastern EuropeEcuadorEgyptEl SalvadorEnglandEritreaEthiopiaEuropeFranceGermanyGhanaGreeceGuatemalaGuyanaHaitiHondurasHong KongHungaryIndiaIndonesiaIranIraqIrelandIsraelItalyJamaicaJapanJordanKenyaKoreaLaosLatin AmericaLatviaLebanonLiberiaMalaysiaMexicoMiddle AfricaMoldovaMoroccoNepalNetherlandsNicaraguaNigeriaNorth MacedoniaNorthern AfricaNorthern EuropeNorwayOceaniaPakistanPanamaPeruPhilippinesPolandPortugalRomaniaRussiaSaudi ArabiaScotlandSenegalSerbiaSierra LeoneSingaporeSouth AfricaSouth AmericaSouth Central AsiaSouth Eastern AsiaSouthern EuropeSpainSt. Vincent and the GrenadinesSudanSyriaTaiwanThailandTrinidad and TobagoTurkeyUgandaUkraineUzbekistanVenezuelaVietnamWest IndiesWestern AfricaWestern AsiaWestern EuropeYemenZaireZimbabwe
Immigrant Origin (Percentage)
AfghanistanAfricaArgentinaAsiaAustraliaAustriaBahamasBangladeshBarbadosBelarusBoliviaBosnia and HerzegovinaBrazilBulgariaBurma / MyanmarCambodiaCameroonCanadaCaribbeanCentral AmericaChileChinaColombiaCongoCosta RicaCubaDenmarkDominican RepublicEastern AfricaEastern AsiaEastern EuropeEcuadorEgyptEl SalvadorEnglandEritreaEthiopiaEuropeFranceGermanyGhanaGreeceGuatemalaGuyanaHaitiHondurasHong KongHungaryIndiaIndonesiaIranIraqIrelandIsraelItalyJamaicaJapanJordanKenyaKoreaLaosLatin AmericaLatviaLebanonLiberiaMalaysiaMexicoMiddle AfricaMoldovaMoroccoNepalNetherlandsNicaraguaNigeriaNorth MacedoniaNorthern AfricaNorthern EuropeNorwayOceaniaPakistanPanamaPeruPhilippinesPolandPortugalRomaniaRussiaSaudi ArabiaScotlandSenegalSerbiaSierra LeoneSingaporeSouth AfricaSouth AmericaSouth Central AsiaSouth Eastern AsiaSouthern EuropeSpainSt. Vincent and the GrenadinesSudanSyriaTaiwanThailandTrinidad and TobagoTurkeyUgandaUkraineUzbekistanVenezuelaVietnamWest IndiesWestern AfricaWestern AsiaWestern EuropeYemenZaireZimbabwe
Income
Income (Families)
Income (Households)
Poverty
Poverty (Families)
Unemployment
Employment Occupations
Employment Industries
Employer Class
Commute Time
Commute Means
School Enrollment
Education by Degree Field
Occupancy
Finances
Physical Characteristics
Indianapolis
Compare Zip Codes
Comparison Subject

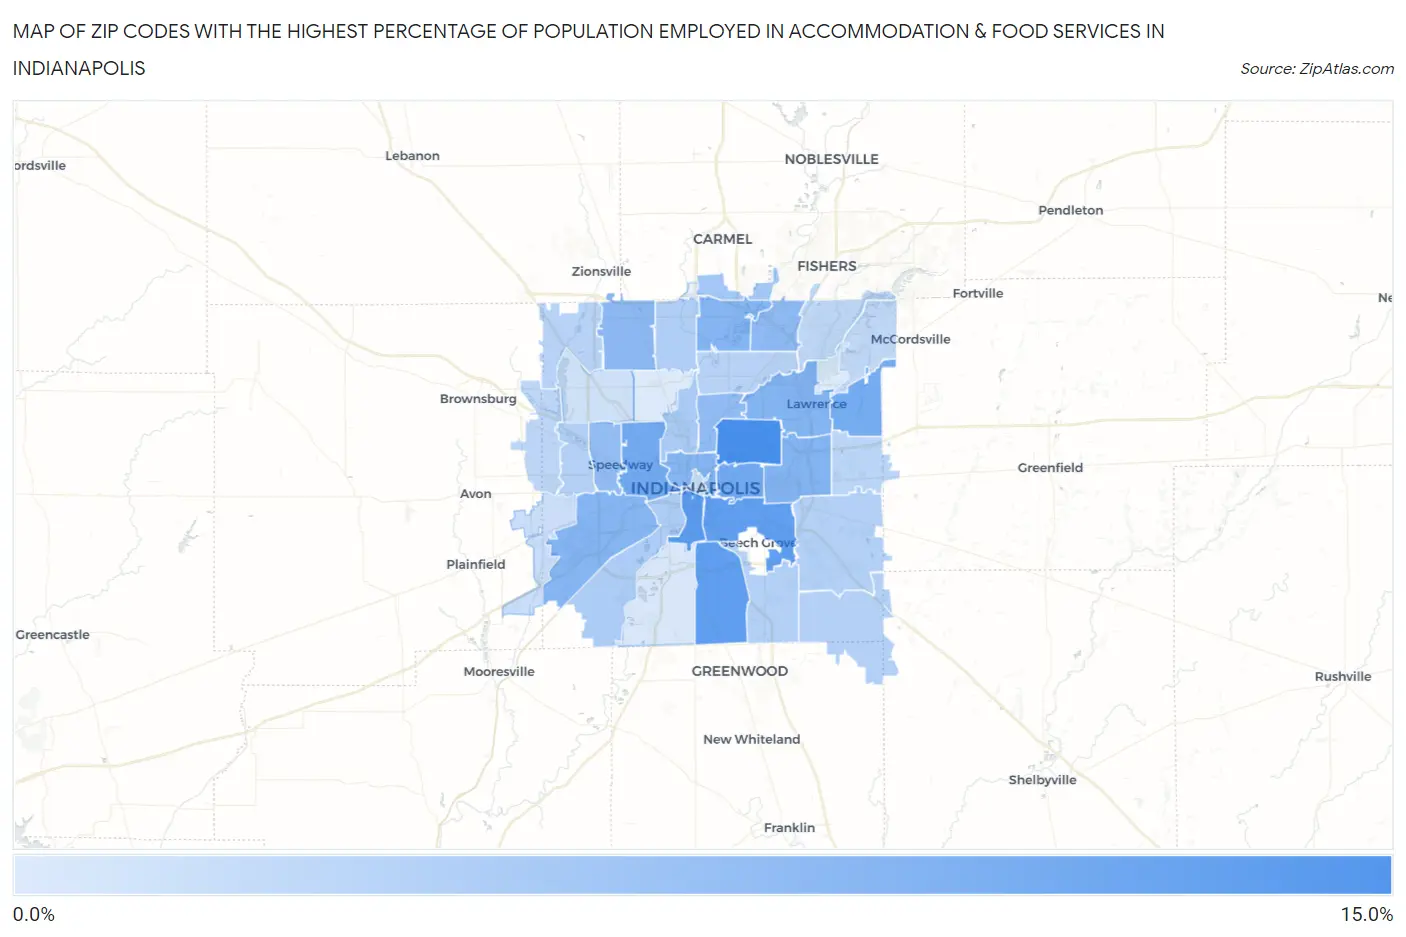
Map of Zip Codes with the Highest Percentage of Population Employed in Accommodation & Food Services in Indianapolis

0.0%
15.0%
Zip Codes with the Highest Percentage of Population Employed in Accommodation & Food Services in Indianapolis Map

Zip Codes with the Highest Percentage of Population Employed in Accommodation & Food Services in Indianapolis, IN

Zip Code % Employed vs State vs National
1.4621812.5%6.4%(+6.06)#456.9%(+5.62)#2,583
2.4622511.2%6.4%(+4.81)#646.9%(+4.36)#3,367
3.4622710.7%6.4%(+4.29)#776.9%(+3.85)#3,778
4.4620310.7%6.4%(+4.24)#786.9%(+3.79)#3,818
5.462229.4%6.4%(+3.01)#1066.9%(+2.57)#5,274
6.462019.4%6.4%(+2.99)#1086.9%(+2.55)#5,308
7.462359.3%6.4%(+2.90)#1126.9%(+2.46)#5,445
8.462198.4%6.4%(+1.91)#1446.9%(+1.47)#7,089
9.462268.3%6.4%(+1.88)#1476.9%(+1.44)#7,164
10.462418.3%6.4%(+1.84)#1496.9%(+1.39)#7,268
11.462028.3%6.4%(+1.83)#1506.9%(+1.39)#7,286
12.462408.2%6.4%(+1.75)#1576.9%(+1.31)#7,425
13.462687.8%6.4%(+1.36)#1776.9%(+0.920)#8,263
14.462507.6%6.4%(+1.17)#1906.9%(+0.730)#8,730
15.462057.5%6.4%(+1.02)#1996.9%(+0.578)#9,085
16.462247.2%6.4%(+0.769)#2156.9%(+0.327)#9,793
17.462806.2%6.4%(-0.272)#2896.9%(-0.715)#12,905
18.462085.7%6.4%(-0.745)#3266.9%(-1.19)#14,417
19.462215.6%6.4%(-0.828)#3306.9%(-1.27)#14,667
20.462605.3%6.4%(-1.11)#3636.9%(-1.55)#15,647
21.462145.2%6.4%(-1.24)#3786.9%(-1.68)#16,100
22.462375.1%6.4%(-1.32)#3906.9%(-1.76)#16,399
23.462395.1%6.4%(-1.34)#3916.9%(-1.78)#16,456
24.462595.1%6.4%(-1.36)#3926.9%(-1.80)#16,551
25.462784.8%6.4%(-1.65)#4246.9%(-2.09)#17,521
26.462204.8%6.4%(-1.68)#4276.9%(-2.12)#17,619
27.462294.7%6.4%(-1.75)#4296.9%(-2.19)#17,843
28.462344.6%6.4%(-1.85)#4386.9%(-2.30)#18,214
29.462564.3%6.4%(-2.10)#4626.9%(-2.54)#19,036
30.462364.3%6.4%(-2.14)#4676.9%(-2.58)#19,172
31.462044.0%6.4%(-2.47)#4936.9%(-2.91)#20,260
32.462313.7%6.4%(-2.78)#5196.9%(-3.22)#21,246
33.462543.4%6.4%(-3.05)#5416.9%(-3.50)#22,130
34.462172.7%6.4%(-3.71)#5946.9%(-4.15)#23,936
35.462162.5%6.4%(-3.97)#6176.9%(-4.41)#24,559
36.462282.4%6.4%(-4.00)#6186.9%(-4.44)#24,626

Common Questions

What are the Top 10 Zip Codes with the Highest Percentage of Population Employed in Accommodation & Food Services in Indianapolis, IN?
Top 10 Zip Codes with the Highest Percentage of Population Employed in Accommodation & Food Services in Indianapolis, IN are:
#1
12.5%
#2
11.2%
#3
10.7%
#4
10.7%
#5
9.4%
#6
9.4%
#7
9.3%
#8
8.4%
#9
8.3%
#10
8.3%
What zip code has the Highest Percentage of Population Employed in Accommodation & Food Services in Indianapolis, IN?
46218 has the Highest Percentage of Population Employed in Accommodation & Food Services in Indianapolis, IN with 12.5%.
What is the Percentage of Population Employed in Accommodation & Food Services in Indianapolis, IN?
Percentage of Population Employed in Accommodation & Food Services in Indianapolis is 6.9%.
What is the Percentage of Population Employed in Accommodation & Food Services in Indiana?
Percentage of Population Employed in Accommodation & Food Services in Indiana is 6.4%.
What is the Percentage of Population Employed in Accommodation & Food Services in the United States?
Percentage of Population Employed in Accommodation & Food Services in the United States is 6.9%.