Arlington, IN Map & Demographics
Arlington Map
Arlington Overview
$30,536
PER CAPITA INCOME
$53,043
AVG FAMILY INCOME
$54,565
AVG HOUSEHOLD INCOME
0.40
INEQUALITY / GINI INDEX
469
TOTAL POPULATION
260
MALE POPULATION
209
FEMALE POPULATION
124.40
MALES / 100 FEMALES
80.38
FEMALES / 100 MALES
39.4
MEDIAN AGE
2.4
AVG FAMILY SIZE
1.9
AVG HOUSEHOLD SIZE
218
LABOR FORCE [ PEOPLE ]
61.8%
PERCENT IN LABOR FORCE
16.5%
UNEMPLOYMENT RATE
Arlington Zip Codes
Arlington Area Codes
Income in Arlington
Income Overview in Arlington
Per Capita Income in Arlington is $30,536, while median incomes of families and households are $53,043 and $54,565 respectively.
| Characteristic | Number | Measure |
| Per Capita Income | 469 | $30,536 |
| Median Family Income | 130 | $53,043 |
| Mean Family Income | 130 | $58,415 |
| Median Household Income | 240 | $54,565 |
| Mean Household Income | 240 | $62,660 |
| Income Deficit | 130 | $0 |
| Wage / Income Gap (%) | 469 | 0.00% |
| Wage / Income Gap ($) | 469 | 100.00¢ per $1 |
| Gini / Inequality Index | 469 | 0.40 |
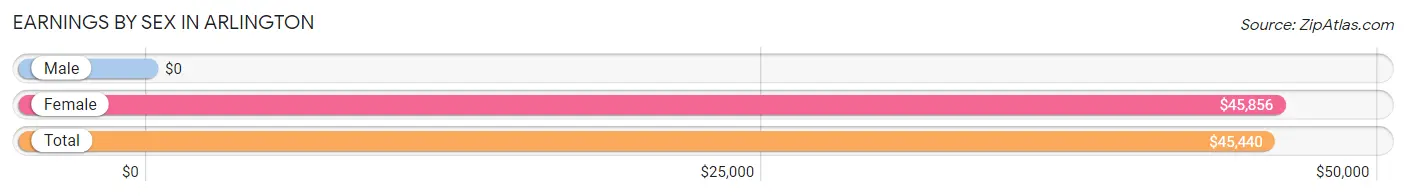
Earnings by Sex in Arlington
| Sex | Number | Average Earnings |
| Male | 138 (60.3%) | $0 |
| Female | 91 (39.7%) | $45,856 |
| Total | 229 (100.0%) | $45,440 |
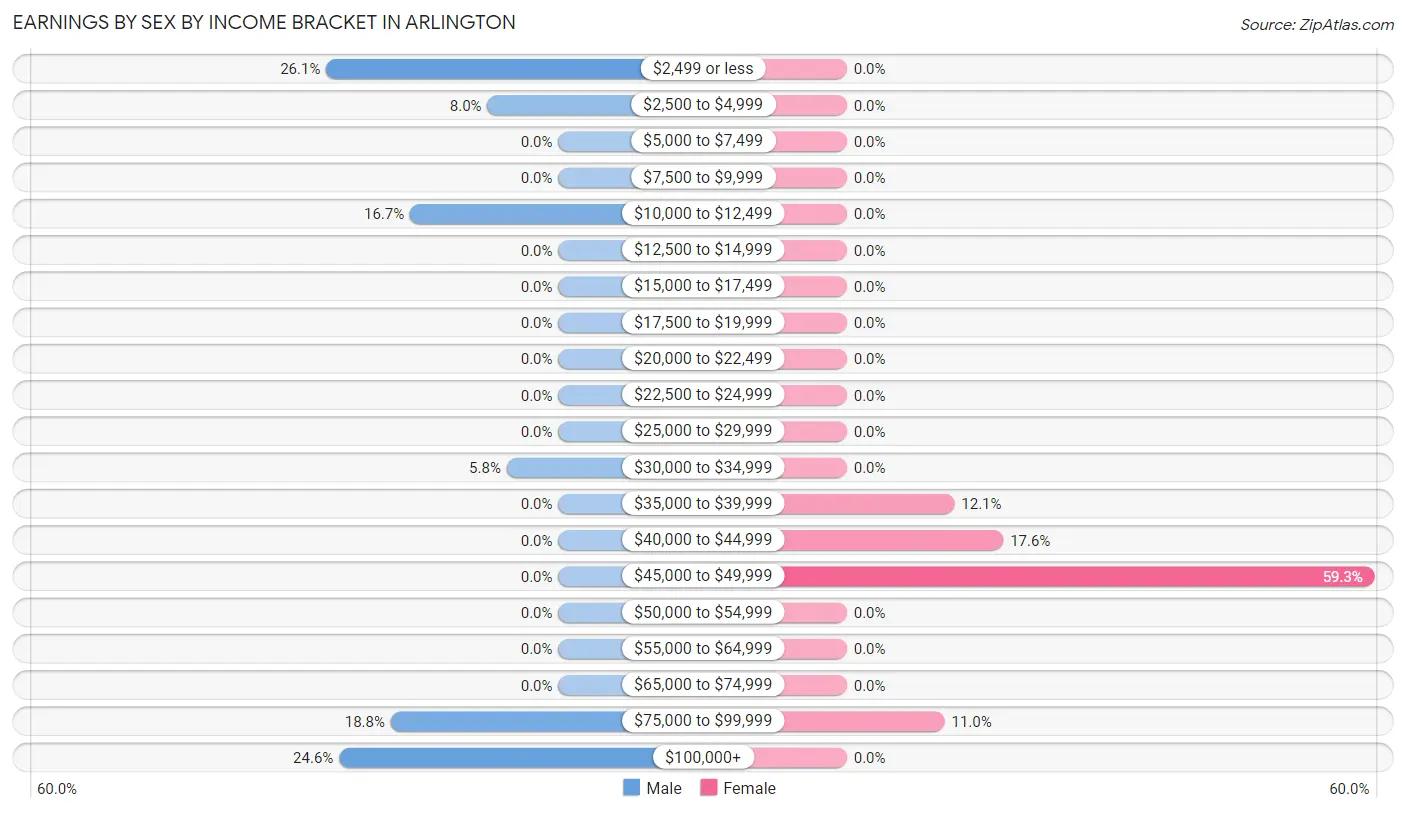
Earnings by Sex by Income Bracket in Arlington
The most common earnings brackets in Arlington are $2,499 or less for men (36 | 26.1%) and $45,000 to $49,999 for women (54 | 59.3%).
| Income | Male | Female |
| $2,499 or less | 36 (26.1%) | 0 (0.0%) |
| $2,500 to $4,999 | 11 (8.0%) | 0 (0.0%) |
| $5,000 to $7,499 | 0 (0.0%) | 0 (0.0%) |
| $7,500 to $9,999 | 0 (0.0%) | 0 (0.0%) |
| $10,000 to $12,499 | 23 (16.7%) | 0 (0.0%) |
| $12,500 to $14,999 | 0 (0.0%) | 0 (0.0%) |
| $15,000 to $17,499 | 0 (0.0%) | 0 (0.0%) |
| $17,500 to $19,999 | 0 (0.0%) | 0 (0.0%) |
| $20,000 to $22,499 | 0 (0.0%) | 0 (0.0%) |
| $22,500 to $24,999 | 0 (0.0%) | 0 (0.0%) |
| $25,000 to $29,999 | 0 (0.0%) | 0 (0.0%) |
| $30,000 to $34,999 | 8 (5.8%) | 0 (0.0%) |
| $35,000 to $39,999 | 0 (0.0%) | 11 (12.1%) |
| $40,000 to $44,999 | 0 (0.0%) | 16 (17.6%) |
| $45,000 to $49,999 | 0 (0.0%) | 54 (59.3%) |
| $50,000 to $54,999 | 0 (0.0%) | 0 (0.0%) |
| $55,000 to $64,999 | 0 (0.0%) | 0 (0.0%) |
| $65,000 to $74,999 | 0 (0.0%) | 0 (0.0%) |
| $75,000 to $99,999 | 26 (18.8%) | 10 (11.0%) |
| $100,000+ | 34 (24.6%) | 0 (0.0%) |
| Total | 138 (100.0%) | 91 (100.0%) |
Earnings by Sex by Educational Attainment in Arlington
| Educational Attainment | Male Income | Female Income |
| Less than High School | - | - |
| High School Diploma | - | - |
| College or Associate's Degree | - | - |
| Bachelor's Degree | - | - |
| Graduate Degree | - | - |
| Total | - | - |
Family Income in Arlington
Family Income Brackets in Arlington
According to the Arlington family income data, there are 54 families falling into the $35,000 to $49,999 income range, which is the most common income bracket and makes up 41.5% of all families.
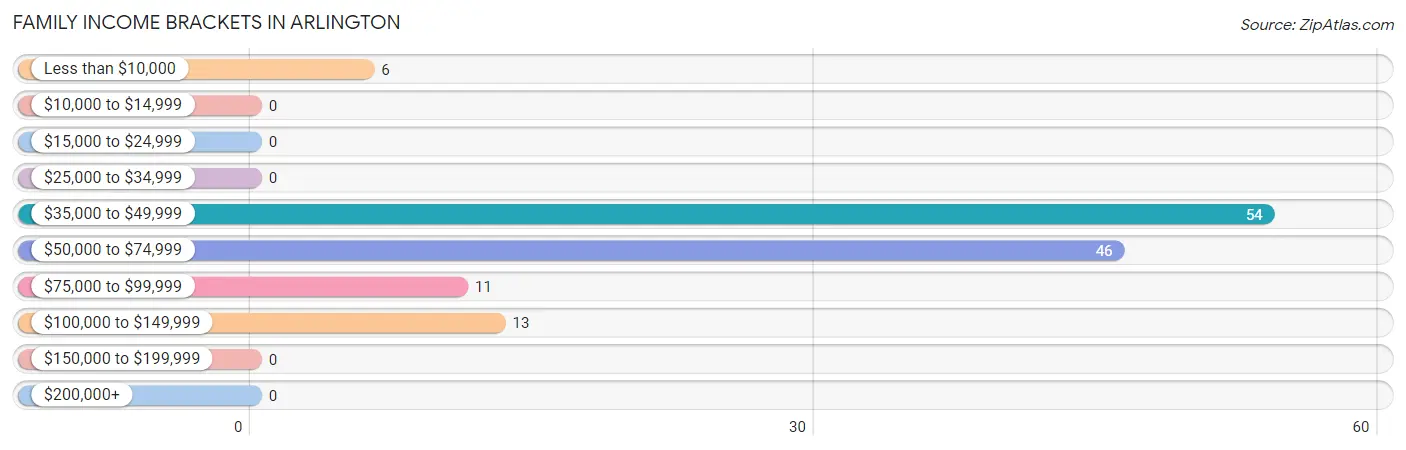
| Income Bracket | # Families | % Families |
| Less than $10,000 | 6 | 4.6% |
| $10,000 to $14,999 | 0 | 0.0% |
| $15,000 to $24,999 | 0 | 0.0% |
| $25,000 to $34,999 | 0 | 0.0% |
| $35,000 to $49,999 | 54 | 41.5% |
| $50,000 to $74,999 | 46 | 35.4% |
| $75,000 to $99,999 | 11 | 8.5% |
| $100,000 to $149,999 | 13 | 10.0% |
| $150,000 to $199,999 | 0 | 0.0% |
| $200,000+ | 0 | 0.0% |
Family Income by Famaliy Size in Arlington
2-person families (80 | 61.5%) account for the highest median family income in Arlington with $55,761 per family, while 2-person families (80 | 61.5%) have the highest median income of $27,880 per family member.
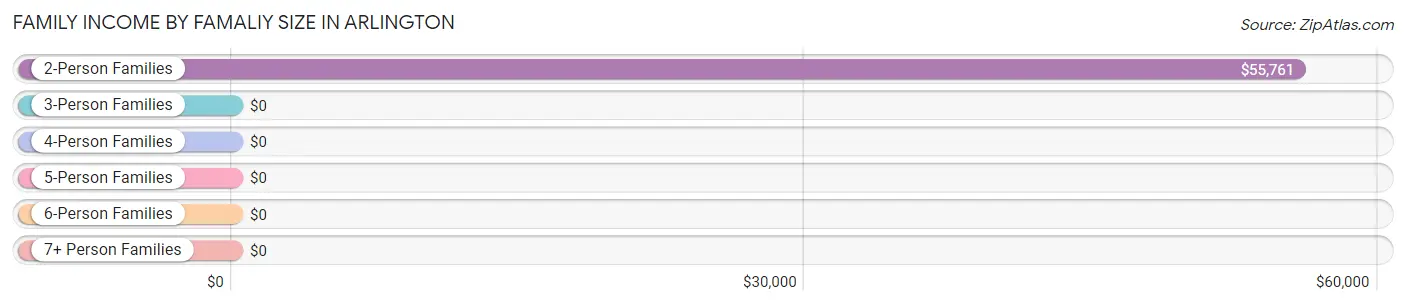
| Income Bracket | # Families | Median Income |
| 2-Person Families | 80 (61.5%) | $55,761 |
| 3-Person Families | 23 (17.7%) | $0 |
| 4-Person Families | 27 (20.8%) | $0 |
| 5-Person Families | 0 (0.0%) | $0 |
| 6-Person Families | 0 (0.0%) | $0 |
| 7+ Person Families | 0 (0.0%) | $0 |
| Total | 130 (100.0%) | $53,043 |
Family Income by Number of Earners in Arlington
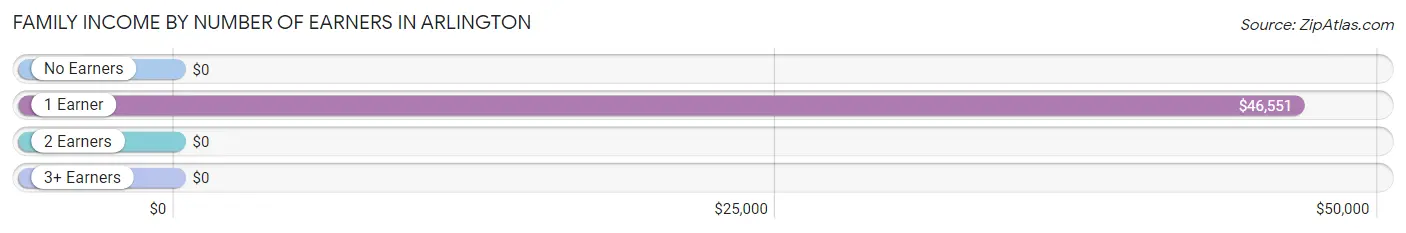
| Number of Earners | # Families | Median Income |
| No Earners | 29 (22.3%) | $0 |
| 1 Earner | 67 (51.5%) | $46,551 |
| 2 Earners | 34 (26.2%) | $0 |
| 3+ Earners | 0 (0.0%) | $0 |
| Total | 130 (100.0%) | $53,043 |
Household Income in Arlington
Household Income Brackets in Arlington
With 74 households falling in the category, the $100,000 to $149,999 income range is the most frequent in Arlington, accounting for 30.8% of all households.
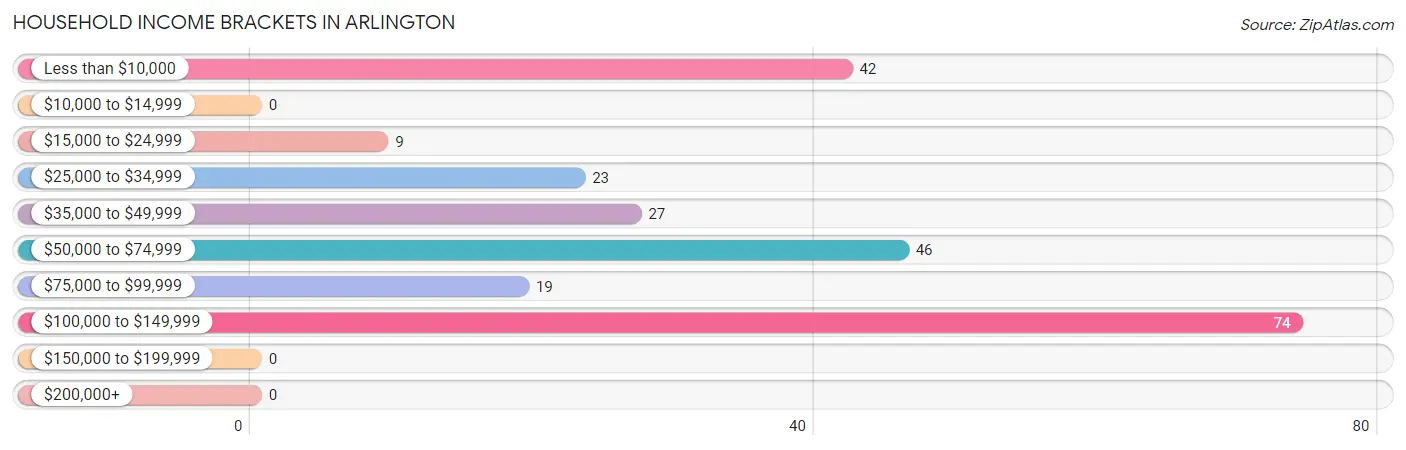
| Income Bracket | # Households | % Households |
| Less than $10,000 | 42 | 17.5% |
| $10,000 to $14,999 | 0 | 0.0% |
| $15,000 to $24,999 | 9 | 3.8% |
| $25,000 to $34,999 | 23 | 9.6% |
| $35,000 to $49,999 | 27 | 11.3% |
| $50,000 to $74,999 | 46 | 19.2% |
| $75,000 to $99,999 | 19 | 7.9% |
| $100,000 to $149,999 | 74 | 30.8% |
| $150,000 to $199,999 | 0 | 0.0% |
| $200,000+ | 0 | 0.0% |
Household Income by Householder Age in Arlington
The median household income in Arlington is $54,565, with the highest median household income of $107,831 found in the 45 to 64 years age bracket for the primary householder. A total of 59 households (24.6%) fall into this category. Meanwhile, the 15 to 24 years age bracket for the primary householder has the lowest median household income of $0, with 6 households (2.5%) in this group.
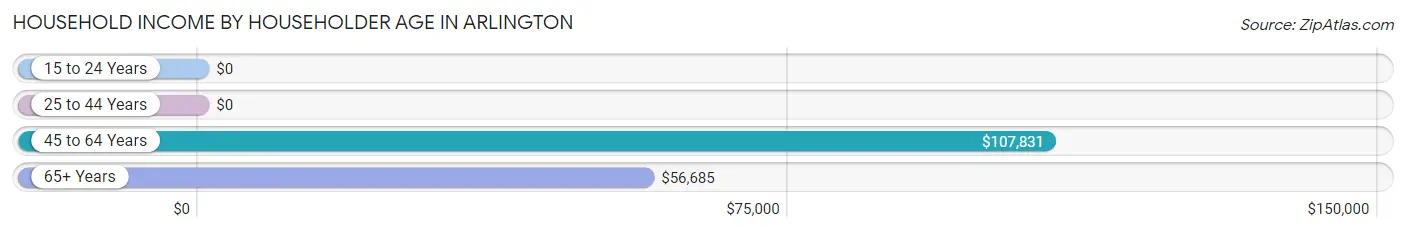
| Income Bracket | # Households | Median Income |
| 15 to 24 Years | 6 (2.5%) | $0 |
| 25 to 44 Years | 96 (40.0%) | $0 |
| 45 to 64 Years | 59 (24.6%) | $107,831 |
| 65+ Years | 79 (32.9%) | $56,685 |
| Total | 240 (100.0%) | $54,565 |
Poverty in Arlington
Income Below Poverty by Sex and Age in Arlington
With 24.2% poverty level for males and 2.9% for females among the residents of Arlington, 35 to 44 year old males and 25 to 34 year old females are the most vulnerable to poverty, with 55 males (100.0%) and 6 females (18.2%) in their respective age groups living below the poverty level.
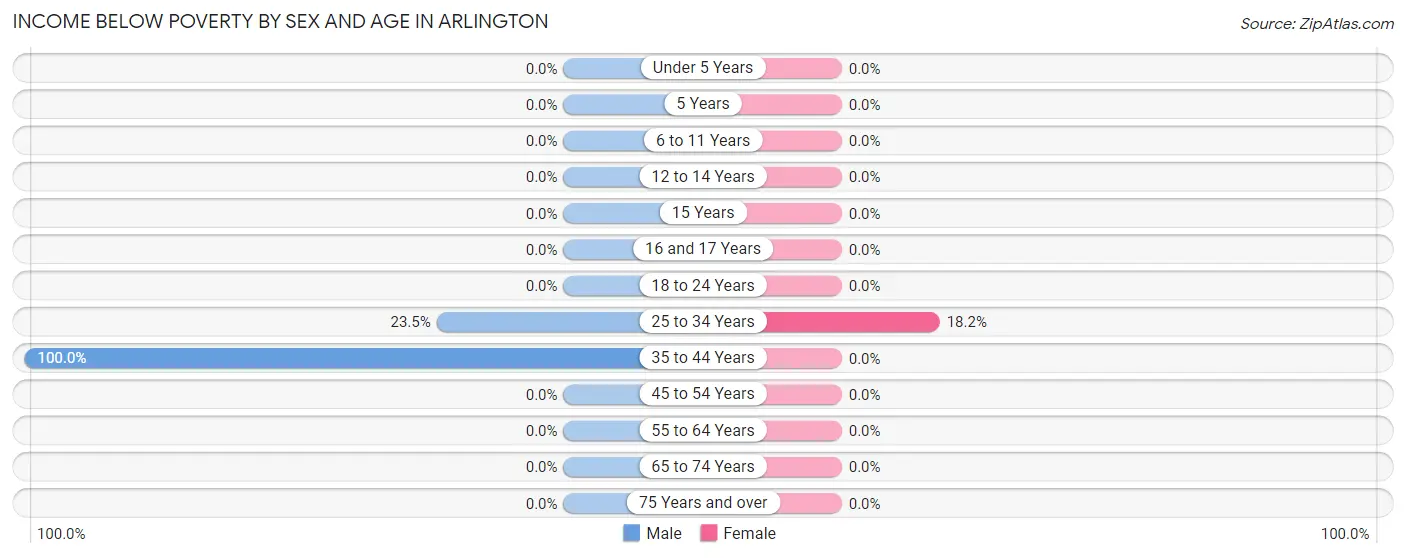
| Age Bracket | Male | Female |
| Under 5 Years | 0 (0.0%) | 0 (0.0%) |
| 5 Years | 0 (0.0%) | 0 (0.0%) |
| 6 to 11 Years | 0 (0.0%) | 0 (0.0%) |
| 12 to 14 Years | 0 (0.0%) | 0 (0.0%) |
| 15 Years | 0 (0.0%) | 0 (0.0%) |
| 16 and 17 Years | 0 (0.0%) | 0 (0.0%) |
| 18 to 24 Years | 0 (0.0%) | 0 (0.0%) |
| 25 to 34 Years | 8 (23.5%) | 6 (18.2%) |
| 35 to 44 Years | 55 (100.0%) | 0 (0.0%) |
| 45 to 54 Years | 0 (0.0%) | 0 (0.0%) |
| 55 to 64 Years | 0 (0.0%) | 0 (0.0%) |
| 65 to 74 Years | 0 (0.0%) | 0 (0.0%) |
| 75 Years and over | 0 (0.0%) | 0 (0.0%) |
| Total | 63 (24.2%) | 6 (2.9%) |
Income Above Poverty by Sex and Age in Arlington
According to the poverty statistics in Arlington, males aged 6 to 11 years and females aged under 5 years are the age groups that are most secure financially, with 100.0% of males and 100.0% of females in these age groups living above the poverty line.
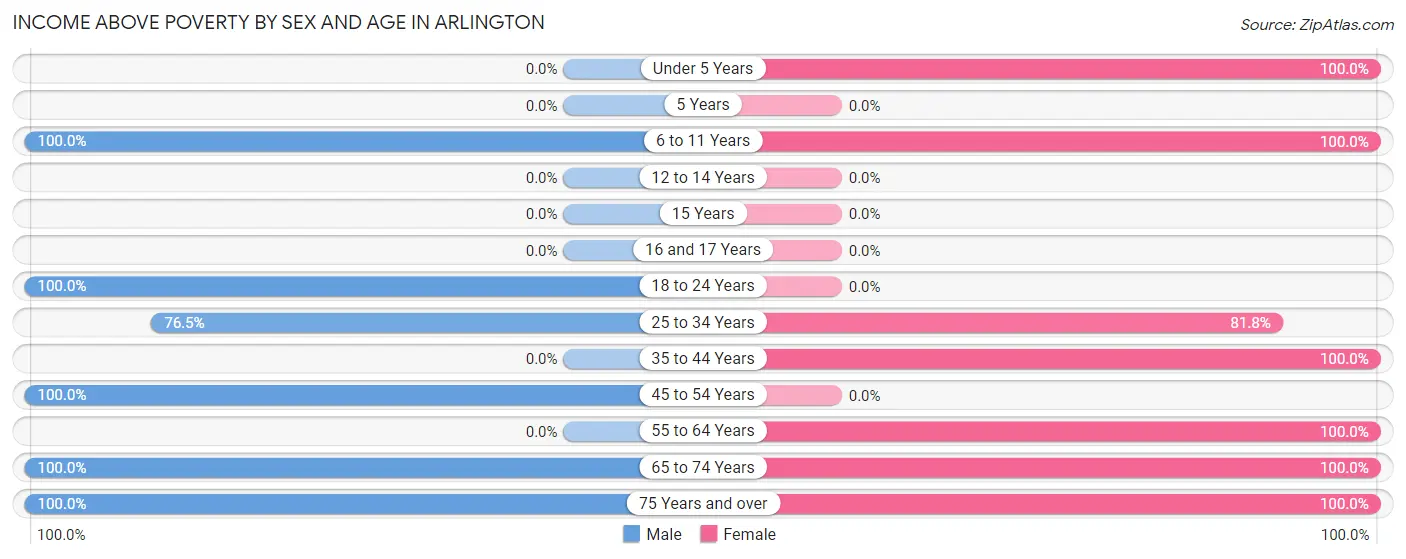
| Age Bracket | Male | Female |
| Under 5 Years | 0 (0.0%) | 35 (100.0%) |
| 5 Years | 0 (0.0%) | 0 (0.0%) |
| 6 to 11 Years | 50 (100.0%) | 31 (100.0%) |
| 12 to 14 Years | 0 (0.0%) | 0 (0.0%) |
| 15 Years | 0 (0.0%) | 0 (0.0%) |
| 16 and 17 Years | 0 (0.0%) | 0 (0.0%) |
| 18 to 24 Years | 6 (100.0%) | 0 (0.0%) |
| 25 to 34 Years | 26 (76.5%) | 27 (81.8%) |
| 35 to 44 Years | 0 (0.0%) | 43 (100.0%) |
| 45 to 54 Years | 59 (100.0%) | 0 (0.0%) |
| 55 to 64 Years | 0 (0.0%) | 21 (100.0%) |
| 65 to 74 Years | 43 (100.0%) | 23 (100.0%) |
| 75 Years and over | 13 (100.0%) | 23 (100.0%) |
| Total | 197 (75.8%) | 203 (97.1%) |
Income Below Poverty Among Married-Couple Families in Arlington
The poverty statistics for married-couple families in Arlington show that 7.9% or 6 of the total 76 families live below the poverty line. Families with no children have the highest poverty rate of 11.3%, comprising of 6 families. On the other hand, families with 1 or 2 children have the lowest poverty rate of 0.0%, which includes 0 families.
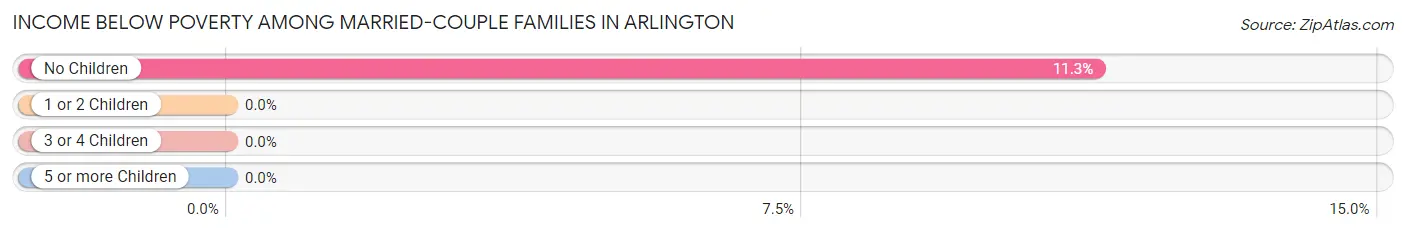
| Children | Above Poverty | Below Poverty |
| No Children | 47 (88.7%) | 6 (11.3%) |
| 1 or 2 Children | 23 (100.0%) | 0 (0.0%) |
| 3 or 4 Children | 0 (0.0%) | 0 (0.0%) |
| 5 or more Children | 0 (0.0%) | 0 (0.0%) |
| Total | 70 (92.1%) | 6 (7.9%) |
Income Below Poverty Among Single-Parent Households in Arlington
| Children | Single Father | Single Mother |
| No Children | 0 (0.0%) | 0 (0.0%) |
| 1 or 2 Children | 0 (0.0%) | 0 (0.0%) |
| 3 or 4 Children | 0 (0.0%) | 0 (0.0%) |
| 5 or more Children | 0 (0.0%) | 0 (0.0%) |
| Total | 0 (0.0%) | 0 (0.0%) |
Income Below Poverty Among Married-Couple vs Single-Parent Households in Arlington
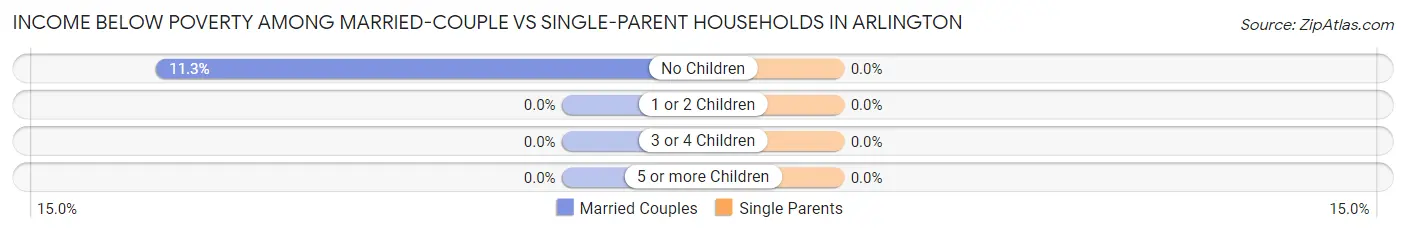
| Children | Married-Couple Families | Single-Parent Households |
| No Children | 6 (11.3%) | 0 (0.0%) |
| 1 or 2 Children | 0 (0.0%) | 0 (0.0%) |
| 3 or 4 Children | 0 (0.0%) | 0 (0.0%) |
| 5 or more Children | 0 (0.0%) | 0 (0.0%) |
| Total | 6 (7.9%) | 0 (0.0%) |
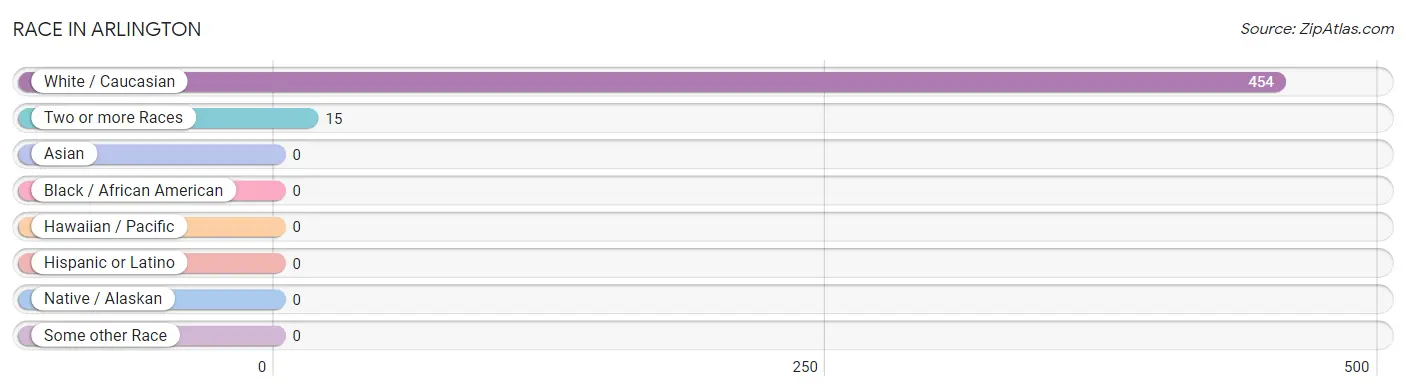
Race in Arlington
The most populous races in Arlington are White / Caucasian (454 | 96.8%), and Two or more Races (15 | 3.2%).
| Race | # Population | % Population |
| Asian | 0 | 0.0% |
| Black / African American | 0 | 0.0% |
| Hawaiian / Pacific | 0 | 0.0% |
| Hispanic or Latino | 0 | 0.0% |
| Native / Alaskan | 0 | 0.0% |
| White / Caucasian | 454 | 96.8% |
| Two or more Races | 15 | 3.2% |
| Some other Race | 0 | 0.0% |
| Total | 469 | 100.0% |
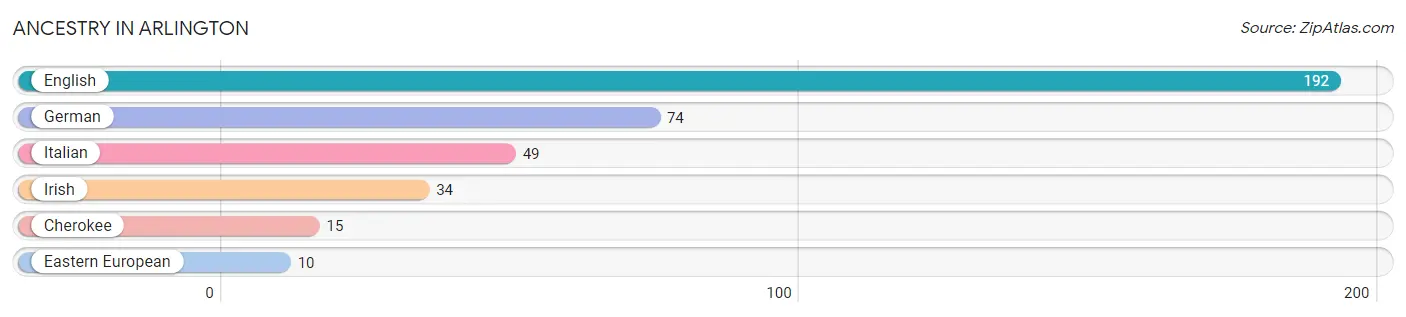
Ancestry in Arlington
The most populous ancestries reported in Arlington are English (192 | 40.9%), German (74 | 15.8%), Italian (49 | 10.4%), Irish (34 | 7.2%), and Cherokee (15 | 3.2%), together accounting for 77.6% of all Arlington residents.
| Ancestry | # Population | % Population |
| Cherokee | 15 | 3.2% |
| Eastern European | 10 | 2.1% |
| English | 192 | 40.9% |
| German | 74 | 15.8% |
| Irish | 34 | 7.2% |
| Italian | 49 | 10.4% | View All 6 Rows |
Immigrants in Arlington

| Immigration Origin | # Population | % Population | View All 0 Rows |
Sex and Age in Arlington
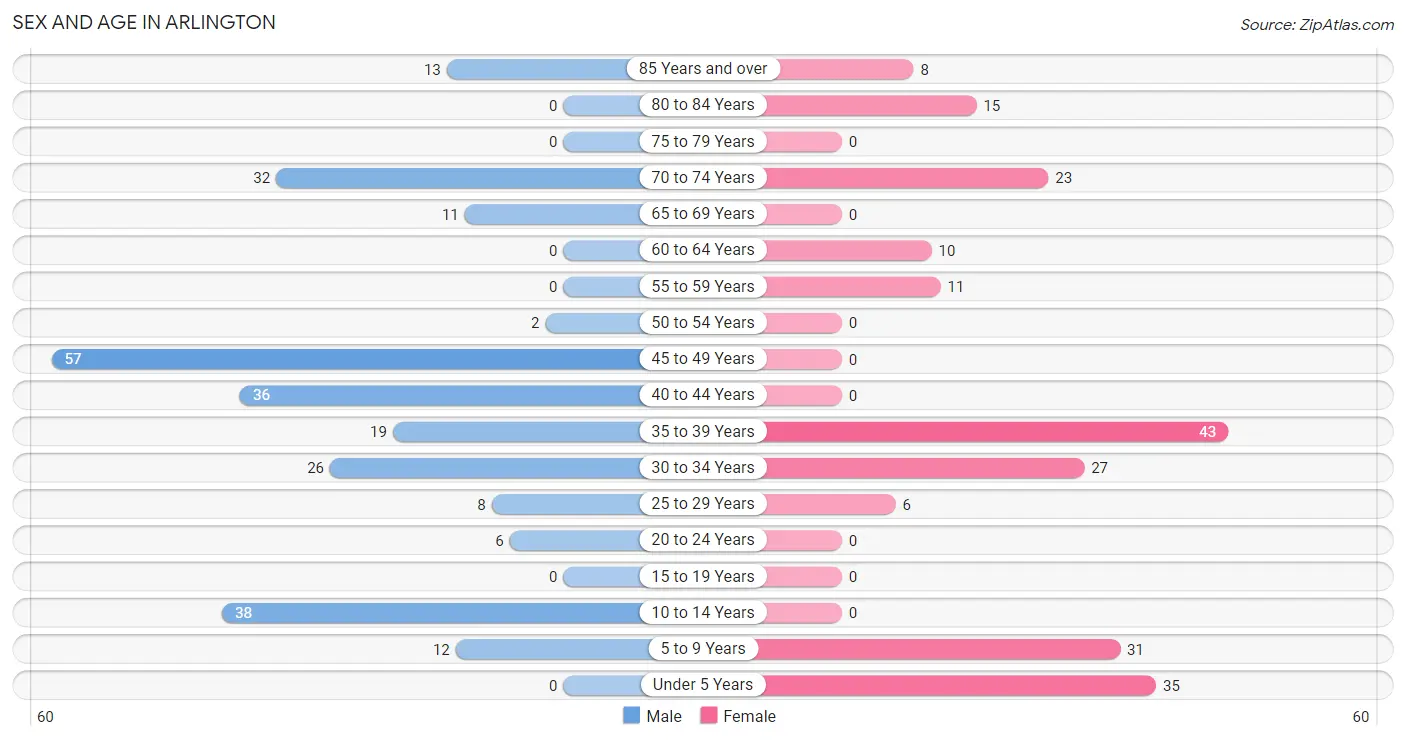
Sex and Age in Arlington
The most populous age groups in Arlington are 45 to 49 Years (57 | 21.9%) for men and 35 to 39 Years (43 | 20.6%) for women.
| Age Bracket | Male | Female |
| Under 5 Years | 0 (0.0%) | 35 (16.8%) |
| 5 to 9 Years | 12 (4.6%) | 31 (14.8%) |
| 10 to 14 Years | 38 (14.6%) | 0 (0.0%) |
| 15 to 19 Years | 0 (0.0%) | 0 (0.0%) |
| 20 to 24 Years | 6 (2.3%) | 0 (0.0%) |
| 25 to 29 Years | 8 (3.1%) | 6 (2.9%) |
| 30 to 34 Years | 26 (10.0%) | 27 (12.9%) |
| 35 to 39 Years | 19 (7.3%) | 43 (20.6%) |
| 40 to 44 Years | 36 (13.9%) | 0 (0.0%) |
| 45 to 49 Years | 57 (21.9%) | 0 (0.0%) |
| 50 to 54 Years | 2 (0.8%) | 0 (0.0%) |
| 55 to 59 Years | 0 (0.0%) | 11 (5.3%) |
| 60 to 64 Years | 0 (0.0%) | 10 (4.8%) |
| 65 to 69 Years | 11 (4.2%) | 0 (0.0%) |
| 70 to 74 Years | 32 (12.3%) | 23 (11.0%) |
| 75 to 79 Years | 0 (0.0%) | 0 (0.0%) |
| 80 to 84 Years | 0 (0.0%) | 15 (7.2%) |
| 85 Years and over | 13 (5.0%) | 8 (3.8%) |
| Total | 260 (100.0%) | 209 (100.0%) |
Families and Households in Arlington
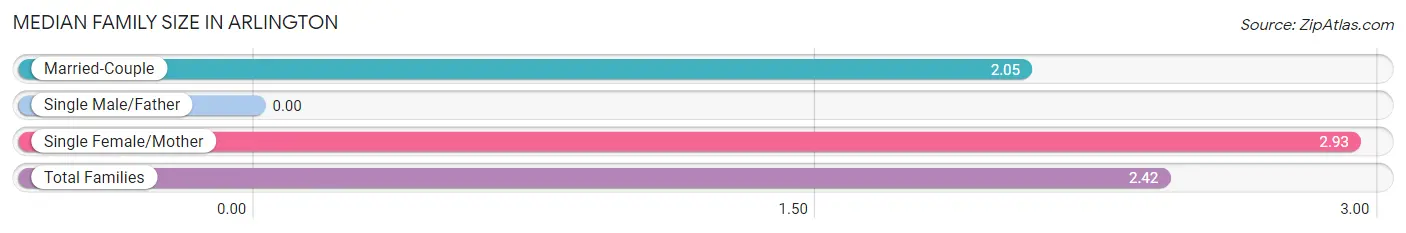
Median Family Size in Arlington
| Family Type | # Families | Family Size |
| Married-Couple | 76 (58.5%) | 2.05 |
| Single Male/Father | 0 (0.0%) | - |
| Single Female/Mother | 54 (41.5%) | 2.93 |
| Total Families | 130 (100.0%) | 2.42 |
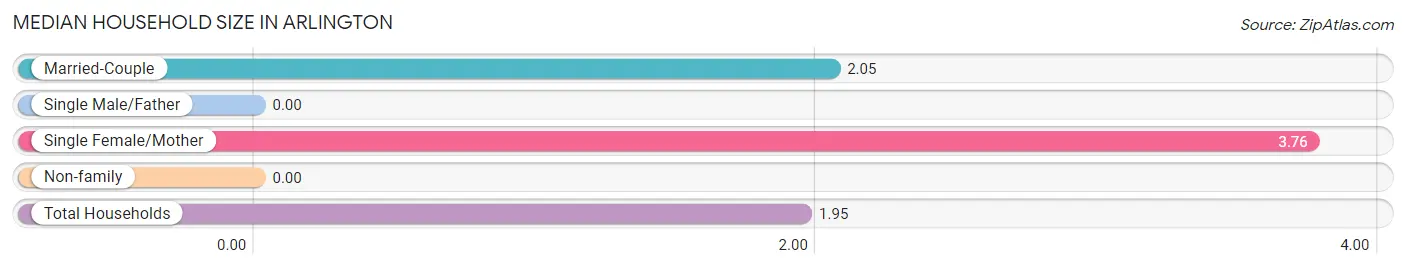
Median Household Size in Arlington
| Household Type | # Households | Household Size |
| Married-Couple | 76 (31.7%) | 2.05 |
| Single Male/Father | 0 (0.0%) | - |
| Single Female/Mother | 54 (22.5%) | 3.76 |
| Non-family | 110 (45.8%) | - |
| Total Households | 240 (100.0%) | 1.95 |
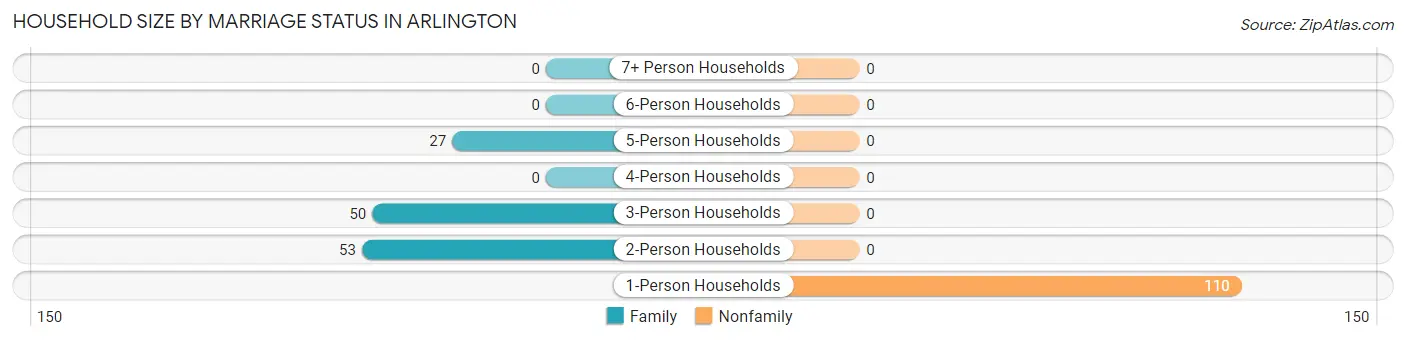
Household Size by Marriage Status in Arlington
Out of a total of 240 households in Arlington, 130 (54.2%) are family households, while 110 (45.8%) are nonfamily households. The most numerous type of family households are 2-person households, comprising 53, and the most common type of nonfamily households are 1-person households, comprising 110.
| Household Size | Family Households | Nonfamily Households |
| 1-Person Households | - | 110 (45.8%) |
| 2-Person Households | 53 (22.1%) | 0 (0.0%) |
| 3-Person Households | 50 (20.8%) | 0 (0.0%) |
| 4-Person Households | 0 (0.0%) | 0 (0.0%) |
| 5-Person Households | 27 (11.3%) | 0 (0.0%) |
| 6-Person Households | 0 (0.0%) | 0 (0.0%) |
| 7+ Person Households | 0 (0.0%) | 0 (0.0%) |
| Total | 130 (54.2%) | 110 (45.8%) |
Female Fertility in Arlington
Fertility by Age in Arlington
| Age Bracket | Women with Births | Births / 1,000 Women |
| 15 to 19 years | 0 (0.0%) | 0.0 |
| 20 to 34 years | 0 (0.0%) | 0.0 |
| 35 to 50 years | 0 (0.0%) | 0.0 |
| Total | 0 (0.0%) | 0.0 |
Fertility by Age by Marriage Status in Arlington
| Age Bracket | Married | Unmarried |
| 15 to 19 years | 0 (0.0%) | 0 (0.0%) |
| 20 to 34 years | 0 (0.0%) | 0 (0.0%) |
| 35 to 50 years | 0 (0.0%) | 0 (0.0%) |
| Total | 0 (0.0%) | 0 (0.0%) |
Fertility by Education in Arlington
| Educational Attainment | Women with Births | Births / 1,000 Women |
| Less than High School | 0 (0.0%) | 0.0 |
| High School Diploma | 0 (0.0%) | 0.0 |
| College or Associate's Degree | 0 (0.0%) | 0.0 |
| Bachelor's Degree | 0 (0.0%) | 0.0 |
| Graduate Degree | 0 (0.0%) | 0.0 |
| Total | 0 (0.0%) | 0.0 |
Fertility by Education by Marriage Status in Arlington
| Educational Attainment | Married | Unmarried |
| Less than High School | 0 (0.0%) | 0 (0.0%) |
| High School Diploma | 0 (0.0%) | 0 (0.0%) |
| College or Associate's Degree | 0 (0.0%) | 0 (0.0%) |
| Bachelor's Degree | 0 (0.0%) | 0 (0.0%) |
| Graduate Degree | 0 (0.0%) | 0 (0.0%) |
| Total | 0 (0.0%) | 0 (0.0%) |
Employment Characteristics in Arlington
Employment by Class of Employer in Arlington
Among the 182 employed individuals in Arlington, private company employees (144 | 79.1%), not-for-profit organizations (27 | 14.8%), and local government employees (11 | 6.0%) make up the most common classes of employment.
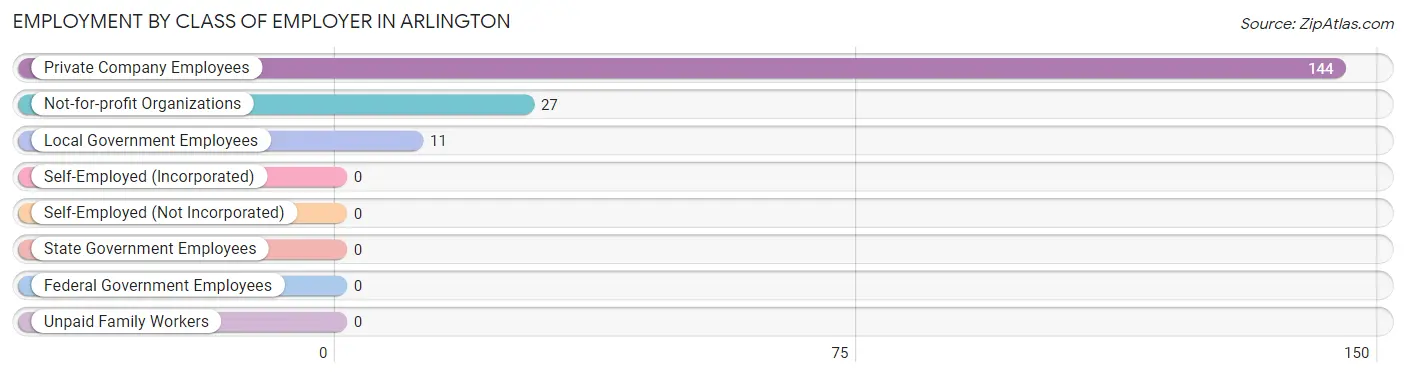
| Employer Class | # Employees | % Employees |
| Private Company Employees | 144 | 79.1% |
| Self-Employed (Incorporated) | 0 | 0.0% |
| Self-Employed (Not Incorporated) | 0 | 0.0% |
| Not-for-profit Organizations | 27 | 14.8% |
| Local Government Employees | 11 | 6.0% |
| State Government Employees | 0 | 0.0% |
| Federal Government Employees | 0 | 0.0% |
| Unpaid Family Workers | 0 | 0.0% |
| Total | 182 | 100.0% |
Employment Status by Age in Arlington
According to the labor force statistics for Arlington, out of the total population over 16 years of age (353), 61.8% or 218 individuals are in the labor force, with 16.5% or 36 of them unemployed. The age group with the highest labor force participation rate is 20 to 24 years, with 100.0% or 6 individuals in the labor force. Within the labor force, the 35 to 44 years age range has the highest percentage of unemployed individuals, with 45.6% or 36 of them being unemployed.
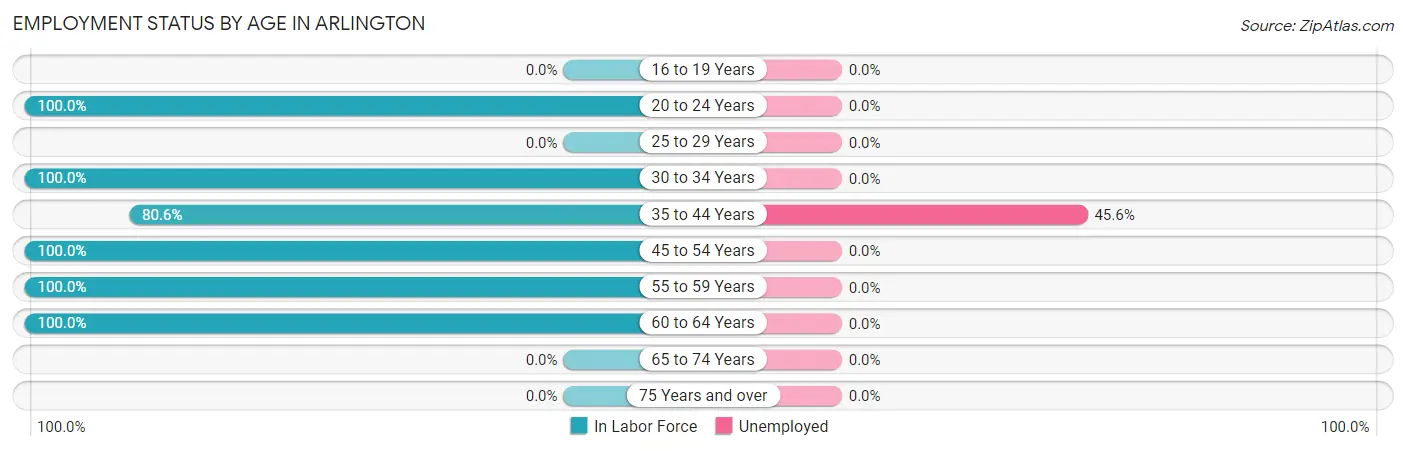
| Age Bracket | In Labor Force | Unemployed |
| 16 to 19 Years | 0 (0.0%) | 0 (0.0%) |
| 20 to 24 Years | 6 (100.0%) | 0 (0.0%) |
| 25 to 29 Years | 0 (0.0%) | 0 (0.0%) |
| 30 to 34 Years | 53 (100.0%) | 0 (0.0%) |
| 35 to 44 Years | 79 (80.6%) | 36 (45.6%) |
| 45 to 54 Years | 59 (100.0%) | 0 (0.0%) |
| 55 to 59 Years | 11 (100.0%) | 0 (0.0%) |
| 60 to 64 Years | 10 (100.0%) | 0 (0.0%) |
| 65 to 74 Years | 0 (0.0%) | 0 (0.0%) |
| 75 Years and over | 0 (0.0%) | 0 (0.0%) |
| Total | 218 (61.8%) | 36 (16.5%) |
Employment Status by Educational Attainment in Arlington
According to labor force statistics for Arlington, 86.5% of individuals (212) out of the total population between 25 and 64 years of age (245) are in the labor force, with 17.0% or 36 of them being unemployed. The group with the highest labor force participation rate are those with the educational attainment of college / associate degree, with 100.0% or 79 individuals in the labor force. Within the labor force, individuals with high school diploma education have the highest percentage of unemployment, with 33.6% or 36 of them being unemployed.
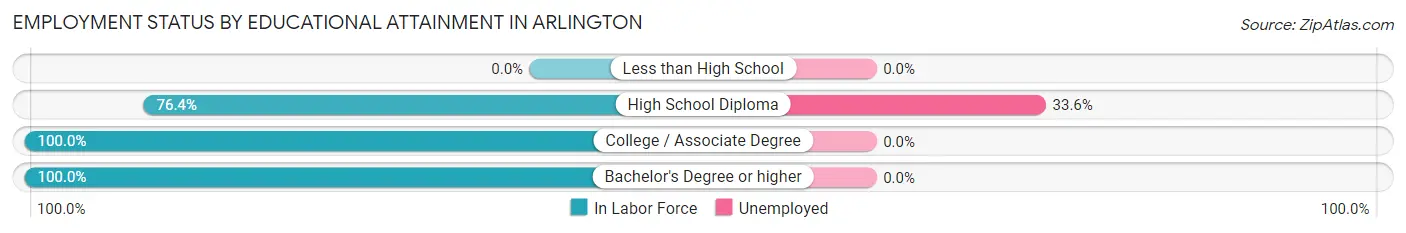
| Educational Attainment | In Labor Force | Unemployed |
| Less than High School | 0 (0.0%) | 0 (0.0%) |
| High School Diploma | 107 (76.4%) | 47 (33.6%) |
| College / Associate Degree | 79 (100.0%) | 0 (0.0%) |
| Bachelor's Degree or higher | 26 (100.0%) | 0 (0.0%) |
| Total | 212 (86.5%) | 42 (17.0%) |
Employment Occupations by Sex in Arlington
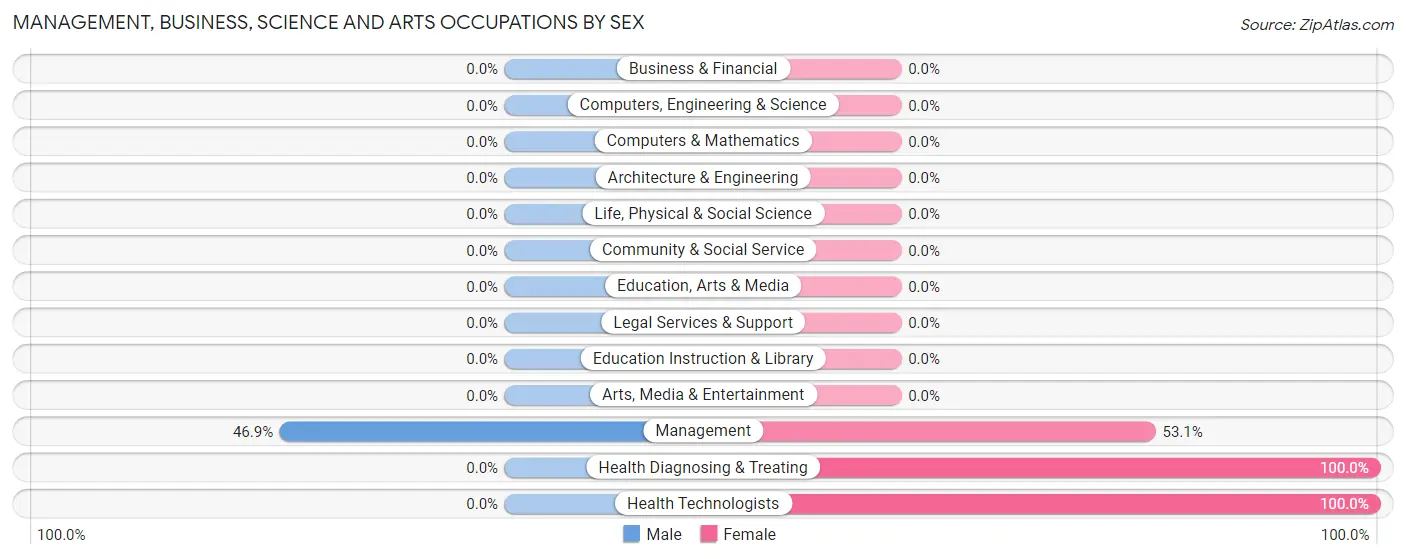
Management, Business, Science and Arts Occupations
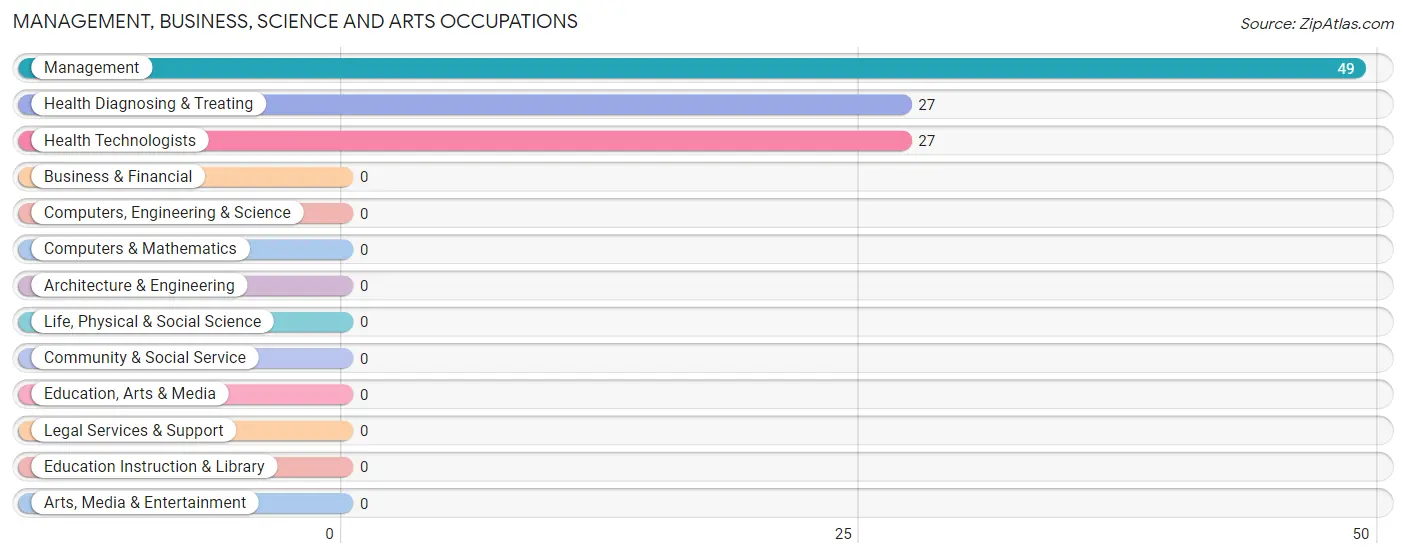
The most common Management, Business, Science and Arts occupations in Arlington are Management (49 | 26.9%), Health Diagnosing & Treating (27 | 14.8%), and Health Technologists (27 | 14.8%).
Management, Business, Science and Arts Occupations by Sex
| Occupation | Male | Female |
| Management | 23 (46.9%) | 26 (53.1%) |
| Business & Financial | 0 (0.0%) | 0 (0.0%) |
| Computers, Engineering & Science | 0 (0.0%) | 0 (0.0%) |
| Computers & Mathematics | 0 (0.0%) | 0 (0.0%) |
| Architecture & Engineering | 0 (0.0%) | 0 (0.0%) |
| Life, Physical & Social Science | 0 (0.0%) | 0 (0.0%) |
| Community & Social Service | 0 (0.0%) | 0 (0.0%) |
| Education, Arts & Media | 0 (0.0%) | 0 (0.0%) |
| Legal Services & Support | 0 (0.0%) | 0 (0.0%) |
| Education Instruction & Library | 0 (0.0%) | 0 (0.0%) |
| Arts, Media & Entertainment | 0 (0.0%) | 0 (0.0%) |
| Health Diagnosing & Treating | 0 (0.0%) | 27 (100.0%) |
| Health Technologists | 0 (0.0%) | 27 (100.0%) |
| Total (Category) | 23 (30.3%) | 53 (69.7%) |
| Total (Overall) | 91 (50.0%) | 91 (50.0%) |
Services Occupations
Services Occupations by Sex
| Occupation | Male | Female |
| Healthcare Support | 0 (0.0%) | 0 (0.0%) |
| Security & Protection | 0 (0.0%) | 0 (0.0%) |
| Firefighting & Prevention | 0 (0.0%) | 0 (0.0%) |
| Law Enforcement | 0 (0.0%) | 0 (0.0%) |
| Food Preparation & Serving | 0 (0.0%) | 0 (0.0%) |
| Cleaning & Maintenance | 0 (0.0%) | 0 (0.0%) |
| Personal Care & Service | 0 (0.0%) | 0 (0.0%) |
| Total (Category) | 0 (0.0%) | 0 (0.0%) |
| Total (Overall) | 91 (50.0%) | 91 (50.0%) |
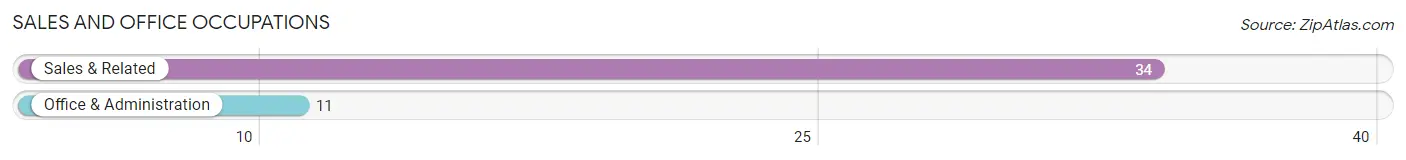
Sales and Office Occupations
The most common Sales and Office occupations in Arlington are Sales & Related (34 | 18.7%), and Office & Administration (11 | 6.0%).
Sales and Office Occupations by Sex

| Occupation | Male | Female |
| Sales & Related | 34 (100.0%) | 0 (0.0%) |
| Office & Administration | 0 (0.0%) | 11 (100.0%) |
| Total (Category) | 34 (75.6%) | 11 (24.4%) |
| Total (Overall) | 91 (50.0%) | 91 (50.0%) |
Natural Resources, Construction and Maintenance Occupations
The most common Natural Resources, Construction and Maintenance occupations in Arlington are , and Construction & Extraction (6 | 3.3%).
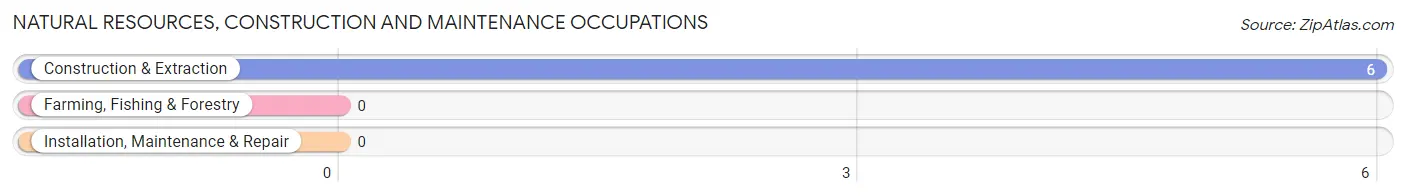
Natural Resources, Construction and Maintenance Occupations by Sex
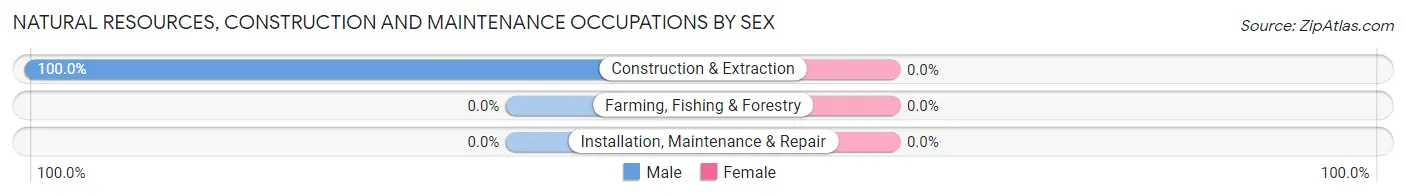
| Occupation | Male | Female |
| Farming, Fishing & Forestry | 0 (0.0%) | 0 (0.0%) |
| Construction & Extraction | 6 (100.0%) | 0 (0.0%) |
| Installation, Maintenance & Repair | 0 (0.0%) | 0 (0.0%) |
| Total (Category) | 6 (100.0%) | 0 (0.0%) |
| Total (Overall) | 91 (50.0%) | 91 (50.0%) |
Production, Transportation and Moving Occupations
The most common Production, Transportation and Moving occupations in Arlington are Transportation (28 | 15.4%), and Material Moving (27 | 14.8%).
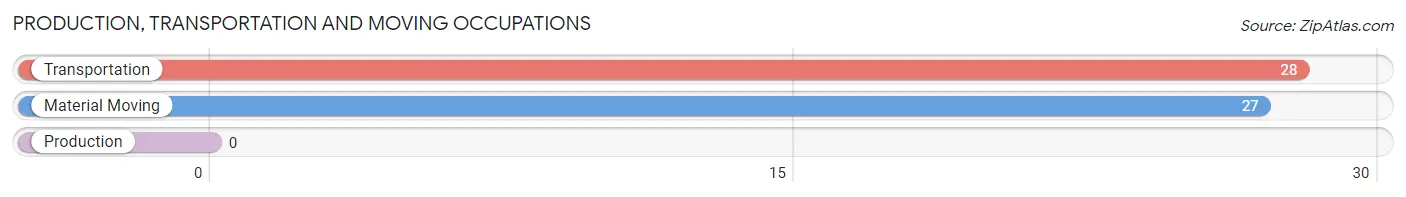
Production, Transportation and Moving Occupations by Sex
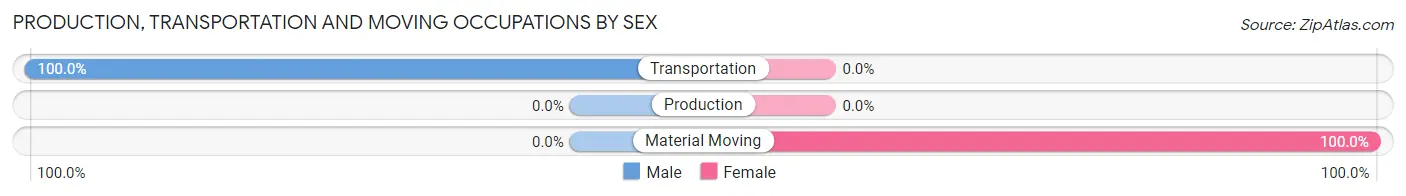
| Occupation | Male | Female |
| Production | 0 (0.0%) | 0 (0.0%) |
| Transportation | 28 (100.0%) | 0 (0.0%) |
| Material Moving | 0 (0.0%) | 27 (100.0%) |
| Total (Category) | 28 (50.9%) | 27 (49.1%) |
| Total (Overall) | 91 (50.0%) | 91 (50.0%) |
Employment Industries by Sex in Arlington
Employment Industries in Arlington
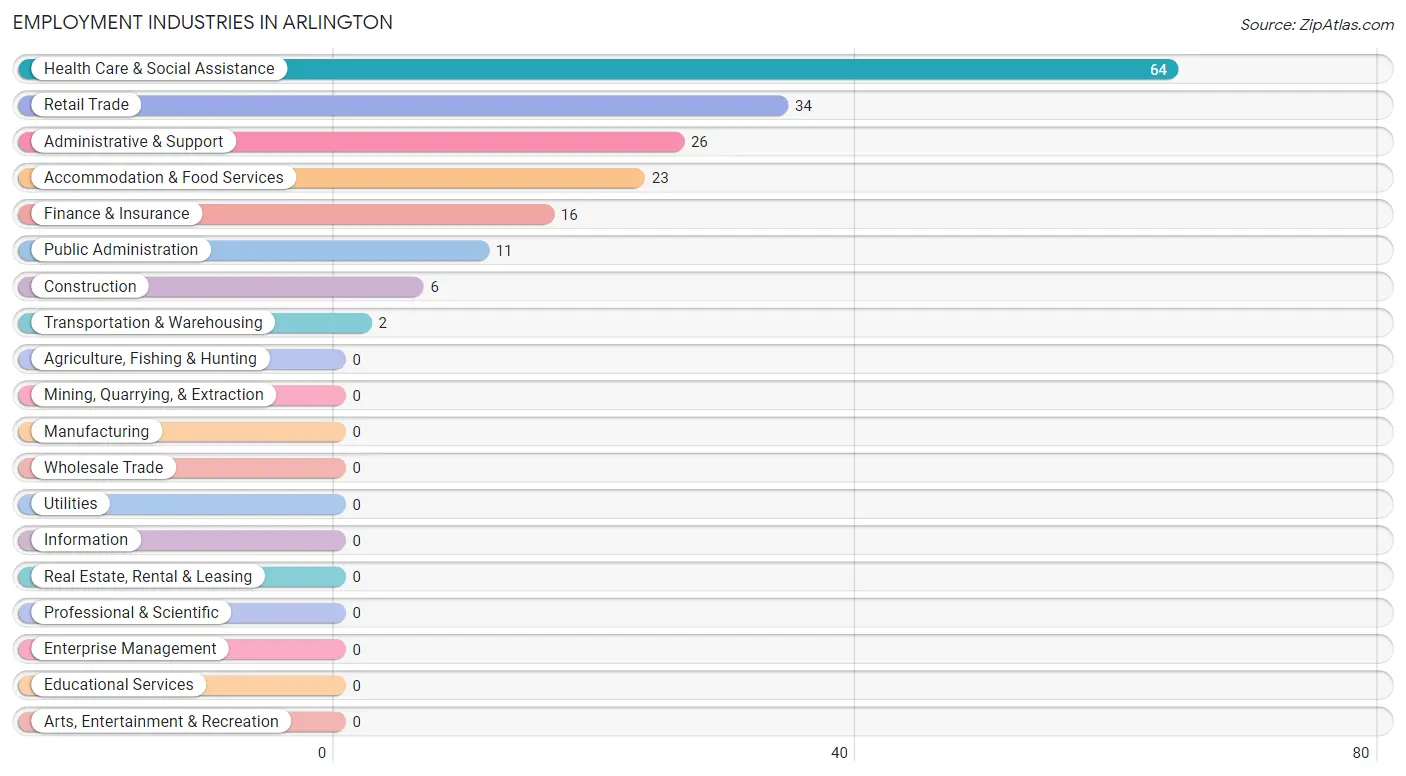
The major employment industries in Arlington include Health Care & Social Assistance (64 | 35.2%), Retail Trade (34 | 18.7%), Administrative & Support (26 | 14.3%), Accommodation & Food Services (23 | 12.6%), and Finance & Insurance (16 | 8.8%).
Employment Industries by Sex in Arlington
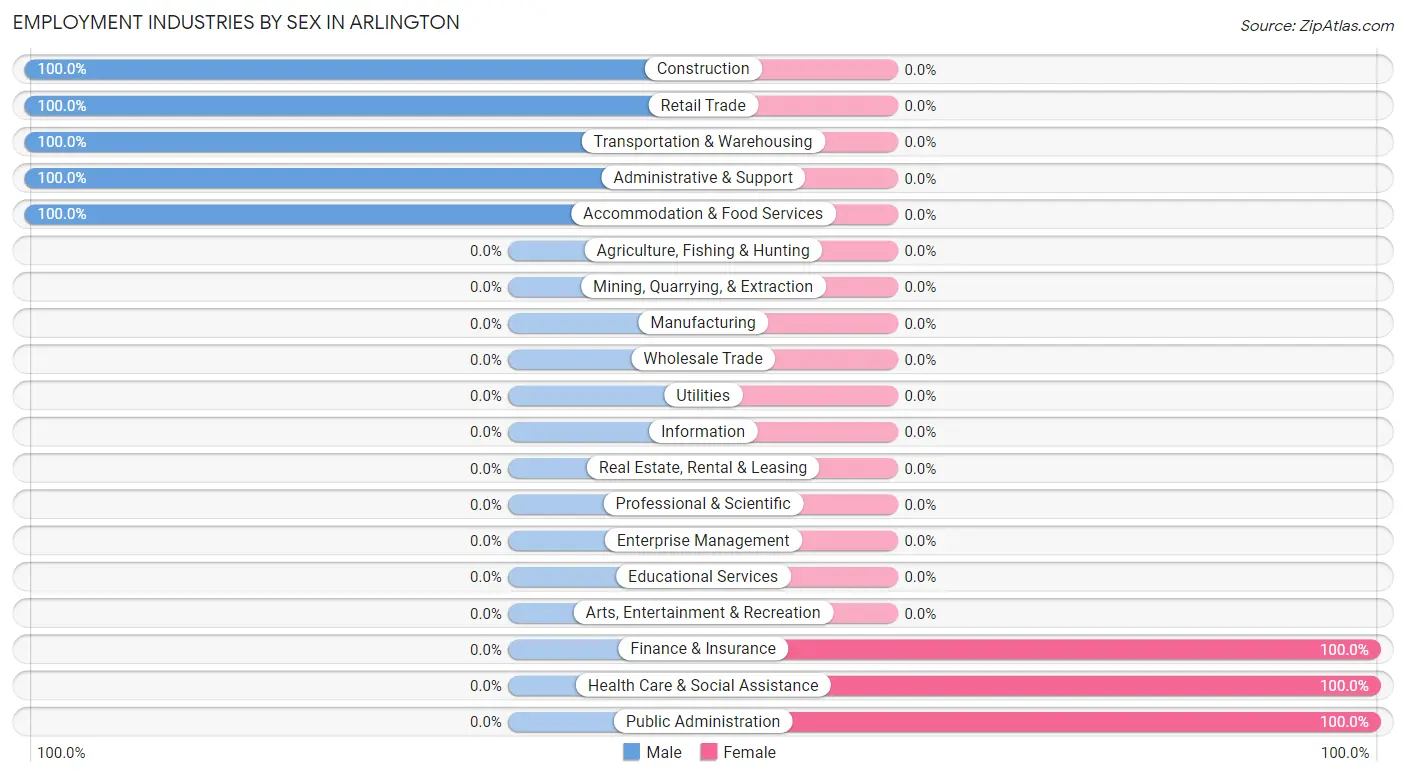
The Arlington industries that see more men than women are Construction (100.0%), Retail Trade (100.0%), and Transportation & Warehousing (100.0%), whereas the industries that tend to have a higher number of women are Finance & Insurance (100.0%), Health Care & Social Assistance (100.0%), and Public Administration (100.0%).
| Industry | Male | Female |
| Agriculture, Fishing & Hunting | 0 (0.0%) | 0 (0.0%) |
| Mining, Quarrying, & Extraction | 0 (0.0%) | 0 (0.0%) |
| Construction | 6 (100.0%) | 0 (0.0%) |
| Manufacturing | 0 (0.0%) | 0 (0.0%) |
| Wholesale Trade | 0 (0.0%) | 0 (0.0%) |
| Retail Trade | 34 (100.0%) | 0 (0.0%) |
| Transportation & Warehousing | 2 (100.0%) | 0 (0.0%) |
| Utilities | 0 (0.0%) | 0 (0.0%) |
| Information | 0 (0.0%) | 0 (0.0%) |
| Finance & Insurance | 0 (0.0%) | 16 (100.0%) |
| Real Estate, Rental & Leasing | 0 (0.0%) | 0 (0.0%) |
| Professional & Scientific | 0 (0.0%) | 0 (0.0%) |
| Enterprise Management | 0 (0.0%) | 0 (0.0%) |
| Administrative & Support | 26 (100.0%) | 0 (0.0%) |
| Educational Services | 0 (0.0%) | 0 (0.0%) |
| Health Care & Social Assistance | 0 (0.0%) | 64 (100.0%) |
| Arts, Entertainment & Recreation | 0 (0.0%) | 0 (0.0%) |
| Accommodation & Food Services | 23 (100.0%) | 0 (0.0%) |
| Public Administration | 0 (0.0%) | 11 (100.0%) |
| Total | 91 (50.0%) | 91 (50.0%) |
Education in Arlington
School Enrollment in Arlington
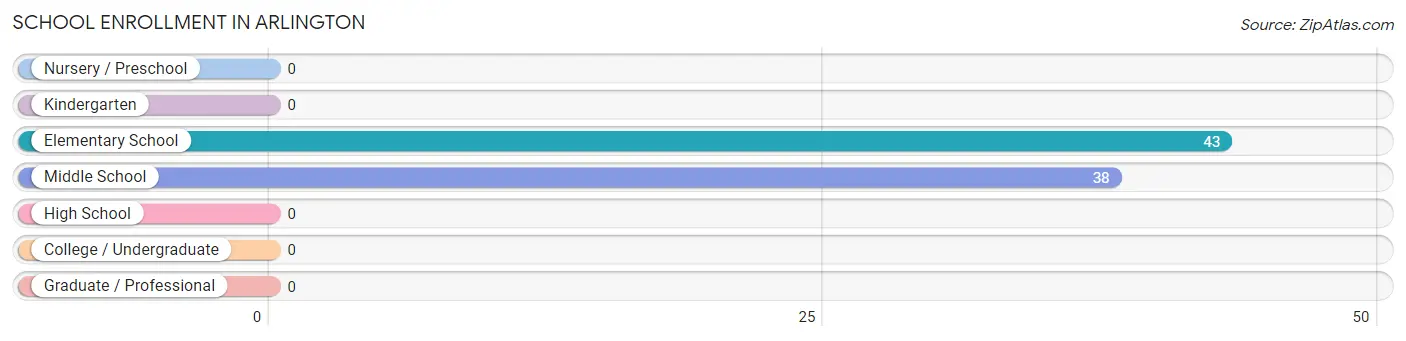
The most common levels of schooling among the 81 students in Arlington are elementary school (43 | 53.1%), and middle school (38 | 46.9%).
| School Level | # Students | % Students |
| Nursery / Preschool | 0 | 0.0% |
| Kindergarten | 0 | 0.0% |
| Elementary School | 43 | 53.1% |
| Middle School | 38 | 46.9% |
| High School | 0 | 0.0% |
| College / Undergraduate | 0 | 0.0% |
| Graduate / Professional | 0 | 0.0% |
| Total | 81 | 100.0% |
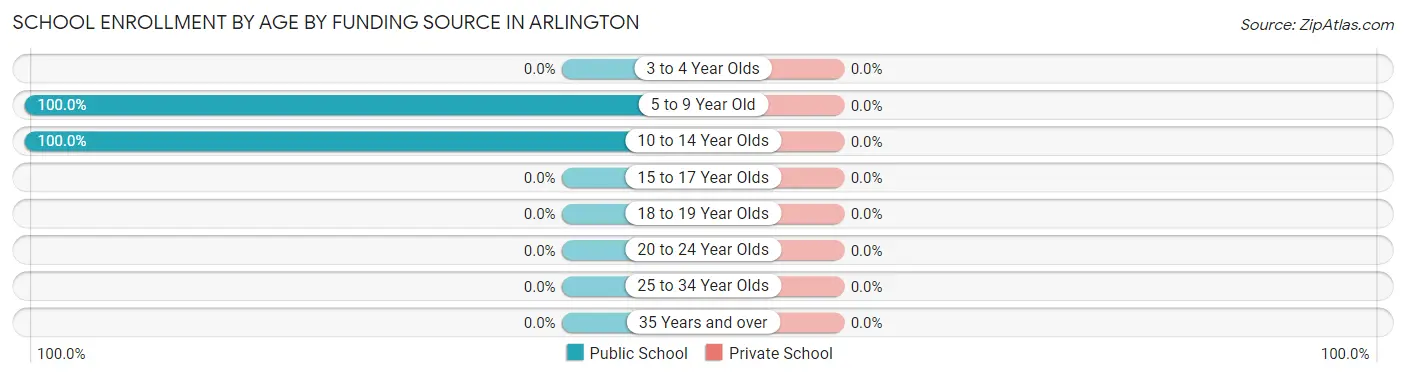
School Enrollment by Age by Funding Source in Arlington
| Age Bracket | Public School | Private School |
| 3 to 4 Year Olds | 0 (0.0%) | 0 (0.0%) |
| 5 to 9 Year Old | 43 (100.0%) | 0 (0.0%) |
| 10 to 14 Year Olds | 38 (100.0%) | 0 (0.0%) |
| 15 to 17 Year Olds | 0 (0.0%) | 0 (0.0%) |
| 18 to 19 Year Olds | 0 (0.0%) | 0 (0.0%) |
| 20 to 24 Year Olds | 0 (0.0%) | 0 (0.0%) |
| 25 to 34 Year Olds | 0 (0.0%) | 0 (0.0%) |
| 35 Years and over | 0 (0.0%) | 0 (0.0%) |
| Total | 81 (100.0%) | 0 (0.0%) |
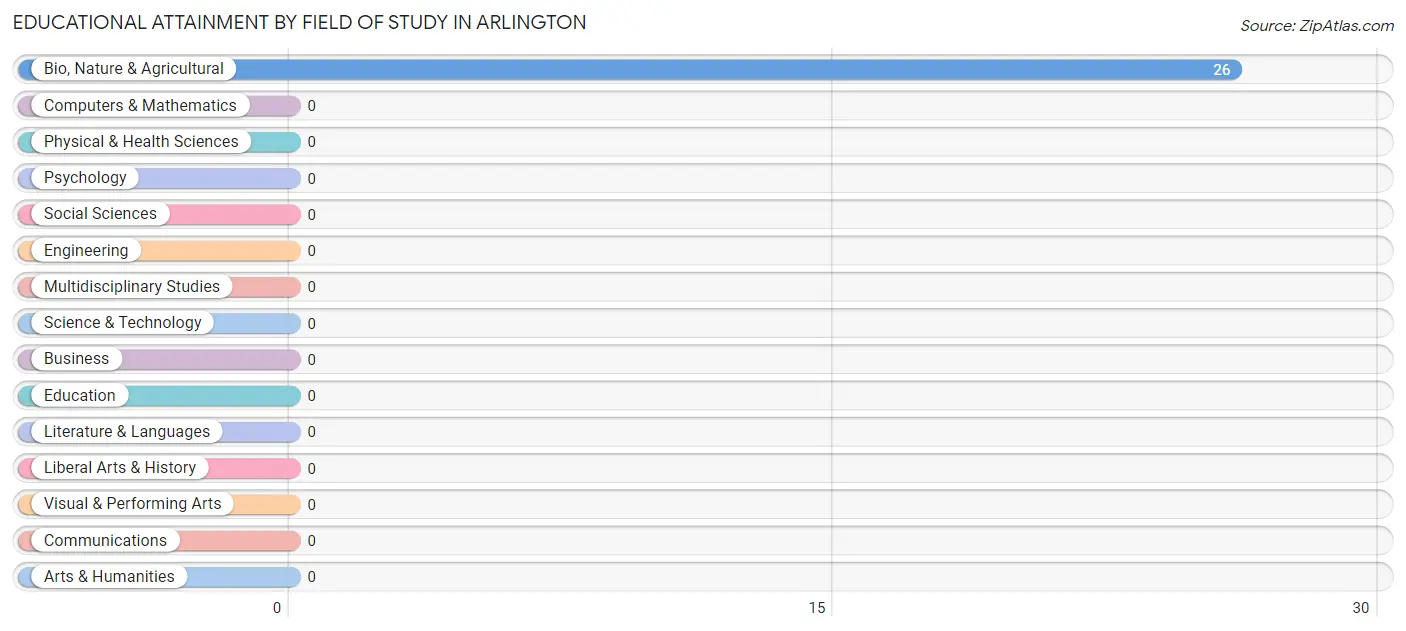
Educational Attainment by Field of Study in Arlington
, and bio, nature & agricultural (26 | 100.0%) are the most common fields of study among 26 individuals in Arlington who have obtained a bachelor's degree or higher.
| Field of Study | # Graduates | % Graduates |
| Computers & Mathematics | 0 | 0.0% |
| Bio, Nature & Agricultural | 26 | 100.0% |
| Physical & Health Sciences | 0 | 0.0% |
| Psychology | 0 | 0.0% |
| Social Sciences | 0 | 0.0% |
| Engineering | 0 | 0.0% |
| Multidisciplinary Studies | 0 | 0.0% |
| Science & Technology | 0 | 0.0% |
| Business | 0 | 0.0% |
| Education | 0 | 0.0% |
| Literature & Languages | 0 | 0.0% |
| Liberal Arts & History | 0 | 0.0% |
| Visual & Performing Arts | 0 | 0.0% |
| Communications | 0 | 0.0% |
| Arts & Humanities | 0 | 0.0% |
| Total | 26 | 100.0% |
Transportation & Commute in Arlington
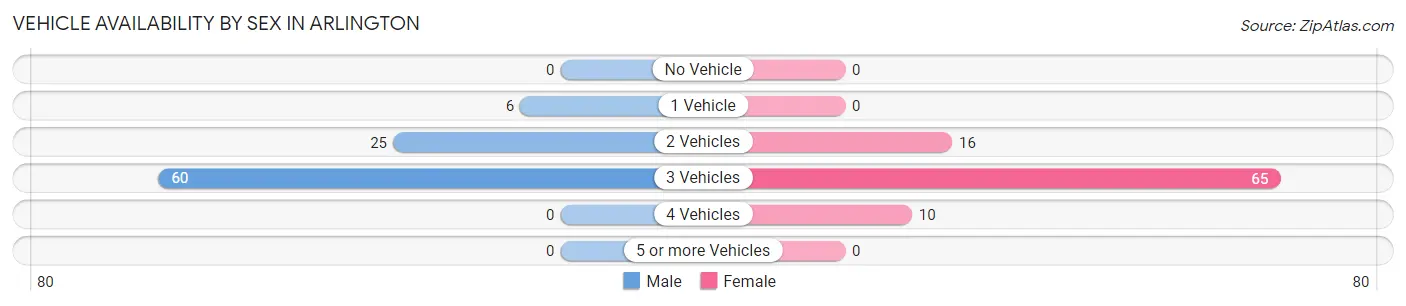
Vehicle Availability by Sex in Arlington
The most prevalent vehicle ownership categories in Arlington are males with 3 vehicles (60, accounting for 65.9%) and females with 3 vehicles (65, making up 65.9%).
| Vehicles Available | Male | Female |
| No Vehicle | 0 (0.0%) | 0 (0.0%) |
| 1 Vehicle | 6 (6.6%) | 0 (0.0%) |
| 2 Vehicles | 25 (27.5%) | 16 (17.6%) |
| 3 Vehicles | 60 (65.9%) | 65 (71.4%) |
| 4 Vehicles | 0 (0.0%) | 10 (11.0%) |
| 5 or more Vehicles | 0 (0.0%) | 0 (0.0%) |
| Total | 91 (100.0%) | 91 (100.0%) |
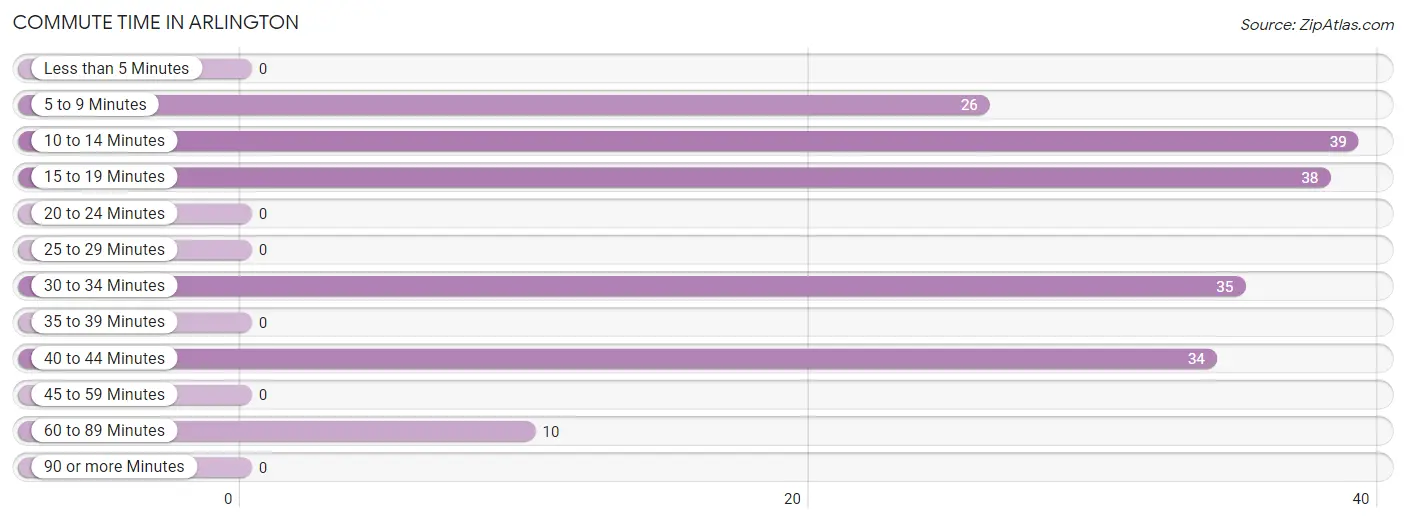
Commute Time in Arlington
The most frequently occuring commute durations in Arlington are 10 to 14 minutes (39 commuters, 21.4%), 15 to 19 minutes (38 commuters, 20.9%), and 30 to 34 minutes (35 commuters, 19.2%).
| Commute Time | # Commuters | % Commuters |
| Less than 5 Minutes | 0 | 0.0% |
| 5 to 9 Minutes | 26 | 14.3% |
| 10 to 14 Minutes | 39 | 21.4% |
| 15 to 19 Minutes | 38 | 20.9% |
| 20 to 24 Minutes | 0 | 0.0% |
| 25 to 29 Minutes | 0 | 0.0% |
| 30 to 34 Minutes | 35 | 19.2% |
| 35 to 39 Minutes | 0 | 0.0% |
| 40 to 44 Minutes | 34 | 18.7% |
| 45 to 59 Minutes | 0 | 0.0% |
| 60 to 89 Minutes | 10 | 5.5% |
| 90 or more Minutes | 0 | 0.0% |
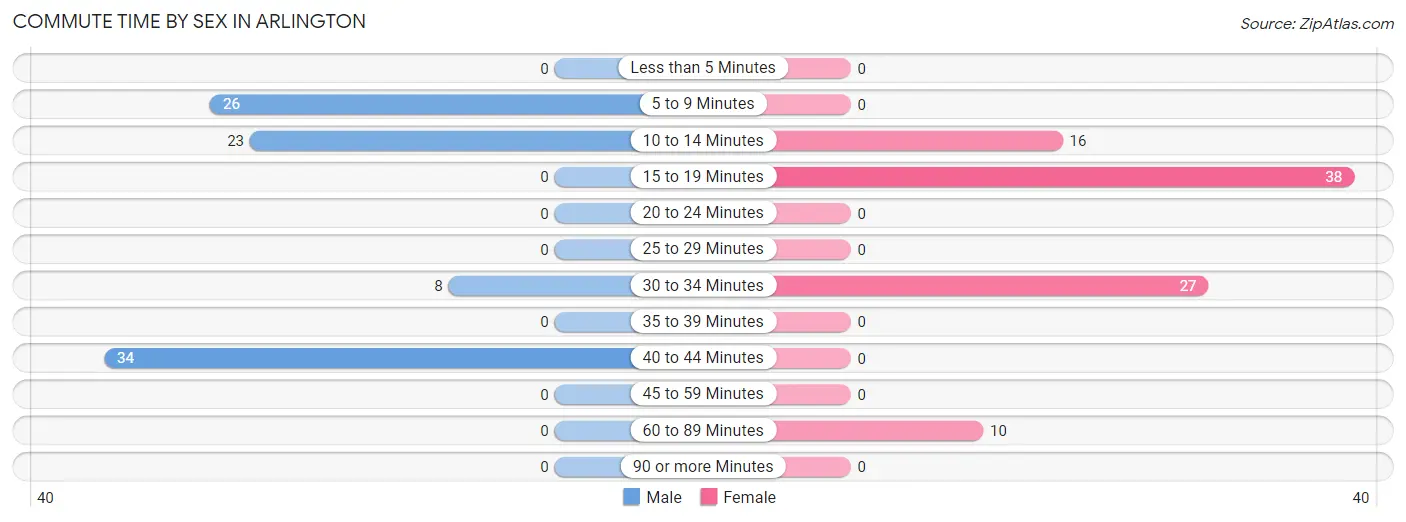
Commute Time by Sex in Arlington
The most common commute times in Arlington are 40 to 44 minutes (34 commuters, 37.4%) for males and 15 to 19 minutes (38 commuters, 41.8%) for females.
| Commute Time | Male | Female |
| Less than 5 Minutes | 0 (0.0%) | 0 (0.0%) |
| 5 to 9 Minutes | 26 (28.6%) | 0 (0.0%) |
| 10 to 14 Minutes | 23 (25.3%) | 16 (17.6%) |
| 15 to 19 Minutes | 0 (0.0%) | 38 (41.8%) |
| 20 to 24 Minutes | 0 (0.0%) | 0 (0.0%) |
| 25 to 29 Minutes | 0 (0.0%) | 0 (0.0%) |
| 30 to 34 Minutes | 8 (8.8%) | 27 (29.7%) |
| 35 to 39 Minutes | 0 (0.0%) | 0 (0.0%) |
| 40 to 44 Minutes | 34 (37.4%) | 0 (0.0%) |
| 45 to 59 Minutes | 0 (0.0%) | 0 (0.0%) |
| 60 to 89 Minutes | 0 (0.0%) | 10 (11.0%) |
| 90 or more Minutes | 0 (0.0%) | 0 (0.0%) |
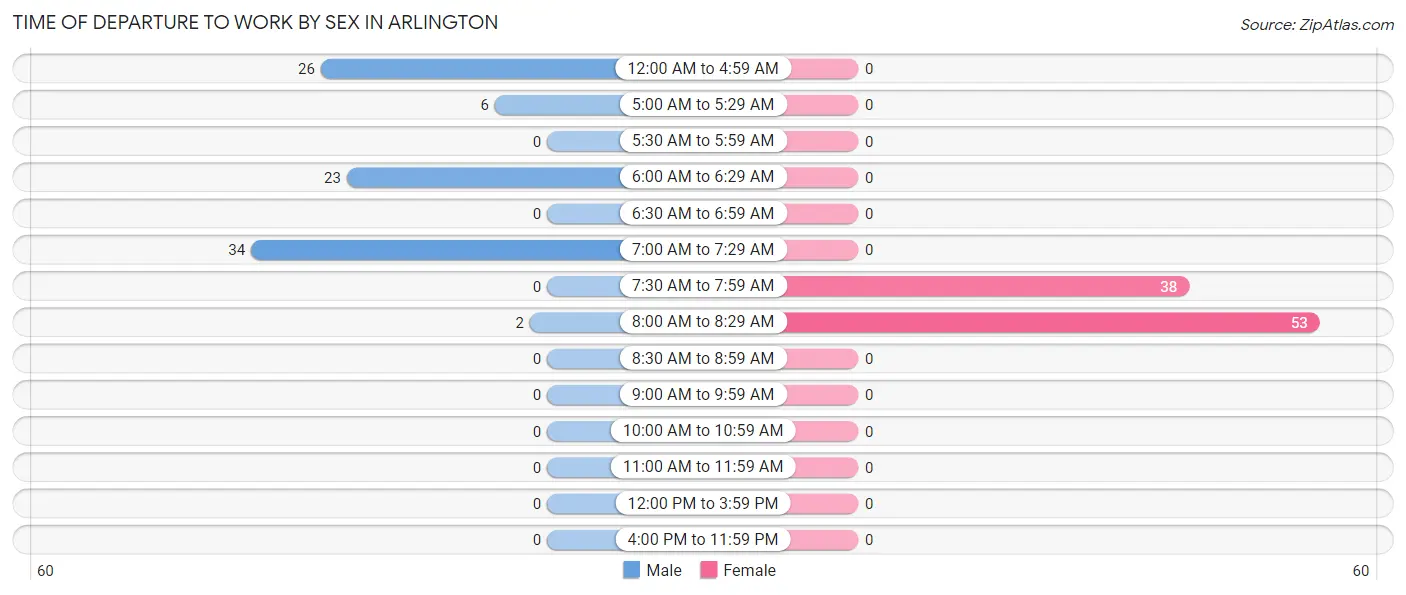
Time of Departure to Work by Sex in Arlington
The most frequent times of departure to work in Arlington are 7:00 AM to 7:29 AM (34, 37.4%) for males and 8:00 AM to 8:29 AM (53, 58.2%) for females.
| Time of Departure | Male | Female |
| 12:00 AM to 4:59 AM | 26 (28.6%) | 0 (0.0%) |
| 5:00 AM to 5:29 AM | 6 (6.6%) | 0 (0.0%) |
| 5:30 AM to 5:59 AM | 0 (0.0%) | 0 (0.0%) |
| 6:00 AM to 6:29 AM | 23 (25.3%) | 0 (0.0%) |
| 6:30 AM to 6:59 AM | 0 (0.0%) | 0 (0.0%) |
| 7:00 AM to 7:29 AM | 34 (37.4%) | 0 (0.0%) |
| 7:30 AM to 7:59 AM | 0 (0.0%) | 38 (41.8%) |
| 8:00 AM to 8:29 AM | 2 (2.2%) | 53 (58.2%) |
| 8:30 AM to 8:59 AM | 0 (0.0%) | 0 (0.0%) |
| 9:00 AM to 9:59 AM | 0 (0.0%) | 0 (0.0%) |
| 10:00 AM to 10:59 AM | 0 (0.0%) | 0 (0.0%) |
| 11:00 AM to 11:59 AM | 0 (0.0%) | 0 (0.0%) |
| 12:00 PM to 3:59 PM | 0 (0.0%) | 0 (0.0%) |
| 4:00 PM to 11:59 PM | 0 (0.0%) | 0 (0.0%) |
| Total | 91 (100.0%) | 91 (100.0%) |
Housing Occupancy in Arlington
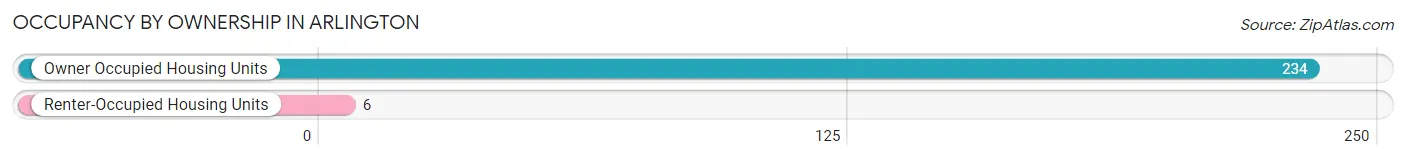
Occupancy by Ownership in Arlington
Of the total 240 dwellings in Arlington, owner-occupied units account for 234 (97.5%), while renter-occupied units make up 6 (2.5%).
| Occupancy | # Housing Units | % Housing Units |
| Owner Occupied Housing Units | 234 | 97.5% |
| Renter-Occupied Housing Units | 6 | 2.5% |
| Total Occupied Housing Units | 240 | 100.0% |
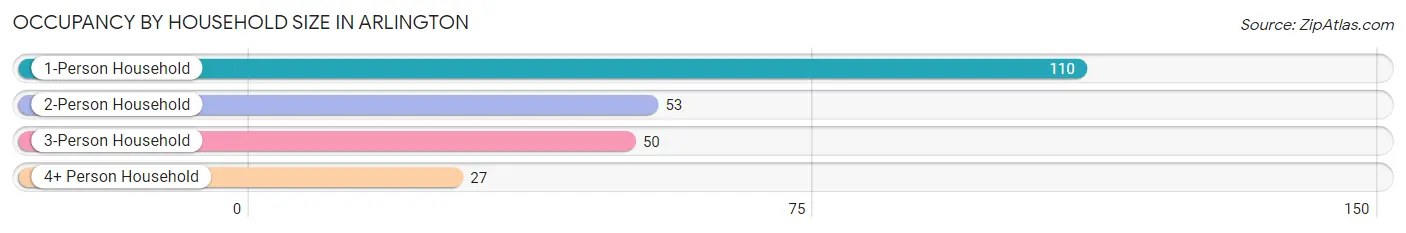
Occupancy by Household Size in Arlington
| Household Size | # Housing Units | % Housing Units |
| 1-Person Household | 110 | 45.8% |
| 2-Person Household | 53 | 22.1% |
| 3-Person Household | 50 | 20.8% |
| 4+ Person Household | 27 | 11.3% |
| Total Housing Units | 240 | 100.0% |
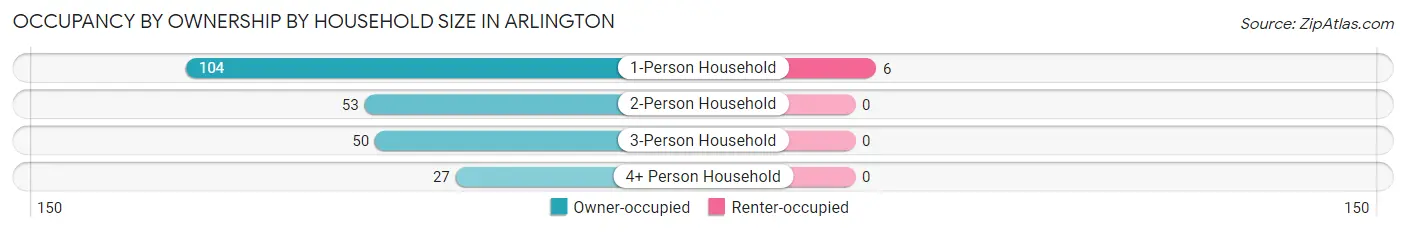
Occupancy by Ownership by Household Size in Arlington
| Household Size | Owner-occupied | Renter-occupied |
| 1-Person Household | 104 (94.6%) | 6 (5.4%) |
| 2-Person Household | 53 (100.0%) | 0 (0.0%) |
| 3-Person Household | 50 (100.0%) | 0 (0.0%) |
| 4+ Person Household | 27 (100.0%) | 0 (0.0%) |
| Total Housing Units | 234 (97.5%) | 6 (2.5%) |
Occupancy by Educational Attainment in Arlington
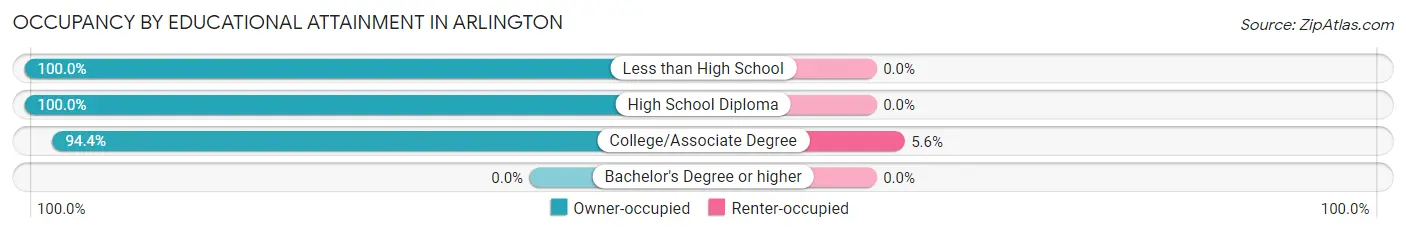
| Household Size | Owner-occupied | Renter-occupied |
| Less than High School | 22 (100.0%) | 0 (0.0%) |
| High School Diploma | 110 (100.0%) | 0 (0.0%) |
| College/Associate Degree | 102 (94.4%) | 6 (5.6%) |
| Bachelor's Degree or higher | 0 (0.0%) | 0 (0.0%) |
Occupancy by Age of Householder in Arlington
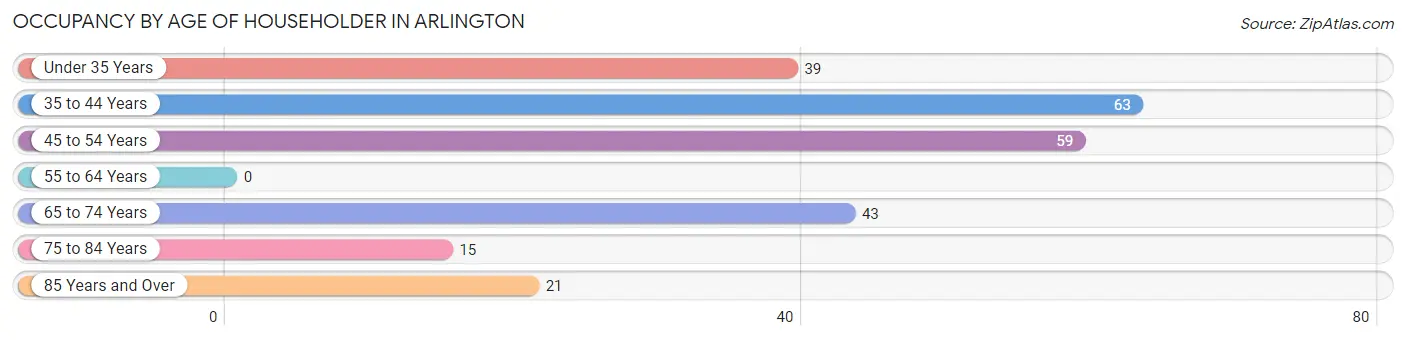
| Age Bracket | # Households | % Households |
| Under 35 Years | 39 | 16.3% |
| 35 to 44 Years | 63 | 26.3% |
| 45 to 54 Years | 59 | 24.6% |
| 55 to 64 Years | 0 | 0.0% |
| 65 to 74 Years | 43 | 17.9% |
| 75 to 84 Years | 15 | 6.2% |
| 85 Years and Over | 21 | 8.7% |
| Total | 240 | 100.0% |
Housing Finances in Arlington
Median Income by Occupancy in Arlington
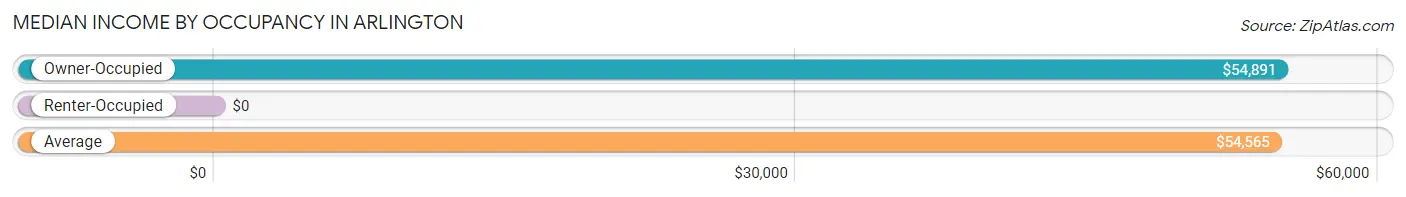
| Occupancy Type | # Households | Median Income |
| Owner-Occupied | 234 (97.5%) | $54,891 |
| Renter-Occupied | 6 (2.5%) | $0 |
| Average | 240 (100.0%) | $54,565 |
Occupancy by Householder Income Bracket in Arlington
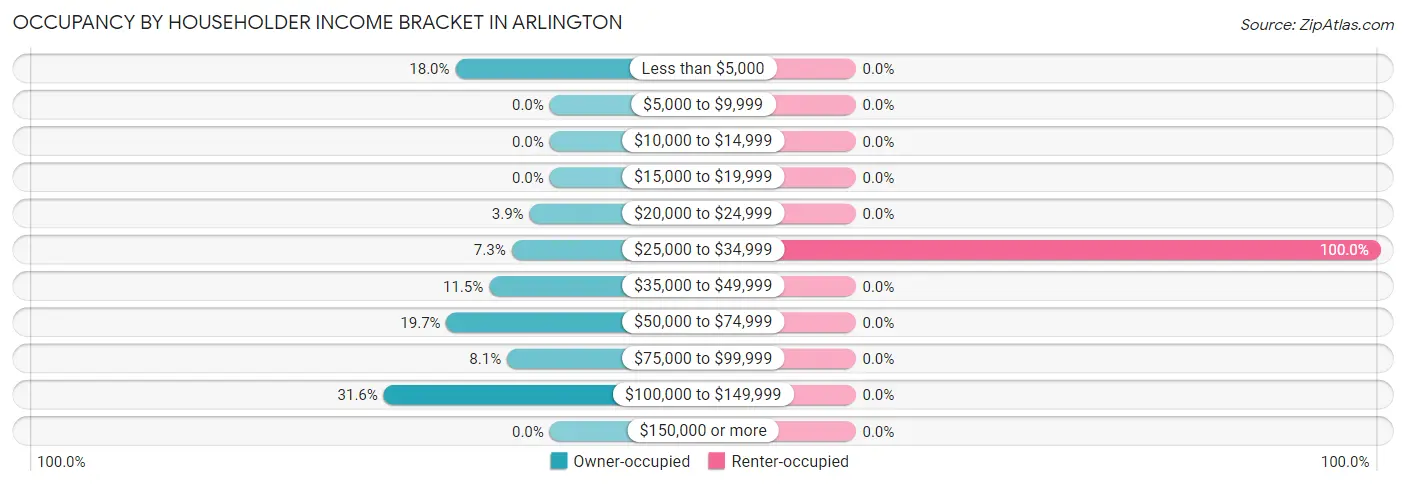
| Income Bracket | Owner-occupied | Renter-occupied |
| Less than $5,000 | 42 (17.9%) | 0 (0.0%) |
| $5,000 to $9,999 | 0 (0.0%) | 0 (0.0%) |
| $10,000 to $14,999 | 0 (0.0%) | 0 (0.0%) |
| $15,000 to $19,999 | 0 (0.0%) | 0 (0.0%) |
| $20,000 to $24,999 | 9 (3.8%) | 0 (0.0%) |
| $25,000 to $34,999 | 17 (7.3%) | 6 (100.0%) |
| $35,000 to $49,999 | 27 (11.5%) | 0 (0.0%) |
| $50,000 to $74,999 | 46 (19.7%) | 0 (0.0%) |
| $75,000 to $99,999 | 19 (8.1%) | 0 (0.0%) |
| $100,000 to $149,999 | 74 (31.6%) | 0 (0.0%) |
| $150,000 or more | 0 (0.0%) | 0 (0.0%) |
| Total | 234 (100.0%) | 6 (100.0%) |
Monthly Housing Cost Tiers in Arlington
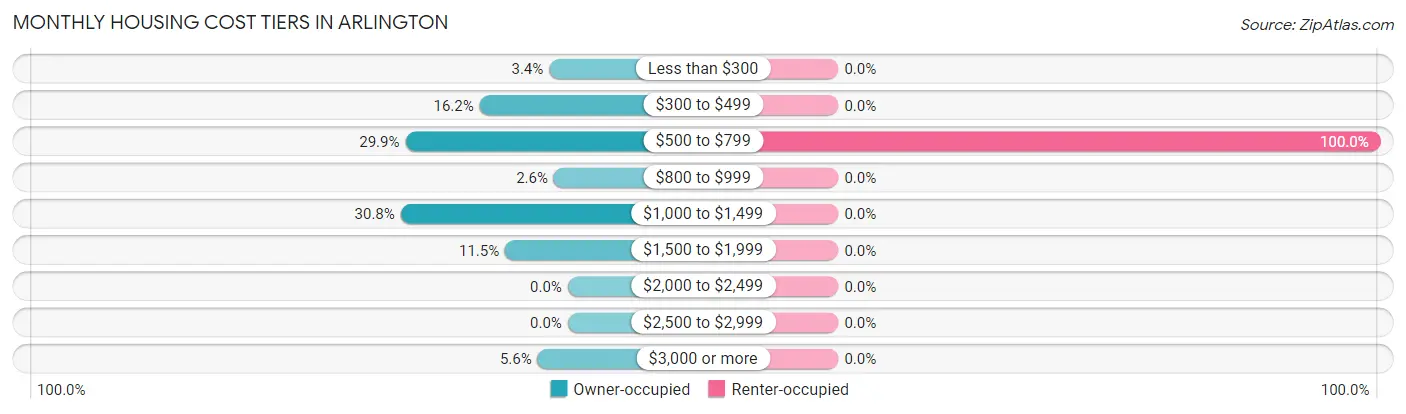
| Monthly Cost | Owner-occupied | Renter-occupied |
| Less than $300 | 8 (3.4%) | 0 (0.0%) |
| $300 to $499 | 38 (16.2%) | 0 (0.0%) |
| $500 to $799 | 70 (29.9%) | 6 (100.0%) |
| $800 to $999 | 6 (2.6%) | 0 (0.0%) |
| $1,000 to $1,499 | 72 (30.8%) | 0 (0.0%) |
| $1,500 to $1,999 | 27 (11.5%) | 0 (0.0%) |
| $2,000 to $2,499 | 0 (0.0%) | 0 (0.0%) |
| $2,500 to $2,999 | 0 (0.0%) | 0 (0.0%) |
| $3,000 or more | 13 (5.6%) | 0 (0.0%) |
| Total | 234 (100.0%) | 6 (100.0%) |
Physical Housing Characteristics in Arlington
Housing Structures in Arlington
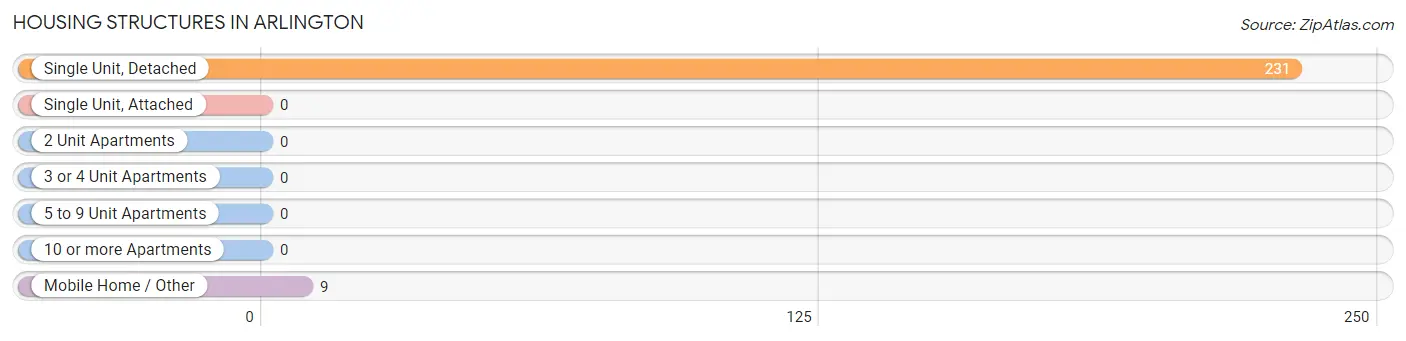
| Structure Type | # Housing Units | % Housing Units |
| Single Unit, Detached | 231 | 96.3% |
| Single Unit, Attached | 0 | 0.0% |
| 2 Unit Apartments | 0 | 0.0% |
| 3 or 4 Unit Apartments | 0 | 0.0% |
| 5 to 9 Unit Apartments | 0 | 0.0% |
| 10 or more Apartments | 0 | 0.0% |
| Mobile Home / Other | 9 | 3.7% |
| Total | 240 | 100.0% |
Housing Structures by Occupancy in Arlington
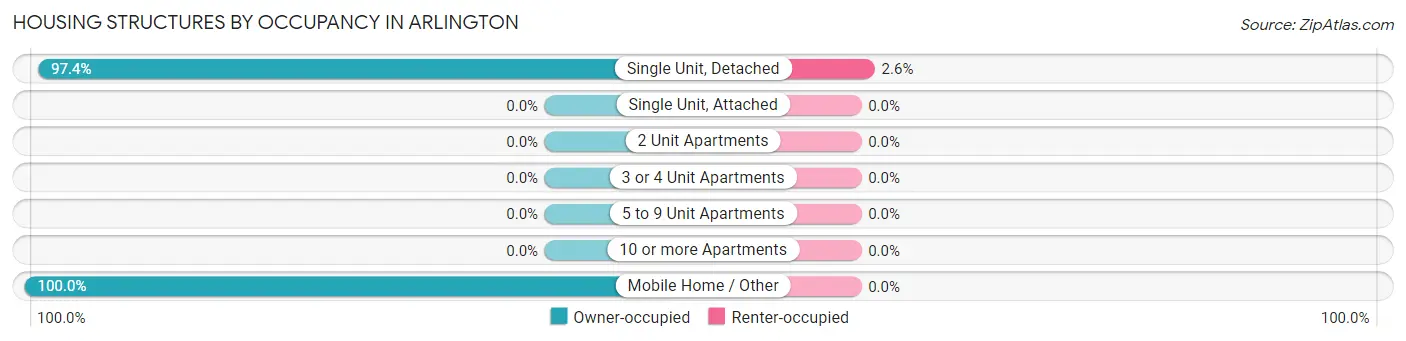
| Structure Type | Owner-occupied | Renter-occupied |
| Single Unit, Detached | 225 (97.4%) | 6 (2.6%) |
| Single Unit, Attached | 0 (0.0%) | 0 (0.0%) |
| 2 Unit Apartments | 0 (0.0%) | 0 (0.0%) |
| 3 or 4 Unit Apartments | 0 (0.0%) | 0 (0.0%) |
| 5 to 9 Unit Apartments | 0 (0.0%) | 0 (0.0%) |
| 10 or more Apartments | 0 (0.0%) | 0 (0.0%) |
| Mobile Home / Other | 9 (100.0%) | 0 (0.0%) |
| Total | 234 (97.5%) | 6 (2.5%) |
Housing Structures by Number of Rooms in Arlington
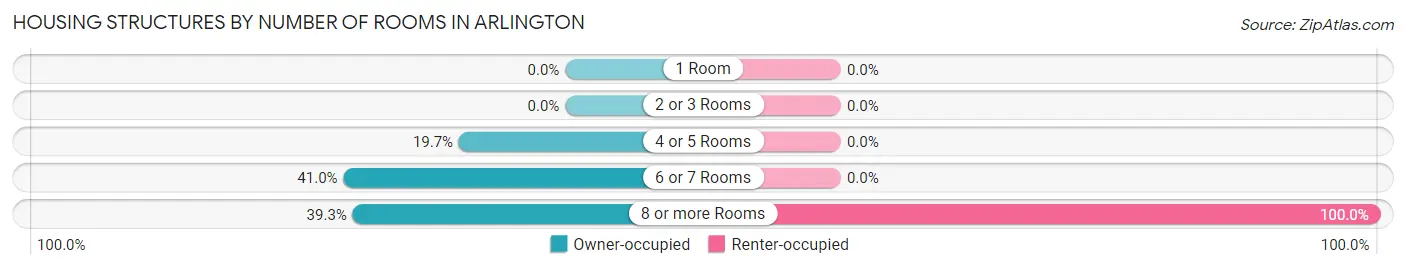
| Number of Rooms | Owner-occupied | Renter-occupied |
| 1 Room | 0 (0.0%) | 0 (0.0%) |
| 2 or 3 Rooms | 0 (0.0%) | 0 (0.0%) |
| 4 or 5 Rooms | 46 (19.7%) | 0 (0.0%) |
| 6 or 7 Rooms | 96 (41.0%) | 0 (0.0%) |
| 8 or more Rooms | 92 (39.3%) | 6 (100.0%) |
| Total | 234 (100.0%) | 6 (100.0%) |
Housing Structure by Heating Type in Arlington
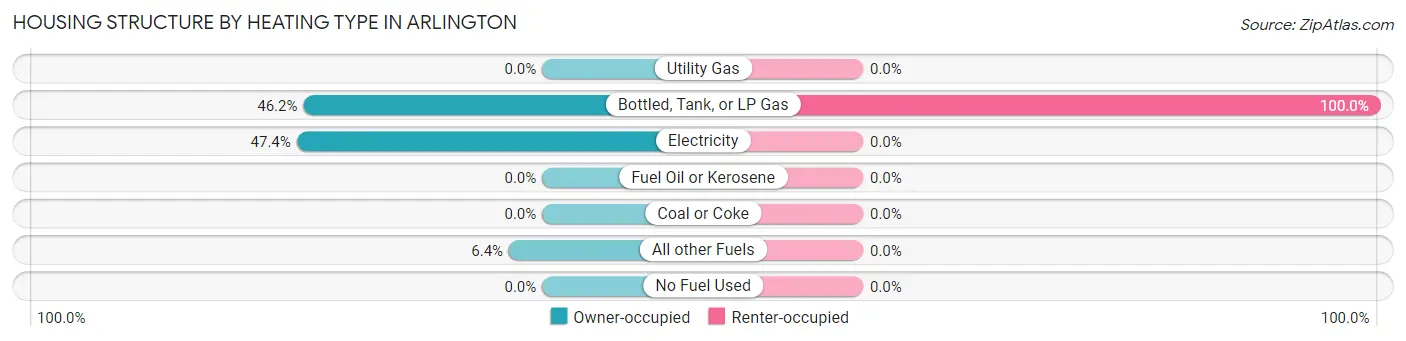
| Heating Type | Owner-occupied | Renter-occupied |
| Utility Gas | 0 (0.0%) | 0 (0.0%) |
| Bottled, Tank, or LP Gas | 108 (46.2%) | 6 (100.0%) |
| Electricity | 111 (47.4%) | 0 (0.0%) |
| Fuel Oil or Kerosene | 0 (0.0%) | 0 (0.0%) |
| Coal or Coke | 0 (0.0%) | 0 (0.0%) |
| All other Fuels | 15 (6.4%) | 0 (0.0%) |
| No Fuel Used | 0 (0.0%) | 0 (0.0%) |
| Total | 234 (100.0%) | 6 (100.0%) |
Household Vehicle Usage in Arlington
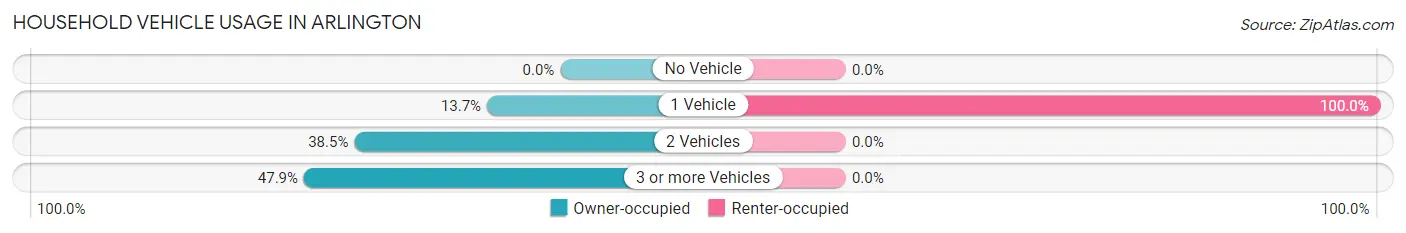
| Vehicles per Household | Owner-occupied | Renter-occupied |
| No Vehicle | 0 (0.0%) | 0 (0.0%) |
| 1 Vehicle | 32 (13.7%) | 6 (100.0%) |
| 2 Vehicles | 90 (38.5%) | 0 (0.0%) |
| 3 or more Vehicles | 112 (47.9%) | 0 (0.0%) |
| Total | 234 (100.0%) | 6 (100.0%) |
Real Estate & Mortgages in Arlington
Real Estate and Mortgage Overview in Arlington
| Characteristic | Without Mortgage | With Mortgage |
| Housing Units | 116 | 118 |
| Median Property Value | $125,400 | $256,000 |
| Median Household Income | - | - |
| Monthly Housing Costs | $520 | $13 |
| Real Estate Taxes | $416 | $0 |
Property Value by Mortgage Status in Arlington
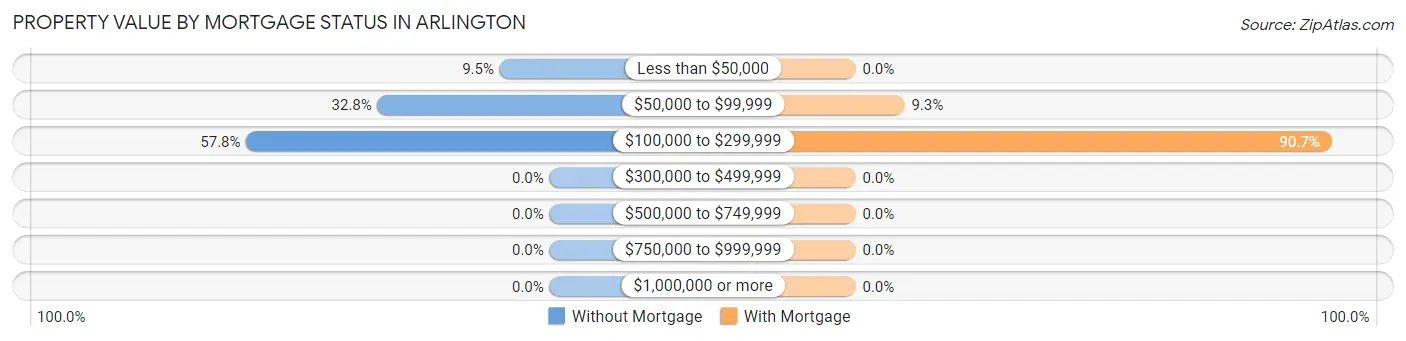
| Property Value | Without Mortgage | With Mortgage |
| Less than $50,000 | 11 (9.5%) | 0 (0.0%) |
| $50,000 to $99,999 | 38 (32.8%) | 11 (9.3%) |
| $100,000 to $299,999 | 67 (57.8%) | 107 (90.7%) |
| $300,000 to $499,999 | 0 (0.0%) | 0 (0.0%) |
| $500,000 to $749,999 | 0 (0.0%) | 0 (0.0%) |
| $750,000 to $999,999 | 0 (0.0%) | 0 (0.0%) |
| $1,000,000 or more | 0 (0.0%) | 0 (0.0%) |
| Total | 116 (100.0%) | 118 (100.0%) |
Household Income by Mortgage Status in Arlington
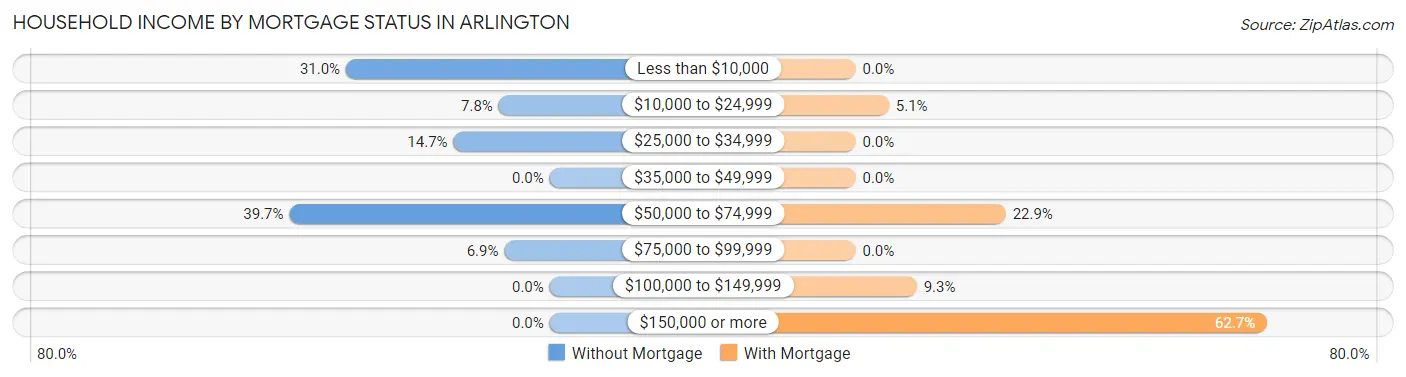
| Household Income | Without Mortgage | With Mortgage |
| Less than $10,000 | 36 (31.0%) | 0 (0.0%) |
| $10,000 to $24,999 | 9 (7.8%) | 6 (5.1%) |
| $25,000 to $34,999 | 17 (14.7%) | 0 (0.0%) |
| $35,000 to $49,999 | 0 (0.0%) | 0 (0.0%) |
| $50,000 to $74,999 | 46 (39.7%) | 27 (22.9%) |
| $75,000 to $99,999 | 8 (6.9%) | 0 (0.0%) |
| $100,000 to $149,999 | 0 (0.0%) | 11 (9.3%) |
| $150,000 or more | 0 (0.0%) | 74 (62.7%) |
| Total | 116 (100.0%) | 118 (100.0%) |
Property Value to Household Income Ratio in Arlington
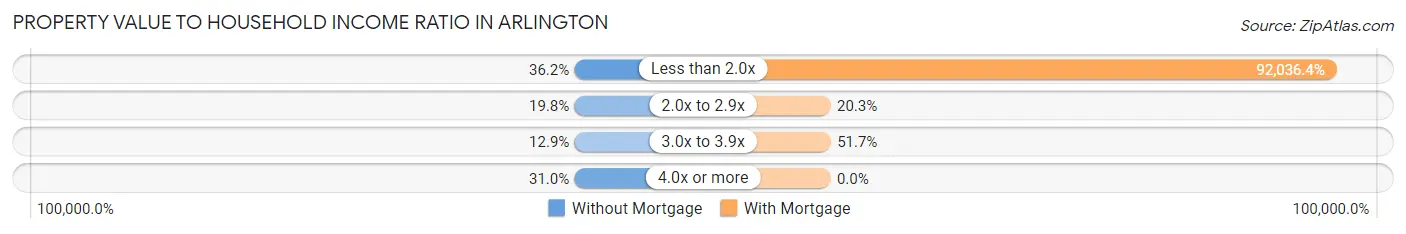
| Value-to-Income Ratio | Without Mortgage | With Mortgage |
| Less than 2.0x | 42 (36.2%) | 108,603 (92,036.4%) |
| 2.0x to 2.9x | 23 (19.8%) | 24 (20.3%) |
| 3.0x to 3.9x | 15 (12.9%) | 61 (51.7%) |
| 4.0x or more | 36 (31.0%) | 0 (0.0%) |
| Total | 116 (100.0%) | 118 (100.0%) |
Real Estate Taxes by Mortgage Status in Arlington
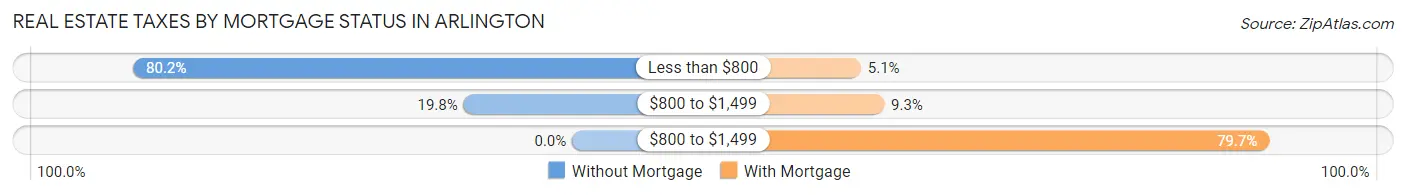
| Property Taxes | Without Mortgage | With Mortgage |
| Less than $800 | 93 (80.2%) | 6 (5.1%) |
| $800 to $1,499 | 23 (19.8%) | 11 (9.3%) |
| $800 to $1,499 | 0 (0.0%) | 94 (79.7%) |
| Total | 116 (100.0%) | 118 (100.0%) |
Health & Disability in Arlington
Health Insurance Coverage by Age in Arlington
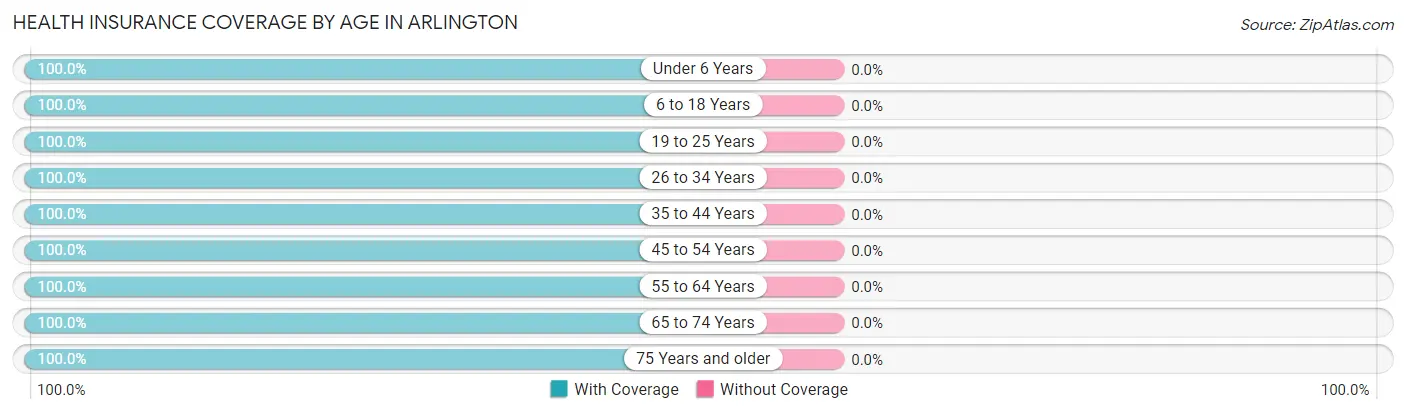
| Age Bracket | With Coverage | Without Coverage |
| Under 6 Years | 35 (100.0%) | 0 (0.0%) |
| 6 to 18 Years | 81 (100.0%) | 0 (0.0%) |
| 19 to 25 Years | 6 (100.0%) | 0 (0.0%) |
| 26 to 34 Years | 67 (100.0%) | 0 (0.0%) |
| 35 to 44 Years | 98 (100.0%) | 0 (0.0%) |
| 45 to 54 Years | 59 (100.0%) | 0 (0.0%) |
| 55 to 64 Years | 21 (100.0%) | 0 (0.0%) |
| 65 to 74 Years | 66 (100.0%) | 0 (0.0%) |
| 75 Years and older | 36 (100.0%) | 0 (0.0%) |
| Total | 469 (100.0%) | 0 (0.0%) |
Health Insurance Coverage by Citizenship Status in Arlington
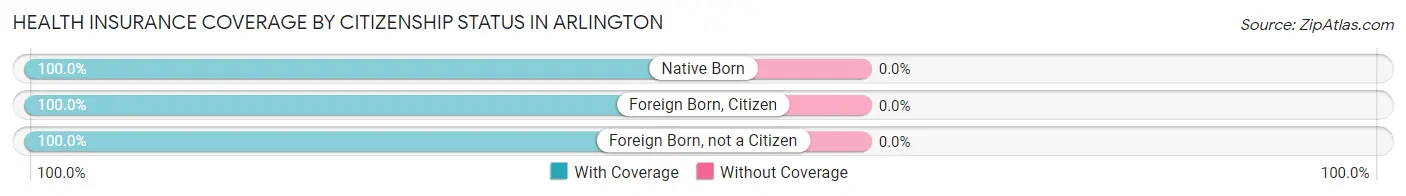
| Citizenship Status | With Coverage | Without Coverage |
| Native Born | 35 (100.0%) | 0 (0.0%) |
| Foreign Born, Citizen | 81 (100.0%) | 0 (0.0%) |
| Foreign Born, not a Citizen | 6 (100.0%) | 0 (0.0%) |
Health Insurance Coverage by Household Income in Arlington
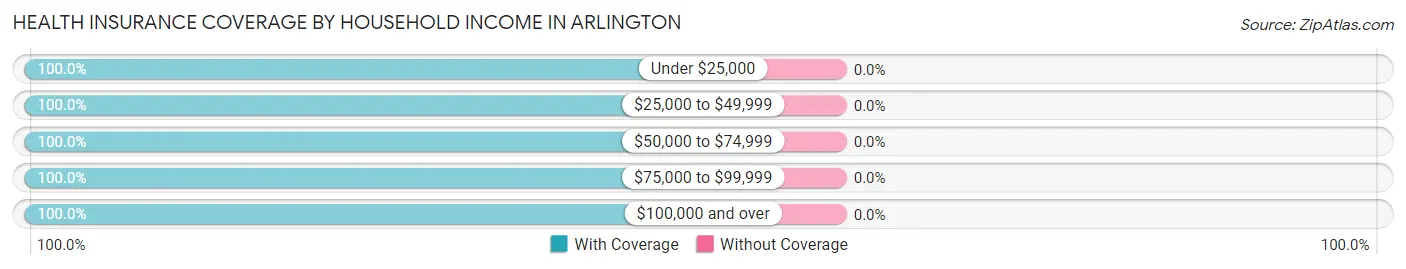
| Household Income | With Coverage | Without Coverage |
| Under $25,000 | 59 (100.0%) | 0 (0.0%) |
| $25,000 to $49,999 | 154 (100.0%) | 0 (0.0%) |
| $50,000 to $74,999 | 97 (100.0%) | 0 (0.0%) |
| $75,000 to $99,999 | 30 (100.0%) | 0 (0.0%) |
| $100,000 and over | 129 (100.0%) | 0 (0.0%) |
Public vs Private Health Insurance Coverage by Age in Arlington
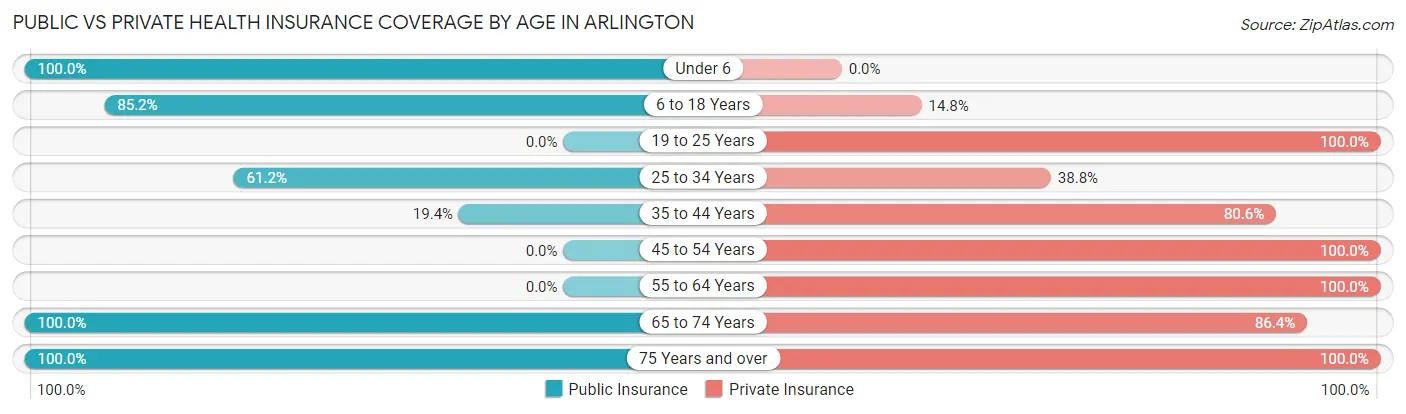
| Age Bracket | Public Insurance | Private Insurance |
| Under 6 | 35 (100.0%) | 0 (0.0%) |
| 6 to 18 Years | 69 (85.2%) | 12 (14.8%) |
| 19 to 25 Years | 0 (0.0%) | 6 (100.0%) |
| 25 to 34 Years | 41 (61.2%) | 26 (38.8%) |
| 35 to 44 Years | 19 (19.4%) | 79 (80.6%) |
| 45 to 54 Years | 0 (0.0%) | 59 (100.0%) |
| 55 to 64 Years | 0 (0.0%) | 21 (100.0%) |
| 65 to 74 Years | 66 (100.0%) | 57 (86.4%) |
| 75 Years and over | 36 (100.0%) | 36 (100.0%) |
| Total | 266 (56.7%) | 296 (63.1%) |
Disability Status by Sex by Age in Arlington
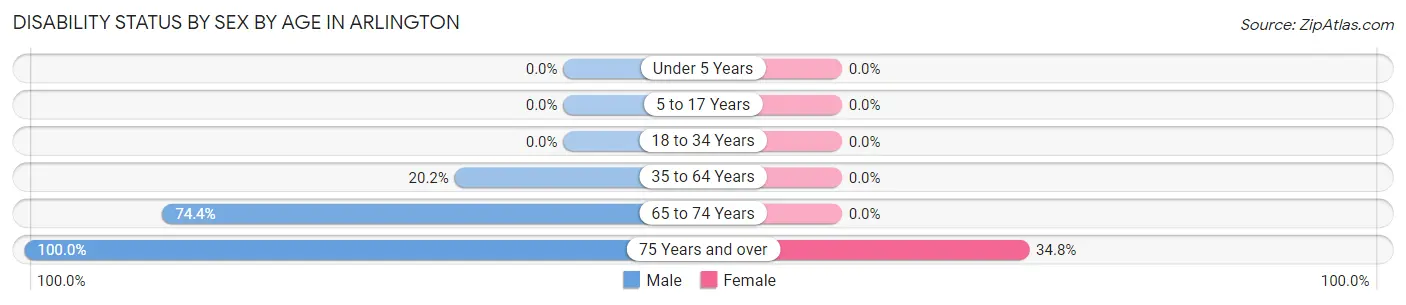
| Age Bracket | Male | Female |
| Under 5 Years | 0 (0.0%) | 0 (0.0%) |
| 5 to 17 Years | 0 (0.0%) | 0 (0.0%) |
| 18 to 34 Years | 0 (0.0%) | 0 (0.0%) |
| 35 to 64 Years | 23 (20.2%) | 0 (0.0%) |
| 65 to 74 Years | 32 (74.4%) | 0 (0.0%) |
| 75 Years and over | 13 (100.0%) | 8 (34.8%) |
Disability Class by Sex by Age in Arlington
Disability Class: Hearing Difficulty
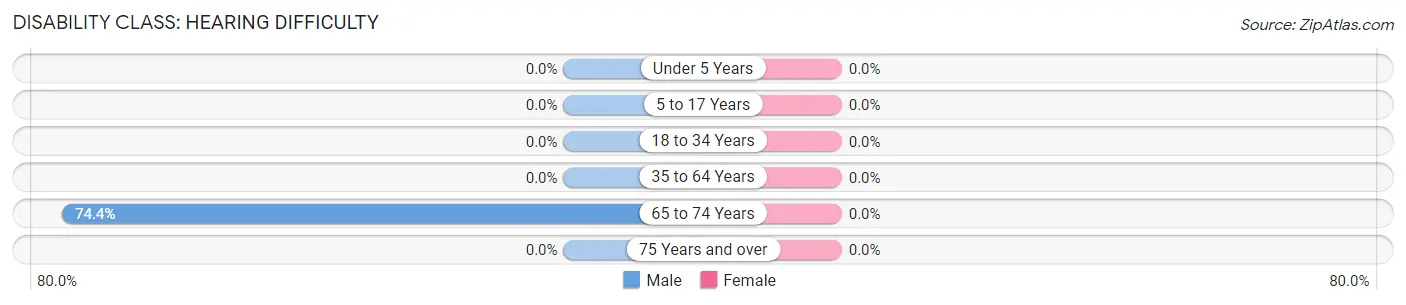
| Age Bracket | Male | Female |
| Under 5 Years | 0 (0.0%) | 0 (0.0%) |
| 5 to 17 Years | 0 (0.0%) | 0 (0.0%) |
| 18 to 34 Years | 0 (0.0%) | 0 (0.0%) |
| 35 to 64 Years | 0 (0.0%) | 0 (0.0%) |
| 65 to 74 Years | 32 (74.4%) | 0 (0.0%) |
| 75 Years and over | 0 (0.0%) | 0 (0.0%) |
Disability Class: Vision Difficulty
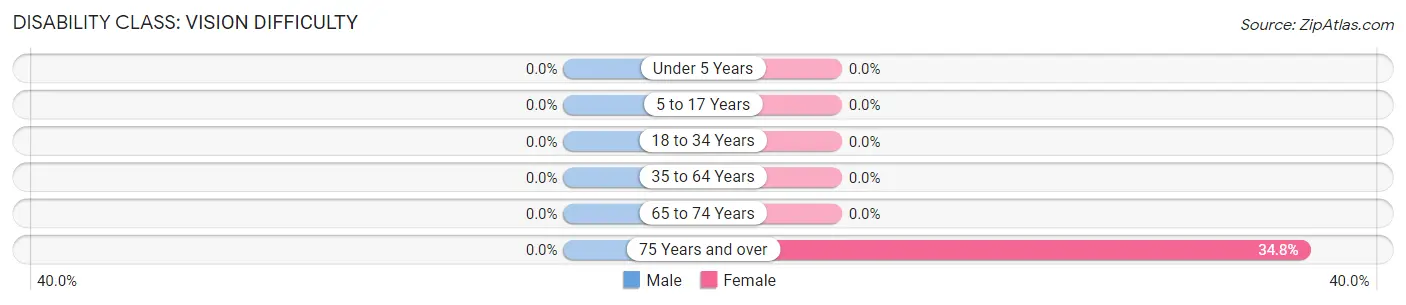
| Age Bracket | Male | Female |
| Under 5 Years | 0 (0.0%) | 0 (0.0%) |
| 5 to 17 Years | 0 (0.0%) | 0 (0.0%) |
| 18 to 34 Years | 0 (0.0%) | 0 (0.0%) |
| 35 to 64 Years | 0 (0.0%) | 0 (0.0%) |
| 65 to 74 Years | 0 (0.0%) | 0 (0.0%) |
| 75 Years and over | 0 (0.0%) | 8 (34.8%) |
Disability Class: Cognitive Difficulty
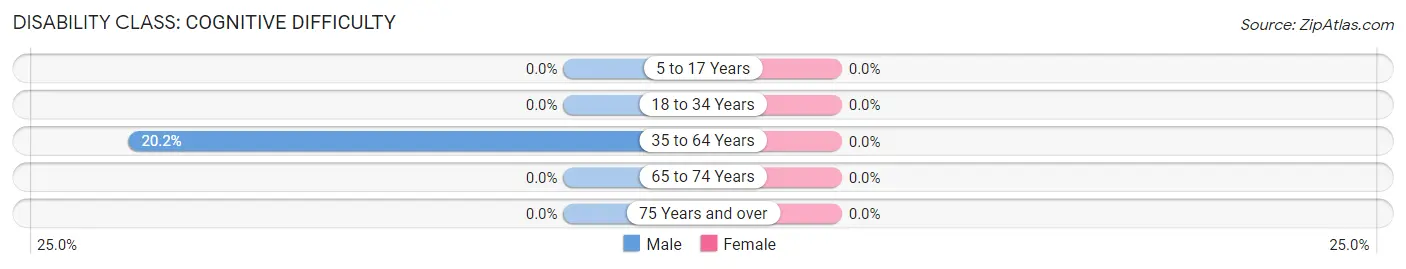
| Age Bracket | Male | Female |
| 5 to 17 Years | 0 (0.0%) | 0 (0.0%) |
| 18 to 34 Years | 0 (0.0%) | 0 (0.0%) |
| 35 to 64 Years | 23 (20.2%) | 0 (0.0%) |
| 65 to 74 Years | 0 (0.0%) | 0 (0.0%) |
| 75 Years and over | 0 (0.0%) | 0 (0.0%) |
Disability Class: Ambulatory Difficulty
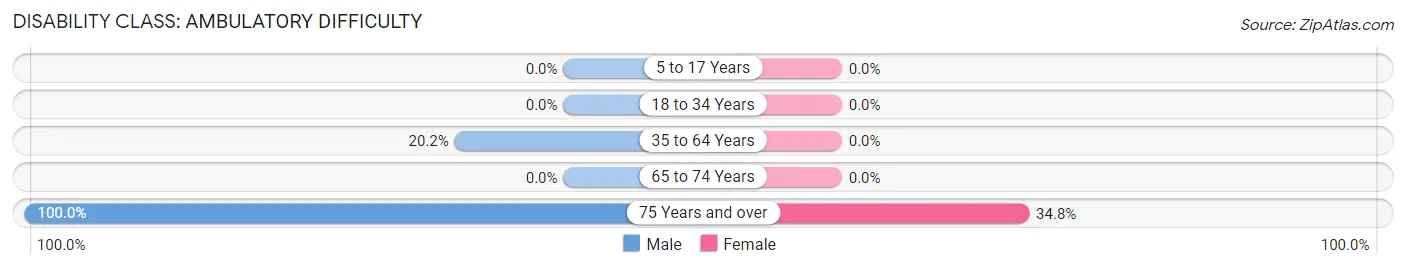
| Age Bracket | Male | Female |
| 5 to 17 Years | 0 (0.0%) | 0 (0.0%) |
| 18 to 34 Years | 0 (0.0%) | 0 (0.0%) |
| 35 to 64 Years | 23 (20.2%) | 0 (0.0%) |
| 65 to 74 Years | 0 (0.0%) | 0 (0.0%) |
| 75 Years and over | 13 (100.0%) | 8 (34.8%) |
Disability Class: Self-Care Difficulty
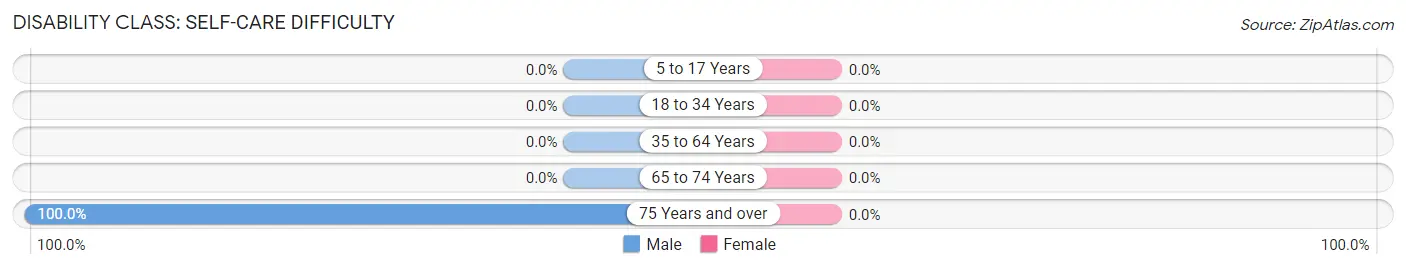
| Age Bracket | Male | Female |
| 5 to 17 Years | 0 (0.0%) | 0 (0.0%) |
| 18 to 34 Years | 0 (0.0%) | 0 (0.0%) |
| 35 to 64 Years | 0 (0.0%) | 0 (0.0%) |
| 65 to 74 Years | 0 (0.0%) | 0 (0.0%) |
| 75 Years and over | 13 (100.0%) | 0 (0.0%) |
Technology Access in Arlington
Computing Device Access in Arlington
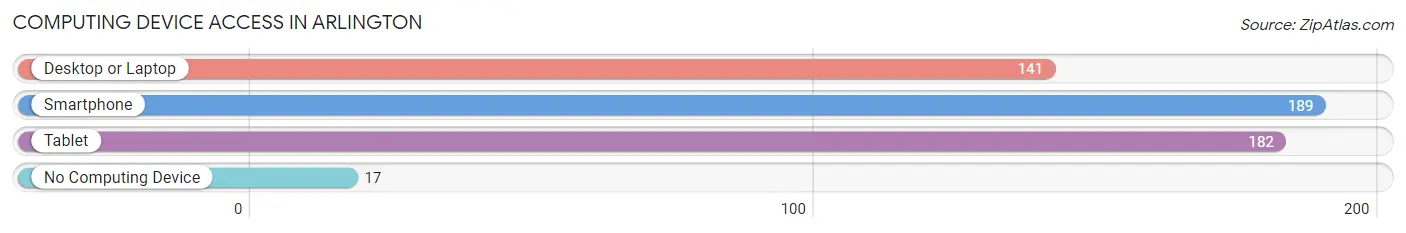
| Device Type | # Households | % Households |
| Desktop or Laptop | 141 | 58.8% |
| Smartphone | 189 | 78.7% |
| Tablet | 182 | 75.8% |
| No Computing Device | 17 | 7.1% |
| Total | 240 | 100.0% |
Internet Access in Arlington
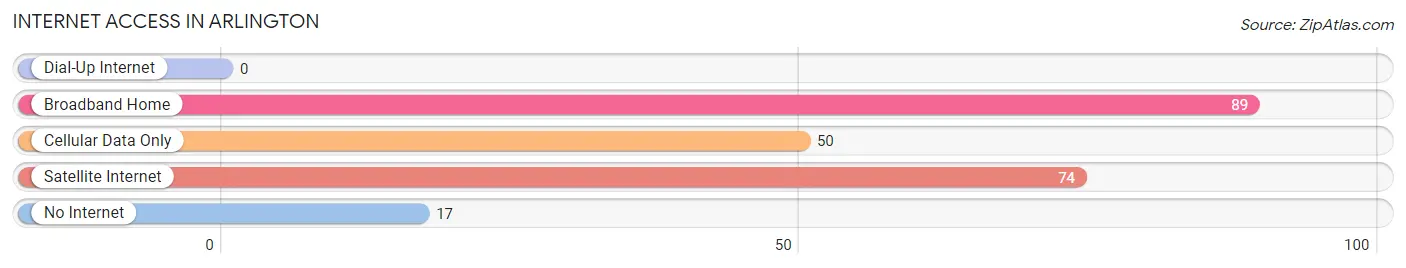
| Internet Type | # Households | % Households |
| Dial-Up Internet | 0 | 0.0% |
| Broadband Home | 89 | 37.1% |
| Cellular Data Only | 50 | 20.8% |
| Satellite Internet | 74 | 30.8% |
| No Internet | 17 | 7.1% |
| Total | 240 | 100.0% |
Arlington Summary
Arlington is a small town located in the northeast corner of Indiana, in the United States. It is part of the Fort Wayne metropolitan area and is situated in the county of Wells. The town has a population of approximately 1,000 people and is located on the banks of the Wabash River.
History
Arlington was founded in 1837 by a group of settlers from Ohio. The town was named after the nearby Arlington Plantation, which was owned by the family of William Henry Harrison, the ninth President of the United States. The town was originally a farming community, but it soon developed into a small industrial center. In 1851, the first railroad line was built through the town, connecting it to Fort Wayne. This allowed the town to become a major shipping center for the surrounding area.
In the late 19th century, Arlington was home to several factories, including a flour mill, a sawmill, a brickyard, and a furniture factory. The town also had a number of stores and businesses, including a bank, a hotel, and a newspaper.
Geography
Arlington is located in the northeast corner of Indiana, in the county of Wells. It is situated on the banks of the Wabash River, which forms the border between Indiana and Ohio. The town is located approximately 25 miles south of Fort Wayne and is part of the Fort Wayne metropolitan area.
The town has a total area of 1.2 square miles, all of which is land. The terrain is mostly flat, with some rolling hills in the surrounding area. The climate is humid continental, with hot summers and cold winters.
Economy
The economy of Arlington is largely based on agriculture and manufacturing. The town is home to several farms, which produce a variety of crops, including corn, soybeans, and wheat. The town also has several factories, which produce a variety of products, including furniture, clothing, and automotive parts.
The town also has a number of small businesses, including restaurants, stores, and service providers. The town is also home to a number of banks and financial institutions.
Demographics
As of the 2010 census, the population of Arlington was 1,000. The racial makeup of the town was 97.2% White, 0.7% African American, 0.3% Native American, 0.3% Asian, and 1.5% from other races. The median household income was $41,250, and the median family income was $50,000.
The town has a large number of elderly residents, with nearly 20% of the population over the age of 65. The town also has a large number of children, with nearly 30% of the population under the age of 18. The town has a low unemployment rate, with only 4.2% of the population unemployed.
Common Questions
What is Per Capita Income in Arlington?
Per Capita income in Arlington is $30,536.
What is the Median Family Income in Arlington?
Median Family Income in Arlington is $53,043.
What is the Median Household income in Arlington?
Median Household Income in Arlington is $54,565.
What is Inequality or Gini Index in Arlington?
Inequality or Gini Index in Arlington is 0.40.
What is the Total Population of Arlington?
Total Population of Arlington is 469.
What is the Total Male Population of Arlington?
Total Male Population of Arlington is 260.
What is the Total Female Population of Arlington?
Total Female Population of Arlington is 209.
What is the Ratio of Males per 100 Females in Arlington?
There are 124.40 Males per 100 Females in Arlington.
What is the Ratio of Females per 100 Males in Arlington?
There are 80.38 Females per 100 Males in Arlington.
What is the Median Population Age in Arlington?
Median Population Age in Arlington is 39.4 Years.
What is the Average Family Size in Arlington
Average Family Size in Arlington is 2.4 People.
What is the Average Household Size in Arlington
Average Household Size in Arlington is 1.9 People.
How Large is the Labor Force in Arlington?
There are 218 People in the Labor Forcein in Arlington.
What is the Percentage of People in the Labor Force in Arlington?
61.8% of People are in the Labor Force in Arlington.
What is the Unemployment Rate in Arlington?
Unemployment Rate in Arlington is 16.5%.