Zip Codes with the Highest Percentage of Population Employed in Accommodation & Food Services in Evansville, IN
RELATED REPORTS & OPTIONS
Accommodation & Food Services
Evansville
Compare Zip Codes
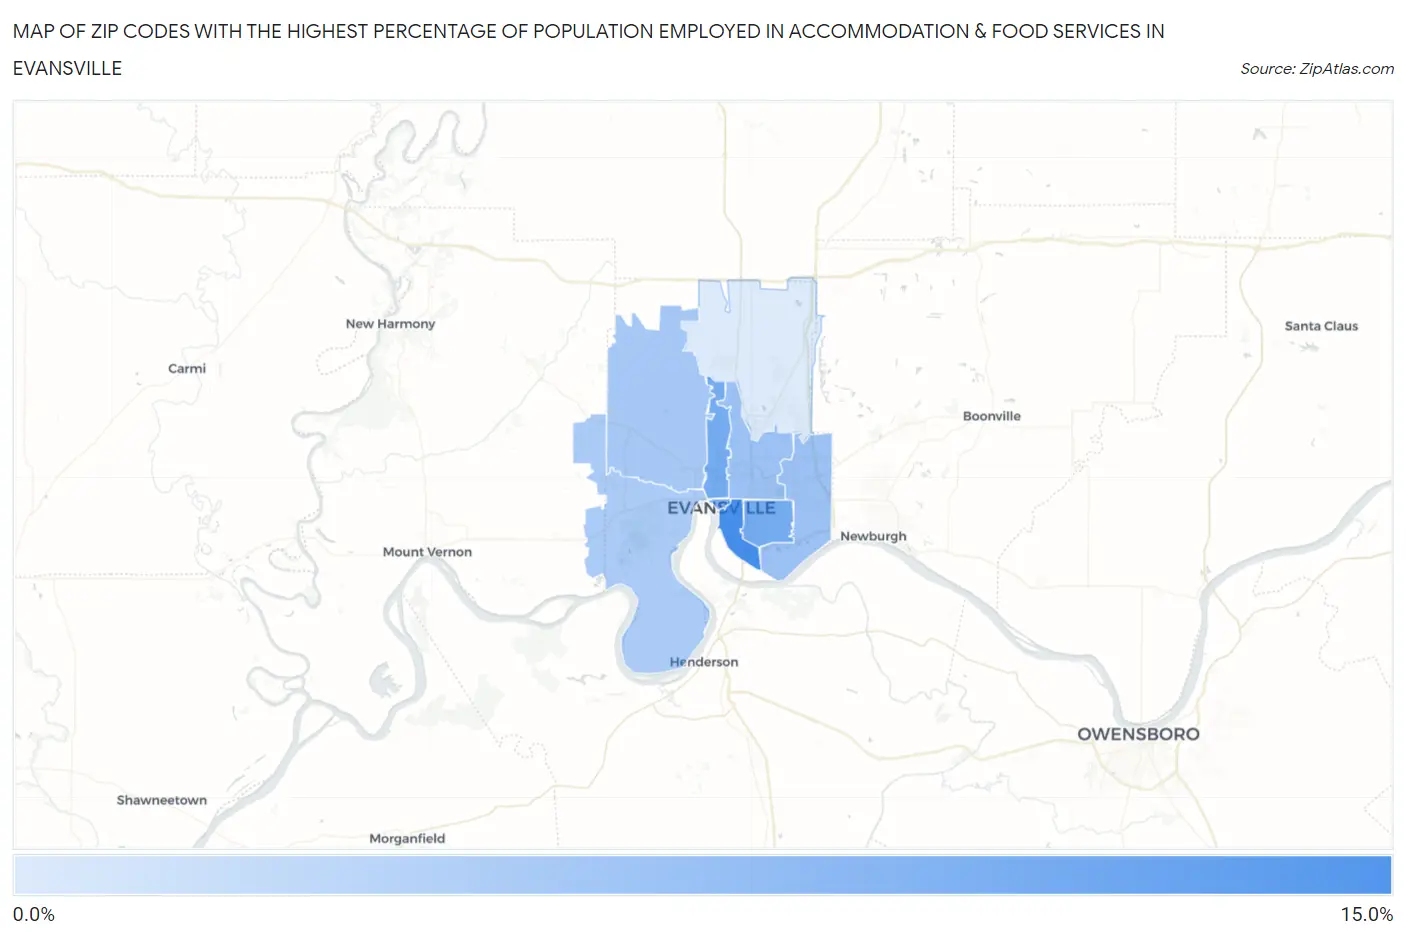
Map of Zip Codes with the Highest Percentage of Population Employed in Accommodation & Food Services in Evansville
4.4%
13.7%
Zip Codes with the Highest Percentage of Population Employed in Accommodation & Food Services in Evansville, IN
| Zip Code | % Employed | vs State | vs National | |
| 1. | 47713 | 13.7% | 6.4%(+7.22)#30 | 6.9%(+6.78)#2,069 |
| 2. | 47714 | 10.8% | 6.4%(+4.31)#74 | 6.9%(+3.87)#3,756 |
| 3. | 47710 | 10.7% | 6.4%(+4.30)#75 | 6.9%(+3.86)#3,764 |
| 4. | 47708 | 10.2% | 6.4%(+3.77)#87 | 6.9%(+3.32)#4,297 |
| 5. | 47715 | 8.5% | 6.4%(+2.03)#140 | 6.9%(+1.59)#6,870 |
| 6. | 47711 | 8.4% | 6.4%(+2.00)#142 | 6.9%(+1.56)#6,923 |
| 7. | 47720 | 7.7% | 6.4%(+1.29)#180 | 6.9%(+0.850)#8,415 |
| 8. | 47712 | 7.5% | 6.4%(+1.05)#198 | 6.9%(+0.608)#9,019 |
| 9. | 47725 | 4.4% | 6.4%(-2.00)#452 | 6.9%(-2.45)#18,718 |
1
Common Questions
What are the Top 5 Zip Codes with the Highest Percentage of Population Employed in Accommodation & Food Services in Evansville, IN?
Top 5 Zip Codes with the Highest Percentage of Population Employed in Accommodation & Food Services in Evansville, IN are:
What zip code has the Highest Percentage of Population Employed in Accommodation & Food Services in Evansville, IN?
47713 has the Highest Percentage of Population Employed in Accommodation & Food Services in Evansville, IN with 13.7%.
What is the Percentage of Population Employed in Accommodation & Food Services in Evansville, IN?
Percentage of Population Employed in Accommodation & Food Services in Evansville is 10.6%.
What is the Percentage of Population Employed in Accommodation & Food Services in Indiana?
Percentage of Population Employed in Accommodation & Food Services in Indiana is 6.4%.
What is the Percentage of Population Employed in Accommodation & Food Services in the United States?
Percentage of Population Employed in Accommodation & Food Services in the United States is 6.9%.