Zip Codes with the Highest Percentage of Population Employed in Accommodation & Food Services in Hammond, IN
RELATED REPORTS & OPTIONS
Accommodation & Food Services
Hammond
Compare Zip Codes
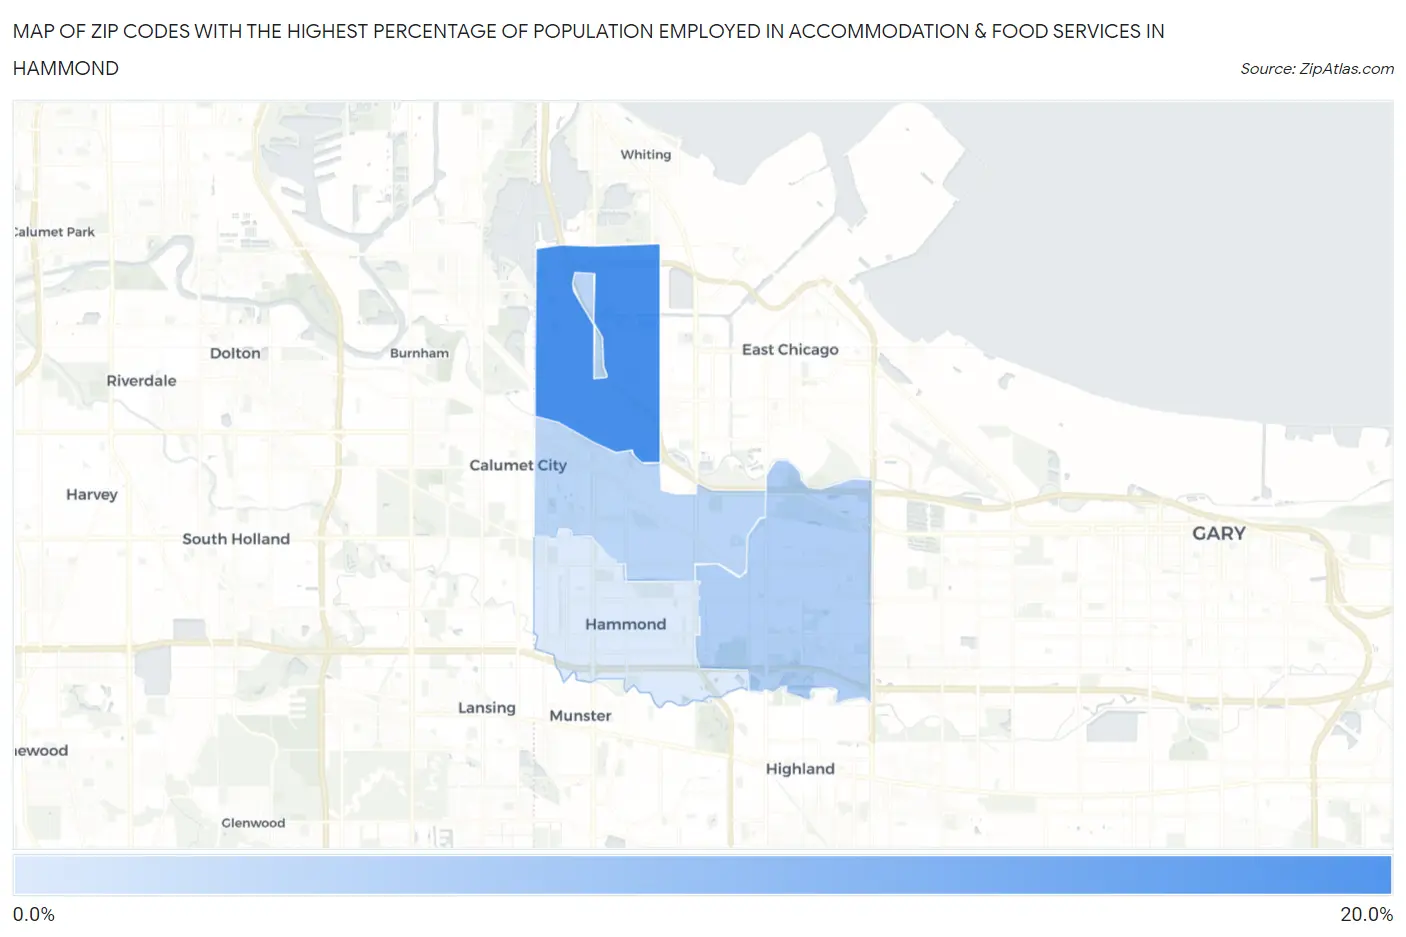
Map of Zip Codes with the Highest Percentage of Population Employed in Accommodation & Food Services in Hammond
6.0%
15.7%
Zip Codes with the Highest Percentage of Population Employed in Accommodation & Food Services in Hammond, IN
| Zip Code | % Employed | vs State | vs National | |
| 1. | 46327 | 15.7% | 6.4%(+9.29)#21 | 6.9%(+8.84)#1,512 |
| 2. | 46323 | 8.8% | 6.4%(+2.34)#132 | 6.9%(+1.90)#6,313 |
| 3. | 46320 | 8.2% | 6.4%(+1.74)#158 | 6.9%(+1.30)#7,455 |
| 4. | 46324 | 6.0% | 6.4%(-0.431)#302 | 6.9%(-0.873)#13,424 |
1
Common Questions
What are the Top 3 Zip Codes with the Highest Percentage of Population Employed in Accommodation & Food Services in Hammond, IN?
Top 3 Zip Codes with the Highest Percentage of Population Employed in Accommodation & Food Services in Hammond, IN are:
What zip code has the Highest Percentage of Population Employed in Accommodation & Food Services in Hammond, IN?
46327 has the Highest Percentage of Population Employed in Accommodation & Food Services in Hammond, IN with 15.7%.
What is the Percentage of Population Employed in Accommodation & Food Services in Hammond, IN?
Percentage of Population Employed in Accommodation & Food Services in Hammond is 8.4%.
What is the Percentage of Population Employed in Accommodation & Food Services in Indiana?
Percentage of Population Employed in Accommodation & Food Services in Indiana is 6.4%.
What is the Percentage of Population Employed in Accommodation & Food Services in the United States?
Percentage of Population Employed in Accommodation & Food Services in the United States is 6.9%.