St Benedict, IA Map & Demographics
St Benedict Map
St Benedict Overview
$46,352
PER CAPITA INCOME
$81,563
AVG HOUSEHOLD INCOME
0.23
INEQUALITY / GINI INDEX
44
TOTAL POPULATION
33
MALE POPULATION
11
FEMALE POPULATION
300.00
MALES / 100 FEMALES
33.33
FEMALES / 100 MALES
43.6
MEDIAN AGE
2.5
AVG FAMILY SIZE
1.5
AVG HOUSEHOLD SIZE
36
LABOR FORCE [ PEOPLE ]
81.8%
PERCENT IN LABOR FORCE
25.0%
UNEMPLOYMENT RATE
Income in St Benedict
Income Overview in St Benedict
| Characteristic | Number | Measure |
| Per Capita Income | 44 | $46,352 |
| Median Family Income | 8 | $0 |
| Mean Family Income | 8 | $0 |
| Median Household Income | 29 | $81,563 |
| Mean Household Income | 29 | $77,917 |
| Income Deficit | 8 | $0 |
| Wage / Income Gap (%) | 44 | 0.00% |
| Wage / Income Gap ($) | 44 | 100.00¢ per $1 |
| Gini / Inequality Index | 44 | 0.23 |
Earnings by Sex in St Benedict
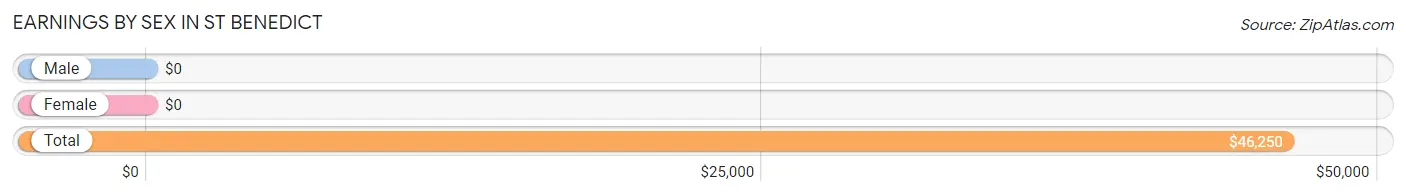
| Sex | Number | Average Earnings |
| Male | 29 (72.5%) | $0 |
| Female | 11 (27.5%) | $0 |
| Total | 40 (100.0%) | $46,250 |
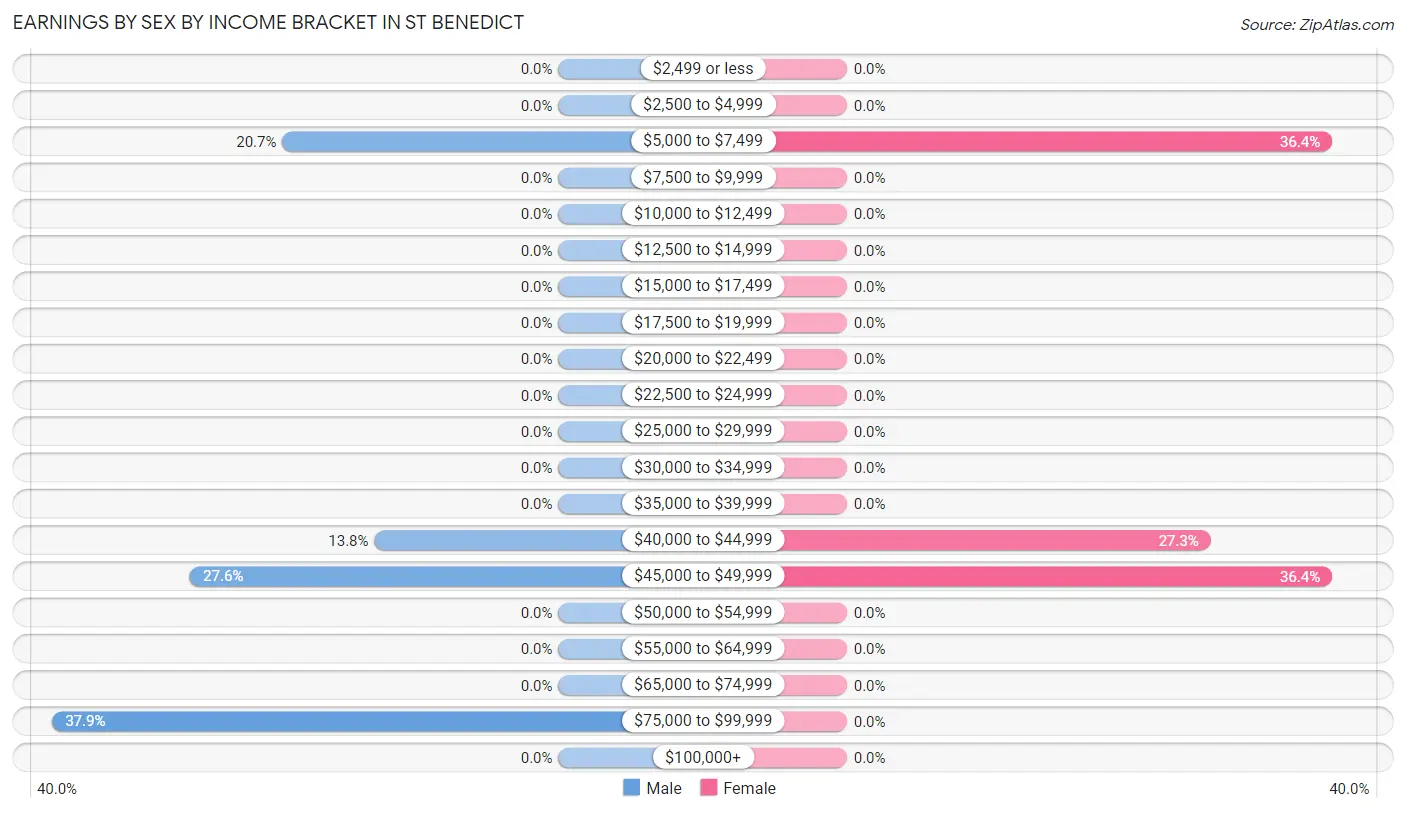
Earnings by Sex by Income Bracket in St Benedict
The most common earnings brackets in St Benedict are $75,000 to $99,999 for men (11 | 37.9%) and $5,000 to $7,499 for women (4 | 36.4%).
| Income | Male | Female |
| $2,499 or less | 0 (0.0%) | 0 (0.0%) |
| $2,500 to $4,999 | 0 (0.0%) | 0 (0.0%) |
| $5,000 to $7,499 | 6 (20.7%) | 4 (36.4%) |
| $7,500 to $9,999 | 0 (0.0%) | 0 (0.0%) |
| $10,000 to $12,499 | 0 (0.0%) | 0 (0.0%) |
| $12,500 to $14,999 | 0 (0.0%) | 0 (0.0%) |
| $15,000 to $17,499 | 0 (0.0%) | 0 (0.0%) |
| $17,500 to $19,999 | 0 (0.0%) | 0 (0.0%) |
| $20,000 to $22,499 | 0 (0.0%) | 0 (0.0%) |
| $22,500 to $24,999 | 0 (0.0%) | 0 (0.0%) |
| $25,000 to $29,999 | 0 (0.0%) | 0 (0.0%) |
| $30,000 to $34,999 | 0 (0.0%) | 0 (0.0%) |
| $35,000 to $39,999 | 0 (0.0%) | 0 (0.0%) |
| $40,000 to $44,999 | 4 (13.8%) | 3 (27.3%) |
| $45,000 to $49,999 | 8 (27.6%) | 4 (36.4%) |
| $50,000 to $54,999 | 0 (0.0%) | 0 (0.0%) |
| $55,000 to $64,999 | 0 (0.0%) | 0 (0.0%) |
| $65,000 to $74,999 | 0 (0.0%) | 0 (0.0%) |
| $75,000 to $99,999 | 11 (37.9%) | 0 (0.0%) |
| $100,000+ | 0 (0.0%) | 0 (0.0%) |
| Total | 29 (100.0%) | 11 (100.0%) |
Earnings by Sex by Educational Attainment in St Benedict
| Educational Attainment | Male Income | Female Income |
| Less than High School | - | - |
| High School Diploma | - | - |
| College or Associate's Degree | - | - |
| Bachelor's Degree | - | - |
| Graduate Degree | - | - |
| Total | - | - |
Family Income in St Benedict
Family Income Brackets in St Benedict
According to the St Benedict family income data, there are 4 families falling into the $25,000 to $34,999 income range, which is the most common income bracket and makes up 50.0% of all families.
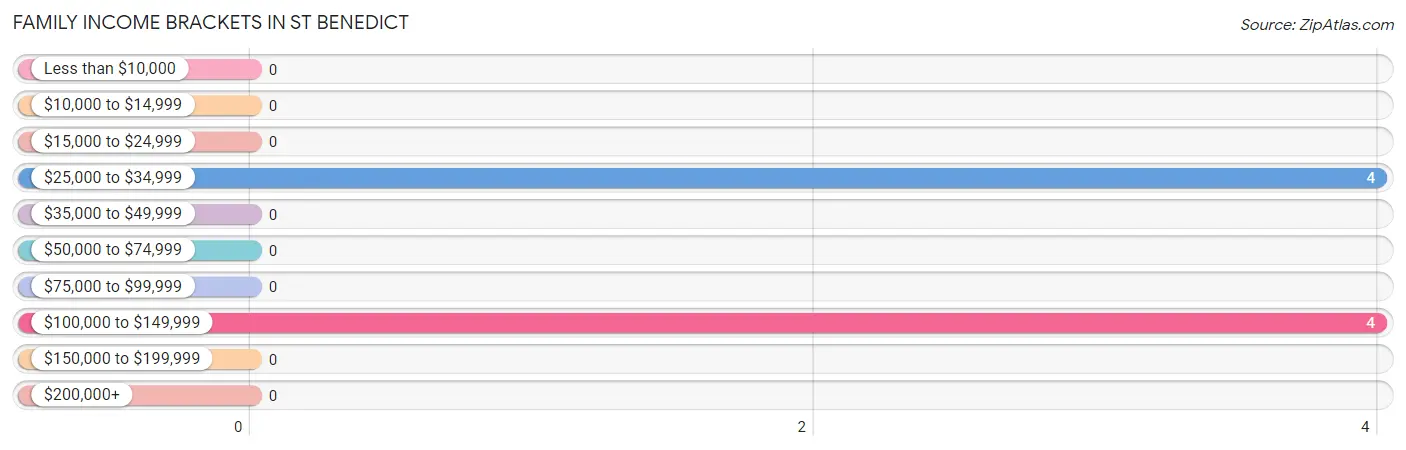
| Income Bracket | # Families | % Families |
| Less than $10,000 | 0 | 0.0% |
| $10,000 to $14,999 | 0 | 0.0% |
| $15,000 to $24,999 | 0 | 0.0% |
| $25,000 to $34,999 | 4 | 50.0% |
| $35,000 to $49,999 | 0 | 0.0% |
| $50,000 to $74,999 | 0 | 0.0% |
| $75,000 to $99,999 | 0 | 0.0% |
| $100,000 to $149,999 | 4 | 50.0% |
| $150,000 to $199,999 | 0 | 0.0% |
| $200,000+ | 0 | 0.0% |
Family Income by Famaliy Size in St Benedict
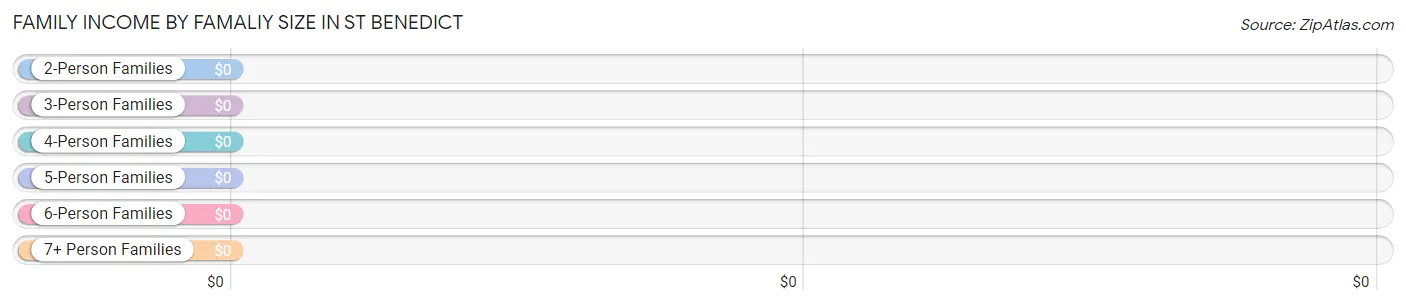
| Income Bracket | # Families | Median Income |
| 2-Person Families | 4 (50.0%) | $0 |
| 3-Person Families | 4 (50.0%) | $0 |
| 4-Person Families | 0 (0.0%) | $0 |
| 5-Person Families | 0 (0.0%) | $0 |
| 6-Person Families | 0 (0.0%) | $0 |
| 7+ Person Families | 0 (0.0%) | $0 |
| Total | 8 (100.0%) | $0 |
Family Income by Number of Earners in St Benedict
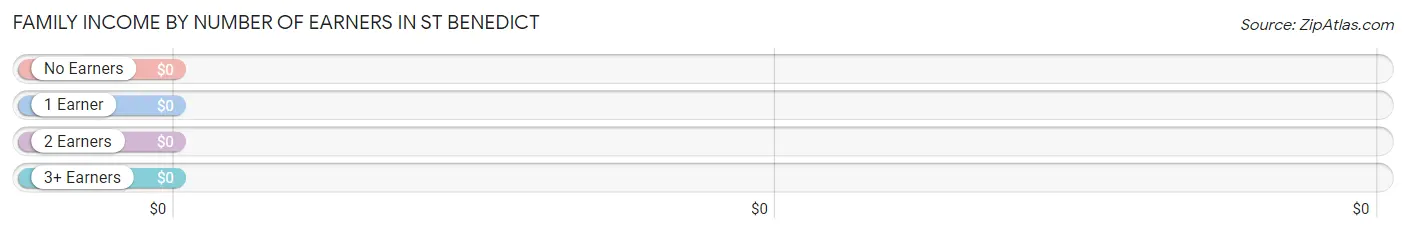
| Number of Earners | # Families | Median Income |
| No Earners | 0 (0.0%) | $0 |
| 1 Earner | 0 (0.0%) | $0 |
| 2 Earners | 8 (100.0%) | $0 |
| 3+ Earners | 0 (0.0%) | $0 |
| Total | 8 (100.0%) | $0 |
Household Income in St Benedict
Household Income Brackets in St Benedict
With 13 households falling in the category, the $75,000 to $99,999 income range is the most frequent in St Benedict, accounting for 44.8% of all households.
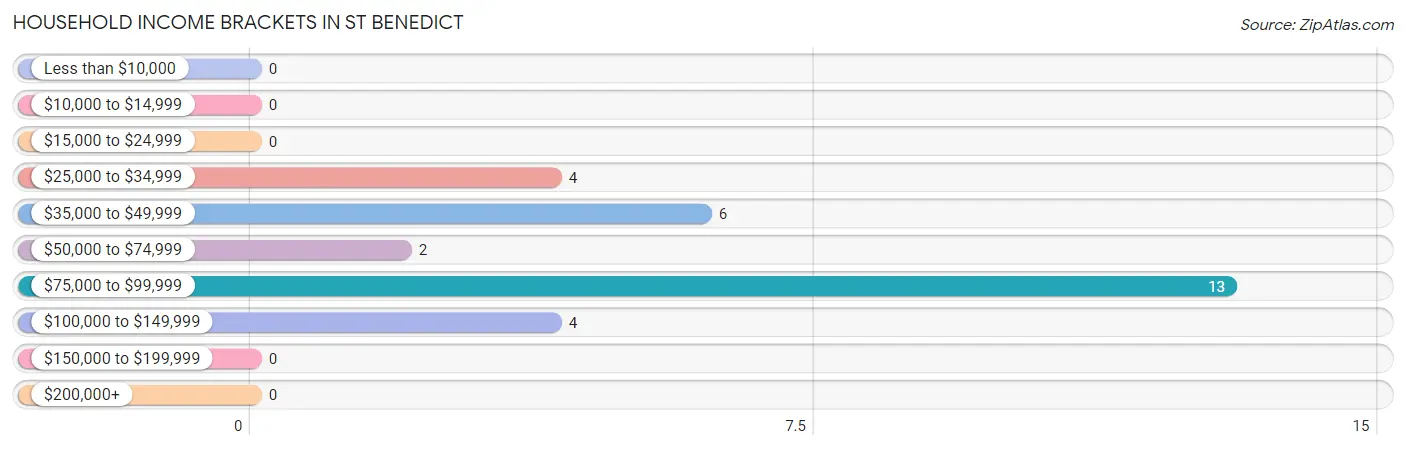
| Income Bracket | # Households | % Households |
| Less than $10,000 | 0 | 0.0% |
| $10,000 to $14,999 | 0 | 0.0% |
| $15,000 to $24,999 | 0 | 0.0% |
| $25,000 to $34,999 | 4 | 13.8% |
| $35,000 to $49,999 | 6 | 20.7% |
| $50,000 to $74,999 | 2 | 6.9% |
| $75,000 to $99,999 | 13 | 44.8% |
| $100,000 to $149,999 | 4 | 13.8% |
| $150,000 to $199,999 | 0 | 0.0% |
| $200,000+ | 0 | 0.0% |
Household Income by Householder Age in St Benedict
| Income Bracket | # Households | Median Income |
| 15 to 24 Years | 0 (0.0%) | $0 |
| 25 to 44 Years | 13 (44.8%) | $0 |
| 45 to 64 Years | 12 (41.4%) | $0 |
| 65+ Years | 4 (13.8%) | $0 |
| Total | 29 (100.0%) | $81,563 |
Poverty in St Benedict
Income Below Poverty by Sex and Age in St Benedict
| Age Bracket | Male | Female |
| Under 5 Years | 0 (0.0%) | 0 (0.0%) |
| 5 Years | 0 (0.0%) | 0 (0.0%) |
| 6 to 11 Years | 0 (0.0%) | 0 (0.0%) |
| 12 to 14 Years | 0 (0.0%) | 0 (0.0%) |
| 15 Years | 0 (0.0%) | 0 (0.0%) |
| 16 and 17 Years | 0 (0.0%) | 0 (0.0%) |
| 18 to 24 Years | 0 (0.0%) | 0 (0.0%) |
| 25 to 34 Years | 0 (0.0%) | 0 (0.0%) |
| 35 to 44 Years | 0 (0.0%) | 0 (0.0%) |
| 45 to 54 Years | 0 (0.0%) | 0 (0.0%) |
| 55 to 64 Years | 0 (0.0%) | 0 (0.0%) |
| 65 to 74 Years | 0 (0.0%) | 0 (0.0%) |
| 75 Years and over | 0 (0.0%) | 0 (0.0%) |
| Total | 0 (0.0%) | 0 (0.0%) |
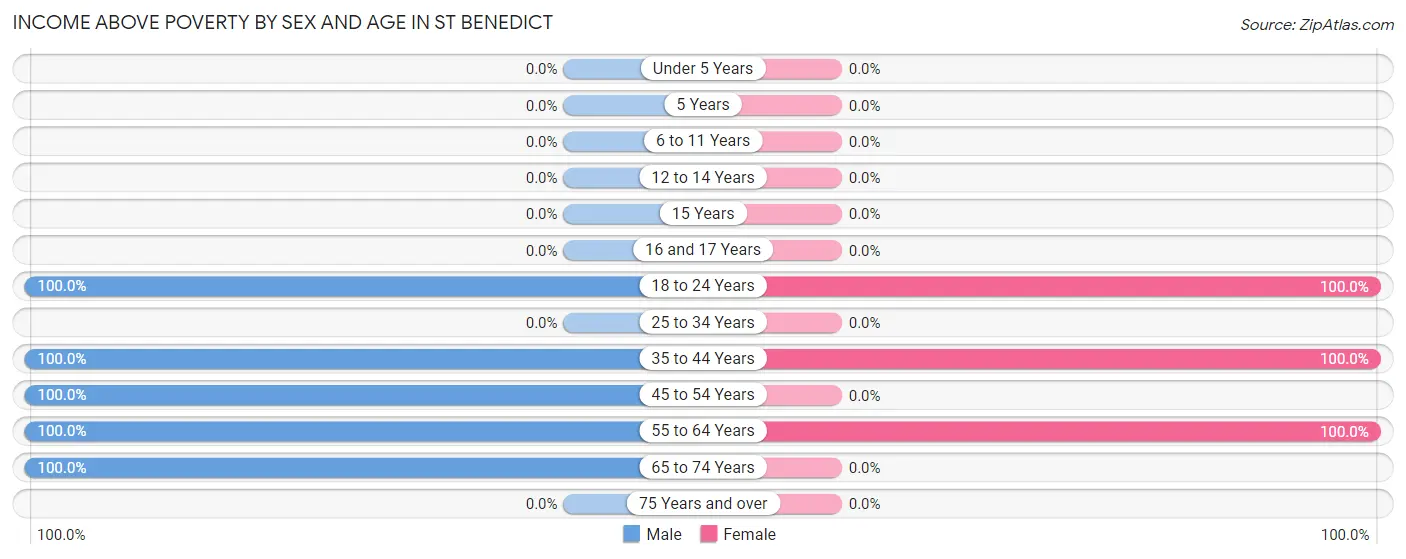
Income Above Poverty by Sex and Age in St Benedict
According to the poverty statistics in St Benedict, males aged 18 to 24 years and females aged 18 to 24 years are the age groups that are most secure financially, with 100.0% of males and 100.0% of females in these age groups living above the poverty line.
| Age Bracket | Male | Female |
| Under 5 Years | 0 (0.0%) | 0 (0.0%) |
| 5 Years | 0 (0.0%) | 0 (0.0%) |
| 6 to 11 Years | 0 (0.0%) | 0 (0.0%) |
| 12 to 14 Years | 0 (0.0%) | 0 (0.0%) |
| 15 Years | 0 (0.0%) | 0 (0.0%) |
| 16 and 17 Years | 0 (0.0%) | 0 (0.0%) |
| 18 to 24 Years | 6 (100.0%) | 4 (100.0%) |
| 25 to 34 Years | 0 (0.0%) | 0 (0.0%) |
| 35 to 44 Years | 13 (100.0%) | 3 (100.0%) |
| 45 to 54 Years | 2 (100.0%) | 0 (0.0%) |
| 55 to 64 Years | 8 (100.0%) | 4 (100.0%) |
| 65 to 74 Years | 4 (100.0%) | 0 (0.0%) |
| 75 Years and over | 0 (0.0%) | 0 (0.0%) |
| Total | 33 (100.0%) | 11 (100.0%) |
Income Below Poverty Among Married-Couple Families in St Benedict
| Children | Above Poverty | Below Poverty |
| No Children | 4 (100.0%) | 0 (0.0%) |
| 1 or 2 Children | 0 (0.0%) | 0 (0.0%) |
| 3 or 4 Children | 0 (0.0%) | 0 (0.0%) |
| 5 or more Children | 0 (0.0%) | 0 (0.0%) |
| Total | 4 (100.0%) | 0 (0.0%) |
Income Below Poverty Among Single-Parent Households in St Benedict
| Children | Single Father | Single Mother |
| No Children | 0 (0.0%) | 0 (0.0%) |
| 1 or 2 Children | 0 (0.0%) | 0 (0.0%) |
| 3 or 4 Children | 0 (0.0%) | 0 (0.0%) |
| 5 or more Children | 0 (0.0%) | 0 (0.0%) |
| Total | 0 (0.0%) | 0 (0.0%) |
Income Below Poverty Among Married-Couple vs Single-Parent Households in St Benedict
| Children | Married-Couple Families | Single-Parent Households |
| No Children | 0 (0.0%) | 0 (0.0%) |
| 1 or 2 Children | 0 (0.0%) | 0 (0.0%) |
| 3 or 4 Children | 0 (0.0%) | 0 (0.0%) |
| 5 or more Children | 0 (0.0%) | 0 (0.0%) |
| Total | 0 (0.0%) | 0 (0.0%) |
Race in St Benedict
The most populous races in St Benedict are , and White / Caucasian (44 | 100.0%).
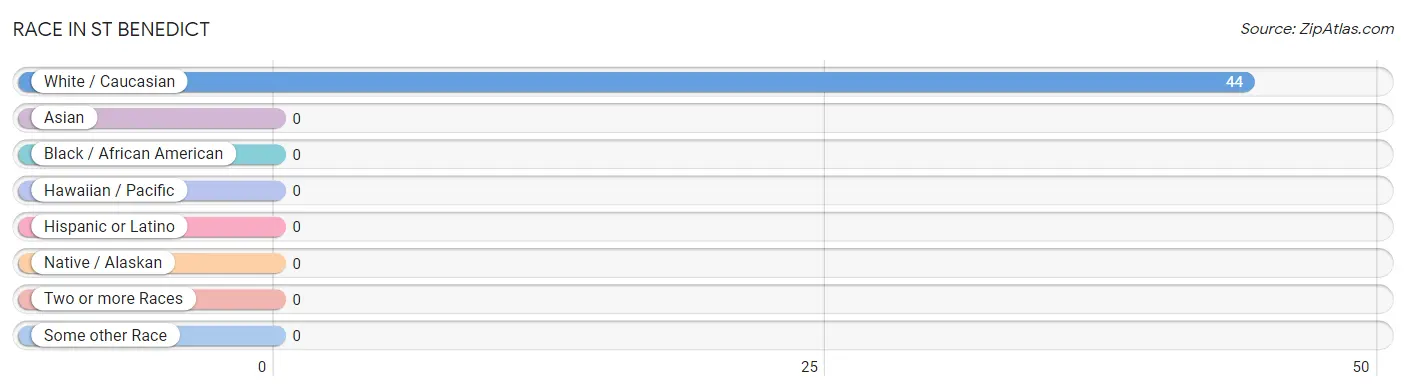
| Race | # Population | % Population |
| Asian | 0 | 0.0% |
| Black / African American | 0 | 0.0% |
| Hawaiian / Pacific | 0 | 0.0% |
| Hispanic or Latino | 0 | 0.0% |
| Native / Alaskan | 0 | 0.0% |
| White / Caucasian | 44 | 100.0% |
| Two or more Races | 0 | 0.0% |
| Some other Race | 0 | 0.0% |
| Total | 44 | 100.0% |
Ancestry in St Benedict
The most populous ancestries reported in St Benedict are German (17 | 38.6%), English (10 | 22.7%), European (10 | 22.7%), American (6 | 13.6%), and Dutch (6 | 13.6%), together accounting for 111.4% of all St Benedict residents.
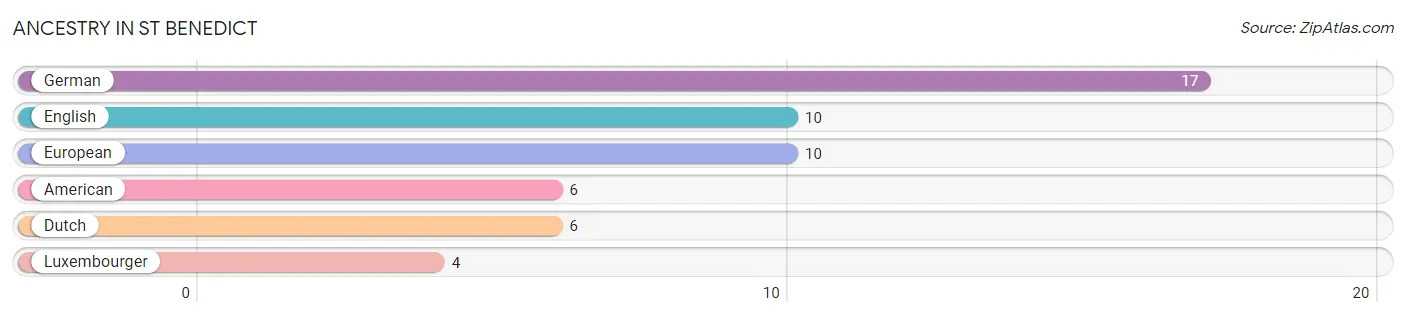
| Ancestry | # Population | % Population |
| American | 6 | 13.6% |
| Dutch | 6 | 13.6% |
| English | 10 | 22.7% |
| European | 10 | 22.7% |
| German | 17 | 38.6% |
| Luxembourger | 4 | 9.1% | View All 6 Rows |
Immigrants in St Benedict

| Immigration Origin | # Population | % Population | View All 0 Rows |
Sex and Age in St Benedict
Sex and Age in St Benedict
The most populous age groups in St Benedict are 40 to 44 Years (9 | 27.3%) for men and 20 to 24 Years (4 | 36.4%) for women.
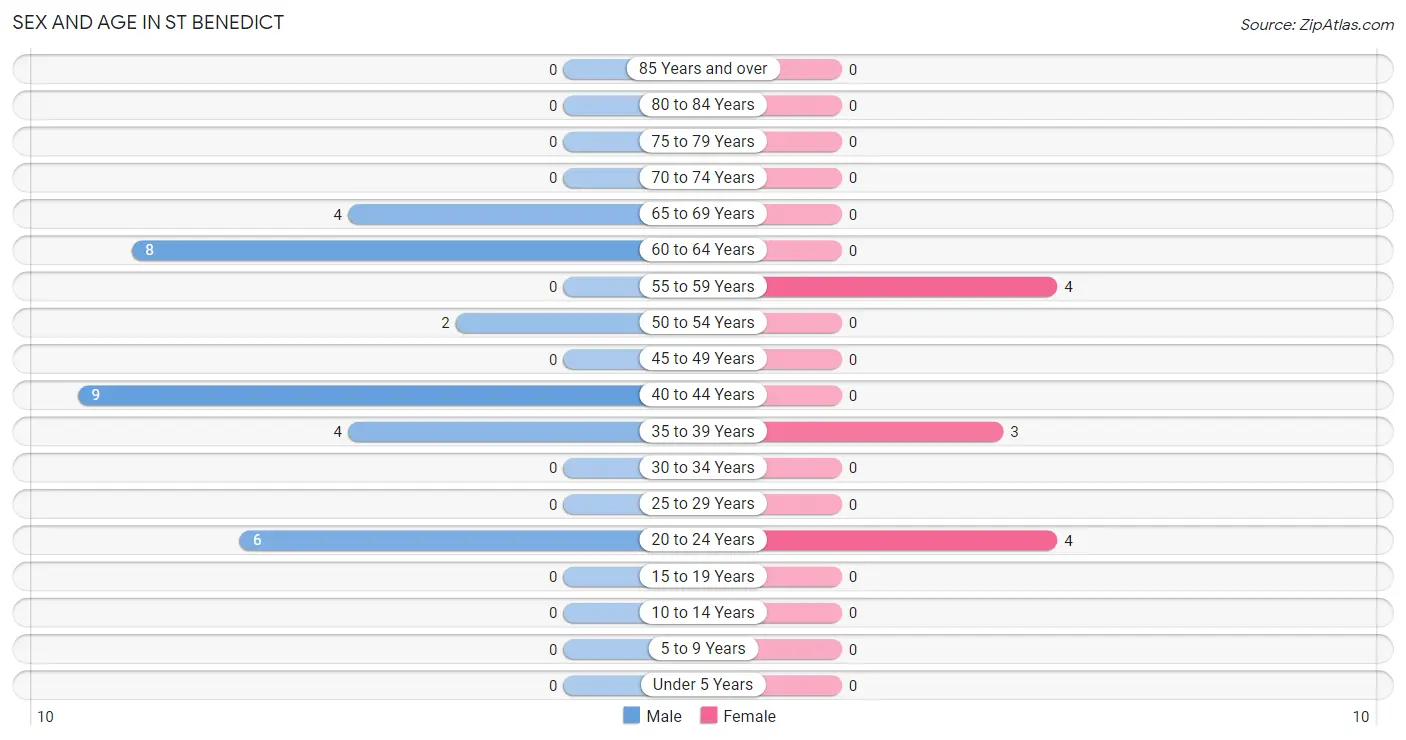
| Age Bracket | Male | Female |
| Under 5 Years | 0 (0.0%) | 0 (0.0%) |
| 5 to 9 Years | 0 (0.0%) | 0 (0.0%) |
| 10 to 14 Years | 0 (0.0%) | 0 (0.0%) |
| 15 to 19 Years | 0 (0.0%) | 0 (0.0%) |
| 20 to 24 Years | 6 (18.2%) | 4 (36.4%) |
| 25 to 29 Years | 0 (0.0%) | 0 (0.0%) |
| 30 to 34 Years | 0 (0.0%) | 0 (0.0%) |
| 35 to 39 Years | 4 (12.1%) | 3 (27.3%) |
| 40 to 44 Years | 9 (27.3%) | 0 (0.0%) |
| 45 to 49 Years | 0 (0.0%) | 0 (0.0%) |
| 50 to 54 Years | 2 (6.1%) | 0 (0.0%) |
| 55 to 59 Years | 0 (0.0%) | 4 (36.4%) |
| 60 to 64 Years | 8 (24.2%) | 0 (0.0%) |
| 65 to 69 Years | 4 (12.1%) | 0 (0.0%) |
| 70 to 74 Years | 0 (0.0%) | 0 (0.0%) |
| 75 to 79 Years | 0 (0.0%) | 0 (0.0%) |
| 80 to 84 Years | 0 (0.0%) | 0 (0.0%) |
| 85 Years and over | 0 (0.0%) | 0 (0.0%) |
| Total | 33 (100.0%) | 11 (100.0%) |
Families and Households in St Benedict
Median Family Size in St Benedict
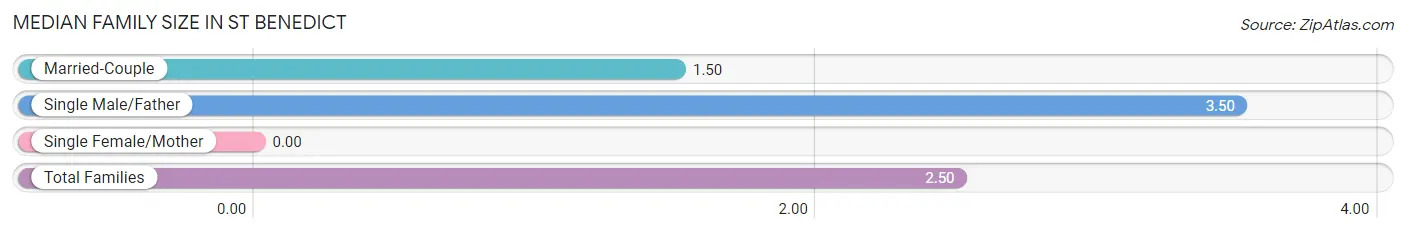
| Family Type | # Families | Family Size |
| Married-Couple | 4 (50.0%) | 1.50 |
| Single Male/Father | 4 (50.0%) | 3.50 |
| Single Female/Mother | 0 (0.0%) | - |
| Total Families | 8 (100.0%) | 2.50 |
Median Household Size in St Benedict
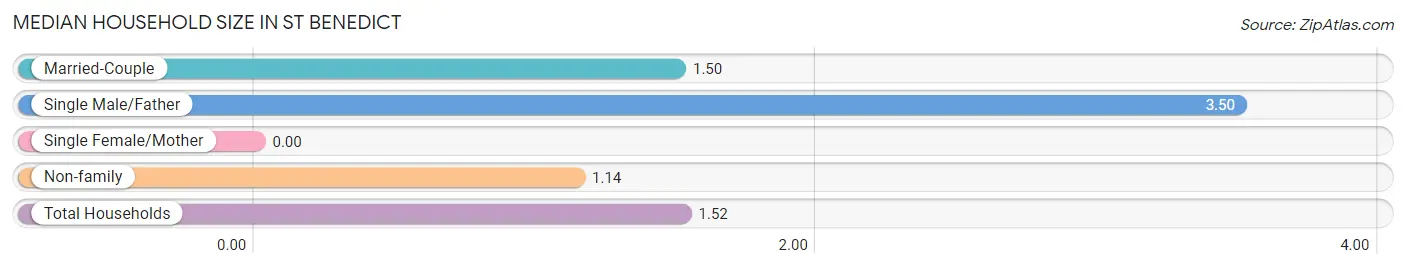
| Household Type | # Households | Household Size |
| Married-Couple | 4 (13.8%) | 1.50 |
| Single Male/Father | 4 (13.8%) | 3.50 |
| Single Female/Mother | 0 (0.0%) | - |
| Non-family | 21 (72.4%) | 1.14 |
| Total Households | 29 (100.0%) | 1.52 |
Household Size by Marriage Status in St Benedict
Out of a total of 29 households in St Benedict, 8 (27.6%) are family households, while 21 (72.4%) are nonfamily households. The most numerous type of family households are 2-person households, comprising 4, and the most common type of nonfamily households are 1-person households, comprising 17.
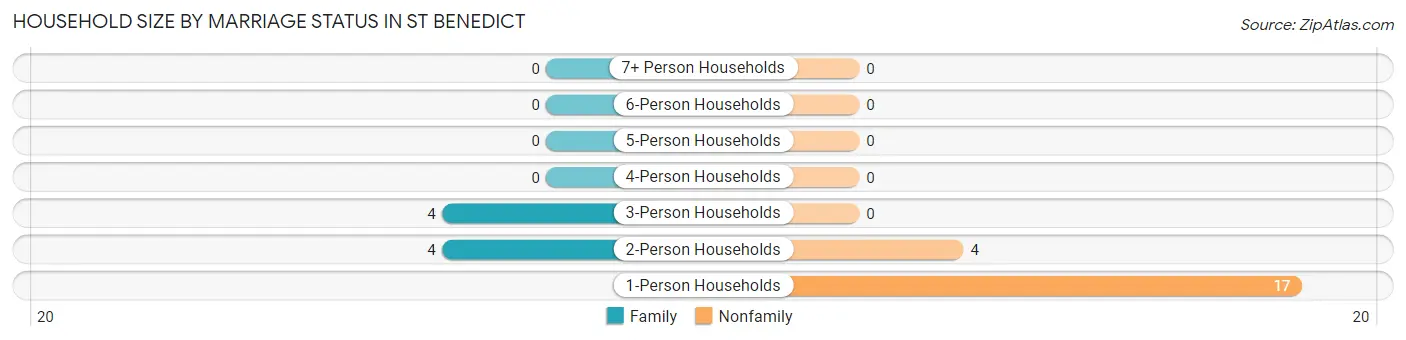
| Household Size | Family Households | Nonfamily Households |
| 1-Person Households | - | 17 (58.6%) |
| 2-Person Households | 4 (13.8%) | 4 (13.8%) |
| 3-Person Households | 4 (13.8%) | 0 (0.0%) |
| 4-Person Households | 0 (0.0%) | 0 (0.0%) |
| 5-Person Households | 0 (0.0%) | 0 (0.0%) |
| 6-Person Households | 0 (0.0%) | 0 (0.0%) |
| 7+ Person Households | 0 (0.0%) | 0 (0.0%) |
| Total | 8 (27.6%) | 21 (72.4%) |
Female Fertility in St Benedict
Fertility by Age in St Benedict
| Age Bracket | Women with Births | Births / 1,000 Women |
| 15 to 19 years | 0 (0.0%) | 0.0 |
| 20 to 34 years | 0 (0.0%) | 0.0 |
| 35 to 50 years | 0 (0.0%) | 0.0 |
| Total | 0 (0.0%) | 0.0 |
Fertility by Age by Marriage Status in St Benedict
| Age Bracket | Married | Unmarried |
| 15 to 19 years | 0 (0.0%) | 0 (0.0%) |
| 20 to 34 years | 0 (0.0%) | 0 (0.0%) |
| 35 to 50 years | 0 (0.0%) | 0 (0.0%) |
| Total | 0 (0.0%) | 0 (0.0%) |
Fertility by Education in St Benedict
| Educational Attainment | Women with Births | Births / 1,000 Women |
| Less than High School | 0 (0.0%) | 0.0 |
| High School Diploma | 0 (0.0%) | 0.0 |
| College or Associate's Degree | 0 (0.0%) | 0.0 |
| Bachelor's Degree | 0 (0.0%) | 0.0 |
| Graduate Degree | 0 (0.0%) | 0.0 |
| Total | 0 (0.0%) | 0.0 |
Fertility by Education by Marriage Status in St Benedict
| Educational Attainment | Married | Unmarried |
| Less than High School | 0 (0.0%) | 0 (0.0%) |
| High School Diploma | 0 (0.0%) | 0 (0.0%) |
| College or Associate's Degree | 0 (0.0%) | 0 (0.0%) |
| Bachelor's Degree | 0 (0.0%) | 0 (0.0%) |
| Graduate Degree | 0 (0.0%) | 0 (0.0%) |
| Total | 0 (0.0%) | 0 (0.0%) |
Employment Characteristics in St Benedict
Employment by Class of Employer in St Benedict
Among the 27 employed individuals in St Benedict, private company employees (15 | 55.6%), self-employed (not incorporated) (8 | 29.6%), and state government employees (4 | 14.8%) make up the most common classes of employment.
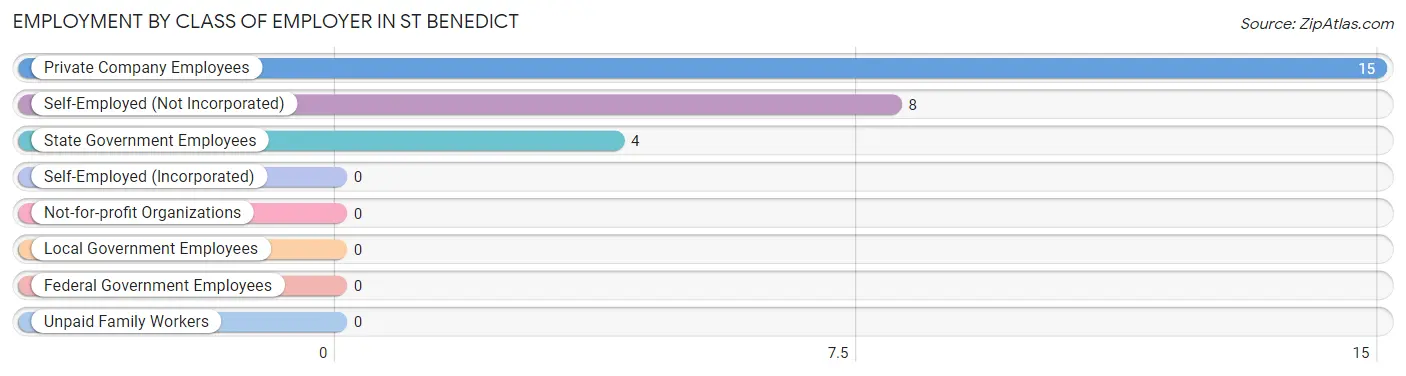
| Employer Class | # Employees | % Employees |
| Private Company Employees | 15 | 55.6% |
| Self-Employed (Incorporated) | 0 | 0.0% |
| Self-Employed (Not Incorporated) | 8 | 29.6% |
| Not-for-profit Organizations | 0 | 0.0% |
| Local Government Employees | 0 | 0.0% |
| State Government Employees | 4 | 14.8% |
| Federal Government Employees | 0 | 0.0% |
| Unpaid Family Workers | 0 | 0.0% |
| Total | 27 | 100.0% |
Employment Status by Age in St Benedict
According to the labor force statistics for St Benedict, out of the total population over 16 years of age (44), 81.8% or 36 individuals are in the labor force, with 25.0% or 9 of them unemployed. The age group with the highest labor force participation rate is 35 to 44 years, with 100.0% or 16 individuals in the labor force. Within the labor force, the 35 to 44 years age range has the highest percentage of unemployed individuals, with 56.3% or 9 of them being unemployed.
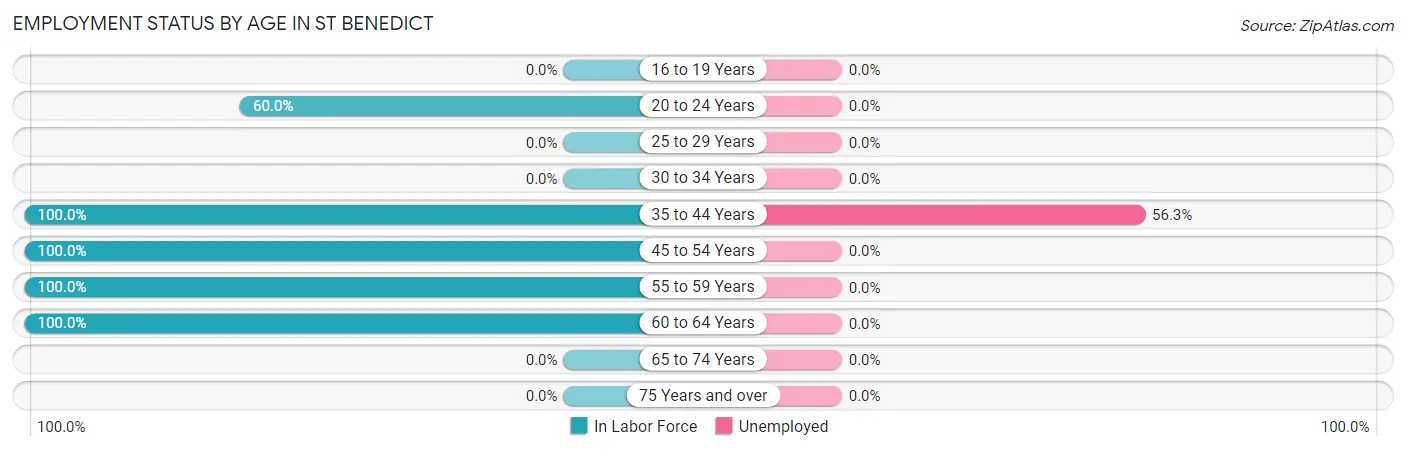
| Age Bracket | In Labor Force | Unemployed |
| 16 to 19 Years | 0 (0.0%) | 0 (0.0%) |
| 20 to 24 Years | 6 (60.0%) | 0 (0.0%) |
| 25 to 29 Years | 0 (0.0%) | 0 (0.0%) |
| 30 to 34 Years | 0 (0.0%) | 0 (0.0%) |
| 35 to 44 Years | 16 (100.0%) | 9 (56.3%) |
| 45 to 54 Years | 2 (100.0%) | 0 (0.0%) |
| 55 to 59 Years | 4 (100.0%) | 0 (0.0%) |
| 60 to 64 Years | 8 (100.0%) | 0 (0.0%) |
| 65 to 74 Years | 0 (0.0%) | 0 (0.0%) |
| 75 Years and over | 0 (0.0%) | 0 (0.0%) |
| Total | 36 (81.8%) | 9 (25.0%) |
Employment Status by Educational Attainment in St Benedict
According to labor force statistics for St Benedict, 100.0% of individuals (30) out of the total population between 25 and 64 years of age (30) are in the labor force, with 30.0% or 9 of them being unemployed. The group with the highest labor force participation rate are those with the educational attainment of high school diploma, with 100.0% or 6 individuals in the labor force. Within the labor force, individuals with bachelor's degree or higher education have the highest percentage of unemployment, with 50.0% or 9 of them being unemployed.
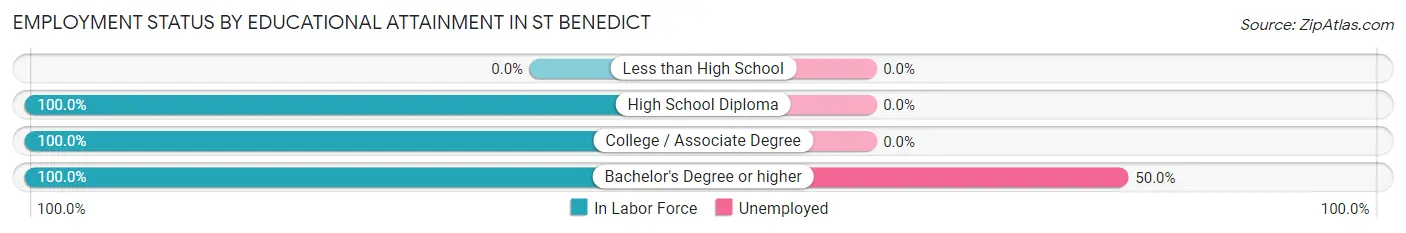
| Educational Attainment | In Labor Force | Unemployed |
| Less than High School | 0 (0.0%) | 0 (0.0%) |
| High School Diploma | 6 (100.0%) | 0 (0.0%) |
| College / Associate Degree | 6 (100.0%) | 0 (0.0%) |
| Bachelor's Degree or higher | 18 (100.0%) | 9 (50.0%) |
| Total | 30 (100.0%) | 9 (30.0%) |
Employment Occupations by Sex in St Benedict
Management, Business, Science and Arts Occupations
The most common Management, Business, Science and Arts occupations in St Benedict are , and Management (12 | 44.4%).
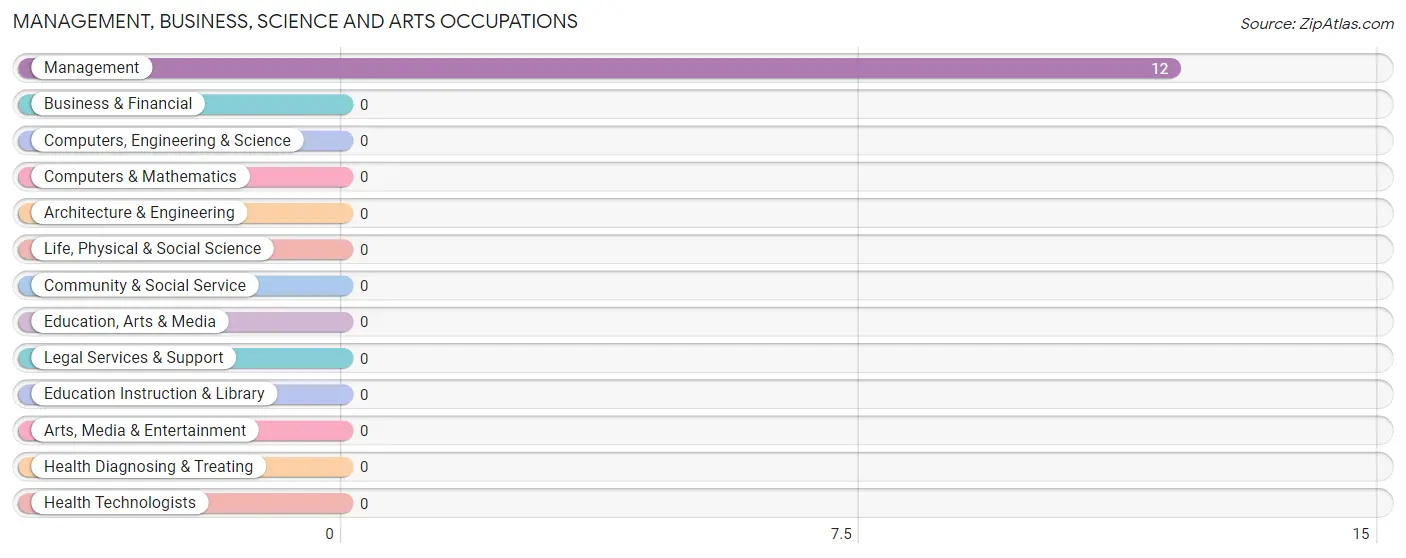
Management, Business, Science and Arts Occupations by Sex
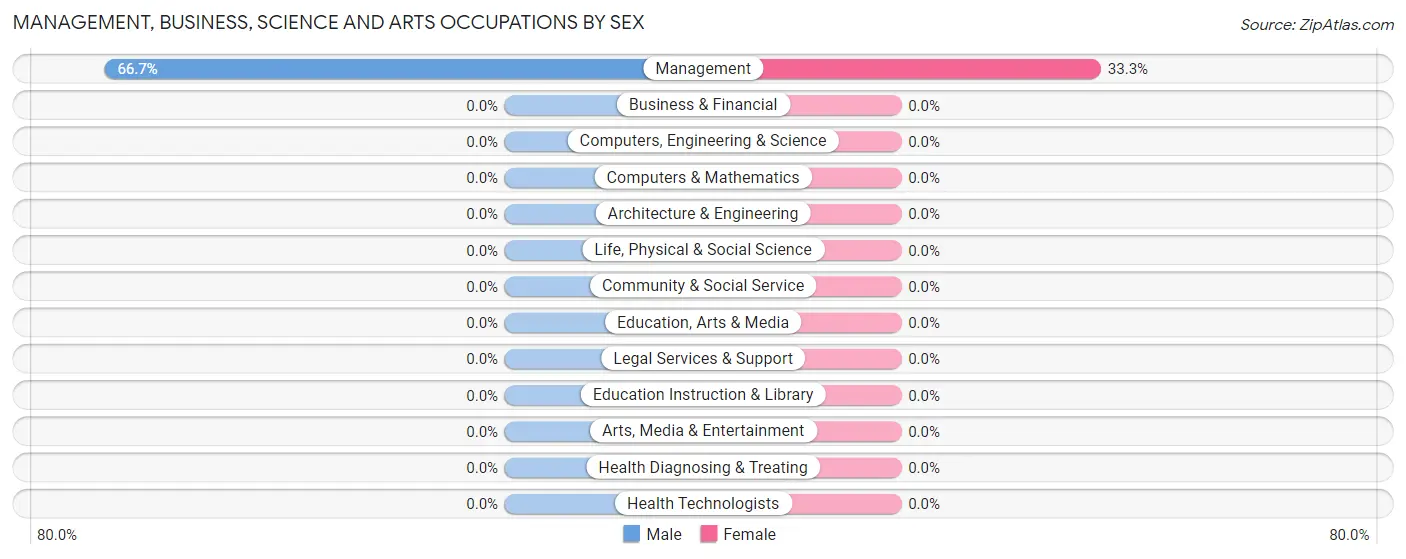
| Occupation | Male | Female |
| Management | 8 (66.7%) | 4 (33.3%) |
| Business & Financial | 0 (0.0%) | 0 (0.0%) |
| Computers, Engineering & Science | 0 (0.0%) | 0 (0.0%) |
| Computers & Mathematics | 0 (0.0%) | 0 (0.0%) |
| Architecture & Engineering | 0 (0.0%) | 0 (0.0%) |
| Life, Physical & Social Science | 0 (0.0%) | 0 (0.0%) |
| Community & Social Service | 0 (0.0%) | 0 (0.0%) |
| Education, Arts & Media | 0 (0.0%) | 0 (0.0%) |
| Legal Services & Support | 0 (0.0%) | 0 (0.0%) |
| Education Instruction & Library | 0 (0.0%) | 0 (0.0%) |
| Arts, Media & Entertainment | 0 (0.0%) | 0 (0.0%) |
| Health Diagnosing & Treating | 0 (0.0%) | 0 (0.0%) |
| Health Technologists | 0 (0.0%) | 0 (0.0%) |
| Total (Category) | 8 (66.7%) | 4 (33.3%) |
| Total (Overall) | 20 (74.1%) | 7 (25.9%) |
Services Occupations
Services Occupations by Sex
| Occupation | Male | Female |
| Healthcare Support | 0 (0.0%) | 0 (0.0%) |
| Security & Protection | 0 (0.0%) | 0 (0.0%) |
| Firefighting & Prevention | 0 (0.0%) | 0 (0.0%) |
| Law Enforcement | 0 (0.0%) | 0 (0.0%) |
| Food Preparation & Serving | 0 (0.0%) | 0 (0.0%) |
| Cleaning & Maintenance | 0 (0.0%) | 0 (0.0%) |
| Personal Care & Service | 0 (0.0%) | 0 (0.0%) |
| Total (Category) | 0 (0.0%) | 0 (0.0%) |
| Total (Overall) | 20 (74.1%) | 7 (25.9%) |
Sales and Office Occupations
The most common Sales and Office occupations in St Benedict are Sales & Related (4 | 14.8%), and Office & Administration (3 | 11.1%).
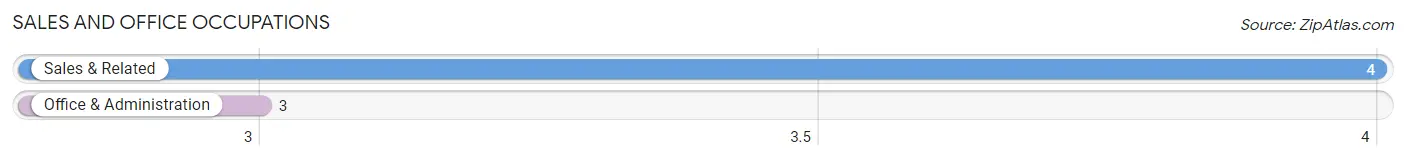
Sales and Office Occupations by Sex
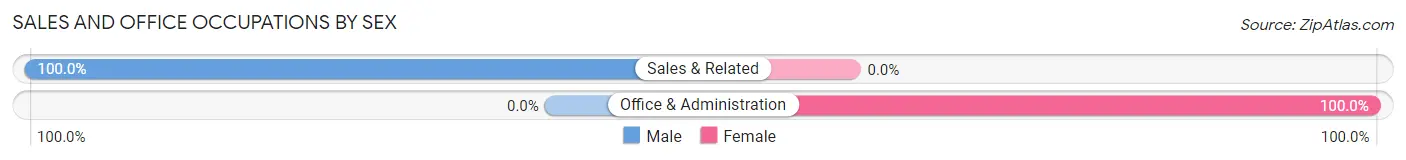
| Occupation | Male | Female |
| Sales & Related | 4 (100.0%) | 0 (0.0%) |
| Office & Administration | 0 (0.0%) | 3 (100.0%) |
| Total (Category) | 4 (57.1%) | 3 (42.9%) |
| Total (Overall) | 20 (74.1%) | 7 (25.9%) |
Natural Resources, Construction and Maintenance Occupations
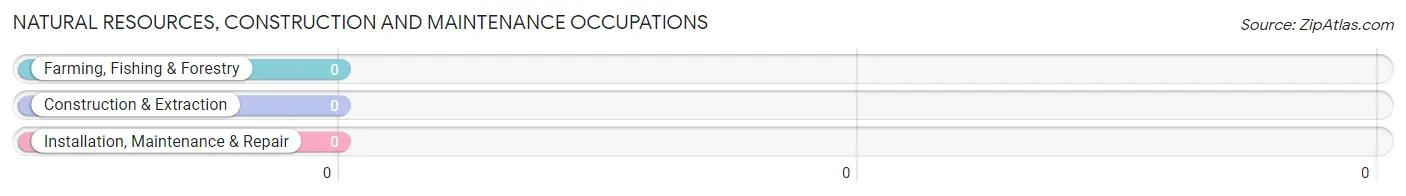
Natural Resources, Construction and Maintenance Occupations by Sex
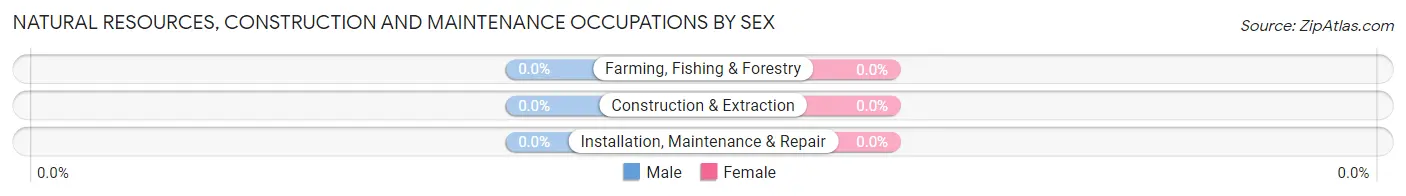
| Occupation | Male | Female |
| Farming, Fishing & Forestry | 0 (0.0%) | 0 (0.0%) |
| Construction & Extraction | 0 (0.0%) | 0 (0.0%) |
| Installation, Maintenance & Repair | 0 (0.0%) | 0 (0.0%) |
| Total (Category) | 0 (0.0%) | 0 (0.0%) |
| Total (Overall) | 20 (74.1%) | 7 (25.9%) |
Production, Transportation and Moving Occupations
The most common Production, Transportation and Moving occupations in St Benedict are , and Material Moving (8 | 29.6%).
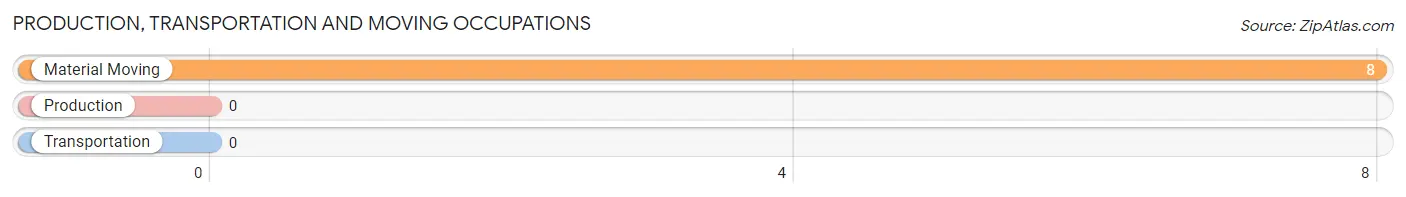
Production, Transportation and Moving Occupations by Sex
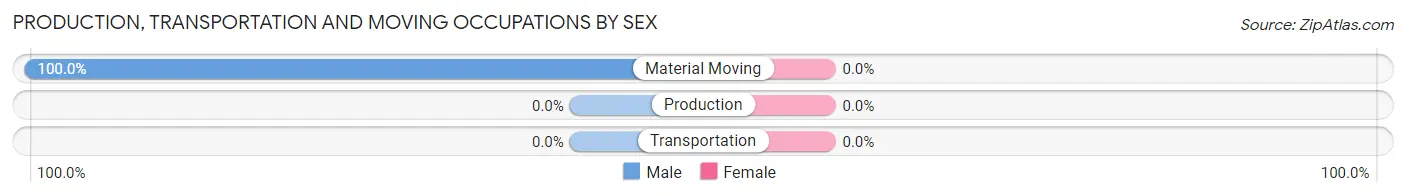
| Occupation | Male | Female |
| Production | 0 (0.0%) | 0 (0.0%) |
| Transportation | 0 (0.0%) | 0 (0.0%) |
| Material Moving | 8 (100.0%) | 0 (0.0%) |
| Total (Category) | 8 (100.0%) | 0 (0.0%) |
| Total (Overall) | 20 (74.1%) | 7 (25.9%) |
Employment Industries by Sex in St Benedict
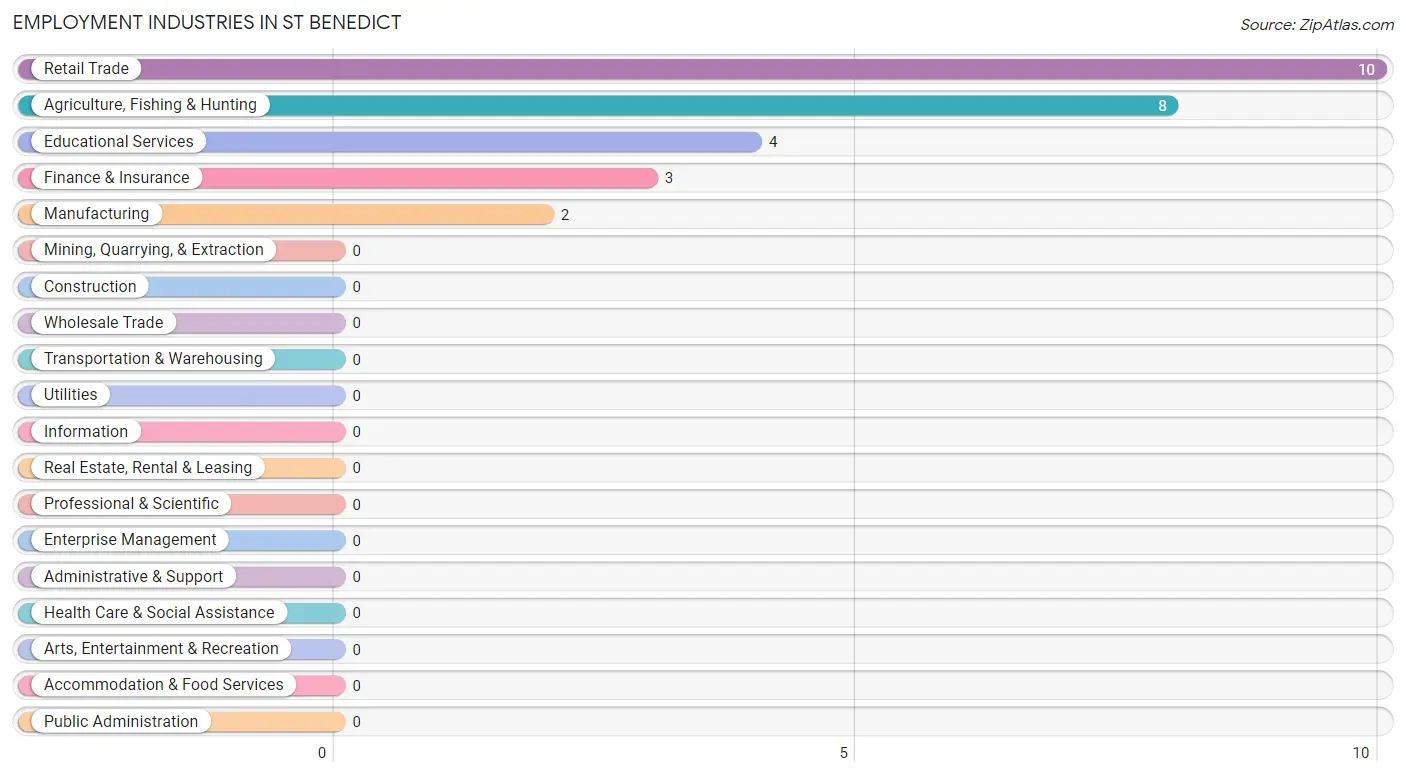
Employment Industries in St Benedict
The major employment industries in St Benedict include Retail Trade (10 | 37.0%), Agriculture, Fishing & Hunting (8 | 29.6%), Educational Services (4 | 14.8%), Finance & Insurance (3 | 11.1%), and Manufacturing (2 | 7.4%).
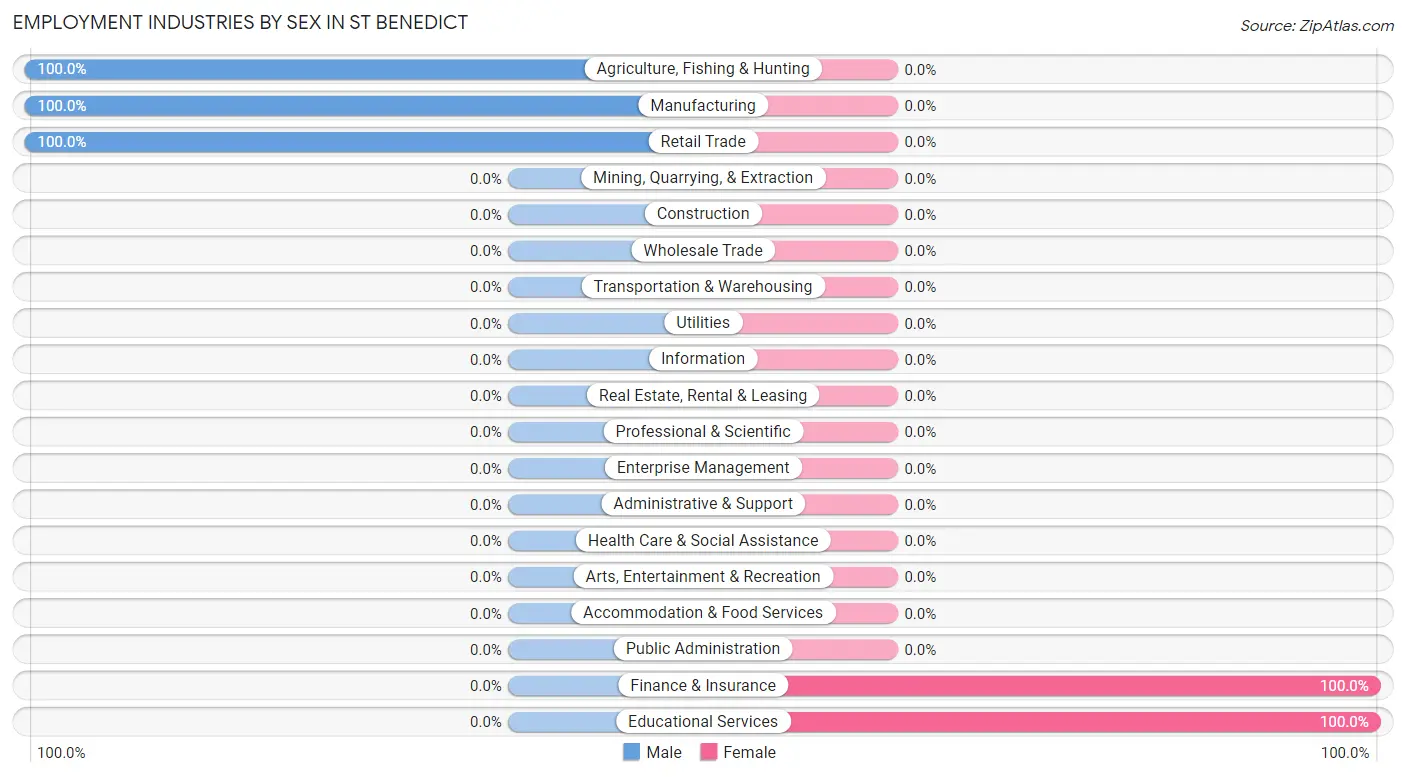
Employment Industries by Sex in St Benedict
The St Benedict industries that see more men than women are Agriculture, Fishing & Hunting (100.0%), Manufacturing (100.0%), and Retail Trade (100.0%), whereas the industries that tend to have a higher number of women are Finance & Insurance (100.0%), and Educational Services (100.0%).
| Industry | Male | Female |
| Agriculture, Fishing & Hunting | 8 (100.0%) | 0 (0.0%) |
| Mining, Quarrying, & Extraction | 0 (0.0%) | 0 (0.0%) |
| Construction | 0 (0.0%) | 0 (0.0%) |
| Manufacturing | 2 (100.0%) | 0 (0.0%) |
| Wholesale Trade | 0 (0.0%) | 0 (0.0%) |
| Retail Trade | 10 (100.0%) | 0 (0.0%) |
| Transportation & Warehousing | 0 (0.0%) | 0 (0.0%) |
| Utilities | 0 (0.0%) | 0 (0.0%) |
| Information | 0 (0.0%) | 0 (0.0%) |
| Finance & Insurance | 0 (0.0%) | 3 (100.0%) |
| Real Estate, Rental & Leasing | 0 (0.0%) | 0 (0.0%) |
| Professional & Scientific | 0 (0.0%) | 0 (0.0%) |
| Enterprise Management | 0 (0.0%) | 0 (0.0%) |
| Administrative & Support | 0 (0.0%) | 0 (0.0%) |
| Educational Services | 0 (0.0%) | 4 (100.0%) |
| Health Care & Social Assistance | 0 (0.0%) | 0 (0.0%) |
| Arts, Entertainment & Recreation | 0 (0.0%) | 0 (0.0%) |
| Accommodation & Food Services | 0 (0.0%) | 0 (0.0%) |
| Public Administration | 0 (0.0%) | 0 (0.0%) |
| Total | 20 (74.1%) | 7 (25.9%) |
Education in St Benedict
School Enrollment in St Benedict
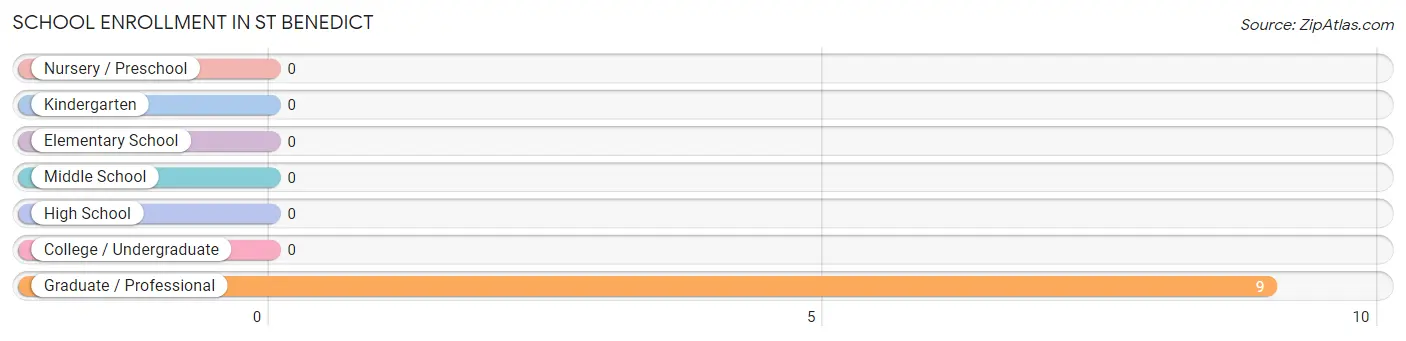
| School Level | # Students | % Students |
| Nursery / Preschool | 0 | 0.0% |
| Kindergarten | 0 | 0.0% |
| Elementary School | 0 | 0.0% |
| Middle School | 0 | 0.0% |
| High School | 0 | 0.0% |
| College / Undergraduate | 0 | 0.0% |
| Graduate / Professional | 9 | 100.0% |
| Total | 9 | 100.0% |
School Enrollment by Age by Funding Source in St Benedict
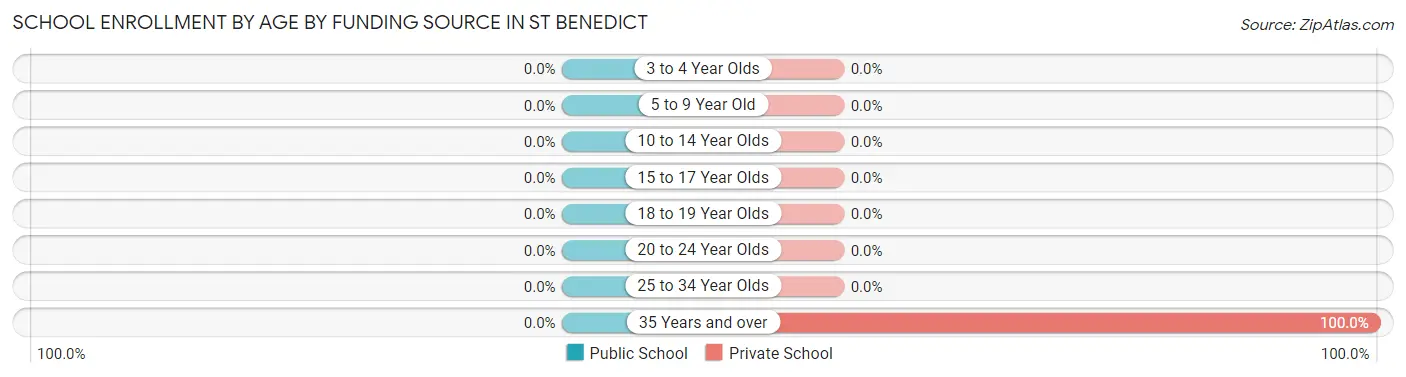
| Age Bracket | Public School | Private School |
| 3 to 4 Year Olds | 0 (0.0%) | 0 (0.0%) |
| 5 to 9 Year Old | 0 (0.0%) | 0 (0.0%) |
| 10 to 14 Year Olds | 0 (0.0%) | 0 (0.0%) |
| 15 to 17 Year Olds | 0 (0.0%) | 0 (0.0%) |
| 18 to 19 Year Olds | 0 (0.0%) | 0 (0.0%) |
| 20 to 24 Year Olds | 0 (0.0%) | 0 (0.0%) |
| 25 to 34 Year Olds | 0 (0.0%) | 0 (0.0%) |
| 35 Years and over | 0 (0.0%) | 9 (100.0%) |
| Total | 0 (0.0%) | 9 (100.0%) |
Educational Attainment by Field of Study in St Benedict
Arts & humanities (9 | 50.0%), bio, nature & agricultural (6 | 33.3%), and education (3 | 16.7%) are the most common fields of study among 18 individuals in St Benedict who have obtained a bachelor's degree or higher.
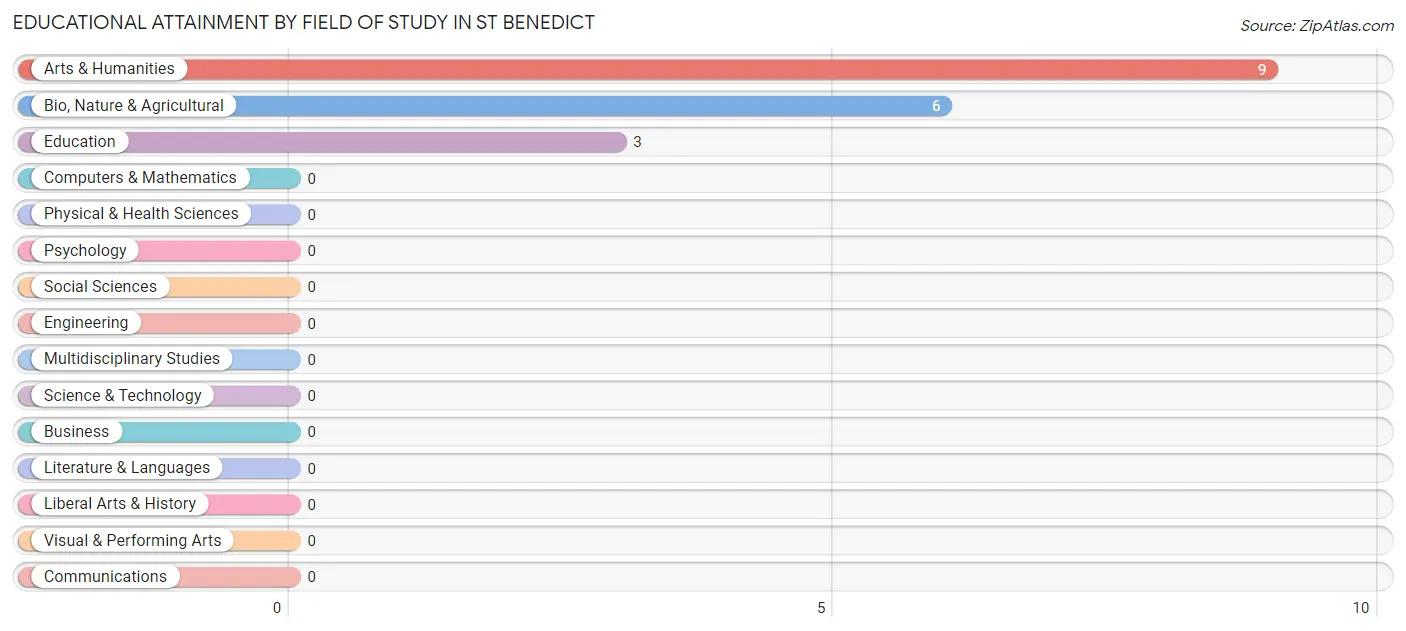
| Field of Study | # Graduates | % Graduates |
| Computers & Mathematics | 0 | 0.0% |
| Bio, Nature & Agricultural | 6 | 33.3% |
| Physical & Health Sciences | 0 | 0.0% |
| Psychology | 0 | 0.0% |
| Social Sciences | 0 | 0.0% |
| Engineering | 0 | 0.0% |
| Multidisciplinary Studies | 0 | 0.0% |
| Science & Technology | 0 | 0.0% |
| Business | 0 | 0.0% |
| Education | 3 | 16.7% |
| Literature & Languages | 0 | 0.0% |
| Liberal Arts & History | 0 | 0.0% |
| Visual & Performing Arts | 0 | 0.0% |
| Communications | 0 | 0.0% |
| Arts & Humanities | 9 | 50.0% |
| Total | 18 | 100.0% |
Transportation & Commute in St Benedict
Vehicle Availability by Sex in St Benedict
The most prevalent vehicle ownership categories in St Benedict are males with 2 vehicles (8, accounting for 40.0%) and females with 2 vehicles (0, making up 114.3%).
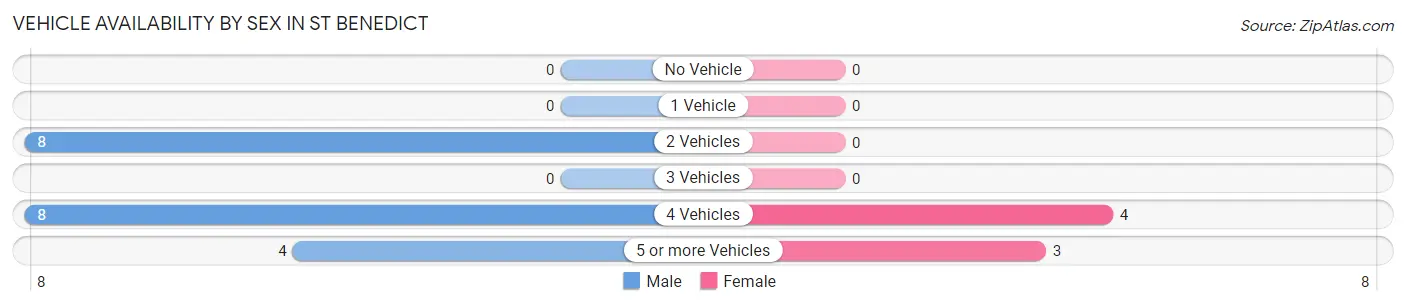
| Vehicles Available | Male | Female |
| No Vehicle | 0 (0.0%) | 0 (0.0%) |
| 1 Vehicle | 0 (0.0%) | 0 (0.0%) |
| 2 Vehicles | 8 (40.0%) | 0 (0.0%) |
| 3 Vehicles | 0 (0.0%) | 0 (0.0%) |
| 4 Vehicles | 8 (40.0%) | 4 (57.1%) |
| 5 or more Vehicles | 4 (20.0%) | 3 (42.9%) |
| Total | 20 (100.0%) | 7 (100.0%) |
Commute Time in St Benedict
The most frequently occuring commute durations in St Benedict are 25 to 29 minutes (10 commuters, 40.0%), 20 to 24 minutes (7 commuters, 28.0%), and 5 to 9 minutes (6 commuters, 24.0%).
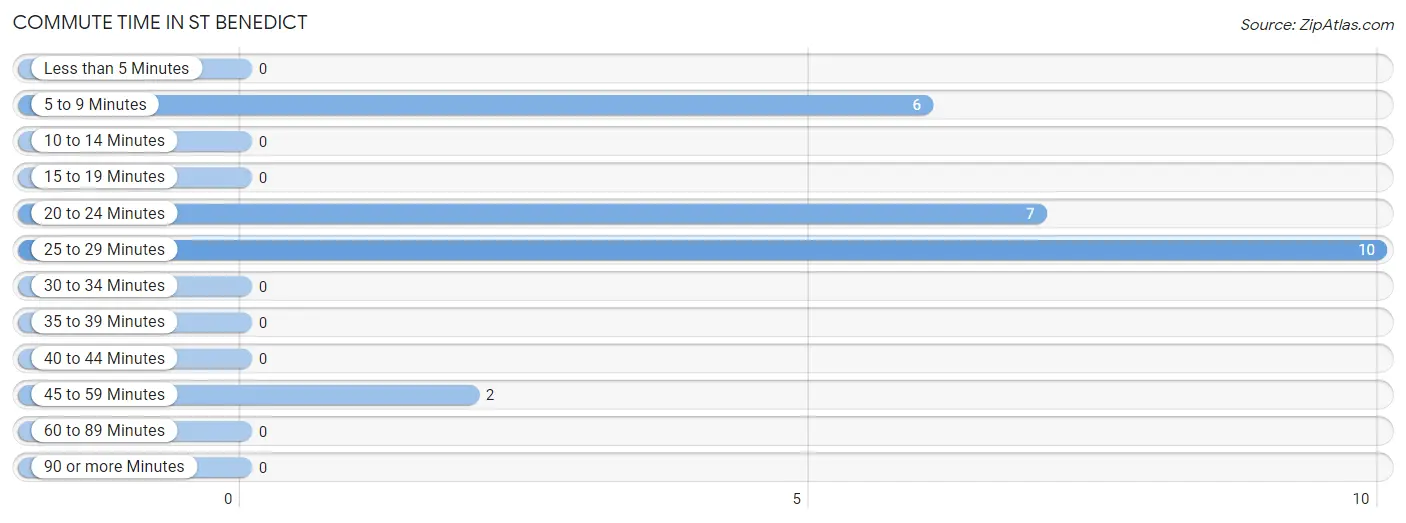
| Commute Time | # Commuters | % Commuters |
| Less than 5 Minutes | 0 | 0.0% |
| 5 to 9 Minutes | 6 | 24.0% |
| 10 to 14 Minutes | 0 | 0.0% |
| 15 to 19 Minutes | 0 | 0.0% |
| 20 to 24 Minutes | 7 | 28.0% |
| 25 to 29 Minutes | 10 | 40.0% |
| 30 to 34 Minutes | 0 | 0.0% |
| 35 to 39 Minutes | 0 | 0.0% |
| 40 to 44 Minutes | 0 | 0.0% |
| 45 to 59 Minutes | 2 | 8.0% |
| 60 to 89 Minutes | 0 | 0.0% |
| 90 or more Minutes | 0 | 0.0% |
Commute Time by Sex in St Benedict
The most common commute times in St Benedict are 25 to 29 minutes (10 commuters, 55.6%) for males and 20 to 24 minutes (7 commuters, 100.0%) for females.
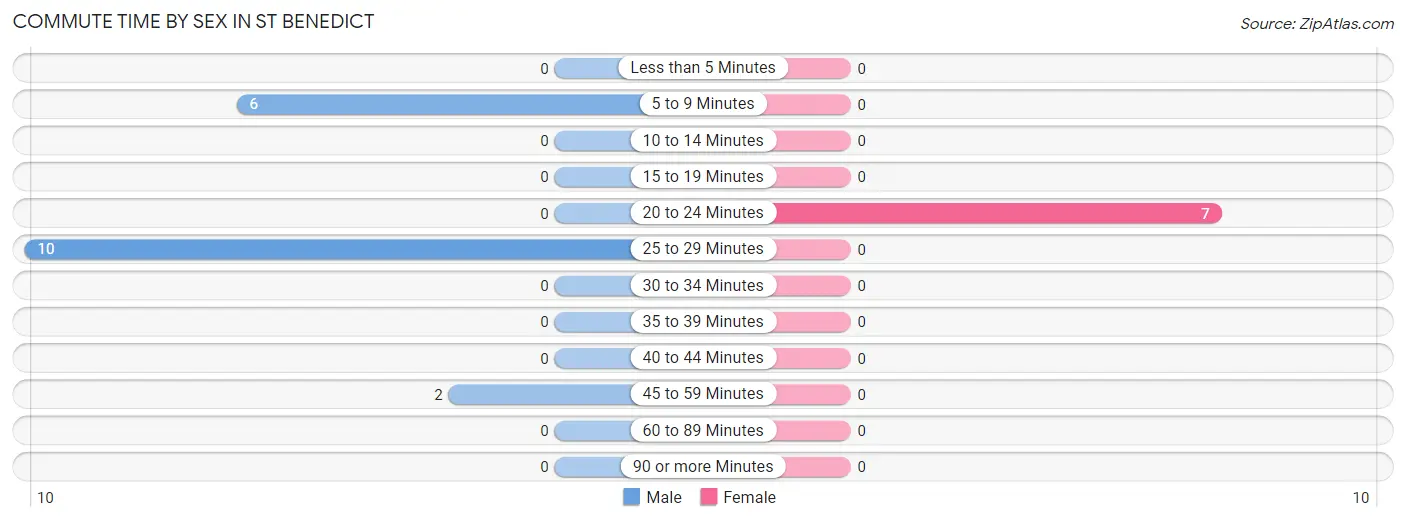
| Commute Time | Male | Female |
| Less than 5 Minutes | 0 (0.0%) | 0 (0.0%) |
| 5 to 9 Minutes | 6 (33.3%) | 0 (0.0%) |
| 10 to 14 Minutes | 0 (0.0%) | 0 (0.0%) |
| 15 to 19 Minutes | 0 (0.0%) | 0 (0.0%) |
| 20 to 24 Minutes | 0 (0.0%) | 7 (100.0%) |
| 25 to 29 Minutes | 10 (55.6%) | 0 (0.0%) |
| 30 to 34 Minutes | 0 (0.0%) | 0 (0.0%) |
| 35 to 39 Minutes | 0 (0.0%) | 0 (0.0%) |
| 40 to 44 Minutes | 0 (0.0%) | 0 (0.0%) |
| 45 to 59 Minutes | 2 (11.1%) | 0 (0.0%) |
| 60 to 89 Minutes | 0 (0.0%) | 0 (0.0%) |
| 90 or more Minutes | 0 (0.0%) | 0 (0.0%) |
Time of Departure to Work by Sex in St Benedict
The most frequent times of departure to work in St Benedict are 5:30 AM to 5:59 AM (6, 33.3%) for males and 6:00 AM to 6:29 AM (4, 57.1%) for females.
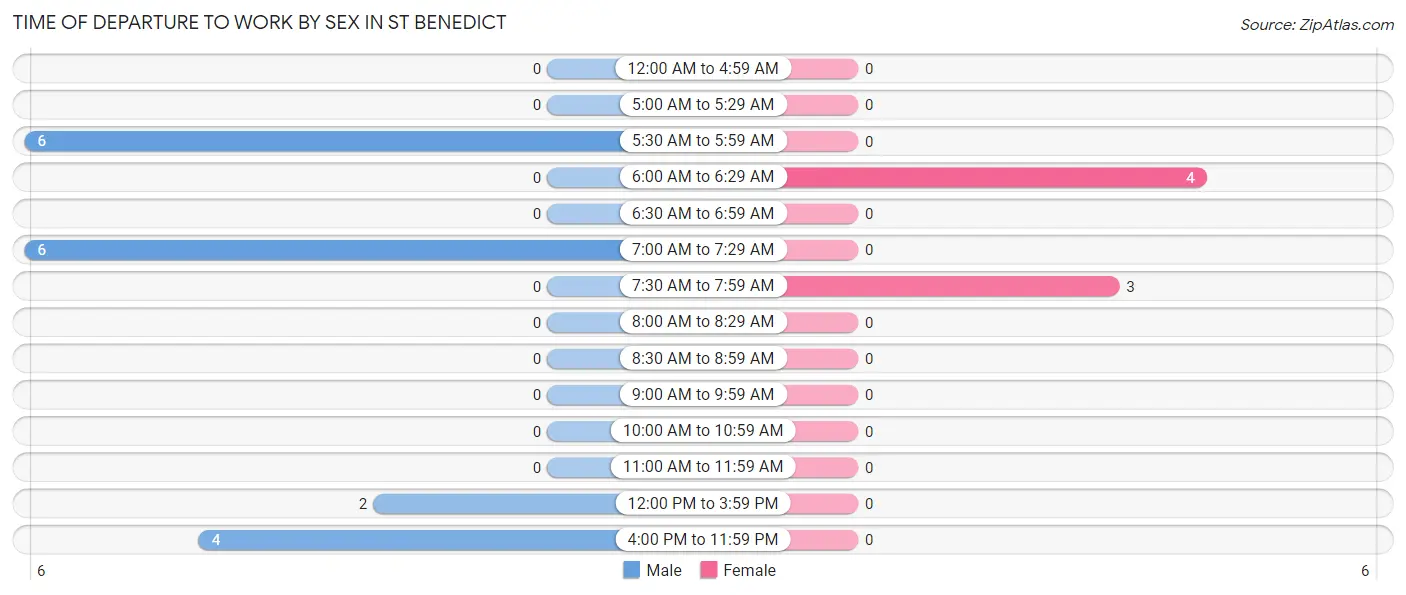
| Time of Departure | Male | Female |
| 12:00 AM to 4:59 AM | 0 (0.0%) | 0 (0.0%) |
| 5:00 AM to 5:29 AM | 0 (0.0%) | 0 (0.0%) |
| 5:30 AM to 5:59 AM | 6 (33.3%) | 0 (0.0%) |
| 6:00 AM to 6:29 AM | 0 (0.0%) | 4 (57.1%) |
| 6:30 AM to 6:59 AM | 0 (0.0%) | 0 (0.0%) |
| 7:00 AM to 7:29 AM | 6 (33.3%) | 0 (0.0%) |
| 7:30 AM to 7:59 AM | 0 (0.0%) | 3 (42.9%) |
| 8:00 AM to 8:29 AM | 0 (0.0%) | 0 (0.0%) |
| 8:30 AM to 8:59 AM | 0 (0.0%) | 0 (0.0%) |
| 9:00 AM to 9:59 AM | 0 (0.0%) | 0 (0.0%) |
| 10:00 AM to 10:59 AM | 0 (0.0%) | 0 (0.0%) |
| 11:00 AM to 11:59 AM | 0 (0.0%) | 0 (0.0%) |
| 12:00 PM to 3:59 PM | 2 (11.1%) | 0 (0.0%) |
| 4:00 PM to 11:59 PM | 4 (22.2%) | 0 (0.0%) |
| Total | 18 (100.0%) | 7 (100.0%) |
Housing Occupancy in St Benedict
Occupancy by Ownership in St Benedict
Of the total 29 dwellings in St Benedict, owner-occupied units account for 29 (100.0%), while renter-occupied units make up 0 (0.0%).
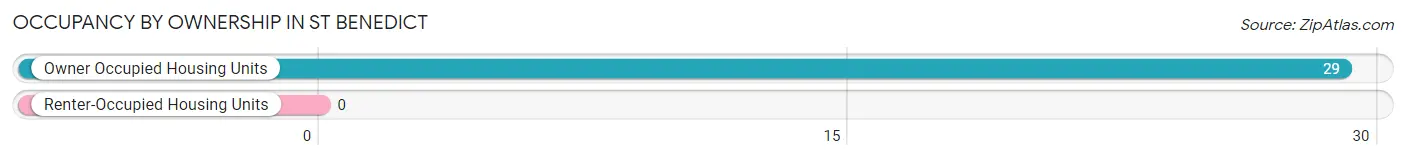
| Occupancy | # Housing Units | % Housing Units |
| Owner Occupied Housing Units | 29 | 100.0% |
| Renter-Occupied Housing Units | 0 | 0.0% |
| Total Occupied Housing Units | 29 | 100.0% |
Occupancy by Household Size in St Benedict
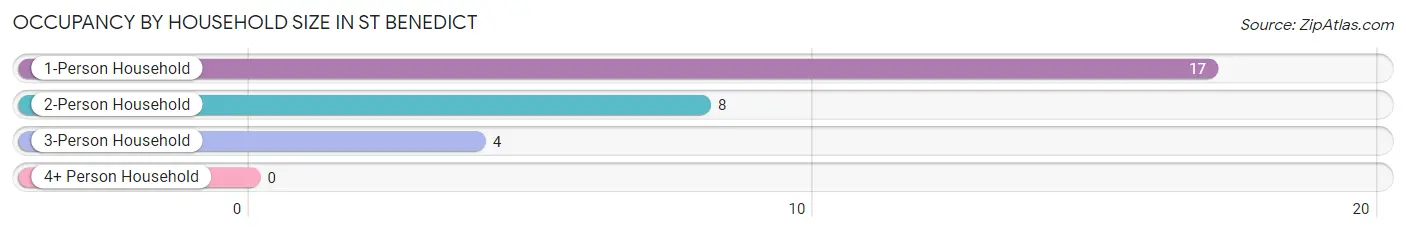
| Household Size | # Housing Units | % Housing Units |
| 1-Person Household | 17 | 58.6% |
| 2-Person Household | 8 | 27.6% |
| 3-Person Household | 4 | 13.8% |
| 4+ Person Household | 0 | 0.0% |
| Total Housing Units | 29 | 100.0% |
Occupancy by Ownership by Household Size in St Benedict
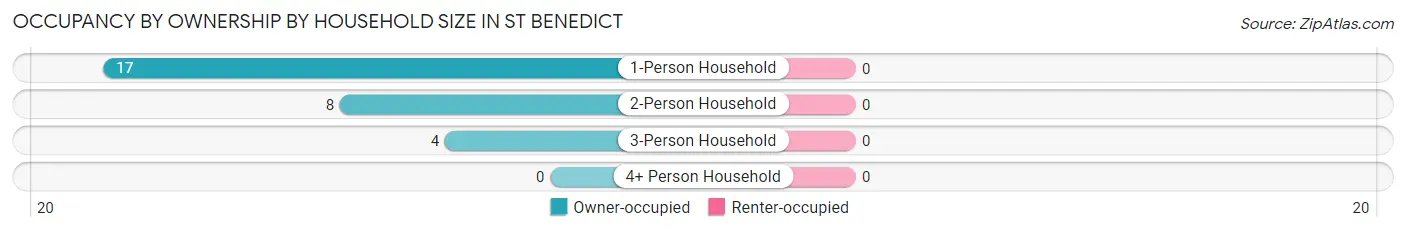
| Household Size | Owner-occupied | Renter-occupied |
| 1-Person Household | 17 (100.0%) | 0 (0.0%) |
| 2-Person Household | 8 (100.0%) | 0 (0.0%) |
| 3-Person Household | 4 (100.0%) | 0 (0.0%) |
| 4+ Person Household | 0 (0.0%) | 0 (0.0%) |
| Total Housing Units | 29 (100.0%) | 0 (0.0%) |
Occupancy by Educational Attainment in St Benedict
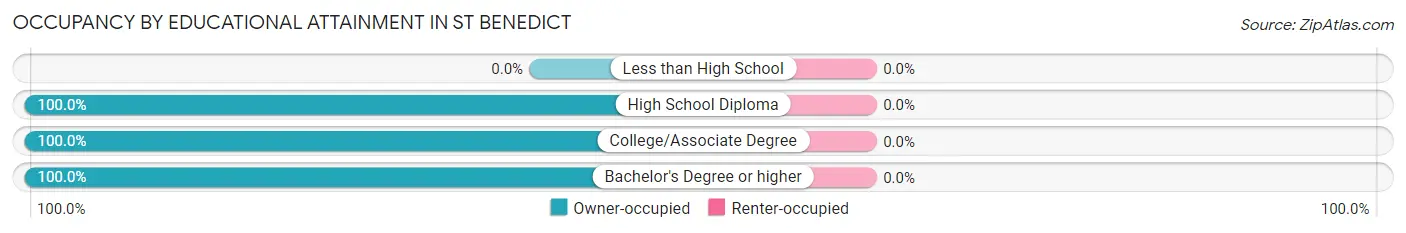
| Household Size | Owner-occupied | Renter-occupied |
| Less than High School | 0 (0.0%) | 0 (0.0%) |
| High School Diploma | 6 (100.0%) | 0 (0.0%) |
| College/Associate Degree | 10 (100.0%) | 0 (0.0%) |
| Bachelor's Degree or higher | 13 (100.0%) | 0 (0.0%) |
Occupancy by Age of Householder in St Benedict
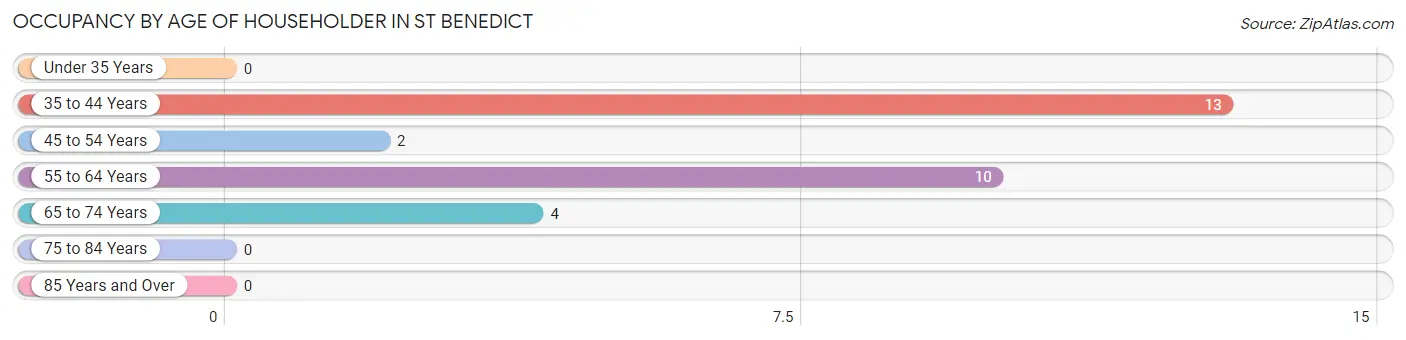
| Age Bracket | # Households | % Households |
| Under 35 Years | 0 | 0.0% |
| 35 to 44 Years | 13 | 44.8% |
| 45 to 54 Years | 2 | 6.9% |
| 55 to 64 Years | 10 | 34.5% |
| 65 to 74 Years | 4 | 13.8% |
| 75 to 84 Years | 0 | 0.0% |
| 85 Years and Over | 0 | 0.0% |
| Total | 29 | 100.0% |
Housing Finances in St Benedict
Median Income by Occupancy in St Benedict
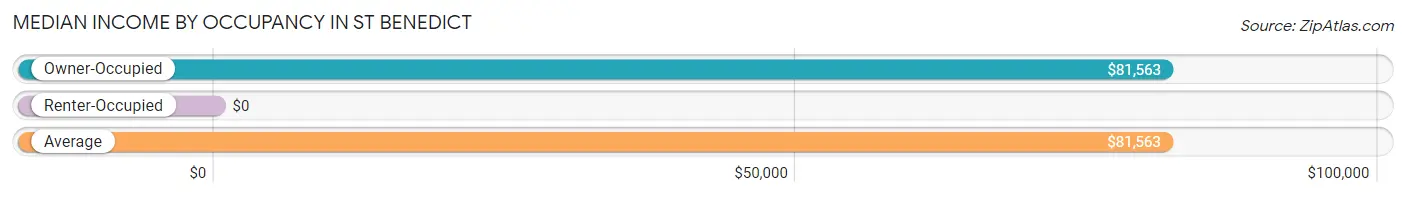
| Occupancy Type | # Households | Median Income |
| Owner-Occupied | 29 (100.0%) | $81,563 |
| Renter-Occupied | 0 (0.0%) | $0 |
| Average | 29 (100.0%) | $81,563 |
Occupancy by Householder Income Bracket in St Benedict
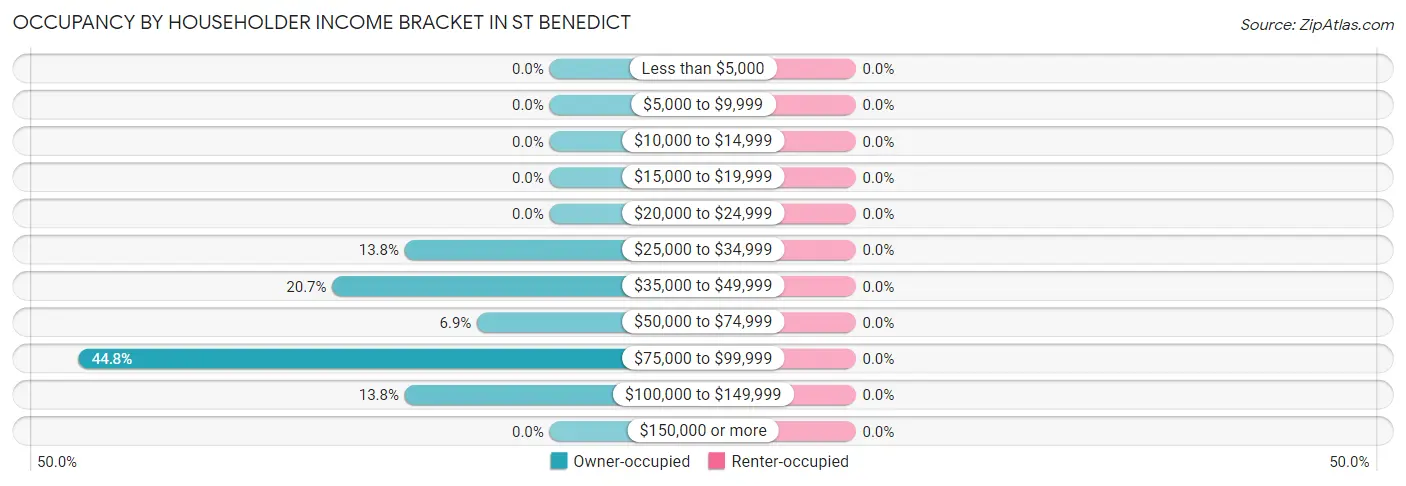
| Income Bracket | Owner-occupied | Renter-occupied |
| Less than $5,000 | 0 (0.0%) | 0 (0.0%) |
| $5,000 to $9,999 | 0 (0.0%) | 0 (0.0%) |
| $10,000 to $14,999 | 0 (0.0%) | 0 (0.0%) |
| $15,000 to $19,999 | 0 (0.0%) | 0 (0.0%) |
| $20,000 to $24,999 | 0 (0.0%) | 0 (0.0%) |
| $25,000 to $34,999 | 4 (13.8%) | 0 (0.0%) |
| $35,000 to $49,999 | 6 (20.7%) | 0 (0.0%) |
| $50,000 to $74,999 | 2 (6.9%) | 0 (0.0%) |
| $75,000 to $99,999 | 13 (44.8%) | 0 (0.0%) |
| $100,000 to $149,999 | 4 (13.8%) | 0 (0.0%) |
| $150,000 or more | 0 (0.0%) | 0 (0.0%) |
| Total | 29 (100.0%) | 0 (0.0%) |
Monthly Housing Cost Tiers in St Benedict
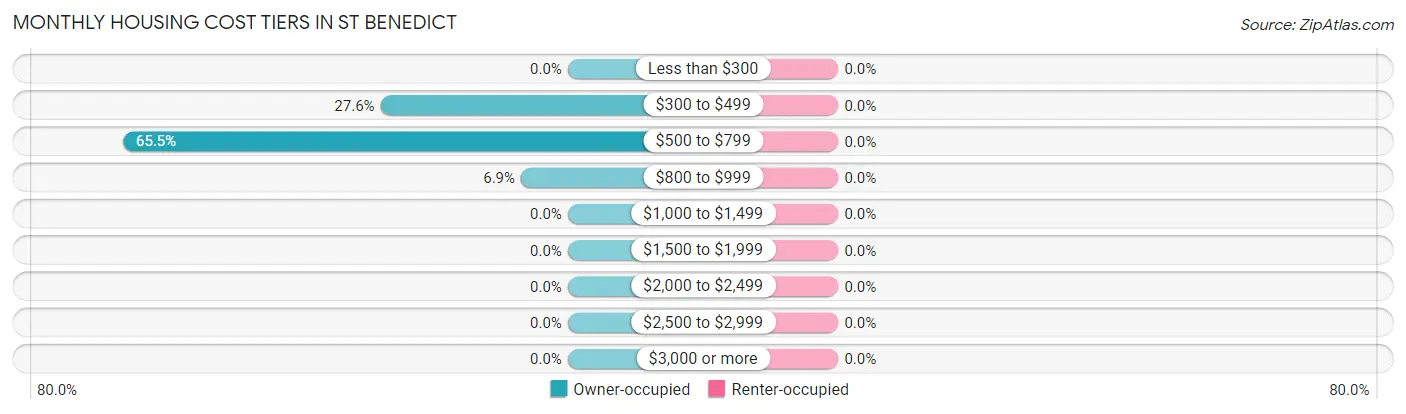
| Monthly Cost | Owner-occupied | Renter-occupied |
| Less than $300 | 0 (0.0%) | 0 (0.0%) |
| $300 to $499 | 8 (27.6%) | 0 (0.0%) |
| $500 to $799 | 19 (65.5%) | 0 (0.0%) |
| $800 to $999 | 2 (6.9%) | 0 (0.0%) |
| $1,000 to $1,499 | 0 (0.0%) | 0 (0.0%) |
| $1,500 to $1,999 | 0 (0.0%) | 0 (0.0%) |
| $2,000 to $2,499 | 0 (0.0%) | 0 (0.0%) |
| $2,500 to $2,999 | 0 (0.0%) | 0 (0.0%) |
| $3,000 or more | 0 (0.0%) | 0 (0.0%) |
| Total | 29 (100.0%) | 0 (0.0%) |
Physical Housing Characteristics in St Benedict
Housing Structures in St Benedict
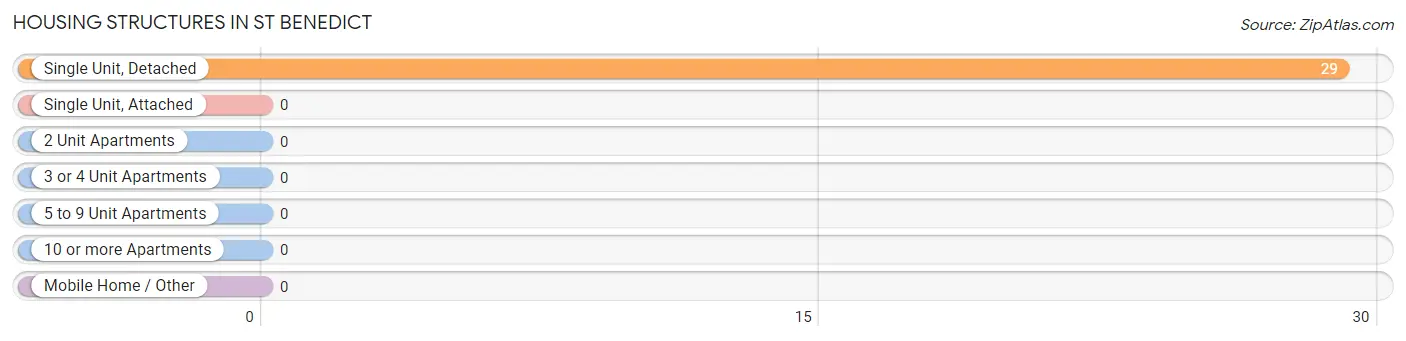
| Structure Type | # Housing Units | % Housing Units |
| Single Unit, Detached | 29 | 100.0% |
| Single Unit, Attached | 0 | 0.0% |
| 2 Unit Apartments | 0 | 0.0% |
| 3 or 4 Unit Apartments | 0 | 0.0% |
| 5 to 9 Unit Apartments | 0 | 0.0% |
| 10 or more Apartments | 0 | 0.0% |
| Mobile Home / Other | 0 | 0.0% |
| Total | 29 | 100.0% |
Housing Structures by Occupancy in St Benedict
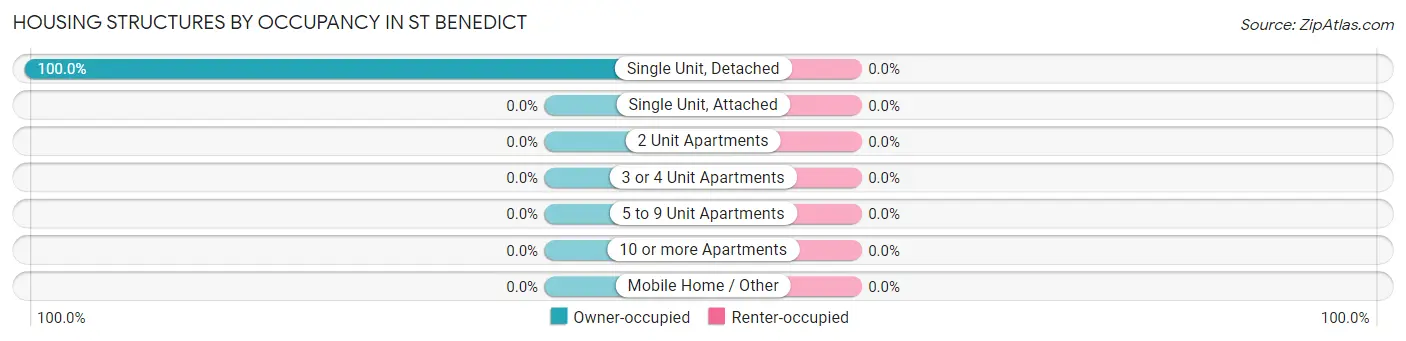
| Structure Type | Owner-occupied | Renter-occupied |
| Single Unit, Detached | 29 (100.0%) | 0 (0.0%) |
| Single Unit, Attached | 0 (0.0%) | 0 (0.0%) |
| 2 Unit Apartments | 0 (0.0%) | 0 (0.0%) |
| 3 or 4 Unit Apartments | 0 (0.0%) | 0 (0.0%) |
| 5 to 9 Unit Apartments | 0 (0.0%) | 0 (0.0%) |
| 10 or more Apartments | 0 (0.0%) | 0 (0.0%) |
| Mobile Home / Other | 0 (0.0%) | 0 (0.0%) |
| Total | 29 (100.0%) | 0 (0.0%) |
Housing Structures by Number of Rooms in St Benedict
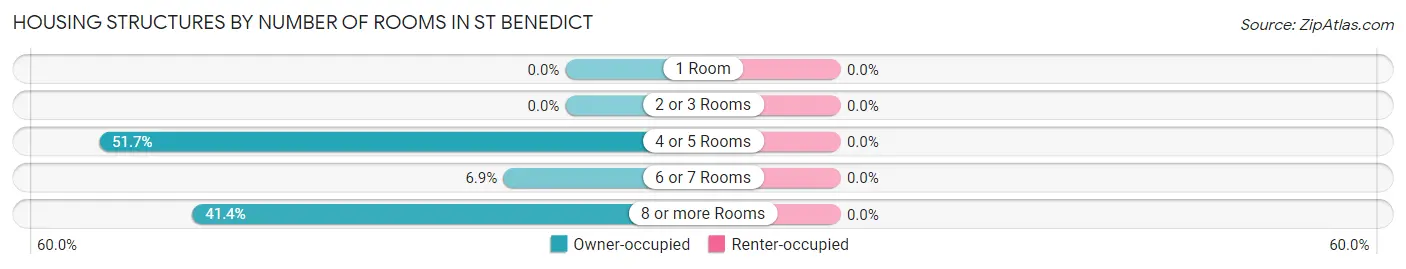
| Number of Rooms | Owner-occupied | Renter-occupied |
| 1 Room | 0 (0.0%) | 0 (0.0%) |
| 2 or 3 Rooms | 0 (0.0%) | 0 (0.0%) |
| 4 or 5 Rooms | 15 (51.7%) | 0 (0.0%) |
| 6 or 7 Rooms | 2 (6.9%) | 0 (0.0%) |
| 8 or more Rooms | 12 (41.4%) | 0 (0.0%) |
| Total | 29 (100.0%) | 0 (0.0%) |
Housing Structure by Heating Type in St Benedict
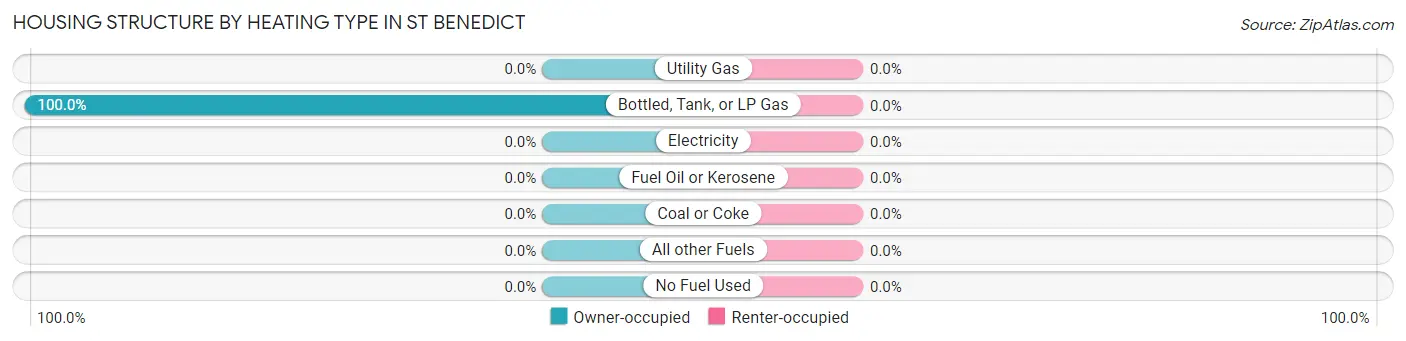
| Heating Type | Owner-occupied | Renter-occupied |
| Utility Gas | 0 (0.0%) | 0 (0.0%) |
| Bottled, Tank, or LP Gas | 29 (100.0%) | 0 (0.0%) |
| Electricity | 0 (0.0%) | 0 (0.0%) |
| Fuel Oil or Kerosene | 0 (0.0%) | 0 (0.0%) |
| Coal or Coke | 0 (0.0%) | 0 (0.0%) |
| All other Fuels | 0 (0.0%) | 0 (0.0%) |
| No Fuel Used | 0 (0.0%) | 0 (0.0%) |
| Total | 29 (100.0%) | 0 (0.0%) |
Household Vehicle Usage in St Benedict
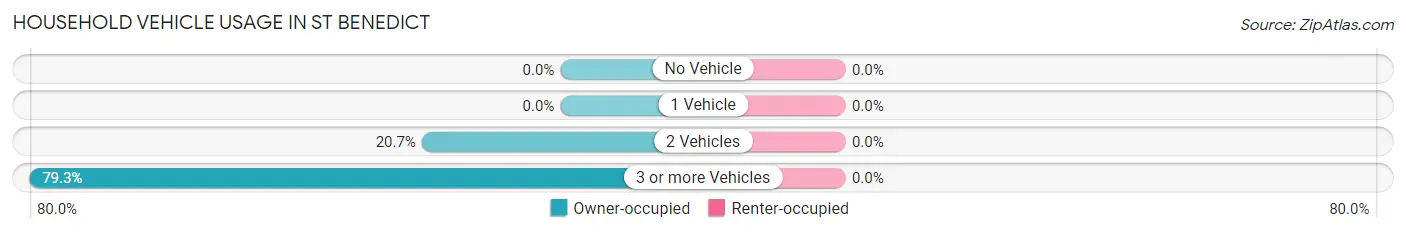
| Vehicles per Household | Owner-occupied | Renter-occupied |
| No Vehicle | 0 (0.0%) | 0 (0.0%) |
| 1 Vehicle | 0 (0.0%) | 0 (0.0%) |
| 2 Vehicles | 6 (20.7%) | 0 (0.0%) |
| 3 or more Vehicles | 23 (79.3%) | 0 (0.0%) |
| Total | 29 (100.0%) | 0 (0.0%) |
Real Estate & Mortgages in St Benedict
Real Estate and Mortgage Overview in St Benedict
| Characteristic | Without Mortgage | With Mortgage |
| Housing Units | 21 | 8 |
| Median Property Value | $213,900 | $0 |
| Median Household Income | $88,194 | $0 |
| Monthly Housing Costs | $519 | $0 |
| Real Estate Taxes | $1,639 | $0 |
Property Value by Mortgage Status in St Benedict
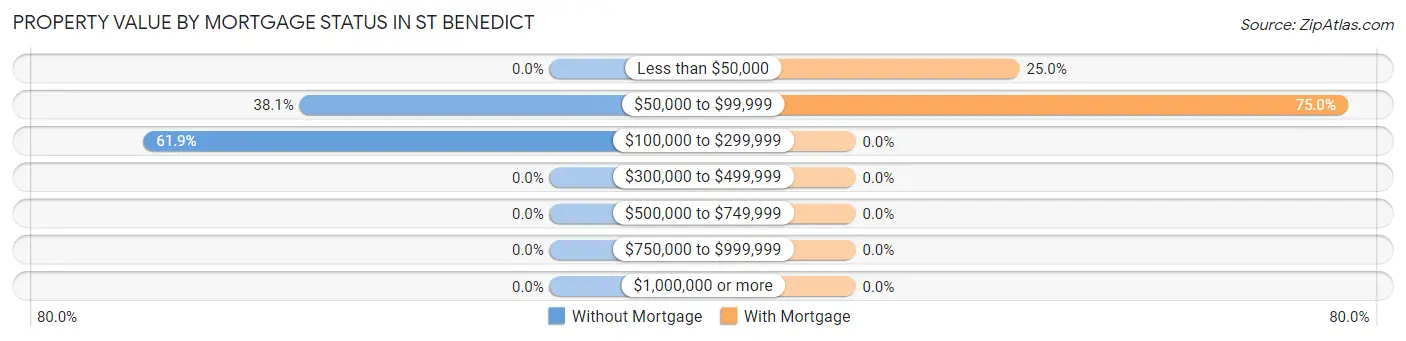
| Property Value | Without Mortgage | With Mortgage |
| Less than $50,000 | 0 (0.0%) | 2 (25.0%) |
| $50,000 to $99,999 | 8 (38.1%) | 6 (75.0%) |
| $100,000 to $299,999 | 13 (61.9%) | 0 (0.0%) |
| $300,000 to $499,999 | 0 (0.0%) | 0 (0.0%) |
| $500,000 to $749,999 | 0 (0.0%) | 0 (0.0%) |
| $750,000 to $999,999 | 0 (0.0%) | 0 (0.0%) |
| $1,000,000 or more | 0 (0.0%) | 0 (0.0%) |
| Total | 21 (100.0%) | 8 (100.0%) |
Household Income by Mortgage Status in St Benedict
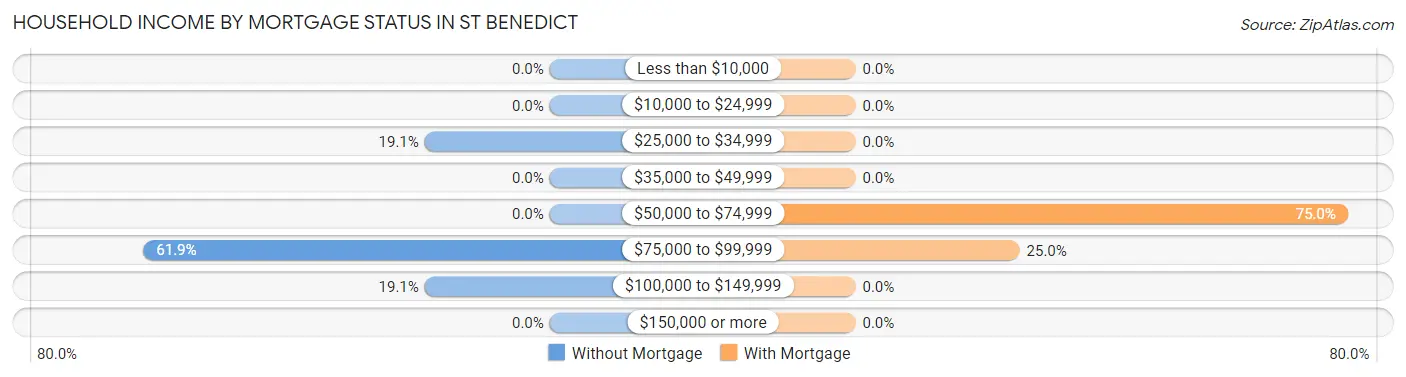
| Household Income | Without Mortgage | With Mortgage |
| Less than $10,000 | 0 (0.0%) | 0 (0.0%) |
| $10,000 to $24,999 | 0 (0.0%) | 0 (0.0%) |
| $25,000 to $34,999 | 4 (19.1%) | 0 (0.0%) |
| $35,000 to $49,999 | 0 (0.0%) | 0 (0.0%) |
| $50,000 to $74,999 | 0 (0.0%) | 6 (75.0%) |
| $75,000 to $99,999 | 13 (61.9%) | 2 (25.0%) |
| $100,000 to $149,999 | 4 (19.1%) | 0 (0.0%) |
| $150,000 or more | 0 (0.0%) | 0 (0.0%) |
| Total | 21 (100.0%) | 8 (100.0%) |
Property Value to Household Income Ratio in St Benedict
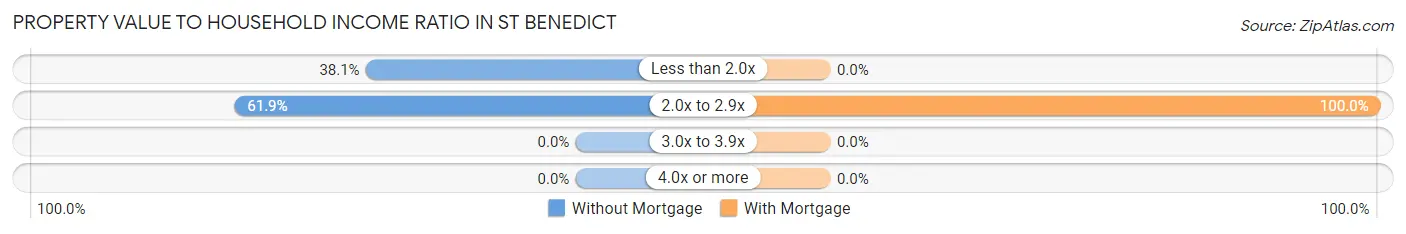
| Value-to-Income Ratio | Without Mortgage | With Mortgage |
| Less than 2.0x | 8 (38.1%) | 0 (0.0%) |
| 2.0x to 2.9x | 13 (61.9%) | 8 (100.0%) |
| 3.0x to 3.9x | 0 (0.0%) | 0 (0.0%) |
| 4.0x or more | 0 (0.0%) | 0 (0.0%) |
| Total | 21 (100.0%) | 8 (100.0%) |
Real Estate Taxes by Mortgage Status in St Benedict
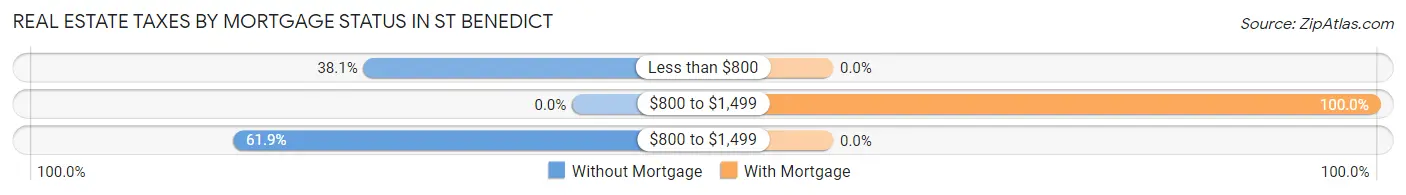
| Property Taxes | Without Mortgage | With Mortgage |
| Less than $800 | 8 (38.1%) | 0 (0.0%) |
| $800 to $1,499 | 0 (0.0%) | 8 (100.0%) |
| $800 to $1,499 | 13 (61.9%) | 0 (0.0%) |
| Total | 21 (100.0%) | 8 (100.0%) |
Health & Disability in St Benedict
Health Insurance Coverage by Age in St Benedict
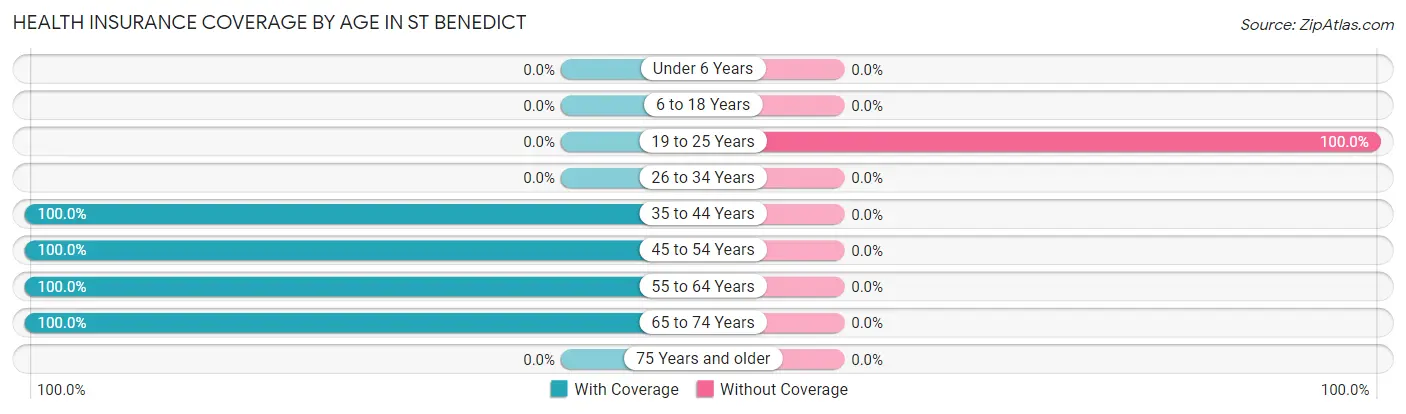
| Age Bracket | With Coverage | Without Coverage |
| Under 6 Years | 0 (0.0%) | 0 (0.0%) |
| 6 to 18 Years | 0 (0.0%) | 0 (0.0%) |
| 19 to 25 Years | 0 (0.0%) | 10 (100.0%) |
| 26 to 34 Years | 0 (0.0%) | 0 (0.0%) |
| 35 to 44 Years | 16 (100.0%) | 0 (0.0%) |
| 45 to 54 Years | 2 (100.0%) | 0 (0.0%) |
| 55 to 64 Years | 12 (100.0%) | 0 (0.0%) |
| 65 to 74 Years | 4 (100.0%) | 0 (0.0%) |
| 75 Years and older | 0 (0.0%) | 0 (0.0%) |
| Total | 34 (77.3%) | 10 (22.7%) |
Health Insurance Coverage by Citizenship Status in St Benedict
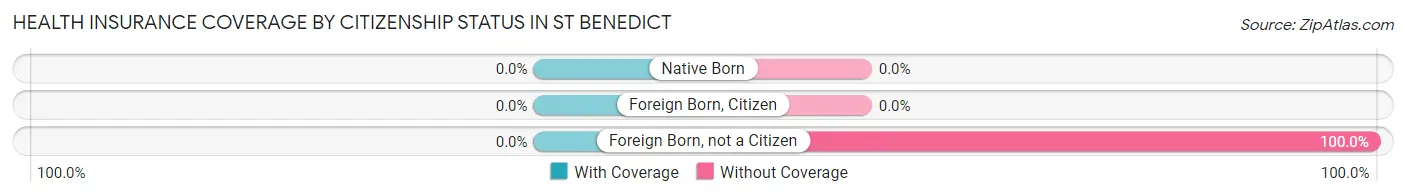
| Citizenship Status | With Coverage | Without Coverage |
| Native Born | 0 (0.0%) | 0 (0.0%) |
| Foreign Born, Citizen | 0 (0.0%) | 0 (0.0%) |
| Foreign Born, not a Citizen | 0 (0.0%) | 10 (100.0%) |
Health Insurance Coverage by Household Income in St Benedict
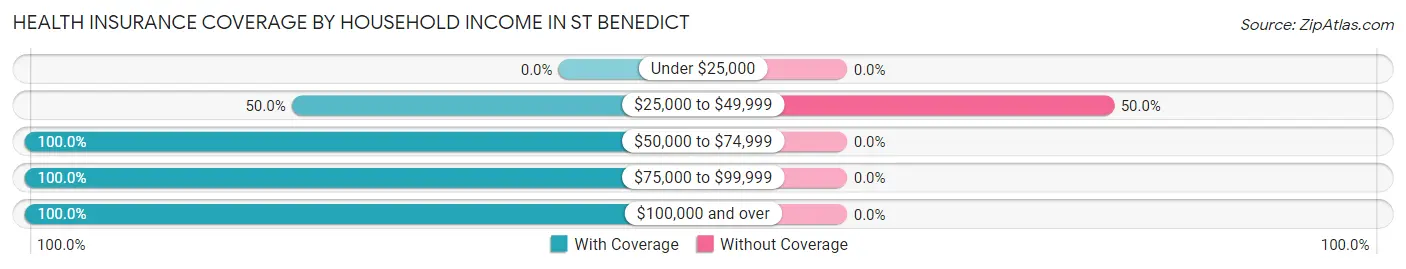
| Household Income | With Coverage | Without Coverage |
| Under $25,000 | 0 (0.0%) | 0 (0.0%) |
| $25,000 to $49,999 | 10 (50.0%) | 10 (50.0%) |
| $50,000 to $74,999 | 2 (100.0%) | 0 (0.0%) |
| $75,000 to $99,999 | 16 (100.0%) | 0 (0.0%) |
| $100,000 and over | 6 (100.0%) | 0 (0.0%) |
Public vs Private Health Insurance Coverage by Age in St Benedict
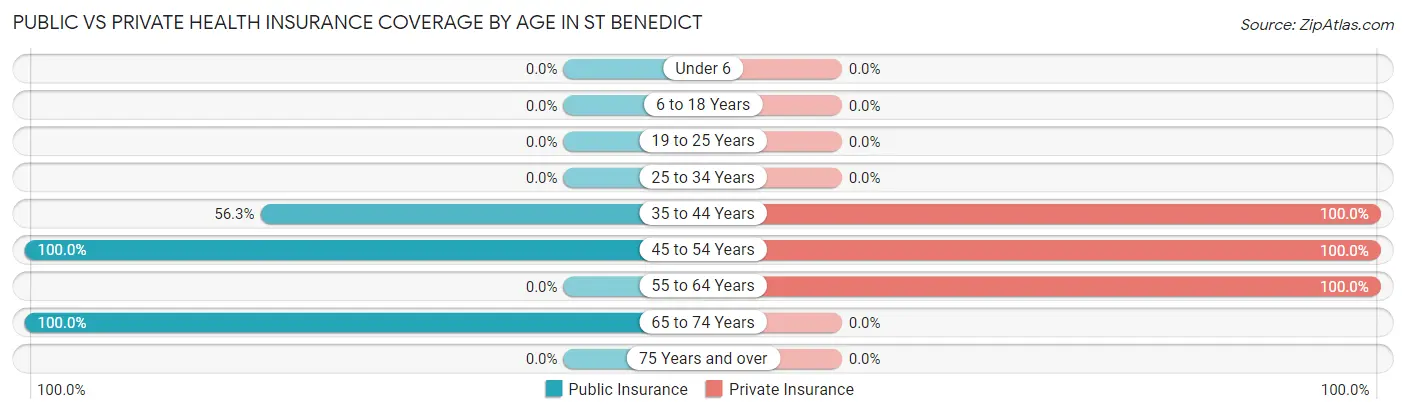
| Age Bracket | Public Insurance | Private Insurance |
| Under 6 | 0 (0.0%) | 0 (0.0%) |
| 6 to 18 Years | 0 (0.0%) | 0 (0.0%) |
| 19 to 25 Years | 0 (0.0%) | 0 (0.0%) |
| 25 to 34 Years | 0 (0.0%) | 0 (0.0%) |
| 35 to 44 Years | 9 (56.2%) | 16 (100.0%) |
| 45 to 54 Years | 2 (100.0%) | 2 (100.0%) |
| 55 to 64 Years | 0 (0.0%) | 12 (100.0%) |
| 65 to 74 Years | 4 (100.0%) | 0 (0.0%) |
| 75 Years and over | 0 (0.0%) | 0 (0.0%) |
| Total | 15 (34.1%) | 30 (68.2%) |
Disability Status by Sex by Age in St Benedict
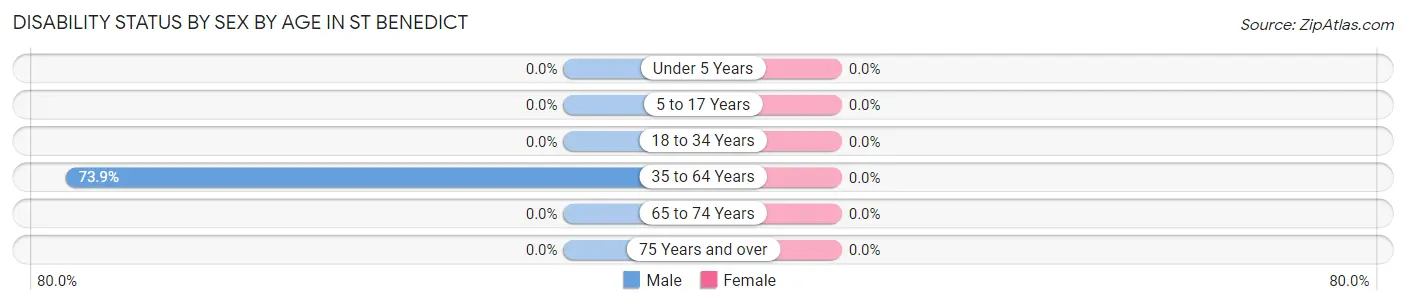
| Age Bracket | Male | Female |
| Under 5 Years | 0 (0.0%) | 0 (0.0%) |
| 5 to 17 Years | 0 (0.0%) | 0 (0.0%) |
| 18 to 34 Years | 0 (0.0%) | 0 (0.0%) |
| 35 to 64 Years | 17 (73.9%) | 0 (0.0%) |
| 65 to 74 Years | 0 (0.0%) | 0 (0.0%) |
| 75 Years and over | 0 (0.0%) | 0 (0.0%) |
Disability Class by Sex by Age in St Benedict
Disability Class: Hearing Difficulty
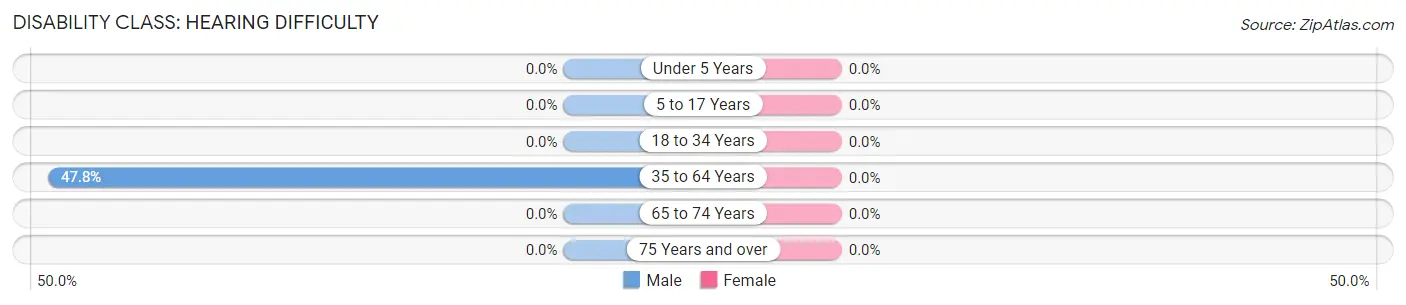
| Age Bracket | Male | Female |
| Under 5 Years | 0 (0.0%) | 0 (0.0%) |
| 5 to 17 Years | 0 (0.0%) | 0 (0.0%) |
| 18 to 34 Years | 0 (0.0%) | 0 (0.0%) |
| 35 to 64 Years | 11 (47.8%) | 0 (0.0%) |
| 65 to 74 Years | 0 (0.0%) | 0 (0.0%) |
| 75 Years and over | 0 (0.0%) | 0 (0.0%) |
Disability Class: Vision Difficulty
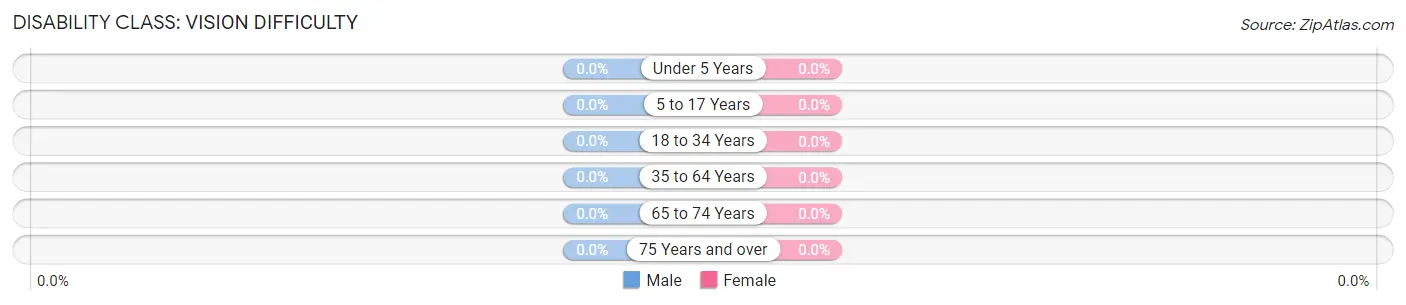
| Age Bracket | Male | Female |
| Under 5 Years | 0 (0.0%) | 0 (0.0%) |
| 5 to 17 Years | 0 (0.0%) | 0 (0.0%) |
| 18 to 34 Years | 0 (0.0%) | 0 (0.0%) |
| 35 to 64 Years | 0 (0.0%) | 0 (0.0%) |
| 65 to 74 Years | 0 (0.0%) | 0 (0.0%) |
| 75 Years and over | 0 (0.0%) | 0 (0.0%) |
Disability Class: Cognitive Difficulty
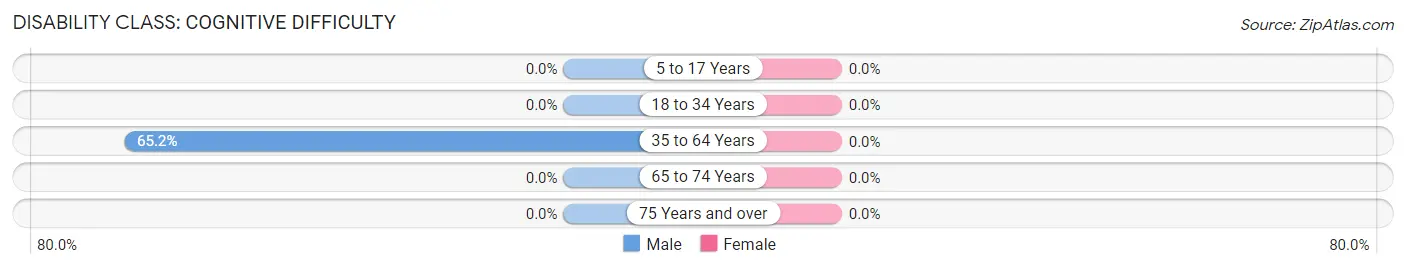
| Age Bracket | Male | Female |
| 5 to 17 Years | 0 (0.0%) | 0 (0.0%) |
| 18 to 34 Years | 0 (0.0%) | 0 (0.0%) |
| 35 to 64 Years | 15 (65.2%) | 0 (0.0%) |
| 65 to 74 Years | 0 (0.0%) | 0 (0.0%) |
| 75 Years and over | 0 (0.0%) | 0 (0.0%) |
Disability Class: Ambulatory Difficulty
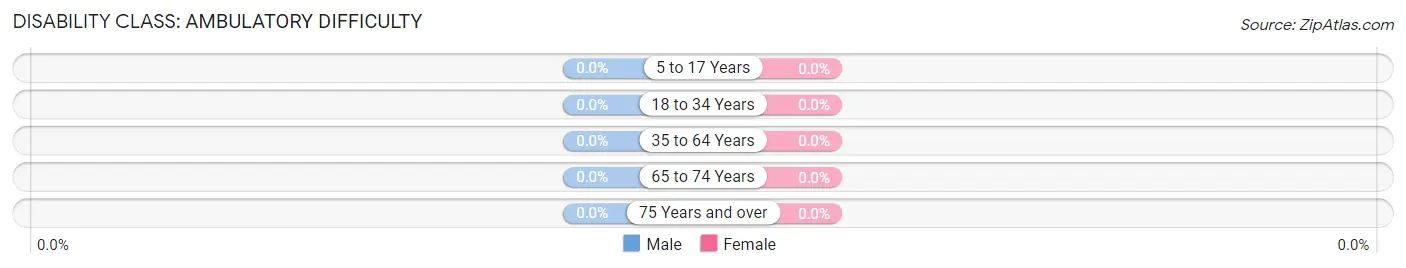
| Age Bracket | Male | Female |
| 5 to 17 Years | 0 (0.0%) | 0 (0.0%) |
| 18 to 34 Years | 0 (0.0%) | 0 (0.0%) |
| 35 to 64 Years | 0 (0.0%) | 0 (0.0%) |
| 65 to 74 Years | 0 (0.0%) | 0 (0.0%) |
| 75 Years and over | 0 (0.0%) | 0 (0.0%) |
Disability Class: Self-Care Difficulty
| Age Bracket | Male | Female |
| 5 to 17 Years | 0 (0.0%) | 0 (0.0%) |
| 18 to 34 Years | 0 (0.0%) | 0 (0.0%) |
| 35 to 64 Years | 0 (0.0%) | 0 (0.0%) |
| 65 to 74 Years | 0 (0.0%) | 0 (0.0%) |
| 75 Years and over | 0 (0.0%) | 0 (0.0%) |
Technology Access in St Benedict
Computing Device Access in St Benedict
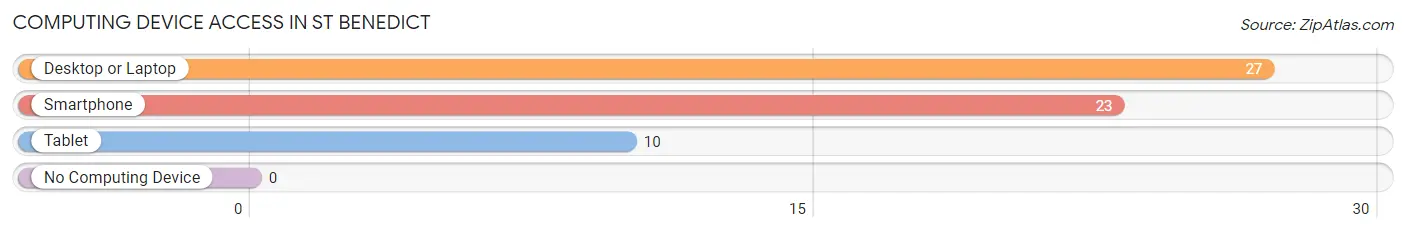
| Device Type | # Households | % Households |
| Desktop or Laptop | 27 | 93.1% |
| Smartphone | 23 | 79.3% |
| Tablet | 10 | 34.5% |
| No Computing Device | 0 | 0.0% |
| Total | 29 | 100.0% |
Internet Access in St Benedict
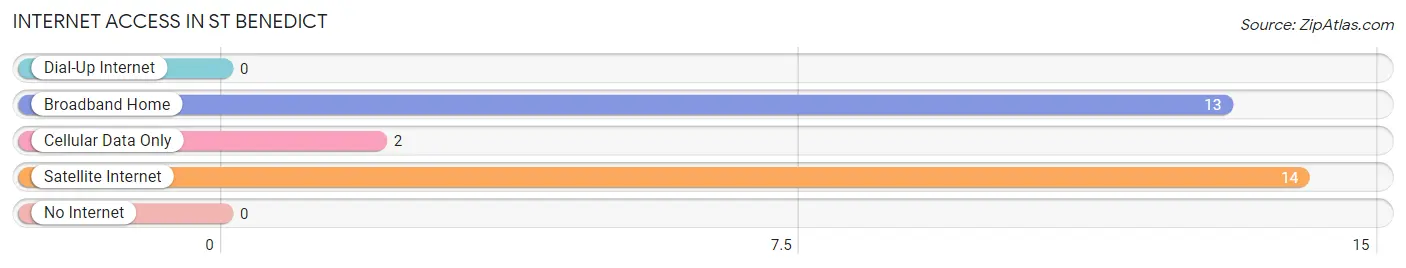
| Internet Type | # Households | % Households |
| Dial-Up Internet | 0 | 0.0% |
| Broadband Home | 13 | 44.8% |
| Cellular Data Only | 2 | 6.9% |
| Satellite Internet | 14 | 48.3% |
| No Internet | 0 | 0.0% |
| Total | 29 | 100.0% |
St Benedict Summary
St Benedict is a small town located in Dubuque County, Iowa. It is situated on the banks of the Mississippi River, just south of the city of Dubuque. The town was founded in 1856 by Benedictine monks from the nearby monastery of St. Benedict. The town was named after the monastery and has been a part of the Dubuque County since its founding.
Geography
St Benedict is located in the Upper Mississippi Valley region of Iowa. It is situated on the banks of the Mississippi River, just south of the city of Dubuque. The town is surrounded by rolling hills and is located in a rural area. The town is located at an elevation of 690 feet above sea level. The town has a total area of 0.6 square miles, all of which is land.
Economy
The economy of St Benedict is largely based on agriculture. The town is home to several farms and ranches, as well as a few small businesses. The town is also home to a few manufacturing companies, such as a furniture factory and a metal fabrication plant. The town also has a few retail stores, such as a grocery store and a hardware store.
Demographics
As of the 2010 census, the population of St Benedict was 1,093. The population is predominantly white, with a small percentage of African Americans and Hispanics. The median household income is $45,000, and the median age is 44. The town has a high rate of homeownership, with over 80% of the population owning their own homes.
The town is served by the Dubuque Community School District. The town has one elementary school, one middle school, and one high school. The town also has a public library and a few churches.
Conclusion
St Benedict is a small town located in Dubuque County, Iowa. It is situated on the banks of the Mississippi River, just south of the city of Dubuque. The town was founded in 1856 by Benedictine monks from the nearby monastery of St. Benedict. The town is largely agricultural, with a few small businesses and manufacturing companies. The population is predominantly white, with a median household income of $45,000 and a median age of 44. The town is served by the Dubuque Community School District and has a public library and a few churches.
Common Questions
What is Per Capita Income in St Benedict?
Per Capita income in St Benedict is $46,352.
What is the Median Household income in St Benedict?
Median Household Income in St Benedict is $81,563.
What is Inequality or Gini Index in St Benedict?
Inequality or Gini Index in St Benedict is 0.23.
What is the Total Population of St Benedict?
Total Population of St Benedict is 44.
What is the Total Male Population of St Benedict?
Total Male Population of St Benedict is 33.
What is the Total Female Population of St Benedict?
Total Female Population of St Benedict is 11.
What is the Ratio of Males per 100 Females in St Benedict?
There are 300.00 Males per 100 Females in St Benedict.
What is the Ratio of Females per 100 Males in St Benedict?
There are 33.33 Females per 100 Males in St Benedict.
What is the Median Population Age in St Benedict?
Median Population Age in St Benedict is 43.6 Years.
What is the Average Family Size in St Benedict
Average Family Size in St Benedict is 2.5 People.
What is the Average Household Size in St Benedict
Average Household Size in St Benedict is 1.5 People.
How Large is the Labor Force in St Benedict?
There are 36 People in the Labor Forcein in St Benedict.
What is the Percentage of People in the Labor Force in St Benedict?
81.8% of People are in the Labor Force in St Benedict.
What is the Unemployment Rate in St Benedict?
Unemployment Rate in St Benedict is 25.0%.