Oconomowoc Lake, WI Map & Demographics
Oconomowoc Lake Map
Oconomowoc Lake Overview
$125,596
PER CAPITA INCOME
$250,001
AVG FAMILY INCOME
$250,001
AVG HOUSEHOLD INCOME
0.46
INEQUALITY / GINI INDEX
691
TOTAL POPULATION
290
MALE POPULATION
401
FEMALE POPULATION
72.32
MALES / 100 FEMALES
138.28
FEMALES / 100 MALES
55.3
MEDIAN AGE
3.1
AVG FAMILY SIZE
2.9
AVG HOUSEHOLD SIZE
424
LABOR FORCE [ PEOPLE ]
68.8%
PERCENT IN LABOR FORCE
2.1%
UNEMPLOYMENT RATE
Income in Oconomowoc Lake
Income Overview in Oconomowoc Lake
Per Capita Income in Oconomowoc Lake is $125,596, while median incomes of families and households are $250,001 and $250,001 respectively.
| Characteristic | Number | Measure |
| Per Capita Income | 691 | $125,596 |
| Median Family Income | 209 | $250,001 |
| Mean Family Income | 209 | $367,479 |
| Median Household Income | 241 | $250,001 |
| Mean Household Income | 241 | $356,010 |
| Income Deficit | 209 | $0 |
| Wage / Income Gap (%) | 691 | 0.00% |
| Wage / Income Gap ($) | 691 | 100.00¢ per $1 |
| Gini / Inequality Index | 691 | 0.46 |
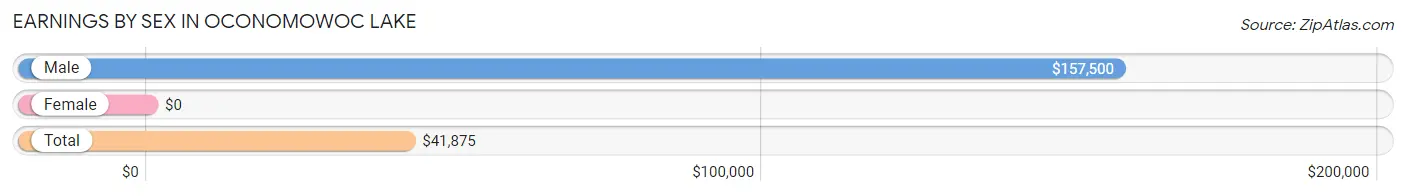
Earnings by Sex in Oconomowoc Lake
| Sex | Number | Average Earnings |
| Male | 210 (46.6%) | $157,500 |
| Female | 241 (53.4%) | $0 |
| Total | 451 (100.0%) | $41,875 |
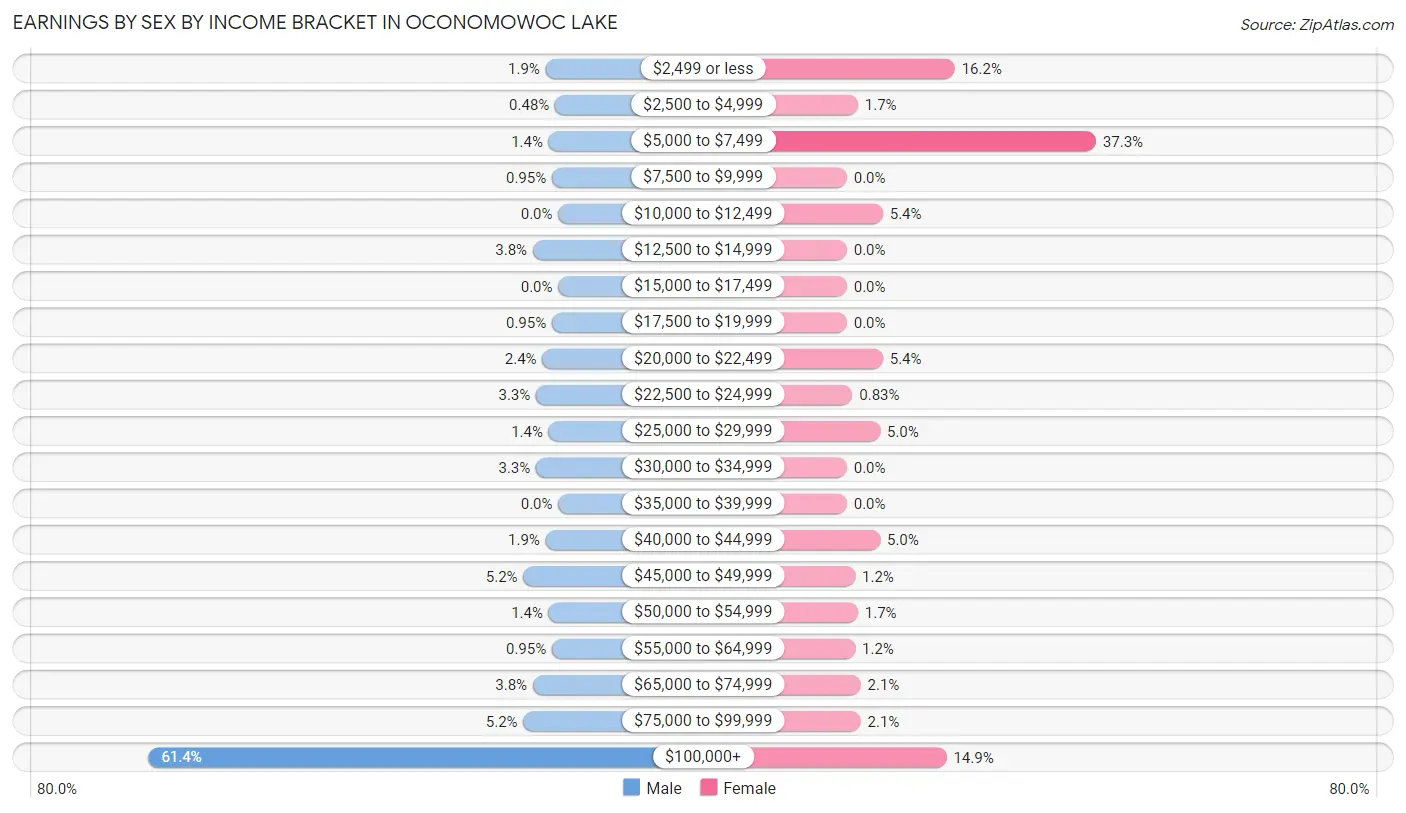
Earnings by Sex by Income Bracket in Oconomowoc Lake
The most common earnings brackets in Oconomowoc Lake are $100,000+ for men (129 | 61.4%) and $5,000 to $7,499 for women (90 | 37.3%).
| Income | Male | Female |
| $2,499 or less | 4 (1.9%) | 39 (16.2%) |
| $2,500 to $4,999 | 1 (0.5%) | 4 (1.7%) |
| $5,000 to $7,499 | 3 (1.4%) | 90 (37.3%) |
| $7,500 to $9,999 | 2 (0.9%) | 0 (0.0%) |
| $10,000 to $12,499 | 0 (0.0%) | 13 (5.4%) |
| $12,500 to $14,999 | 8 (3.8%) | 0 (0.0%) |
| $15,000 to $17,499 | 0 (0.0%) | 0 (0.0%) |
| $17,500 to $19,999 | 2 (0.9%) | 0 (0.0%) |
| $20,000 to $22,499 | 5 (2.4%) | 13 (5.4%) |
| $22,500 to $24,999 | 7 (3.3%) | 2 (0.8%) |
| $25,000 to $29,999 | 3 (1.4%) | 12 (5.0%) |
| $30,000 to $34,999 | 7 (3.3%) | 0 (0.0%) |
| $35,000 to $39,999 | 0 (0.0%) | 0 (0.0%) |
| $40,000 to $44,999 | 4 (1.9%) | 12 (5.0%) |
| $45,000 to $49,999 | 11 (5.2%) | 3 (1.2%) |
| $50,000 to $54,999 | 3 (1.4%) | 4 (1.7%) |
| $55,000 to $64,999 | 2 (0.9%) | 3 (1.2%) |
| $65,000 to $74,999 | 8 (3.8%) | 5 (2.1%) |
| $75,000 to $99,999 | 11 (5.2%) | 5 (2.1%) |
| $100,000+ | 129 (61.4%) | 36 (14.9%) |
| Total | 210 (100.0%) | 241 (100.0%) |
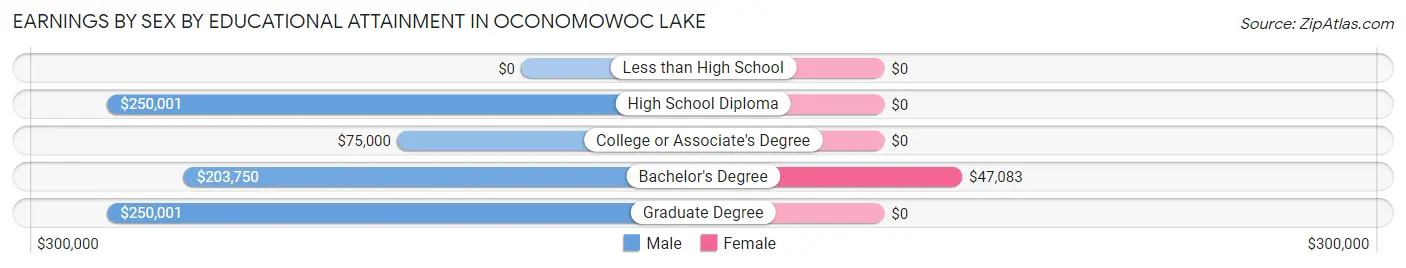
Earnings by Sex by Educational Attainment in Oconomowoc Lake
| Educational Attainment | Male Income | Female Income |
| Less than High School | - | - |
| High School Diploma | $250,001 | $0 |
| College or Associate's Degree | $75,000 | $0 |
| Bachelor's Degree | $203,750 | $47,083 |
| Graduate Degree | $250,001 | $0 |
| Total | $210,000 | $0 |
Family Income in Oconomowoc Lake
Family Income Brackets in Oconomowoc Lake
According to the Oconomowoc Lake family income data, there are 137 families falling into the $200,000+ income range, which is the most common income bracket and makes up 65.5% of all families.
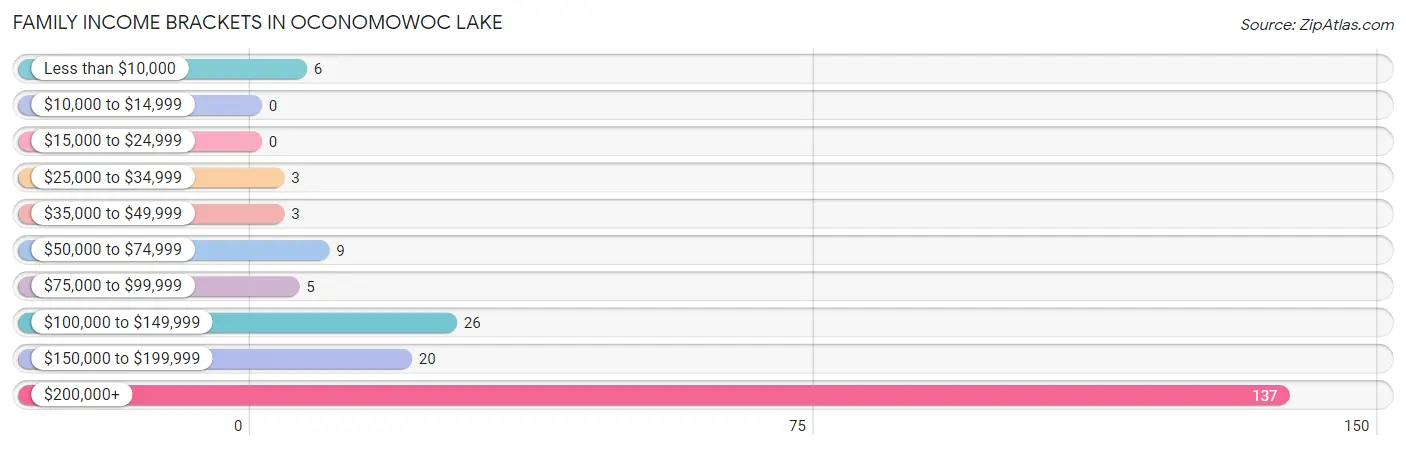
| Income Bracket | # Families | % Families |
| Less than $10,000 | 6 | 2.9% |
| $10,000 to $14,999 | 0 | 0.0% |
| $15,000 to $24,999 | 0 | 0.0% |
| $25,000 to $34,999 | 3 | 1.4% |
| $35,000 to $49,999 | 3 | 1.4% |
| $50,000 to $74,999 | 9 | 4.3% |
| $75,000 to $99,999 | 5 | 2.4% |
| $100,000 to $149,999 | 26 | 12.4% |
| $150,000 to $199,999 | 20 | 9.6% |
| $200,000+ | 137 | 65.6% |
Family Income by Famaliy Size in Oconomowoc Lake
2-person families (121 | 57.9%) account for the highest median family income in Oconomowoc Lake with $250,001 per family, while 2-person families (121 | 57.9%) have the highest median income of $125,000 per family member.
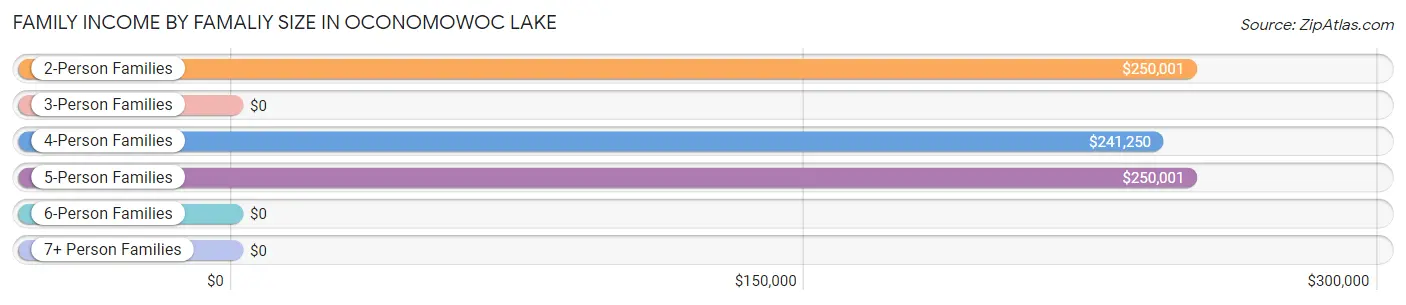
| Income Bracket | # Families | Median Income |
| 2-Person Families | 121 (57.9%) | $250,001 |
| 3-Person Families | 36 (17.2%) | $0 |
| 4-Person Families | 46 (22.0%) | $241,250 |
| 5-Person Families | 6 (2.9%) | $250,001 |
| 6-Person Families | 0 (0.0%) | $0 |
| 7+ Person Families | 0 (0.0%) | $0 |
| Total | 209 (100.0%) | $250,001 |
Family Income by Number of Earners in Oconomowoc Lake
The median family income in Oconomowoc Lake is $250,001, with families comprising 1 earner (47) having the highest median family income of $250,001, while families with no earners (30) have the lowest median family income of $211,250, accounting for 22.5% and 14.3% of families, respectively.
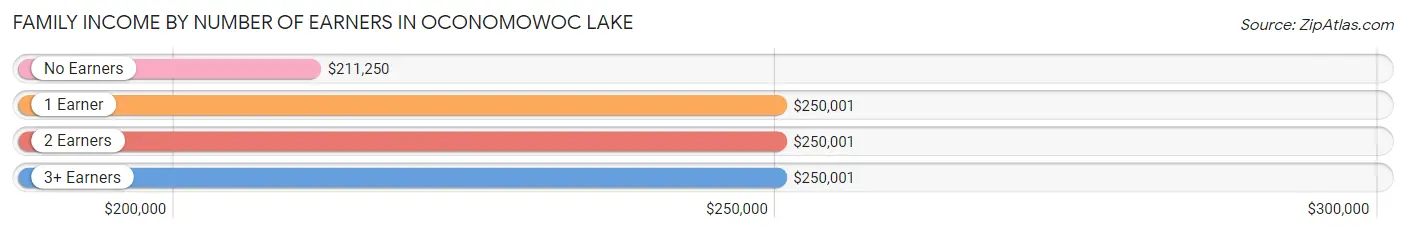
| Number of Earners | # Families | Median Income |
| No Earners | 30 (14.3%) | $211,250 |
| 1 Earner | 47 (22.5%) | $250,001 |
| 2 Earners | 109 (52.1%) | $250,001 |
| 3+ Earners | 23 (11.0%) | $250,001 |
| Total | 209 (100.0%) | $250,001 |
Household Income in Oconomowoc Lake
Household Income Brackets in Oconomowoc Lake
With 158 households falling in the category, the $200,000+ income range is the most frequent in Oconomowoc Lake, accounting for 65.6% of all households.
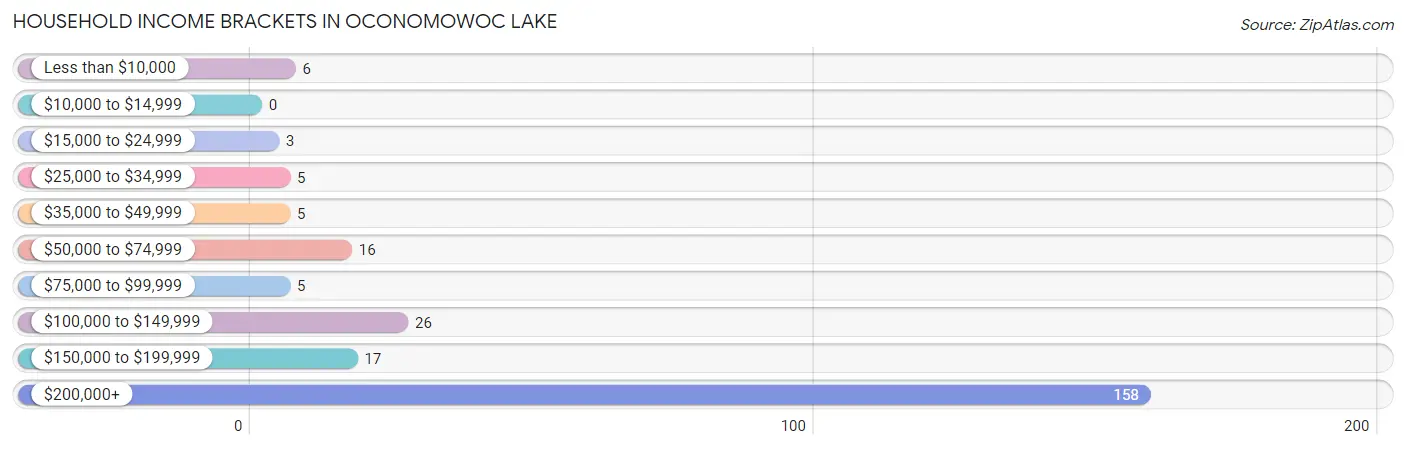
| Income Bracket | # Households | % Households |
| Less than $10,000 | 6 | 2.5% |
| $10,000 to $14,999 | 0 | 0.0% |
| $15,000 to $24,999 | 3 | 1.2% |
| $25,000 to $34,999 | 5 | 2.1% |
| $35,000 to $49,999 | 5 | 2.1% |
| $50,000 to $74,999 | 16 | 6.6% |
| $75,000 to $99,999 | 5 | 2.1% |
| $100,000 to $149,999 | 26 | 10.8% |
| $150,000 to $199,999 | 17 | 7.1% |
| $200,000+ | 158 | 65.6% |
Household Income by Householder Age in Oconomowoc Lake
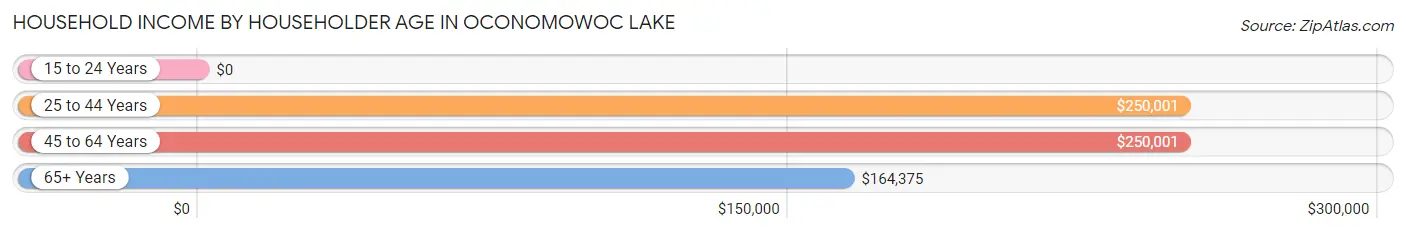
The median household income in Oconomowoc Lake is $250,001, with the highest median household income of $250,001 found in the 25 to 44 years age bracket for the primary householder. A total of 28 households (11.6%) fall into this category.
| Income Bracket | # Households | Median Income |
| 15 to 24 Years | 0 (0.0%) | $0 |
| 25 to 44 Years | 28 (11.6%) | $250,001 |
| 45 to 64 Years | 162 (67.2%) | $250,001 |
| 65+ Years | 51 (21.2%) | $164,375 |
| Total | 241 (100.0%) | $250,001 |
Poverty in Oconomowoc Lake
Income Below Poverty by Sex and Age in Oconomowoc Lake
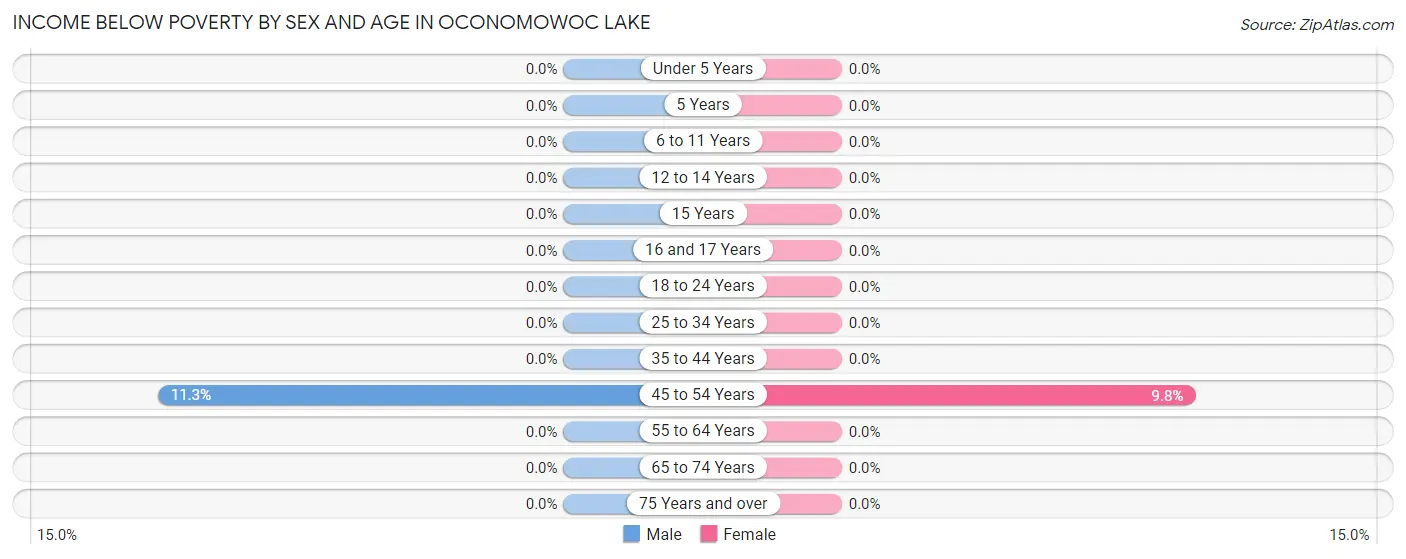
With 2.4% poverty level for males and 1.5% for females among the residents of Oconomowoc Lake, 45 to 54 year old males and 45 to 54 year old females are the most vulnerable to poverty, with 7 males (11.3%) and 6 females (9.8%) in their respective age groups living below the poverty level.
| Age Bracket | Male | Female |
| Under 5 Years | 0 (0.0%) | 0 (0.0%) |
| 5 Years | 0 (0.0%) | 0 (0.0%) |
| 6 to 11 Years | 0 (0.0%) | 0 (0.0%) |
| 12 to 14 Years | 0 (0.0%) | 0 (0.0%) |
| 15 Years | 0 (0.0%) | 0 (0.0%) |
| 16 and 17 Years | 0 (0.0%) | 0 (0.0%) |
| 18 to 24 Years | 0 (0.0%) | 0 (0.0%) |
| 25 to 34 Years | 0 (0.0%) | 0 (0.0%) |
| 35 to 44 Years | 0 (0.0%) | 0 (0.0%) |
| 45 to 54 Years | 7 (11.3%) | 6 (9.8%) |
| 55 to 64 Years | 0 (0.0%) | 0 (0.0%) |
| 65 to 74 Years | 0 (0.0%) | 0 (0.0%) |
| 75 Years and over | 0 (0.0%) | 0 (0.0%) |
| Total | 7 (2.4%) | 6 (1.5%) |
Income Above Poverty by Sex and Age in Oconomowoc Lake
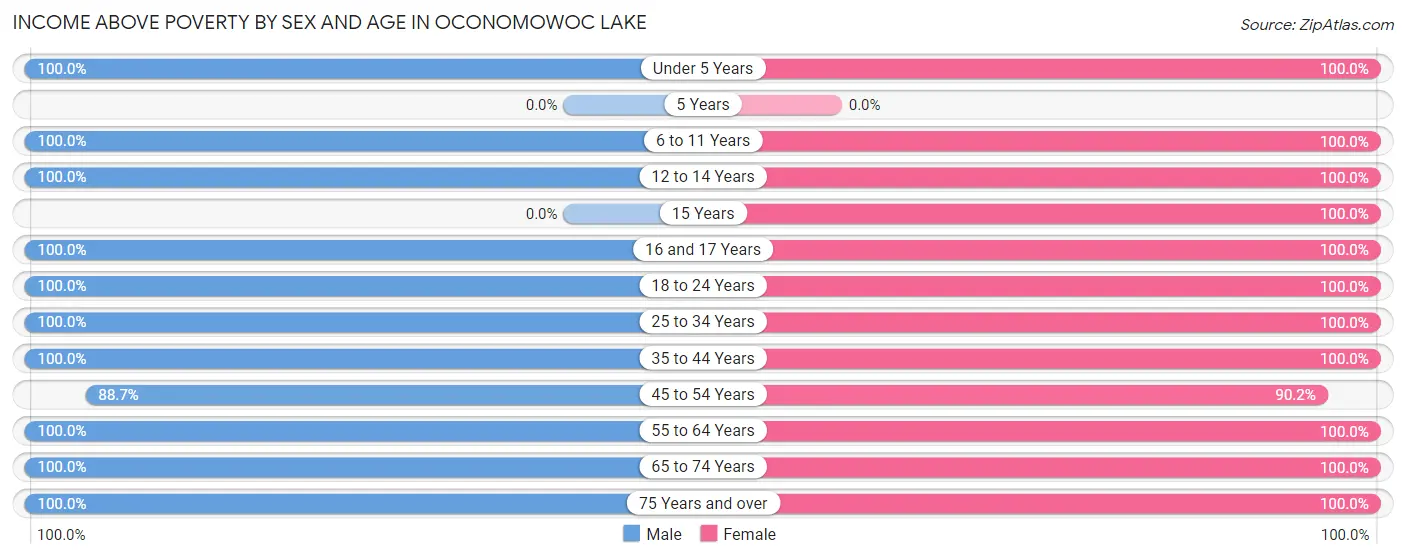
According to the poverty statistics in Oconomowoc Lake, males aged under 5 years and females aged under 5 years are the age groups that are most secure financially, with 100.0% of males and 100.0% of females in these age groups living above the poverty line.
| Age Bracket | Male | Female |
| Under 5 Years | 10 (100.0%) | 19 (100.0%) |
| 5 Years | 0 (0.0%) | 0 (0.0%) |
| 6 to 11 Years | 2 (100.0%) | 7 (100.0%) |
| 12 to 14 Years | 17 (100.0%) | 14 (100.0%) |
| 15 Years | 0 (0.0%) | 6 (100.0%) |
| 16 and 17 Years | 5 (100.0%) | 19 (100.0%) |
| 18 to 24 Years | 22 (100.0%) | 33 (100.0%) |
| 25 to 34 Years | 19 (100.0%) | 18 (100.0%) |
| 35 to 44 Years | 13 (100.0%) | 12 (100.0%) |
| 45 to 54 Years | 55 (88.7%) | 55 (90.2%) |
| 55 to 64 Years | 93 (100.0%) | 86 (100.0%) |
| 65 to 74 Years | 28 (100.0%) | 112 (100.0%) |
| 75 Years and over | 19 (100.0%) | 14 (100.0%) |
| Total | 283 (97.6%) | 395 (98.5%) |
Income Below Poverty Among Married-Couple Families in Oconomowoc Lake
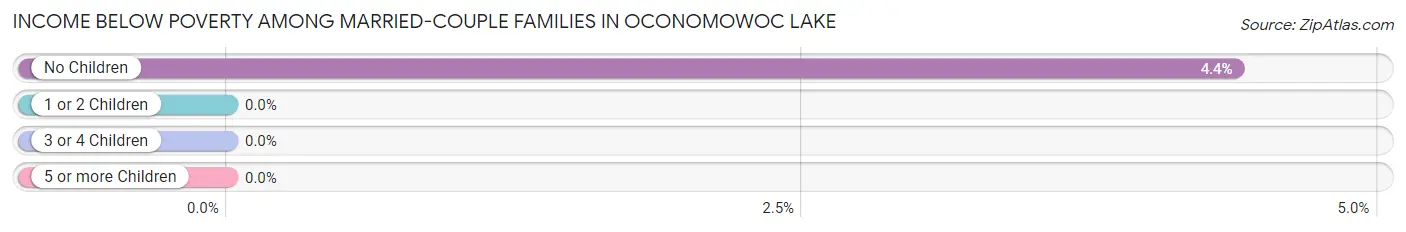
The poverty statistics for married-couple families in Oconomowoc Lake show that 3.1% or 6 of the total 191 families live below the poverty line. Families with no children have the highest poverty rate of 4.4%, comprising of 6 families. On the other hand, families with 1 or 2 children have the lowest poverty rate of 0.0%, which includes 0 families.
| Children | Above Poverty | Below Poverty |
| No Children | 131 (95.6%) | 6 (4.4%) |
| 1 or 2 Children | 51 (100.0%) | 0 (0.0%) |
| 3 or 4 Children | 3 (100.0%) | 0 (0.0%) |
| 5 or more Children | 0 (0.0%) | 0 (0.0%) |
| Total | 185 (96.9%) | 6 (3.1%) |
Income Below Poverty Among Single-Parent Households in Oconomowoc Lake
| Children | Single Father | Single Mother |
| No Children | 0 (0.0%) | 0 (0.0%) |
| 1 or 2 Children | 0 (0.0%) | 0 (0.0%) |
| 3 or 4 Children | 0 (0.0%) | 0 (0.0%) |
| 5 or more Children | 0 (0.0%) | 0 (0.0%) |
| Total | 0 (0.0%) | 0 (0.0%) |
Income Below Poverty Among Married-Couple vs Single-Parent Households in Oconomowoc Lake
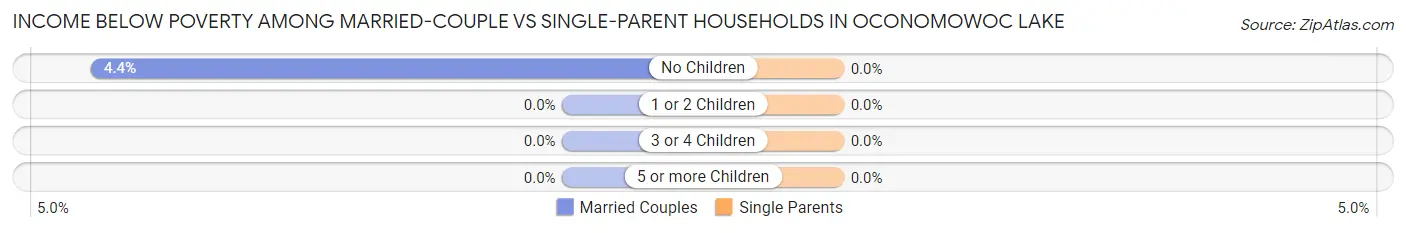
| Children | Married-Couple Families | Single-Parent Households |
| No Children | 6 (4.4%) | 0 (0.0%) |
| 1 or 2 Children | 0 (0.0%) | 0 (0.0%) |
| 3 or 4 Children | 0 (0.0%) | 0 (0.0%) |
| 5 or more Children | 0 (0.0%) | 0 (0.0%) |
| Total | 6 (3.1%) | 0 (0.0%) |
Race in Oconomowoc Lake
The most populous races in Oconomowoc Lake are White / Caucasian (572 | 82.8%), Some other Race (88 | 12.7%), and Hispanic or Latino (29 | 4.2%).
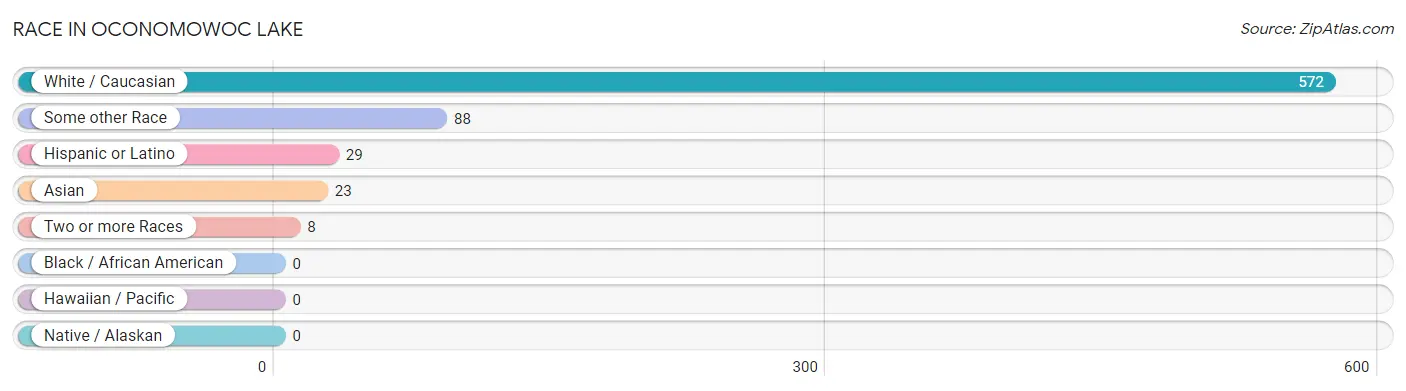
| Race | # Population | % Population |
| Asian | 23 | 3.3% |
| Black / African American | 0 | 0.0% |
| Hawaiian / Pacific | 0 | 0.0% |
| Hispanic or Latino | 29 | 4.2% |
| Native / Alaskan | 0 | 0.0% |
| White / Caucasian | 572 | 82.8% |
| Two or more Races | 8 | 1.2% |
| Some other Race | 88 | 12.7% |
| Total | 691 | 100.0% |
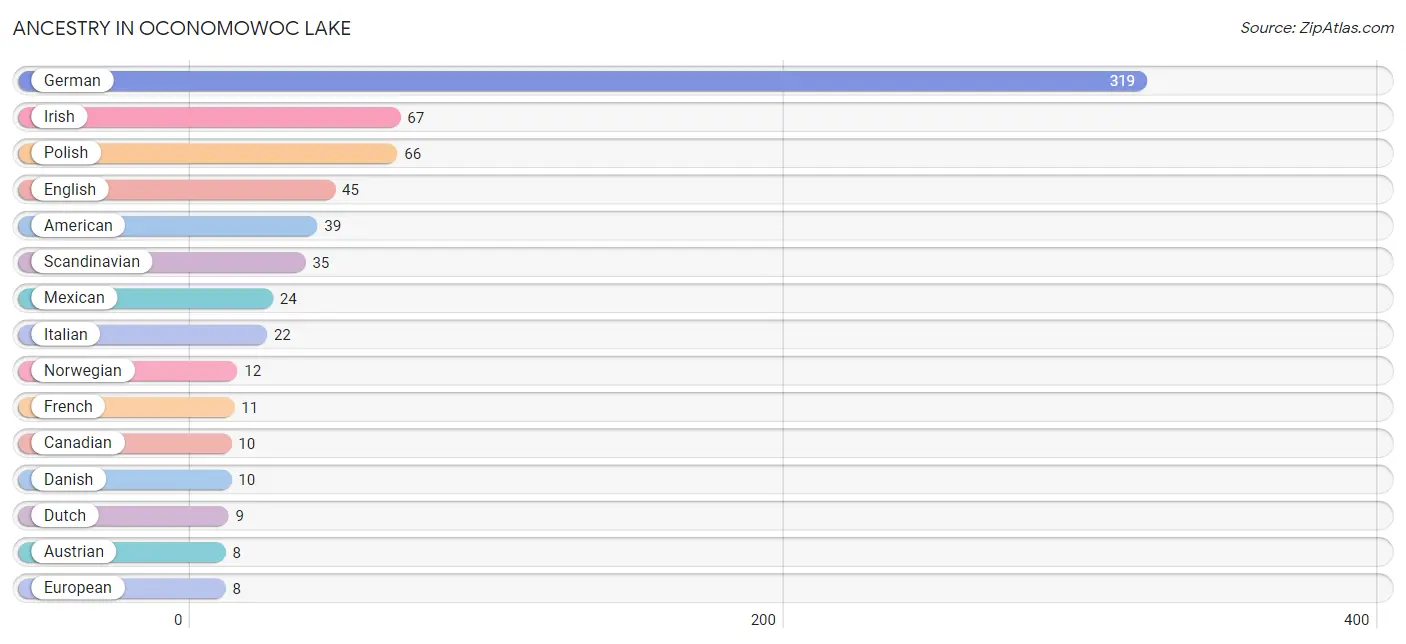
Ancestry in Oconomowoc Lake
The most populous ancestries reported in Oconomowoc Lake are German (319 | 46.2%), Irish (67 | 9.7%), Polish (66 | 9.6%), English (45 | 6.5%), and American (39 | 5.6%), together accounting for 77.6% of all Oconomowoc Lake residents.
| Ancestry | # Population | % Population |
| American | 39 | 5.6% |
| Austrian | 8 | 1.2% |
| British | 7 | 1.0% |
| Canadian | 10 | 1.5% |
| Central American | 2 | 0.3% |
| Czech | 2 | 0.3% |
| Danish | 10 | 1.5% |
| Dutch | 9 | 1.3% |
| Eastern European | 2 | 0.3% |
| English | 45 | 6.5% |
| European | 8 | 1.2% |
| Finnish | 7 | 1.0% |
| French | 11 | 1.6% |
| French Canadian | 1 | 0.1% |
| German | 319 | 46.2% |
| Guatemalan | 2 | 0.3% |
| Hungarian | 2 | 0.3% |
| Indian (Asian) | 6 | 0.9% |
| Irish | 67 | 9.7% |
| Italian | 22 | 3.2% |
| Korean | 7 | 1.0% |
| Lithuanian | 3 | 0.4% |
| Mexican | 24 | 3.5% |
| Native Hawaiian | 3 | 0.4% |
| Norwegian | 12 | 1.7% |
| Pakistani | 6 | 0.9% |
| Polish | 66 | 9.6% |
| Puerto Rican | 3 | 0.4% |
| Scandinavian | 35 | 5.1% |
| Scotch-Irish | 2 | 0.3% |
| Scottish | 2 | 0.3% |
| Slovene | 2 | 0.3% |
| Swedish | 8 | 1.2% |
| Swiss | 7 | 1.0% |
| Thai | 7 | 1.0% |
| Ukrainian | 3 | 0.4% |
| Welsh | 4 | 0.6% | View All 37 Rows |
Immigrants in Oconomowoc Lake
The most numerous immigrant groups reported in Oconomowoc Lake came from Europe (23 | 3.3%), Germany (19 | 2.8%), Western Europe (19 | 2.8%), Asia (18 | 2.6%), and South Eastern Asia (8 | 1.2%), together accounting for 12.6% of all Oconomowoc Lake residents.
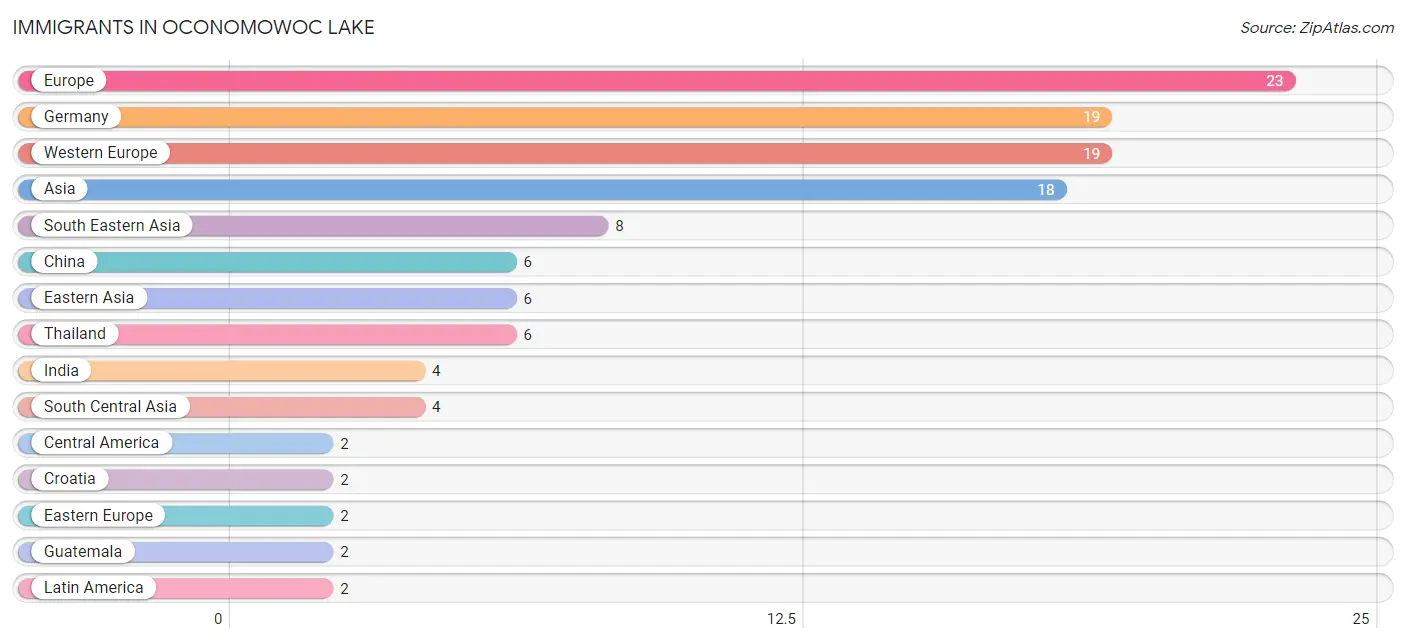
| Immigration Origin | # Population | % Population |
| Asia | 18 | 2.6% |
| Central America | 2 | 0.3% |
| China | 6 | 0.9% |
| Croatia | 2 | 0.3% |
| Eastern Asia | 6 | 0.9% |
| Eastern Europe | 2 | 0.3% |
| Europe | 23 | 3.3% |
| Germany | 19 | 2.8% |
| Guatemala | 2 | 0.3% |
| India | 4 | 0.6% |
| Latin America | 2 | 0.3% |
| Northern Europe | 2 | 0.3% |
| Philippines | 2 | 0.3% |
| South Central Asia | 4 | 0.6% |
| South Eastern Asia | 8 | 1.2% |
| Thailand | 6 | 0.9% |
| Western Europe | 19 | 2.8% | View All 17 Rows |
Sex and Age in Oconomowoc Lake
Sex and Age in Oconomowoc Lake
The most populous age groups in Oconomowoc Lake are 60 to 64 Years (50 | 17.2%) for men and 65 to 69 Years (94 | 23.4%) for women.
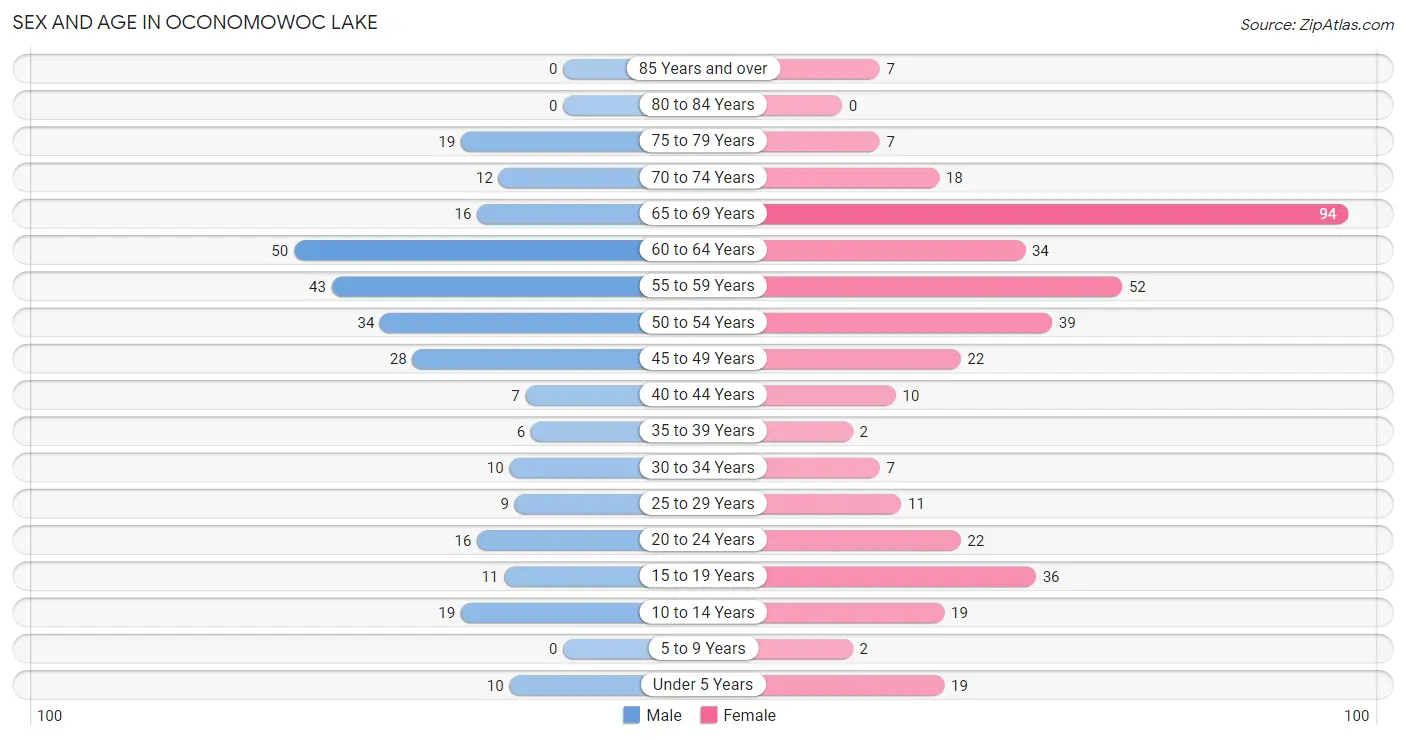
| Age Bracket | Male | Female |
| Under 5 Years | 10 (3.5%) | 19 (4.7%) |
| 5 to 9 Years | 0 (0.0%) | 2 (0.5%) |
| 10 to 14 Years | 19 (6.6%) | 19 (4.7%) |
| 15 to 19 Years | 11 (3.8%) | 36 (9.0%) |
| 20 to 24 Years | 16 (5.5%) | 22 (5.5%) |
| 25 to 29 Years | 9 (3.1%) | 11 (2.7%) |
| 30 to 34 Years | 10 (3.5%) | 7 (1.8%) |
| 35 to 39 Years | 6 (2.1%) | 2 (0.5%) |
| 40 to 44 Years | 7 (2.4%) | 10 (2.5%) |
| 45 to 49 Years | 28 (9.7%) | 22 (5.5%) |
| 50 to 54 Years | 34 (11.7%) | 39 (9.7%) |
| 55 to 59 Years | 43 (14.8%) | 52 (13.0%) |
| 60 to 64 Years | 50 (17.2%) | 34 (8.5%) |
| 65 to 69 Years | 16 (5.5%) | 94 (23.4%) |
| 70 to 74 Years | 12 (4.1%) | 18 (4.5%) |
| 75 to 79 Years | 19 (6.6%) | 7 (1.8%) |
| 80 to 84 Years | 0 (0.0%) | 0 (0.0%) |
| 85 Years and over | 0 (0.0%) | 7 (1.8%) |
| Total | 290 (100.0%) | 401 (100.0%) |
Families and Households in Oconomowoc Lake
Median Family Size in Oconomowoc Lake
The median family size in Oconomowoc Lake is 3.07 persons per family, with single female/mother families (9 | 4.3%) accounting for the largest median family size of 3.11 persons per family. On the other hand, single male/father families (9 | 4.3%) represent the smallest median family size with 2.33 persons per family.
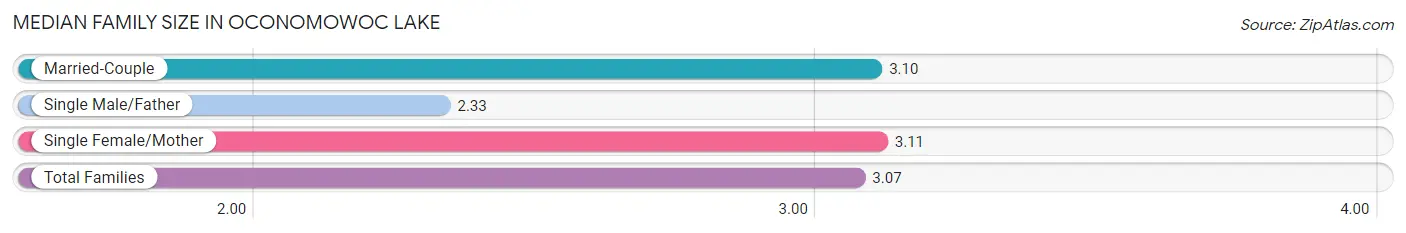
| Family Type | # Families | Family Size |
| Married-Couple | 191 (91.4%) | 3.10 |
| Single Male/Father | 9 (4.3%) | 2.33 |
| Single Female/Mother | 9 (4.3%) | 3.11 |
| Total Families | 209 (100.0%) | 3.07 |
Median Household Size in Oconomowoc Lake
The median household size in Oconomowoc Lake is 2.87 persons per household, with single female/mother households (9 | 3.7%) accounting for the largest median household size of 3.67 persons per household. non-family households (32 | 13.3%) represent the smallest median household size with 1.34 persons per household.
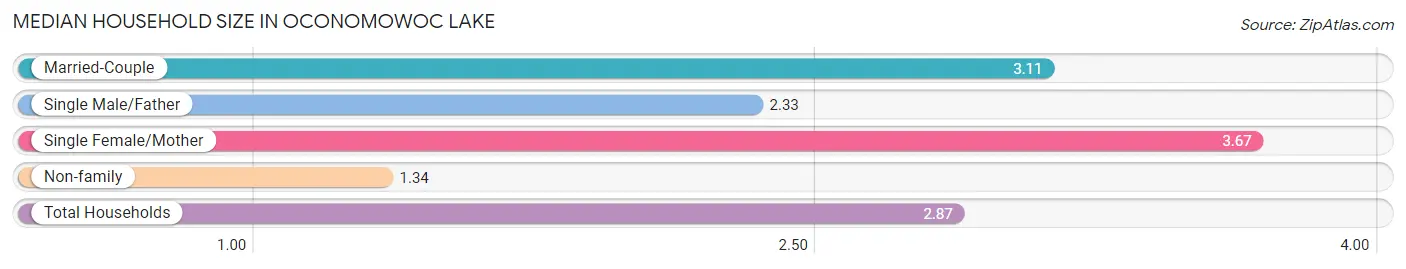
| Household Type | # Households | Household Size |
| Married-Couple | 191 (79.2%) | 3.11 |
| Single Male/Father | 9 (3.7%) | 2.33 |
| Single Female/Mother | 9 (3.7%) | 3.67 |
| Non-family | 32 (13.3%) | 1.34 |
| Total Households | 241 (100.0%) | 2.87 |
Household Size by Marriage Status in Oconomowoc Lake
Out of a total of 241 households in Oconomowoc Lake, 209 (86.7%) are family households, while 32 (13.3%) are nonfamily households. The most numerous type of family households are 2-person households, comprising 121, and the most common type of nonfamily households are 1-person households, comprising 19.
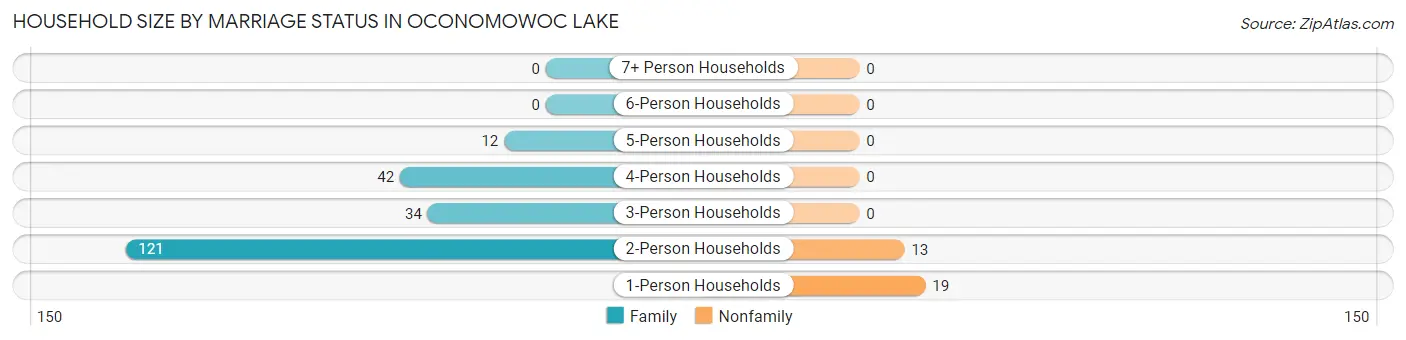
| Household Size | Family Households | Nonfamily Households |
| 1-Person Households | - | 19 (7.9%) |
| 2-Person Households | 121 (50.2%) | 13 (5.4%) |
| 3-Person Households | 34 (14.1%) | 0 (0.0%) |
| 4-Person Households | 42 (17.4%) | 0 (0.0%) |
| 5-Person Households | 12 (5.0%) | 0 (0.0%) |
| 6-Person Households | 0 (0.0%) | 0 (0.0%) |
| 7+ Person Households | 0 (0.0%) | 0 (0.0%) |
| Total | 209 (86.7%) | 32 (13.3%) |
Female Fertility in Oconomowoc Lake
Fertility by Age in Oconomowoc Lake
Average fertility rate in Oconomowoc Lake is 53.0 births per 1,000 women. Women in the age bracket of 20 to 34 years have the highest fertility rate with 150.0 births per 1,000 women. Women in the age bracket of 20 to 34 years acount for 100.0% of all women with births.
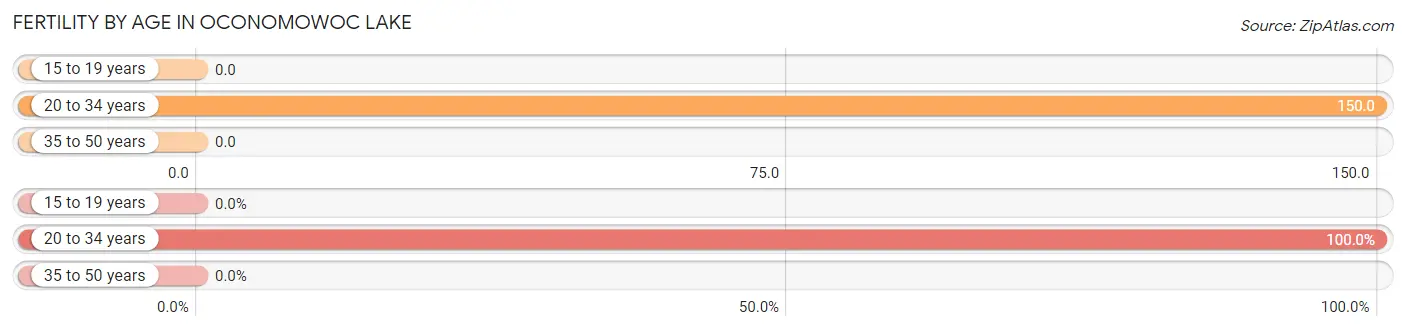
| Age Bracket | Women with Births | Births / 1,000 Women |
| 15 to 19 years | 0 (0.0%) | 0.0 |
| 20 to 34 years | 6 (100.0%) | 150.0 |
| 35 to 50 years | 0 (0.0%) | 0.0 |
| Total | 6 (100.0%) | 53.0 |
Fertility by Age by Marriage Status in Oconomowoc Lake
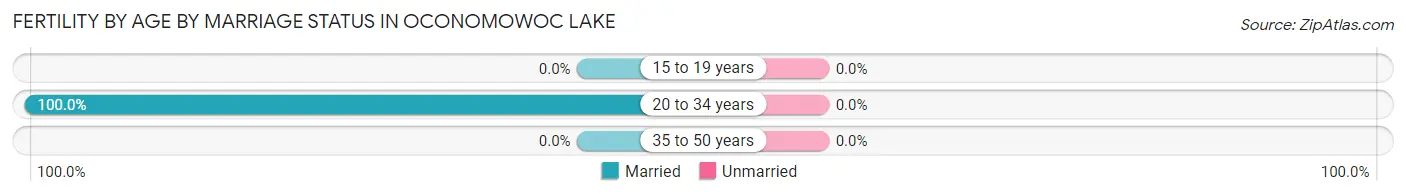
| Age Bracket | Married | Unmarried |
| 15 to 19 years | 0 (0.0%) | 0 (0.0%) |
| 20 to 34 years | 6 (100.0%) | 0 (0.0%) |
| 35 to 50 years | 0 (0.0%) | 0 (0.0%) |
| Total | 6 (100.0%) | 0 (0.0%) |
Fertility by Education in Oconomowoc Lake
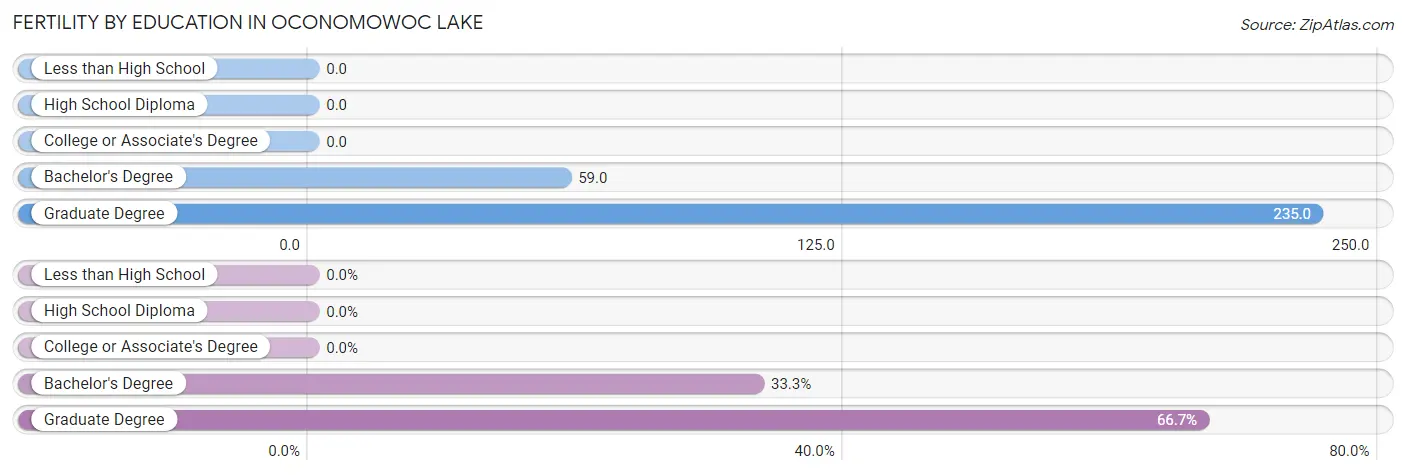
| Educational Attainment | Women with Births | Births / 1,000 Women |
| Less than High School | 0 (0.0%) | 0.0 |
| High School Diploma | 0 (0.0%) | 0.0 |
| College or Associate's Degree | 0 (0.0%) | 0.0 |
| Bachelor's Degree | 2 (33.3%) | 59.0 |
| Graduate Degree | 4 (66.7%) | 235.0 |
| Total | 6 (100.0%) | 53.0 |
Fertility by Education by Marriage Status in Oconomowoc Lake
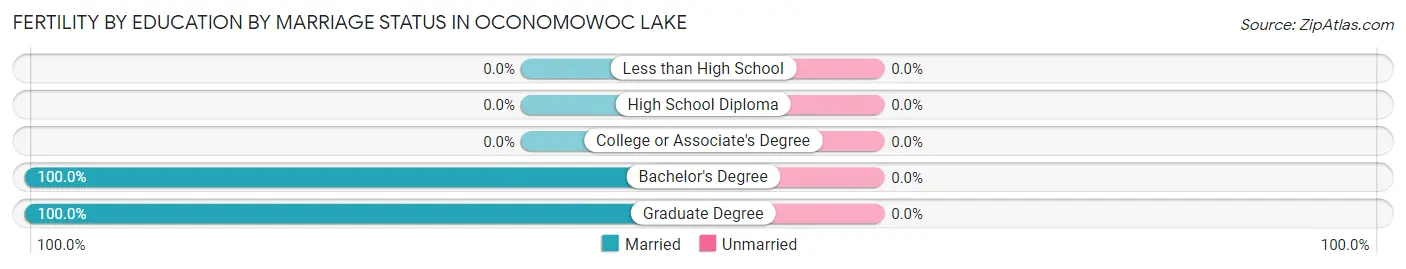
| Educational Attainment | Married | Unmarried |
| Less than High School | 0 (0.0%) | 0 (0.0%) |
| High School Diploma | 0 (0.0%) | 0 (0.0%) |
| College or Associate's Degree | 0 (0.0%) | 0 (0.0%) |
| Bachelor's Degree | 2 (100.0%) | 0 (0.0%) |
| Graduate Degree | 4 (100.0%) | 0 (0.0%) |
| Total | 6 (100.0%) | 0 (0.0%) |
Employment Characteristics in Oconomowoc Lake
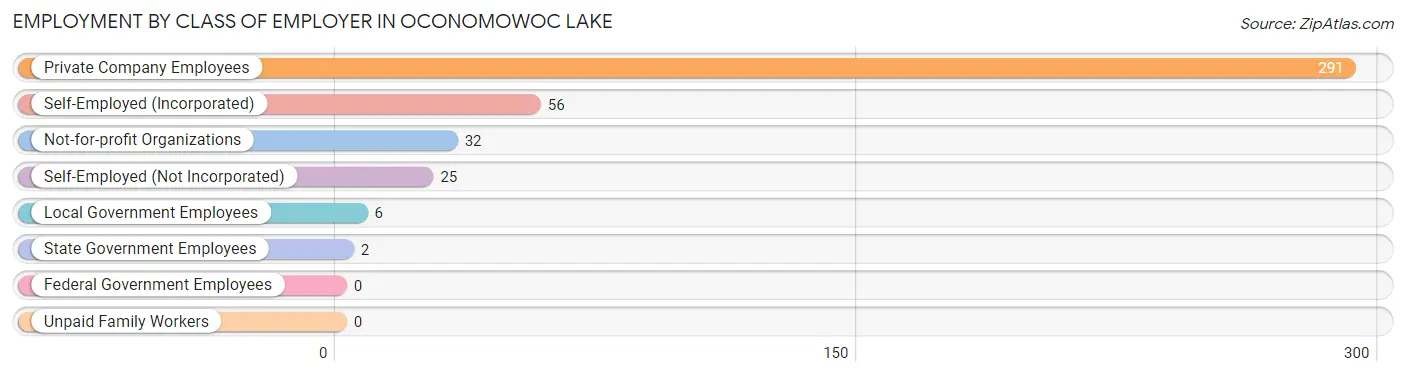
Employment by Class of Employer in Oconomowoc Lake
Among the 412 employed individuals in Oconomowoc Lake, private company employees (291 | 70.6%), self-employed (incorporated) (56 | 13.6%), and not-for-profit organizations (32 | 7.8%) make up the most common classes of employment.
| Employer Class | # Employees | % Employees |
| Private Company Employees | 291 | 70.6% |
| Self-Employed (Incorporated) | 56 | 13.6% |
| Self-Employed (Not Incorporated) | 25 | 6.1% |
| Not-for-profit Organizations | 32 | 7.8% |
| Local Government Employees | 6 | 1.5% |
| State Government Employees | 2 | 0.5% |
| Federal Government Employees | 0 | 0.0% |
| Unpaid Family Workers | 0 | 0.0% |
| Total | 412 | 100.0% |
Employment Status by Age in Oconomowoc Lake
According to the labor force statistics for Oconomowoc Lake, out of the total population over 16 years of age (616), 68.8% or 424 individuals are in the labor force, with 2.1% or 9 of them unemployed. The age group with the highest labor force participation rate is 20 to 24 years, with 100.0% or 38 individuals in the labor force. Within the labor force, the 16 to 19 years age range has the highest percentage of unemployed individuals, with 23.1% or 3 of them being unemployed.

| Age Bracket | In Labor Force | Unemployed |
| 16 to 19 Years | 13 (31.7%) | 3 (23.1%) |
| 20 to 24 Years | 38 (100.0%) | 3 (7.9%) |
| 25 to 29 Years | 20 (100.0%) | 0 (0.0%) |
| 30 to 34 Years | 17 (100.0%) | 0 (0.0%) |
| 35 to 44 Years | 22 (88.0%) | 2 (9.1%) |
| 45 to 54 Years | 75 (61.0%) | 0 (0.0%) |
| 55 to 59 Years | 67 (70.5%) | 0 (0.0%) |
| 60 to 64 Years | 63 (75.0%) | 1 (1.6%) |
| 65 to 74 Years | 102 (72.9%) | 0 (0.0%) |
| 75 Years and over | 7 (21.2%) | 0 (0.0%) |
| Total | 424 (68.8%) | 9 (2.1%) |
Employment Status by Educational Attainment in Oconomowoc Lake
According to labor force statistics for Oconomowoc Lake, 72.5% of individuals (264) out of the total population between 25 and 64 years of age (364) are in the labor force, with 1.1% or 3 of them being unemployed. The group with the highest labor force participation rate are those with the educational attainment of less than high school, with 100.0% or 11 individuals in the labor force. Within the labor force, individuals with bachelor's degree or higher education have the highest percentage of unemployment, with 1.9% or 3 of them being unemployed.
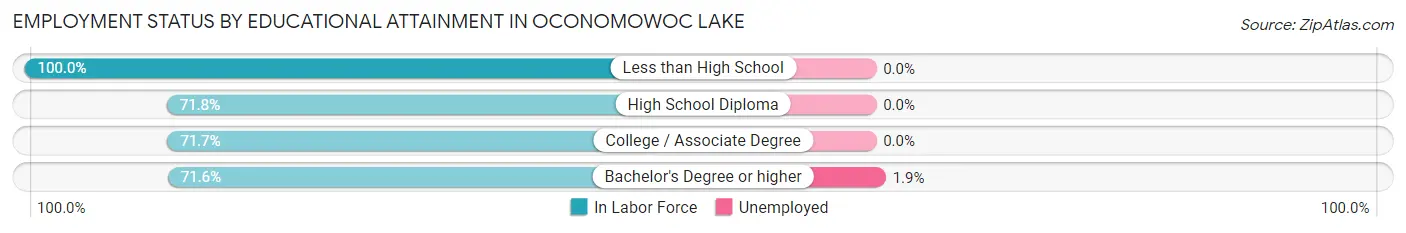
| Educational Attainment | In Labor Force | Unemployed |
| Less than High School | 11 (100.0%) | 0 (0.0%) |
| High School Diploma | 56 (71.8%) | 0 (0.0%) |
| College / Associate Degree | 38 (71.7%) | 0 (0.0%) |
| Bachelor's Degree or higher | 159 (71.6%) | 4 (1.9%) |
| Total | 264 (72.5%) | 4 (1.1%) |
Employment Occupations by Sex in Oconomowoc Lake
Management, Business, Science and Arts Occupations
The most common Management, Business, Science and Arts occupations in Oconomowoc Lake are Management (100 | 24.1%), Health Diagnosing & Treating (39 | 9.4%), Business & Financial (36 | 8.7%), Health Technologists (36 | 8.7%), and Community & Social Service (25 | 6.0%).
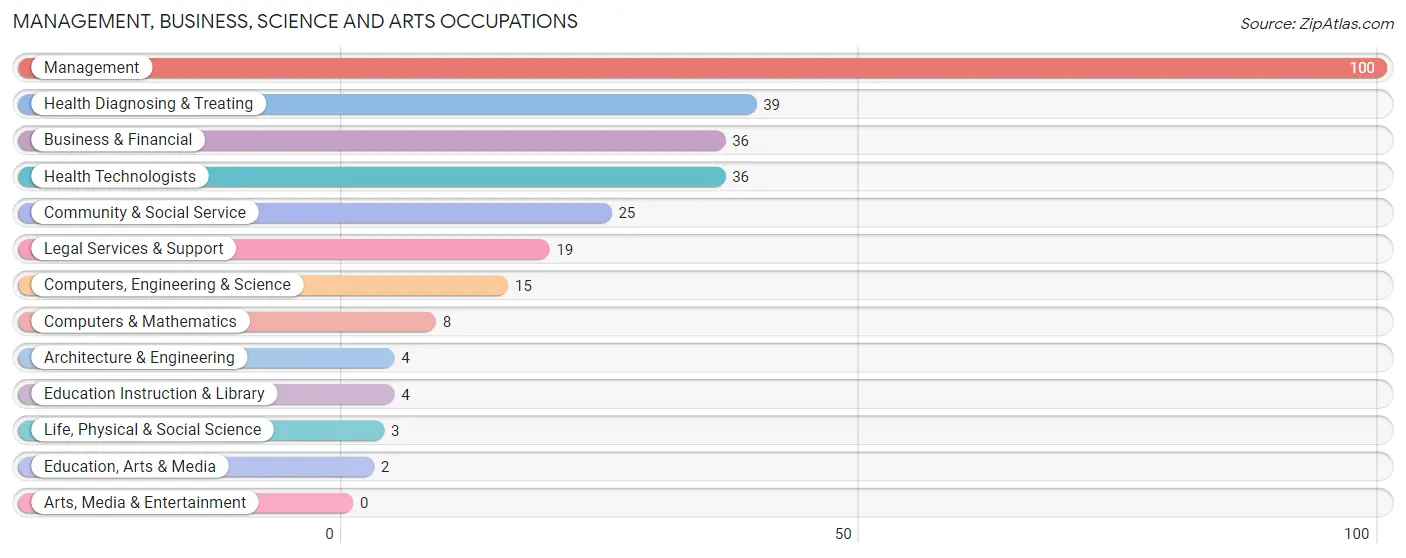
Management, Business, Science and Arts Occupations by Sex
Within the Management, Business, Science and Arts occupations in Oconomowoc Lake, the most male-oriented occupations are Architecture & Engineering (100.0%), Management (77.0%), and Computers & Mathematics (75.0%), while the most female-oriented occupations are Life, Physical & Social Science (100.0%), Education, Arts & Media (100.0%), and Health Diagnosing & Treating (59.0%).
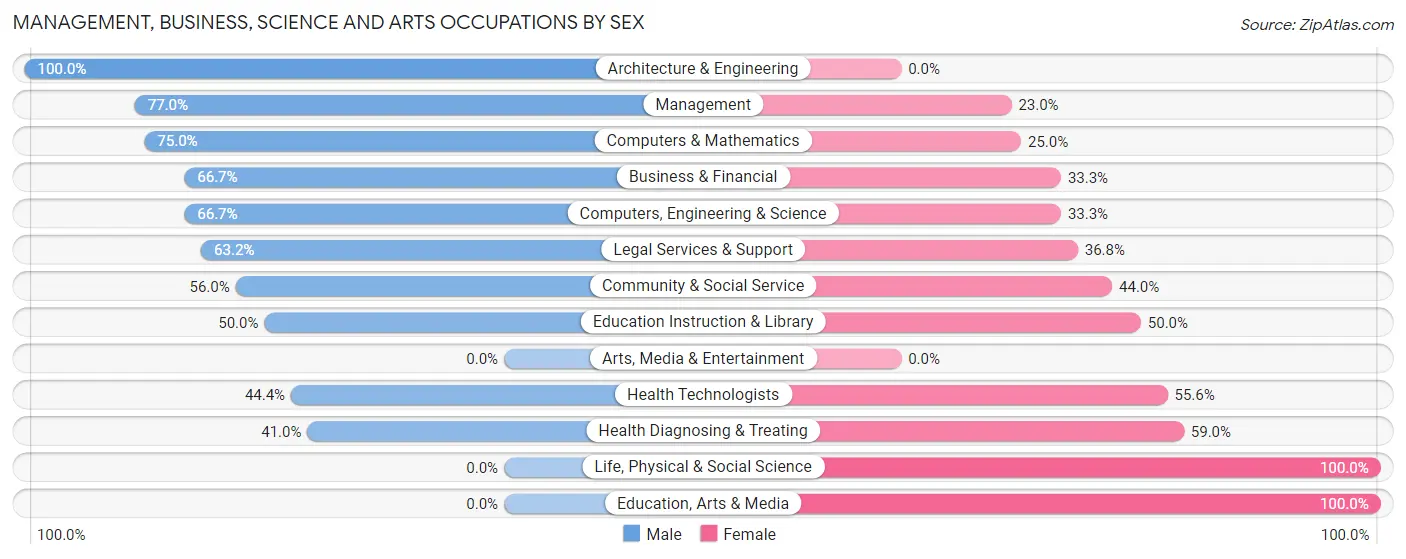
| Occupation | Male | Female |
| Management | 77 (77.0%) | 23 (23.0%) |
| Business & Financial | 24 (66.7%) | 12 (33.3%) |
| Computers, Engineering & Science | 10 (66.7%) | 5 (33.3%) |
| Computers & Mathematics | 6 (75.0%) | 2 (25.0%) |
| Architecture & Engineering | 4 (100.0%) | 0 (0.0%) |
| Life, Physical & Social Science | 0 (0.0%) | 3 (100.0%) |
| Community & Social Service | 14 (56.0%) | 11 (44.0%) |
| Education, Arts & Media | 0 (0.0%) | 2 (100.0%) |
| Legal Services & Support | 12 (63.2%) | 7 (36.8%) |
| Education Instruction & Library | 2 (50.0%) | 2 (50.0%) |
| Arts, Media & Entertainment | 0 (0.0%) | 0 (0.0%) |
| Health Diagnosing & Treating | 16 (41.0%) | 23 (59.0%) |
| Health Technologists | 16 (44.4%) | 20 (55.6%) |
| Total (Category) | 141 (65.6%) | 74 (34.4%) |
| Total (Overall) | 199 (47.9%) | 216 (52.0%) |
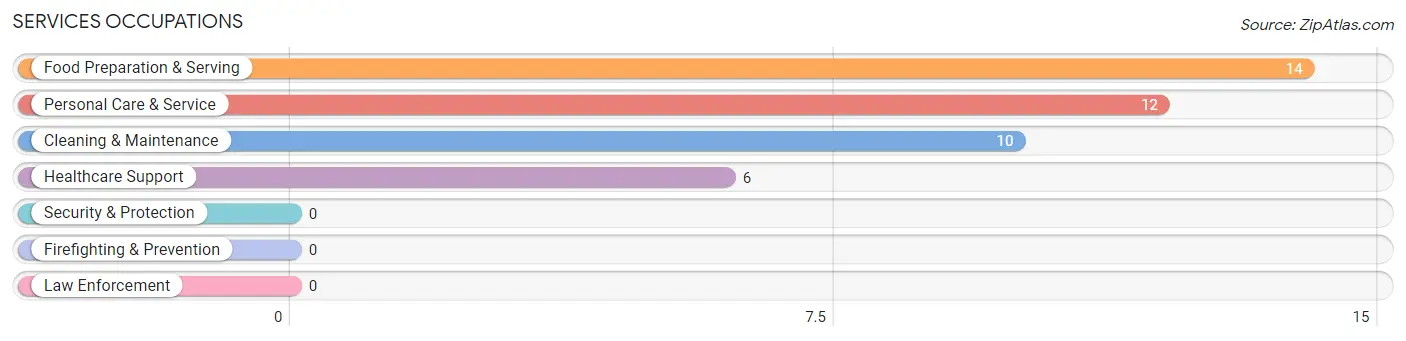
Services Occupations
The most common Services occupations in Oconomowoc Lake are Food Preparation & Serving (14 | 3.4%), Personal Care & Service (12 | 2.9%), Cleaning & Maintenance (10 | 2.4%), and Healthcare Support (6 | 1.5%).
Services Occupations by Sex
Within the Services occupations in Oconomowoc Lake, the most male-oriented occupations are Cleaning & Maintenance (80.0%), Healthcare Support (33.3%), and Food Preparation & Serving (14.3%), while the most female-oriented occupations are Personal Care & Service (100.0%), Food Preparation & Serving (85.7%), and Healthcare Support (66.7%).
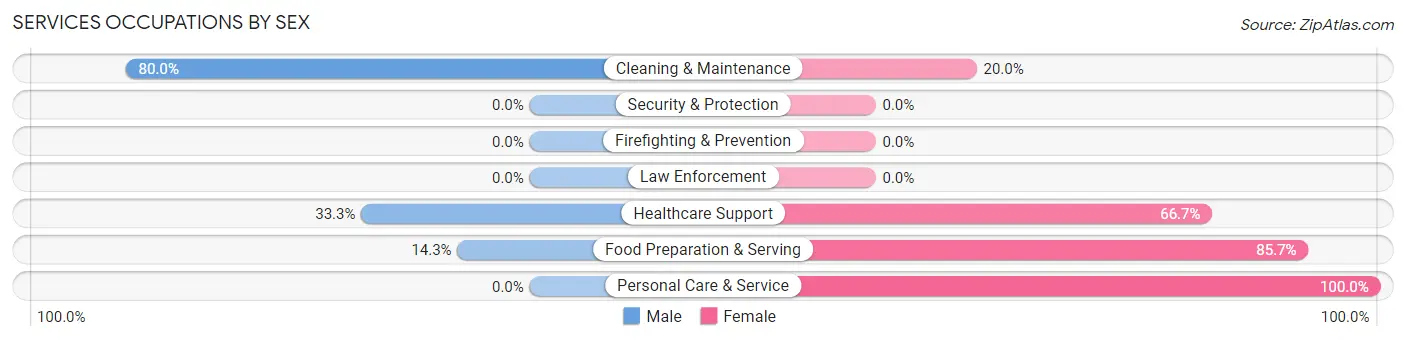
| Occupation | Male | Female |
| Healthcare Support | 2 (33.3%) | 4 (66.7%) |
| Security & Protection | 0 (0.0%) | 0 (0.0%) |
| Firefighting & Prevention | 0 (0.0%) | 0 (0.0%) |
| Law Enforcement | 0 (0.0%) | 0 (0.0%) |
| Food Preparation & Serving | 2 (14.3%) | 12 (85.7%) |
| Cleaning & Maintenance | 8 (80.0%) | 2 (20.0%) |
| Personal Care & Service | 0 (0.0%) | 12 (100.0%) |
| Total (Category) | 12 (28.6%) | 30 (71.4%) |
| Total (Overall) | 199 (47.9%) | 216 (52.0%) |
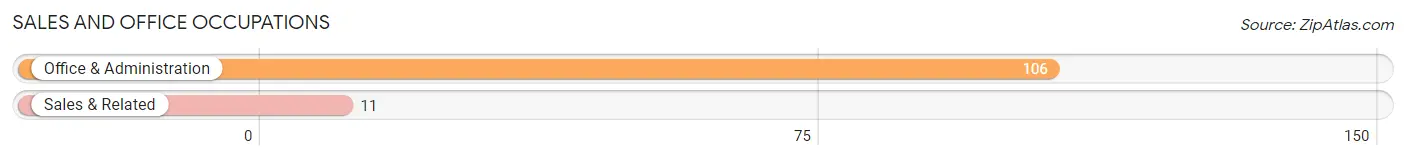
Sales and Office Occupations
The most common Sales and Office occupations in Oconomowoc Lake are Office & Administration (106 | 25.5%), and Sales & Related (11 | 2.6%).
Sales and Office Occupations by Sex
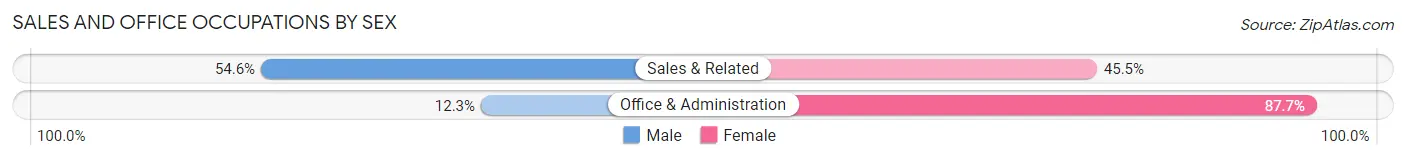
| Occupation | Male | Female |
| Sales & Related | 6 (54.5%) | 5 (45.5%) |
| Office & Administration | 13 (12.3%) | 93 (87.7%) |
| Total (Category) | 19 (16.2%) | 98 (83.8%) |
| Total (Overall) | 199 (47.9%) | 216 (52.0%) |
Natural Resources, Construction and Maintenance Occupations
The most common Natural Resources, Construction and Maintenance occupations in Oconomowoc Lake are , and Construction & Extraction (5 | 1.2%).
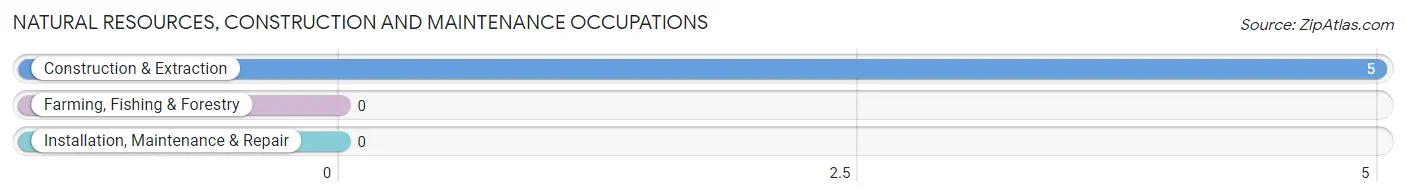
Natural Resources, Construction and Maintenance Occupations by Sex
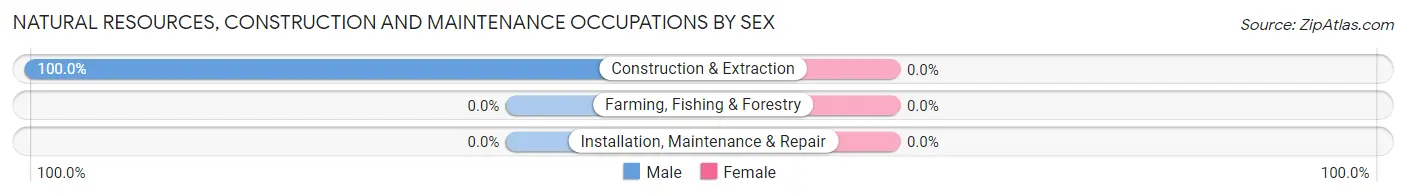
| Occupation | Male | Female |
| Farming, Fishing & Forestry | 0 (0.0%) | 0 (0.0%) |
| Construction & Extraction | 5 (100.0%) | 0 (0.0%) |
| Installation, Maintenance & Repair | 0 (0.0%) | 0 (0.0%) |
| Total (Category) | 5 (100.0%) | 0 (0.0%) |
| Total (Overall) | 199 (47.9%) | 216 (52.0%) |
Production, Transportation and Moving Occupations
The most common Production, Transportation and Moving occupations in Oconomowoc Lake are Production (15 | 3.6%), Material Moving (15 | 3.6%), and Transportation (6 | 1.5%).
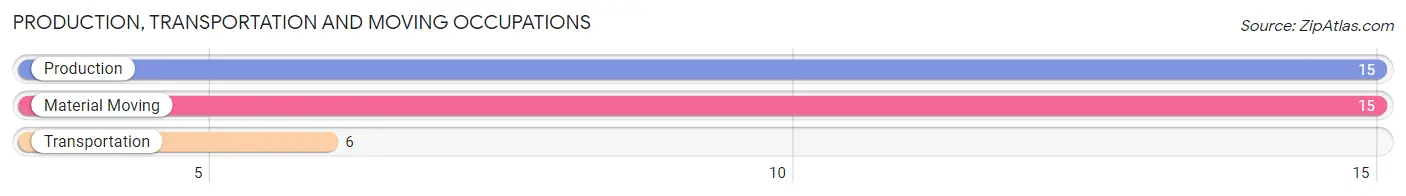
Production, Transportation and Moving Occupations by Sex
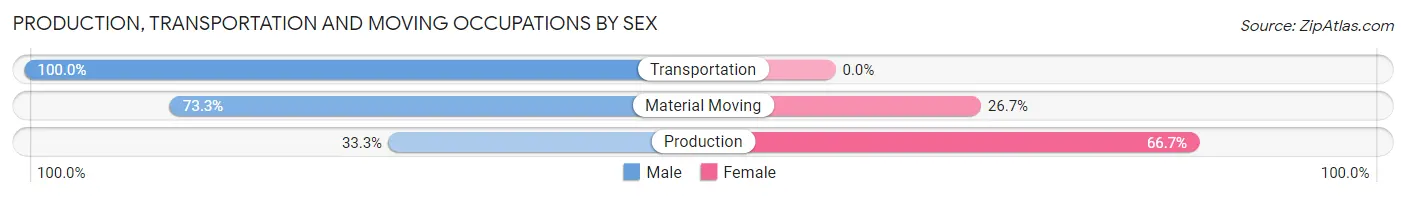
| Occupation | Male | Female |
| Production | 5 (33.3%) | 10 (66.7%) |
| Transportation | 6 (100.0%) | 0 (0.0%) |
| Material Moving | 11 (73.3%) | 4 (26.7%) |
| Total (Category) | 22 (61.1%) | 14 (38.9%) |
| Total (Overall) | 199 (47.9%) | 216 (52.0%) |
Employment Industries by Sex in Oconomowoc Lake
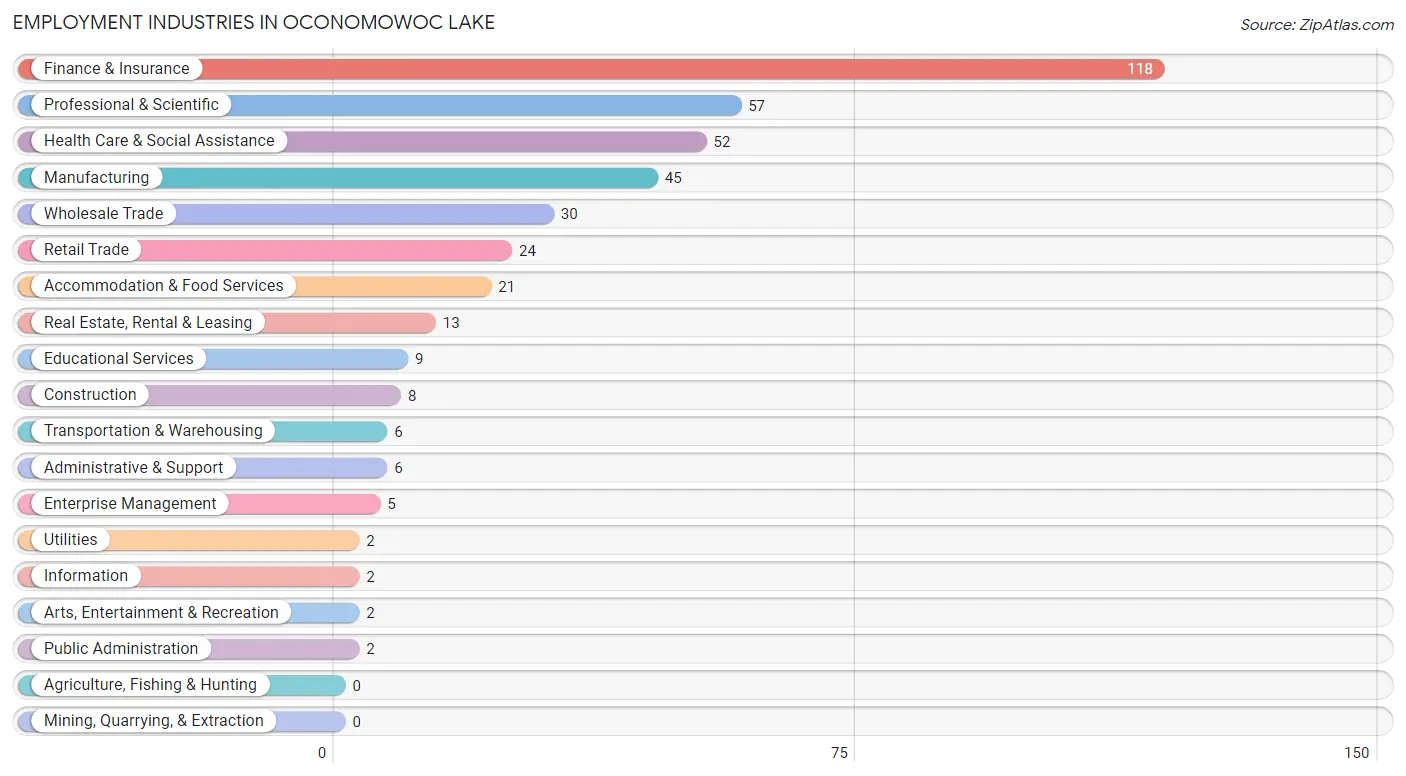
Employment Industries in Oconomowoc Lake
The major employment industries in Oconomowoc Lake include Finance & Insurance (118 | 28.4%), Professional & Scientific (57 | 13.7%), Health Care & Social Assistance (52 | 12.5%), Manufacturing (45 | 10.8%), and Wholesale Trade (30 | 7.2%).
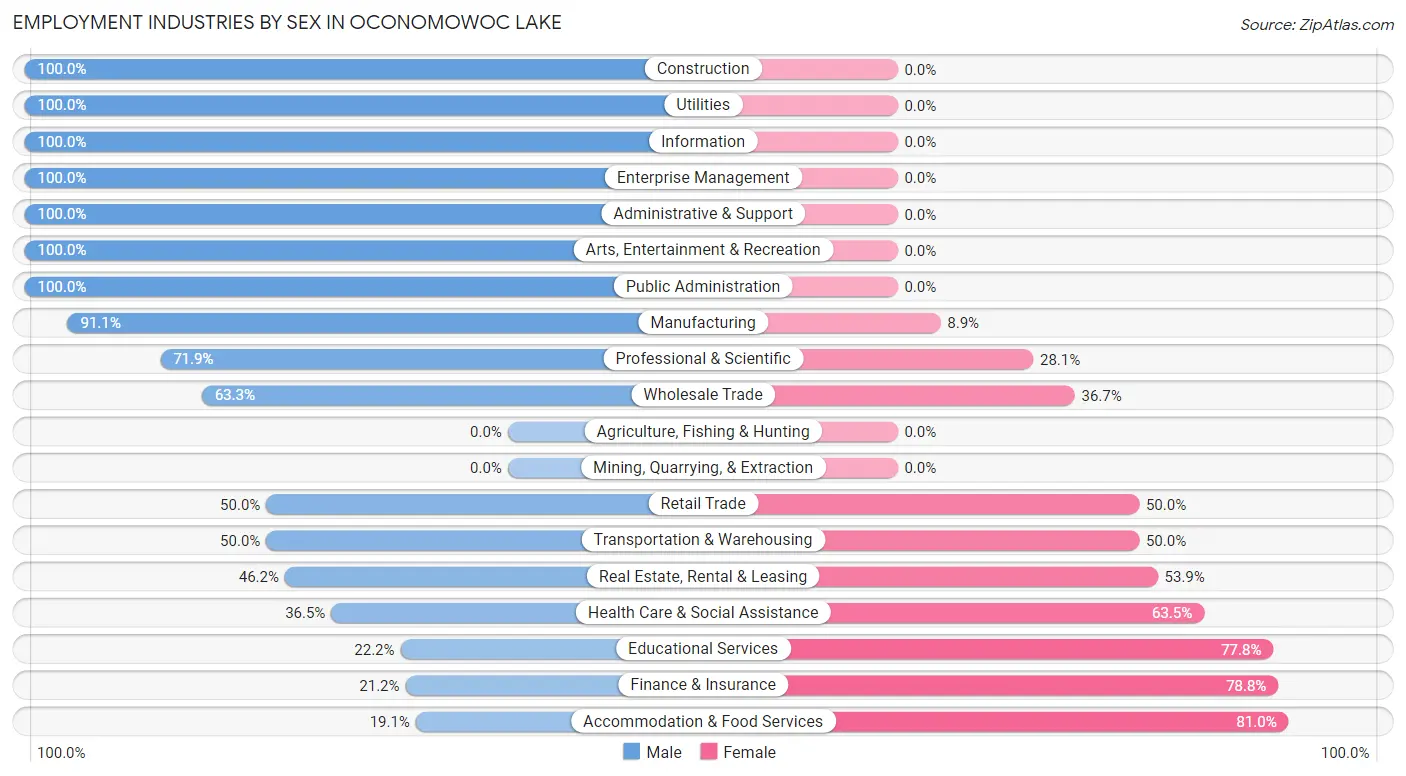
Employment Industries by Sex in Oconomowoc Lake
The Oconomowoc Lake industries that see more men than women are Construction (100.0%), Utilities (100.0%), and Information (100.0%), whereas the industries that tend to have a higher number of women are Accommodation & Food Services (80.9%), Finance & Insurance (78.8%), and Educational Services (77.8%).
| Industry | Male | Female |
| Agriculture, Fishing & Hunting | 0 (0.0%) | 0 (0.0%) |
| Mining, Quarrying, & Extraction | 0 (0.0%) | 0 (0.0%) |
| Construction | 8 (100.0%) | 0 (0.0%) |
| Manufacturing | 41 (91.1%) | 4 (8.9%) |
| Wholesale Trade | 19 (63.3%) | 11 (36.7%) |
| Retail Trade | 12 (50.0%) | 12 (50.0%) |
| Transportation & Warehousing | 3 (50.0%) | 3 (50.0%) |
| Utilities | 2 (100.0%) | 0 (0.0%) |
| Information | 2 (100.0%) | 0 (0.0%) |
| Finance & Insurance | 25 (21.2%) | 93 (78.8%) |
| Real Estate, Rental & Leasing | 6 (46.2%) | 7 (53.8%) |
| Professional & Scientific | 41 (71.9%) | 16 (28.1%) |
| Enterprise Management | 5 (100.0%) | 0 (0.0%) |
| Administrative & Support | 6 (100.0%) | 0 (0.0%) |
| Educational Services | 2 (22.2%) | 7 (77.8%) |
| Health Care & Social Assistance | 19 (36.5%) | 33 (63.5%) |
| Arts, Entertainment & Recreation | 2 (100.0%) | 0 (0.0%) |
| Accommodation & Food Services | 4 (19.1%) | 17 (80.9%) |
| Public Administration | 2 (100.0%) | 0 (0.0%) |
| Total | 199 (47.9%) | 216 (52.0%) |
Education in Oconomowoc Lake
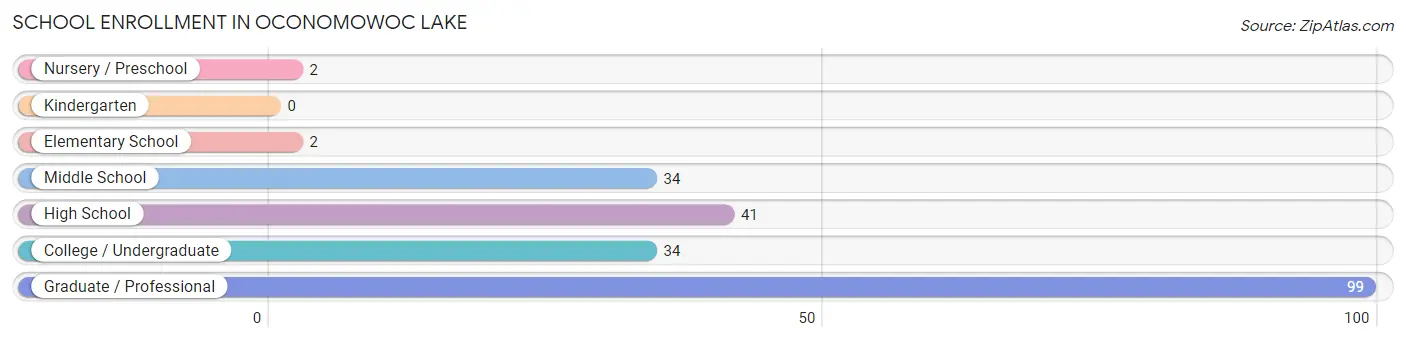
School Enrollment in Oconomowoc Lake
The most common levels of schooling among the 212 students in Oconomowoc Lake are graduate / professional (99 | 46.7%), high school (41 | 19.3%), and middle school (34 | 16.0%).
| School Level | # Students | % Students |
| Nursery / Preschool | 2 | 0.9% |
| Kindergarten | 0 | 0.0% |
| Elementary School | 2 | 0.9% |
| Middle School | 34 | 16.0% |
| High School | 41 | 19.3% |
| College / Undergraduate | 34 | 16.0% |
| Graduate / Professional | 99 | 46.7% |
| Total | 212 | 100.0% |
School Enrollment by Age by Funding Source in Oconomowoc Lake
Out of a total of 212 students who are enrolled in schools in Oconomowoc Lake, 112 (52.8%) attend a private institution, while the remaining 100 (47.2%) are enrolled in public schools. The age group of 35 years and over has the highest likelihood of being enrolled in private schools, with 85 (96.6% in the age bracket) enrolled. Conversely, the age group of 3 to 4 year olds has the lowest likelihood of being enrolled in a private school, with 2 (100.0% in the age bracket) attending a public institution.
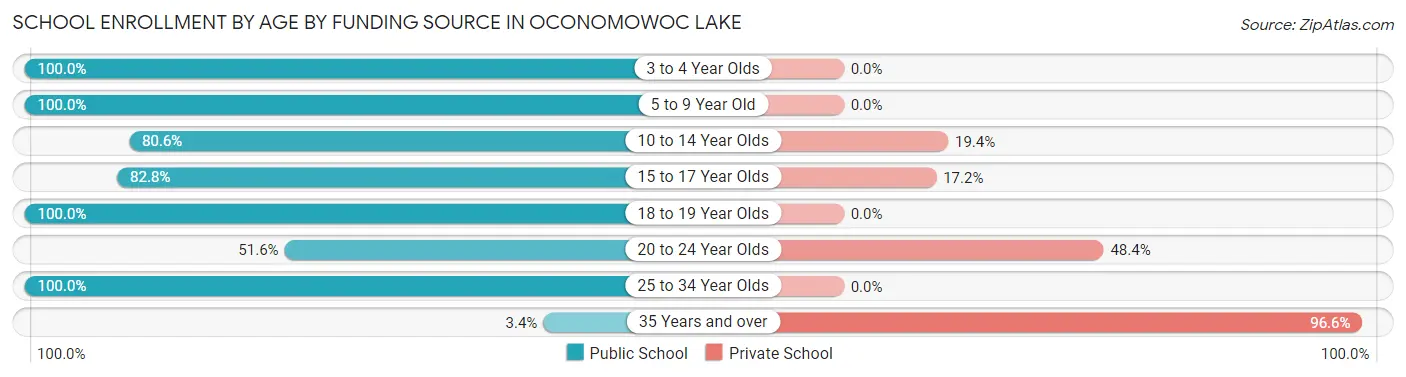
| Age Bracket | Public School | Private School |
| 3 to 4 Year Olds | 2 (100.0%) | 0 (0.0%) |
| 5 to 9 Year Old | 2 (100.0%) | 0 (0.0%) |
| 10 to 14 Year Olds | 29 (80.6%) | 7 (19.4%) |
| 15 to 17 Year Olds | 24 (82.8%) | 5 (17.2%) |
| 18 to 19 Year Olds | 17 (100.0%) | 0 (0.0%) |
| 20 to 24 Year Olds | 16 (51.6%) | 15 (48.4%) |
| 25 to 34 Year Olds | 7 (100.0%) | 0 (0.0%) |
| 35 Years and over | 3 (3.4%) | 85 (96.6%) |
| Total | 100 (47.2%) | 112 (52.8%) |
Educational Attainment by Field of Study in Oconomowoc Lake
Education (111 | 28.4%), business (90 | 23.0%), liberal arts & history (26 | 6.7%), communications (26 | 6.7%), and bio, nature & agricultural (21 | 5.4%) are the most common fields of study among 391 individuals in Oconomowoc Lake who have obtained a bachelor's degree or higher.
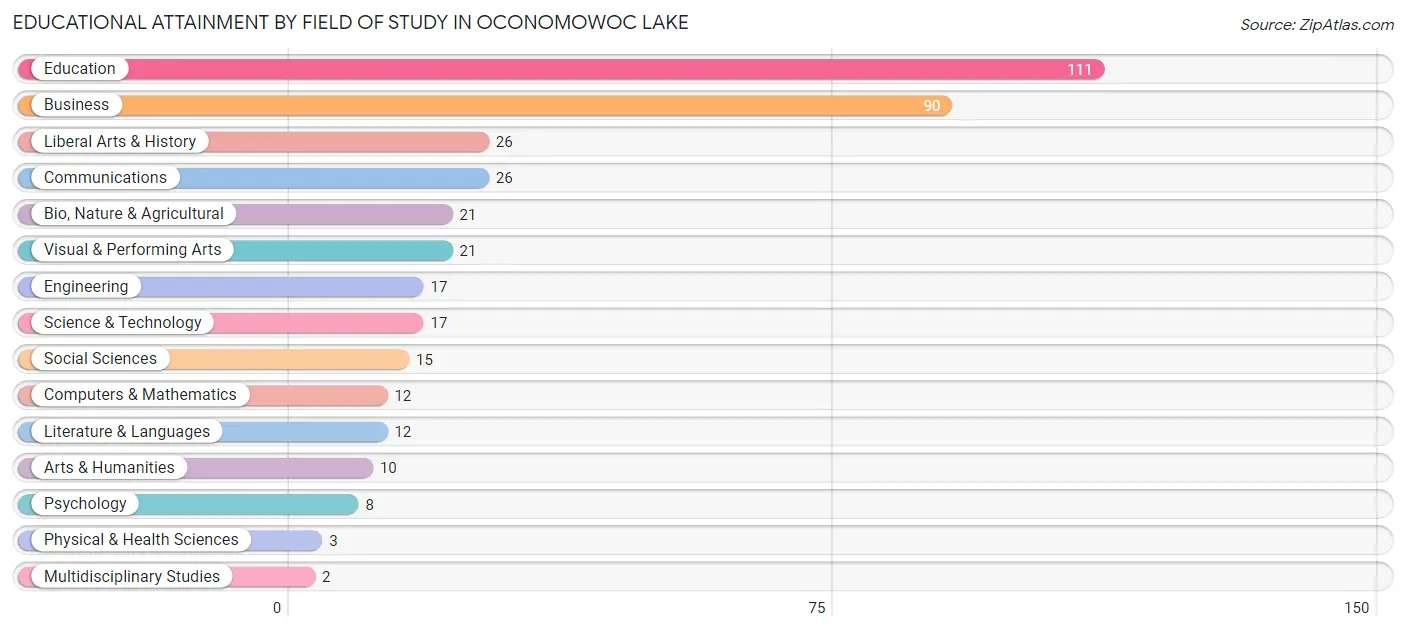
| Field of Study | # Graduates | % Graduates |
| Computers & Mathematics | 12 | 3.1% |
| Bio, Nature & Agricultural | 21 | 5.4% |
| Physical & Health Sciences | 3 | 0.8% |
| Psychology | 8 | 2.1% |
| Social Sciences | 15 | 3.8% |
| Engineering | 17 | 4.3% |
| Multidisciplinary Studies | 2 | 0.5% |
| Science & Technology | 17 | 4.3% |
| Business | 90 | 23.0% |
| Education | 111 | 28.4% |
| Literature & Languages | 12 | 3.1% |
| Liberal Arts & History | 26 | 6.7% |
| Visual & Performing Arts | 21 | 5.4% |
| Communications | 26 | 6.7% |
| Arts & Humanities | 10 | 2.6% |
| Total | 391 | 100.0% |
Transportation & Commute in Oconomowoc Lake
Vehicle Availability by Sex in Oconomowoc Lake
The most prevalent vehicle ownership categories in Oconomowoc Lake are males with 2 vehicles (62, accounting for 31.2%) and females with 2 vehicles (39, making up 29.1%).
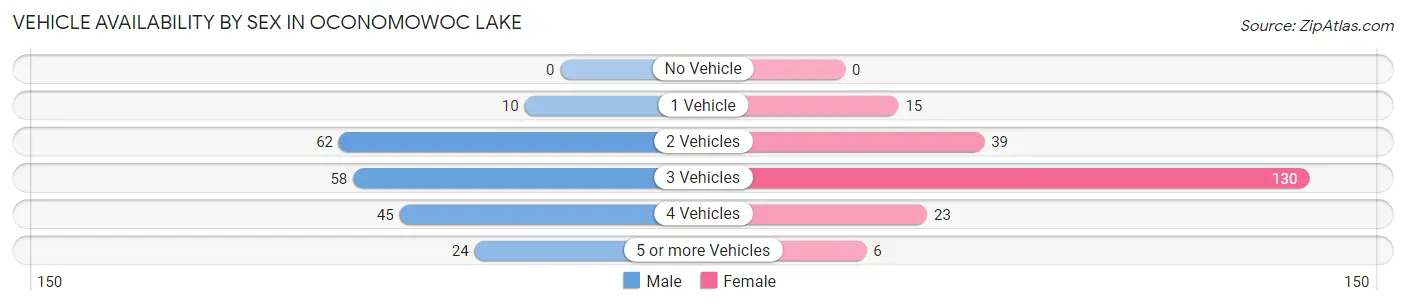
| Vehicles Available | Male | Female |
| No Vehicle | 0 (0.0%) | 0 (0.0%) |
| 1 Vehicle | 10 (5.0%) | 15 (7.0%) |
| 2 Vehicles | 62 (31.2%) | 39 (18.3%) |
| 3 Vehicles | 58 (29.1%) | 130 (61.0%) |
| 4 Vehicles | 45 (22.6%) | 23 (10.8%) |
| 5 or more Vehicles | 24 (12.1%) | 6 (2.8%) |
| Total | 199 (100.0%) | 213 (100.0%) |
Commute Time in Oconomowoc Lake
The most frequently occuring commute durations in Oconomowoc Lake are 20 to 24 minutes (120 commuters, 33.0%), 45 to 59 minutes (42 commuters, 11.5%), and 10 to 14 minutes (41 commuters, 11.3%).
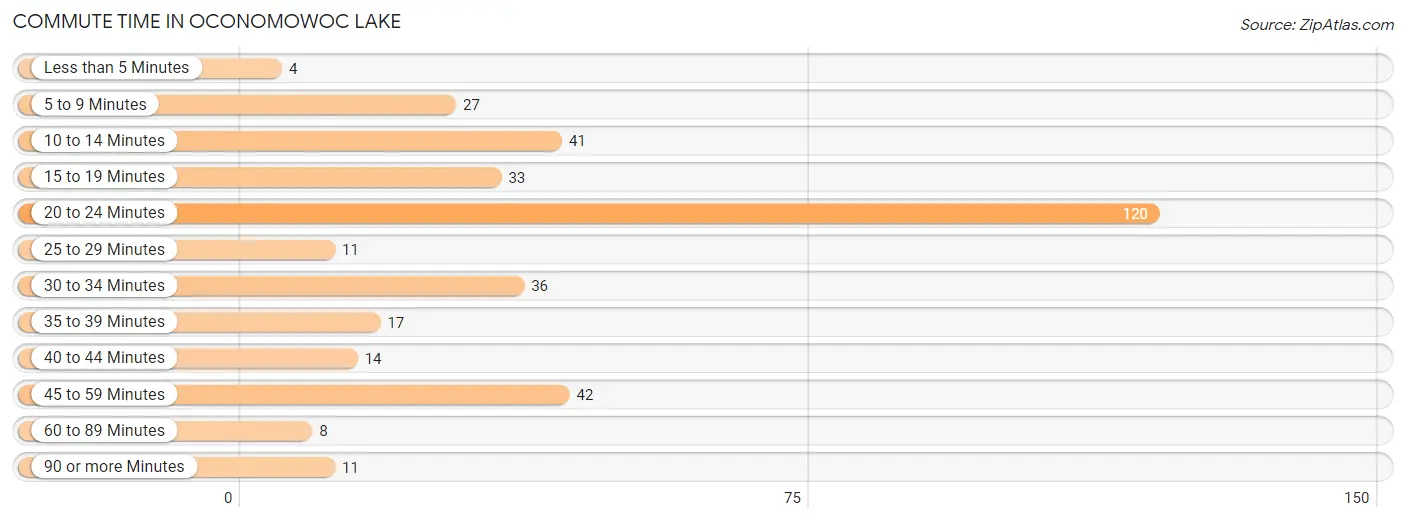
| Commute Time | # Commuters | % Commuters |
| Less than 5 Minutes | 4 | 1.1% |
| 5 to 9 Minutes | 27 | 7.4% |
| 10 to 14 Minutes | 41 | 11.3% |
| 15 to 19 Minutes | 33 | 9.1% |
| 20 to 24 Minutes | 120 | 33.0% |
| 25 to 29 Minutes | 11 | 3.0% |
| 30 to 34 Minutes | 36 | 9.9% |
| 35 to 39 Minutes | 17 | 4.7% |
| 40 to 44 Minutes | 14 | 3.8% |
| 45 to 59 Minutes | 42 | 11.5% |
| 60 to 89 Minutes | 8 | 2.2% |
| 90 or more Minutes | 11 | 3.0% |
Commute Time by Sex in Oconomowoc Lake
The most common commute times in Oconomowoc Lake are 45 to 59 minutes (32 commuters, 18.4%) for males and 20 to 24 minutes (92 commuters, 48.4%) for females.
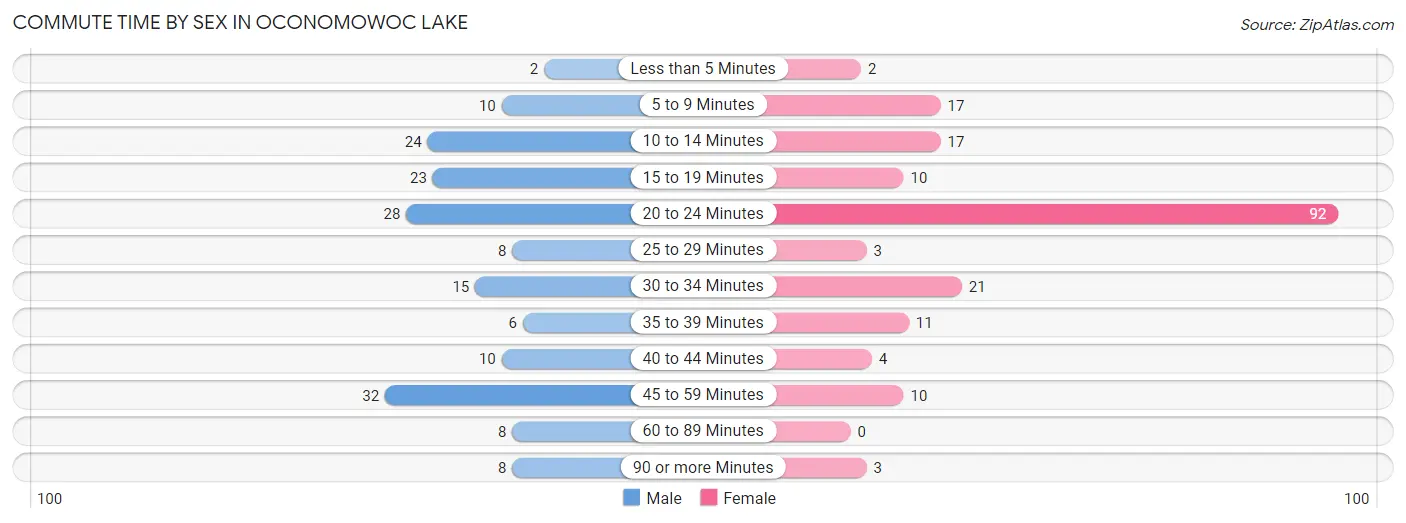
| Commute Time | Male | Female |
| Less than 5 Minutes | 2 (1.1%) | 2 (1.1%) |
| 5 to 9 Minutes | 10 (5.8%) | 17 (8.9%) |
| 10 to 14 Minutes | 24 (13.8%) | 17 (8.9%) |
| 15 to 19 Minutes | 23 (13.2%) | 10 (5.3%) |
| 20 to 24 Minutes | 28 (16.1%) | 92 (48.4%) |
| 25 to 29 Minutes | 8 (4.6%) | 3 (1.6%) |
| 30 to 34 Minutes | 15 (8.6%) | 21 (11.1%) |
| 35 to 39 Minutes | 6 (3.5%) | 11 (5.8%) |
| 40 to 44 Minutes | 10 (5.8%) | 4 (2.1%) |
| 45 to 59 Minutes | 32 (18.4%) | 10 (5.3%) |
| 60 to 89 Minutes | 8 (4.6%) | 0 (0.0%) |
| 90 or more Minutes | 8 (4.6%) | 3 (1.6%) |
Time of Departure to Work by Sex in Oconomowoc Lake
The most frequent times of departure to work in Oconomowoc Lake are 6:30 AM to 6:59 AM (56, 32.2%) for males and 8:00 AM to 8:29 AM (100, 52.6%) for females.
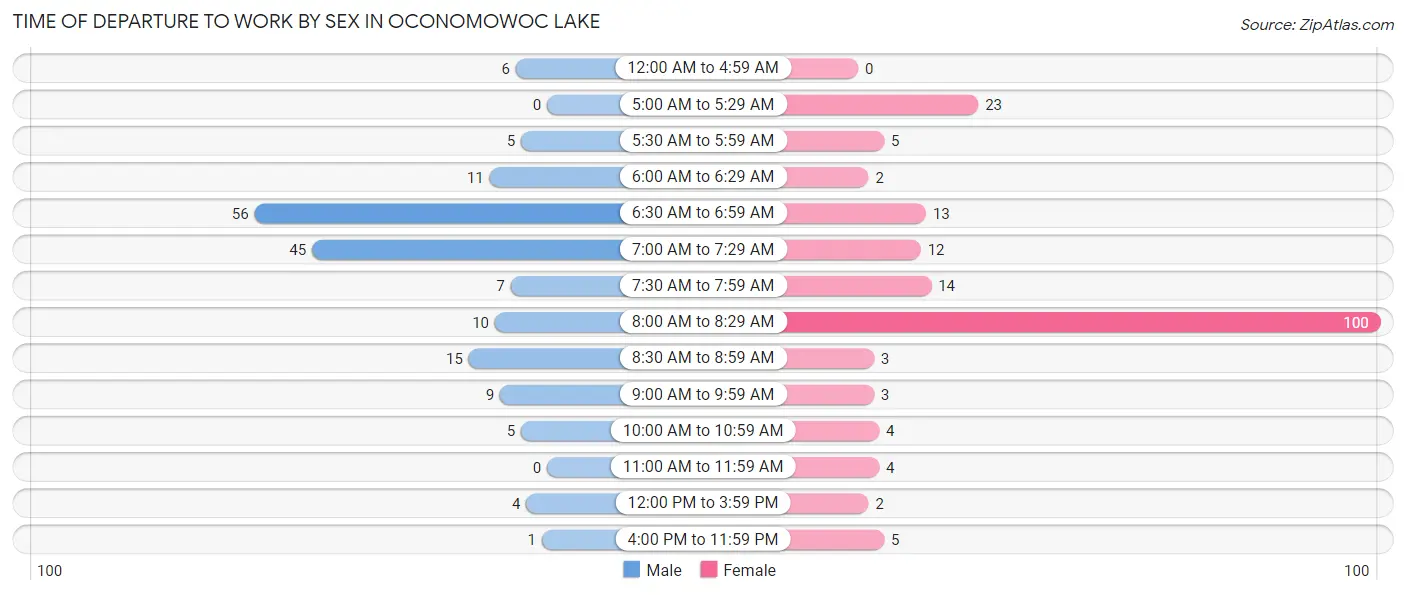
| Time of Departure | Male | Female |
| 12:00 AM to 4:59 AM | 6 (3.5%) | 0 (0.0%) |
| 5:00 AM to 5:29 AM | 0 (0.0%) | 23 (12.1%) |
| 5:30 AM to 5:59 AM | 5 (2.9%) | 5 (2.6%) |
| 6:00 AM to 6:29 AM | 11 (6.3%) | 2 (1.1%) |
| 6:30 AM to 6:59 AM | 56 (32.2%) | 13 (6.8%) |
| 7:00 AM to 7:29 AM | 45 (25.9%) | 12 (6.3%) |
| 7:30 AM to 7:59 AM | 7 (4.0%) | 14 (7.4%) |
| 8:00 AM to 8:29 AM | 10 (5.8%) | 100 (52.6%) |
| 8:30 AM to 8:59 AM | 15 (8.6%) | 3 (1.6%) |
| 9:00 AM to 9:59 AM | 9 (5.2%) | 3 (1.6%) |
| 10:00 AM to 10:59 AM | 5 (2.9%) | 4 (2.1%) |
| 11:00 AM to 11:59 AM | 0 (0.0%) | 4 (2.1%) |
| 12:00 PM to 3:59 PM | 4 (2.3%) | 2 (1.1%) |
| 4:00 PM to 11:59 PM | 1 (0.6%) | 5 (2.6%) |
| Total | 174 (100.0%) | 190 (100.0%) |
Housing Occupancy in Oconomowoc Lake
Occupancy by Ownership in Oconomowoc Lake
Of the total 241 dwellings in Oconomowoc Lake, owner-occupied units account for 232 (96.3%), while renter-occupied units make up 9 (3.7%).
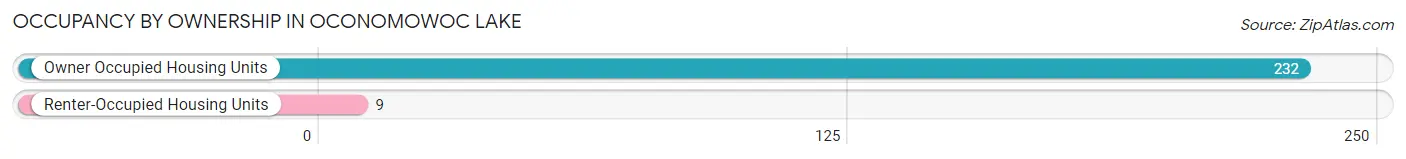
| Occupancy | # Housing Units | % Housing Units |
| Owner Occupied Housing Units | 232 | 96.3% |
| Renter-Occupied Housing Units | 9 | 3.7% |
| Total Occupied Housing Units | 241 | 100.0% |
Occupancy by Household Size in Oconomowoc Lake
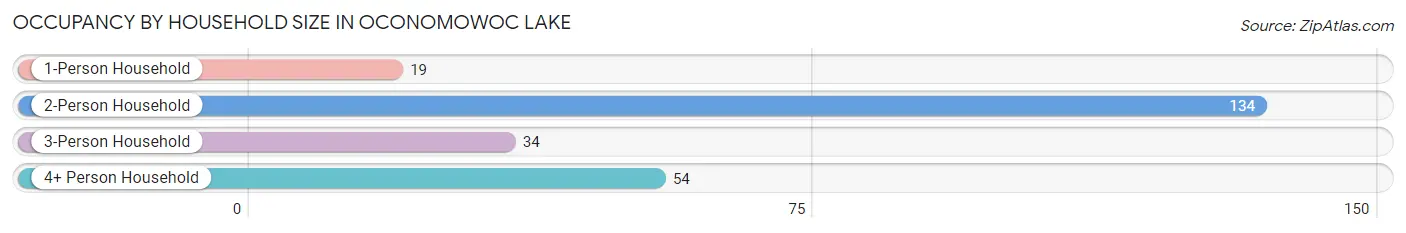
| Household Size | # Housing Units | % Housing Units |
| 1-Person Household | 19 | 7.9% |
| 2-Person Household | 134 | 55.6% |
| 3-Person Household | 34 | 14.1% |
| 4+ Person Household | 54 | 22.4% |
| Total Housing Units | 241 | 100.0% |
Occupancy by Ownership by Household Size in Oconomowoc Lake
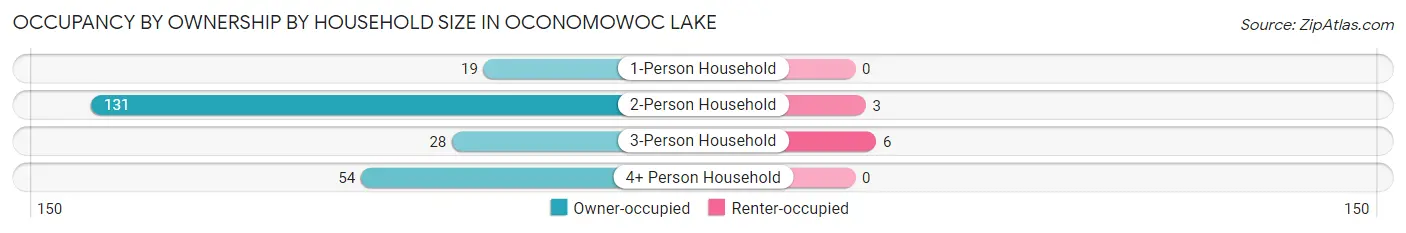
| Household Size | Owner-occupied | Renter-occupied |
| 1-Person Household | 19 (100.0%) | 0 (0.0%) |
| 2-Person Household | 131 (97.8%) | 3 (2.2%) |
| 3-Person Household | 28 (82.4%) | 6 (17.6%) |
| 4+ Person Household | 54 (100.0%) | 0 (0.0%) |
| Total Housing Units | 232 (96.3%) | 9 (3.7%) |
Occupancy by Educational Attainment in Oconomowoc Lake
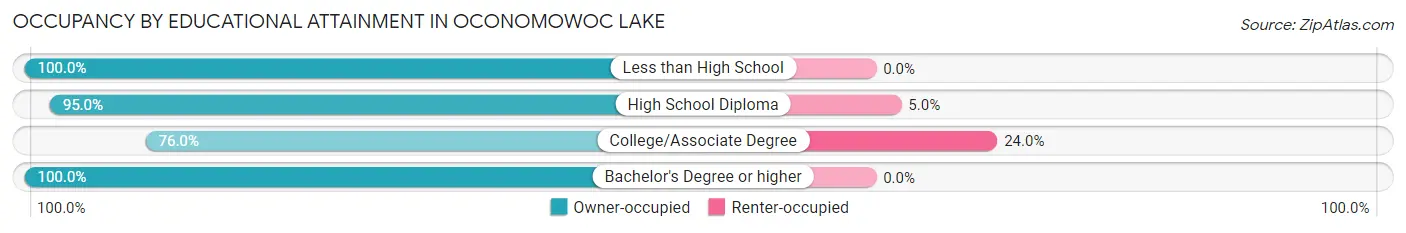
| Household Size | Owner-occupied | Renter-occupied |
| Less than High School | 2 (100.0%) | 0 (0.0%) |
| High School Diploma | 57 (95.0%) | 3 (5.0%) |
| College/Associate Degree | 19 (76.0%) | 6 (24.0%) |
| Bachelor's Degree or higher | 154 (100.0%) | 0 (0.0%) |
Occupancy by Age of Householder in Oconomowoc Lake
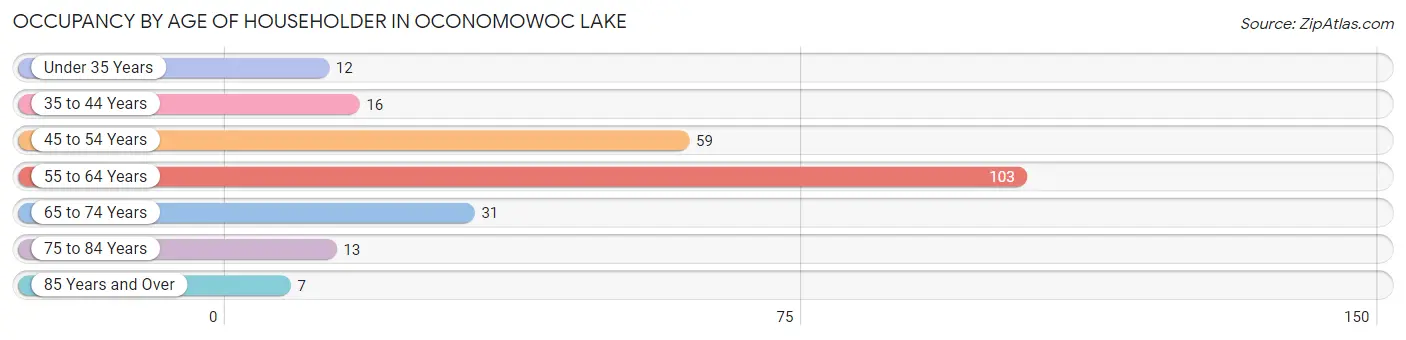
| Age Bracket | # Households | % Households |
| Under 35 Years | 12 | 5.0% |
| 35 to 44 Years | 16 | 6.6% |
| 45 to 54 Years | 59 | 24.5% |
| 55 to 64 Years | 103 | 42.7% |
| 65 to 74 Years | 31 | 12.9% |
| 75 to 84 Years | 13 | 5.4% |
| 85 Years and Over | 7 | 2.9% |
| Total | 241 | 100.0% |
Housing Finances in Oconomowoc Lake
Median Income by Occupancy in Oconomowoc Lake
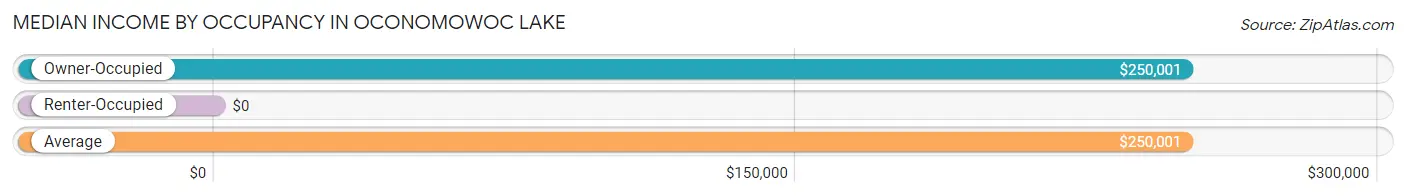
| Occupancy Type | # Households | Median Income |
| Owner-Occupied | 232 (96.3%) | $250,001 |
| Renter-Occupied | 9 (3.7%) | $0 |
| Average | 241 (100.0%) | $250,001 |
Occupancy by Householder Income Bracket in Oconomowoc Lake
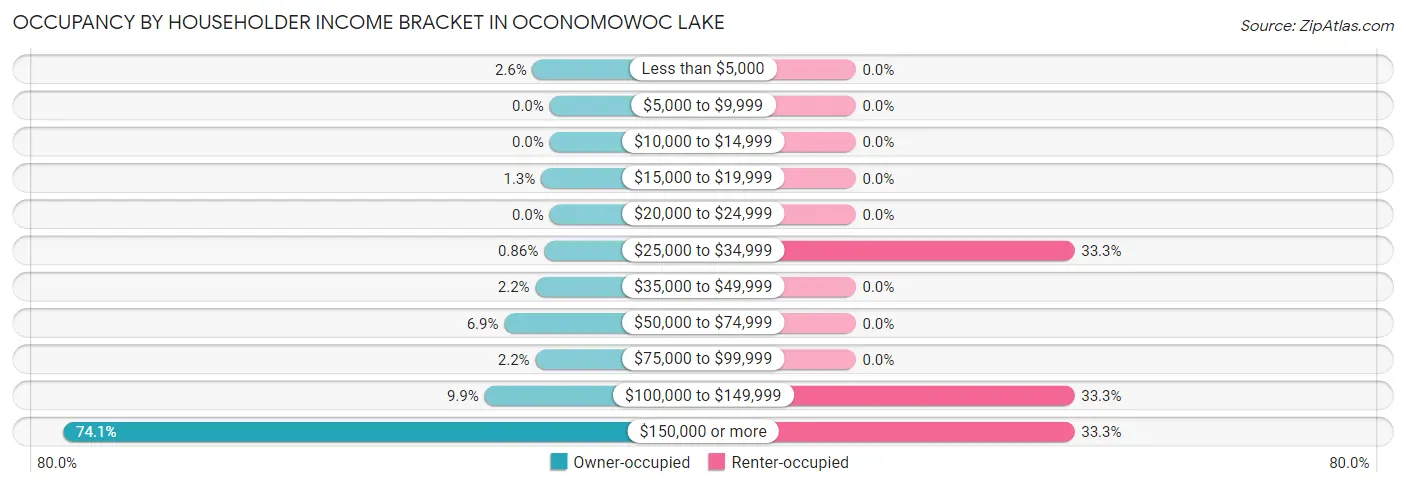
| Income Bracket | Owner-occupied | Renter-occupied |
| Less than $5,000 | 6 (2.6%) | 0 (0.0%) |
| $5,000 to $9,999 | 0 (0.0%) | 0 (0.0%) |
| $10,000 to $14,999 | 0 (0.0%) | 0 (0.0%) |
| $15,000 to $19,999 | 3 (1.3%) | 0 (0.0%) |
| $20,000 to $24,999 | 0 (0.0%) | 0 (0.0%) |
| $25,000 to $34,999 | 2 (0.9%) | 3 (33.3%) |
| $35,000 to $49,999 | 5 (2.2%) | 0 (0.0%) |
| $50,000 to $74,999 | 16 (6.9%) | 0 (0.0%) |
| $75,000 to $99,999 | 5 (2.2%) | 0 (0.0%) |
| $100,000 to $149,999 | 23 (9.9%) | 3 (33.3%) |
| $150,000 or more | 172 (74.1%) | 3 (33.3%) |
| Total | 232 (100.0%) | 9 (100.0%) |
Monthly Housing Cost Tiers in Oconomowoc Lake
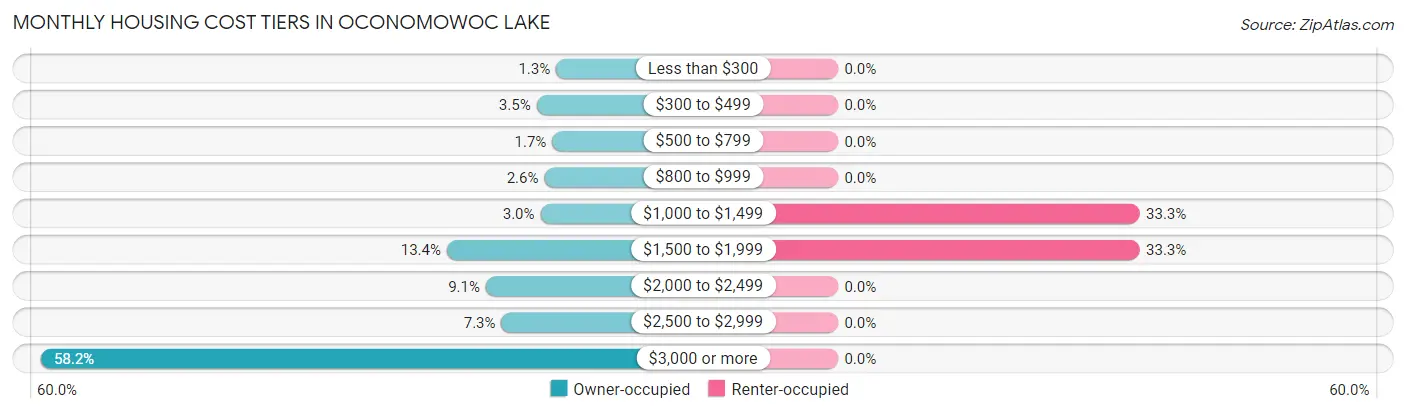
| Monthly Cost | Owner-occupied | Renter-occupied |
| Less than $300 | 3 (1.3%) | 0 (0.0%) |
| $300 to $499 | 8 (3.5%) | 0 (0.0%) |
| $500 to $799 | 4 (1.7%) | 0 (0.0%) |
| $800 to $999 | 6 (2.6%) | 0 (0.0%) |
| $1,000 to $1,499 | 7 (3.0%) | 3 (33.3%) |
| $1,500 to $1,999 | 31 (13.4%) | 3 (33.3%) |
| $2,000 to $2,499 | 21 (9.0%) | 0 (0.0%) |
| $2,500 to $2,999 | 17 (7.3%) | 0 (0.0%) |
| $3,000 or more | 135 (58.2%) | 0 (0.0%) |
| Total | 232 (100.0%) | 9 (100.0%) |
Physical Housing Characteristics in Oconomowoc Lake
Housing Structures in Oconomowoc Lake
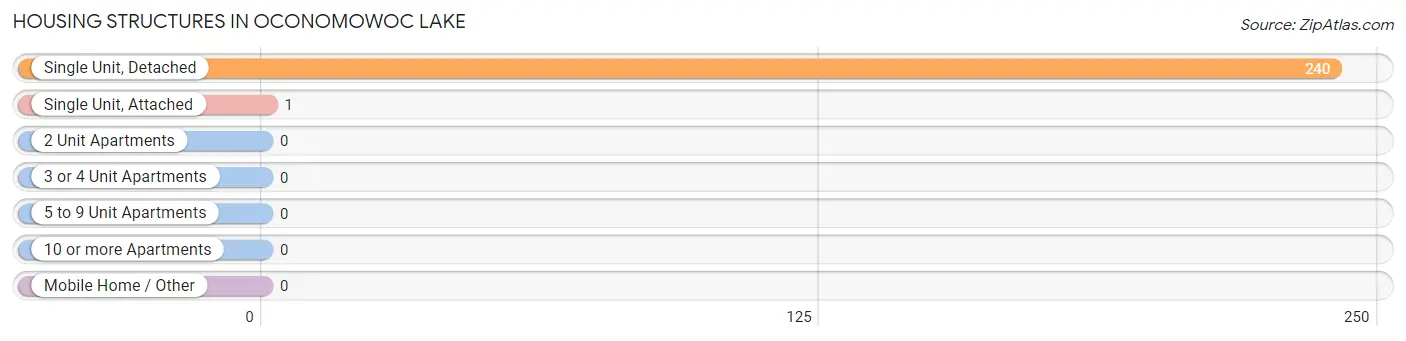
| Structure Type | # Housing Units | % Housing Units |
| Single Unit, Detached | 240 | 99.6% |
| Single Unit, Attached | 1 | 0.4% |
| 2 Unit Apartments | 0 | 0.0% |
| 3 or 4 Unit Apartments | 0 | 0.0% |
| 5 to 9 Unit Apartments | 0 | 0.0% |
| 10 or more Apartments | 0 | 0.0% |
| Mobile Home / Other | 0 | 0.0% |
| Total | 241 | 100.0% |
Housing Structures by Occupancy in Oconomowoc Lake
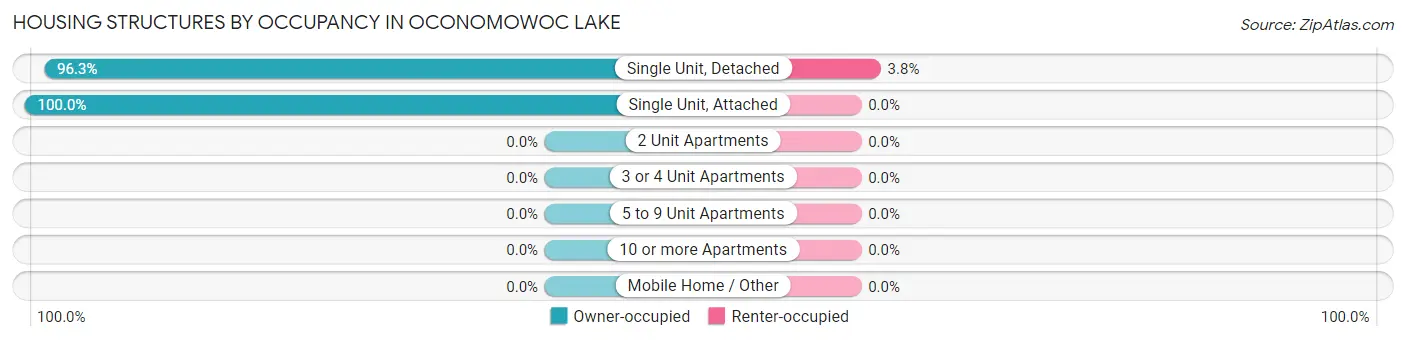
| Structure Type | Owner-occupied | Renter-occupied |
| Single Unit, Detached | 231 (96.3%) | 9 (3.7%) |
| Single Unit, Attached | 1 (100.0%) | 0 (0.0%) |
| 2 Unit Apartments | 0 (0.0%) | 0 (0.0%) |
| 3 or 4 Unit Apartments | 0 (0.0%) | 0 (0.0%) |
| 5 to 9 Unit Apartments | 0 (0.0%) | 0 (0.0%) |
| 10 or more Apartments | 0 (0.0%) | 0 (0.0%) |
| Mobile Home / Other | 0 (0.0%) | 0 (0.0%) |
| Total | 232 (96.3%) | 9 (3.7%) |
Housing Structures by Number of Rooms in Oconomowoc Lake
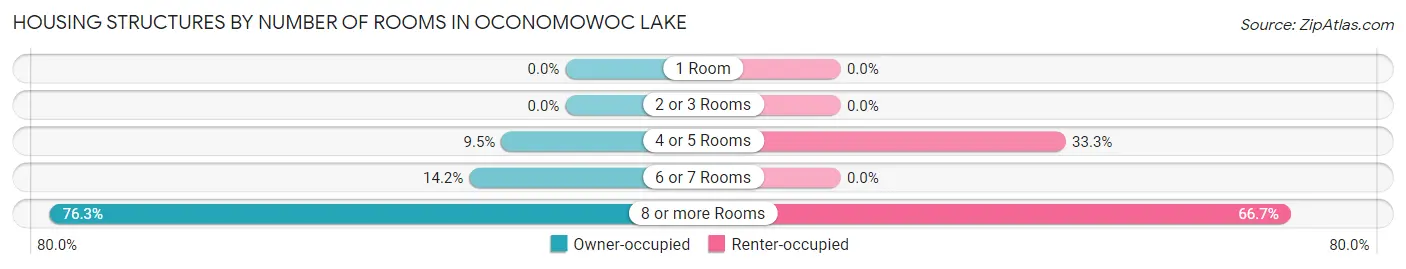
| Number of Rooms | Owner-occupied | Renter-occupied |
| 1 Room | 0 (0.0%) | 0 (0.0%) |
| 2 or 3 Rooms | 0 (0.0%) | 0 (0.0%) |
| 4 or 5 Rooms | 22 (9.5%) | 3 (33.3%) |
| 6 or 7 Rooms | 33 (14.2%) | 0 (0.0%) |
| 8 or more Rooms | 177 (76.3%) | 6 (66.7%) |
| Total | 232 (100.0%) | 9 (100.0%) |
Housing Structure by Heating Type in Oconomowoc Lake
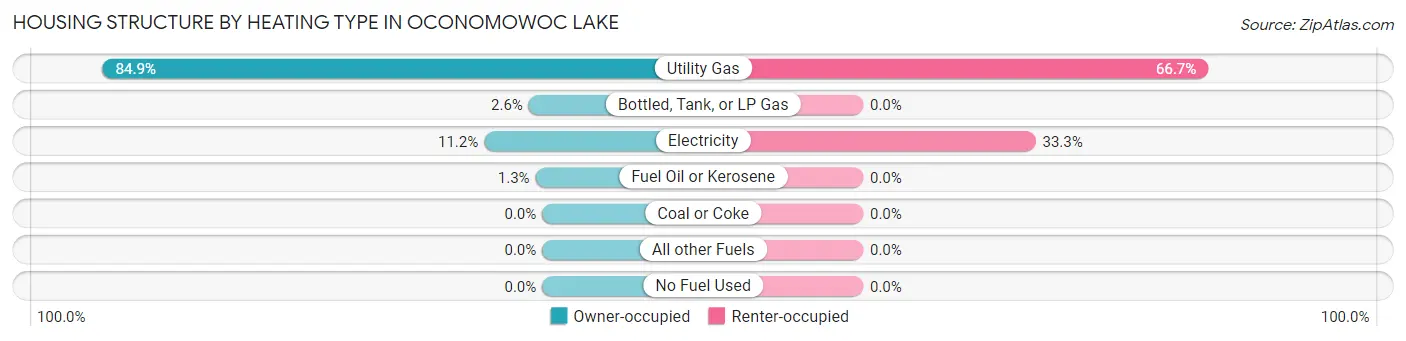
| Heating Type | Owner-occupied | Renter-occupied |
| Utility Gas | 197 (84.9%) | 6 (66.7%) |
| Bottled, Tank, or LP Gas | 6 (2.6%) | 0 (0.0%) |
| Electricity | 26 (11.2%) | 3 (33.3%) |
| Fuel Oil or Kerosene | 3 (1.3%) | 0 (0.0%) |
| Coal or Coke | 0 (0.0%) | 0 (0.0%) |
| All other Fuels | 0 (0.0%) | 0 (0.0%) |
| No Fuel Used | 0 (0.0%) | 0 (0.0%) |
| Total | 232 (100.0%) | 9 (100.0%) |
Household Vehicle Usage in Oconomowoc Lake
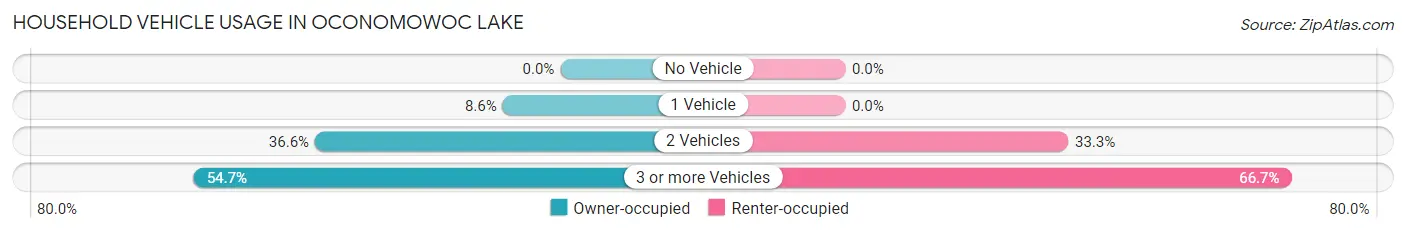
| Vehicles per Household | Owner-occupied | Renter-occupied |
| No Vehicle | 0 (0.0%) | 0 (0.0%) |
| 1 Vehicle | 20 (8.6%) | 0 (0.0%) |
| 2 Vehicles | 85 (36.6%) | 3 (33.3%) |
| 3 or more Vehicles | 127 (54.7%) | 6 (66.7%) |
| Total | 232 (100.0%) | 9 (100.0%) |
Real Estate & Mortgages in Oconomowoc Lake
Real Estate and Mortgage Overview in Oconomowoc Lake
| Characteristic | Without Mortgage | With Mortgage |
| Housing Units | 64 | 168 |
| Median Property Value | $1,214,300 | $1,300,000 |
| Median Household Income | $196,875 | $134 |
| Monthly Housing Costs | $1,501 | $119 |
| Real Estate Taxes | $10,001 | $0 |
Property Value by Mortgage Status in Oconomowoc Lake
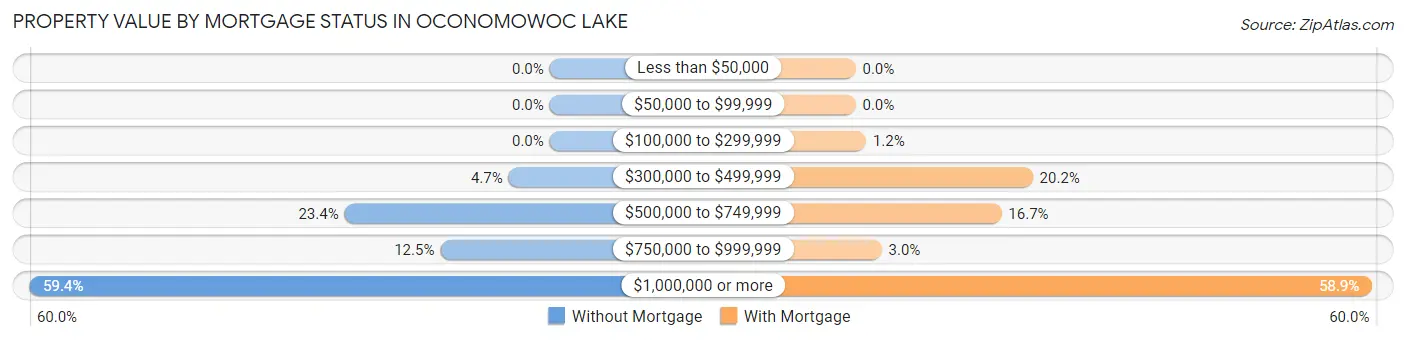
| Property Value | Without Mortgage | With Mortgage |
| Less than $50,000 | 0 (0.0%) | 0 (0.0%) |
| $50,000 to $99,999 | 0 (0.0%) | 0 (0.0%) |
| $100,000 to $299,999 | 0 (0.0%) | 2 (1.2%) |
| $300,000 to $499,999 | 3 (4.7%) | 34 (20.2%) |
| $500,000 to $749,999 | 15 (23.4%) | 28 (16.7%) |
| $750,000 to $999,999 | 8 (12.5%) | 5 (3.0%) |
| $1,000,000 or more | 38 (59.4%) | 99 (58.9%) |
| Total | 64 (100.0%) | 168 (100.0%) |
Household Income by Mortgage Status in Oconomowoc Lake
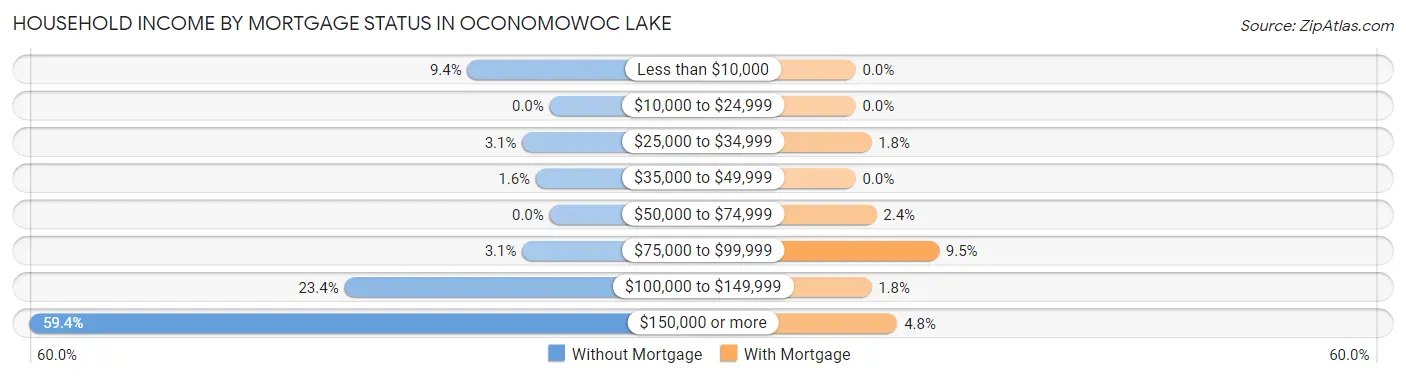
| Household Income | Without Mortgage | With Mortgage |
| Less than $10,000 | 6 (9.4%) | 0 (0.0%) |
| $10,000 to $24,999 | 0 (0.0%) | 0 (0.0%) |
| $25,000 to $34,999 | 2 (3.1%) | 3 (1.8%) |
| $35,000 to $49,999 | 1 (1.6%) | 0 (0.0%) |
| $50,000 to $74,999 | 0 (0.0%) | 4 (2.4%) |
| $75,000 to $99,999 | 2 (3.1%) | 16 (9.5%) |
| $100,000 to $149,999 | 15 (23.4%) | 3 (1.8%) |
| $150,000 or more | 38 (59.4%) | 8 (4.8%) |
| Total | 64 (100.0%) | 168 (100.0%) |
Property Value to Household Income Ratio in Oconomowoc Lake
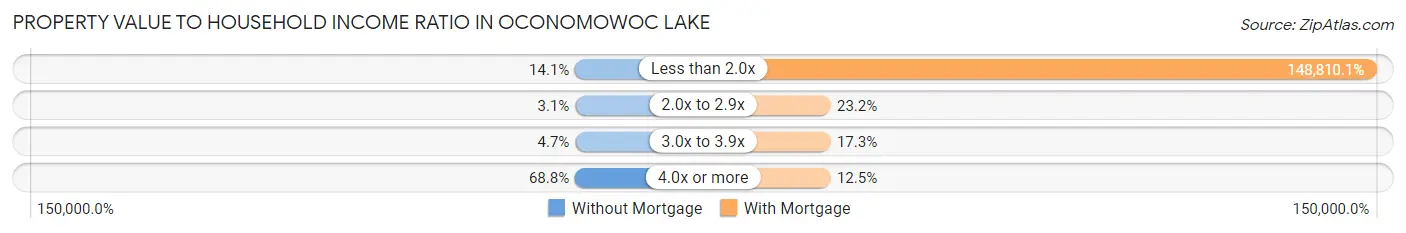
| Value-to-Income Ratio | Without Mortgage | With Mortgage |
| Less than 2.0x | 9 (14.1%) | 250,001 (148,810.1%) |
| 2.0x to 2.9x | 2 (3.1%) | 39 (23.2%) |
| 3.0x to 3.9x | 3 (4.7%) | 29 (17.3%) |
| 4.0x or more | 44 (68.8%) | 21 (12.5%) |
| Total | 64 (100.0%) | 168 (100.0%) |
Real Estate Taxes by Mortgage Status in Oconomowoc Lake
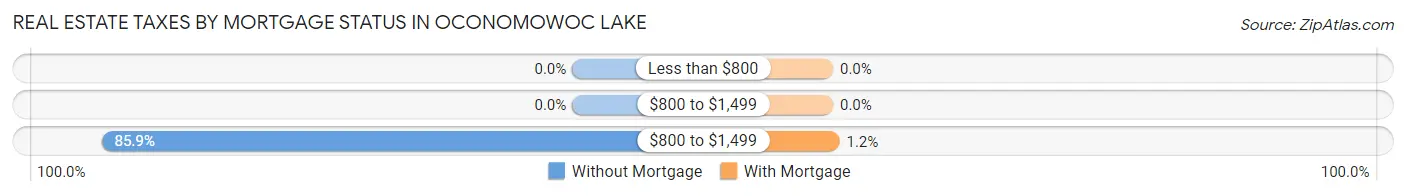
| Property Taxes | Without Mortgage | With Mortgage |
| Less than $800 | 0 (0.0%) | 0 (0.0%) |
| $800 to $1,499 | 0 (0.0%) | 0 (0.0%) |
| $800 to $1,499 | 55 (85.9%) | 2 (1.2%) |
| Total | 64 (100.0%) | 168 (100.0%) |
Health & Disability in Oconomowoc Lake
Health Insurance Coverage by Age in Oconomowoc Lake
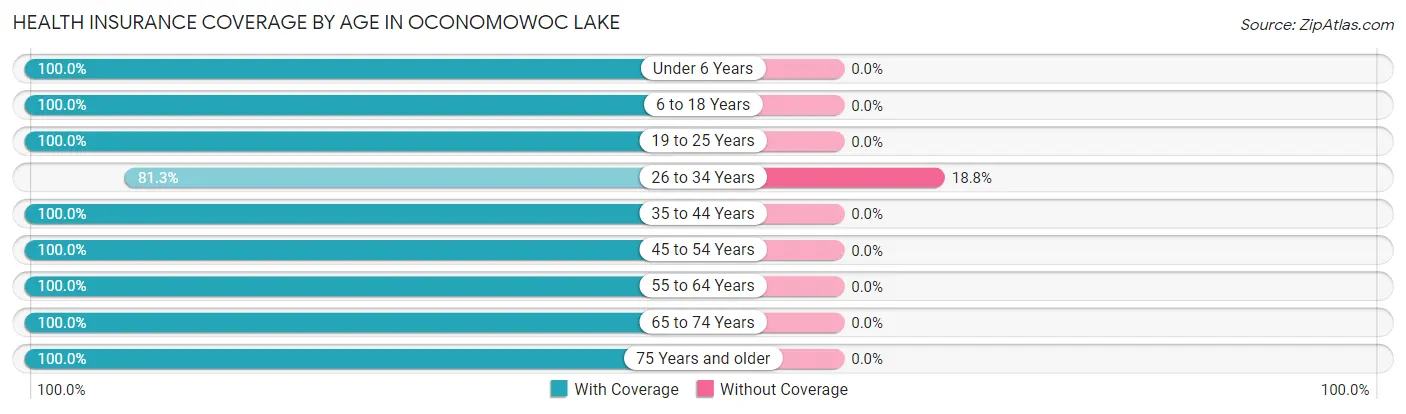
| Age Bracket | With Coverage | Without Coverage |
| Under 6 Years | 29 (100.0%) | 0 (0.0%) |
| 6 to 18 Years | 80 (100.0%) | 0 (0.0%) |
| 19 to 25 Years | 50 (100.0%) | 0 (0.0%) |
| 26 to 34 Years | 26 (81.2%) | 6 (18.8%) |
| 35 to 44 Years | 25 (100.0%) | 0 (0.0%) |
| 45 to 54 Years | 123 (100.0%) | 0 (0.0%) |
| 55 to 64 Years | 179 (100.0%) | 0 (0.0%) |
| 65 to 74 Years | 140 (100.0%) | 0 (0.0%) |
| 75 Years and older | 33 (100.0%) | 0 (0.0%) |
| Total | 685 (99.1%) | 6 (0.9%) |
Health Insurance Coverage by Citizenship Status in Oconomowoc Lake
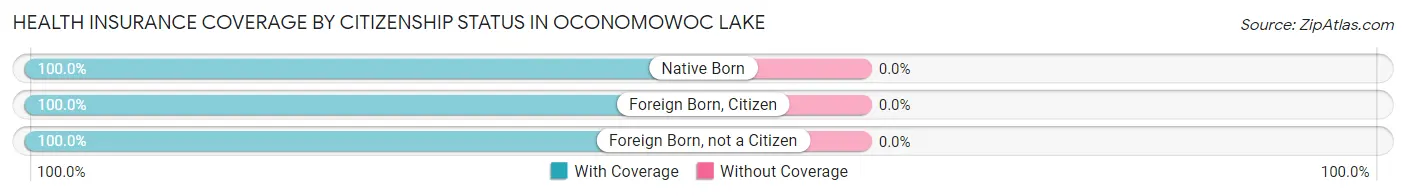
| Citizenship Status | With Coverage | Without Coverage |
| Native Born | 29 (100.0%) | 0 (0.0%) |
| Foreign Born, Citizen | 80 (100.0%) | 0 (0.0%) |
| Foreign Born, not a Citizen | 50 (100.0%) | 0 (0.0%) |
Health Insurance Coverage by Household Income in Oconomowoc Lake
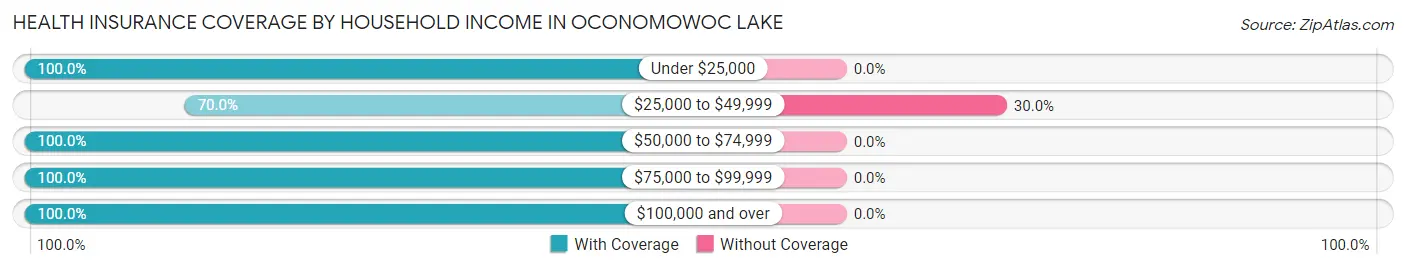
| Household Income | With Coverage | Without Coverage |
| Under $25,000 | 16 (100.0%) | 0 (0.0%) |
| $25,000 to $49,999 | 14 (70.0%) | 6 (30.0%) |
| $50,000 to $74,999 | 32 (100.0%) | 0 (0.0%) |
| $75,000 to $99,999 | 16 (100.0%) | 0 (0.0%) |
| $100,000 and over | 607 (100.0%) | 0 (0.0%) |
Public vs Private Health Insurance Coverage by Age in Oconomowoc Lake
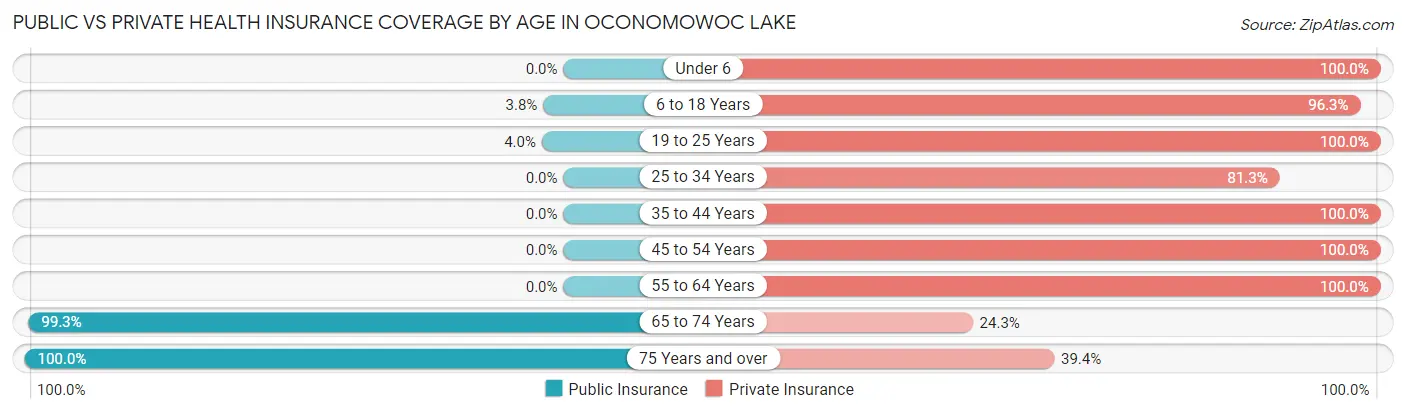
| Age Bracket | Public Insurance | Private Insurance |
| Under 6 | 0 (0.0%) | 29 (100.0%) |
| 6 to 18 Years | 3 (3.7%) | 77 (96.3%) |
| 19 to 25 Years | 2 (4.0%) | 50 (100.0%) |
| 25 to 34 Years | 0 (0.0%) | 26 (81.2%) |
| 35 to 44 Years | 0 (0.0%) | 25 (100.0%) |
| 45 to 54 Years | 0 (0.0%) | 123 (100.0%) |
| 55 to 64 Years | 0 (0.0%) | 179 (100.0%) |
| 65 to 74 Years | 139 (99.3%) | 34 (24.3%) |
| 75 Years and over | 33 (100.0%) | 13 (39.4%) |
| Total | 177 (25.6%) | 556 (80.5%) |
Disability Status by Sex by Age in Oconomowoc Lake
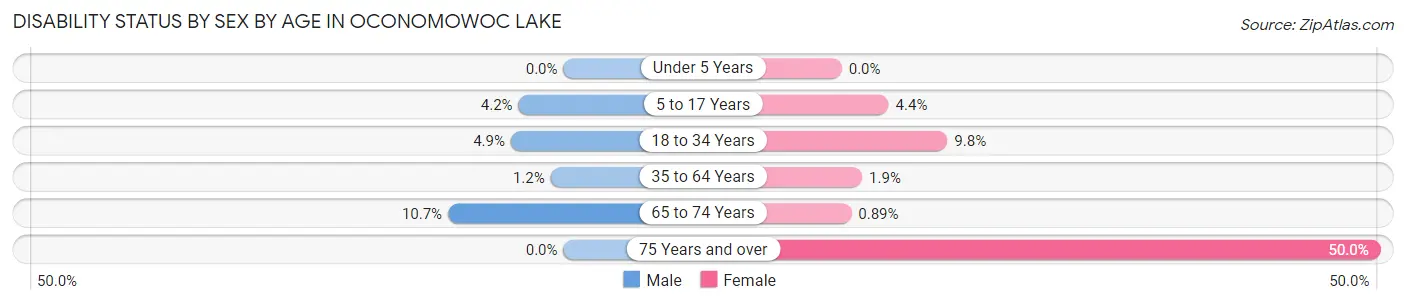
| Age Bracket | Male | Female |
| Under 5 Years | 0 (0.0%) | 0 (0.0%) |
| 5 to 17 Years | 1 (4.2%) | 2 (4.3%) |
| 18 to 34 Years | 2 (4.9%) | 5 (9.8%) |
| 35 to 64 Years | 2 (1.2%) | 3 (1.9%) |
| 65 to 74 Years | 3 (10.7%) | 1 (0.9%) |
| 75 Years and over | 0 (0.0%) | 7 (50.0%) |
Disability Class by Sex by Age in Oconomowoc Lake
Disability Class: Hearing Difficulty
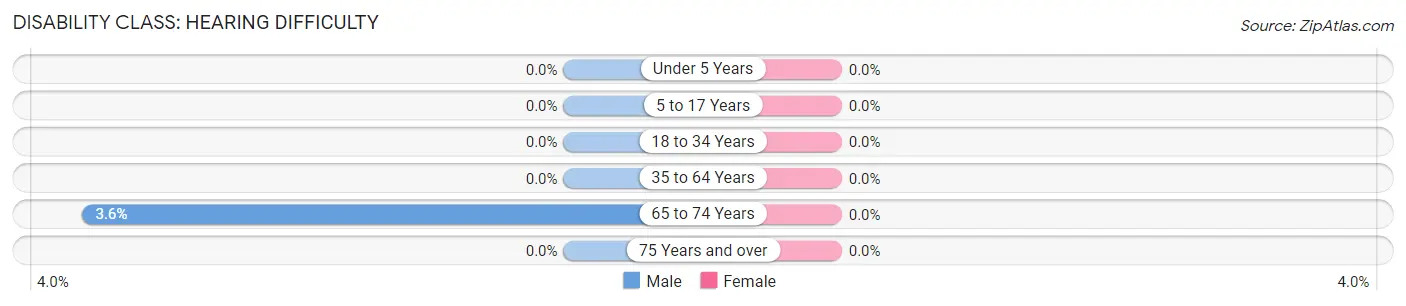
| Age Bracket | Male | Female |
| Under 5 Years | 0 (0.0%) | 0 (0.0%) |
| 5 to 17 Years | 0 (0.0%) | 0 (0.0%) |
| 18 to 34 Years | 0 (0.0%) | 0 (0.0%) |
| 35 to 64 Years | 0 (0.0%) | 0 (0.0%) |
| 65 to 74 Years | 1 (3.6%) | 0 (0.0%) |
| 75 Years and over | 0 (0.0%) | 0 (0.0%) |
Disability Class: Vision Difficulty
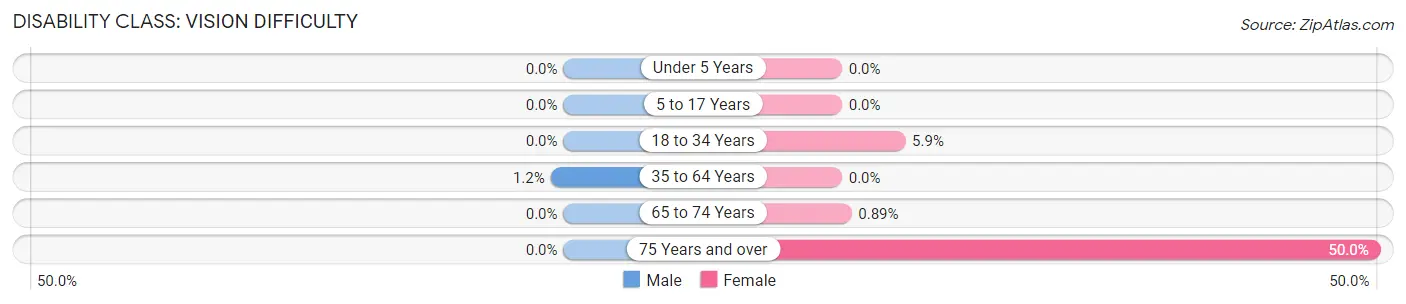
| Age Bracket | Male | Female |
| Under 5 Years | 0 (0.0%) | 0 (0.0%) |
| 5 to 17 Years | 0 (0.0%) | 0 (0.0%) |
| 18 to 34 Years | 0 (0.0%) | 3 (5.9%) |
| 35 to 64 Years | 2 (1.2%) | 0 (0.0%) |
| 65 to 74 Years | 0 (0.0%) | 1 (0.9%) |
| 75 Years and over | 0 (0.0%) | 7 (50.0%) |
Disability Class: Cognitive Difficulty
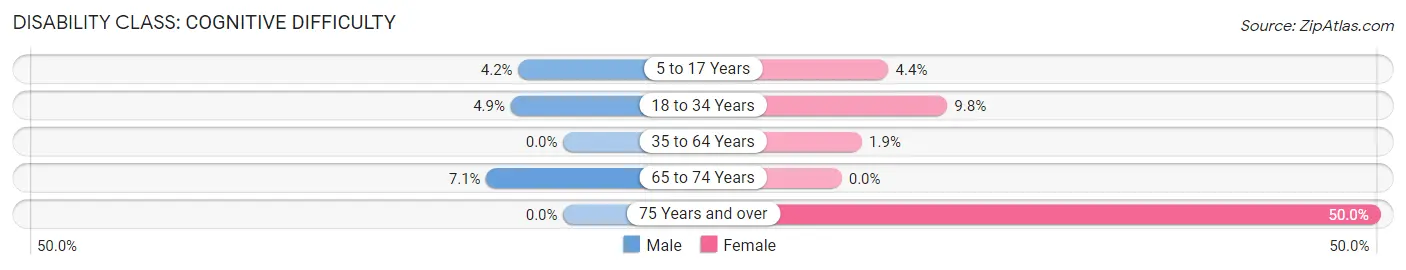
| Age Bracket | Male | Female |
| 5 to 17 Years | 1 (4.2%) | 2 (4.3%) |
| 18 to 34 Years | 2 (4.9%) | 5 (9.8%) |
| 35 to 64 Years | 0 (0.0%) | 3 (1.9%) |
| 65 to 74 Years | 2 (7.1%) | 0 (0.0%) |
| 75 Years and over | 0 (0.0%) | 7 (50.0%) |
Disability Class: Ambulatory Difficulty
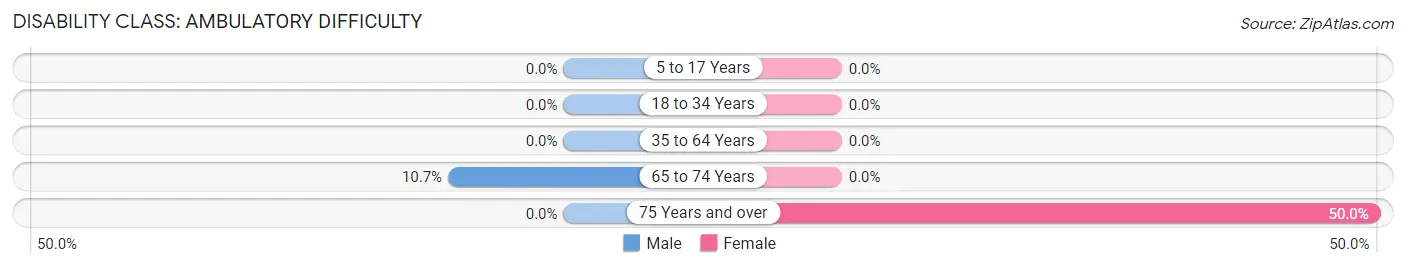
| Age Bracket | Male | Female |
| 5 to 17 Years | 0 (0.0%) | 0 (0.0%) |
| 18 to 34 Years | 0 (0.0%) | 0 (0.0%) |
| 35 to 64 Years | 0 (0.0%) | 0 (0.0%) |
| 65 to 74 Years | 3 (10.7%) | 0 (0.0%) |
| 75 Years and over | 0 (0.0%) | 7 (50.0%) |
Disability Class: Self-Care Difficulty
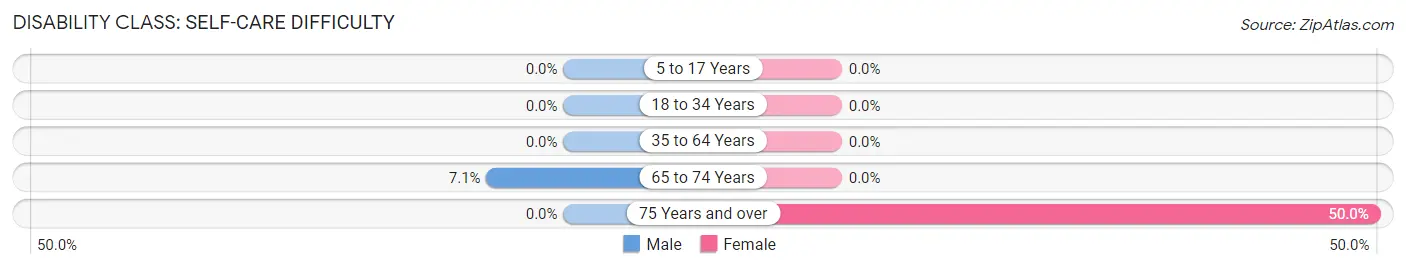
| Age Bracket | Male | Female |
| 5 to 17 Years | 0 (0.0%) | 0 (0.0%) |
| 18 to 34 Years | 0 (0.0%) | 0 (0.0%) |
| 35 to 64 Years | 0 (0.0%) | 0 (0.0%) |
| 65 to 74 Years | 2 (7.1%) | 0 (0.0%) |
| 75 Years and over | 0 (0.0%) | 7 (50.0%) |
Technology Access in Oconomowoc Lake
Computing Device Access in Oconomowoc Lake
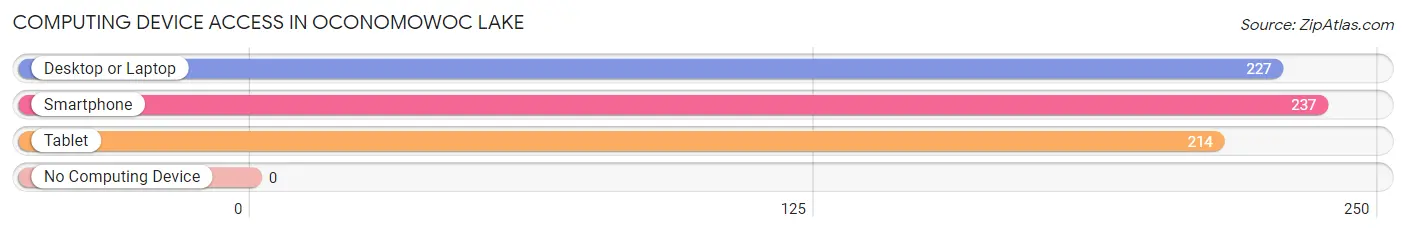
| Device Type | # Households | % Households |
| Desktop or Laptop | 227 | 94.2% |
| Smartphone | 237 | 98.3% |
| Tablet | 214 | 88.8% |
| No Computing Device | 0 | 0.0% |
| Total | 241 | 100.0% |
Internet Access in Oconomowoc Lake
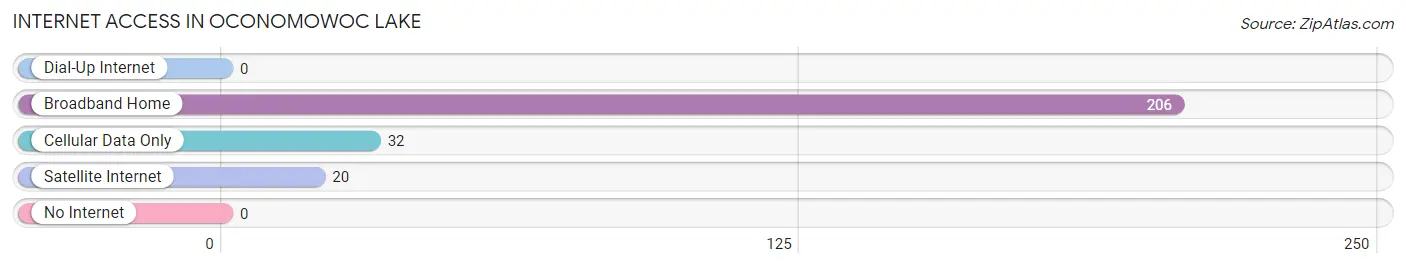
| Internet Type | # Households | % Households |
| Dial-Up Internet | 0 | 0.0% |
| Broadband Home | 206 | 85.5% |
| Cellular Data Only | 32 | 13.3% |
| Satellite Internet | 20 | 8.3% |
| No Internet | 0 | 0.0% |
| Total | 241 | 100.0% |
Oconomowoc Lake Summary
Oconomowoc Lake, Wisconsin is a small village located in Waukesha County, Wisconsin. It is situated on the western shore of Oconomowoc Lake, a large lake in the Kettle Moraine region of southeastern Wisconsin. The village is located approximately 30 miles west of Milwaukee and is part of the Milwaukee metropolitan area. As of the 2010 census, the village had a population of 1,845.
History
The area around Oconomowoc Lake has been inhabited by Native Americans for thousands of years. The Potawatomi were the predominant tribe in the area prior to European settlement. The first European settlers arrived in the area in the early 1800s. The village of Oconomowoc Lake was officially established in 1845.
The village was named after the lake, which was named by the Potawatomi for the Oconomowoc River, which flows into the lake. The name Oconomowoc is derived from the Potawatomi words for “water of the sand”.
The village was initially a small farming community, but it began to grow in the late 19th century as a resort destination. The lake was a popular spot for fishing, boating, and swimming. The village also became a popular destination for wealthy Milwaukeeans who built large summer homes on the lake.
Geography
Oconomowoc Lake is located at 43°7′N 88°25′W (43.1167, -88.4167). It is situated on the western shore of Oconomowoc Lake, a large lake in the Kettle Moraine region of southeastern Wisconsin. The village is located approximately 30 miles west of Milwaukee and is part of the Milwaukee metropolitan area.
The village has a total area of 1.2 square miles, all of which is land. The terrain is generally flat, with some rolling hills. The village is bordered by the towns of Oconomowoc and Summit to the north, the town of Merton to the east, and the town of Delafield to the south.
Economy
The economy of Oconomowoc Lake is largely based on tourism and recreation. The village is a popular destination for fishing, boating, and swimming. There are several marinas and boat launches on the lake, as well as several restaurants and bars.
The village is also home to several small businesses, including a grocery store, a hardware store, and a few small shops. The village is also home to a few small manufacturing companies.
Demographics
As of the 2010 census, the village had a population of 1,845. The racial makeup of the village was 97.2% White, 0.7% African American, 0.3% Native American, 0.7% Asian, 0.1% Pacific Islander, 0.2% from other races, and 0.9% from two or more races. Hispanic or Latino of any race were 1.3% of the population.
The median income for a household in the village was $60,938, and the median income for a family was $71,250. The per capita income for the village was $30,945. About 4.2% of families and 5.3% of the population were below the poverty line, including 6.2% of those under age 18 and 4.2% of those age 65 or over.
Common Questions
What is Per Capita Income in Oconomowoc Lake?
Per Capita income in Oconomowoc Lake is $125,596.
What is the Median Family Income in Oconomowoc Lake?
Median Family Income in Oconomowoc Lake is $250,001.
What is the Median Household income in Oconomowoc Lake?
Median Household Income in Oconomowoc Lake is $250,001.
What is Inequality or Gini Index in Oconomowoc Lake?
Inequality or Gini Index in Oconomowoc Lake is 0.46.
What is the Total Population of Oconomowoc Lake?
Total Population of Oconomowoc Lake is 691.
What is the Total Male Population of Oconomowoc Lake?
Total Male Population of Oconomowoc Lake is 290.
What is the Total Female Population of Oconomowoc Lake?
Total Female Population of Oconomowoc Lake is 401.
What is the Ratio of Males per 100 Females in Oconomowoc Lake?
There are 72.32 Males per 100 Females in Oconomowoc Lake.
What is the Ratio of Females per 100 Males in Oconomowoc Lake?
There are 138.28 Females per 100 Males in Oconomowoc Lake.
What is the Median Population Age in Oconomowoc Lake?
Median Population Age in Oconomowoc Lake is 55.3 Years.
What is the Average Family Size in Oconomowoc Lake
Average Family Size in Oconomowoc Lake is 3.1 People.
What is the Average Household Size in Oconomowoc Lake
Average Household Size in Oconomowoc Lake is 2.9 People.
How Large is the Labor Force in Oconomowoc Lake?
There are 424 People in the Labor Forcein in Oconomowoc Lake.
What is the Percentage of People in the Labor Force in Oconomowoc Lake?
68.8% of People are in the Labor Force in Oconomowoc Lake.
What is the Unemployment Rate in Oconomowoc Lake?
Unemployment Rate in Oconomowoc Lake is 2.1%.